Dust Devils: Structural Features, Dynamics and Climate Impact


1
Schmidt Institute of Physics of the Earth of the Russian Academy of Sciences, 123242 Moscow, B. Gruzinskaya 10-1, Russia
2
Plasma Dynamics Group, Department of Automatic Control and Systems Engineering, University of Sheffield, Sheffield S13JD, UK
3
Space and Geophysical Laboratory at Applied Research Laboratory at the University of Texas (ARLUT), Austin, TX 78712, USA
4
Plasma Dynamics Group, School of Mathematics and Statistics, University of Sheffield, Hicks building, Sheffield S3 7RH, UK
*
Author to whom correspondence should be addressed.
†
Second address: Space Research Institute, 84/32 Profsouznaya Str., 117997 Moscow, Russia.
Climate 2019, 7(1), 12; https://0-doi-org.brum.beds.ac.uk/10.3390/cli7010012
Submission received: 23 November 2018
/
Revised: 3 January 2019
/
Accepted: 4 January 2019
/
Published: 11 January 2019
(This article belongs to the Special Issue Impact of Atmospheric Chemistry on Local Weather and Local Climate)
Abstract
:According to modern concepts, the main natural sources of dust in the atmosphere are dust storms and associated dust devils—rotating columns of rising dust. The impact of dust and aerosols on climate change in the past, present and future is one of the poorly understood and, at the same time, one of the fundamental elements needed for weather and climate forecasting. The purpose of this review is to describe and summarise the results of the study of dust devils in the Earth’s atmosphere. Special attention is given to the description of the 3D structures, the external flows and atmospheric gradients of temperature that lead to the generation and maintenance of the dust devils.
1. Introduction
Dust devils DDs) [1,2] are common atmospheric phenomena on the Earth’s surface and are representative of the class of small-scale concentrated vortices (CVs). Due to the presence of dust, these vortices can be visible as miniature or small tornadoes. The existence of such structures, that are able to lift and carry dust over long distances, means that they are an important factor that must be taken into account when determining weather and climate [1,2]. The influence of dust on the dynamics and energy of the ocean—atmosphere system has been a little studied aspect of the Earth’s climate system. Knowledge of these interactions is one of the most important conditions for adequate forecasting of weather changes and climate variability. Under typical conditions, wind is not able to raise fine dust to great heights. However, vortex structures such as DDs can carry dust high enough into the atmosphere. This dust can be picked up by zonal winds and can therefore be transported over long distances, noticeably effecting the weather and even the climate of vast regions. DDs themselves are not usually dangerous, although there is evidence that they are responsible for some for reported accidents [3]. Analysis of the incident database of the National transport safety Board (USA), based on 97 incidents, showed that in some cases, DDs were probably the most likely cause of accidents. The purpose of this review is to summarise the studies to date of small scale concentrated vortex dynamics and their structures in the Earth’s atmosphere. Despite the relevance of studying concentrated whirlwinds, theoretical modelling is still not sufficiently developed to offer a fuller understanding and prediction of their vortex dynamics. In this regard finding new exact solutions of the hydrodynamic equations which govern their vortex structure and dynamic evolution is important.
The second section briefly describes the main features of dust vortices as well as the processes of sand grain saltation and electrification. The third section is devoted to the description of mechanisms of generation of vortices in an unstably stratified atmosphere. The fourth section is devoted to the description of concentrated vortices at the quasi-stationary stage. The fifth section presents the results of numerical simulations of vortices in a convective unstable atmosphere. The final summary is given in the conclusions.
2. Main Features
2.1. Dust Devils—Columns of Rising Dust
Dust devils are small-scale and short-lived tornadoes with a low-pressure core which can suck dust, sand and small debris, dragging them into an upwards spiralling vortex upward movement. In English-speaking countries they are often called DDs. This nomenclature is well-established in the literature for describing rotating columns of rising dust, most usually found in arid desert regions of the Earth [4,5,6,7,8,9,10]. In fact, DDs are the most common vortex structures in the Earth’s atmosphere. Usually they appear during the summer time in an open, well-heated areas during hot, cloudless and almost windless weather conditions. However, sometimes DDs can occur in winter or spring, when cold air spreads along the warm ground, hence they even occur in subarctic regions. DDs mostly occur in the United States, Australia, India and Africa, especially in the Sahara desert. They can cause a grey column of dust to rise to cloud height. Pilots can sometimes observe these rising air currents and dust tornadoes at an altitude of several kilometres. However, in poor dust and sand regions DDs are much less visible and may even be invisible to the naked eye.
Vortices pick up dust from the Earth’s surface as a result of the so-called saltation. Sinclair (see e.g., [11,12,13,14]) suggested that DDs occur due to the existence of dust in the near-surface layer of the atmosphere in areas with abnormally high soil temperature where there is a sufficient presence of local wind obstacles which are required to form the necessary shear flows. At sea or on large lakes observed water devils (or water jets, waterspouts) have a similar origin [15,16] but instead of dust such tornadoes carry away drops of water. In addition, during a fire, with sufficiently calm conditions fiery devils can occur unexpectedly.
2.2. Dust Devils: Typical Parameters
The history of regular observations of DDs spans more than 150 years, starting with general descriptions [1,2,4,5] and then later more detailed observations and measurements were developed (see e.g., [6,10,11,12,13,14,17,18,19,20,21,22,23,24,25,26]). Let us summarize the currently available data on DDs. Most often DDs are observed on summer afternoons when the weather is calm, dry and windless, and the soil is sufficiently heated by solar radiation. Rising warm air creates a vortex with a low pressure center. The characteristic diameter of DDs is from several meters to several tens of meters, and in height they reach several hundred and even thousands of meters. These vortices are transferred in space at a speed close to the speed of the undisturbed wind. Due to the presence of dust, they become visible to an outside observer in the form of miniature tornadoes. The role of DDs in convection, soil erosion and sand transport in arid regions of the Earth has been intensively studied for a long time [27,28,29].
The direction of DDs circulation depends only on local initial conditions. Their spatial scales are not so large that they are affected by the Coriolis force, as in Rossby wave vortices. Very often, when a group of DDs is forming nearby you can see vortices that rotate in different directions. Balme [8], summarising the results of previous studies, presented an overview of the characteristic parameters of DDs on Earth and Mars. The characteristic toroidal speed in DDs reaches 25 m/s, and the vertical wind speed 10 m/s. Larger DDs have higher speeds of rotation and higher vertical speeds. In terms of radial position, DD can be divided into three concentric regions (see e.g., [26]). There is an outer region with weak vorticity and a constant (or slowly changing) radius; a narrow region where the vorticity varies dramatically, and an inner region where the converging flow to the center is transformed into a vertically ascending flow with large vertical and toroidal velocities.
2.3. Saltation
Saltation from the Latin Salto (which means to dance or jump) is the process of soaring and transfer of sand along the surface of a planet. This process occurs when wind applies sufficient stress to temporarily lift sand grains against gravity but due to the transient nature of wind turbulence at some point the grains eventually return to the surface. This motion is known as reptation. Saltation occurs when the particles returning to the surface collisionally cause more sand entrainment (during the so-called splash). Wind-controlled transfer of sand, dust and other objects is an Aeolian process, named after the Greek god of the winds, Eola. Aeolian processes are observed not only on Earth but also on Mars, Venus and Saturn’s moon Titan. On Earth, these processes occur mostly in deserts, beaches, and other areas with sparse vegetation. Sand blown about in these areas helps to change the surface by forming sand dunes and ripples, eroding rocks and transferring soil particles (see e.g., [27,28,30,31]).
Particle transport by wind depends on the wind speed and particle size. The specific terms, dust and sand, generally refer to solid inorganic particles that are associated with rock weathering. Sand is defined as mineral particles with a diameter of 60 to 2000 m, while dust is defined as particles with a diameter less than 60 m. As shown by observations [27,28,29,30,31,32,33,34,35] most DDs with increasing wind speed from 0.3 m/s to 2.4 m/s first begin to move sand particles with an optimal diameter of ≈100 microns. When colliding with a surface, some particles set in motion others (see e.g., [9,28]). The first comprehensive review of the physics of saltation was given by Bagnold [2].
The process of sand grain saltation can be divided into 4 main stages [9]: (1) excitation of saltation—jumping of particles under the influence of an aerodynamic force, (2) ballistic movement of particles, (3) impact on the surface of particles falling under gravity, and (4) modification of the vertical profile of the wind by bouncing particles. Upon impact, the adhesion forces of the particles on the surface are reduced and smaller particles are emitted from the surface.Collisions of small salting particles can also mobilise larger particles. However, the acceleration of particles with a diameter of ≈500 m is strongly limited by their large inertia, so these particles usually do not participate in saltation [2]. Vertical vortices, which have a lower pressure in the center, can pick up sand and dust from ground level and carry it to a height of several kilometers (see e.g., [8,23]). Greeley et al. [36] and Neakrase et al. [37] suggested that vortices are more efficient at dust rise than non-rotating boundary layer flows due to pressure deficit in vortex centers.
2.4. The Electrification of Dust
Dust particles and sand, picked up by the wind in a dry atmosphere, after numerous collisions acquire an electric charge as a result of the triboelectric effect, which produces electric charge when one substance rubs against another. Due to gravity small, lighter particles with larger charge-to-mass ratios than the heavier particles rise to higher altitudes in the vortex structures creating stratified electric charge distributions. These stratified charge distributions generate large vertical electric fields as analysed with numerical simulations in Section 4 and are measured in the field data and in laboratory experiments [40,41,42,43,44]. Pioneer measurements of Schmidt et al. [45] show that under moderate wind conditions, electric fields of up to 160 kV/m can occur in rising dust fluxes. Strong electric fields exceeding the value of 100 kV/m were observed (see e.g., [6,25,40,41,43,44]) during sandstorms and in DDs. Full-scale measurements (see e.g., [46,47]) during the passage of sandstorms and DDs in Western Sahara indicate even greater changes in electric fields than previously thought. Much attention has been paid to the study of electric fields in DDs [9,40,43,46,47,48,49,50,51,52]. The corresponding charge density can be to electrons per cubic meter. Electrical discharges between dust particles with different charges in an electric tornado can create a spectrum of radio interference in the microwave range (1.35–6 cm). Furthermore, vortex motion of charges generates a weak magnetic field of the order of several nano Tesla. NASA’s research project Martian Atmosphere And Dust in the Optical and Radio (MATADOR) was devoted to the study of the role of hydrodynamic and electromagnetic forces in the formation of DDs (see e.g., [53,54,55,56,57]). Similar studies were conducted in laboratories (see e.g., [58,59,60]). It was found that influence of the electric field on the dynamic processes and trajectories of dust particles, in the first approximation, can be disregarded relative to hydrodynamic effects [53]. However, such electric fields have been seen in both wind tunnel studies and field observations to be capable of significantly affecting sand transport. The electric field generated in DDs is determined by the vertical currents of charged particles and the dispersion of particle velocity can be calculated as a function of mass.
2.5. Dust Devils as an Element of the Family of Concentrated Small-Scale Vortices in the Atmosphere
In contrast to planetary-scale vortices (cyclones and anticyclones), DDs and tornadoes are small-scale vortices (see e.g., [68]). Waterspouts, fire vortices and larger-scale and more intense tornadoes belong to the extensive class of CVs (see, for example, [69,70,71,72,73,74]). Despite the fact that CVs generated in different environments (tornadoes occur in powerful storm clouds), they have much in common. The spiral-like upward movement of matter in such vortices has the general property: the toroidal velocity in such vortices attains a maximum value on the characteristic radius and tends to zero when approaching the center of the vortex or its periphery. The typical radius of concentrated vortices is from a meter to several tens or even hundreds of meters. The speed of rotation in such vortices reaches the maximum value at the characteristic radius and tends to zero when approaching the center of the vortex and on the periphery of the vortex. These observations coincide with the behaviour of the rotational velocity in the stationary Rankin vortex (see e.g., [8,12,20,21,69]). DDs as the simplest vortex structures are of interest for the study of the whole class of concentrated atmospheric vortices. Detailed knowledge of the internal properties of the structure and causes of DD generation can be useful in the study of tornadoes. Such a wide class of vortices has attracted the attention of many researchers. For example, the problem of radioactive dust removal by vortices in ground-based nuclear tests in the 1960s stimulated the study of vortices. Also, the catastrophic destruction caused by large tropical cyclones motivated further analysis of tornadoes.
2.6. The Dustiness of the Atmosphere and Climate
Despite the large and increasing number of studies on dust transport, its impact on the Earth system remains very uncertain (see e.g., [39,75,76,77,78,79,80]). Dust redistributes energy by scattering and absorbing both solar and terrestrial radiation. In addition, dust aerosols serve as vapour condensation nuclei in the liquid (as cloud condensation nuclei) and in the solid phase (as ice nuclei) [81]. The process of interaction between dust and clouds is very complex and insufficiently studied (see e.g., [82,83]). In addition, dust deposition on glaciers and snow cover reduces albedo, which causes warming and early spring snowmelt [39,75,76,77,78]. Climate change is very sensitive to the global dust cycle, i.e., the rate of dust deposition during the glacial maximum is several times higher than during the interglacial era [78,84,85]. Note that global dust deposition has been increasing for at least the last 50 years [86].
At altitudes of 2000–4000 m, streams were observed with temperatures several tenths of a degree above ambient temperature and with vertical wind speeds of 2–4 m/s over an area of 1–5 km. This suggests that dust particles are associated with longer fluxes of rising warm air, which extends up to several kilometres in height and expands to several kilometres in diameter before returning down [38]. DDs effectively transport dust in the form of a suspension upwards, where it is picked up by regional winds and carried for several hours or days over long distances. Fine African dust can be transported to the South of Europe and reaches the Caribbean and southeastern United States each summer [27,87,88,89] with concentrations typically in the range of 10 to 100 g/m. This is between one third and one half of the observed dust particles with a diameter of less than 2.5 m.
3. Generation of Vertical Jets (Plumes) and Vortices in an Unstable Stratified Atmosphere
Sinclair [13], based on long time observations, suggested that the necessary condition for the existence of DDs is the presence of dust in the near-surface layer of the atmosphere and areas with abnormally high soil temperature. According to modern concepts [8,88,89,90,91,92,93], DDs are formed in an unstable near-surface layer with a super-adiabatic temperature gradient. Observations have shown that the generation of vortices with the direction of rotation clockwise (anticyclonic) and counterclockwise (cyclonic) are equally probable. From the observed lack of correlation between the external vorticity, the generation time and the diameter of the vortex, it follows that only, the external vorticity, is insufficient for DD generation.
Meteorological observations [12,13,19,20,21,22] served as the basis for the creation of the first thermodynamic model of DD generation [25,94]. Characteristic DDs are interpreted as a heat machine in which the heat of the surface layer is transformed into DD energy. According to this model, warm air in a convectively unstable atmosphere rises and cools down. This model is an analogue of the heat engine, drawing energy from the hot surface layer. The model predicts that DD intensity depends on the product of vertical and horizontal temperature gradients due to turbulent processes. Generally speaking, turbulence in the near-surface layer plays an important role for generation of coherent vortices. Next we will focus on the mechanism of vortex generation in a convectively unstable atmosphere.
3.1. Convective Instability of the Near-Surface Atmospheric Layer
Solar heating of the Earth’s surface results in the formation of an unstable atmospheric layer of air where the temperature decreases with altitude. The atmosphere is considered unstably stratified if the square of the Brunt-Väisälä or buoyancy frequency characterising the internal gravity waves
is negative. Here g is the gravitational acceleration, is the ratio of specific heats, H is the reduced height of the atmosphere, and T and are the fluid temperature and temperature gradient in the vertical direction, respectively. Owing to solar heating of the soil, the vertical temperature gradient (the second term in the round brackets) is negative and exceeds the first term. Equation (1) corresponds to the famous Schwarzschild criterion for convective instability. In this case, internal gravity waves (IGWs) convert to unstable, exponentially growing plumes. Hence, such conditions would also generate DDs with an initial exponential growth rate.
3.2. Generation of Vertical Jets (Plumes) in an Unstable Stratified Atmosphere
In this section, which describes the generation of convective jets (plumes) and vortices in a convectively unstable atmosphere, we will focus on the results obtained in the works [95,96,97,98]. Similar to these models we will consider only the axisymmetric case assuming that in the cylindrical coordinate system with the flow velocity denoted as . Given that sand grains in DDs move at subsonic speeds, the incompressible fluid approximation is valid. According to [95,96,97] the radial and vertical velocities of convective incompressible motion in plums of an unstable stratified atmosphere are equal to
and
Here is the characteristic velocity, , is the vortex radius, t is the time and . The expressions for the velocity components of convective motion in the plume (2) and (3) are given under the assumption that the following condition holds
For moderate values condition (4) can be satisfied in the central part of the vortex, for , or far at the periphery of the vortex, for . From the Equations (2) and (3) it is seen that the radial velocity in the jet is directed to the center and does not depend on the vertical coordinate z, and the vertical velocity is directed upwards in the inner region of the jet and downwards for in the external region. The vertical and radial velocity components decrease exponentially at the plume periphery, when .
3.3. Generation Model of Dust Devils from Vertical Jets
We consider that within the vortex there is a stationary large scale, with characteristic scale scaling the vertical vortex vorticity term as follows . In the vortex region when the vertical vorticity is . Using the expressions for the radial and vertical velocities of convective motion (2) and (3), one can obtain an initial large scale vertical vorticity , where is the initial toroidal velocity. Taking into account the interaction of the vertical vorticity with an exponentially increasing poloidal motion, one can obtain [95,96,97,98] expression for jet toroidal (or azimuthal) velocity,
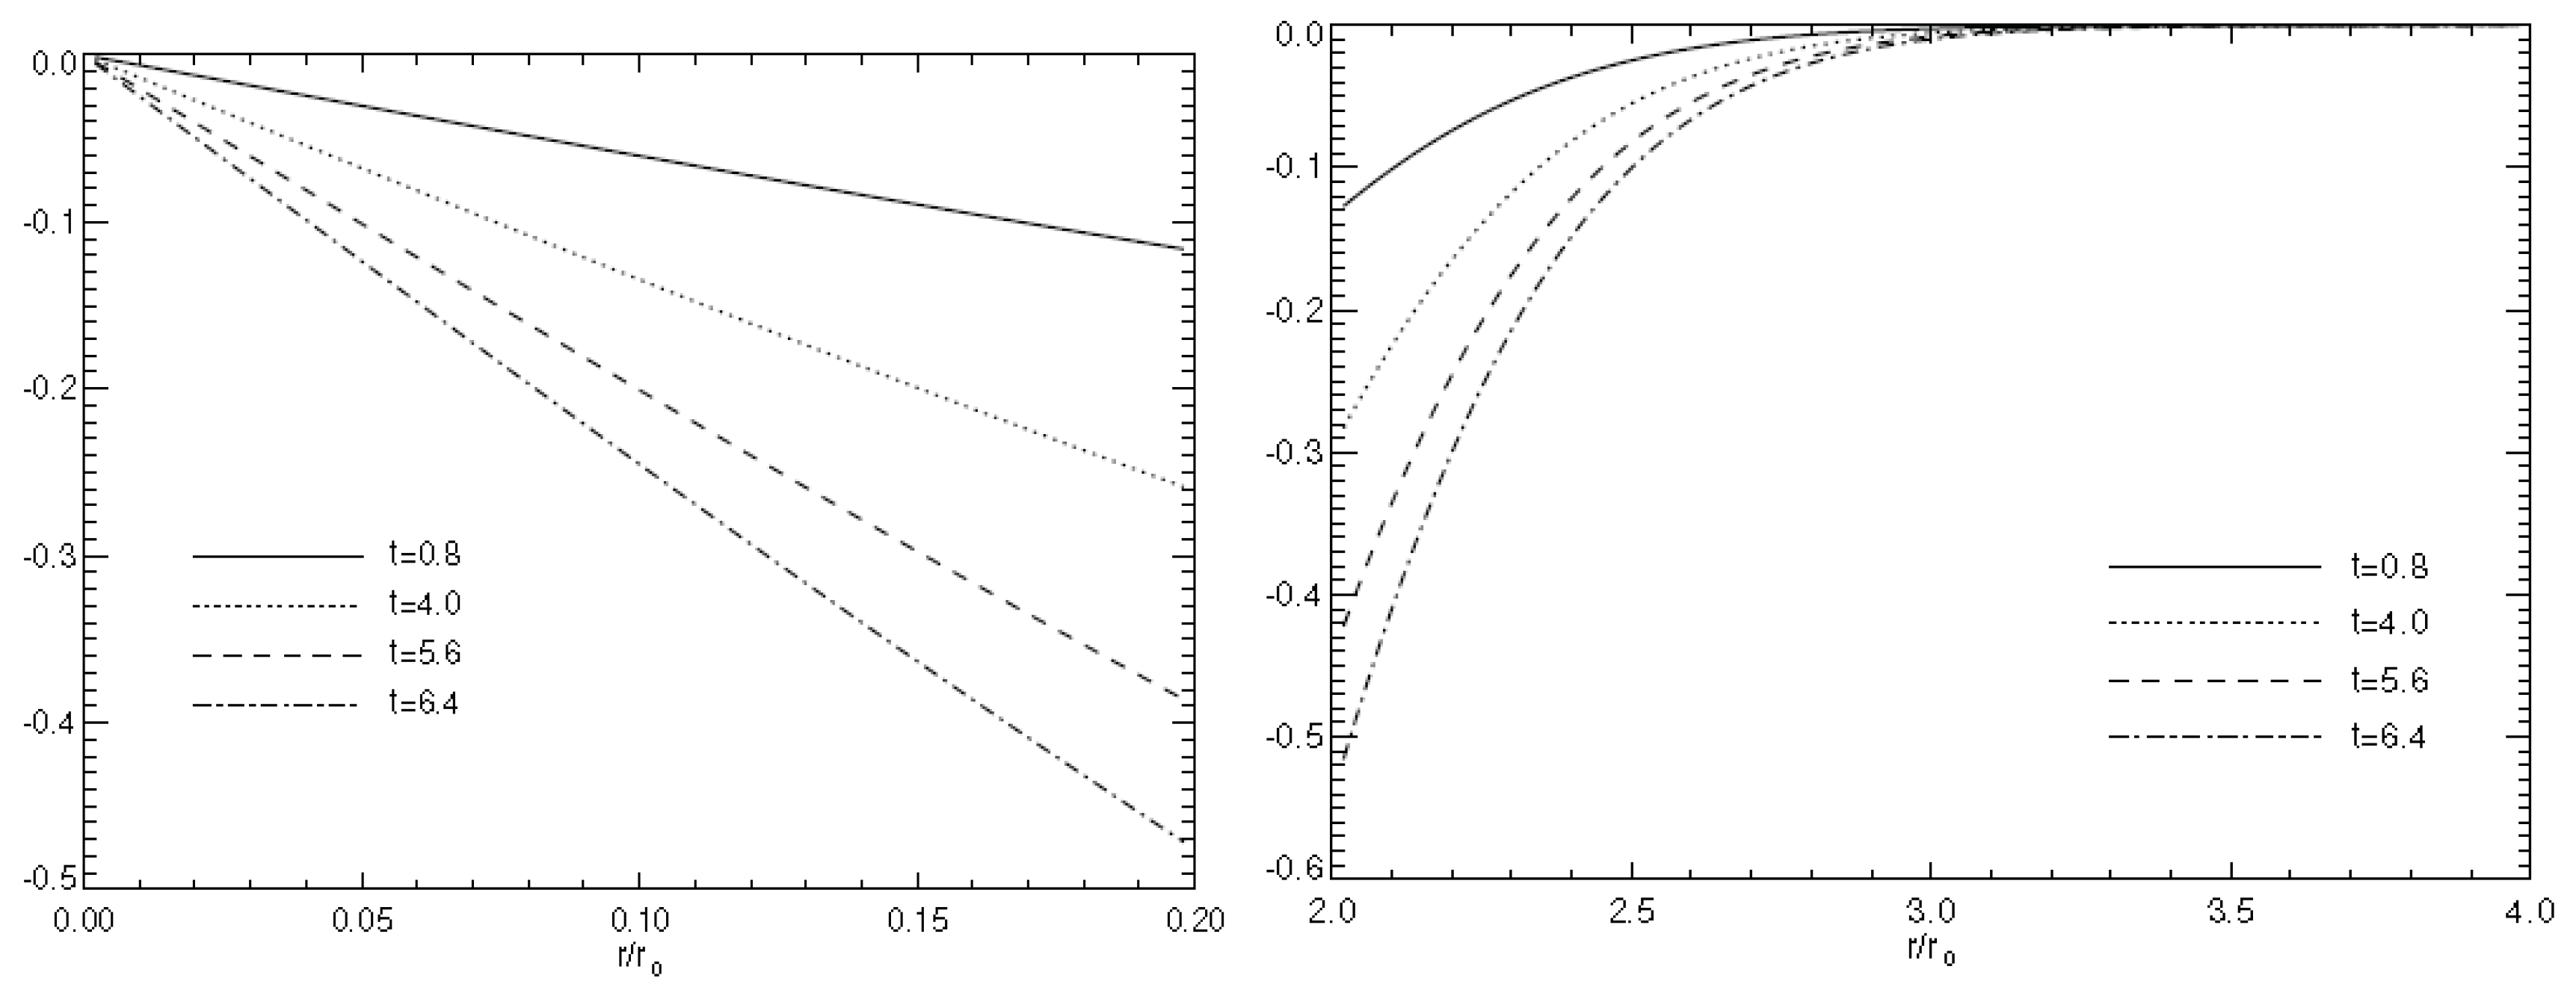
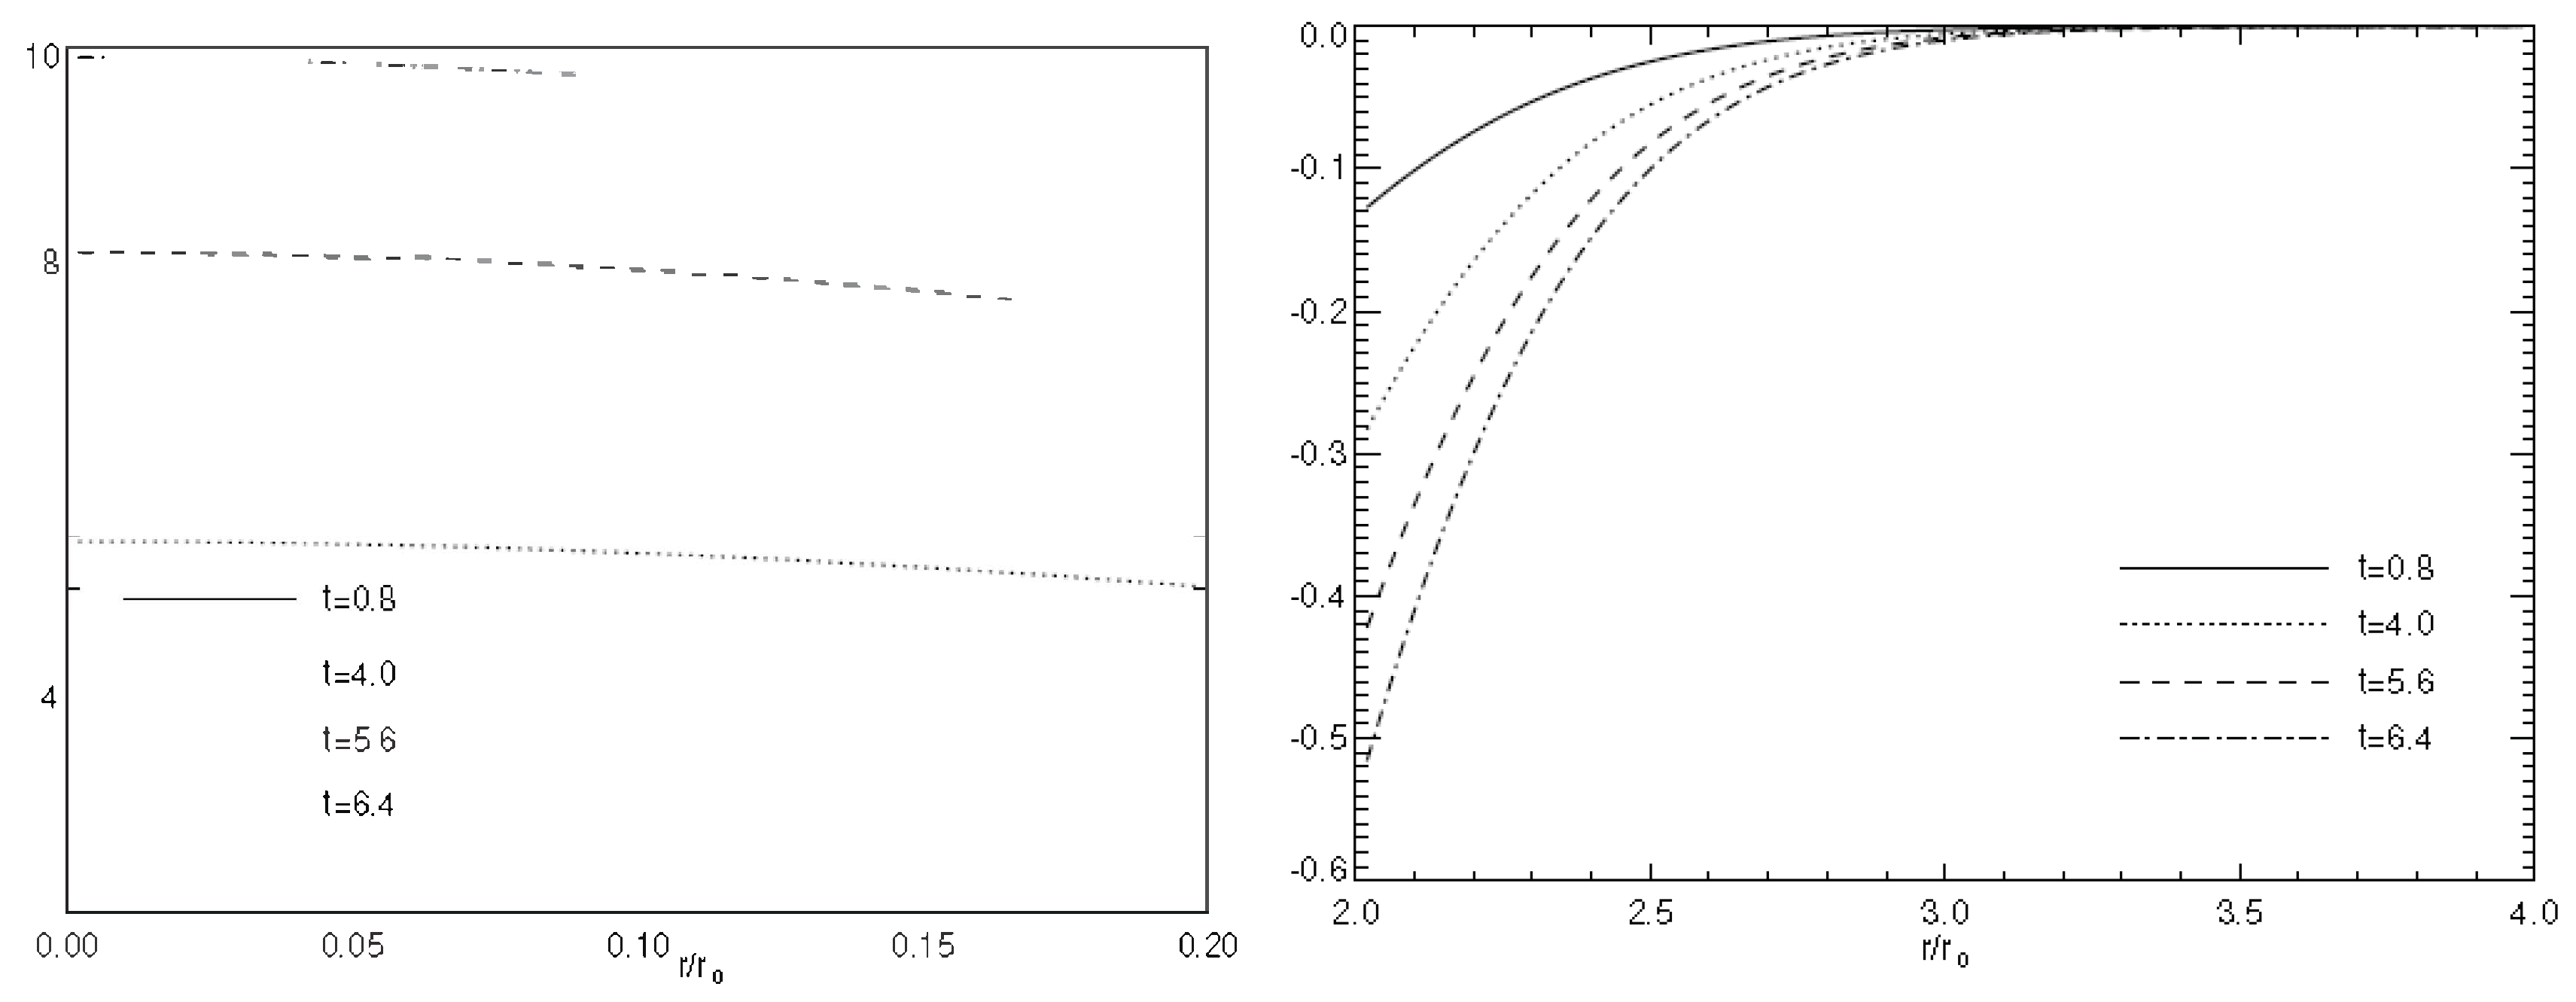
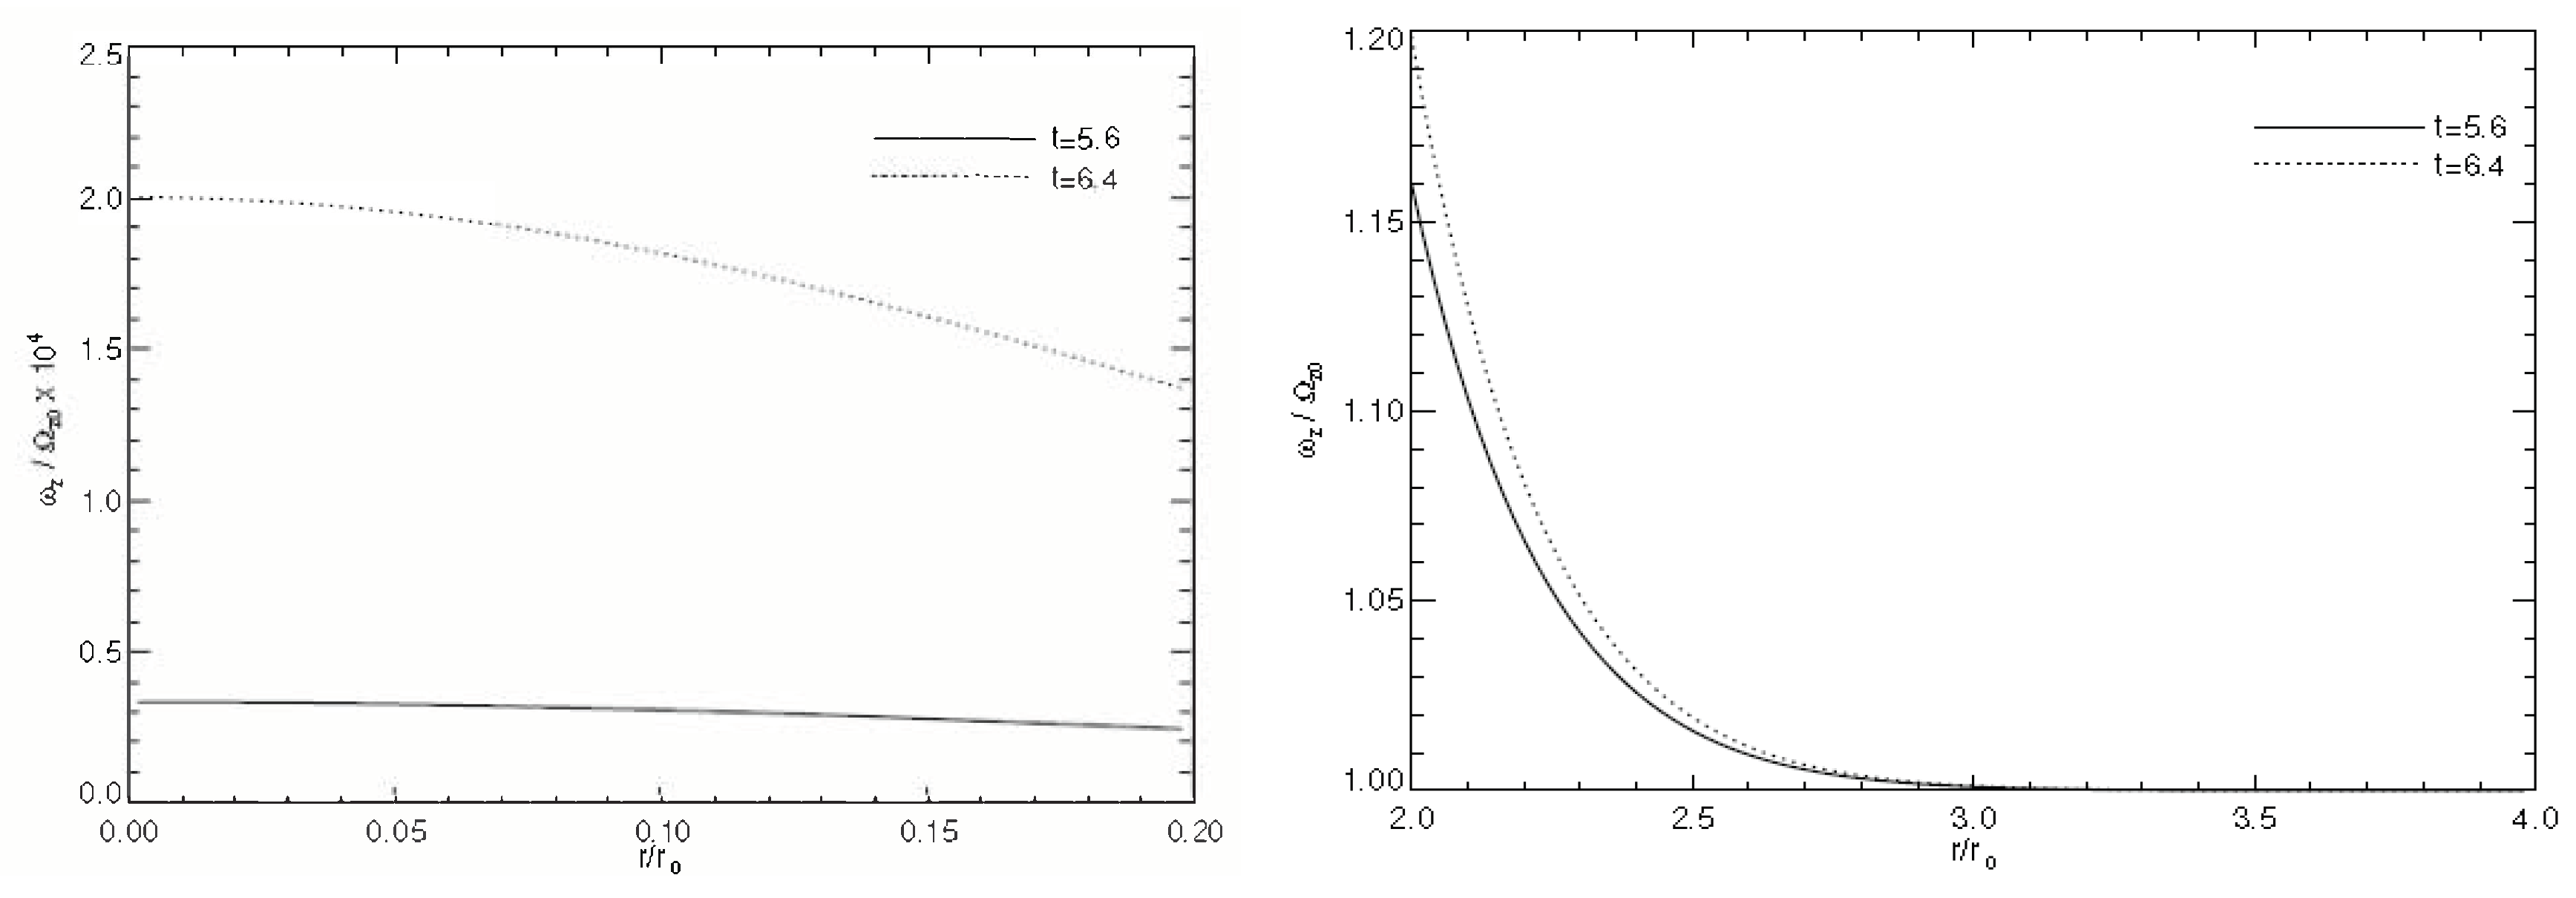
To apply these results to interpret dust vortices in the Earth’s atmosphere, let us take the characteristic value of the temperature gradient in the near-surface layer [35] as 2 K/m, which is usually measured in the near-surface layer during vortex generation. This gradient corresponds to the convective instability growth rate. Figure 1 and Figure 2 show the dependence of normalised radial and vertical components of the velocity within the time interval s and when in the radial domains or . Note, that according to Equation (4) the vertical velocity is proportional to z. Figure 2 is plotted for . In the intermediate domain corresponds to the domain where the condition (5) fails. Further investigation of this nonlinearity in the region will be carried out elsewhere. Comparing the left and right panels of Figure 1 and Figure 2, and using the interpolation behaviour of the velocities in the regions and one can assume that for the absolute value of the radial velocity attains its maximum value. Then the vertical component of the velocity, for , vanishes and then changes the sign. Figure 3 shows a strong increase in the vertical vorticity, i.e., ten times, from to s in the interior of the vortex.
4. Quasi-Stationary Models of Concentrated Vortices
4.1. Previous Models
Despite the fact that concentrated vortices such as DDs and tornadoes occur in many different environments, they actually have much in common. Regarding their radial structure, the toroidal velocity reaches a maximum value on the characteristic radius and tends to zero at the vortex centre and on the periphery of the vortex approach. Therefore, modelling DDs is of interest since they are the most numerous and regularly observed CVs in the earth atmosphere. The simplest model of a stationary vortex is the Rankine vortex (see e.g., [99]). The Rankine vortex with piecewise continuous toroidal velocity is not an exact solution of the Navier-Stokes equations and, therefore, is not realistic for describing motions in the atmosphere, however, it is often used in the interpretation of the observations [8,13,36,100] and also in interpreting the results of numerical simulations of CVs (see e.g., [18,69,100,101,102,103]).
At present, only a small number of exact solutions of the Navier-Stokes equations describing the structure of vortices are known. These include the Burgers or Burgers–Rott (see e.g., [104,105]) and Sullivan [106] vortices. The Burgers and Sullivan models describe three-dimensional axisymmetric flows of viscous incompressible fluids. In the Burgers model, the radial and vertical velocities grow unbounded, respectively, with increasing distance from the center of the vortex and with increasing altitude. For these reasons, this model is not realistic at high altitude and at long radial distances. Unlike the Burgers vortex, the Sullivan vortex has a two-cell structure. In the central part of the vortex (in the central cell), the vertical velocity is directed downward, and the radial velocity is directed outward. In the outer region of the vortex (in the outer cell), the vertical velocity is directed upwards, and the radial velocity is directed to the centre of the vortex. The Sullivan vortex is a simple two-cell dissipative vortex that is used to interpret powerful DDs and tornadoes (see e.g., [88,107,108]). It is, certainly, recognised that a tornado is too complex a phenomenon to be completely described by a simple explicit stationary solution of the hydrodynamic equations. However, explicit solutions provide important foundation knowledge about the possible structure of vortex flows. As in the Burgers vortex, the vertical velocity in the Sullivan vortex grows infinitely with height. The principal mechanism underlying the maintenance of dissipative Burgers and Sullivan vortices is the balance of the viscous diffusion and the radial flow. As the viscosity of the fluid decreases, the vortex itself disappears. The question arises: can stationary vortices exist in a non-dissipative medium? As well as understanding DDs, detailed knowledge of the internal properties of the structure of CVs can also be applied to the study of tornadoes and tropical cyclones. In this regard, there is much motivation to search for new accurate solutions of the hydrodynamics equations describing CV fluid flow. A new low-parametric model of an exponentially localised vortex in space is described in [109]. This corresponds to an exact solution of the Euler equations for an incompressible fluid (the Navier-Stokes equations for inviscid fluid) [110]. Similar to the Burgers and Sullivan vortex there is an inwards radial flow concentrating vorticity in a narrow column around the axis of symmetry. But unlike the Burgers model, the dissipation of vertical vorticity is determined not by a viscosity, but by the vertical advection of vorticity in an ascending stream which has a decreasing toroidal velocity with altitude. This special type of stationary vortex arises when these two effects balance each other. Below we present the main results obtained in this work.
4.2. Model of Concentrated Vortices in a Non-Dissipative Medium
In this model of CVs in a non-dissipative medium, the radial, vertical and toroidal components of the velocity are [109,110]
and
Here L is the characteristic height of the vortex, is the initial (seed) toroidal velocity. Using the expression for azimuthal velocity (8), one can obtain an equation for toroidal vorticity.
where . The Equations (7) and (9) show that the vertical velocity and the vertical vorticity change the sign at the boundary of the vortex. Using Equation (9) it can be shown that according to Thompson’s theorem in hydrodynamics of an ideal fluid the total (integral) vertical vorticity is zero, i.e.,
Unlike the Rankine and the Burgers vortices, the structures studied here have finite horizontal vorticity, where (see e.g., [109,110])
Equations (9) and (10) show that both the vertical and horizontal vortices are exponentially localized in radial direction. Substituting expressions for the components of the velocity (6)–(8) into the equation of momentum conservation, we obtain an equation for pressure, (see e.g., [109,110])
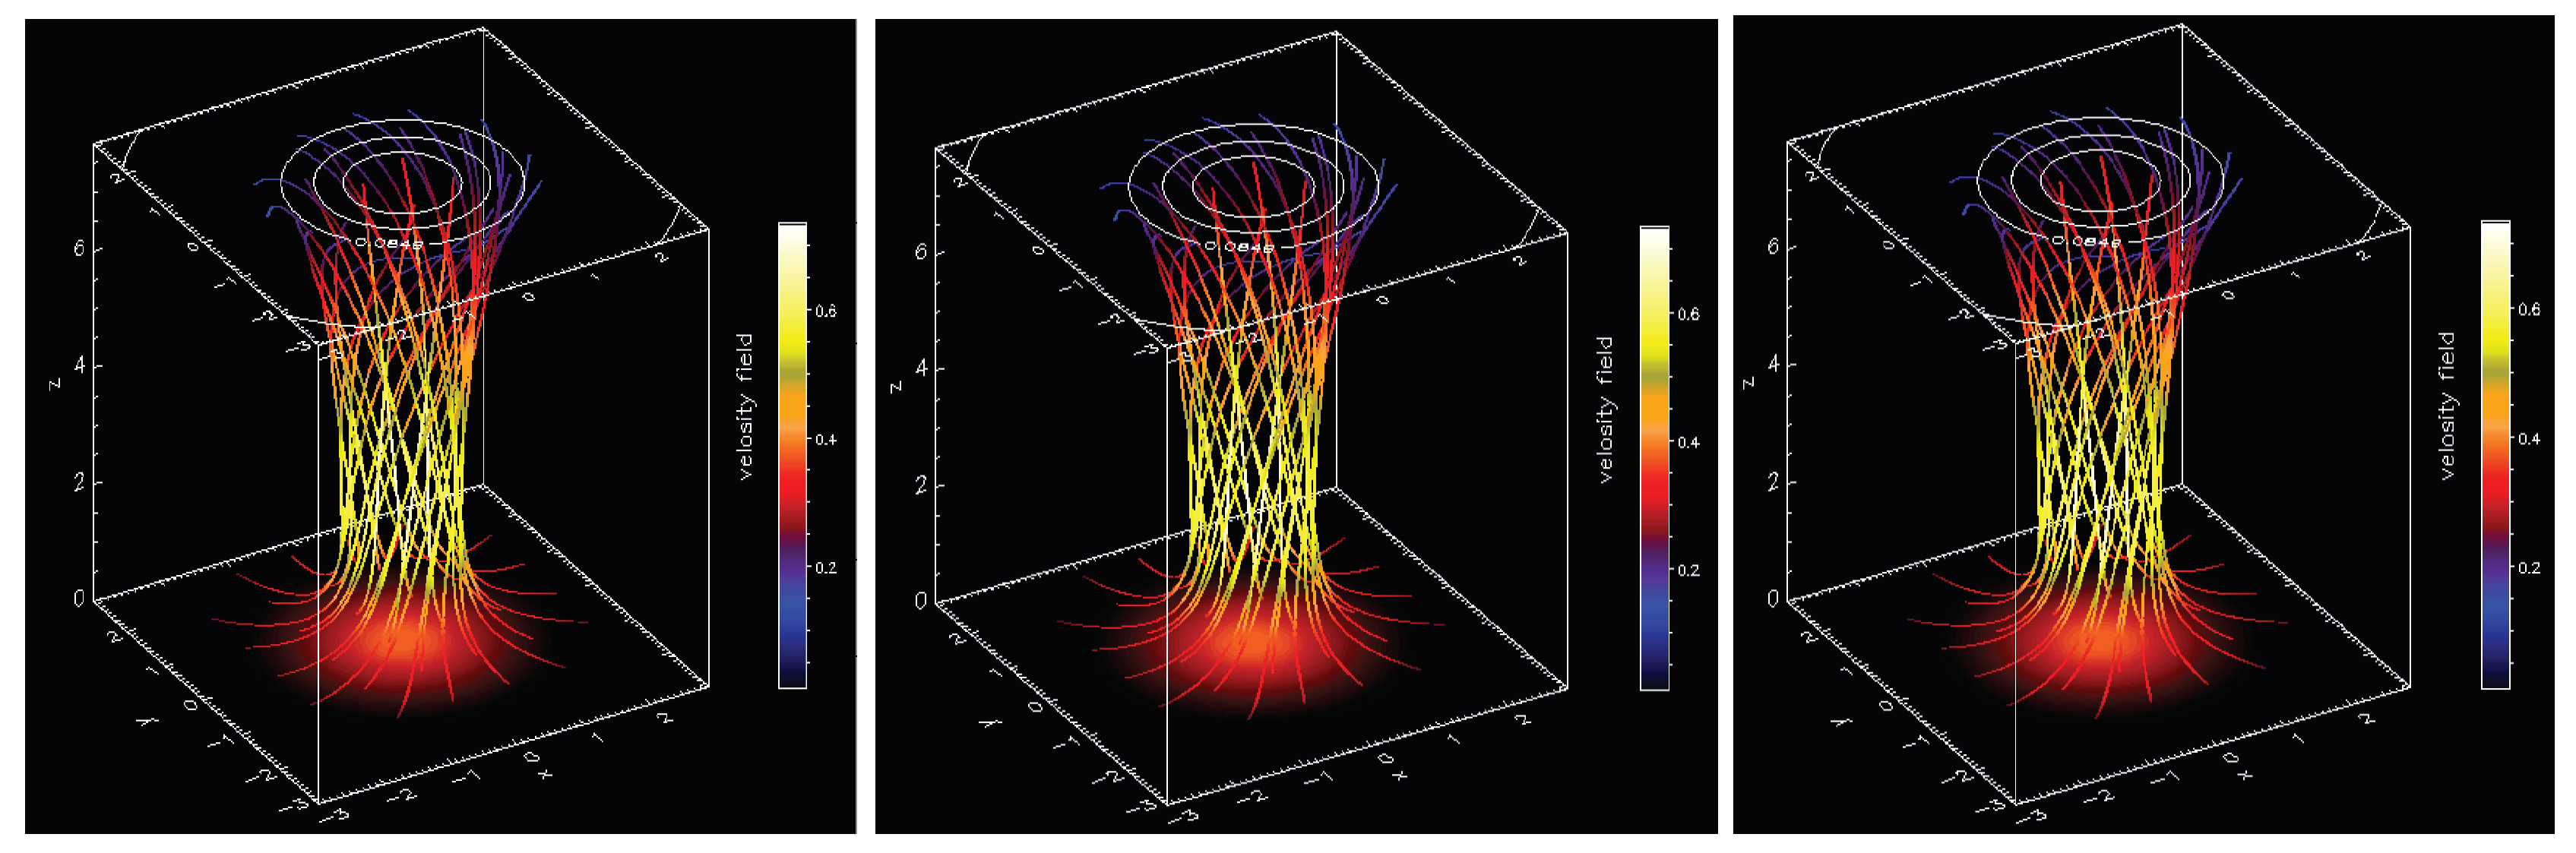
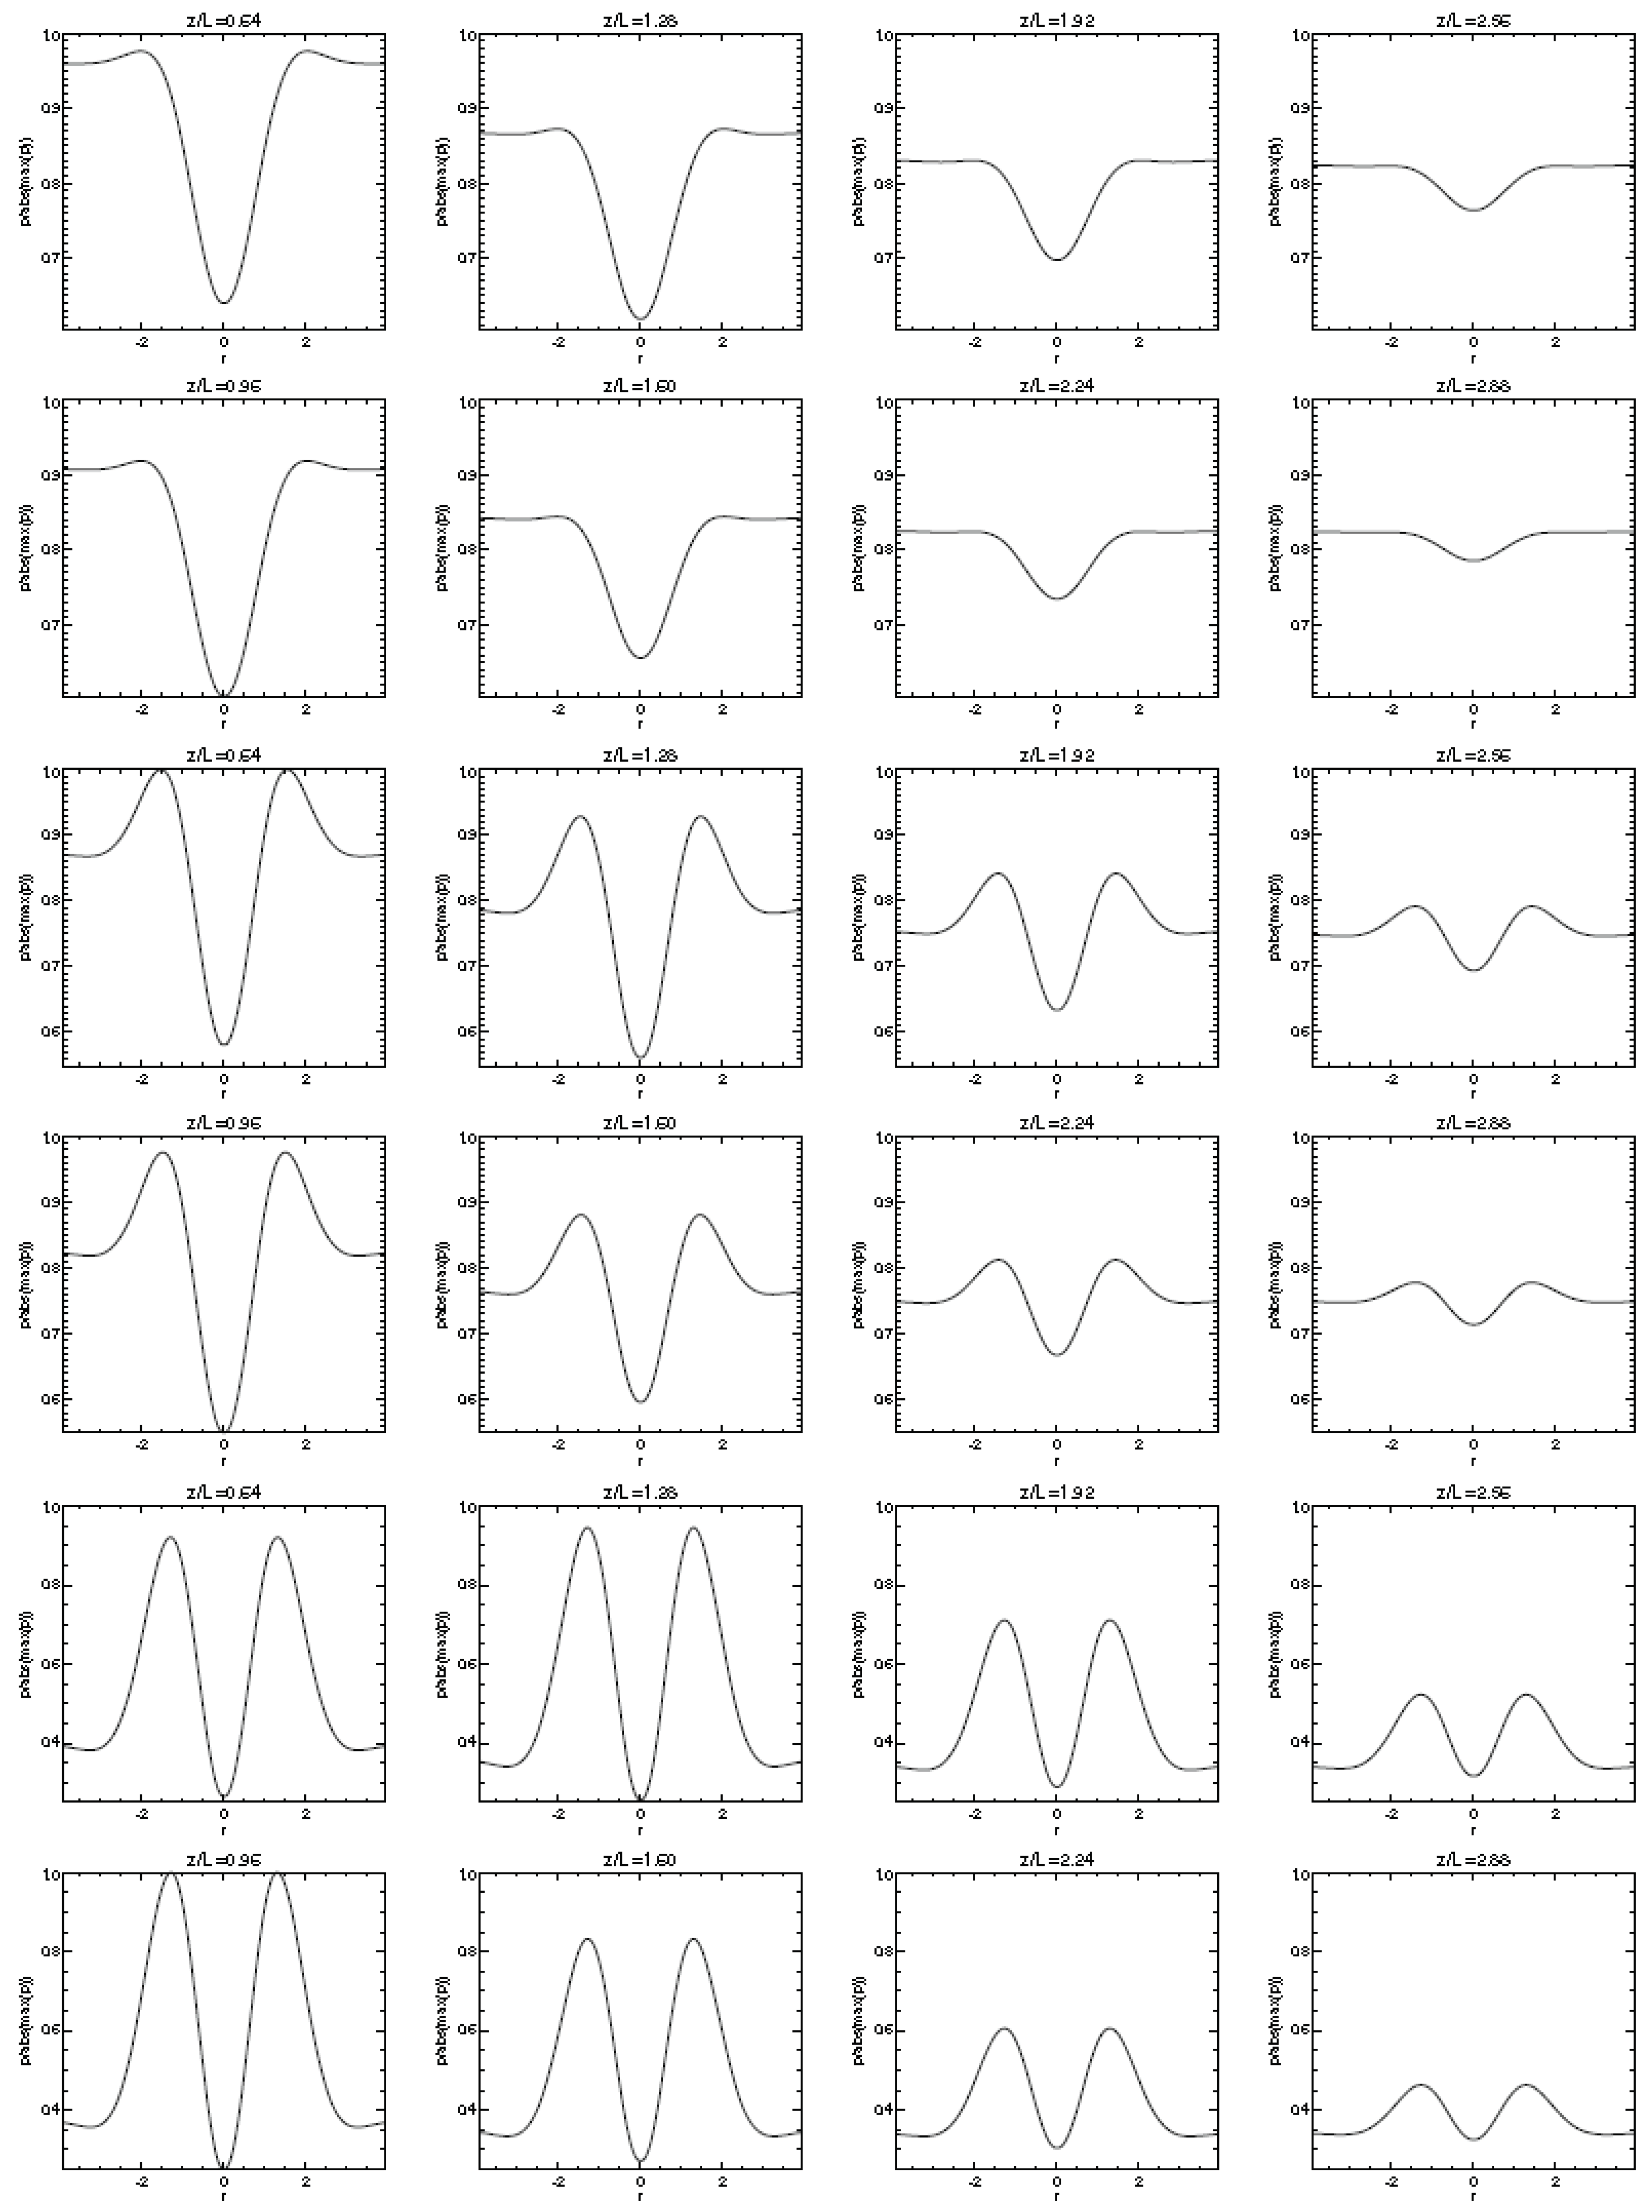
Equations (6)–(8) and (11) describe an exact solution of the Euler equations for incompressible flows in disregard of the viscosity effect. In this model, the vortex flow is exponentially localised not only in the radial direction, but also exponentially localised in the vertical direction with a characteristic scale L. The structure of the vortex in the vertical direction can be decomposed into three areas: the base (or skirt), the central part and the upper part. In the radial direction, the structure is divided into the inner and outer parts of the vortex, and , respectively. In the inner region the flow is directed to the center, and in the outer—to the outside. At the base of the vortex , the vertical and toroidal velocity components are small. As the height increases in the inner region, the vertical and toroidal components of the velocity increase. The main movement in the central area is concentrated inside the cylinder , where . At the height of the vertical and toroidal speed, as well as vertical vorticity, reach maximum values. In the upper part of the vortex, the ascending and directed to the center flow is transformed into a descending spreading flow. The normalised three-dimensional field of the velocities of the fluid motion and the particle trajectory in the vortex and pressure values across the vortex at different heights are shown in Figure 4 and Figure 5, respectively.
5. Numerical Simulations of Vortex Dynamics
The first attempts of analytical research, as well as numerical and laboratory modelling of vortices taking into account the effects associated with the self-consistent dynamics of the movement of charged dust particles of different masses and different electric charge, picked up by a hydrodynamic flow, in the presence of electrostatic field were made in [46,47,49,50,51,52,53,54,55,56,57,58,59,60,111,112,113]. In a recently published review, Spiga et al. [114] discussed numerical modelling of DDs using the Large-Eddy Simulation (LES) approach. However, the study of the dynamics of vortices in realistic multi-component dust, incorporating the influence of electrostatic fields, is still very much at the initial stage of development.
The influence of the vertical temperature gradient and friction in the near-surface layer on the vortex dynamics was studied in [54,60,88,107,115,116,117,118,119,120,121,122,123,124]. By varying the values of the parameters determining the initial vorticity, surface temperature and friction in the near-surface layer, their influence on the maximum toroidal velocity, pressure drop and vortex structure was numerically investigated. In [125] the main attention was paid to studying of topology of DDs. The influence of charged dust particles and emerging electric fields on the dynamics of vortices was studied. Two problems, in particular, were to be investigated by numerical simulations: (1) to show if vortex motion in the horizontal plane is generated as a result of the development of convective instability, and (2) to study the motion of individual sand grains picked up by the vortex structures. Despite the fact that the dynamics of three-dimensional vortex motion has been studied intensively, the occurrence of vortices in an unstable poloidal (axial) flow remains poorly studied. The motion of test particles in a complex axial vortex also remained unexplored.
Using MUTSY/cNS 3 D (Multi Theoretical Subjects Utility/incompressible Navier-Stokes 3D) code, numerical simulation of vortex generation in a convectively unstable atmosphere was performed. The developed numerical code can be used to construct a general circulation model in a dusty atmosphere. At the upper boundary, absorption at constant pressure and gradually increasing with high viscosity was prescribed. The calculations used the condition of no slippage of matter at the lower boundary (planetary surface) for a given temperature distribution. In the initial state, the flow of matter was set in the form of weak perturbations. The vertical velocity of matter in the calculations was significantly less than the velocity of sound.
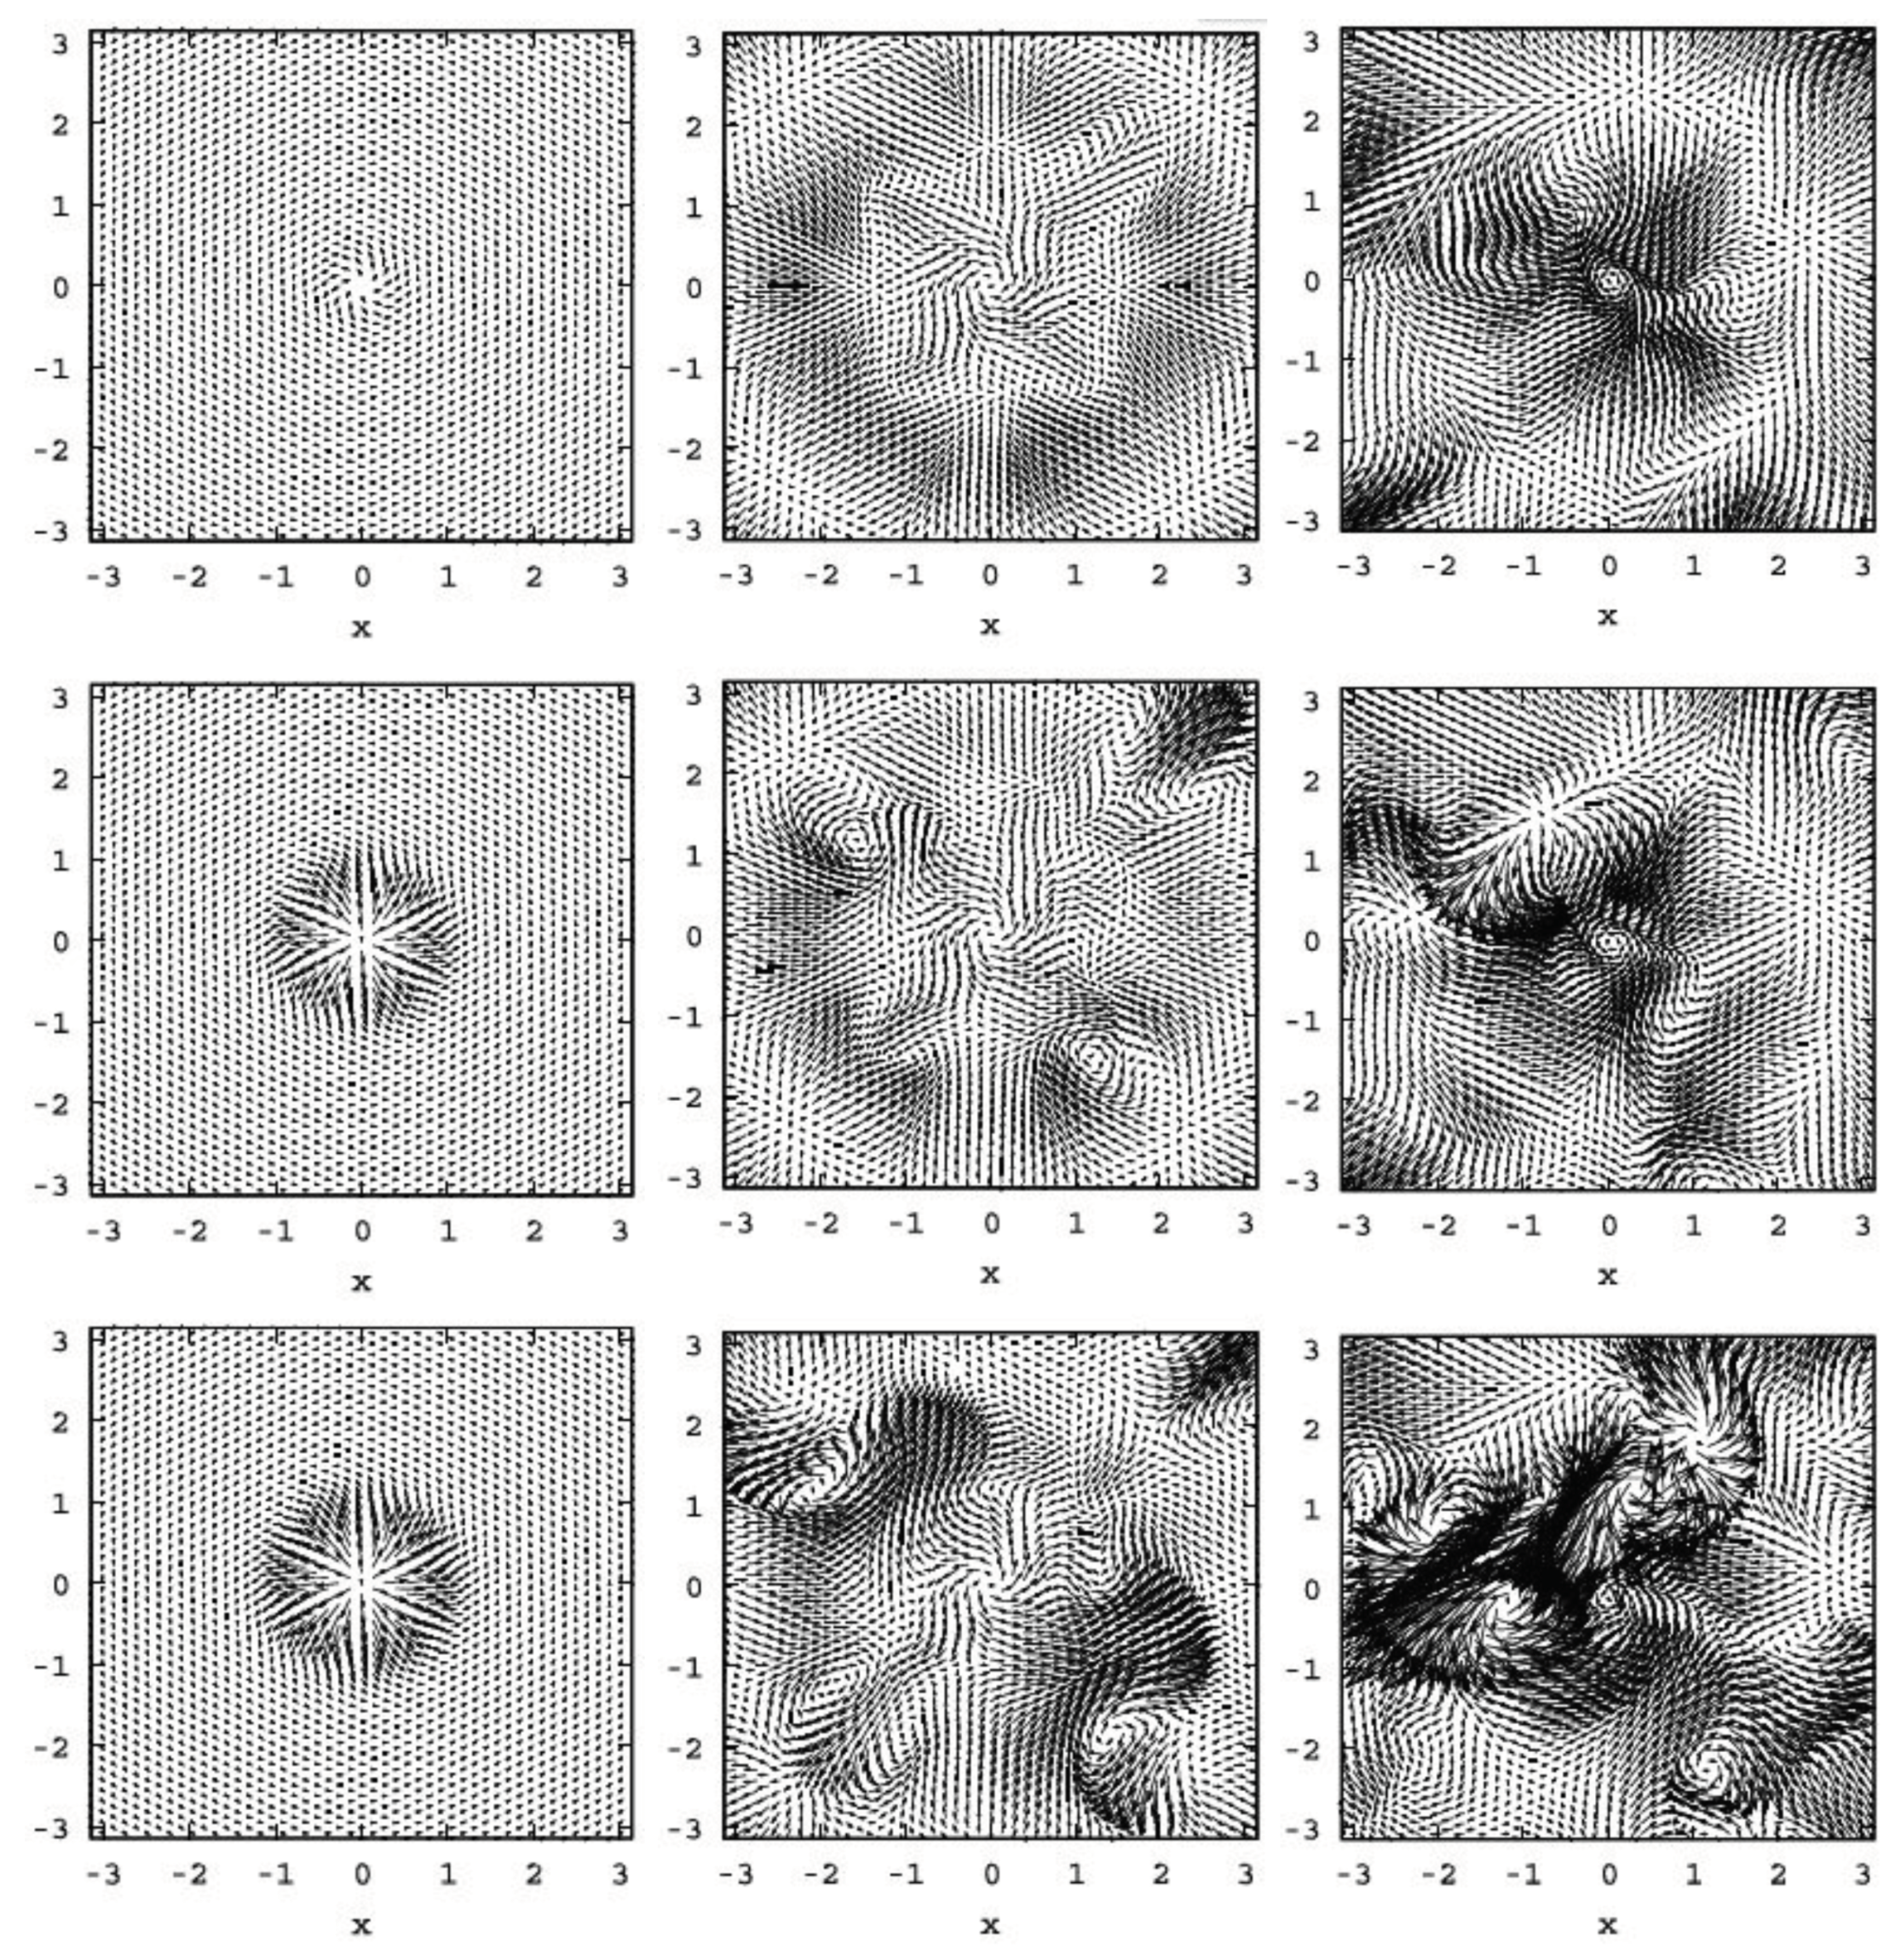
At the first stage of numerical simulation, the possibility of generating toroidal motion in an unstable poloidal flow under convective instability was shown. The left column on Figure 6 shows the velocity field at the initial time at different heights (with increasing height from top to bottom). The middle and right columns correspond to the speed at these heights at time and . Figure 6 clearly indicates the existence of a nonlinear phase of convective instability. This figure also shows that at the nonlinear stage (time ) multi-vortex motion prevails. Thus, the numerical simulation shows the nonlinear stage of development of convective instability associated with the growth of energy of toroidal motion.
At the second stage of numerical modelling a more detailed study of the motion of the central region of DD was conducted by implementing periodic vertical conditions. For simplicity at this stage the condition of constant temperature in height was used. To study the evolution of the vortex structure, a pseudo spectral code was used in the calculations. The dust component was considered as a passive component (dust particles) denoted by black dots.
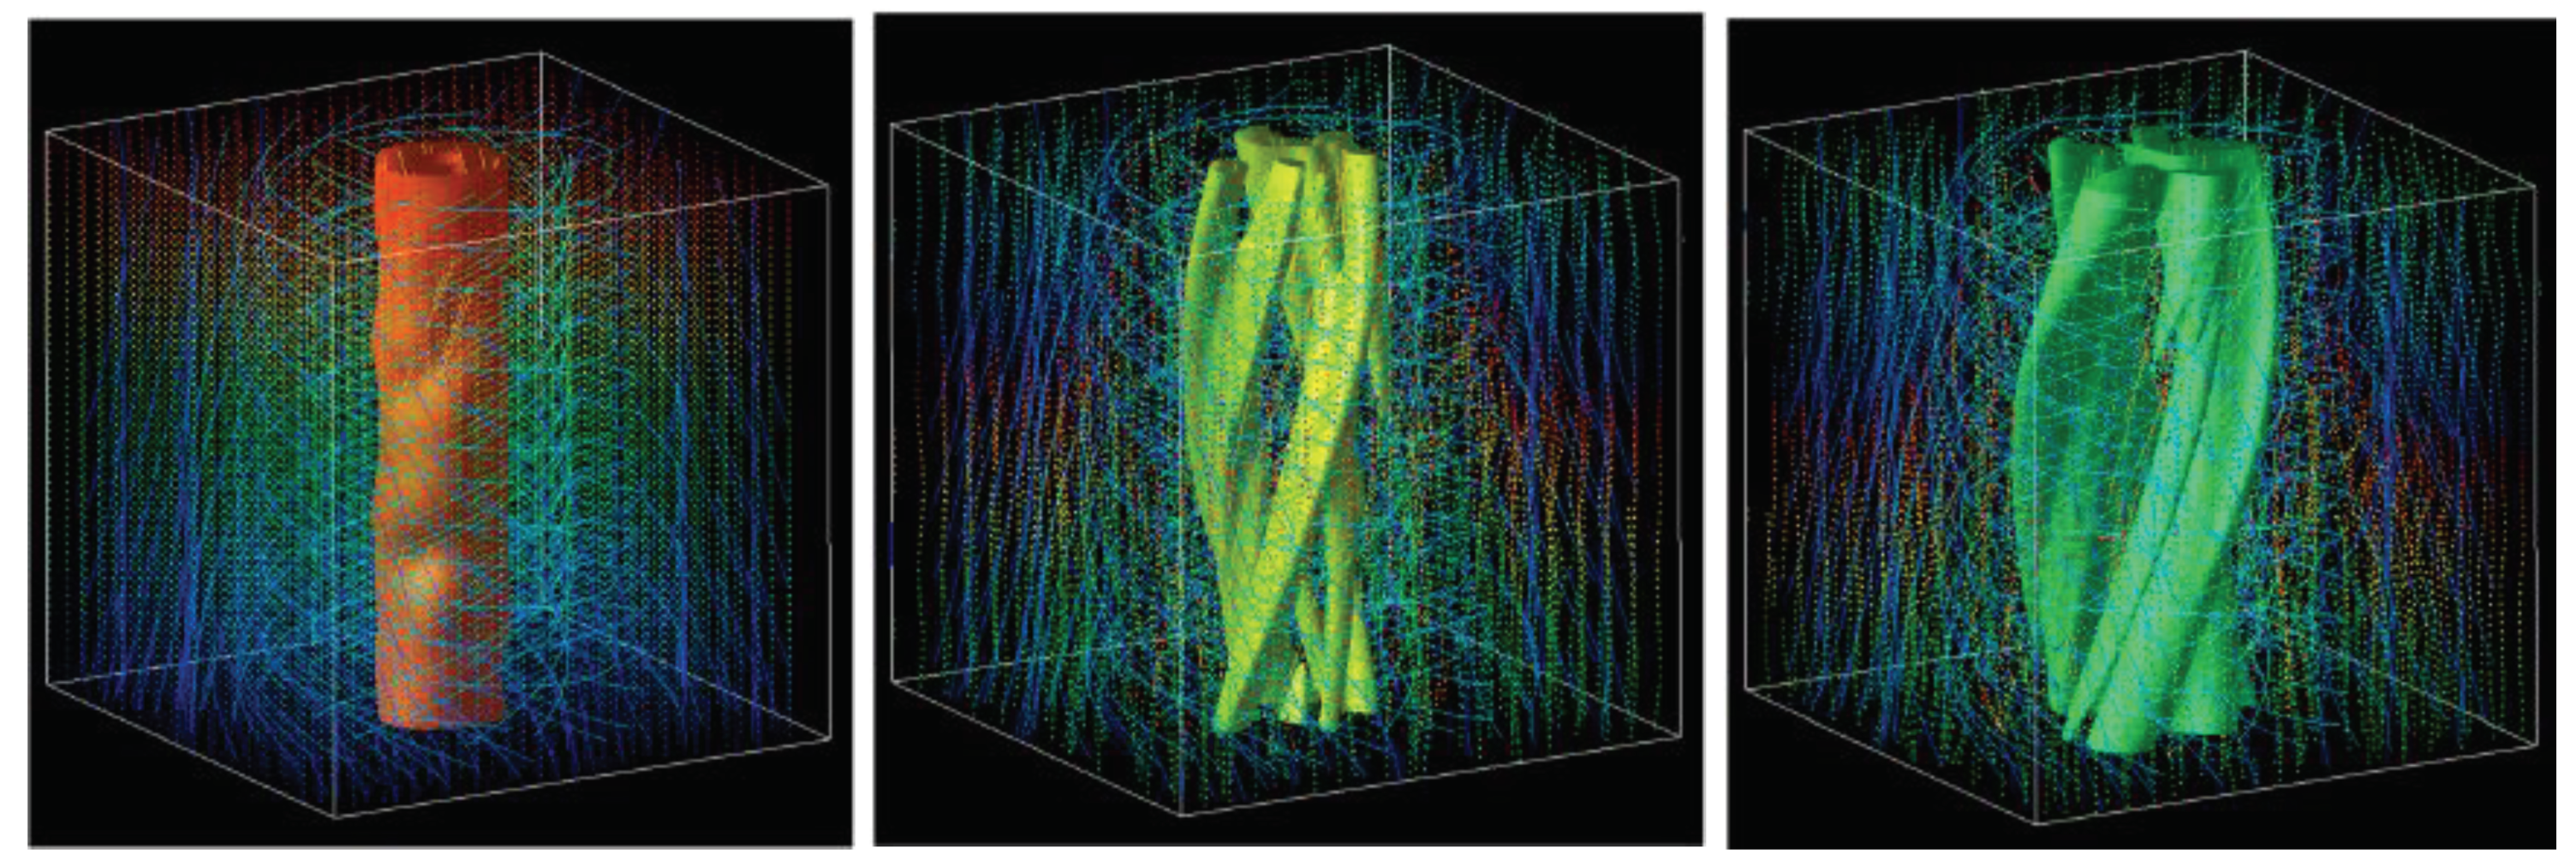
In Figure 7 three fragments of the evolution of the vortex structure are presented (time increases from left to right). As the initial flow in the calculations, a constant flow in the vertical direction (the left fragment) was adopted. The calculations showed the formation of small-scale spiral formations from the left (initial) to the middle fragment over time. At later times, the attenuation of small-scale spiral structures and the formation of a more symmetrical central part in the transition from the middle to the right fragment. The time interval corresponds to about four rotations of the DDs.
Three fragments shown in Figure 3 indicate intermittency in the evolution of the spiral structure. The left fragment has a weak spiral structure, the middle has a strong helicity, and the right fragment, corresponding to the great times, again has a weak helicity.
6. Conclusions
According to modern concepts, the basic natural sources of dust in the atmosphere are dust storms and are also possibly associated with DDs. The effects of dust on climate change in the past, present and future are poorly understood. Knowledge of these interactions is fundamental to weather and climate forecasting. The formation of the ecological system of the near-Earth environment is extremely complex and includes many physical, chemical and biological processes, and also climatic changes. Furthermore, these processes interact with each other in a nonlinear way. Each interaction is important and has its own thresholds. For example, one of the most notable components of this system is the iron cycle, in which iron-containing dust is transported from the soil through the atmosphere and then into the ocean, and due to biogeochemistry has the opposite effect on the climate and dust content of the atmosphere.
This review summarised the results of observations and studies of DDs. Special attention was paid to the mechanism of their generation. It has been established from observations that one of the main conditions for the occurrence of DDs is the convective instability of the atmosphere associated with the super adiabatic temperature gradient in the near-surface layer. Such an instability occurs as a result of abnormally strong heating of the Earth’s surface by solar radiation. In the boundary layer with a seed large-scale vorticity there is a spiralling movement to the central region with reduced pressure. This causes the concentration of vortex motion to smaller scales.
A nonlinear hydrodynamic model of the generation of convective motions and dust vortices in an unstably stratified atmosphere was also discussed. This particular model for generating convective plume cells assumed an axially symmetric flow field and nonlinear equations governing internal gravitational waves. It was shown that in a convectively unstable atmosphere with a large-scale seed vorticity, small-scale intense vertical vortices are formed extremely rapidly from jets. The structure of radial, vertical and toroidal velocity components in such vortices was studied. It was found that these vortices have a low pressure inner region with a strong toroidal motion which can suck up dust from the Earth’s surface. The structure of vertical vorticity and toroidal velocity in the radius-restricted areas of the vortex was also investigated.
Further studies of DDs, including numerical modelling, will allow us to study: (a) generation and structure of generated vortices at arbitrary radial distances, (b) the study of the vortex structure without the restriction of axial symmetry, (c) incorporation the effect of charged dust in the dynamics of vortices and dust content of the atmosphere. Such modelling can help in the study and prediction of more powerful tornadoes and hurricanes, as well as verification of the role of DDs and dust storms in the dynamics of dust in the atmosphere.
Author Contributions
Conceptualization, O.G., O.P. and V.F.; methodology, O.G.; software, V.F., O.G.; validation, O.G., V.F., O.P., W.H. and G.V.; formal analysis, O.G., O.P., V.F., W.H. and G.V.; investigation, O.G., O.P., V.F., W.H. and G.V.; resources, V.F.; writing-original draft preparation, O.G. and O.P.; writing-review and editing, O.G., O.P., V.F., W.H. and G.V.; visualization, V.F.; project administration, O.G.
Funding
We have provided this info in the acknowledgments.
Acknowledgments
O.G. and O.P. are thankful to the Program of Prezidium of the Russian Academy of Sciences No. 28 and the state task of IPE RAS for the partial financial support. WH thanks for partial support of the US Department of Energy under grant DE-FG02-04ER54742 and the Space and Geophysics Laboratory at The University of Texas at Austin. V.F. and G.V. are grateful to the Royal Society (International Exchanges Scheme, collaboration with Mexico and Chile) and STFC Consolidated Grant ST/M000826/1 for support provided. We also thank the anonymous referees whose comments and suggestions helped improve this review.
Conflicts of Interest
The authors declare no conflict of interest.
References
- Baddeley, P.F.H. Whirlwinds and Dust Storms of India; Bell & Daldy: London, UK, 1860. [Google Scholar]
- Bagnold, R.A. The Physics of Blown Sand and Desert Dunes; Chapman and Hall: London, UK, 1941. [Google Scholar]
- Lorenz, R.D.; Myers, M.J. Dust devil hazard to aviation. A review of United States Air accident reports. J. Meteorol. 2005, 30, 178–184. [Google Scholar]
- Ives, R.L. Behavior of dust devils. Bull. Am. Meteorol. Soc. 1947, 28, 168–174. [Google Scholar] [CrossRef]
- Grant, C.G. Dust devils in the sub-arctic. Weather 1949, 4, 402–403. [Google Scholar]
- Crozier, W.D. Dust devil properties. J. Geophys. Res. 1970, 75, 4583–4585. [Google Scholar] [CrossRef]
- Leovy, C.B. MarsThe devil is in the dust. Nature 2003, 424, 1008–1009. [Google Scholar] [CrossRef] [PubMed]
- Balme, M.; Greeley, R. Dust devils on Earth and Mars. Rev. Geophys. 2006, 44, RG3003. [Google Scholar] [CrossRef]
- Kok, J.F.; Parteli, E.J.R.; Michaels, T.I.; Karam, D.B. The physics of wind-blown sand and dust. Rep. Prog. Phys. 2012, 75, 106901. [Google Scholar] [CrossRef]
- Lorenz, R.D.; Balme, M.R.; Gu, Z.; Kahanpää, H.; Klose, M.; Kurgansky, M.V.; Patel, M.R.; Reiss, D.; Rossi, A.P.; Spiga, A.; et al. History and Applications of Dust Devil Studies. Space Sci. Rev. 2016, 203, 5–37. [Google Scholar] [CrossRef] [Green Version]
- Sinclair, P.C. Some Preliminary Dust Devil MEASUREMENTS. Mon. Weather Rev. 1964, 92, 363. [Google Scholar] [CrossRef]
- Sinclair, P.C. On the rotation of dust devils. Bull. Am. Meteorol. Soc. 1965, 46, 388–391. [Google Scholar] [CrossRef]
- Sinclair, P.C. General Characteristics of Dust Devils. J. Appl. Meteorol. 1969, 8, 32–45. [Google Scholar] [CrossRef] [Green Version]
- Sinclair, P.C. The Lower Structure of Dust Devils. J. Atmos. Sci. 1973, 30, 1599–1619. [Google Scholar] [CrossRef] [Green Version]
- Idso, S.B. Tornado-Like Dust Devils. Weather 1975, 30, 115–117. [Google Scholar] [CrossRef]
- Rennó, N.O.; Bluestein, H.B. A Simple Theory for Waterspouts. J. Atmos. Sci. 2001, 58, 927–932. [Google Scholar] [CrossRef]
- Snow, J.T.; McClelland, T.M. Dust devils at White Sands Missile Range, New Mexico: 1. Temporal and spatial distributions. J. Geophys. Res. 1990, 95, 13. [Google Scholar] [CrossRef]
- Kurgansky, M.V. Steady-state properties and statistical distribution of atmospheric dust devils. Geophys. Res. Lett. 2006, 33, L19S06. [Google Scholar] [CrossRef]
- Ringrose, T.J. Dust devils: Inside dust devils. Astron. Geophys. 2005, 46, 5.16–5.19. [Google Scholar] [CrossRef]
- Carroll, J.J.; Ryan, J.A. Atmospheric vorticity and dust devil rotation. J. Geophys. Res. 1970, 75, 5179–5184. [Google Scholar] [CrossRef]
- Ryan, J.A.; Carroll, J.J. Dust devil wind velocities: Mature state. J. Geophys. Res. 1970, 75, 531–541. [Google Scholar] [CrossRef]
- Fitzjarrald, D.E. A Field Investigation of Dust Devils. J. Appl. Meteorol. 1973, 12, 808–813. [Google Scholar] [CrossRef] [Green Version]
- Hess, G.D.; Spillane, K.T. Characteristics of Dust Devils in Australia. J. Appl. Meteorol. 1990, 29, 498–507. [Google Scholar] [CrossRef] [Green Version]
- Metzger, S.M.; Carr, J.R.; Johnson, J.R.; Parker, T.J.; Lemmon, M.T. Dust devil vortices seen by the Mars Pathfinder Camera. Geophys. Res. Lett. 1999, 26, 2781–2784. [Google Scholar] [CrossRef] [Green Version]
- Renno, N.O.; Abreu, V.J.; Koch, J.; Smith, P.H.; Hartogensis, O.K.; De Bruin, H.A.R.; Burose, D.; Delory, G.T.; Farrell, W.M.; Watts, C.J.; et al. MATADOR 2002: A pilot field experiment on convective plumes and dust devils. J. Geophys. Res. (Planets) 2004, 109, E07001. [Google Scholar] [CrossRef]
- Lewellen, D.C.; Lewellen, W.S.; Xia, J. The Influence of a Local Swirl Ratio on Tornado Intensification near the Surface. J. Atmos. Sci. 2000, 57, 527–544. [Google Scholar] [CrossRef]
- Metzger, S.M. Dust Devils as Aeolian Transport Mechanisms in Southern Nevada And the Mars Pathfinder Landing Site. Ph.D. Thesis, University of Nevada, Reno, NV, USA, 1999. [Google Scholar]
- Shao, Y. Physics and Modelling of Wind Erosion; Springer: Berlin, Germany, 2008. [Google Scholar]
- Iversen, J.D.; White, B.R. Saltation threshold on Earth, Mars and Venus. Sedimentology 1982, 29, 111–119. [Google Scholar] [CrossRef]
- Greeley, R.; Iversen, J.D. Wind As a Geological Process on Earth, Mars, Venus And Titan; Cambridge University Press: Cambridge, UK, 1985. [Google Scholar]
- Neakrase, L.D.V.; Balme, M.R.; Esposito, F.; Kelling, T.; Klose, M.; Kok, J.F.; Marticorena, B.; Merrison, J.; Patel, M.; Wurm, G. Particle Lifting Processes in Dust Devils. Space Sci. Rev. 2016, 203, 347–376. [Google Scholar] [CrossRef] [Green Version]
- Almeida, M.P.; Parteli, E.J.R.; Andrade, J.S.; Herrmann, H.J. From the Cover: Giant saltation on Mars. Proc. Natl. Acad. Sci. USA 2008, 105, 6222–6226. [Google Scholar] [CrossRef]
- Balme, M.R.; Whelley, P.L.; Greeley, R. Mars: Dust devil track survey in Argyre Planitia and Hellas Basin. J. Geophys. Res. (Planets) 2003, 108, 5086. [Google Scholar] [CrossRef]
- Balme, M.; Metzger, S.; Towner, M.; Ringrose, T.; Greeley, R.; Iversen, J. Friction wind speeds in dust devils: A field study. Geophys. Res. Lett. 2003, 30, 1830. [Google Scholar] [CrossRef]
- Oke, A.M.C.; Dunkerley, D.; Tapper, N.J. Willy-willies in the Australian landscape: Sediment transport characteristics. J. Arid Environ. 2007, 71, 216–228. [Google Scholar] [CrossRef]
- Greeley, R.; Balme, M.R.; Iversen, J.D.; Metzger, S.; Mickelson, R.; Phoreman, J.; White, B. Martian dust devils: Laboratory simulations of particle threshold. J. Geophys. Res. (Planets) 2003, 108, 5041. [Google Scholar] [CrossRef]
- Neakrase, L.D.V.; Greeley, R.; Iversen, J.D.; Balme, M.R.; Eddlemon, E.E. Dust flux within dust devils: Preliminary laboratory simulations. Geophys. Res. Lett. 2006, 33, L19S09. [Google Scholar] [CrossRef]
- Twohy, C.H.; Kreidenweis, S.M.; Eidhammer, T.; Browell, E.V.; Heymsfield, A.J.; Bansemer, A.R.; Anderson, B.E.; Chen, G.; Ismail, S.; DeMott, P.J.; et al. Saharan dust particles nucleate droplets in eastern Atlantic clouds. Geophys. Res. Lett. 2009, 36, L01807. [Google Scholar] [CrossRef]
- Tegen, I.; Lacis, A.A.; Fung, I. The influence on climate forcing of mineral aerosols from disturbed soils. Nature 1996, 380, 419–422. [Google Scholar] [CrossRef]
- Renno, N.O.; Kok, J.F. Electrical Activity and Dust Lifting on Earth, Mars, and Beyond. Space Sci. Rev. 2008, 137, 419–434. [Google Scholar] [CrossRef] [Green Version]
- Freier, G.D. The Electric Field of a Large Dust Devil. J. Geophys. Res. 1960, 65, 3504. [Google Scholar] [CrossRef]
- Kok, J.F.; Renno, N.O. Enhancement of the emission of mineral dust aerosols by electric forces. Geophys. Res. Lett. 2006, 33, L19S10. [Google Scholar] [CrossRef]
- Kok, J.F.; Renno, N.O. Electrostatics in Wind-Blown Sand. Phys. Rev. Lett. 2008, 100, 014501. [Google Scholar] [CrossRef]
- Lacks, D.J.; Levandovsky, A. Effect of particle size distribution on the polarity of triboelectric charging in granular insulator systems. J. Electrost. 2007, 65, 107–112. [Google Scholar] [CrossRef]
- Schmidt, D.S.; Schmidt, R.A.; Dent, J.D. Electrostatic force on saltating sand. J. Geophys. Res. 1998, 103, 8997–9001. [Google Scholar] [CrossRef] [Green Version]
- Jackson, T.L.; Farrell, W.M. Electrostatic Fields in Dust Devils: An Analog to Mars. IEEE Trans. Geosci. Remote Sens. 2006, 44, 2942–2949. [Google Scholar] [CrossRef]
- Stow, C.D. Dust and Sand Storm Electrification. Weather 1969, 24, 134–144. [Google Scholar] [CrossRef]
- Pähtz, T.; Herrmann, H.J.; Shinbrot, T. Why do particle clouds generate electric charges? Nat. Phys. 2010, 6, 364–368. [Google Scholar] [CrossRef] [Green Version]
- Mills, A.A. Dust clouds and frictional generation of glow discharges on Mars. Nature 1977, 268, 614. [Google Scholar] [CrossRef]
- Crozier, W.D. The Electrical Field of a New Mexico Dust Devil. J. Geophys. Res. 1964, 69, 5427–5429. [Google Scholar] [CrossRef]
- Williams, E.; Nathou, N.; Hicks, E.; Pontikis, C.; Russell, B.; Miller, M.; Bartholomew, M.J. The electrification of dust-lofting gust fronts (‘haboobs’) in the Sahel. Atmos. Res. 2009, 91, 292–298. [Google Scholar] [CrossRef]
- Rudge, W.A.D. Atmospheric electrification during South African dust storms. Nature 1913, 91, 31–32. [Google Scholar] [CrossRef]
- Farrell, W.M.; Smith, P.H.; Delory, G.T.; Hillard, G.B.; Marshall, J.R.; Catling, D.; Hecht, M.; Tratt, D.M.; Renno, N.; Desch, M.D.; et al. Electric and magnetic signatures of dust devils from the 2000–2001 MATADOR desert tests. J. Geophys. Res. (Planets) 2004, 109, E03004. [Google Scholar] [CrossRef]
- Farrell, W.M.; Delory, G.T.; Cummer, S.A.; Marshall, J.R. A simple electrodynamic model of a dust devil. Geophys. Res. Lett. 2003, 30, 2050. [Google Scholar] [CrossRef]
- Farrell, W.M.; Renno, N.; Delory, G.T.; Cummer, S.A.; Marshall, J.R. Integration of electrostatic and fluid dynamics within a dust devil. J. Geophys. Res. (Planets) 2006, 111, E01006. [Google Scholar] [CrossRef]
- Eden, H.F.; Vonnegut, B. Electrical Breakdown Caused by Dust Motion in Low-Pressure Atmospheres: Considerations for Mars. Science 1973, 180, 962–963. [Google Scholar] [CrossRef] [PubMed]
- Melnik, O.; Parrot, M. Electrostatic discharge in Martian dust storms. J. Geophys. Res. 1998, 103, 29107–29118. [Google Scholar] [CrossRef]
- Zheng, X.J.; Huang, N.; Zhou, Y.H. Laboratory measurement of electrification of wind-blown sands and simulation of its effect on sand saltation movement. J. Geophys. Res. (Atmos.) 2003, 108, 4322. [Google Scholar] [CrossRef]
- Zhou, Y.H.; Guo, X.; Zheng, X.J. Experimental measurement of wind-sand flux and sand transport for naturally mixed sands. Phys. Rev. E 2002, 66, 021305. [Google Scholar] [CrossRef] [PubMed]
- Huang, N.; Yue, G.; Zheng, X. Numerical simulations of a dust devil and the electric field in it. J. Geophys. Res. (Atmos.) 2008, 113, D20203. [Google Scholar] [CrossRef]
- Ireland, P.M. Triboelectrification of particulate flows on surfaces: Part I? Experiments. Powder Technol. 2010, 198, 189–198. [Google Scholar] [CrossRef]
- Ireland, P.M. Triboelectrification of particulate flows on surfaces: Part II? Mechanisms and models. Powder Technol. 2010, 198, 199–210. [Google Scholar] [CrossRef]
- Ireland, P.M.; Jameson, G.J. Particle dynamics in cyclone tribochargers. J. Electrost. 2013, 71, 449–455. [Google Scholar] [CrossRef]
- Lowell, J.; Truscott, W.S. Triboelectrification of identical insulators. II. Theory and further experiments. J. Phys. D Appl. Phys. 1986, 19, 1281–1298. [Google Scholar] [CrossRef]
- Lacks, D.J.; Duff, N.; Kumar, S.K. Nonequilibrium Accumulation of Surface Species and Triboelectric Charging in Single Component Particulate Systems. Phys. Rev. Lett. 2008, 100, 188305. [Google Scholar] [CrossRef]
- Lacks, D.J.; Mohan Sankaran, R. Contact electrification of insulating materials. J. Phys. D Appl. Phys. 2011, 44, 453001. [Google Scholar] [CrossRef]
- Matsusaka, S.; Masuda, H. Electrostatics of particles. Adv. Powder Technol. 2003, 14, 143–166. [Google Scholar] [CrossRef]
- Onishchenko, O.G.; Pokhotelov, O.A.; Astafieva, N.M. Reviews of topical problems: Generation of large-scale eddies and zonal winds in planetary atmospheres. Phys. Uspekhi 2008, 51, 577–589. [Google Scholar] [CrossRef]
- Mullen, J.B.; Maxworthy, T. A laboratory model of dust devil vortices. Dyn. Atmos. Oceans 1977, 1, 181–214. [Google Scholar] [CrossRef]
- Church, C.R.; Snow, J.T.; Baker, G.L.; Agee, E.M. Characteristics of Tornado-Like Vortices as a Function of Swirl Ratio: A Laboratory Investigation. J. Atmos. Sci. 1979, 36, 1755–1776. [Google Scholar] [CrossRef] [Green Version]
- Howells, P.A.C.; Rotunno, R.; Smith, R.K. A comparative study of atmospheric and laboratory-analogue numerical tornado-vortex models. Q. J. R. Meteorol. Soc. 1988, 114, 801–822. [Google Scholar] [CrossRef]
- Idso, S.B.; Kimball, B.A. Tornado or Dust Devil: The Enigma of Desert Whirlwinds. Am. Sci. 1974, 62, 530–541. [Google Scholar]
- Nolan, D.S.; Farrell, B.F. The Structure and Dynamics of Tornado-Like Vortices. J. Atmos. Sci. 1999, 56, 2908–2936. [Google Scholar] [CrossRef]
- Trapp, R.J.; Fiedler, B.H. Tornado-like Vortexgenesis in a Simplified Numerical Model. J. Atmos. Sci. 1995, 52, 3757–3778. [Google Scholar] [CrossRef]
- Mahowald, N. Aerosol Indirect Effect on Biogeochemical Cycles and Climate. Science 2011, 334, 794. [Google Scholar] [CrossRef]
- Mahowald, N.; Ward, D.S.; Kloster, S.; Flanner, M.G.; Heald, C.L.; Heavens, N.G.; Hess, P.G.; Lamarque, J.F.; Chuang, P.Y. Aerosol Impacts on Climate and Biogeochemistry. Ann. Rev. Environ. Resour. 2011, 36, 45–74. [Google Scholar] [CrossRef]
- Miller, R.L.; Knippertz, P.; Pérez Garcia-Pando, C.; Perlwitz, J.P.; Tegen, I. Impact of dust radiative forcing upon climate. In Mineral Dust; Knippertz, P., Stuut, J.-B.W., Eds.; Springer: Berlin, Germany, 2014; pp. 327–357. [Google Scholar]
- Yoshioka, M.; Mahowald, N.M.; Conley, A.J.; Collins, W.D.; Fillmore, D.W.; Zender, C.S.; Coleman, D.B. Impact of Desert Dust Radiative Forcing on Sahel Precipitation: Relative Importance of Dust Compared to Sea Surface Temperature Variations, Vegetation Changes, and Greenhouse Gas Warming. J. Clim. 2007, 20, 1445. [Google Scholar] [CrossRef]
- Pokharel, A.K.; Kaplan, M.L.; Fiedler, S. The Role of Jet Adjustment Processes in Subtropical Dust Storms. J. Geophys. Res. (Atmos.) 2017, 122, 12. [Google Scholar] [CrossRef]
- Pokharel, A.K.; Kaplan, M.L.; Fiedler, S. Subtropical Dust Storms and Downslope Wind Events. J. Geophys. Res. (Atmos.) 2017, 122, 10. [Google Scholar] [CrossRef]
- Ramanathan, V.; Crutzen, P.J.; Kiehl, J.T.; Rosenfeld, D. Aerosols, Climate, and the Hydrological Cycle. Science 2001, 294, 2119–2124. [Google Scholar] [CrossRef] [PubMed] [Green Version]
- Toon, O.B. African dust in Florida clouds. Nature 2003, 424, 623–624. [Google Scholar] [CrossRef] [PubMed]
- Twohy, C.H.; Anderson, B.E.; Ferrare, R.A.; Sauter, K.E.; L’Ecuyer, T.S.; van den Heever, S.C.; Heymsfield, A.J.; Ismail, S.; Diskin, G.S. Saharan dust, convective lofting, aerosol enhancement zones, and potential impacts on ice nucleation in the tropical upper troposphere. J. Geophys. Res. (Atmos.) 2017, 122, 8833–8851. [Google Scholar] [CrossRef]
- Kohfeld, K.E.; Harrison, S.P. DIRTMAP: The geological record of dust. Earth Sci. Rev. 2001, 54, 81–114. [Google Scholar] [CrossRef]
- Harrison, S.P.; Kohfeld, K.E.; Roelandt, C.; Claquin, T. The role of dust in climate changes today, at the last glacial maximum and in the future. Earth Sci. Rev. 2001, 54, 43–80. [Google Scholar] [CrossRef]
- Prospero, J.M.; Lamb, P.J. African Droughts and Dust Transport to the Caribbean: Climate Change Implications. Science 2003, 302, 1024–1027. [Google Scholar] [CrossRef]
- DeMott, P.J.; Sassen, K.; Poellot, M.R.; Baumgardner, D.; Rogers, D.C.; Brooks, S.D.; Prenni, A.J.; Kreidenweis, S.M. African dust aerosols as atmospheric ice nuclei. Geophys. Res. Lett. 2003, 30, 1732. [Google Scholar] [CrossRef]
- Zhao, Y.Z.; Gu, Z.L.; Yu, Y.Z.; Ge, Y.; Li, Y.; Feng, X. Mechanism and large eddy simulation of dust devils. Atmos.-Ocean 2004, 41, 61–84. [Google Scholar] [CrossRef]
- Rafkin, S.; Jemmett-Smith, B.; Fenton, L.; Lorenz, R.; Takemi, T.; Ito, J.; Tyler, D. Dust Devil Formation. Space Sci. Rev. 2016, 203, 183–207. [Google Scholar] [CrossRef]
- Raasch, S.; Franke, T. Structure and formation of dust devil-like vortices in the atmospheric boundary layer: A high-resolution numerical study. J. Geophys. Res. (Atmos.) 2011, 116, D16120. [Google Scholar] [CrossRef]
- Kurgansky, M.V. A simple model of dry convective helical vortices (with applications to the atmospheric dust devil). Dyn. Atmos. Oceans 2005, 40, 151–162. [Google Scholar] [CrossRef]
- Bluestein, H.B.; Pazmany, A.L. Observations of Tornadoes and Other Convective Phenomena with a Mobile, 3-mm Wavelength, Doppler Radar: The Spring 1999 Field Experiment. Bull. Am. Meteorol. Soc. 2000, 81, 2939–2952. [Google Scholar] [CrossRef]
- Jackson, B.; Lorenz, R.; Davis, K.; Lipple, B. Using an Instrumented Drone to Probe Dust Devils on Oregon’s Alvord Desert. Remote Sens. 2018, 10, 65. [Google Scholar] [CrossRef]
- Rennó, N.O.; Burkett, M.L.; Larkin, M.P. A Simple Thermodynamical Theory for Dust Devils. J. Atmos. Sci. 1998, 55, 3244–3252. [Google Scholar] [CrossRef]
- Onishchenko, O.G.; Horton, W.; Pokhotelov, O.A.; Stenflo, L. Dust devil generation. Phys. Scr. 2014, 89, 075606. [Google Scholar] [CrossRef]
- Onishchenko, O.G.; Pokhotelov, O.A.; Horton, W. Dust devil dynamics in the internal vortex region. Phys. Scr. 2015, 90, 068004. [Google Scholar] [CrossRef]
- Onishchenko, O.; Pokhotelov, O.; Horton, W.; Fedun, V. Dust devil vortex generation from convective cells. Ann. Geophys. 2015, 33, 1343–1347. [Google Scholar] [CrossRef] [Green Version]
- Onishchenko, O.G.; Horton, W.; Pokhotelov, O.A.; Fedun, V. “Explosively growing” vortices of unstably stratified atmosphere. J. Geophys. Res. (Atmos.) 2016, 121, 11. [Google Scholar] [CrossRef]
- Rankine, W.J.M. A Manual of Applied Mechanics; C. Griffin and Co., Limited: London, UK, 1901. [Google Scholar]
- Battan, L.J. Energy of a Dust Devil. J. Atmos. Sci. 1958, 15, 235–236. [Google Scholar] [CrossRef]
- Toigo, A.D.; Richardson, M.I.; Ewald, S.P.; Gierasch, P.J. Numerical simulation of Martian dust devils. J. Geophys. Res. (Planets) 2003, 108, 5047. [Google Scholar] [CrossRef]
- Kurgansky, M.V.; Lorenz, R.D.; Renno, N.O.; Takemi, T.; Gu, Z.; Wei, W. Dust Devil Steady-State Structure from a Fluid Dynamics Perspective. Space Sci. Rev. 2016, 203, 209–244. [Google Scholar] [CrossRef]
- Vatistas, G.H.; Kozel, V.; Mih, W.C. A simpler model for concentrated vortices. Exp. Fluids 1991, 11, 73–76. [Google Scholar] [CrossRef]
- Burgers, J.M. A Mathematical Model Illustrating the Theory of Turbulence. Adv. Appl. Mech. 1948, 1, 171–199. [Google Scholar]
- Rott, N. On the viscous core of a line vortex. Z. Angew. Math. Phys. 1958, 9, 543–553. [Google Scholar] [CrossRef]
- Sullivan, R.D. A two-cell vortex solution of the Navier-Stokes equations. J. Aerosp. Sci. 1959, 26, 767–768. [Google Scholar] [CrossRef]
- Gu, Z.; Qiu, J.; Zhao, Y.; Li, Y. Simulation of terrestrial dust devil patterns. Adv. Atmos. Sci. 2008, 25, 31–42. [Google Scholar] [CrossRef]
- Michaels, T.I.; Rafkin, S.C.R. Large-eddy simulation of atmospheric convection on Mars. Q. J. R. Meteorol. Soc. 2004, 130, 1251–1274. [Google Scholar] [CrossRef] [Green Version]
- Onishchenko, O.G.; Fedun, V.; Horton, W.; Pokhotelov, O.A.; Astafieva, N.M.; Verth, G. Stationary concentrated vortex model. Q. J. R. Meteorol. Soc. 2018. submitted. [Google Scholar]
- Onishchenko, O.G.; Pokhotelov, O.A.; Astafieva, N.M. A novel model of quasi-stationary vortices in the Earth’s atmosphere. Izv. Atmos. Ocean. Phys. 2018, 54, 130–134. [Google Scholar]
- Kamra, A.K. Measurements of the electrical properties of dust storms. J. Geophys. Res. 1972, 77, 5856–5869. [Google Scholar] [CrossRef]
- Perkins, S. Static electricity strengthens desert dust storms. Science 2016. [Google Scholar] [CrossRef]
- Izvekova, Y.N.; Popel, S.I. Nonlinear Wave Structures and Plasma-Dust Effects in the Earth’s Atmosphere. Plasma Phys. Rep. 2018, 44, 835–839. [Google Scholar] [CrossRef]
- Spiga, A.; Barth, E.; Gu, Z.; Hoffmann, F.; Ito, J.; Jemmett-Smith, B.; Klose, M.; Nishizawa, S.; Raasch, S.; Rafkin, S.; et al. Large-Eddy Simulations of Dust Devils and Convective Vortices. Space Sci. Rev. 2016, 203, 245–275. [Google Scholar] [CrossRef] [Green Version]
- Lorenz, R.D. Vortex Encounter Rates with Fixed Barometer Stations: Comparison with Visual Dust Devil Counts and Large-Eddy Simulations. J. Atmos. Sci. 2014, 71, 4461–4472. [Google Scholar] [CrossRef]
- Kanak, K.M. Numerical simulation of dust devil-scale vortices. Q. J. R. Meteorol. Soc. 2005, 131, 1271–1292. [Google Scholar] [CrossRef] [Green Version]
- Kanak, K.M.; Lilly, D.K.; Snow, J.T. The formation of vertical Vortices in the convective boundary layer. Q. J. R. Meteorol. Soc. 2000, 126, 2789–2810. [Google Scholar] [CrossRef]
- Leslie, L.M.; Smith, R.K. On the choice of radial boundary conditions for numerical models of sub-synoptic vortex flows in the atmosphere, with application to dust devils. Q. J. R. Meteorol. Soc. 1977, 103, 499–510. [Google Scholar] [CrossRef]
- Smith, R.K.; Leslie, L.M. Thermally driven vortices: A numerical study with application to dust-devil dynamics. Q. J. R. Meteorol. Soc. 1976, 102, 791–804. [Google Scholar] [CrossRef]
- Neves, T.; Fisch, G.; Raasch, S. Local Convection and Turbulence in the Amazonia Using Large Eddy Simulation Model. Atmosphere 2018, 9, 399. [Google Scholar] [CrossRef]
- Harrison, R.G.; Barth, E.; Esposito, F.; Merrison, J.; Montmessin, F.; Aplin, K.L.; Borlina, C.; Berthelier, J.J.; Déprez, G.; Farrell, W.M.; et al. Applications of Electrified Dust and Dust Devil Electrodynamics to Martian Atmospheric Electricity. Space Sci. Rev. 2016, 203, 299–345. [Google Scholar] [CrossRef] [Green Version]
- Barth, E.L.; Farrell, W.M.; Rafkin, S.C. The Electric Environment of Martian Dust Devils. AGU Fall Meeting Abstracts. 2017. Available online: http://adsabs.harvard.edu/abs/2017AGUFM.P33I..04B (accessed on 9 January 2019).
- Farrell, W.M.; McLain, J.L.; Collier, M.R.; Keller, J.W. The Martian dust devil electron avalanche: Laboratory measurements of the E-field fortifying effects of dust-electron absorption. Icarus 2017, 297, 90–96. [Google Scholar] [CrossRef]
- Zhai, Y.; Cummer, S.A.; Farrell, W.M. Quasi-electrostatic field analysis and simulation of Martian and terrestrial dust devils. J. Geophys. Res. (Planets) 2006, 111, E06016. [Google Scholar] [CrossRef]
- Horton, W.; Miura, H.; Onishchenko, O.; Couedel, L.; Arnas, C.; Escarguel, A.; Benkadda, S.; Fedun, V. Dust devil dynamics. J. Geophys. Res. (Atmos.) 2016, 121, 7197–7214. [Google Scholar] [CrossRef] [Green Version]
Figure 1.
The normalised radial velocity as a function of and time , 4.0, 5.6 and 6.4 s. The dependance are shown for two separate radial intervals, i.e., (left) and (right).
Figure 1.
The normalised radial velocity as a function of and time , 4.0, 5.6 and 6.4 s. The dependance are shown for two separate radial intervals, i.e., (left) and (right).

Figure 2.
The normalised vertical velocity for as a function of and time , 4.0, 5.6 and 6.4 s. The intervals are the same as in Figure 1.
Figure 2.
The normalised vertical velocity for as a function of and time , 4.0, 5.6 and 6.4 s. The intervals are the same as in Figure 1.

Figure 3.
The radial dependence of the normalized vertical vorticity in the inner (left) and the outer region (right) of the vortex for and 6.4 s.
Figure 3.
The radial dependence of the normalized vertical vorticity in the inner (left) and the outer region (right) of the vortex for and 6.4 s.

Figure 4.
The normalised three-dimensional field of the velocities of the fluid motion and the particle trajectory in the vortex are shown for , and . The vortex height and characteristic radius in the respective units.
Figure 4.
The normalised three-dimensional field of the velocities of the fluid motion and the particle trajectory in the vortex are shown for , and . The vortex height and characteristic radius in the respective units.

Figure 5.
Pressure values across the vortex at different heights for , and from top to bottom, correspondingly.
Figure 5.
Pressure values across the vortex at different heights for , and from top to bottom, correspondingly.

Figure 6.
The results of numerical simulation of the evolution of a single vortex in different vertical sections of the vortex (from top to bottom) and at different times , and (from left to right).
Figure 6.
The results of numerical simulation of the evolution of a single vortex in different vertical sections of the vortex (from top to bottom) and at different times , and (from left to right).

Figure 7.
Three fragments of vortex structure evolution; time grows from left to right.

© 2019 by the authors. Licensee MDPI, Basel, Switzerland. This article is an open access article distributed under the terms and conditions of the Creative Commons Attribution (CC BY) license (http://creativecommons.org/licenses/by/4.0/).
Share and Cite
MDPI and ACS Style
Onishchenko, O.; Fedun, V.; Horton, W.; Pokhotelov, O.; Verth, G. Dust Devils: Structural Features, Dynamics and Climate Impact. Climate 2019, 7, 12. https://0-doi-org.brum.beds.ac.uk/10.3390/cli7010012
AMA Style
Onishchenko O, Fedun V, Horton W, Pokhotelov O, Verth G. Dust Devils: Structural Features, Dynamics and Climate Impact. Climate. 2019; 7(1):12. https://0-doi-org.brum.beds.ac.uk/10.3390/cli7010012
Chicago/Turabian StyleOnishchenko, Oleg, Viktor Fedun, Wendell Horton, Oleg Pokhotelov, and Gary Verth. 2019. "Dust Devils: Structural Features, Dynamics and Climate Impact" Climate 7, no. 1: 12. https://0-doi-org.brum.beds.ac.uk/10.3390/cli7010012
Note that from the first issue of 2016, this journal uses article numbers instead of page numbers. See further details here.