Green Infrastructure Financing as an Imperative to Achieve Green Goals

1
Wagner Graduate School of Public Service, New York University, 295 Lafayette Street—2nd floor, New York, NY 10012, USA
2
Master of Science in Public Policy, New York University, New York, NY 10012, USA
3
Master of Public Administration, New York University, New York, NY 10012, USA
*
Author to whom correspondence should be addressed.
Climate 2019, 7(3), 39; https://0-doi-org.brum.beds.ac.uk/10.3390/cli7030039
Submission received: 31 January 2019
/
Revised: 2 March 2019
/
Accepted: 3 March 2019
/
Published: 9 March 2019
(This article belongs to the Special Issue Climate Change Resilience and Urban Sustainability)
Abstract
:Green infrastructure (GI) has increasingly gained popularity for achieving adaptation and mitigation goals associated with climate change and extreme weather events. To continue implementing GI, financial tools are needed for upfront project capital or development costs and later for maintenance. This study’s purpose is to evaluate financing tools used in a selected GI dataset and to assess how those tools are linked to various GI technologies and other GI project characteristics like cost and size. The dataset includes over 400 GI U.S. projects, comprising a convenience sample, from the American Society of Landscape Architects (ASLA). GI project characteristics were organized to answer a number of research questions using descriptive statistics. Results indicated that the number of projects and overall cost shares were mostly located in a few states. Grants were the most common financial tool with about two-thirds of the projects reporting information on financial tools receiving grant funding. Most projects reported financing from only one tool with a maximum of three tools. Projects primarily included multiple GI technologies averaging three and a maximum of nine. The most common GI technologies were bioswales, retention, rain gardens, and porous pavements. These findings are useful for decision-makers evaluating funding support for GI.
1. Introduction
Green infrastructure (GI) has had a very long history and has emerged as a central strategy in climate-related adaptation and mitigation to reduce adverse effects on and from infrastructure [1]. The foundation of GI is reflected in a number of different elements or concepts. It can be traced back at least for example to “Garden Cities” and green cities that included green belts, corridors, greenways, ecological corridors, and other similar forms and types of spaces in the U.S. and Europe [2]. The need to integrate such green elements into cities in an urban planning context has often been emphasized [3].
The role of GI in climate-related adaptation and mitigation applies to a wide range of climate-related water phenomenon such as extreme precipitation, sea level rise, and heat, all of which have been increasing for many years and are projected to continue to increase. Walsh et al. [4], for example, point out that, in the U.S. since 1991, “the amount of rain falling in very heavy precipitation events has been significantly above average. This increase has been greatest in the Northeast, Midwest, and upper Great Plains—more than 30% above the 1901–1960 average” [4] (p. 36). Globally since 1880, “sea level has risen by about 8 inches... [and is] projected to rise another 1 to 4 feet by 2100, ... much greater than at any time in at least the past 2000 years” [4] (p. 44). The fourth National Climate Assessment provides similar conclusions with respect to water inundations [5] (p. 43). In addition to the water management functions, which is the focus here, GI is also used for other purposes, providing co-benefits and multiple functions in general [6,7,8] such as reducing the impacts of extreme heat and improving air quality. McPhillips and Matsler [9] identify, for example, the heat management benefits provided by green roofs [10,11], tree canopies, and other vegetation. The role of GI in providing these benefits as a foundation for climate-related adaptation and mitigation relates to and has roots in a number of disciplinary areas such as “nature-based” solutions and ecosystem services [12,13,14]. These functions are also often performed in conjunction with urban planning, sustainability and resilience planning, and development, yet the density of many urban areas is considered likely to require special adaptations of GI approaches [3]. GI techniques that take advantage of elevated spaces and vertical walls in dense urban areas begin to approach this problem.
For GI goals to become a reality, financial support is needed in the same way attention was given to finance for gray infrastructure (defined below) over the past century or more. GI finance differs from gray infrastructure financing in the kinds of investors it attracts, since it reflects socially conscious investment. As such, a different kind of financing emerges. GI financial mechanisms may be similar in structure to those used for gray infrastructure, however, they differ in the details in important ways, as an outcome of the emphasis upon socially responsible investment. These details include the terms, conditions, who the buyers are and what they want. Combinations of GI and gray infrastructure in financial packages, however, are important hybrids in that more funds and investors can potentially be attracted to the combined benefits.
Gray infrastructure signifies infrastructures that rely upon structures as distinct from GI, which incorporates natural systems. The differences between green and gray infrastructures have been emphasized in the literature, for example by Bell et al. [15] (p. 3) in the context of stormwater control systems (SCMs) as follows: “Gray SCMs are larger structures made from conventional construction materials (e.g., concrete, steel, and plastic) that focus on storage and release, whereas green SCMs are typically smaller, consist of media and plants, and focus on reducing runoff and pollutant loads.” GI can potentially support connectivity with gray infrastructure, and this connectivity can increase the reduction of negative water-related impacts of gray infrastructure, and potentially open up opportunities for additional funding. McPhillips and Matsler [9] (p. 2) focus on connectivity also in the context of stormwater control measures (SCMs) as “hybrid” systems that are “ecological to technological, or green to gray”. Infrastructure connectivity poses a complex analytical problem involving networks and numerous modeling approaches [1,16,17] and green–gray infrastructure connections are the next frontier with finance potentially heavily influencing and enabling both sectors and their connections.
1.1. Scope of the Research
This paper focuses on how GI projects aimed at water management in the U.S. are funded, what the characteristics of these funding mechanisms or sources are, and how funding relates to the size, cost, location, and in some cases the completion date of the project. The basis for this analysis is a convenience sample, which is not intended to be representative of the broader set of GI, and whose value is in its contribution to a growing database for GI projects. The sample contains GI which provides water management primarily through vegetation and to some extent material adaptations to promote water absorption (e.g., porous pavement). The term ‘technology’ is used in this paper in connection with GI where it refers to GI types since they involve knowledge applications such as hydrology, plant science, etc. This is consistent with the definition of technology as applying knowledge areas [18] and its use for GI [19,20].
Much of the success of GI projects is likely to depend upon financing and understanding the circumstances under which different types of funding are used. Thus, the paper addresses the following research questions:
- R1.
- How does project size and cost vary by the general type of funding source (public, private, or mixed)?
- R2.
- How does project size and cost vary by GI technology used?
- R3.
- Do larger projects in terms of either size or cost use more funding tools?
- R4.
- Do projects use different financial tools based on the total project cost?
- R5.
- Do older projects rely on fewer funding sources?
- R6.
- Does the use of GI technologies in the convenience sample change over time, potentially affecting the kind of GI financing used over time?
1.2. Green Infrastructure Defined
Green infrastructure is defined by the U.S. EPA [21] as usually vegetation-based and reducing or managing water flows by slowing water down, infiltrating it into the ground, evaporating it, transpiring it through vegetation, or redirecting it: GI “reduces and treats stormwater at its source while delivering environmental, social, and economic benefits”. Other research has generally used that definition, for example, to trace the history of GI over more than a century [1]. Within the broad GI category, however, there are numerous types or subcategories of GI and the U.S. EPA [21] lists about a dozen types and even more subtypes, and specific municipalities often put forth other typologies. The Georgetown Climate Center [22] has also provided a similar typology and definitions. Although the research presented here analyzes about a dozen GI types individually, these can roughly be grouped into several categories that are potentially relevant to the way GI is managed and financed: (1) land-based (bioretention, rain garden, bioswale, natural buffers) and street-related (porous pavement, green streets, street trees); (2) building-based (green roof, downspout removal, cistern, rain barrels); and (3) multi-purpose depending on how they are deployed (detention, retention). The variety of definitions for the types of GI has been noted by others [3,6] and has been considered a factor in contributing to uncertainty in how to categorize GI [9]. The broader term, stormwater control measures (SCM) has been used to reflect the range of technologies from gray to green [9,15]. Bell et al. [15] provides details on how the name for a given GI type can differ for different designs and different locations. In other areas of the world, the definition of GI has different meanings. In Europe, for example, GI can often signify facilities with non-water related uses [23,24,25]. GIs with different names also can signify the same GI functions, for example, rain gardens and bioretention.
This paper focuses on the water management function of the GI element, which can encompass both water quantity and water quality functions. It uses the GI category that respondents in the ASLA survey indicated. The benefits of GI are widely acknowledged for stormwater management, as well as providing other co-benefits indicated above. New York City, for example, quantitatively measures the performance of green infrastructure toward their stormwater management goals, and the results were compared with what has been used by over a dozen utilities elsewhere [26]. The Center for Neighborhood Technology [27] provides a calculator for measuring runoff against green infrastructure characteristics. A number of compilations of GI cases have used or linked these characteristics and benefit measures to specific types of financing [28,29].
A concept that is a foundation for GI is infrastructure itself. Although infrastructures have been used for thousands of years—for example, the ancient Roman aqueduct—the term itself has come into common usage much more recently. A brief review traces its origins to the 20th century [1], with the term generally referring to the physical facilities and services that support economic and social activities. Another definition calls infrastructure “the ‘sinews’ of the city” cutting across numerous functions [30] (p. 4) while yet another defines it in terms of the processes it supports moving materials or services from an origin to a destination through a distribution network [31] (p. 104); [32]. Defining GI as infrastructure is important in order to relate it to municipal governments where different funding streams can become available to it that would not typically be available to categories defined biologically. Also, such visibility to municipal governments that fund gray infrastructure might support combined funding opportunities. However, reference to infrastructure may on the contrary subject GI to similar disinvestment that other infrastructures have experienced.
1.3. Financial Tools
In order to realize the potential for GI, financing is a critical necessity. Infrastructure in general has had a long history of disinvestment for both capital or construction costs and maintenance, and it is important for GI not to experience these same constraints. GI is particularly in need of a strong financial base given that it is relatively new, the technologies used are very diverse, they are generally decentralized or dispersed, and it is appealing to social goals as discussed above. Having a wide variety of funding mechanisms that go beyond reliance on a few popular mechanisms for which there is a lot of competition can provide a flexible base adaptable to different conditions and resources to begin to confront GI financing needs.
Financing tools for GI are currently very diversified and widely dispersed across federal, state, and local organizations. These represent public, private, and non-profit funding sources and within those broad groupings and their combinations are many different types of grants, loans, bonds, user fees, and taxation mechanisms or tools. Interest in financial support for GI has been increasing in the public sector [33]. For example, U.S. EPA guidance reported at least a 10% reserve for GI based on Public Law 112-74 for FY12 [34], GI financing policies have been formulated for State Revolving Funds [33,34], and financial activity in general has been reported for specific GI projects [20,35,36]. On 14 January 2019, the Water Infrastructure Improvement Act (H.R. 7279) became P.L. 115-436 that promoted GI use [37]. The U.S. EPA [38] listed almost two dozen federal programs with potential green infrastructure content distributed across about a dozen federal agencies with U.S. HUD, EPA, and DOT accounting for almost half of those programs, and others identified as collaborative programs [35].
Appendix A summarizes some of the major financial tools actually or potentially applicable for GI along with some illustrative examples from numerous sources [22,35,38].
A number of financial mechanisms applicable to GI coincide with or originate from other forms of environmental funding for climate mitigation and adaptation, specific environmental and infrastructure sectors, and extreme weather event special purpose appropriations. A brief description of some of the major financial tools follows below.
Grants have originated in environmental provisions in legislation and accompanying administrative procedures. With respect to the water management function of GI, the legislation has primarily originated from the U.S. Clean Water Act and programs in about a dozen federal agencies [38] that work collaboratively [35]. Some are broadly applicable to communities while others include applications for the use of GI at government owned or managed facilities, such as the U.S. Department of Energy and U.S. Department of Defense [35]. These funding authorities often can be delegated to states and other governmental units, depending upon the State eligibility or ability to meet federal grant administration conditions. Examples of grants relevant to GI that originate from various federal agencies depend on the type of infrastructure area to which GI applies. Loans also originate from federal agencies as well as from many other types of organizations, and a common mechanism applicable to GI is the State Revolving Fund [38]. Bonds are a very diverse funding mechanism and are issued by different types of organizations with different structures and pay-back or other compensation mechanisms if applicable. Well over a dozen different kinds of bonds are actually or potentially applicable to GI depending on the nature and purpose of the facilities being financed, such as conventional municipal bonds, climate bonds, green bonds, and other special purpose bonds [39,40,41,42]. Numerous charges exist including taxation, development exactions, and user fees. Some of these are linked to loans and bonds in the form of pay-back mechanisms, and others are not. Financially-based exemptions also appear in a variety of forms, for example, tax exemptions. In the private sector, many mechanisms exist that can be similar to government mechanisms, however the source of funding is very different, and the method of fund disbursement can differ from the procedures used by government [43,44]. Different funding sources are also often combined. Public–private partnerships (P3), for example, are a way that this occurs, and the forms these take varies with the partners involved. Alternatively, combinations can arise without collaborations. The institutional context of funding is a critical consideration which is a concern that has been analyzed in the U.S. [6] as well as internationally [45,46].
2. Approach and Methodology
2.1. Database Components
A large database of GI projects is maintained by the American Association of Landscape Architects (ASLA) [47]. The advantage of the database is the availability of different project characteristics systematically suitable for addressing the research questions posed above. However, the dataset is not a random sample and would generally be characterized as a ‘convenience sample’ provided by ASLA members in response to an EPA request for case studies. The use of this database is not intended to be representative of the population of GI projects nor is the analysis intended to infer the characteristics of such a population. Instead, this research reflects only the characteristics of the ASLA database to explore further questions about GI technologies and financing tools.
The cases from the ASLA database were extracted for this project in about 2017. The data was compiled from the ASLA cases for the following parameters [47] listed in Table 1.
Out of 461 cases, 17 were eliminated because there was limited data associated with them or because they were outside of the U.S. (in Canada) leaving 444 cases for analysis. When cases are dropped for a specific analysis, the updated number is presented. Only the following variables had fewer than 444 cases: financial tools (n = 102) and completion year (74).
2.2. Data Transformations and Analytical Method
Preparation of the data for analysis involved a few minor steps. All numerical data entries were converted to a common unit (e.g., metric vs. imperial units) to allow for direct comparison. A new variable, cost per square foot, was created as the ratio of project size and cost to standardize project size enabling better comparison of project costs. One-hot encoding was used to create a series of binary variables for both financial tools and GI technologies extracted from a written description of the project. Counts were derived for each project for the number of GI technologies a given project used and the count of the number of financial tools used to strengthen the exploratory effort. Case data was then analyzed using descriptive statistics and regression, keeping in mind the non-random, non-representative nature of the dataset.
2.3. Brief Description of Selected Database Characteristics
2.3.1. Geographical Distribution of Dataset Projects
The projects in the dataset and their characteristics were not uniformly geographically distributed. As an example, by state,
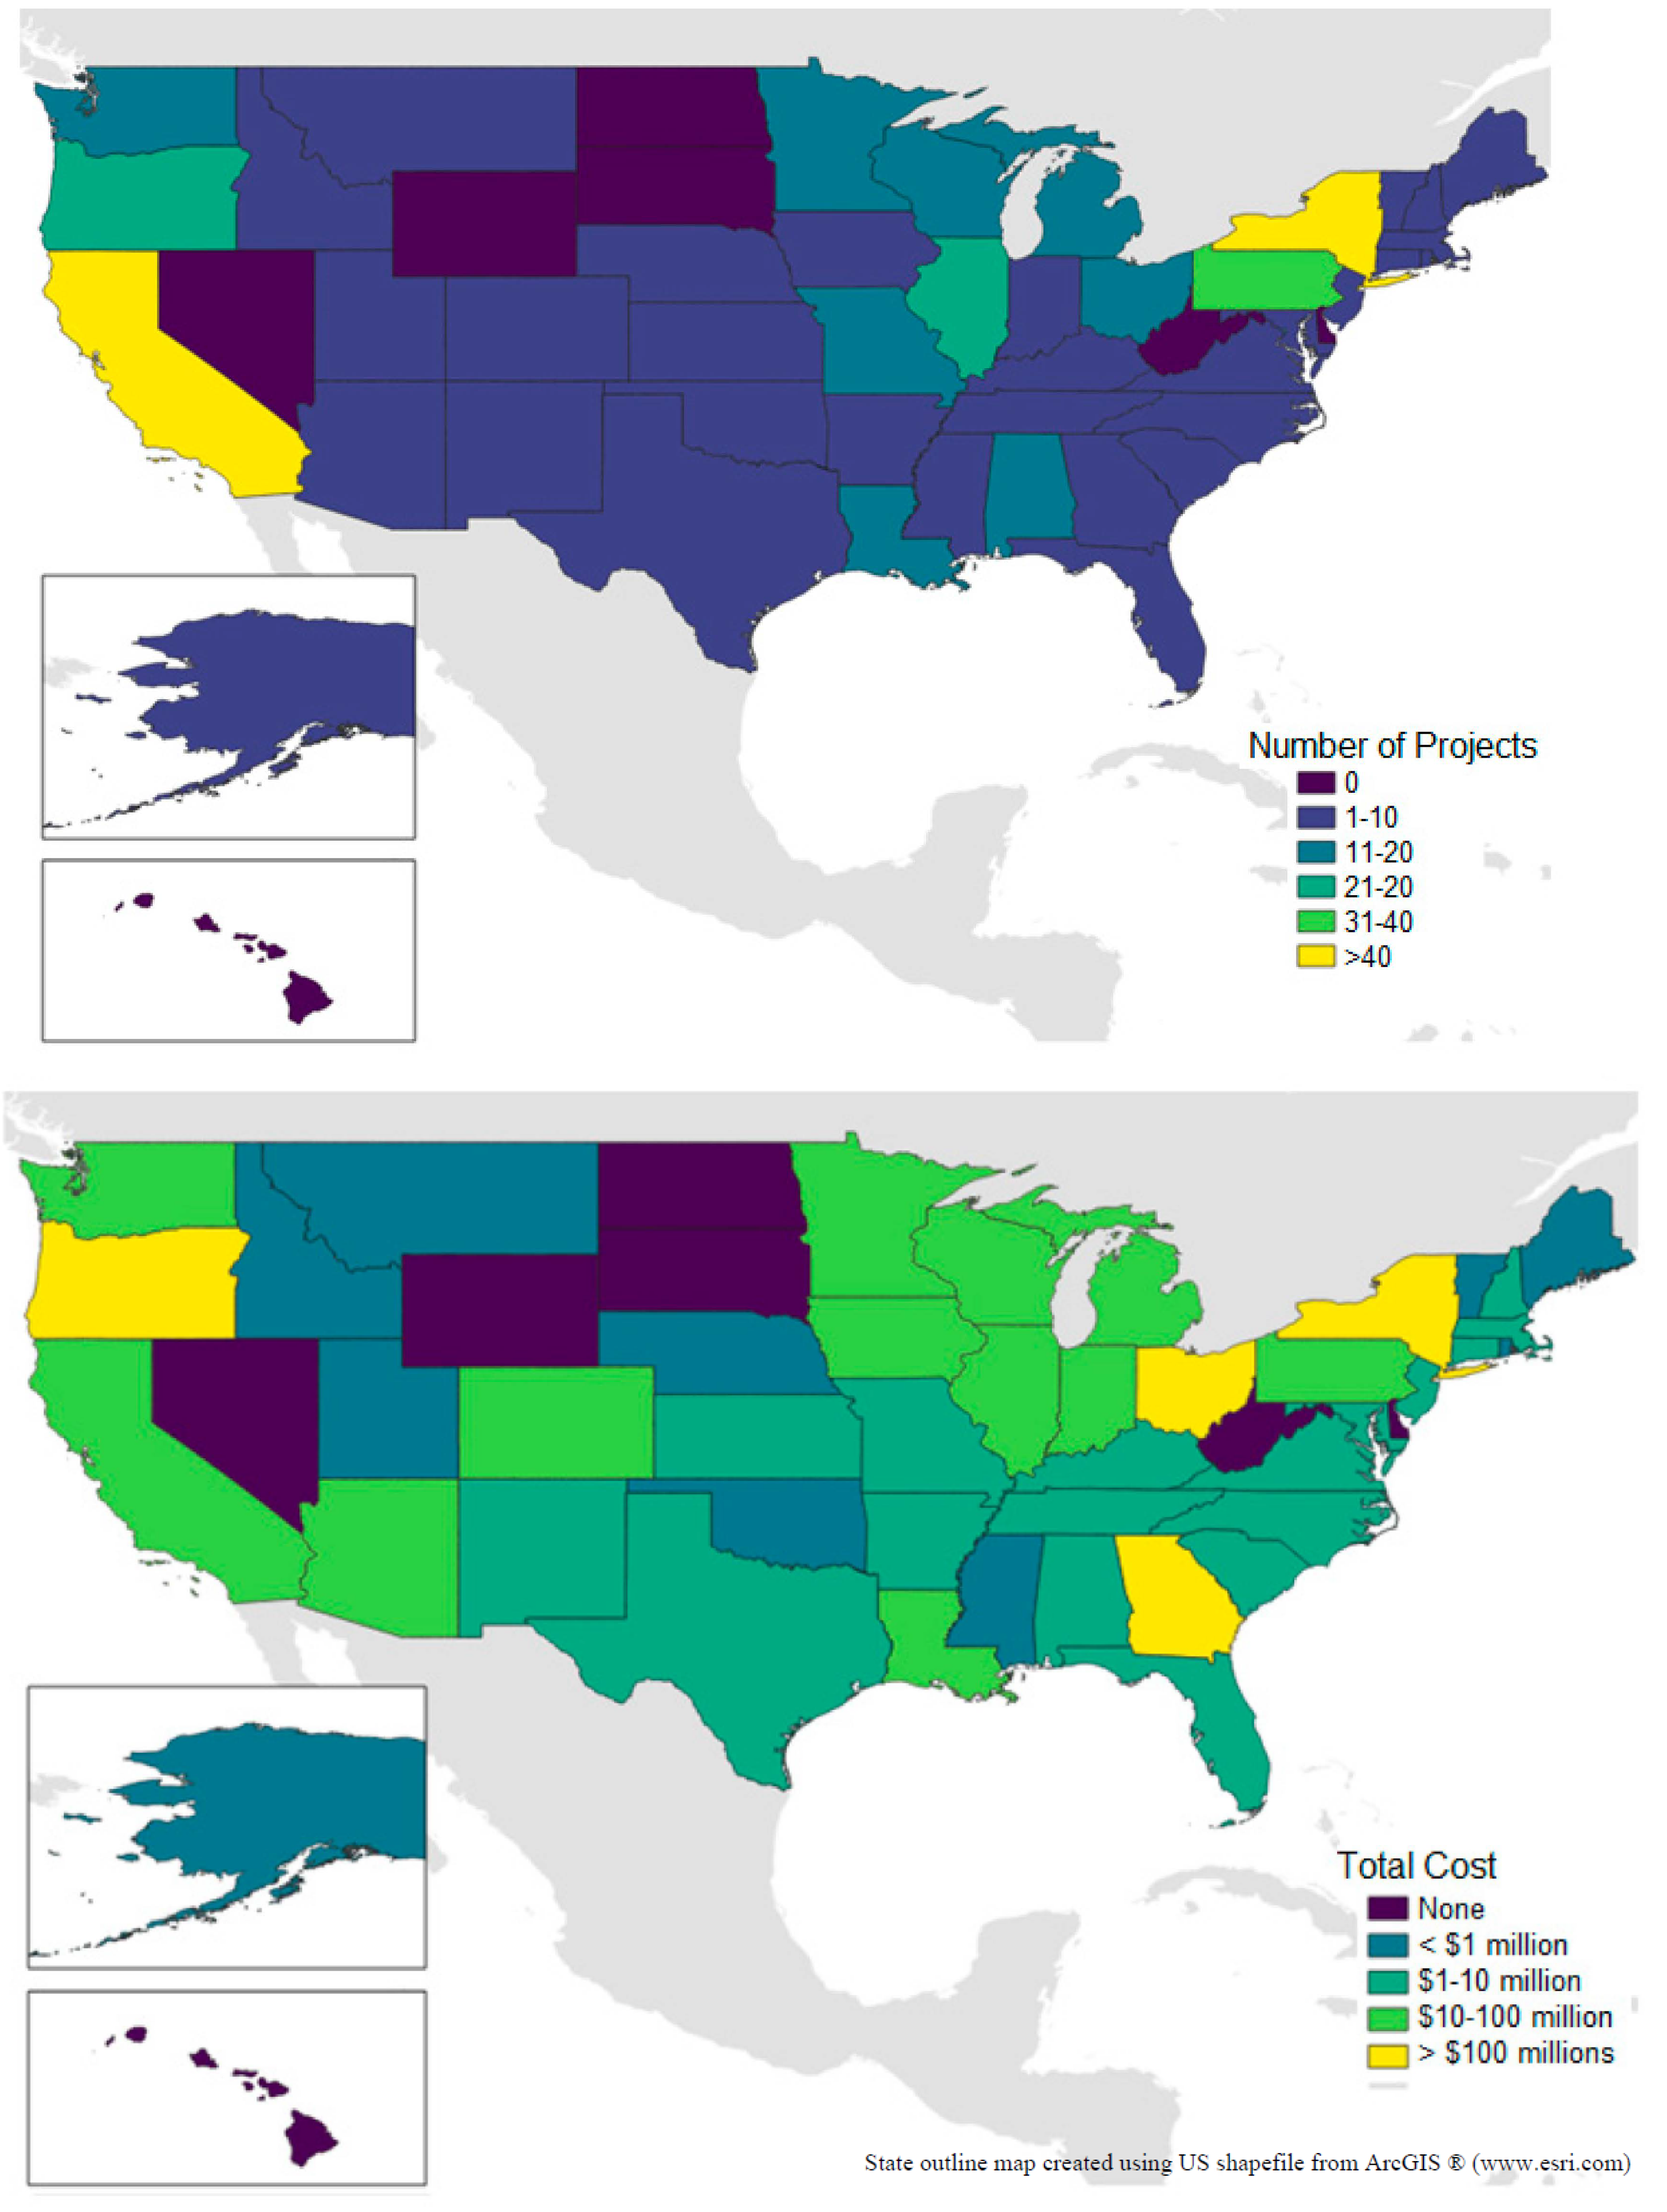
- Only 43 states and the District of Columbia were represented in the dataset. Delaware, Hawaii, Nevada, North Dakota, South Dakota, and West Virginia did not have any projects represented.
- Maine, Montana, Nebraska, Rhode Island, and Vermont each had only 1 project while New York had the most with 56 projects. New York along with California, Pennsylvania, Illinois, and Oregon together accounted for 42% of the projects while each of the other states accounted for under 5% individually.
- Vermont had the lowest total costs with $24,820 and Ohio had the highest with $140,161,100. Ohio along with New York, Georgia, Oregon, and California together accounted for almost two-thirds of the total GI costs.
Figure 1 shows the distribution of the convenience sample dataset by State. Although this is not meant to be representative of GI projects given the non-representative nature of the dataset it enables comparisons to be made with other datasets and to begin to identify why gaps have occurred.
2.3.2. GI Financial Sources and Tools
All 444 cases indicated whether the financial source was public, private, or mixed, and only 102 (23.0%) specified the financial tool used. Projects that did specify the financial tools rarely used more than one—over 80% of the 102 cases indicated using only one tool—and the maximum number of tools used by a single project was three. For cases reporting financial tool, the most common financial tool was grants with over 66% of cases indicating grants as a source of funding and 51% of cases obtaining funding solely through grants. The most common combination of financial tools was a public/private mix of grants and donations. Most projects—around 70%—received exclusively public funding while a little over one quarter received exclusively private funding and under 5% received mixed public/private funds.
Table 2 provides the distribution of financial tools by financial source based upon case projects in the convenience sample.
2.3.3. GI Technology
All 444 cases provided a project description from which the GI technology used was characterized based on keywords. Though individual projects tended to use multiple GI technologies (the average was three and the maximum was nine), projects tended to use the same type of technologies: 55% of the projects used bioswales, 50% used rain gardens, 45% used bioretention, and 44% used porous pavements. Only 17% of cases did not use any of these top four technologies. The U.S. EPA [21] provided the following definitions of these top four GI technologies, recognizing that different sources can define these technologies differently as noted earlier:
- Bioswales: “... vegetated, mulched, or xeriscaped channels that provide treatment and retention as they move stormwater from one place to another.”
- Rain gardens: “... versatile features that can be installed in almost any unpaved space. Also known as bioretention, or bioinfiltration, cells, they are shallow, vegetated basins that collect and absorb runoff from rooftops, sidewalks, and streets. This practice mimics natural hydrology by infiltrating and evaporating and transpiring—or “evapotranspiring”—stormwater runoff.”
- Bioretention: This is considered to be similar to rain gardens.
- Porous pavements: “... infiltrate, treat, and/or store rainwater where it falls. They can be made of pervious concrete, porous asphalt, or permeable interlocking pavers.”
3. Results
3.1. Characteristics of the Green Infrastructure Projects in the Dataset
As indicated above, the size of the dataset was 444 GI projects. These projects had the following characteristics, shown in Table 3. More detailed results are presented for each research question in the next section.
3.2. Research Questions
3.2.1. Research Question 1: How Does Project Size and Cost Vary by the General Type of Funding Source (Public, Private, or Mixed)?
In addition to very specific financial tools provided by a subset of cases, all 444 projects were categorized more generally as receiving public, private, or mixed sources of funding. Project size (in square feet), cost (construction or capital costs), and a calculation of cost per square foot were all compared based on this general source of funding. There was no statistically significant difference between the general funding source categories based on any of these three measures.
- For project cost, the ANOVA comparing the three groups separately had a p-value = 0.740 while the t-test comparing public to private and mixed had a p-value of 0.597
- For project size, the ANOVA comparing the three groups separately had a p-value = 0.286 while the t-test comparing public to private and mixed had a p-value of 0.115
- For cost per square foot, the ANOVA comparing the three groups separately had a p-value = 0.225 while the t-test comparing public to private and mixed had a p-value of 0.095.
Worth noting, though, is that the most expensive projects in terms of overall cost and cost per square foot were both publicly funded while the largest project in terms of size was privately funded. Similarly, the least expensive projects in terms of overall cost and cost square foot were both privately funded while the smallest project in size was publicly funded.
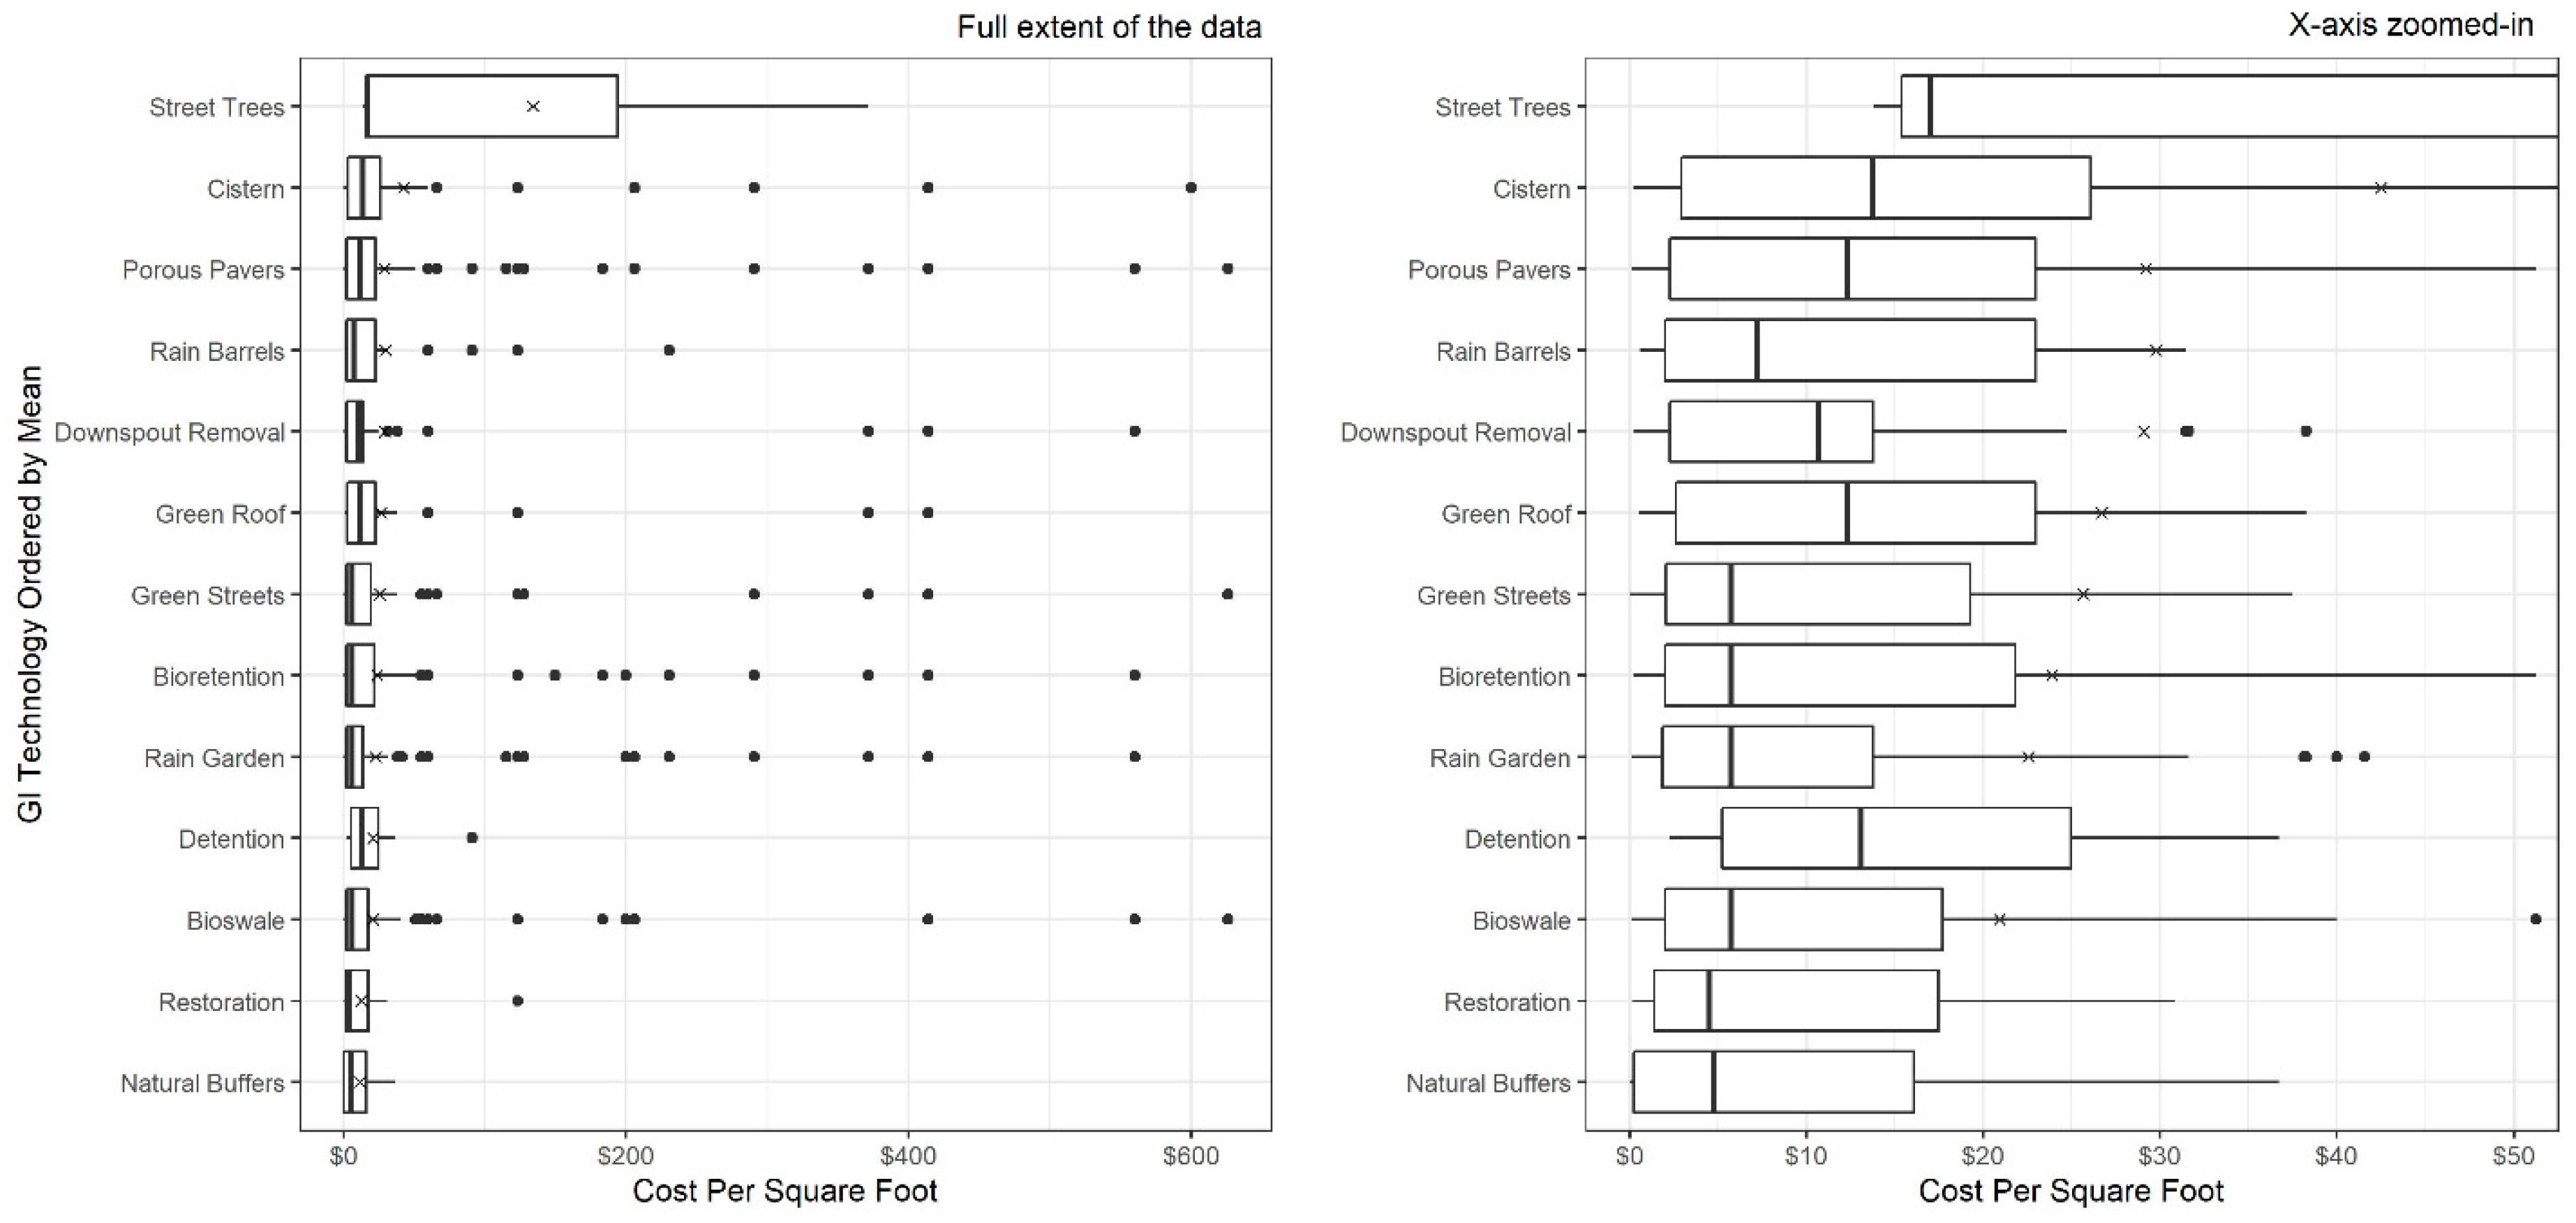
3.2.2. Research Question 2: How Does Project Size and Cost Vary by GI Technology Used?
Cost and size were combined into a cost per square foot measure to compare projects by GI technology. The results are shown in Figure 2. Variability within each technology was high and there were numerous outliers. Street trees stand out as the technology with the highest mean and median, but there were only three cases that used street trees and one case was an extreme outlier, so the values may be biased. Setting aside street trees, the median cost per square foot for each technology is within the interquartile range (IQR) of all of the other technologies suggesting there are no major differences between the technologies in terms of cost per square foot.
3.2.3. Research Question 3: Do Larger Projects in Terms of Either Size or Cost Use More Funding Tools?
The number of financial tools used per project was very low: the maximum tools per project was three and the average was 1.2 with a standard deviation of 0.45. Only 2 projects out of those reporting used 3 tools (2%), 16 (about 16%) used 2 tools, and the rest used only 1 tool. It was determined above that neither project size nor project cost correlates with the use of general funding source (private, public, or mixed), so this question examines the relationship between project size and cost and the number of financial tools used. The results of the regression for each metric are provided in Table 4 and Table 5 below.
Unlike the general financial source evaluated in research question 1, both project size and cost have a statistically significant, positive correlation with the number of financial tools used. The magnitude of this relationship is small, though, given the fact that all projects used very few tools regardless of size and cost.
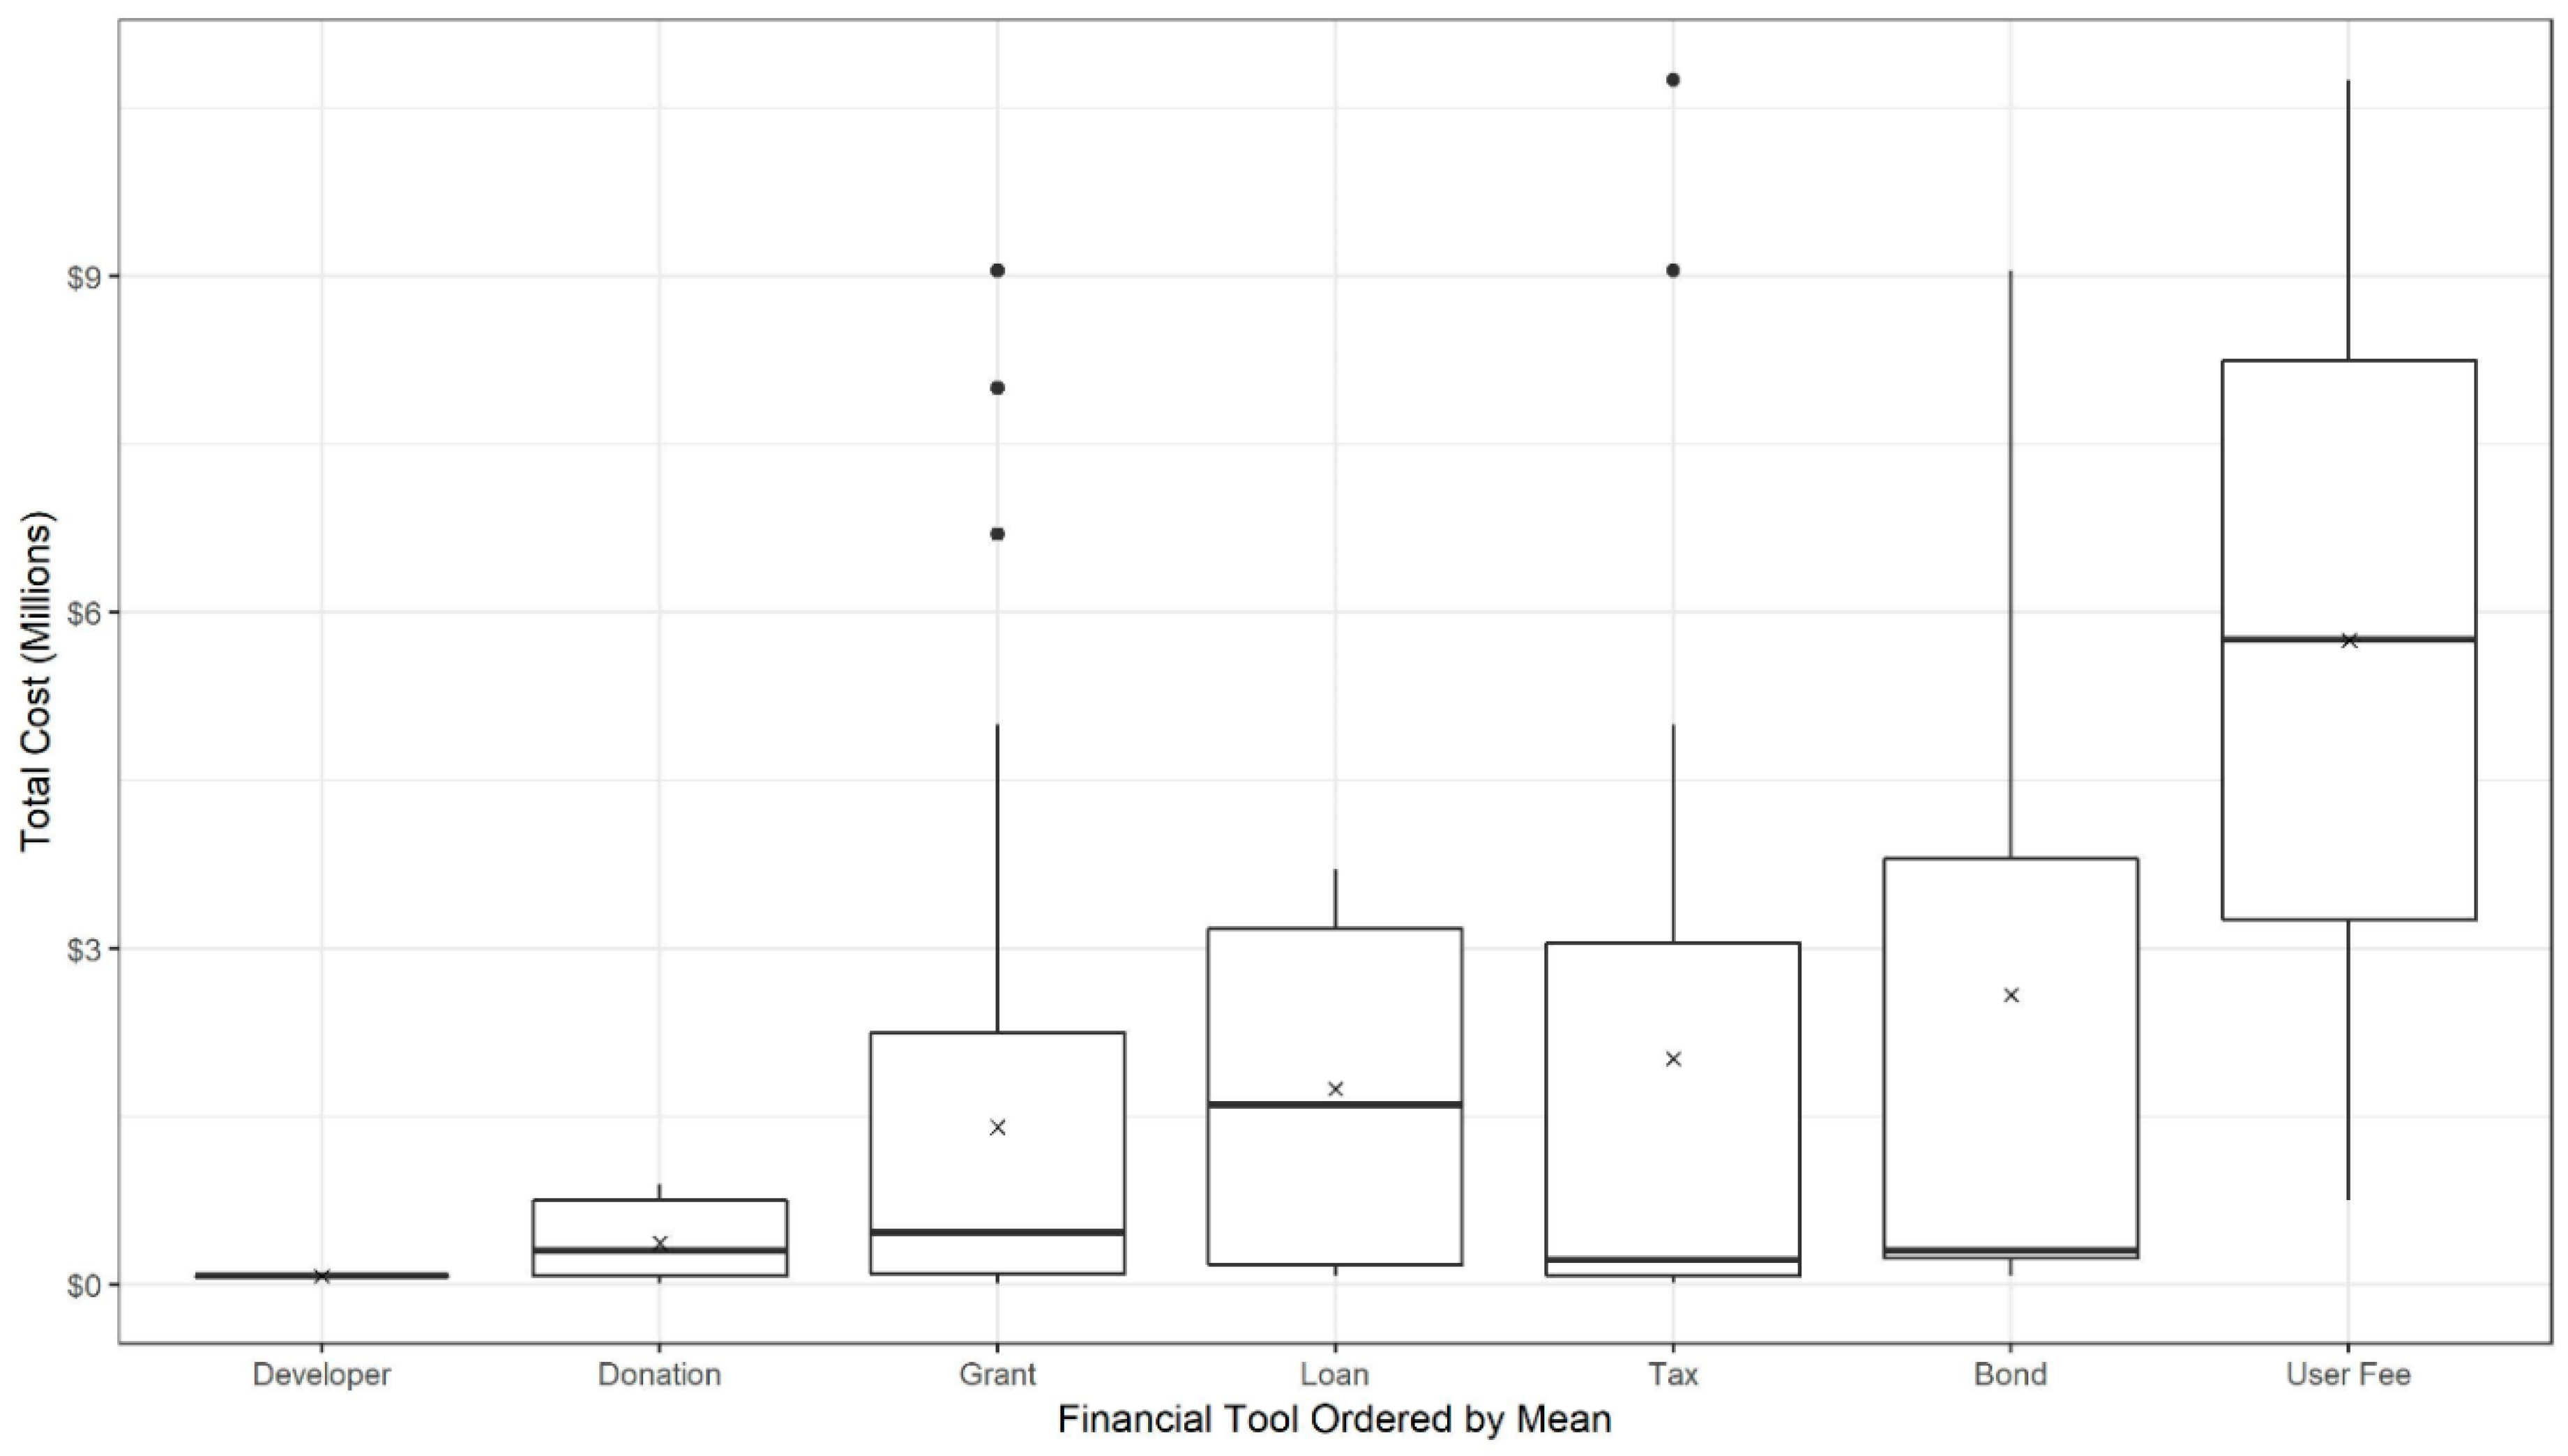
3.2.4. Research Question 4: Do Projects Use Different Financial Tools Based on the Total Project Cost?
The distribution of overall project cost is outlined by financial tool in Figure 3. For projects in this convenience dataset, the variability within each financial tool is high and the distributions across tools have significant overlap. While the most expensive projects were funded by taxes and user fees and the least expensive projects were funded by developers and donations there does not seem to be an obvious trend in the use of financial tools based on overall project cost.
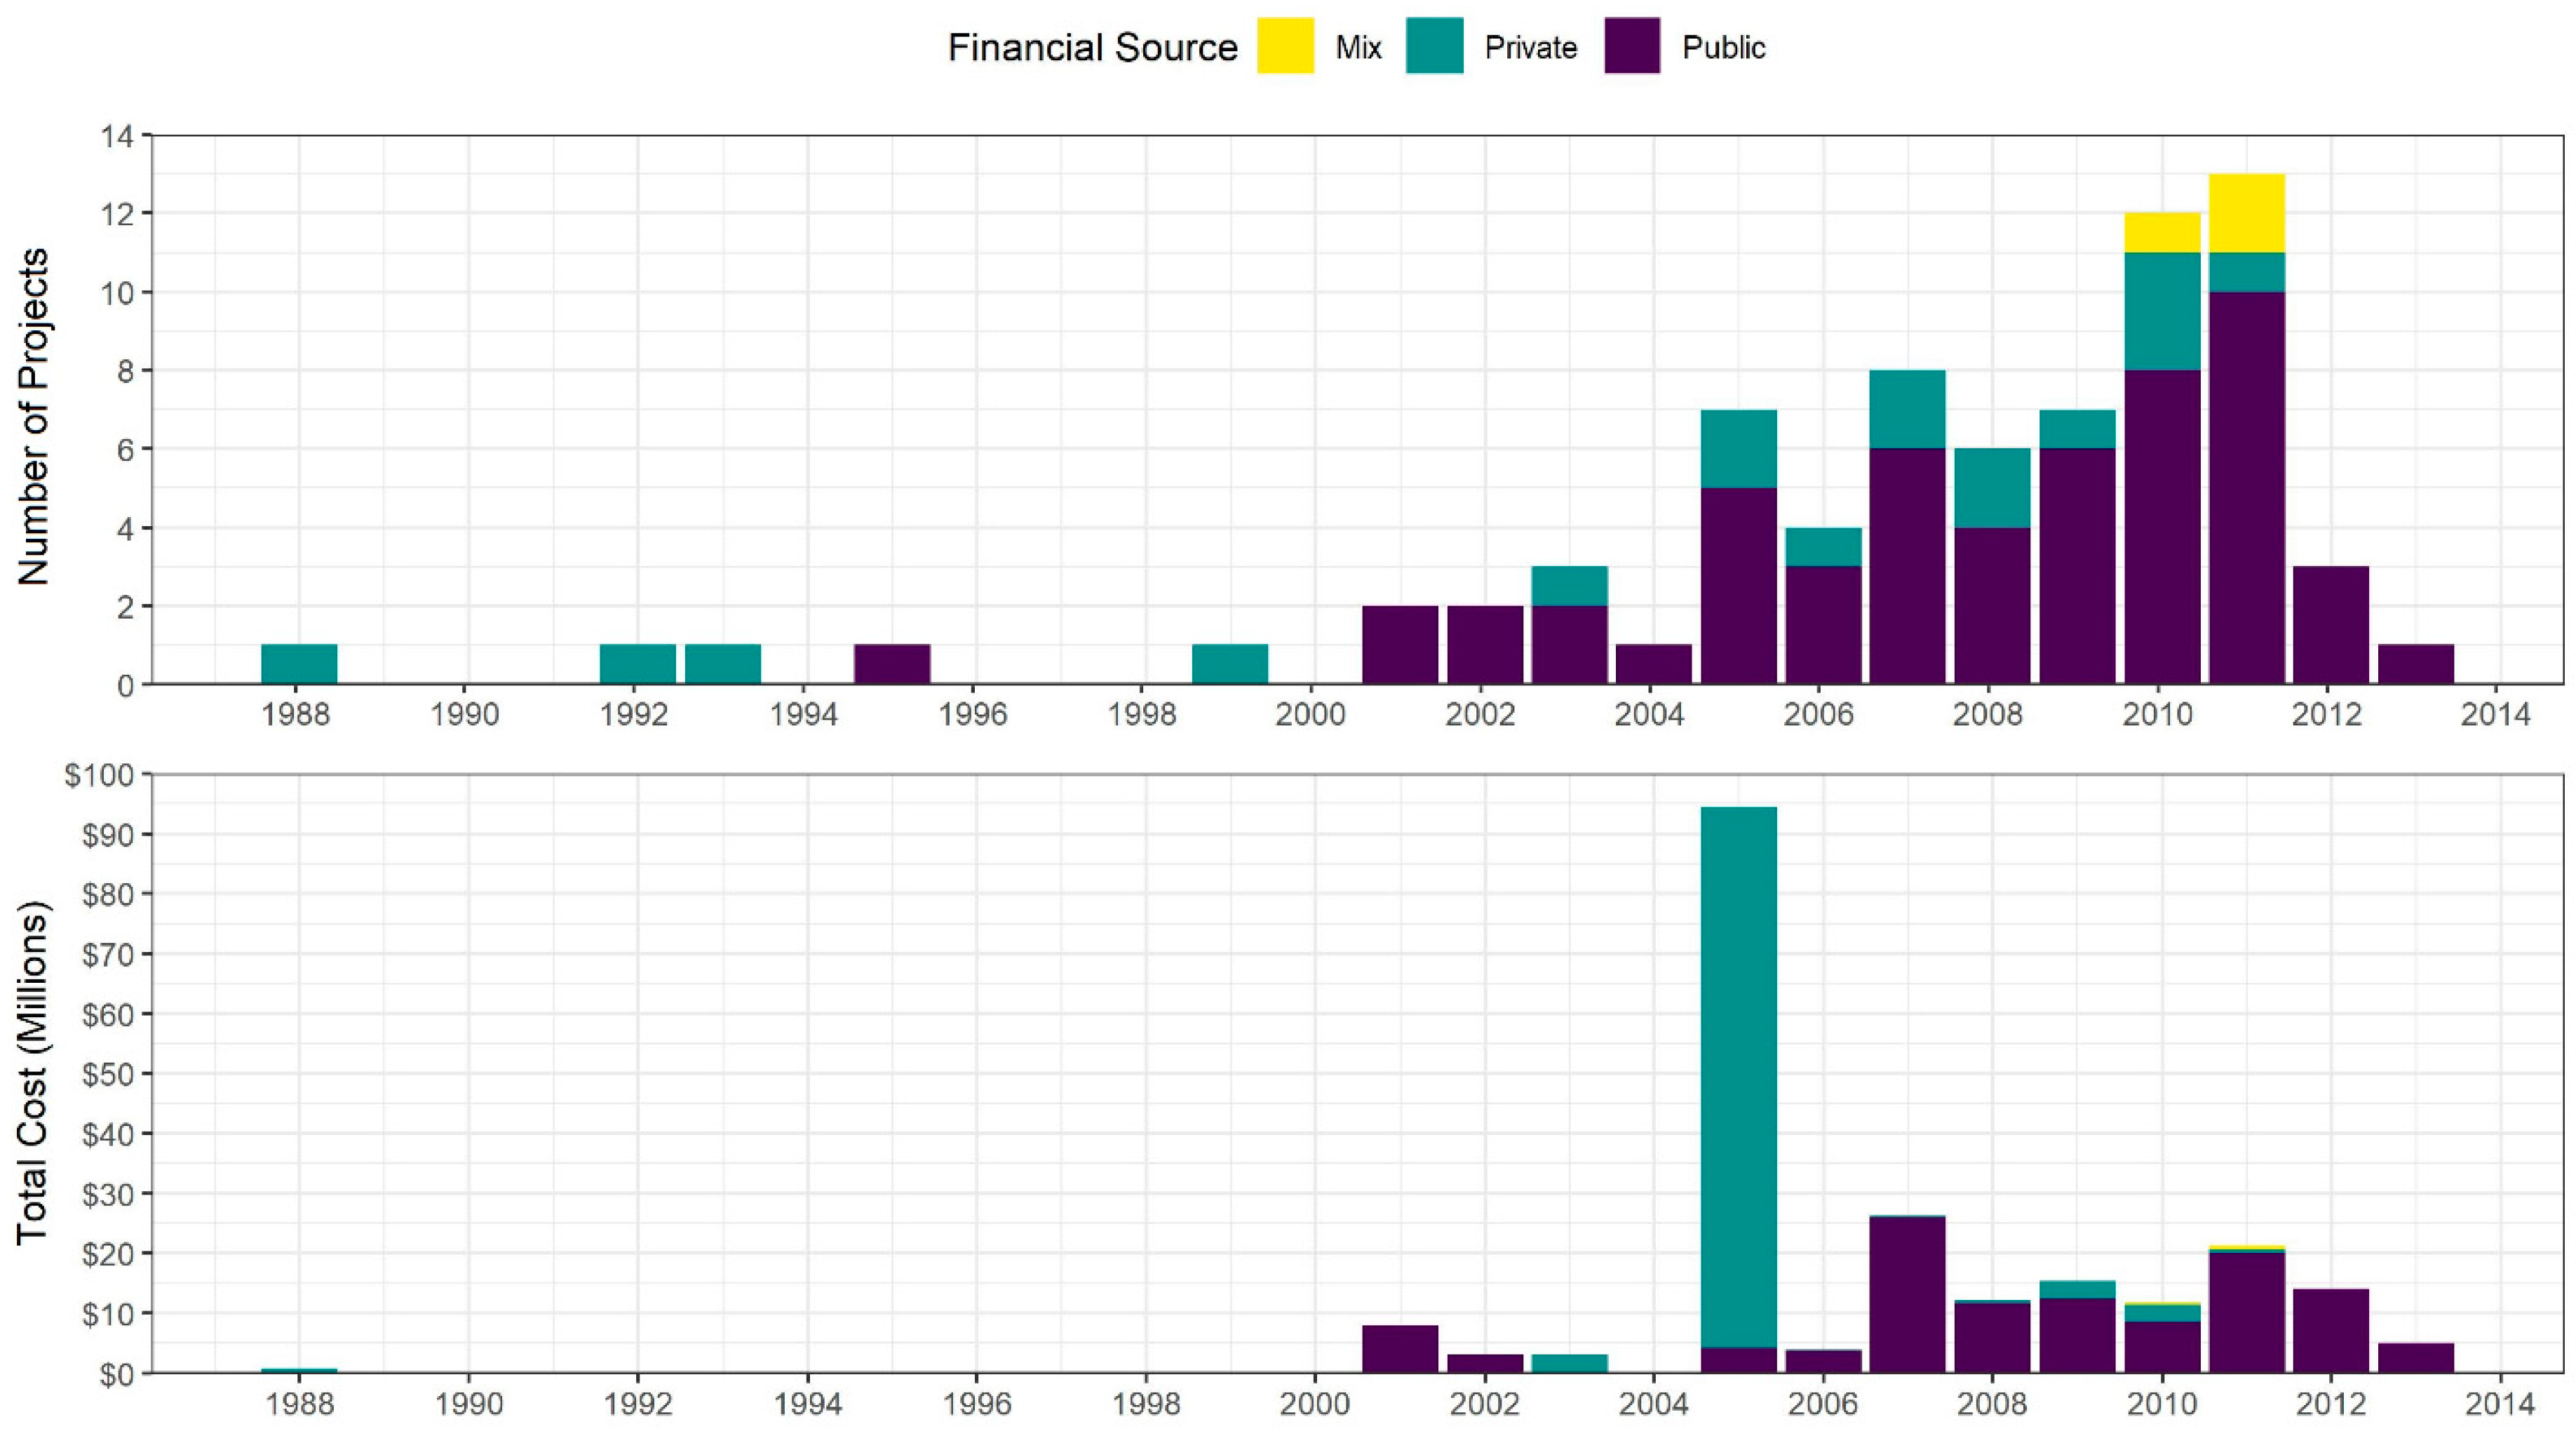
3.2.5. Research Question 5: Do Older Projects Rely on Fewer Funding Sources?
Age of project was defined as the year the project was completed according to the specification in the dataset. The completion year was only reported for 74 cases (about 17%); the other cases were either missing this variable or were not completed at the time of the survey. A sudden drop-off occurs around 2013 that is likely due to incomplete projects at the time of sampling and fewer samples being collected after the initial compilation. Given the limited data available, the number of projects and the costs seem to have increased dramatically in the later years, which is possibly explained by the increasing popularity of GI and greater widespread use in just this sample. Figure 4 illustrates this trend for both total cost and number of GI projects by year.
Additionally, it appears as though the number of financial tools used per project is increasing slightly. This may be due to an increase in availability of financial tools, an increase in awareness of financing options, or the non-random nature of the dataset. As GI becomes more established, additional financing sources are likely to make funds available through various tools.
Figure 4 not only shows the dominance of public sources of funding in terms of both projects and costs (reflected by the large share of grants as a funding tool), but also the increase in the prominence of public sources over time for both projects and costs.
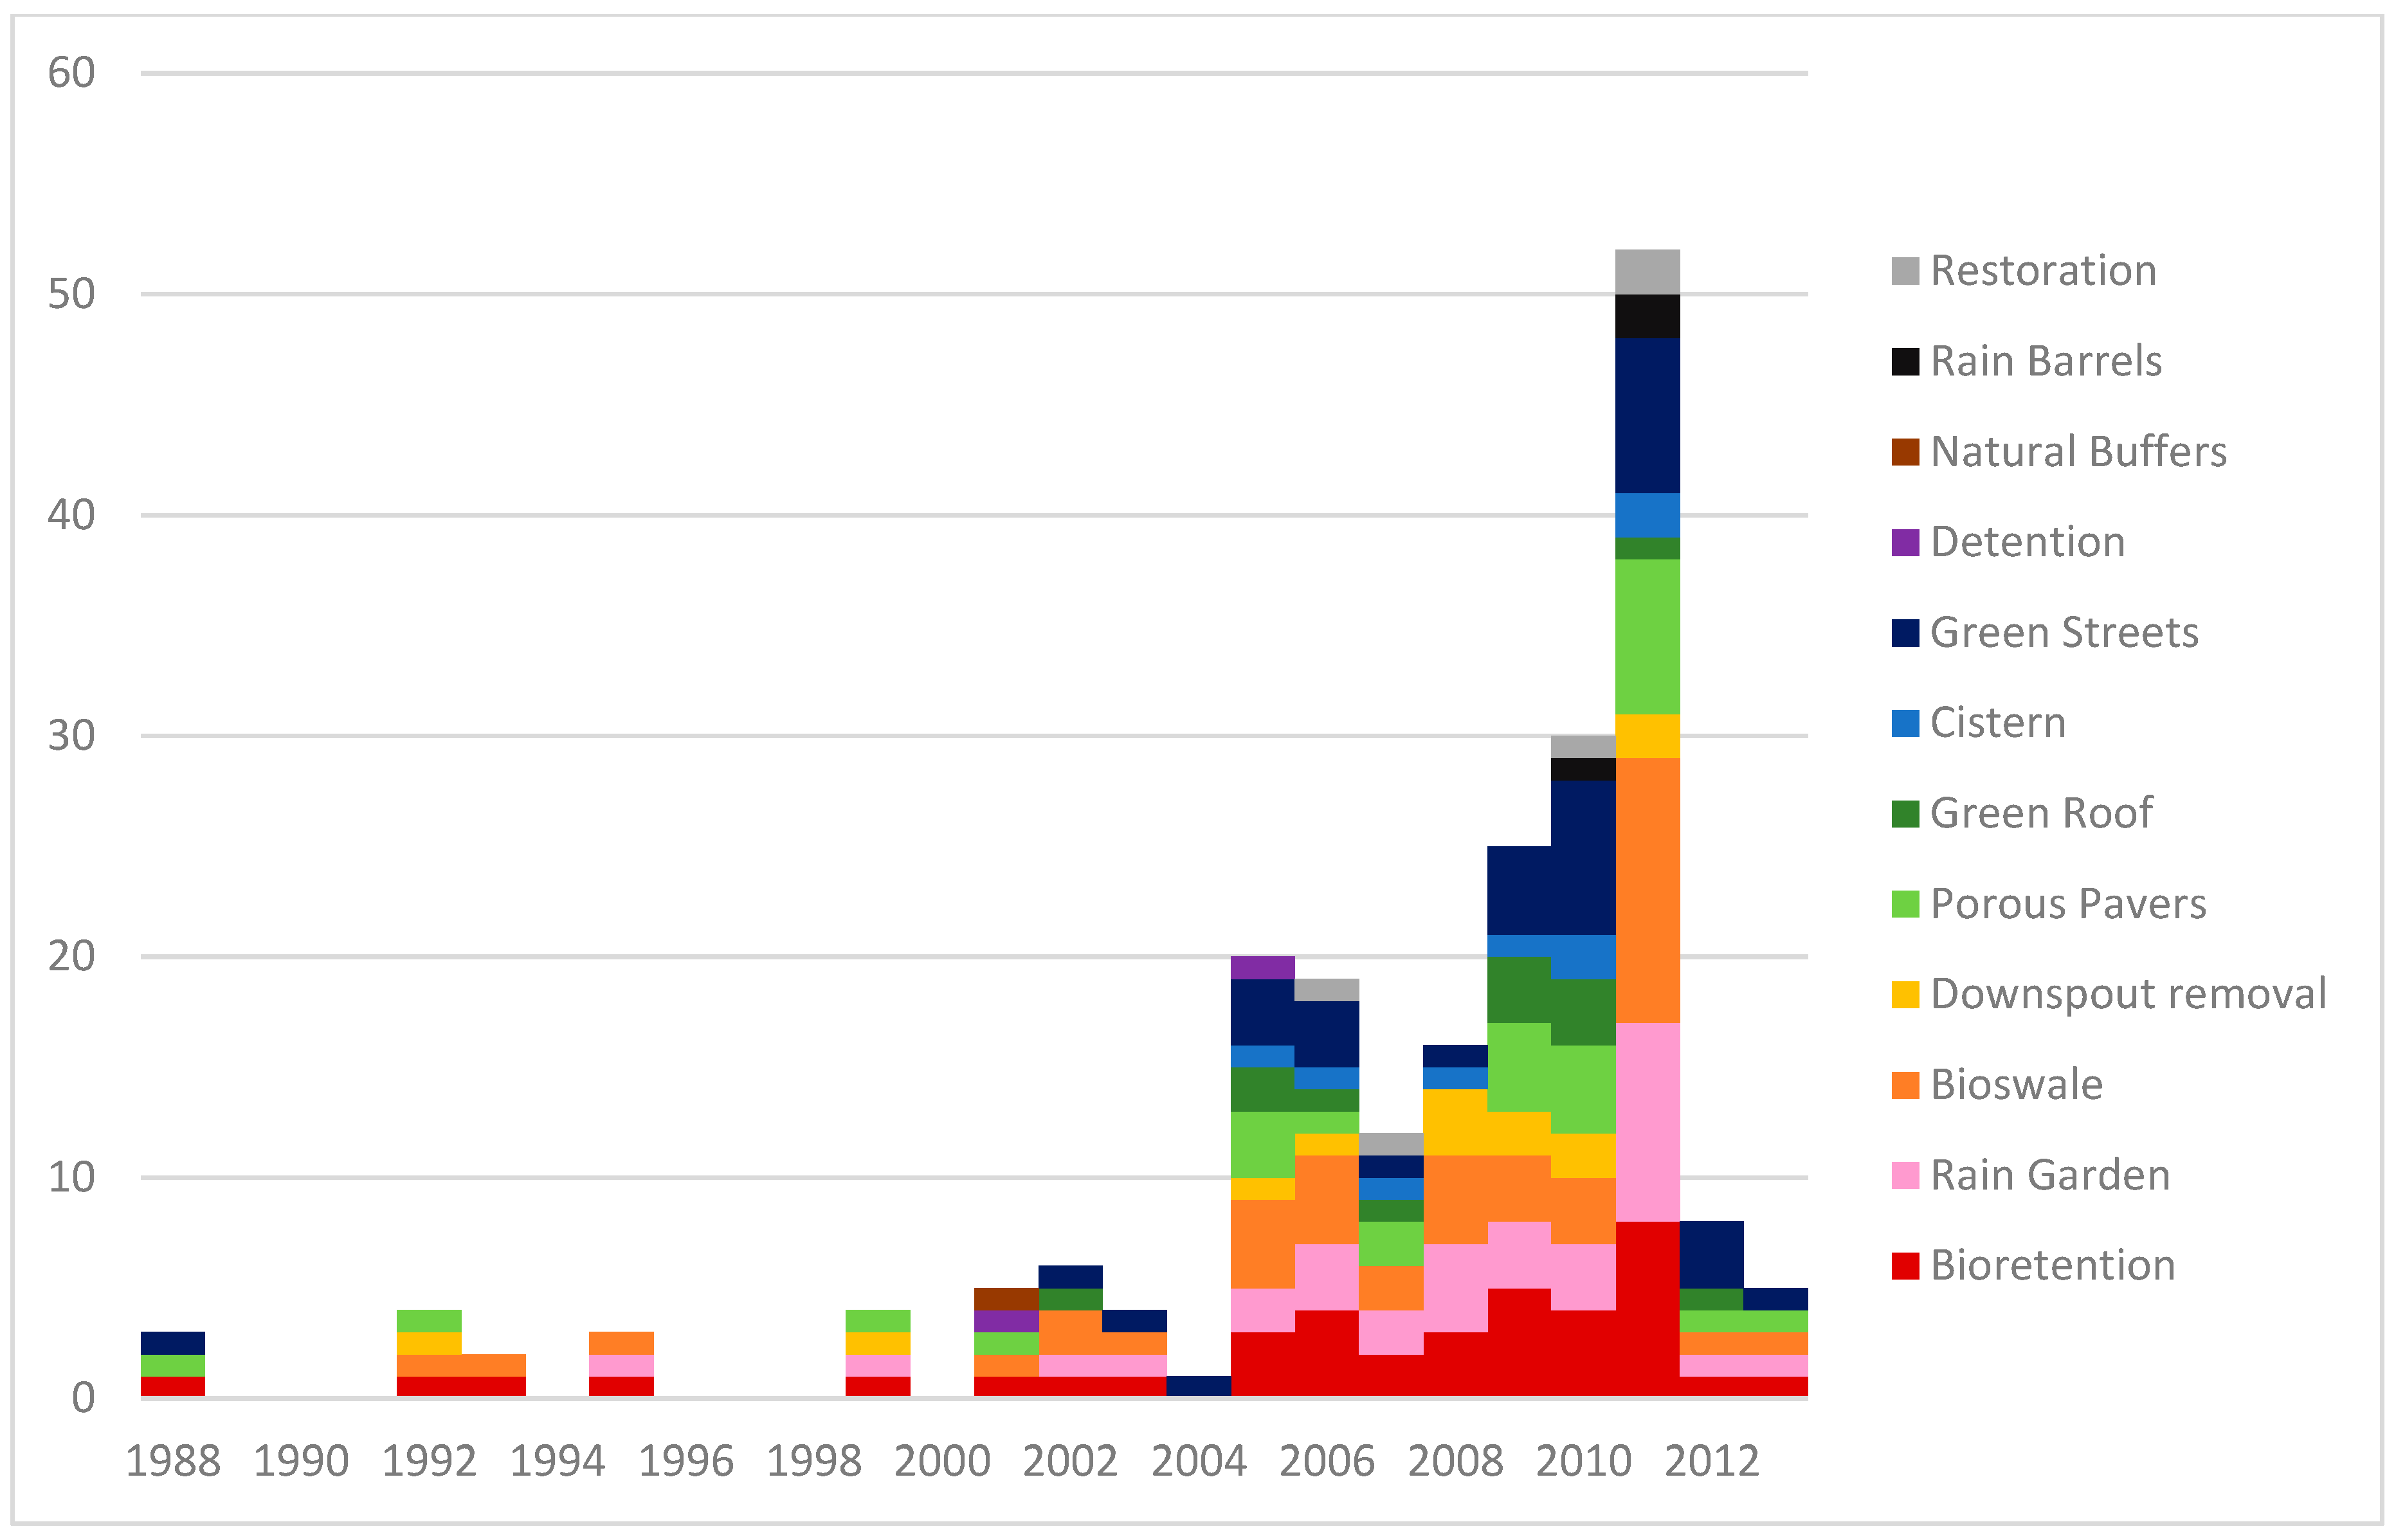
3.2.6. Research Question 6: Does the Use of Specific GI Technologies in the Convenience Sample Change over Time, Potentially Affecting the Kind of GI Financing Used over Time?
For the cases that reported year completed, it seems like the number of technologies used increased over time (at least for the technologies defined by the dataset). The most used technologies, bioswales, rain gardens, bioretention, and porous pavements, have been consistently used and popular over time. Perhaps as GI is more widely adopted, projects will continue to increase the number of techniques used as communities are more willing to experiment and the popularity of existing techniques will also expand as more technologies demonstrate their effectiveness, which in turn is likely to draw more funding and at least the need for funding. Figure 5 exemplifies the use of different GI techniques over time in just the convenience dataset. Other studies have identified this trend as well, for example, in a three-city comparison involving Portland, Baltimore, and Phoenix [9].
4. Discussion
GI has become a popular approach for water management to achieve both mitigation and adaptation relating to climate change concerns—such as sea level rise, increased precipitation, and heat—as well as providing other environmental co-benefits, such as improved air quality and increased green space. The expansion of GI to meet these goals will require accessible and affordable financial tools that are stable, flexible, and financially sustainable. Interest in financing GI has been increasing, as noted earlier in the paper, so a critical next step is to better understand how GI is used and financed.
This paper begins to evaluate characteristics of GI financing by analyzing a single, but large database of GI projects across the U.S. from ASLA. Important findings from this convenience sample indicate that GI projects were more popular in certain states, some financial tools and GI technologies tended to be more commonly used than others, and there were no clear relationships between a project’s GI type, size, and cost characteristics and the financial tools used. This research sets the stage for a more expanded analysis of whether these patterns hold for a representative sample of GI projects, why certain financial tools and GI technologies may be used more than others, whether it is worthwhile to expand the types of GI technologies currently being used, and whether to broaden the use of financial tools to support them. Moreover, the set of GI technologies that were used more commonly seemed to be in the general categories of land use and street design, rather than focused on buildings or private property. This could have implications for types of funding tools used. Other contexts are important as well that were not available in the dataset such as the type of institutional conditions in the form of urban planning and land development that could have influenced both the application of GI and its funding [3,6]. Much of the attention in analyzing this particular dataset was on the costs and financing of the development or construction of GI. The support of GI financing of long-term operation and maintenance costs requires critical attention as well [3].
The methodology used here is transferrable across datasets and different areas allowing additional cases studies to be analyzed in a consistent way. Decision-makers evaluating options to finance their GI projects can draw upon these relationships to inform their decisions to obtain sufficient and affordable financing.
5. Conclusions
GI continues to be an important option for stormwater management and other co-benefits as indicated earlier. There is much to be understood and accomplished to bring about viable financial support for GI. This article has contributed to moving this area of inquiry forward by identifying and analyzing what the financing experience has been for a relatively large set of GI projects, and what financing types are related to the types of GI the projects use. Although it is not a representative set of GI projects, it contributes to an understanding of the use of GI financing tools and provides some significant characteristics that are important to evaluate should a larger data set of GI projects become available.
GI is unusual in the diversity of meanings or definitions applied to any given GI term, the decentralized nature of many of the technologies, the variety of settings in which GI arises and is used, and the many different kinds of sponsors and supporters. This analysis showed that like other studies, the national ASLA database revealed a diversity of types of GI [9] and financial tools, yet the full range of possible GI types and financing tools were not used. In part, this potentially is a function of how new the technology is and the flexibility users have to combine technologies. This is not necessarily a disadvantage, but rather it reflects flexibility and the ability to adapt to specific conditions and circumstances. The greater use of one type of financial tool, grants, in the convenience sample probably reflects the reliance of newer approaches to environmental management (given their initial uncertainties) on more common funding not requiring reimbursements. Afterwards when the approaches become more reliable, stable, and well-known, funding mechanisms are more likely to draw upon those that can support pay-back mechanisms.
Given the diversity of GI types and financial tools, it is important to understand the context in which GI arises. A number of researchers have recognized, for example, that urban planning and urban development processes are an important context that needs to provide and support [6,45,46] for GI and could influence the availability and choice of financial resources. One aspect of institutional context is stakeholder involvement as a factor in supporting financial tools to expand the use of GI. Support is needed to bring about the financial resources. How to handle stakeholder involvement and engagement is very challenging in a setting in which the objectives and the benefits of a given technology are very diversified.
GI funding options and opportunities increase where synergies are created with other infrastructures and the co-benefits they potentially offer. This is important for avoiding conflict and the perception of competition for funding among different kinds of infrastructure. The gray–green connectivity is one such area of connectivity [9,15]. At the outset of this paper, the premise was put forth that financial support for GI was necessary just as it has been for other infrastructures. The debate about infrastructure in general centers around investment needs. Data was not available on how these GIs connected to conventional infrastructure for storm water management, and where one stops and the other begins. This can make financing difficult where it is tailored to particular technologies. Much research on the co-benefits of GI could be brought to bear upon the support for GI, while not diffusing one of its basic purposes, that of water management. The robustness of GI in supporting a wide range of climate-related conditions will affect the attractiveness of funding options. In fact, GI financing options can draw upon other financial tools being used, for example, to finance resilience in connection with climate change [48,49].
Two aspects of green infrastructure that touch on methodological considerations could provide a good foundation for the financing issue: spatial and temporal characteristics of GI projects. Given that the database was drawn from a convenience sample several research questions could not easily be explored as representative of GI and guiding finance. Geography is an important beginning in understanding what financial tools are available that may be specific to a given political jurisdiction. The temporal dimension, likewise given only brief attention in this research, provides insights into how financial tools have evolved over time. In addition to being a convenience sample, several other limitations in the database arose in connection with time period. First, time was only reported for about a fifth of the projects in the dataset, unlike other datasets where date was available for the majority of the sites [9]. Second, time had various interpretations and it was not usually specified what the reference for time was, for example, construction vs. completion. These issues have to be resolved in order to apply time period more widely.
The categorization of GI is an important need to begin to think about financial tools and their effectiveness, however, such tools might not be sensitive to type of GI being funded as long as it performs effectively. The discussion of this variation considers many factors such as what function is being emphasized and the rapidity with which GI technology has emerged.
Historical analyses that include the emergence and selection of a financial tool has indicated a lot of variation in what influences the use of financial tools. McPhillips and Matsler [9] (p. 4, 7, 8) have suggested regulatory, administrative, and organizational drivers as well as combined sewer overflow construction where they exist as a driver, though federal regulations are considered less important at least in their study. Other potential drivers may simply be opportunistic. Sustaining GIs has been influenced by financial conditions and resources, e.g., as McPhillips and Masler [9] (p. 7) indicate the recession diminished SCM development. Others have similarly emphasized the complex factors that contribute to GI implementation [3,6] though they do not directly touch on finance, the implications are clear.
Costs in this database, as indicated earlier, explicitly or implicitly pertain to construction costs or capital costs rather than operations and maintenance. In other studies, costs are considered to be associated with new development, however retrofits are also possibly included [9]. The sensitivity of both relative costs and the feasibility of financial arrangements to different GI types is a key direction for future research.
A data repository for GI projects and GI financial tools is important and would go a long way to support the transferability of knowledge about and experience with GI, including financing characteristics. This would enable analyses to move from non-representative to more representative data sets for GI. This is challenging of course given the wide variety of settings in which GI occurs. More precise databases would help identify the temporal dimension in which different financing tools emerge as indicated above. Time periods can then be linked to political stages and the availability of public funds. One could examine for example whether as public funds become less available, private funds take over as an important funding mechanism. Also, one could link this to practices globally [45] (p.754). As indicated earlier, a database that includes the details that characterize GI financing including the conditions and who the investors are that would be attracted to GI goals, would go a long way in providing financial decision makers with the means to financially support GI.
Thus, the analysis of GI presented here for a convenience sample of GI projects potentially sets the stage for a broader examination of GI and how financial resources can be used to strengthen its application to achieve important water management and other functions. In conclusion, there are many ways the financial base for GI can potentially be strengthened so that it can confront some of the financing obstacles infrastructure in general has faced. Some examples are increasing the number and flexibility of resources to adapt to a wide range of types and settings for GI, acknowledging the institutional context including planning and development processes so they can reinforce rather than conflict with GI needs, and clarifying and expanding the kinds of costs GI financial resources can cover.
Author Contributions
R.Z. provided the overall supervision and direction for the paper, data analysis and interpretation, and provided the writing for the original draft and final manuscript preparation. R.Z. obtained the funding and supervised the research for the paper. R.B. refined and expanded databases in coordination with R.Z. and provided the formal analysis and visualization for the paper as a researcher from 2018–2019. J.L.A. provided an early review of financial mechanisms and began assembling the initial databases under Zimmerman’s direction as a graduate student researcher in 2016–2017.
Funding
This research received external funding from the National Science Foundation (grant number 1444755) through a subcontract to New York University from Arizona State University and from the U.S. Department of Homeland Security to New York University from the University of Illinois (Champaign-Urbana) Critical Infrastructure Resilience Institute.
Acknowledgments
The authors acknowledge the following grants for financial support: The grant titled, “Urban Resilience to Extreme Weather Related Events Sustainability Research Network (UREx SRN)”, funded by the National Science Foundation (1444755) through Arizona State University; and the grant titled, “Dynamic Resiliency Modeling and Planning for Interdependent Critical Infrastructures”, from the Critical Infrastructure Resilience Institute, U. of Illinois, Urbana-Champaign, Homeland Security Center of Excellence, U.S. Department of Homeland Security. http://ciri.illinois.edu/research/dynamic-resiliency-modeling-and-planning-interdependent-critical-infrastructure. The authors gratefully acknowledge the ASLA for their case database used for the research. Disclaimer: Any opinions, findings, conclusions or recommendations expressed in this paper do not necessarily reflect the views of the sponsors or the sources of the data used.
Conflicts of Interest
The authors declare no conflict of interest. The funders had no role in the design of the study; in the collection, analyses, or interpretation of data; in the writing of the manuscript; or in the decision to publish the results.
Appendix A

Table A1.
Examples and summary of financial tools GIF financial tools summary. All information is drawn from [22,35,38].
| Financial Tool | Entity | Illustrative Examples |
|---|---|---|
| Grants | U.S. Environmental Protection Agency (EPA) |
|
| U.S. Housing and Urban Development (HUD) |
| |
| U.S. Department of Homeland Security (DHS) |
| |
| U.S. Department of Agriculture | Various for water and forestry support, providing guidance and participating in collaborations | |
| U.S. Department of Energy |
| |
| U.S. Department of Transportation (DOT) |
| |
| U.S. Department of the Treasury | New Markets Tax Credit program | |
| U.S. Department of Interior | Rivers, Trails and Conservation Assistance Program (in-kind assistance) | |
| U.S. Department of Commerce | Economic Development Administration programs (EDAP) NOAA Community Based Restoration Program (CBRP) | |
| U.S. Department of Defense | GI on U.S. military bases; providing guidance and training | |
| State and Local Governments | Special State Grant Programs | |
| State Water Resources Control Board | Stormwater Grant Program (SWGP) | |
| Loans and Loan Guarantees | U.S. EPA | State Revolving Funds |
| U.S. HUD | Section 108 Loan Guarantee Program | |
| U.S. Department of Commerce (DOC) | EDAP | |
| State and Local Governments Infrastructure Banks/Green Banks | State Revolving Funds | |
| Bonds | Governments, Corporations, Financial Institutions; Infrastructure Banks/Green Banks |
|
| Taxation | Governments, Special Districts |
|
| Financial Incentives | Governments, Special Purpose Authorities |
|
| Fees | Governments, Special Purpose Authorities |
|
| Special Purpose Funds | Governments, Private Entities | Disaster Funds |
| Other | Insurance Companies | Insurance |
| Philanthropies Foundations Charitable Trusts Etc. | Numerous | |
| Combinations | Public–Private Partnerships (P3) |
References
- Zimmerman, R.; Grimm, N.B.; Brawley-Chesworth, A. Planning robust 21st century US urban infrastructure: Socially driven transitions from pre-industrial, carbon-intensive and carbon-sensitive infrastructure, Chapter 14. In U.S. Infrastructure: Challenges and Directions for the 21st Century; Khan, A., Becker, K., Eds.; Routledge: London, UK, forthcoming.
- Beatley, T. Green Cities of Europe; Island Press: Washington, DC, USA, 2012. [Google Scholar]
- Lindholm, G. The implementation of green infrastructure: Relating a general concept to context and site. Sustainability 2017, 9, 610. [Google Scholar] [CrossRef]
- Walsh, J.; Wuebbles, D.; Hayhoe, K.; Kossin, J.; Kunkel, K.; Stephens, G.; Thorne, P.; Vose, R.; Wehner, M.; Willis, J.; et al. Chapter 2: Our Changing Climate. In Climate Change Impacts in the United States: The Third National Climate Assessment; Melillo, J.M., Richmond, T.C., Yohe, G.W., Eds.; U.S. Global Change Research Program: Washington, DC, USA, 2014; pp. 19–67. [Google Scholar] [CrossRef]
- U.S. Global Change Research Program. Impacts, Risks, and Adaptation in the United States: Fourth National Climate Assessment, Volume II; Reidmiller, D.R., Avery, C.W., Easterling, D.R., Kunkel, K.E., Lewis, K.L.M., Maycock, T.K., Stewart, B.C., Eds.; U.S. Global Change Research Program: Washington, DC, USA, 2018; 1515p. [CrossRef]
- Hansen, R. Multifunctionality as a Principle for Urban Green Infrastructure Planning—Theory, Application and Linkages to Ecosystem Services. Ph.D. Thesis, Munich Technical University, Munich, German, 30 October 2017. [Google Scholar]
- Hansen, R.; Pauleit, S. From multifunctionality to multiple ecosystem services? A conceptual framework for multifunctionality in green infrastructure planning for urban areas. AMBIO A J. Hum. Environ. 2014, 43, 516–529. [Google Scholar] [CrossRef] [PubMed]
- Mell, I.C. Green infrastructure: Reflections on past, present and future praxis. Landsc. Res. 2017, 42, 135–145. [Google Scholar] [CrossRef]
- McPhillips, L.E.; Matsler, M.A. Temporal evolution of green stormwater infrastructure strategies in three U.S. cities. Front. Built Environ. 2018, 4. [Google Scholar] [CrossRef]
- Heusinger, J.; Weber, S. Surface energy balance of an extensive green roof as quantified by full year eddy-covariance measurements. Sci. Total Environ. 2017, 577, 220–230. [Google Scholar] [CrossRef] [PubMed]
- Oberndorfer, E.; Lundholm, J.; Bass, B.; Coffman, R.R.; Doshi, H.; Dunnett, N.; Gaffin, S.; Köhler, M.; Liu, K.K.; Rowe, B. Green roofs as urban ecosystems: Ecological structures, functions, and services. BioScience 2007, 57, 823–833. [Google Scholar] [CrossRef]
- World Resources Institute. Creating Value through Ecosystem Service Management in Urban and Suburban Landscapes; World Resources Institute: Washington, DC, USA, 2013; Available online: http://www.wri.org/sites/default/files/creating_value_through_ecosystem_service_management_in_urban_and_suburban_landscapes_0.pdf (accessed on 25 January 2019).
- Schwarz, N.; Moretti, M.; Bugalho, M.N.; Davies, Z.G.; Haase, D.; Hack, J.; Hof, A.; Melero, Y.; Pett, T.J.; Knapp, S. Understanding biodiversity-ecosystem service relationships in urban areas: A comprehensive literature review. Ecosyst. Serv. 2017, 27, 161–171. [Google Scholar] [CrossRef]
- Wang, J.; Banzha, E. Towards a better understanding of green infrastructure: A critical review. Ecol. Indic. 2018, 85, 758–772. [Google Scholar] [CrossRef]
- Bell, C.D.; Stokes-Draut, J.; McCray, J.E. Decision making on the gray-green stormwater infrastructure continuum. J. Sustain. Water Built Environ. 2018, 5, 1. [Google Scholar] [CrossRef]
- Zimmerman, R.; Zhu, Q.; de Leon, F.; Guo, Z. Conceptual modeling framework to integrate resilient and interdependent infrastructure in extreme weather. J. Infrastruct. Syst. 2017, 23, 04017034. [Google Scholar] [CrossRef]
- Ouyang, M. Review on modeling and simulation of interdependent critical infrastructure systems. Reliab. Syst. Saf. 2014, 121, 43–60. [Google Scholar] [CrossRef]
- Merriam-Webster. Available online: https://www.merriam-webster.com/dictionary/technology (accessed on 18 February 2019).
- U.S. Environmental Protection Agency (EPA). Clean Water State Revolving Fund 10% Green Project Reserve: Guidance for Determining Project Eligibility; U.S. EPA: Washington, DC, USA, 2012. Available online: https://www.epa.gov/sites/production/files/2015-04/documents/green_project_reserve_eligibility_guidance.pdf (accessed on 25 January 2019).
- U.S. EPA. The Clean Water State Revolving Fund: Green Infrastructure—Innovative Projects and State Activities; U.S. EPA: Washington, DC, USA, June 2012. Available online: https://www.epa.gov/sites/production/files/2015-04/documents/green_infrastructure_projects_and_state_activities.pdf (accessed on 25 January 2019).
- U.S. EPA. What is Green Infrastructure; U.S. EPA: Washington, DC, USA. Available online: https://www.epa.gov/green-infrastructure/what-green-infrastructure (accessed on 25 January 2019).
- Georgetown Climate Center. Green Infrastructure Toolkit. How to Pay for Green Infrastructure: Funding and Financing; Georgetown Climate Center: Washington, DC, USA, 2016; Available online: http://www.georgetownclimate.org/adaptation/toolkits/green-infrastructure-toolkit/introduction.html (accessed on 25 January 2019).
- Benedict, M.A.; McMahon, E. Green Infrastructure: Smart Conservation for the 21st Century; Sprawl Watch Clearinghouse: Washington, DC, USA, 2001. [Google Scholar]
- Benedict, M.A.; McMahon, E.T. Green Infrastructure: Linking landscapes and Communities; Island Press: Washington, DC, USA, 2006. [Google Scholar]
- Mell, I.C. Aligning Fragmented Planning Structures through a Green Infrastructure Approach to Urban Development in the UK and USA. Urban For. Urban Green. 2014, 13, 612–620. [Google Scholar] [CrossRef]
- NYC Environmental Protection. Green Infrastructure Performance Metrics Report; NYC Environmental Protection: New York, NY, USA, 2016. Available online: http://www.nyc.gov/html/dep/pdf/green_infrastructure/gi-performance-metrics-report-2016.pdf (accessed on 25 January 2019).
- Center for Neighborhood Technology. National Green Values™ Calculator Methodology; Center for Neighborhood Technology: Chicago, IL, USA, 30 June 2009; Available online: http://greenvalues.cnt.org/national/downloads/methodology.pdf (accessed on 25 January 2019).
- U.S. EPA. Enhancing Sustainable Communities with Green Infrastructure: A Guide to Help Communities Better Manage Stormwater While Achieving Other Environmental, Public Health, Social, and Economic Benefits; Technical Report EPA 100-R-14-006; U.S. EPA: Washington, DC, USA, 2014. Available online: https://www.in.gov/indot/files/EPA_Green_Infrastructure.pdf (accessed on 19 February 2019).
- U.S. EPA. Environmental Benefits of Clean Water State Revolving Fund Green Infrastructure Projects; U.S. EPA: Washington, DC, USA, September 2018. Available online: https://www.epa.gov/sites/production/files/2018-09/documents/srf_gpr_case_studies.pdf (accessed on 25 January 2019).
- Tarr, J.A. The evolution of the urban infrastructure in the nineteenth and twentieth centuries. In Perspectives on Urban Infrastructure; Hanson, R., Ed.; National Academy Press: Washington, DC, USA, 1984; pp. 4–66. [Google Scholar]
- Felbinger, C.L. Conditions of confusion and conflict: Rethinking the infrastructure-economic development linkage. In Building the Public City; Perry, D.C., Ed.; Sage: Thousand Oaks, CA, USA, 1995; pp. 103–137. [Google Scholar]
- Eberhard, J.P.; Bernstein, A.B. A conceptual framework for thinking about urban infrastructure. Built Environ. 1985, 10, 254–268. [Google Scholar]
- U.S. Environmental Protection Agency (EPA). Learn About the Clean Water State Revolving Fund 10% Green Project Reserve: Guidance for Determining Project Eligibility; U.S. EPA: Washington, DC, USA, 20 February 2019. Available online: https://www.epa.gov/cwsrf/learn-about-clean-water-state-revolving-fund-cwsrf#eligibilities (accessed on 6 March 2019).
- U.S. EPA. GI Policy for CWSRF; U.S. EPA: Washington, DC, USA, 6 January 2016. Available online: https://www.epa.gov/sites/production/files/2016-01/documents/cwsrf_green_infrastructure_policy_final.pdf (accessed on 25 January 2019).
- U.S. EPA. Federal Agency Support for the Green Infrastructure Collaborative; U.S. EPA: Washington, DC, USA, 6 July 2014; (Amended 8 October 2014). Available online: https://www.epa.gov/sites/production/files/2015-10/documents/federal-support-for-green-infrastructure-collaborative_508.pdf (accessed on 18 February 2019).
- U.S. EPA. City Green: Innovative Green Infrastructure Solutions for Downtowns and Infill Locations; U.S. EPA: Washington, DC, USA, 2016. Available online: https://www.epa.gov/sites/production/files/2016-06/documents/city_green_0.pdf (accessed on 25 January 2019).
- U.S. Congress. Water Infrastructure Improvement Act (H.R. 7279), P.L. 115-436; U.S. Congress: Washington, DC, USA, 14 January 2019.
- U.S. EPA. Water Infrastructure and Resiliency Finance Center. Federal and State Funding Programs—Stormwater & Green Infrastructure Projects; U.S. EPA: Washington, DC, USA, April 2017. Available online: https://www.epa.gov/sites/production/files/2017-05/documents/federal-and-california-sw-funding-programs_0.pdf (accessed on 25 January 2019).
- NYC Office of the Comptroller. A Green Bond Program for New York City; NYC Comptroller: New York, NY, USA, April 2015. Available online: https://comptroller.nyc.gov/wp-content/uploads/documents/Green_Bond_Program_Update.pdf (accessed on 25 January 2019).
- Moody’s Investors Service. Environmental Risks—Sovereigns How Moody’s Assesses the Physical Effects of Climate Change on Sovereign Issuers. 6 November 2016. Available online: https://www.eticanews.it/wp-content/uploads/2017/01/Moodys-climate-change-and-sovereigns-November-7.pdf (accessed on 25 January 2019).
- Moody’s Investors Service. Environmental Risks—Evaluating the Impact of Climate Change on US State and Local Issuers. 28 November 2017. Available online: http://www.southeastfloridaclimatecompact.org/wp-content/uploads/2017/12/Evaluating-the-impact-of-climate-change-on-US-state-and-local-issuers-11-28-17.pdf (accessed on 25 January 2019).
- Moody’s Investors Service. Climate Change & Sovereign Risk Credit. 2016. Available online: https://www.moodys.com/sites/products/ProductAttachments/Climate_trends_infographic_moodys.pdf (accessed on 25 January 2019).
- Center for Urban Innovation. Smart Cities Financing Guide: Expert Analysis of 28 Municipal Finance Tools for City Leaders Investing in the Future; Arizona State University: Tempe, AZ, USA, 2014. [Google Scholar]
- U.S. EPA. Getting to Green: Paying for Green Infrastructure Financing Options and Resources for Local Decision-Makers; Technical Report EPA 842-R-14-005; U.S. Environmental Protection Agency: Washington, DC, USA, 2014. Available online: https://www.epa.gov/sites/production/files/2015-02/documents/gi_financing_options_12-2014_4.pdf (accessed on 25 January 2019).
- Mell, I.C. Financing the future of green infrastructure planning: Alternatives and opportunities in the UK. Landsc. Res. 2018, 43, 751–768. [Google Scholar] [CrossRef]
- Mell, I.C. Establishing the costs of poor green space management: Mistrust, financing & future development options in the UK. People Place Policy 2018, 12, 137–157. [Google Scholar] [CrossRef]
- American Society of Landscape Architects (ASLA). Stormwater Case Studies by State; ASLA: Washington, DC, USA; Available online: https://www.asla.org/stormwatercasestudies.aspx (accessed on 25 January 2019).
- Coffee, J. Money for Resilient Infrastructure: How to Finance America’s Climate Changed Future. Available online: https://www.amazon.com/Money-Resilient-Infrastructure-Finance-Americas-ebook/dp/B07LG3QCK2 (accessed on 28 February 2019).
- Climate Policy Initiative. Undated Website. Available online: https://climatepolicyinitiative.org/ (accessed on 28 February 2019).
Figure 1.
Distribution by state of total projects (top) and total cost (bottom) represented in the ASLA convenience dataset. Note: This concentration of projects may not represent the actual concentration of GI investment and instead reflect the concentration of ASLA membership or awareness of projects.

Figure 2.
Cost per square foot for different GI technologies. Note: The figure on the left represents the full dataset, including all of the outliers, while the figure on the right limits the x-axis to show the majority of the cases. The boxes represent the interquartile range (IQR), the bars within the boxes represent the median, the points marked with an “×” represent the mean, and the dots are the outliers defined as 1.5 times the IQR in either direction.

Figure 3.
Total project cost by financial tool used to finance the project. Note: Only 102 cases (about 23%) provided information on the specific tools used. Projects often included more than one financial tool but did not specify the breakdown of how much funding came from each tool; this distribution represents the total cost of each project that used the given financial tool for at least a portion of the financing. The boxes represent the interquartile range (IQR), the bars within the boxes represent the median, the points marked with an “×” represent the mean, and the dots are the outliers defined as 1.5 times the IQR in either direction.

Figure 4.
Total cost (top) and number of projects (bottom) by completion year (1988–2013). Note: Only 74 cases (about 17%) provided a completion year. This concentration of projects may not represent the actual concentration of GI investment and instead reflect the concentration of ASLA awareness of projects.

Figure 5.
GI technology use by year (1988–2013).

Table 1.
Parameter list from the ASLA convenience dataset.
| General Category | Description |
|---|---|
| Project Name | Name as given by project managers |
| Location | Address |
| City | |
| State | |
| Date | Date completed |
| Financial Source | Public |
| Private | |
| Mixed | |
| Financial Tool | Grants |
| Loans | |
| Bonds | |
| User Fees | |
| Tax Exemptions | |
| Donations | |
| Developer Support | |
| GI Technology | Bioretention |
| Rain Garden | |
| Bioswale | |
| Downspout Removal | |
| Porous Pavers | |
| Green Roofs | |
| Cistern | |
| Green Streets | |
| Street Trees | |
| Detention | |
| Natural Buffers | |
| Rain Barrels | |
| Restoration | |
| Project Size | Capture Area (Square feet) |
| Cost (construction or capital cost) | Total Cost Over Time (actual dollars) |
Table 2.
Distribution of financial tools by financial source.
| Grant | Bond | Loan | Tax | User Fee | Donation | Developer | |
| Public | 61 | 8 | 3 | 20 | 2 | 0 | 0 |
| Private | 0 | 0 | 0 | 0 | 0 | 8 | 1 |
| Mixed | 7 | 0 | 1 | 0 | 0 | 13 | 0 |
| Grant | Bond | Loan | Tax | User Fee | Donation | Developer | |
| Public | 64.9% | 8.5% | 3.2% | 21.3% | 2.1% | 0.0% | 0.0% |
| Private | 0.0% | 0.0% | 0.0% | 0.0% | 0.0% | 88.9% | 11.1% |
| Mixed | 33.3% | 0.0% | 4.8% | 0.0% | 0.0% | 61.9% | 0.0% |
| Grant | Bond | Loan | Tax | User Fee | Donation | Developer | |
| Public | 89.7% | 100.0% | 75.0% | 100.0% | 100.0% | 0.0% | 0.0% |
| Private | 0.0% | 0.0% | 0.0% | 0.0% | 0.0% | 38.1% | 100.0% |
| Mixed | 10.3% | 0.0% | 25.0% | 0.0% | 0.0% | 61.9% | 0.0% |
Note: Projects were categorized as only public, private, or mixed, so the columns sum to 100% of projects using that financial tool. However, projects used multiple tools, so the rows do not sum to 100%.
Table 3.
Descriptive statistics for the major parameters in the ASLA convenience dataset.
| Size (Square Feet) | Cost (Dollars) | No. of GI Technologies | No. of Financial Tools | |
|---|---|---|---|---|
| Number of Cases Reporting Variable | 444 | 444 | 444 | 102 |
| Mean | 143,528 | 1,901,671 | 2.98 | 1.21 |
| Std Deviation | 632,798 | 8,450,123 | 1.75 | 0.45 |
| Minimum | 1,300 | 3,000 | 0 | 1 |
| 25th Percentile | 24,280 | 75,000 | 2 | 1 |
| 50th Percentile | 130,680 | 300,000 | 3 | 1 |
| 75th Percentile | 130,680 | 2,081,250 | 4 | 1 |
| Maximum | 13,068,000 | 122,000,000 | 8 | 3 |
| Median | 130,680 | 300,000 | 3 | 1 |
| Sum | 63,681,892 | 844,341,748 | N/A | N/A |
Note: Values given are only for the cases for which data for the particular variable was reported. Cost pertains to construction or capital costs.
Table 4.
Size of green infrastructure project versus number of financial tools.
| Multiple R | 0.276030884 | |||||
| R Square | 0.076193049 | |||||
| Adjusted R Square | 0.06695498 | |||||
| Standard Error | 0.437047678 | |||||
| Observations | 102 | |||||
| Coefficients | Std. Error | t Stat | p-value | Upper 95% | Lower 95% | |
| Intercept | 1.12858426 | 0.050961705 | 22.14573 | 2.40845E-40 | 1.229690831 | 1.02747769 |
| Size | 0.00000058 | 0.000000202 | 2.871885 | 0.004982028 | 0.000000983 | 0.00000018 |
Table 5.
Cost of green infrastructure project versus the number of financial tools.
| Multiple R | 0.251079297 | |||||
| R Square | 0.063040813 | |||||
| Adjusted R Square | 0.053671222 | |||||
| Standard Error | 0.440147805 | |||||
| Observations | 102 | |||||
| Coefficients | Std. Error | t Stat | p-value | Upper 95% | Lower 95% | |
| Intercept | 1.136228245 | 0.050961705 | 22.19632 | 1.99173E-40 | 1.237787617 | 1.034668874 |
| Cost | 0.000000054 | 0.000000021 | 2.593884 | 0.010914065 | 0.000000013 | 0.000000095 |
© 2019 by the authors. Licensee MDPI, Basel, Switzerland. This article is an open access article distributed under the terms and conditions of the Creative Commons Attribution (CC BY) license (http://creativecommons.org/licenses/by/4.0/).
Share and Cite
MDPI and ACS Style
Zimmerman, R.; Brenner, R.; Llopis Abella, J. Green Infrastructure Financing as an Imperative to Achieve Green Goals. Climate 2019, 7, 39. https://0-doi-org.brum.beds.ac.uk/10.3390/cli7030039
AMA Style
Zimmerman R, Brenner R, Llopis Abella J. Green Infrastructure Financing as an Imperative to Achieve Green Goals. Climate. 2019; 7(3):39. https://0-doi-org.brum.beds.ac.uk/10.3390/cli7030039
Chicago/Turabian StyleZimmerman, Rae, Ryan Brenner, and Jimena Llopis Abella. 2019. "Green Infrastructure Financing as an Imperative to Achieve Green Goals" Climate 7, no. 3: 39. https://0-doi-org.brum.beds.ac.uk/10.3390/cli7030039
Note that from the first issue of 2016, this journal uses article numbers instead of page numbers. See further details here.