Impact of Climate Change on Twenty-First Century Crop Yields in the U.S.


Los Alamos High School, Los Alamos, NM 87544, USA
Climate 2019, 7(3), 40; https://0-doi-org.brum.beds.ac.uk/10.3390/cli7030040
Submission received: 3 February 2019
/
Revised: 8 March 2019
/
Accepted: 8 March 2019
/
Published: 14 March 2019
(This article belongs to the Special Issue Sustainable Agriculture for Climate Change Adaptation)
Abstract
:Crop yields are strongly dependent on the average climate, extreme temperatures, and carbon dioxide concentrations, all of which are projected to increase in the coming century. In this study, a statistical model was created to predict US yields to 2100 for three crops using low and high-emissions future scenarios (RCP 4.5 and 8.5). The model is based on linear regressions between historical crop yields and daily weather observations since 1970 for every county in the US. Yields were found to be most strongly dependent on heat waves, summer average temperatures, and killing degree days; these relationships were hence used to predict future yields. The model shows that warming temperatures will significantly decrease corn and soybean yields, but will not have as strong of an influence on rice. Before accounting for CO fertilization, crops in the high-emissions scenario are predicted to produce 77%, 85%, and 96% of their expected yield without climate change for corn, soybeans, and rice, respectively. When a simple CO fertilization factor is included, corn, a C4 plant, increases slightly, while the yields of the C3 plants (soybeans and rice) are actually predicted to increase compared to today’s yields. This study exhibits the wide range of possible impacts of climate change on crop yields in the coming century, and emphasizes the need for field research on the combined effects of CO fertilization and heat extremes.
1. Introduction
1.1. Impacts of Climate Change and the Social Cost of Carbon
On 8 October 2018, the Intergovernmental Panel on Climate Change (IPCC) released a new report titled Global Warming of 1.5 C, which concludes that drastic action must be taken to limit global temperature rise and avoid serious negative impacts. It finds that natural, managed and human systems have a high risk of permanent damage as the climate warms. Extreme weather events will occur more often, including droughts, floods, coastal storms, and heat waves, increasing mortality and property damage. As warmer temperatures combine with more extreme weather events, cereal yields will decrease [1,2]. If we fail to limit fossil fuel combustion, all of the effects will increase [3].
Also on 8 October, the Nobel Prize in Economic Science was awarded to Paul Romer and William Nordhaus for their research on using economics as a driving factor to reduce greenhouse gas emissions [4]. Nordhaus, recognized as the founder of climate change economics, developed economic models to weigh the cost of reducing carbon footprints today against future costs of current emissions [5]. Romer focused on how market factors influence technological growth. Both advocate carbon taxes to employ market forces to reduce emissions and spur innovation in energy efficiency.
The correct amount to tax carbon may be found through the social cost of carbon, or the external cost of carbon emissions. The social cost of carbon is calculated by integrating all future economic losses due to climate change discussed in the IPCC. In total, warming temperatures cause a loss of annual national average gross domestic product (GDP) of 1.0% to 3.0% at the end of the century [6]. Agriculture is a substantial portion of the economy, and crop yields are highly dependent on temperature. Other impacts are more difficult to put a price on, such as biodiversity and ecosystem loss. The currently accepted cost of carbon dioxide when considering these externalities varies between $37 and $220 per ton emitted [7].
1.2. Warming Temperatures Impact Agriculture
The United States produces 41% of the world’s corn and 38% of the world’s soybeans, two of the four largest crop sources of caloric energy [8]. These crops are thus crucial to food security, and understanding how their yields will change in the next century could help drive more informed policy decisions.
The growing world population requires a larger food supply. Historical improvements in crop yields from agricultural technology (e.g., pesticides, fertilizers, farm machinery, gene modification, and shifting of production to large corporations [9]) have kept up with increasing demand for several decades, but it is doubtful that yields will continue to grow at the same rate as they have since 1970. Population is unlikely to stop growing this century, and by 2100 there will be between 9.6 and 12.3 billion people on earth [10]. Research has shown that yields are projected to drop in coming decades due to warming temperatures and the potential emergence of virulent crop diseases [11,12].
Crop yields are strongly dependent on the weather and may be predicted from observed weather events during the growing season [13,14,15,16]. Over 60% of yield variability in global breadbaskets can be explained by climate variation [17], particularly temperature extremes during crucial phases of the growing season, such as the grain fill stages [18]. Some research suggests that yields decrease exponentially as temperatures warm [8]. Therefore, a warming climate could harm crop yields and global food security. In fact, corn and wheat yields have already decreased by 1–2% per decade since 1980 relative to the expected harvest without warming [19].
There are many different approaches to identifying the the impacts of climate change on crop yields. Statistical models, including this study, use historical correlations from observations to develop empirical relationships between yields and weather. These relationships are then applied to climate model output to predict future crop yields. Process models are based on the mechanisms of an individual plant’s physiology and then are scaled up to large domains. Each type of model has its own advantages and disadvantages. Statistical models are accurate for the specific locations and conditions of their training data sets, and are a direct way to model yields within those constraints [20,21]. Process models offer a deeper understanding of the cause and effect of the environmental impacts on yields, and they can potentially model future yields outside of historical observations. Process models have become more sophisticated in recent years [22], but still have difficulty reproducing historical yields in certain circumstances [23].
Many previous studies have analyzed the relationships between crop yields and emperature [13,24,25], precipitation [14,26,27], or radiation measurements [28,29], and have predicted future yields based on these relationships [13,26,30]. These models may be statistical [17,31], process-based [30,32], or both [33], and have focused on US [14,24,33], China [23,25,29,31,32], Europe [28,30], or global bread baskets [15,17,27]. All of these studies conclude that climate change will have a negative impact on future crop yields, and bread basket failures could pose a threat to food security.
The purpose of this study is to evaluate the future economic losses or gains of three crops through 2100 for different climate scenarios. It examines the historical relationship between crop yields and extreme weather to better understand which factors affect yields, and then projects crop yields into the future for every county in the United States. This study also incorporates CO fertilization to show the range of possible future impacts from these processes. Finally, a monetary value of changing crop yields is calculated, an integral part to the social cost of carbon.
2. Methods
A statistical model was created to evaluate historical weather and crop data, compute correlations and linear regressions for each county, and project crop yields to 2100 based on two future climate model scenarios. Annual crop yield data of corn, soybeans, and rice was obtained for every US county for 1970 through 2015 from the United States Department of Agriculture (USDA, [34]). In addition, 1970 was chosen as a start date because yields were more variable and the farming practices were not as standardized before then (e.g., irrigation, pesticides, fertilizers). Daily weather station observations, provided by the Daily Global Historical Climatology Network [35], were downloaded for all weather stations in the US with data since 1970. Daily minimum and maximum air temperature and precipitation were computed for each county from the average of the two weather stations closest to the center of that county. This provided redundancy—if one station was missing data, the other station’s data was used.
Next, various means and extremes were computed for each county and year. Most of these are standard measures reported by the Intergovernmental Panel on Climate Change (IPCC, [36], Box 2.4 p. 221). Table 1 lists all extremes computed from the daily temperature. Values of the 10th and 90th percentile for each variable and county were computed from the daily data from the years 1970 to 1990. The extreme measures were computed over the growing season, which varies for each crop and state, and were obtained from the USDA [37].
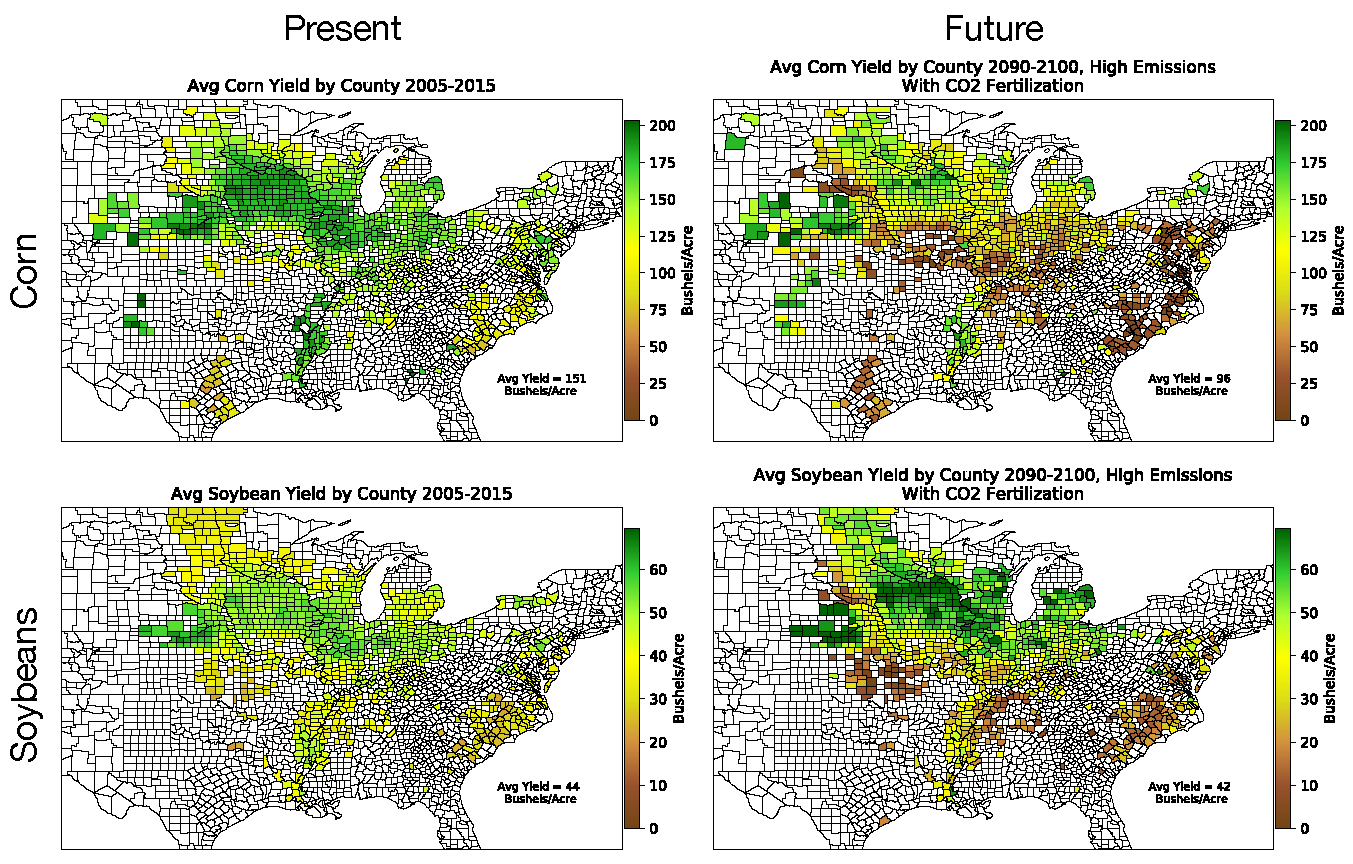
Correlations between the detrended crop yield and each of the weather statistics were then computed for each county and crop. In order to account for increasing crop yields due to improvements in agricultural technology, the yields were first detrended for each county. Figure 1a shows the increase in corn yields since 1970 in an example county of Champaign, Illinois, and Figure 1b shows the correlation between the detrended corn yield and summer average temperature for that same county. Correlations with a p-value less than 0.05 are considered significant and ones under 0.01 are highly significant [38]. The three with the highest correlations were summer average temperature, heat waves, and killing degree days. Thus, these three statistics were used to predict future yields. Although regressions were also computed with precipitation, it was found to have little to no correlations with yields.
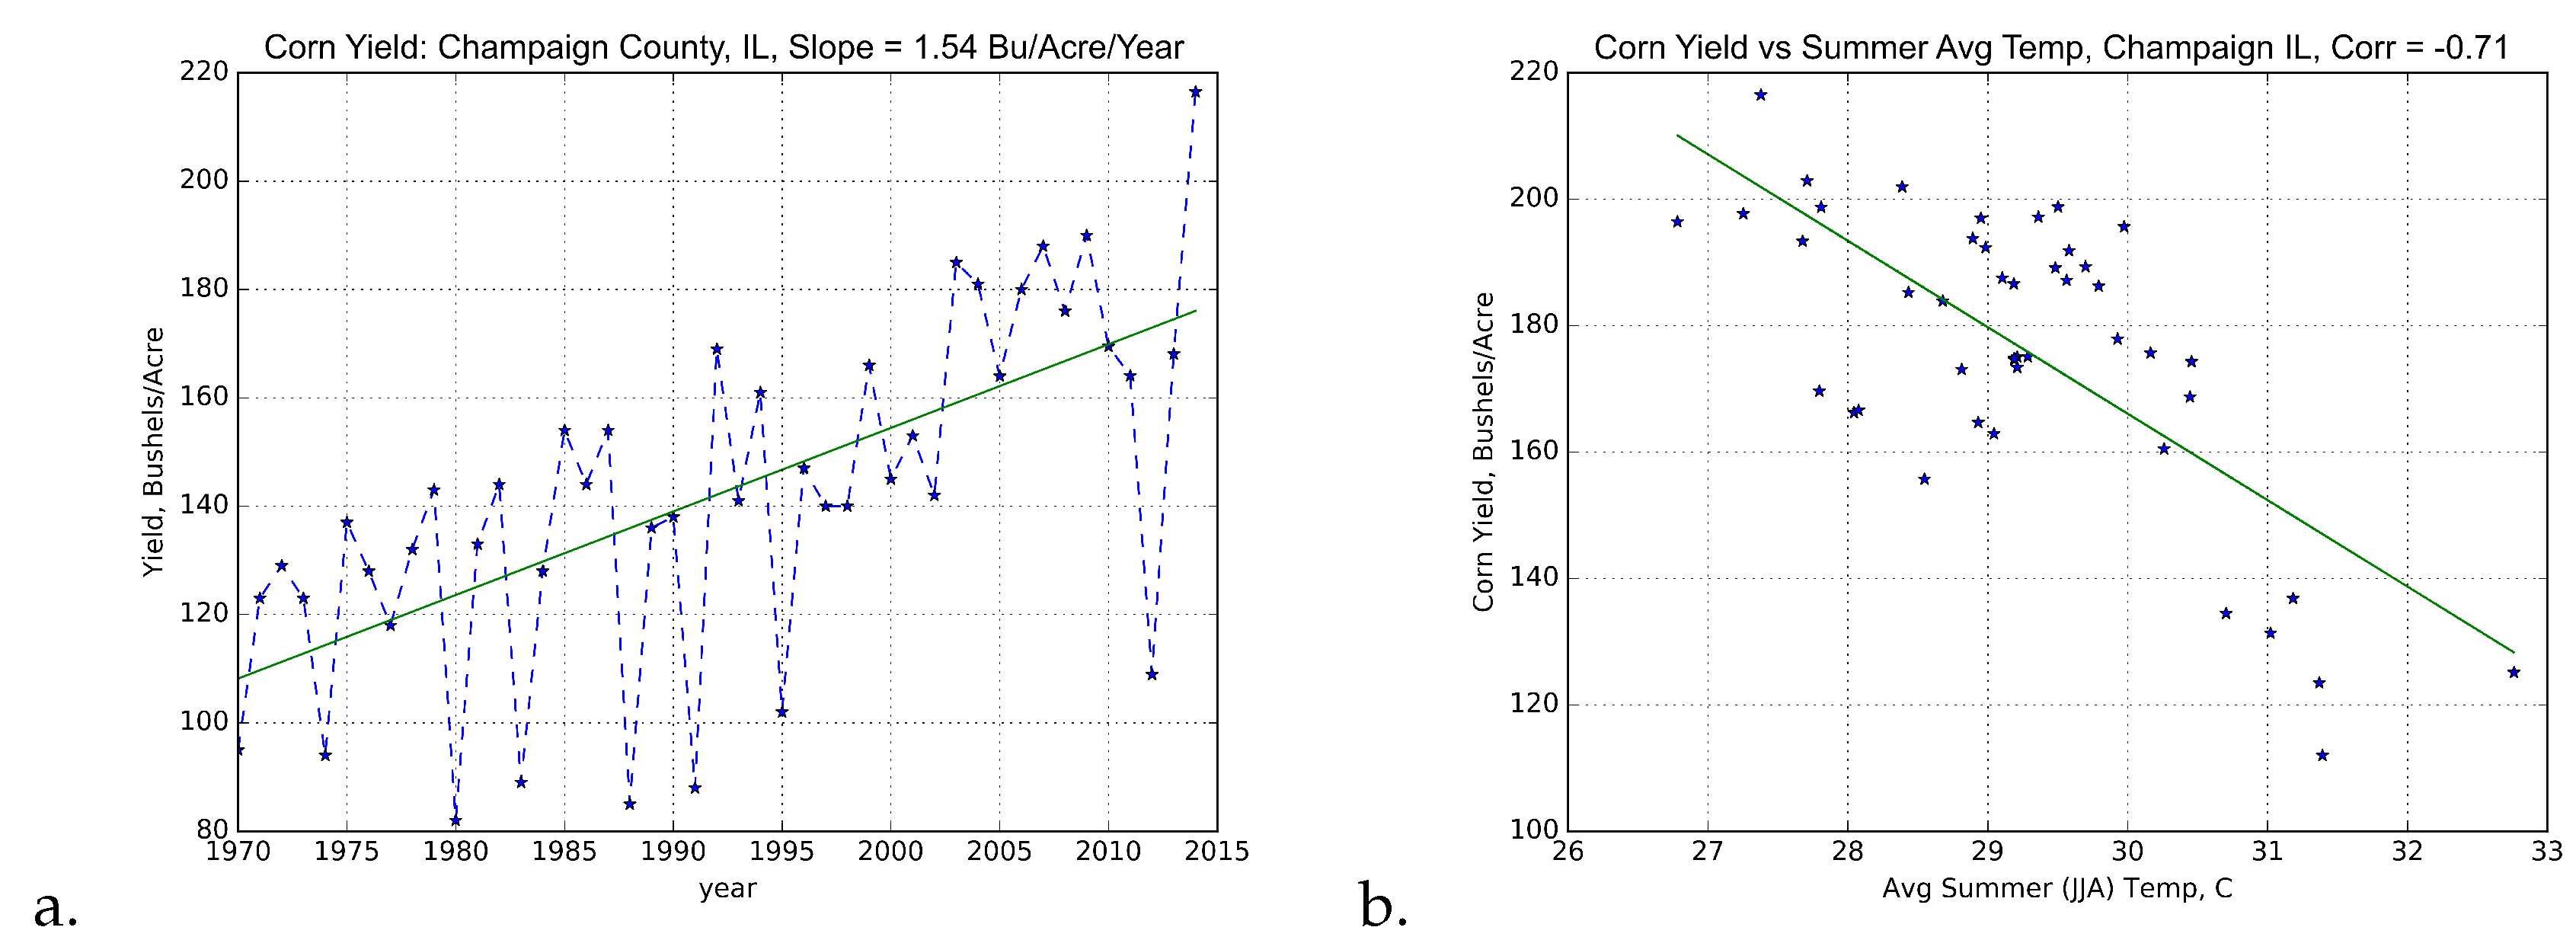
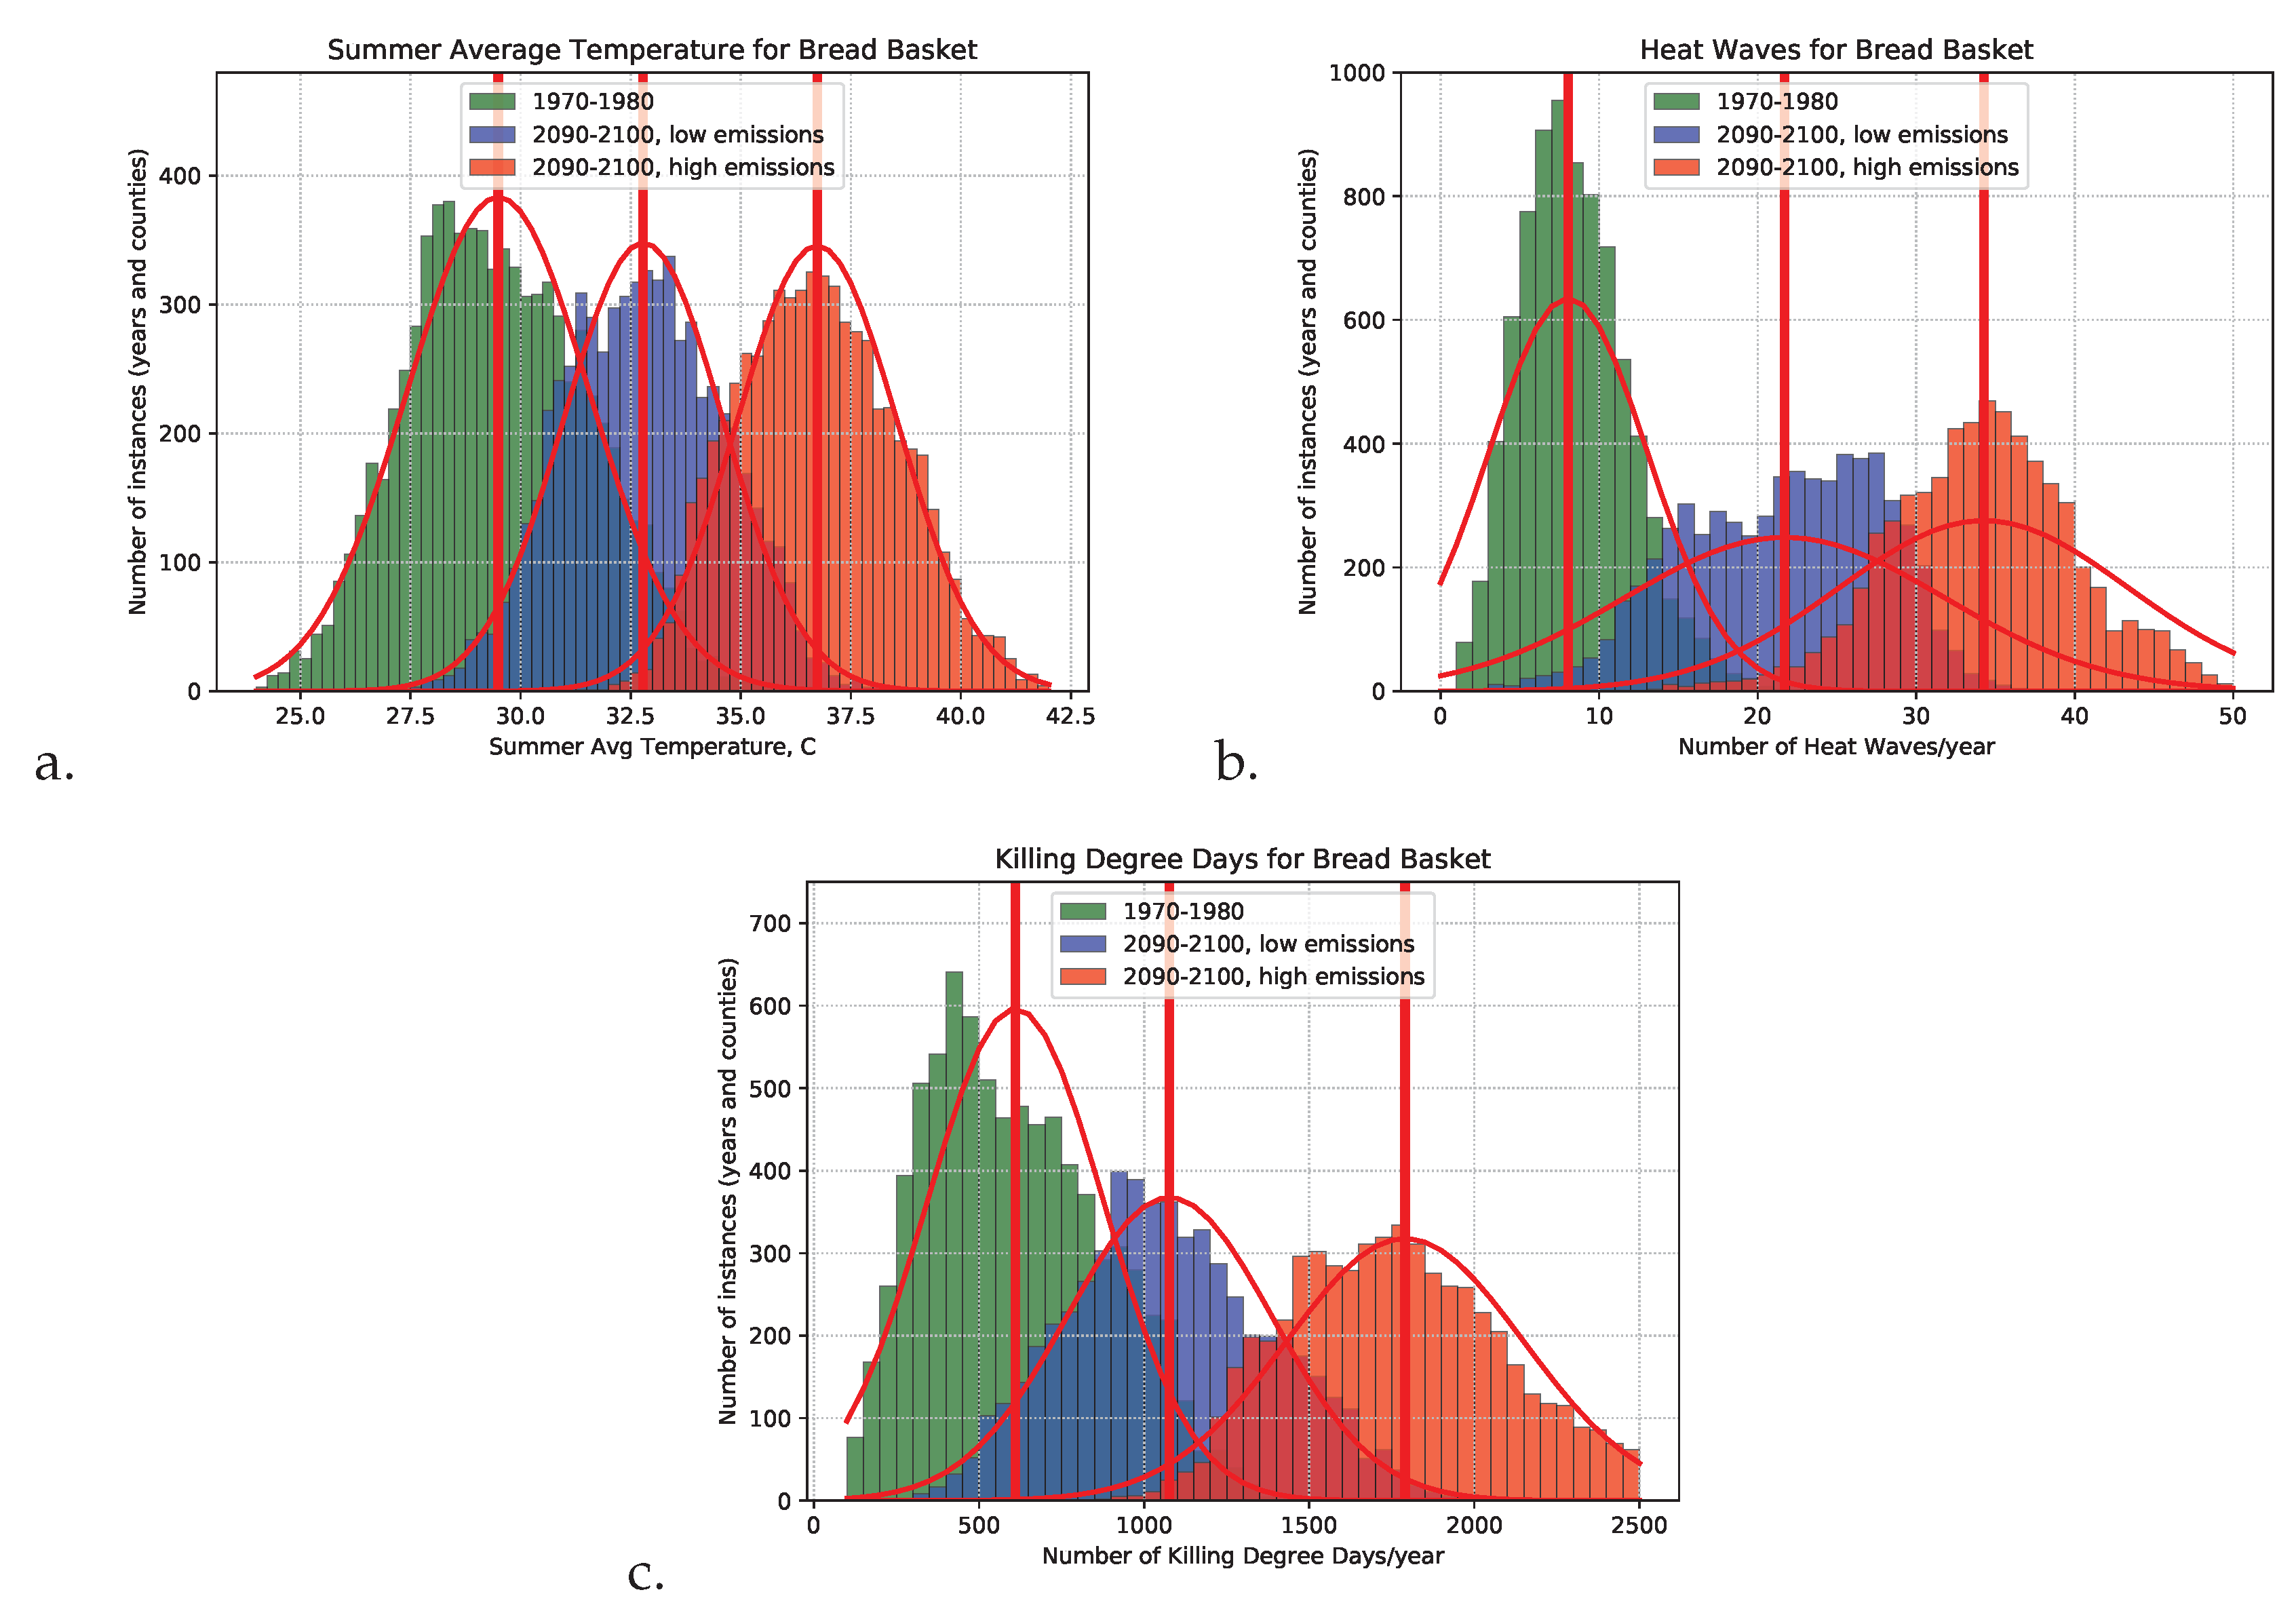
Future climate model data was obtained from the Coupled Model Intercomparison Project Version 5 (CMIP5), using the Community Climate System Model (CCSM4) [39], and was obtained from the MACA data portal. I downloaded datasets for two IPCC scenarios: a high emission future with a Representative Concentration Pathway (RCP) that induces an extra 8.5 W/m of radiative forcing (RCP 8.5) and a low emissions scenario with an RCP of 4.5 W/m (RCP 4.5). Climate forcings in the MACAv2-METDATA were drawn from a statistical downscaling of global climate model data from CMIP5 [40] utilizing a modification of the Multivariate Adaptive Constructed Analogs (MACA) [41] method with the METDATA [42] observational dataset as training data. The climate data had high resolution in space (one-tenth of a degree) and time (daily). Summer average temperature, heat waves, and killing degree days were computed for each county for every year until 2100, using data from the closest model grid-cell to the center of each county. The histograms displaying these future heat measurements (Figure 2) were computed using a latitude/longitude rectangle around the dominant corn-growing region, with corners at (40N, 100W), (44N, 85W).
Crop yields were then predicted by applying the historical linear regressions to the future projections of summer average temperature, heat waves, and killing degree days. For each county, the crop predictions from the three statistics were averaged, as each measure predicted the yields slightly differently. National averages of crop yields were computed by averaging all counties that either consistently grew their crop over the past 10 years or grew at least 10% as much as the highest-producing county for that crop.
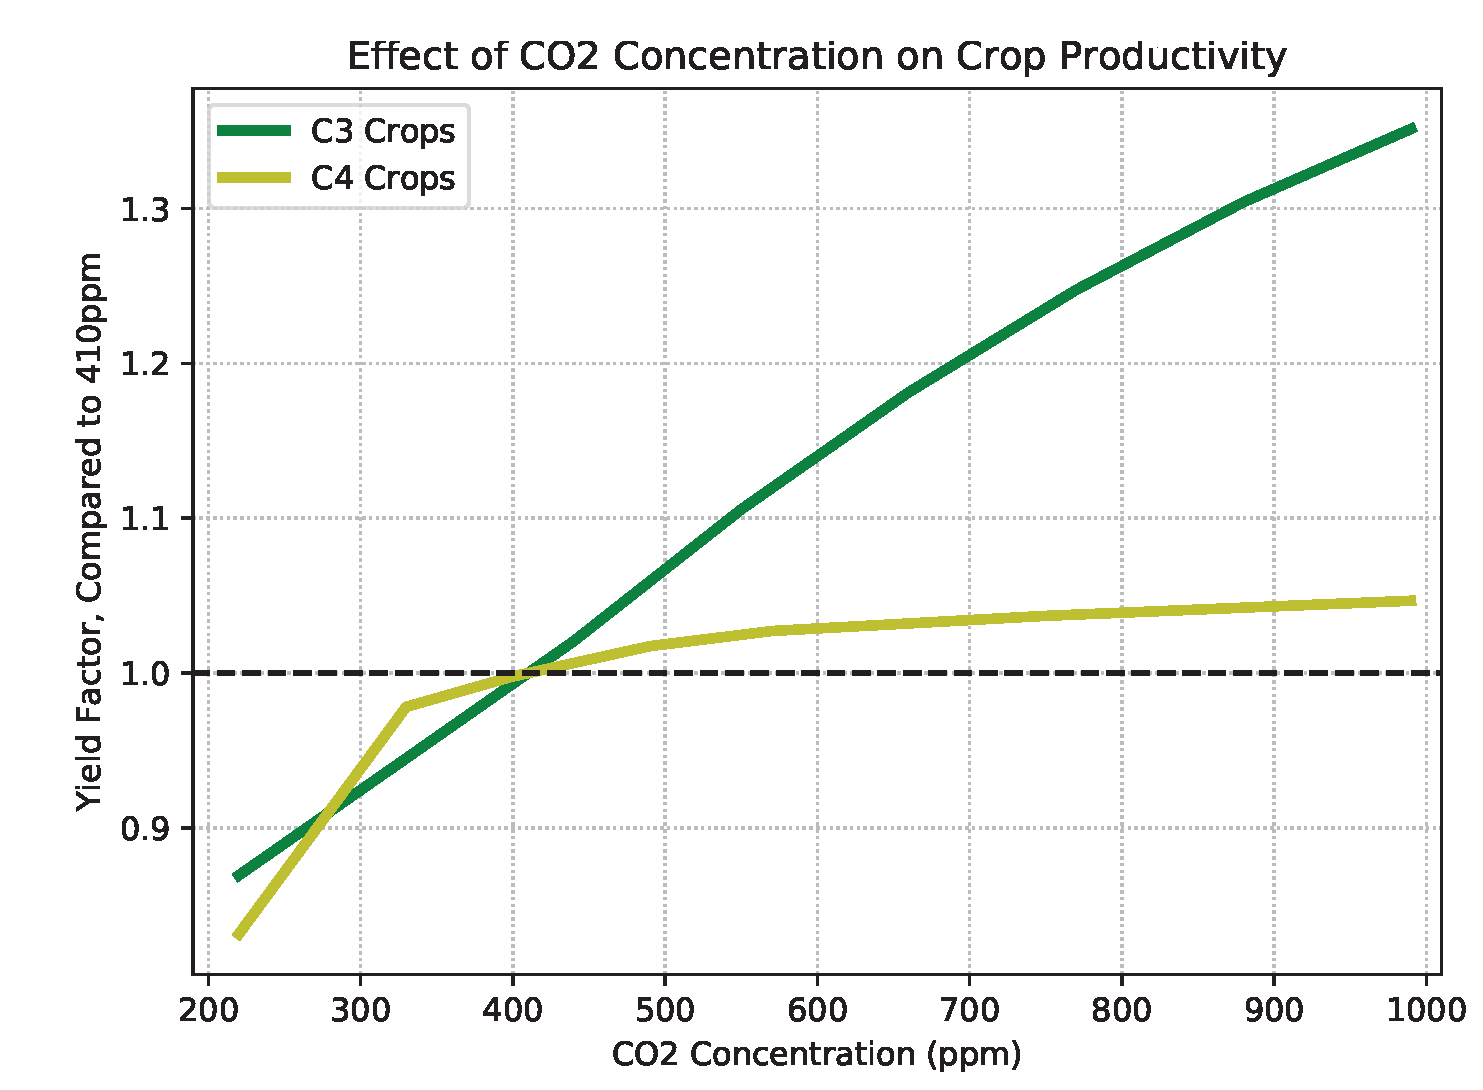
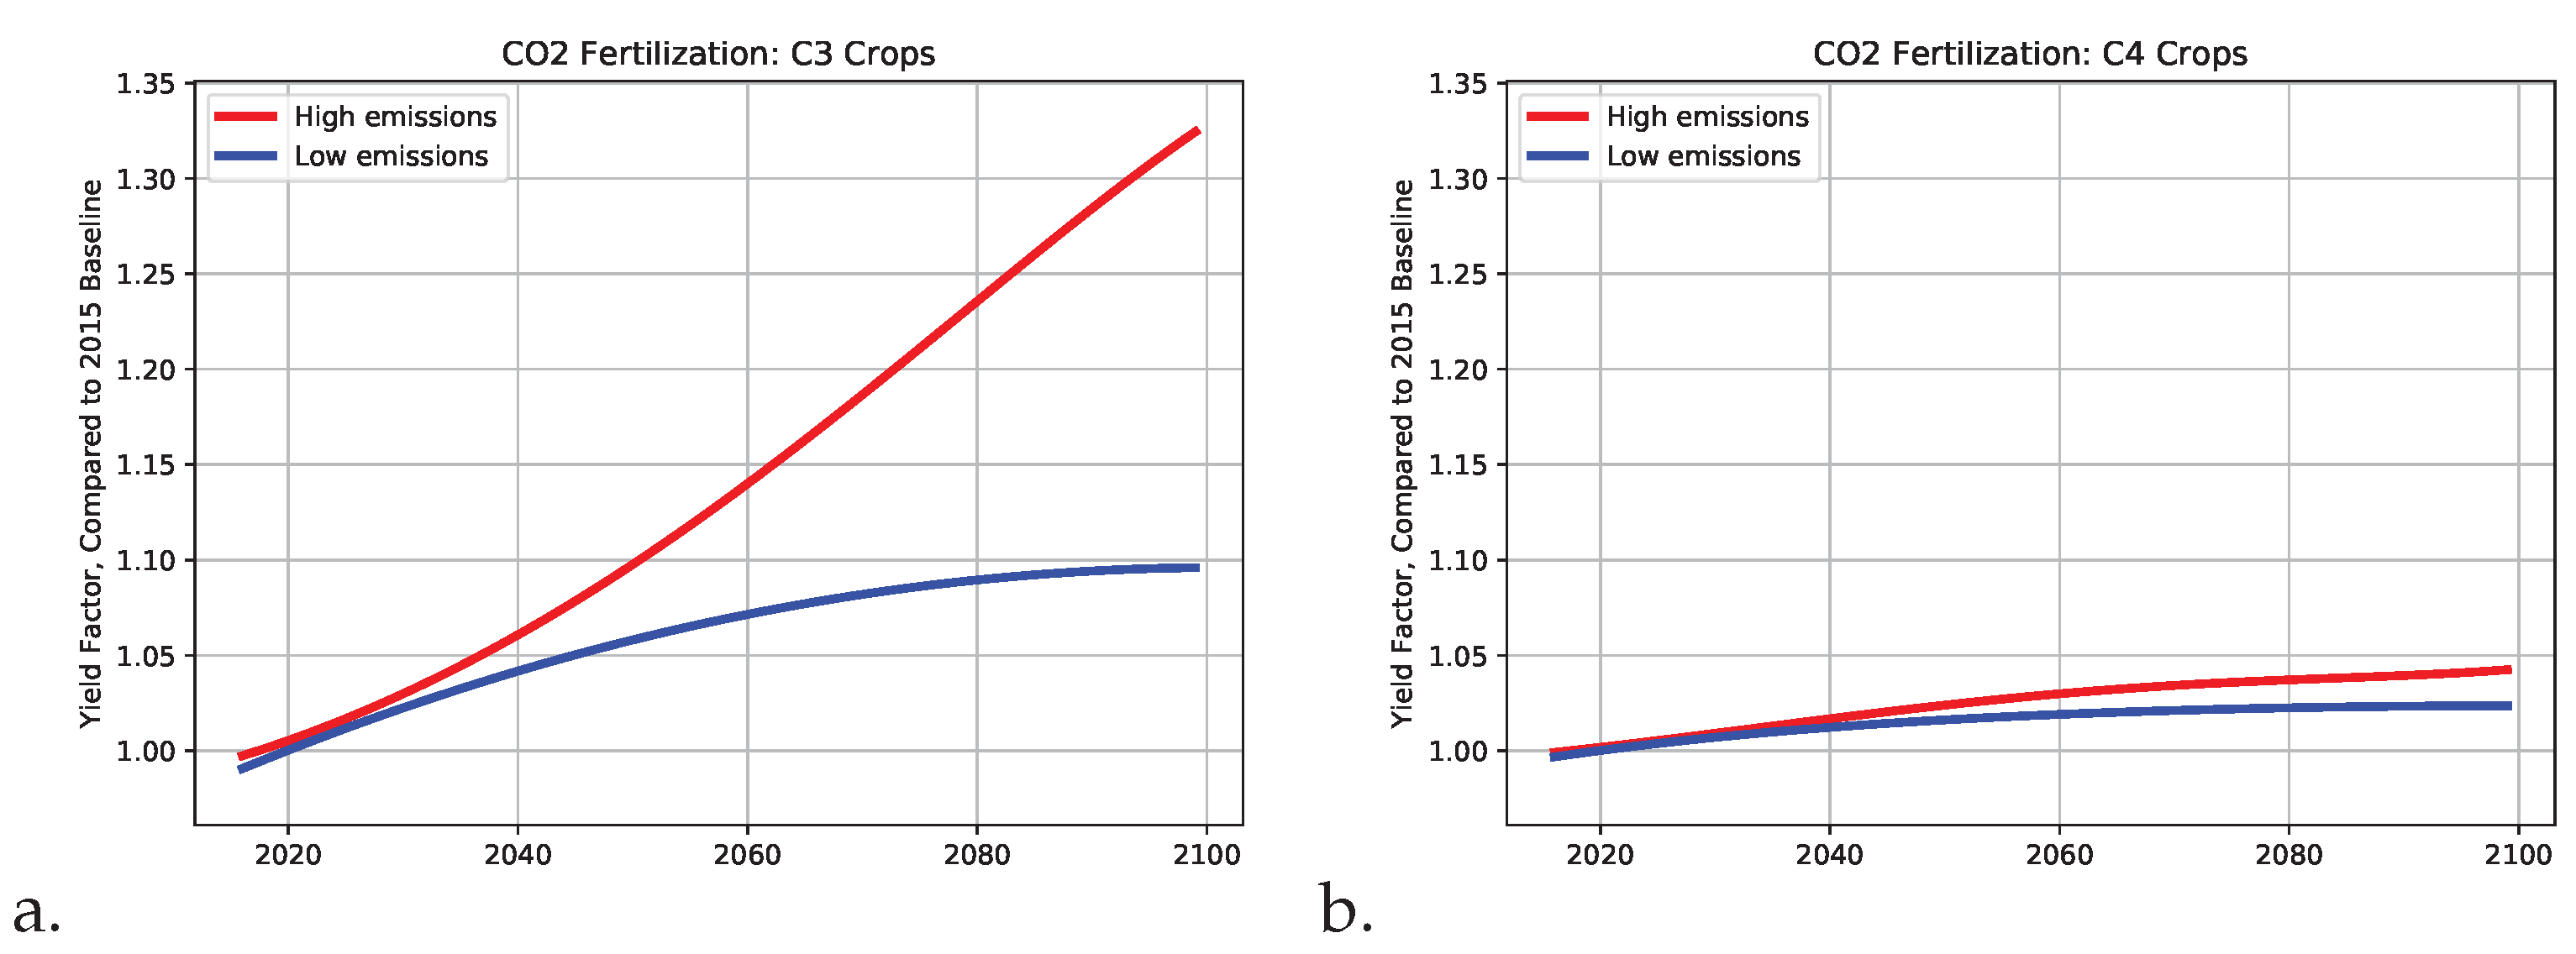
After future crop yields were predicted from temperature projections, the yield was multiplied by the expected yield factor from CO fertilization. Future carbon dioxide concentrations to 2100 for RCP8.5 and RCP4.5 scenarios were obtained from [43]. The yield factor is the change in yield due to carbon dioxide fertilization, where 0.8 is a 20% reduction and 1.2 is a 20% increase in yield. The yield factor for C3 and C4 crops under different CO concentrations (Figure 3) was acquired from [44], in which results from the DSSAT4 models [45] were interpolated based on CO enrichment experiments, and were then normalized at 2015 CO concentrations. Figure 4 displays the yield factor due to carbon dioxide fertilization to year 2100 for C3 and C4 crops under low and high-emissions scenarios.
Crop yields in the US have improved in recent decades due to better technologies. In fact, corn yields have doubled since 1970. It is not known whether these trends will continue to hold in the future or if biological constraints will impose maximum achievable crop yields. In this study, best and worst case scenarios were computed as a proxy for all possible futures. For the best case scenario of continuous technology improvement, the historical trend was added to the future yield predictions. For the worst case scenario of no future technology improvement, no trend was added to the yield predictions.
Ultimately, future yield forecasts were computed based on three sets of indicators: (1) only temperature changes, (2) only CO fertilization, and (3) both combined. Each of these predictions were then split into two technology scenarios: (1) no technology improvement and (2) continuous technology improvement, resulting in six forecasts for each crop.
3. Results
3.1. Historical Correlations and Regressions
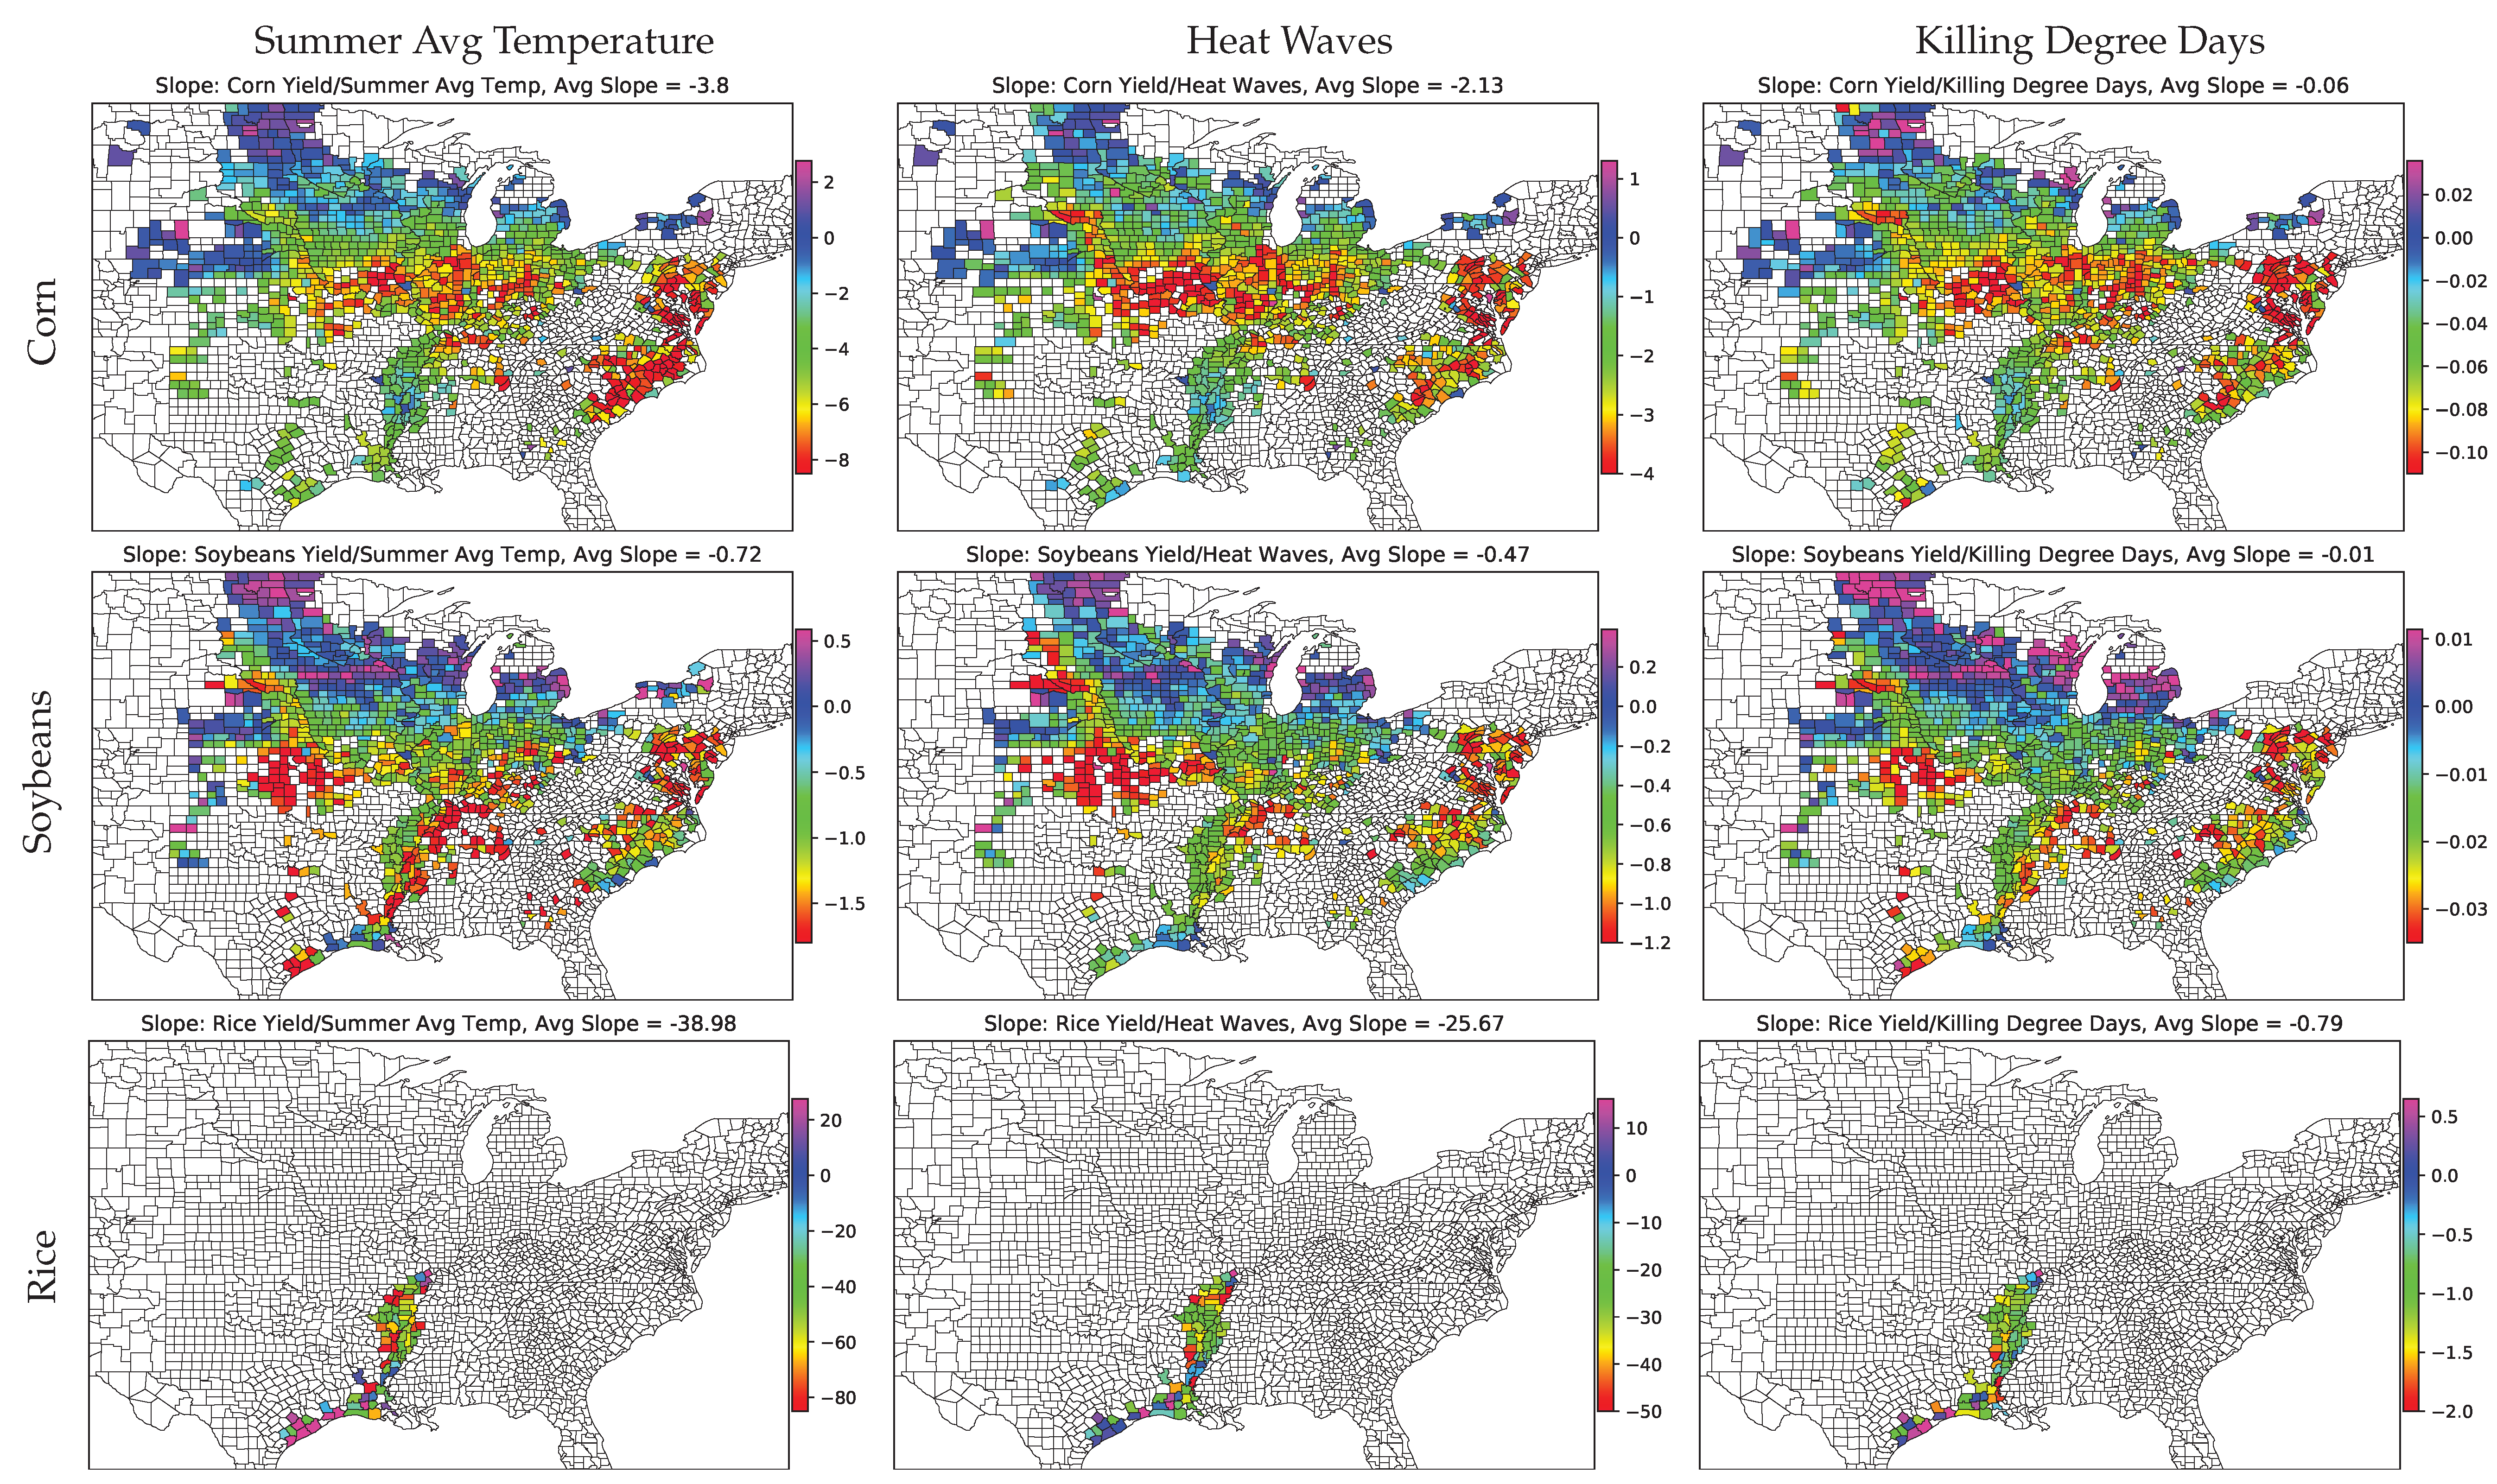
The slopes of the linear regressions computed between crop yields and weather statistics for every county in the US can be seen in Figure 5. Almost all of the slopes are negative, meaning that higher temperatures result in lower crop yields. Corn has average correlations of −0.44, −0.46, and −0.41 to summer average temperature, heat waves, and killing degree days, respectively (Figure 6), and three in every five counties have a significant correlation. All temperature indices have similar correlations, indicating that all three have similar predictive power. Corn and soybeans observe large geographical distributions in the eastern and central US, while rice is mostly grown along the Mississippi River. Spatial variations of slopes and correlations can be examined for corn and soybeans. In southern growing regions (Missouri, southern Illinois, and Indiana), slopes are very negative with highly significant correlations (Figure 5 and Figure 6). Crops here are thus extremely sensitive to heat extremes. In contrast, slopes and correlations farther north (Minnesota and South Dakota) are about zero, indicating that the yields are not affected by temperatures classified as extreme events in these states. The correlations with heat waves, summer average temperature, and killing degree days all follow similar geographic distributions. These results indicate that the places where crops are grown will likely shift north over time, where average temperatures are cooler.
Heat waves have the highest impact on all three crops. Corn has the strongest correlation to heat measurements, soybeans have a slighly weaker correlation, and rice has little to no correlation to temperatures. When averaged across crop-growing counties, soybeans have a correlation of −0.37 with heat waves, and about half of the counties have significant correlations. Rice has an average correlation −0.22 with heat waves and no counties have significant correlations (Figure 6).
3.2. Prediction of Future Crop Yield
Heat extremes are expected to increase in the coming century. Histograms of the three heat measurements are shown for three different times and scenarios: 1970–1980 observed, 2090–2100 low emissions, and 2090–2100 high emissions, over the corn growing counties (Figure 2). Both mean and extreme temperatures dramatically increase in the future, with high emission scenarios increasing more than low emission. For example, the average summer daily high temperature was 29 C (85 F) in 1970 to 1980. In 2090 to 2100, the summer average temperature is projected to be 33 C (91 F) for RCP 4.5 and 36 C (97 F) for RCP 8.5. Heat waves and killing degree days are also expected to increase dramatically (Figure 2b,c). Interestingly, the tails of histograms in the future are much wider, indicating higher probabilities of extreme weather events.
Historical regressions and future climate extremes were used to predict future yields to 2100 for each county, year, and crop. First, results without CO fertilization will be presented, followed by those including CO fertilization.
Before accounting for CO fertilization, crop yields are projected to dramatically drop in the coming century. Forecasted crop yields, with and without future technology improvements, can be seen in Figure 7. In addition to having the highest correlations, corn is also affected the most by the warming climate. Average US corn yields doubled from 80 bushels/acre in 1970 to 170 bushels/acre in 2015. Predicted yields in 2096 through 2100 drop to 76% (86%) of expected yields without warming for a high (low) emissions scenario. This translates to a 3.8% decrease in corn yields per decade for a high emissions scenario and a 1.8% decrease per decade for a low emissions scenario, compared to a historical 24% increase in corn yields per decade due to agricultural technology improvements. For more details, refer to Table 2.
Even with the optimistic conditions of continuous technology improvement, there is a huge loss in yields below expected yields with a steady climate. In 2100, there is a loss of $24 billion per year for high emissions and $13 billion per year for a low emissions scenario. This estimate assumes the acres harvested and the cost of corn in 2016, and does not account for inflation [46,47]. Soybeans are affected by temperature extremes slightly less than corn, with losses of $5 and $10 billion per year in 2100 for high and low emission scenarios. Rice, being least sensitive to climate change, only has losses of $0.34 and $1.06 billion per year (Table 2). Rice is the least affected by heat, likely because it is grown in flooded conditions. These computations assume the current market prices of crops and do not include CO fertilization.
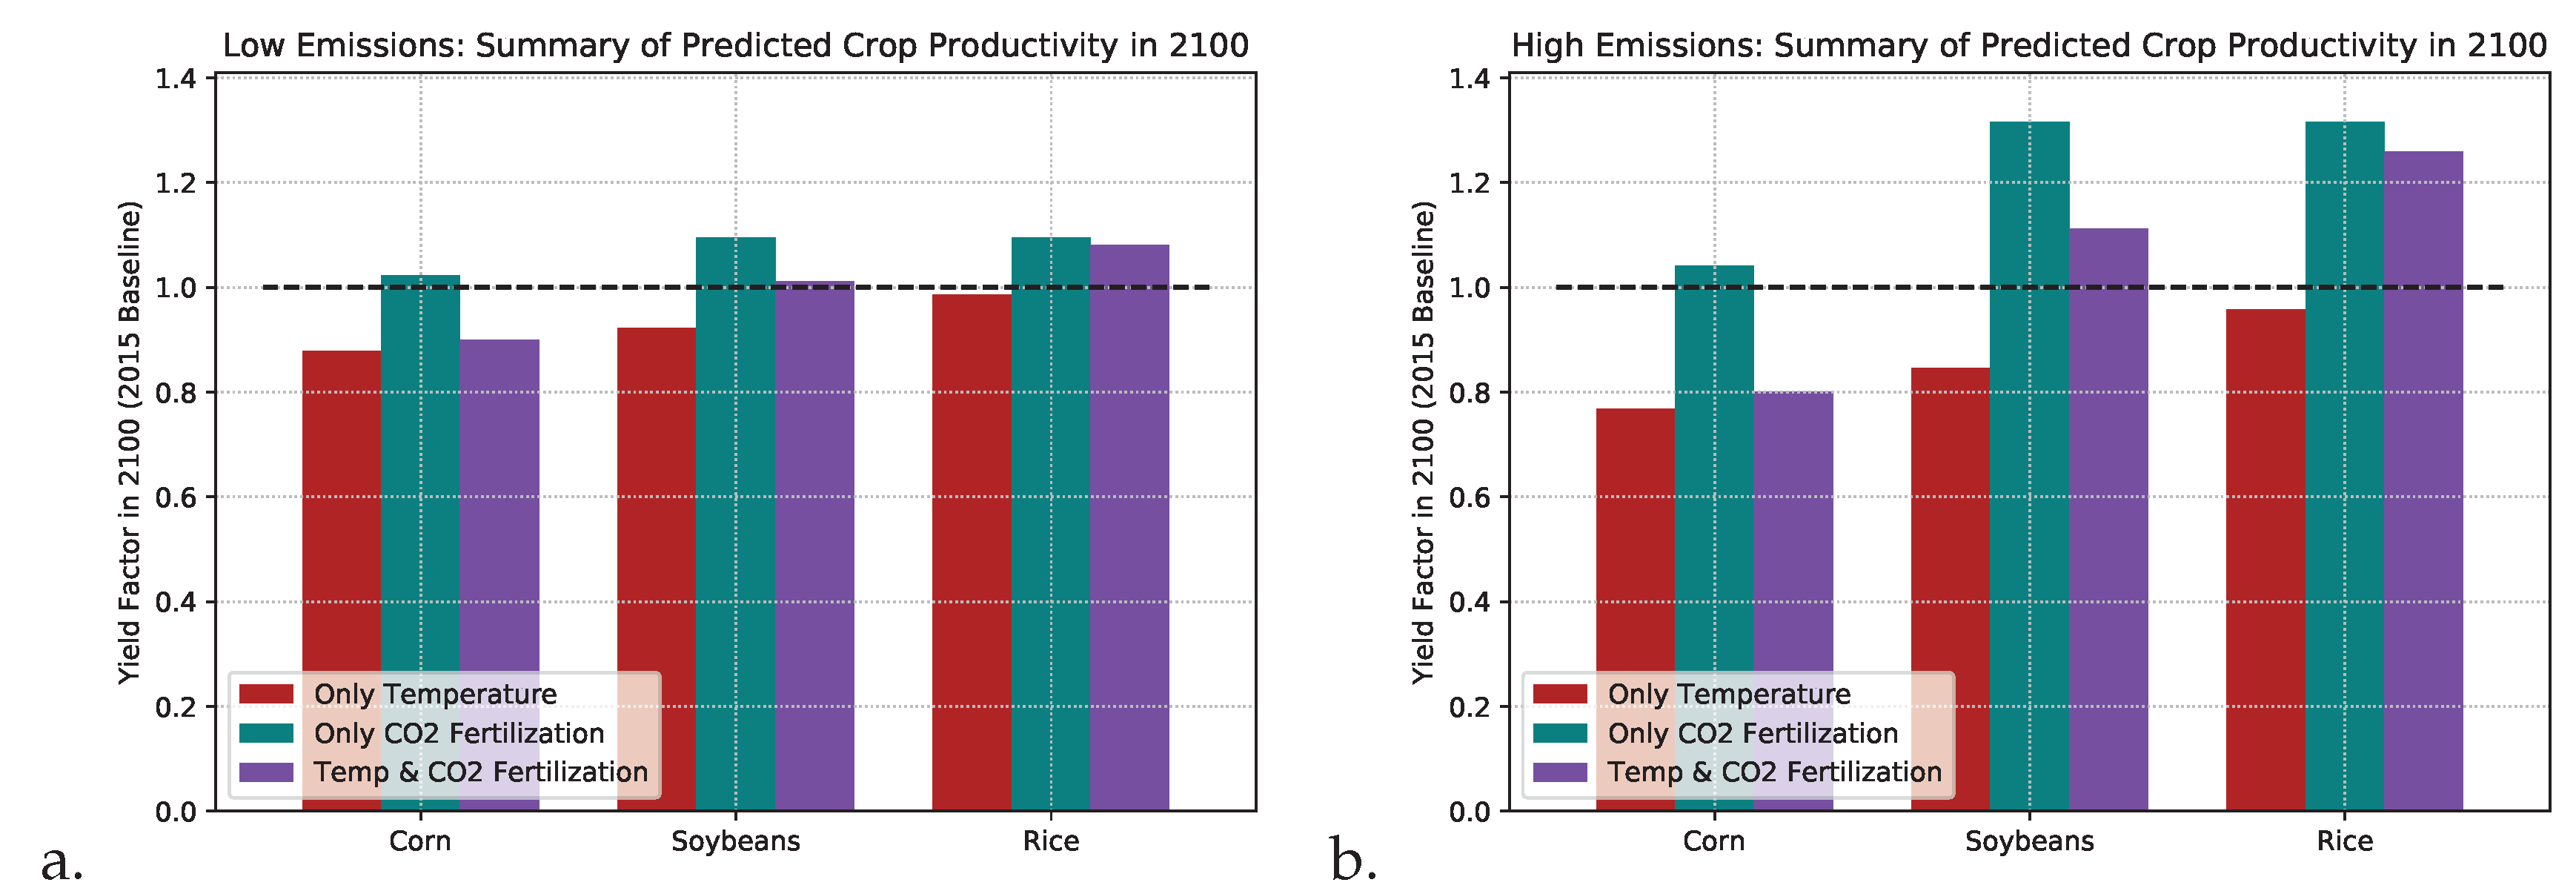
Although these results display a dismal future, the story changes when we account for CO fertilization. In RCP 8.5, carbon dioxide concentrations break 900 ppm by 2100. That translates to almost 135% productivity for C3 crops (here: soybeans and rice) compared to productivity in 2015. Even for a low emissions scenario, C3 crops gain 10% productivity by the end of the century. CO concentrations have a much smaller effect on C4 crops (here: corn), which reach 104% and 102% productivity in 2100 for a high and low-emissions scenario.
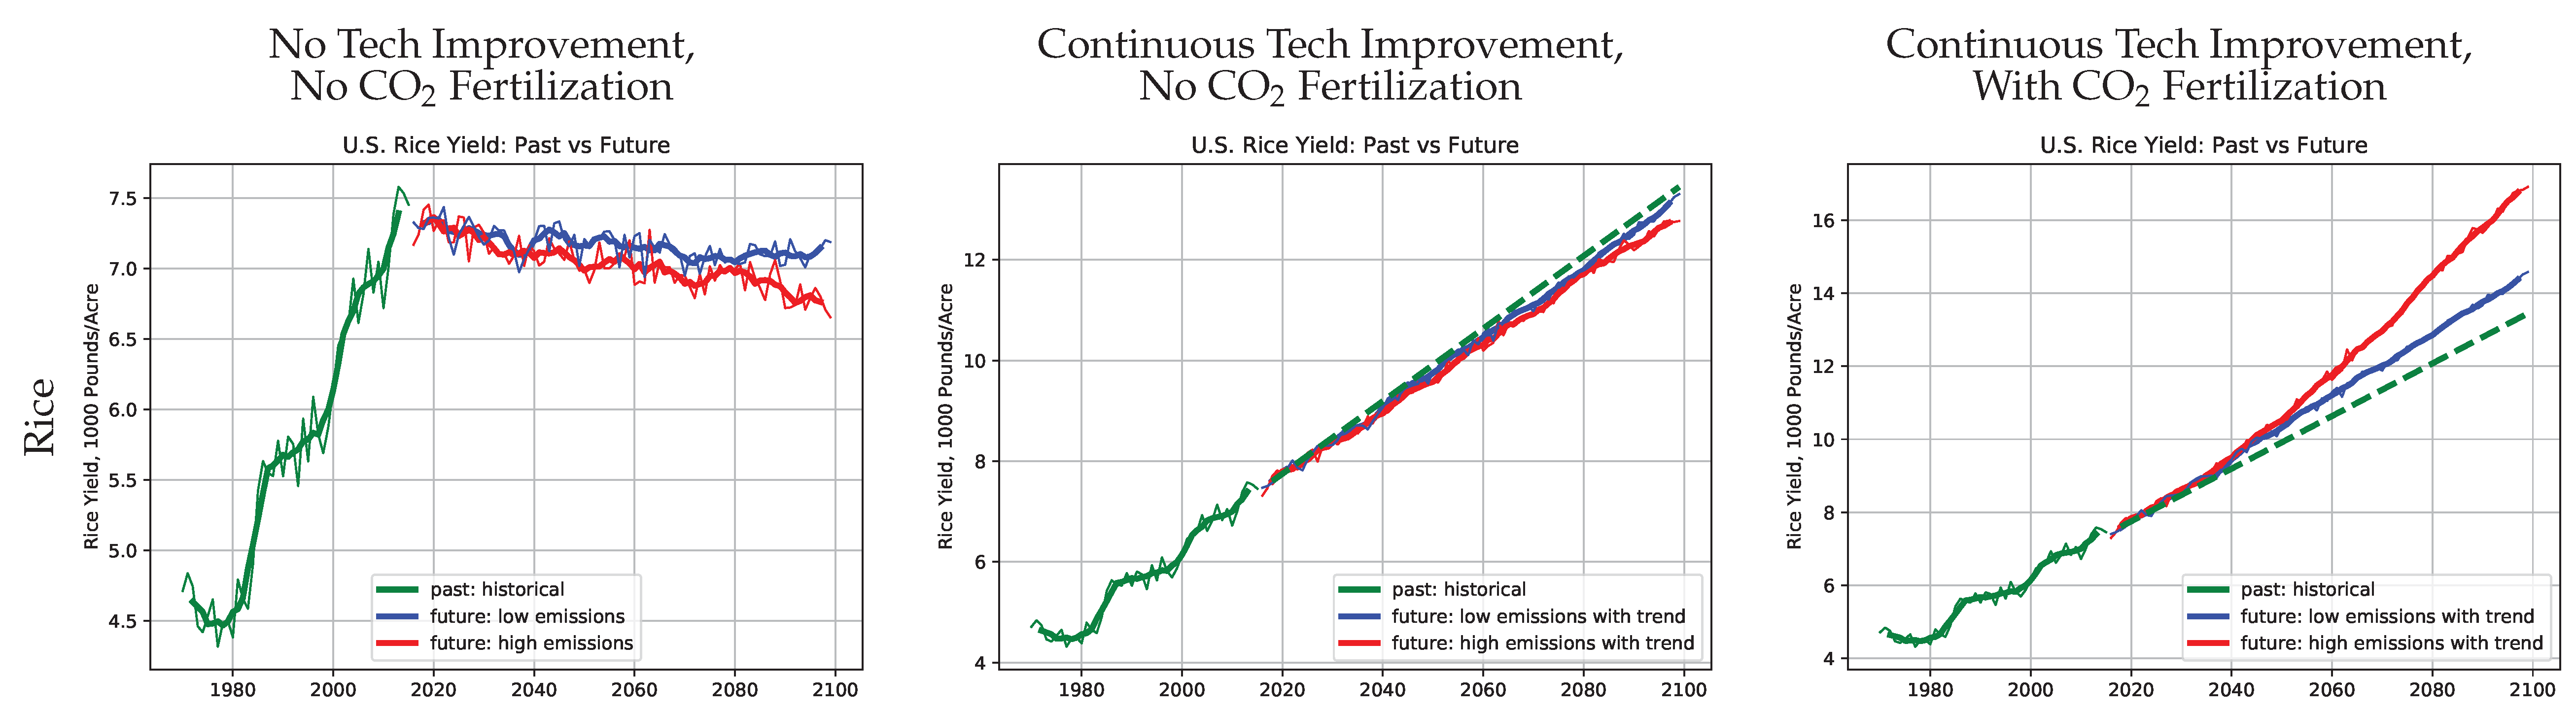
The projections of corn, a C4 crop, are very similar before and after accounting for CO fertilization (Figure 7). Projections of soybeans and rice with CO fertilization, however, are considerably higher. In fact, rice reaches 126% expected productivity by 2100 with a high emissions scenario. A summary of future crop yield estimates is shown in Figure 8.
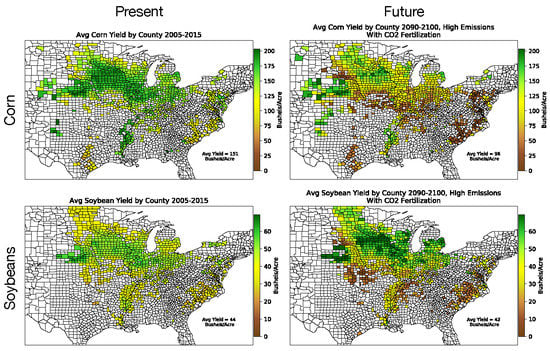
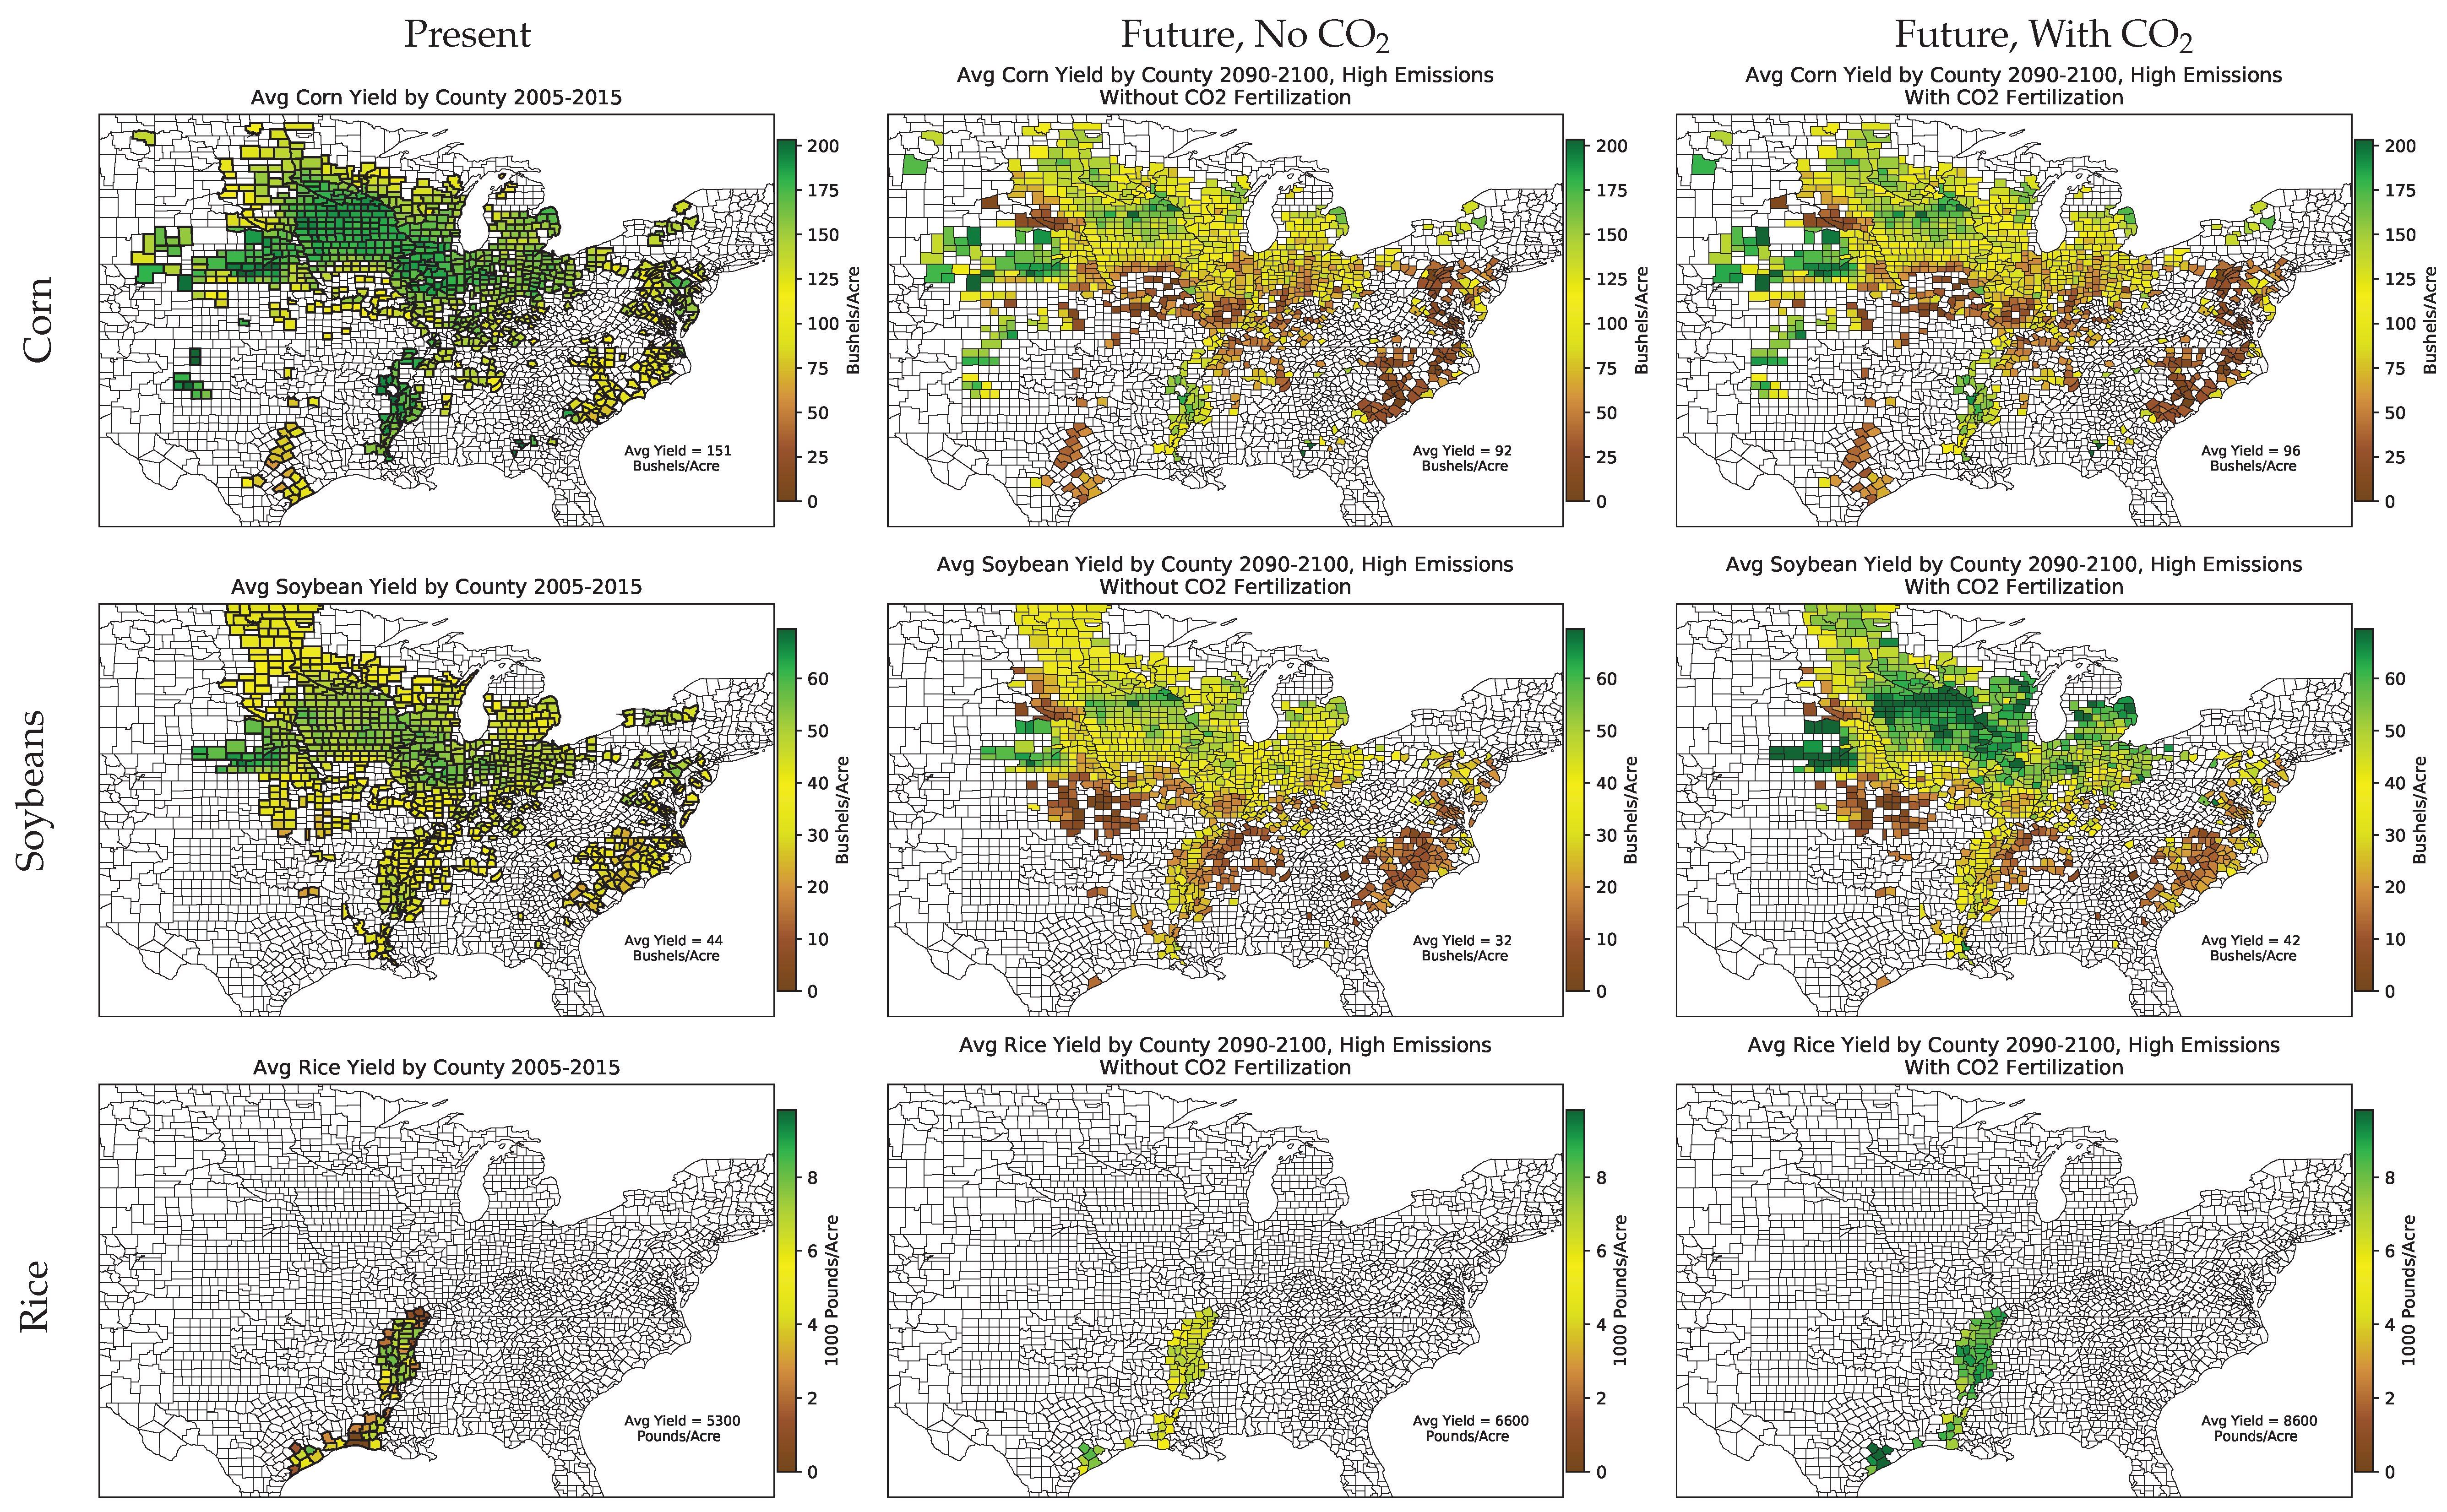
The spatial distributions of projected crop yields may be examined (Figure 9). In 2005 through 2015, corn and soybean yields are relatively uniform across the US. In contrast, their yields are spatially disparate in 2100, with very low yields in the south and much higher yields in the northern Midwest. This distribution likely is a product of cooler climates farther north, and holds true with and without CO fertilization. Few spatial differences are predicted in rice yields, as rice is grown in a relatively small geographic range and has weaker correlations to temperature.
4. Discussion
The purpose of this study was to analyze the potential economic losses or gains of US crop yields due to climate change by applying historical relationships between yields and heat extremes to multiple future climate scenarios, while accounting for CO fertilization. Historical records give insights into factors that affect yields. The most dominant influence on crop yields since 1970 is the secular trend due to improving farming practices and technologies, where yields nearly double over that period. On top of this trend, there is year-to-year variability that can be explained by local weather. Corn, soybean, and rice yields were correlated to several measures of mean and extreme weather, and all were most strongly dependent on heat waves, summer average temperature, and killing degree days. This indicates that hot temperatures have the strongest effect on crop growth, while moderate or cold temperatures have little effect. Interestingly, precipitation had insignificant correlations with crop yields, possibly because of the prevalence of drought-resistant breeds in the US or the confounding influence of irrigation.
This study evaluates future crop yields with and without CO fertilization. Without CO fertilization, increasing temperatures significantly decrease crop production, with yields reaching as low as 77% of their expected productivity without climate change. In all cases, corn is most sensitive to heat, soybeans slightly less so, and rice the least, likely because rice is grown in flooded conditions. When carbon dioxide fertilization is added into the future projections, crop yields increase dramatically. Carbon dioxide concentrations alone are expected to increase C3 crop yields by 35% by the end of the century for a high emissions scenario. When the effects of CO and temperatures are combined in a simple way, rice and soybean yields are actually shown to increase over the next century.
In this study, the effects of temperature extremes on crop yields were measured during historical CO concentrations, while the effects of increased CO concentrations were measured under laboratory conditions, independently of heat extremes. To project the effects of both together, the two factors were multiplied, but this may in fact not be how plants respond. It is unknown whether CO fertilization and temperatures will have compounding physiological effects: the positive influence of CO fertilization may be severely curbed at sufficient heat. Thus, more data on the effects of these combined influences is required for more accurate yield forecasts.
Projected yield losses due to climate change may be compared to past studies, shown in Table 7-2 of the IPCC Working Group II [36]. Numbers in this study compare well with the past corn and rice studies (10 and 13 studies, respectively). The soybean losses here are much greater than the 10 past publications when only accounting for temperatures, but are comparative when including CO fertilization. These comparisons are complicated by the mixture of scenarios and model types in the IPCC summary, and most previous studies do not include CO fertilization.
This study is very similar to [44], which predicts global crop yields for different low-emission climate scenarios, with and without CO fertilization. They find that accounting for CO fertilization mitigates the effect of warming temperatures. The results of this study are comparable to those of [44], since both studies find that C3 crops benefit strongly from higher carbon dioxide concentrations. The results of this study are also similar to those of [15], who use temperature, precipitation, and CO fertilization to predict global corn and wheat yields. They also find clear benefits of reducing greenhouse gas emissions for corn yields, but fewer for wheat yields, as wheat is a C3 crop and benefits from CO fertilization [48].
The statistical model developed here includes several assumptions. The three seasonal climate statistics only involve temperature, but crop yields may also be correlated with other conditions, such as precipitation, soil moisture, and radiation. Some other statistical models include these, but this study found much higher correlations with temperature than precipitation. Soil moisture and radiation were not available from weather station data. In order to project into the future, the model assumes that temperature continues to influence crop yields as they have historically, despite potential changes in other factors such as precipitation, soil conditions, or more advanced technologies. Another assumption is that linear regressions may be used as a predictive model for temperatures much hotter than those recorded historically, even though previous papers have found crop growth to respond nonlinearly to climate [8,49]. Despite these shortcomings, the high correlations in Figure 6 show that the climate statistics used for prediction are reasonable predictors of crop yields.
This study indicates that land in the northern United States may be more suitable for crop production as temperatures rise. Crops in the northern counties are less susceptible to events classified as extreme temperatures in those counties (Figure 6), and are forecasted to have much higher yields in 2100 (Figure 9). A limitation of a statistical model is that it can only predict crop yields in areas with sufficient crop data. Thus, this model cannot judge whether crops will have high yields in counties further north where crops have not been historically grown. A process model would be required to predict crop performance in these counties. A large unknown in this study is whether agricultural technology will continue to improve or whether crop yields will hit a fundamental biological limit. Given the difficulties of predicting future technologies, this study has instead projected a best case and a worst case scenario. Most likely, technology will have decreasing effects on crop yields due to biological constraints on production, and crop yields will increase at slower rates than have been in the last 50 years. In order to prepare for climate change, we should develop farming practices and crop breeds that are resistant to stronger and more frequent heat extremes.
This study highlights the trade-offs of climate change, where CO fertilization is a potential benefit even while average temperatures and heat waves are increasing. Research to date has shown that the positive influences of CO fertilization will increase yields for much of the 21st century, but will be countered by increasingly hot and dry conditions [50,51,52]. The results in this study exhibit the wide range of possible future impacts of climate change in the next century, and emphasize the need for continued research on the compounding effects of carbon dioxide fertilization and heat extremes.
Funding
This research received no external funding
Acknowledgments
L.K.P. is grateful to Mark Petersen and Phillip Wolfram for discussions on statistical methods and scientific presentation.
Conflicts of Interest
The author declares no conflict of interest.
References
- Shrestha, S.; Deb, P.; Bui, T.T.T. Adaptation strategies for rice cultivation under climate change in Central Vietnam. Mitig. Adapt. Strateg. Glob. Chang. 2016, 21, 15–37. [Google Scholar] [CrossRef]
- Deb, P.; Shrestha, S.; Babel, M.S. Forecasting climate change impacts and evaluation of adaptation options for maize cropping in the hilly terrain of Himalayas: Sikkim, India. Theor. Appl. Climatol. 2015, 121, 649–667. [Google Scholar] [CrossRef]
- IPCC. Summary for Policymakers. In Global Warming of 1.5 °C; An IPCC Special Report on the Impacts of Global Warming of 1.5 °C above Pre-Industrial Levels and Related Global Greenhouse Gas Emission Pathways, In the Context of Strengthening the Global Response to the Threat of Climate Change, Sustainable Development, and Efforts to Eradicate Poverty; Intergovernmental Panel on Climate Change (IPCC): Geneva, Switzerland, 2018. [Google Scholar]
- Schiermeier, Q. Economists Who Changed Thinking on Climate Change Win Nobel Prize. Nature, 8 October 2018. [Google Scholar] [CrossRef]
- Nordhaus, W.D. Economic aspects of global warming in a post-Copenhagen environment. Proc. Natl. Acad. Sci. USA 2010, 107, 11721–11726. [Google Scholar] [CrossRef] [PubMed] [Green Version]
- Hsiang, S.; Kopp, R.; Jina, A.; Rising, J.; Delgado, M.; Mohan, S.; Rasmussen, D.J.; Muir-Wood, R.; Wilson, P.; Oppenheimer, M.; et al. Estimating economic damage from climate change in the United States. Science 2017, 356, 1362–1369. [Google Scholar] [CrossRef] [PubMed] [Green Version]
- Moore, F.C.; Diaz, D.B. Temperature impacts on economic growth warrant stringent mitigation policy. Nat. Clim. Chang. 2015, 2015. 5, 127–131. [Google Scholar] [CrossRef]
- Schlenker, W.; Roberts, M.J. Nonlinear temperature effects indicate severe damages to U.S. crop yields under climate change. Proc. Natl. Acad. Sci. USA 2009, 106, 15594–15598. [Google Scholar] [CrossRef] [PubMed] [Green Version]
- Edgerton, M.D. Increasing Crop Productivity to Meet Global Needs for Feed, Food, and Fuel. Plant Physiol. 2009, 149, 7–13. [Google Scholar] [CrossRef] [PubMed] [Green Version]
- Gerland, P.; Raftery, A.E.; Ševčíková, H.; Li, N.; Gu, D.; Spoorenberg, T.; Alkema, L.; Fosdick, B.K.; Chunn, J.; Lalic, N.; et al. World population stabilization unlikely this century. Science 2014, 346, 234–237. [Google Scholar] [CrossRef] [PubMed]
- Alston, J.M.; Beddow, J.M.; Pardey, P.G. Agricultural Research, Productivity, and Food Prices in the Long Run. Science 2009, 325, 1209–1210. [Google Scholar] [CrossRef]
- Singh, R.P.; Hodson, D.P.; Huerta-Espino, J.; Jin, Y.; Njau, P.; Wanyera, R.; Herrera-Foessel, S.A.; Ward, R.W. Will Stem Rust Destroy the World’s Wheat Crop? Adv. Agron. 2018, 98, 271–309. [Google Scholar] [CrossRef]
- Butler, E.E.; Huybers, P. Adaptation of US maize to temperature variations. Nat. Clim. Chang. 2013, 3, 68–72. [Google Scholar] [CrossRef]
- Liang, X.Z.; Wu, Y.; Chambers, R.G.; Schmoldt, D.L.; Gao, W.; Liu, C.; Liu, Y.A.; Sun, C.; Kennedy, J.A. Determining climate effects on US total agricultural productivity. Proc. Natl. Acad. Sci. USA 2017, 114, E2285–E2292. [Google Scholar] [CrossRef] [PubMed] [Green Version]
- Tebaldi, C.; Lobell, D. Estimated impacts of emission reductions on wheat and maize crops. Clim. Chang. 2015, 1–13. [Google Scholar] [CrossRef]
- Petersen, L.K. Real-Time Prediction of Crop Yields From MODIS Relative Vegetation Health: A Continent-Wide Analysis of Africa. Remote Sens. 2018, 10, 1726. [Google Scholar] [CrossRef]
- Ray, D.K.; Gerber, J.S.; MacDonald, G.K.; West, P.C. Climate variation explains a third of global crop yield variability. Nat. Commun. 2015, 6, 5989. [Google Scholar] [CrossRef] [Green Version]
- Ortiz-Bobea, A.; Just, R.E. Modeling the Structure of Adaptation in Climate Change Impact Assessment. Am. J. Agric. Econ. 2013, 95, 244–251. [Google Scholar] [CrossRef]
- Lobell, D.B.; Schlenker, W.; Costa-Roberts, J. Climate Trends and Global Crop Production Since 1980. Science 2011, 333, 616–620. [Google Scholar] [CrossRef] [PubMed]
- Kukal, M.S.; Irmak, S. Climate-Driven Crop Yield and Yield Variability and Climate Change Impacts on the U.S. Great Plains Agricultural Production. Sci. Rep. 2018, 8, 3450. [Google Scholar] [CrossRef]
- Najafi, E.; Devineni, N.; Khanbilvardi, R.M.; Kogan, F. Understanding the Changes in Global Crop Yields Through Changes in Climate and Technology. Earths Future 2018, 6, 410–427. [Google Scholar] [CrossRef]
- Peng, B.; Guan, K.; Chen, M.; Lawrence, D.M.; Pokhrel, Y.; Suyker, A.; Arkebauer, T.; Lu, Y. Improving maize growth processes in the community land model: Implementation and evaluation. Agric. For. Meteorol. 2018, 250–251, 64–89. [Google Scholar] [CrossRef]
- Sheng, M.; Liu, J.; Zhu, A.X.; Rossiter, D.G.; Zhu, L.; Peng, G. Evaluation of CLM-Crop for maize growth simulation over Northeast China. Ecol. Model. 2018, 377, 26–34. [Google Scholar] [CrossRef]
- Butler, E.E.; Huybers, P. Variations in the sensitivity of US maize yield to extreme temperatures by region and growth phase. Environ. Res. Lett. 2015, 10, 034009. [Google Scholar] [CrossRef] [Green Version]
- Zhang, Q.; Zhang, J.; Guo, E.; Yan, D.; Sun, Z. The impacts of long-term and year-to-year temperature change on corn yield in China. Theor. Appl. Climatol. 2015, 119, 77–82. [Google Scholar] [CrossRef]
- Lobell, D.B.; Tebaldi, C. Getting caught with our plants down: the risks of a global crop yield slowdown from climate trends in the next two decades. Environ. Res. Lett. 2014, 9, 074003. [Google Scholar] [CrossRef] [Green Version]
- Tebaldi, C.; Lobell, D.B. Towards probabilistic projections of climate change impacts on global crop yields. Geophys. Res. Lett. 2008, 35, L08705. [Google Scholar] [CrossRef]
- Gornott, C.; Wechsung, F. Statistical regression models for assessing climate impacts on crop yields: A validation study for winter wheat and silage maize in Germany. Agric. For. Meteorol. 2016, 217, 89–100. [Google Scholar] [CrossRef]
- Tao, F.; Zhang, Z.; Zhang, S.; Ratter, R.P.; Shi, W.; Xiao, D.; Liu, Y.; Wang, M.; Liu, F.; Zhang, H. Historical data provide new insights into response and adaptation of maize production systems to climate change/variability in China. Field Crops Res. 2016, 185, 1–11. [Google Scholar] [CrossRef] [Green Version]
- Ummenhofer, C.C.; Xu, H.; Twine, T.E.; Girvetz, E.H.; McCarthy, H.R.; Chhetri, N.; Nicholas, K.A. How Climate Change Affects Extremes in Maize and Wheat Yield in Two Cropping Regions. J. Clim. 2015, 28, 4653–4687. [Google Scholar] [CrossRef]
- Wang, P.; Zhang, Z.; Song, X.; Chen, Y.; Wei, X.; Shi, P.; Tao, F. Temperature variations and rice yields in China: Historical contributions and future trends. Clim. Chang. 2014, 124, 777–789. [Google Scholar] [CrossRef]
- Wang, P.; Zhang, Z.; Chen, Y.; Wei, X.; Feng, B.; Tao, F. How much yield loss has been caused by extreme temperature stress to the irrigated rice production in China? Clim. Chang. 2016, 134, 635–650. [Google Scholar] [CrossRef]
- Anderson, C.J.; Babcock, B.A.; Peng, Y.; Gassman, P.W.; Campbell, T.D. Placing bounds on extreme temperature response of maize. Environ. Res. Lett. 2015, 10, 124001. [Google Scholar] [CrossRef]
- Hamer, H.; Picanso, R.; Prusacki, J.J.; Rater, B.; Johnson, J.; Barnes, K.; Parsons, J.; Young, D.L. National Agricultural Statistics Service; United States Department of Agriculture: Washington, DC, USA, 2017. [Google Scholar]
- Menne, M.J.; Durre, I.; Vose, R.S.; Gleason, B.E.; Houston, T.G. An Overview of the Global Historical Climatology Network-Daily Database. J. Atmos. Ocean. Technol. 2012, 29, 897–910. [Google Scholar] [CrossRef]
- Hartmann, D.; Tank, A.K.; Rusticucci, M. Climate Change 2013: The Physical Science Basis. Contribution of Working Group I to the Fifth Assessment Report of the Intergovernmental Panel on Climate Change; Technical Report; IPCC: Geneva, Switzerland, 2013. [Google Scholar]
- USDA. Field Crops: Usual Planting and Harvesting Dates; Technical Report; National Agricultural Statistics Service: Washington, DC, USA, 2010. [Google Scholar]
- Crow, E.L.; Davis, F.A.; Maxfield, M.W. Statistics Manual; Dover Publications, Inc.: Mineola, NY, USA, 1960. [Google Scholar]
- Gent, P.R.; Danabasoglu, G.; Donner, L.J.; Holland, M.M.; Hunke, E.C.; Jayne, S.R.; Lawrence, D.M.; Neale, R.B.; Rasch, P.J.; Vertenstein, M.; et al. The Community Climate System Model Version 4. J. Clim. 2011, 24, 4973–4991. [Google Scholar] [CrossRef] [Green Version]
- Taylor, K.E.; Stouffer, R.J.; Meehl, G.A. An Overview of CMIP5 and the Experiment Design. Bull. Am. Meteorol. Soc. 2011, 93, 485–498. [Google Scholar] [CrossRef]
- Abatzoglou, J.T.; Brown, T.J. A comparison of statistical downscaling methods suited for wildfire applications. Int. J. Climatol. 2012, 32, 772–780. [Google Scholar] [CrossRef]
- Abatzoglou, J.T. Development of gridded surface meteorological data for ecological applications and modelling. Int. J. Climatol. 2011, 33, 121–131. [Google Scholar] [CrossRef] [Green Version]
- Hayhoe, K.; Edmonds, J.; Kopp, R.; LeGrande, A.; Sanderson, B.; Wehner, M.; Wuebbles, D. Climate models, scenarios, and projections. 2017, 1, 133–160. [Google Scholar] [CrossRef]
- Tebaldi, C.; Lobell, D. Differences, or lack thereof, in wheat and maize yields under three low-warming scenarios. Environ. Res. Lett. 2018, 13, 065001. [Google Scholar] [CrossRef] [Green Version]
- Jones, J.W.; Hoogenboom, G.; Porter, C.H.; Boote, K.J.; Batchelor, W.D.; Hunt, L.A.; Wilkens, P.W.; Singh, U.; Gijsman, A.J.; Ritchie, J.T. The DSSAT cropping system model. Eur. J. Agron. 2003, 18, 235–265. [Google Scholar] [CrossRef]
- USDA, NASS. Agricultural Prices; USDA, NASS: Washington, DC, USA, 2018. [Google Scholar]
- USDA, NASS. Crop Production 2016 Summary; USDA, NASS: Washington, DC, USA, 2017. [Google Scholar]
- Högy, P.; Wieser, H.; Köhler, P.; Schwadorf, K.; Breuer, J.; Franzaring, J.; Muntifering, R.; Fangmeier, A. Effects of elevated CO2 on grain yield and quality of wheat: Results from a 3-year free-air CO2 enrichment experiment. Plant Biol. 2009, 11, 60–69. [Google Scholar] [CrossRef] [PubMed]
- Lobell, D.B.; Bänziger, M.; Magorokosho, C.; Vivek, B. Nonlinear heat effects on African maize as evidenced by historical yield trials. Nat. Clim. Chang. 2011, 1, 42–45. [Google Scholar] [CrossRef]
- Jin, Z.; Ainsworth, E.A.; Leakey, A.D.B.; Lobell, D.B. Increasing drought and diminishing benefits of elevated carbon dioxide for soybean yields across the US Midwest. Glob. Chang. Biol. 2018, 24, e522–e533. [Google Scholar] [CrossRef]
- Jin, Z.; Zhuang, Q.; Wang, J.; Archontoulis, S.V.; Zobel, Z.; Kotamarthi, V.R. The combined and separate impacts of climate extremes on the current and future US rainfed maize and soybean production under elevated CO2. Glob. Chang. Biol. 2017, 23, 2687–2704. [Google Scholar] [CrossRef] [PubMed]
- Obermeier, W.A.; Lehnert, L.W.; Kammann, C.I.; Müller, C.; Grünhage, L.; Luterbacher, J.; Erbs, M.; Moser, G.; Seibert, R.; Yuan, N.; et al. Reduced CO2 fertilization effect in temperate C3 grasslands under more extreme weather conditions. Nat. Clim. Chang. 2016, 7, 137. [Google Scholar] [CrossRef]
Figure 1.
The corn yield over time for an example county (a) and detrended corn yield plotted against summer average temperature (b). The correlation of −0.71 is highly significant. Data is from the USDA [34].
Figure 1.
The corn yield over time for an example county (a) and detrended corn yield plotted against summer average temperature (b). The correlation of −0.71 is highly significant. Data is from the USDA [34].

Figure 2.
Distributions of summer average temperature (a), heat waves (b), and killing degree days (c) for historical (green), future low-emissions RCP 4.5 scenario (blue) and future high-emissions RCP 8.5 scenario (red). Results are for the US corn growing region. Historical data from [35] and future projections from [41].

Figure 3.
Yield factor for C3 (green) and C4 (yellow) crops versus CO concentration. Crop productivity was acquired from [44], in which results from the DSSAT4 models [45] were interpolated based on CO enrichment experiments.

Figure 4.
Yield factor for C3 (a) and C4 (b) crops through 2100 for a low (blue) and high (red) emissions scenario. Crop productivity under CO concentrations was obtained from [44], and CO concentrations for RCP4.5 and RCP8.5 are from [43].

Figure 5.
The slopes of the linear regressions between corn (top), soybean (middle), and rice (bottom) yields and summer average temperature (left), heat waves (center), and killing degree days (right), in each US county with reported crop yields.
Figure 5.
The slopes of the linear regressions between corn (top), soybean (middle), and rice (bottom) yields and summer average temperature (left), heat waves (center), and killing degree days (right), in each US county with reported crop yields.

Figure 6.
The same as Figure 5, but for correlations between the crop yield and the temperature metric. Correlations below −0.49 are significant (p < 0.05) and below −0.59 are highly significant (p < 0.01).
Figure 6.
The same as Figure 5, but for correlations between the crop yield and the temperature metric. Correlations below −0.49 are significant (p < 0.05) and below −0.59 are highly significant (p < 0.01).

Figure 7.
Projected US corn (top), soybean (middle), and rice (bottom) yields to 2100. The prediction scenarios include: (left) no technology improvement and no CO fertilization; (center) continuous technology improvement and no CO fertilization; and (right) continuous technology improvement with CO fertilization. The green dashed line is a linear extension of the 1970–2015 trend. Thin lines are yearly data, solid is the five-year running average.


Figure 8.
Crop productivity averaged over 2096–2100, compared to a 2011 through 2015 baseline for a low (a) and high (b) emissions scenario. Estimates are based on only temperatures (red), only CO fertilization (teal), and both assuming compounding effects (purple).
Figure 8.
Crop productivity averaged over 2096–2100, compared to a 2011 through 2015 baseline for a low (a) and high (b) emissions scenario. Estimates are based on only temperatures (red), only CO fertilization (teal), and both assuming compounding effects (purple).

Figure 9.
Crop yield of corn (top), soybeans (middle), and rice (bottom) for 2005–2015 (left), 2090–2100 without CO fertilization (center), and 2090–2100 with CO fertilization (right). Crop predictions are for a high-emissions scenario without future technology improvements.
Figure 9.
Crop yield of corn (top), soybeans (middle), and rice (bottom) for 2005–2015 (left), 2090–2100 without CO fertilization (center), and 2090–2100 with CO fertilization (right). Crop predictions are for a high-emissions scenario without future technology improvements.


Table 1.
Temperature measures computed to find correlations to crop yields. Summer average temperature, heat waves, and killing degree days had the highest correlation, and thus were used as predictors of crop yields. All statistics after the first four are summed over the growing season for each crop and location. Here, highs and lows refer to the recorded daily high and low temperature at each site.
| Measurement | Definition | Units |
|---|---|---|
| Average Yearly high | Average of all daily highs in a year | C |
| Average Yearly low | Average of all daily lows in a year | C |
| Summer Average | Average of all daily max temps over months June, July, and August | C |
| Warmest Day | The warmest high in the growing season | C |
| Coldest Day | The coldest high in the growing season | C |
| Warmest Night | The warmest low in the growing season | C |
| Coldest Night | The coldest low in the growing season | C |
| Heat Waves of highs | Frequency of 3 daily highs in a row >90th percentile | #/year |
| Heat Waves of lows | Frequency of 3 daily lows in a row >90th percentile | #/year |
| Cold Spells of lows | Frequency of 3 daily lows in a row <10th percentile | #/year |
| Cold Spells of highs | Frequency of 3 daily highs in a row <10th percentile | #/year |
| Warm Days | Days when daily high >90th percentile | days/year |
| Cold Days | Days when daily high <10th percentile | days/year |
| Warm Nights | Days when daily low >90th percentile | days/year |
| Cold Nights | Days when daily low <10th percentile | days/year |
| Tropical Nights | Frequency of daily lows >20 C (68 F) | days/year |
| Frost Nights | Frequency of daily lows <0 C (32 F) | days/year |
| Growing Degree Days | Summation of daily highs above 10 C (50 F) | C*days |
| Killing Degree Days | Summation of daily highs above 29 C (68 F) [13] | C |
| Precipitation | Total precipitation | mm/year |
Table 2.
Statistics on future yield predictions, for forecasts without and with CO fertilization. Future yield change per decade are in comparison to expected yields without climate change. Monetary losses are calculated from the acres harvested and the crop prices in 2016 [46,47].
| Corn | Soybeans | Rice | ||||
|---|---|---|---|---|---|---|
| Historical yield change/decade (%) | 23.7 | 17.7 | 17.4 | |||
| Future: low emissions | no CO | with CO | no CO | with CO | no CO | with CO |
| Yield change/decade (%) | −1.77 | −1.50 | −1.20 | +0.002 | −0.367 | 0.860 |
| Projected yield diff to steady climate (%) | 87.9 | 90.0 | 92.3 | 101 | 98.6 | 108 |
| Monetary loss or gain (billion 2019 US$) | −12.7 | −10.5 | −5.00 | +0.717 | −0.343 | +1.99 |
| Future: high emissions | no CO | with CO | no CO | with CO | no CO | with CO |
| Yield change/decade (%) | −3.78 | −3.41 | −2.40 | 0.96 | −0.830 | 3.09 |
| Projected yield diff to steady climate (%) | 76.8 | 80.0 | 84.6 | 111 | 95.7 | 126 |
| Monetary loss or gain (billion 2019 US$) | −24.3 | −21.0 | −10.0 | +7.29 | −1.06 | +6.42 |
© 2019 by the author. Licensee MDPI, Basel, Switzerland. This article is an open access article distributed under the terms and conditions of the Creative Commons Attribution (CC BY) license (http://creativecommons.org/licenses/by/4.0/).
Share and Cite
MDPI and ACS Style
Petersen, L.K. Impact of Climate Change on Twenty-First Century Crop Yields in the U.S. Climate 2019, 7, 40. https://0-doi-org.brum.beds.ac.uk/10.3390/cli7030040
AMA Style
Petersen LK. Impact of Climate Change on Twenty-First Century Crop Yields in the U.S. Climate. 2019; 7(3):40. https://0-doi-org.brum.beds.ac.uk/10.3390/cli7030040
Chicago/Turabian StylePetersen, Lillian Kay. 2019. "Impact of Climate Change on Twenty-First Century Crop Yields in the U.S." Climate 7, no. 3: 40. https://0-doi-org.brum.beds.ac.uk/10.3390/cli7030040
Note that from the first issue of 2016, this journal uses article numbers instead of page numbers. See further details here.