Information for Adaptation and Response to Flooding, Multi-Stakeholder Perspectives in Nigeria

1
Department of Architecture and the Built Environment, University of the West of England, Coldharbour Lane, Bristol BS16 1QY, UK
2
Department of Geography, York St John University, Lord Mayor’s Walk, York YO31 7EX, UK
3
Department of Geography, University of Ibadan, Ibadan, Oyo State, Nigeria
4
Department of Geography, University of Calabar, Leopard Town Rd, Leopard Town, Calabar, Nigeria
5
Urban Base Consulting, 37 Suez Crescent, Wuse Zone 4, Abuja FCT, Nigeria
*
Author to whom correspondence should be addressed.
Climate 2019, 7(4), 46; https://0-doi-org.brum.beds.ac.uk/10.3390/cli7040046
Submission received: 10 March 2019
/
Revised: 25 March 2019
/
Accepted: 25 March 2019
/
Published: 29 March 2019
(This article belongs to the Special Issue Climate Services for Local Disaster Risk Reduction in Africa)
Abstract
:Provision of data and information for disaster risk reduction is increasingly important to enable resilience. However, the focus of provision in many African countries is limited to national scale risk assessment and meteorological data. The research aimed to consider the perspectives on availability and access to information of different local urban actors that require reliable and specific information to make informed decisions. The research used workshop discussions and questionnaires to collect views from stakeholders in flood risk management in Nigerian cities about their current access to information and requirements. The results confirmed that stakeholders and communities agree in recognising the importance of climate information. Findings identified issues surrounding communication between agencies, government and technical experts. The role of the media and business in filling the vacuum left by state provision of information was further highlighted, demonstrating the potential for Private Public Partnerships in supporting adaptation and response to flooding. However, significant differences in access between sub-groups were also revealed such that some marginalised groups may be excluded from information. It follows that climate services, data and information provision need to be collaboratively designed in order to be more inclusive, meet user requirements and build community capacity.
1. Introduction
Local flood risk management depends on the provision of appropriate data and information to multiple stakeholders that need to take preventative and recovery actions [1]. Data and information may be delivered through a variety of platforms and different sources which inform actors with the expectation that they will act on the information and be better prepared [2]. Two commonly supplied information types are emergency warnings and risk awareness [3]. These have distinct purposes as appropriate for their situation in different phases of the disaster cycle, response and preparedness, respectively. The effectiveness of these two information types in disaster risk reduction is highly interdependent as awareness is a pre-requisite for action on receipt of warning information. More importantly, knowledge of appropriate risk reduction strategies must accompany awareness for the most appropriate actions to be taken [4].
Furthermore, different stakeholders require data at varying levels of detail, and different temporal- and spatial scales-depending on their role in risk reduction. Each actor perceives their need differently and may be influenced by their risk perception, preferred risk reduction strategy and expectation of quality and timeliness of available data and information. In many societies, those most vulnerable to climate hazards, such as flooding, are the urban poor particularly in developing countries [5]. In the context of a lack of formal or technical information and limited capacity, households and businesses in developing countries are disproportionately affected by flooding [6]. This means that new approaches to climate services providing flood risk information, involving data across scales and ensuring appropriate communication to end-users (households and businesses), are required if city dwellers in developing countries are to be made more resilient. To support these flood risk management goals, the research considers a broader conceptualisation of flood risk information that encompasses not just the potential national scale databases, but also those of how information is provided at the local scale.
Local communities will need more than just good information to adapt to flooding and build resilience. For households and businesses to get the most out of emergency and awareness information, there is the need to promote information provision in a manner that will be understandable and used by the recipient. The problem often is not of access, but of other factors such as the nature or the source of the information [7]. Aspects of trust in organisations and individuals that supply information can also be instrumental in delivering effective warnings and in generating preparedness [7,8,9,10]. However, trust is a complex issue, trust in risk management authorities may encourage some preparedness activities (evacuation) while discouraging others (property level resilience). In addition, trust is a highly individual and subjective phenomenon [11], unlikely to be uniform across different recipients of the same information from the same source.
While emergency warning and risk awareness information at the local scale, such as household and businesses, may have considerable impacts on risk reduction, it is often unclear how to address the need and importance of intermediaries in collating data and communicating information. Traditionally, disaster information is often seen as from the government and transmitted through the mainstream media. However, today with the multiplicity of actors in flood management and improvement in information technology other providers and sources are emerging. Communities may rely on both formal sources such as government departments and informal sources such as neighbours. While some attention has been paid to flood risk communication internationally, there are very few studies in Africa [9].
Studies of flood management in the Sub-Saharan Africa region have highlighted the lack of, or paucity of relevant data that may be needed for example to identify risk factors [12,13]. Most of the countries do not have national databases [14], although data exist for major disasters in global databases, such as EM-DAT from the Centre of Research on Epidemiology of Disasters and UNISDR DesInventar databases. According to Osuteye et al. [12], the data on sub-Saharan Africa is too sparse to understand or make any reasonable connection or build trends to support flood management. Such information, if available, would assist decision-makers to make more informed and location-specific choices about flood risk management. It therefore becomes instructive to understand the opportunities and challenges and how stakeholders in these societies are responding to calls to enhance flood management data, information and knowledge.
More specifically, in Nigeria there is currently no database that organises key information on flooding either at a national or sub-national level. There are only records of selected recent floods which are by no means complete [15]. In Nigeria, the lack of information and awareness is noted and general calls for improvement in awareness are made [16]. Studies also call for improved large data sets needed for information in terms of modelling and improvements in reliability and integration [17] for decision making at the national or regional scale. While these are important aspects of risk management, there is also a need to consider risk communication if the information is to be used effectively.
In the Nigerian context, specific knowledge of the requirements of stakeholders and communities is lacking. Little scientific attention has been given to understand how households and businesses acquire climate hazard information and the media they use. The majority of studies of climate risk are based on serving the needs of rural farming communities (see for example References [18,19]). For Lagos, a body of research has documented community, household and individual level flood management strategies (see Reference [17,20]). However, no study has considered a wide range of stakeholders simultaneously.
Such an understanding could inform a more targeted strategy for flood emergency warning and risk awareness and thereby foster planning and learning for enhanced resilience. Recognising that information-source organisations are not necessarily the information providers to the wider stakeholder community, decision makers can use such an understanding to identify appropriate sources for dissemination. Moreover, understanding any intra-group peculiarities within apparently homogenous groups in the communication of flood risk information is immensely valuable.
Given that there is very little available research on risk information for Nigerian urban populations outside of Lagos, and none that takes a multi-stakeholder view in a given city, the role of information in response and adaptation was explored in two smaller Nigerian cities as part of a wider study in climate resilience. The research sought insight on the perceived adequacy and usefulness of available data and information and the communication of information between stakeholders including the preferences of communities at risk. It also examined the level of provision of climate hazard information, either as warning or about what to do in the case of climate hazard. Data was collected from stakeholders, households and small businesses to shed light on the differences between the different actors. Attention was given to (i) understanding sources through which households and businesses receive information, (ii) assessing the level of trust of these sources and (iii) understanding local community’s preferred medium to receive climate hazard information.
2. Materials and Methods
2.1. Study Sites
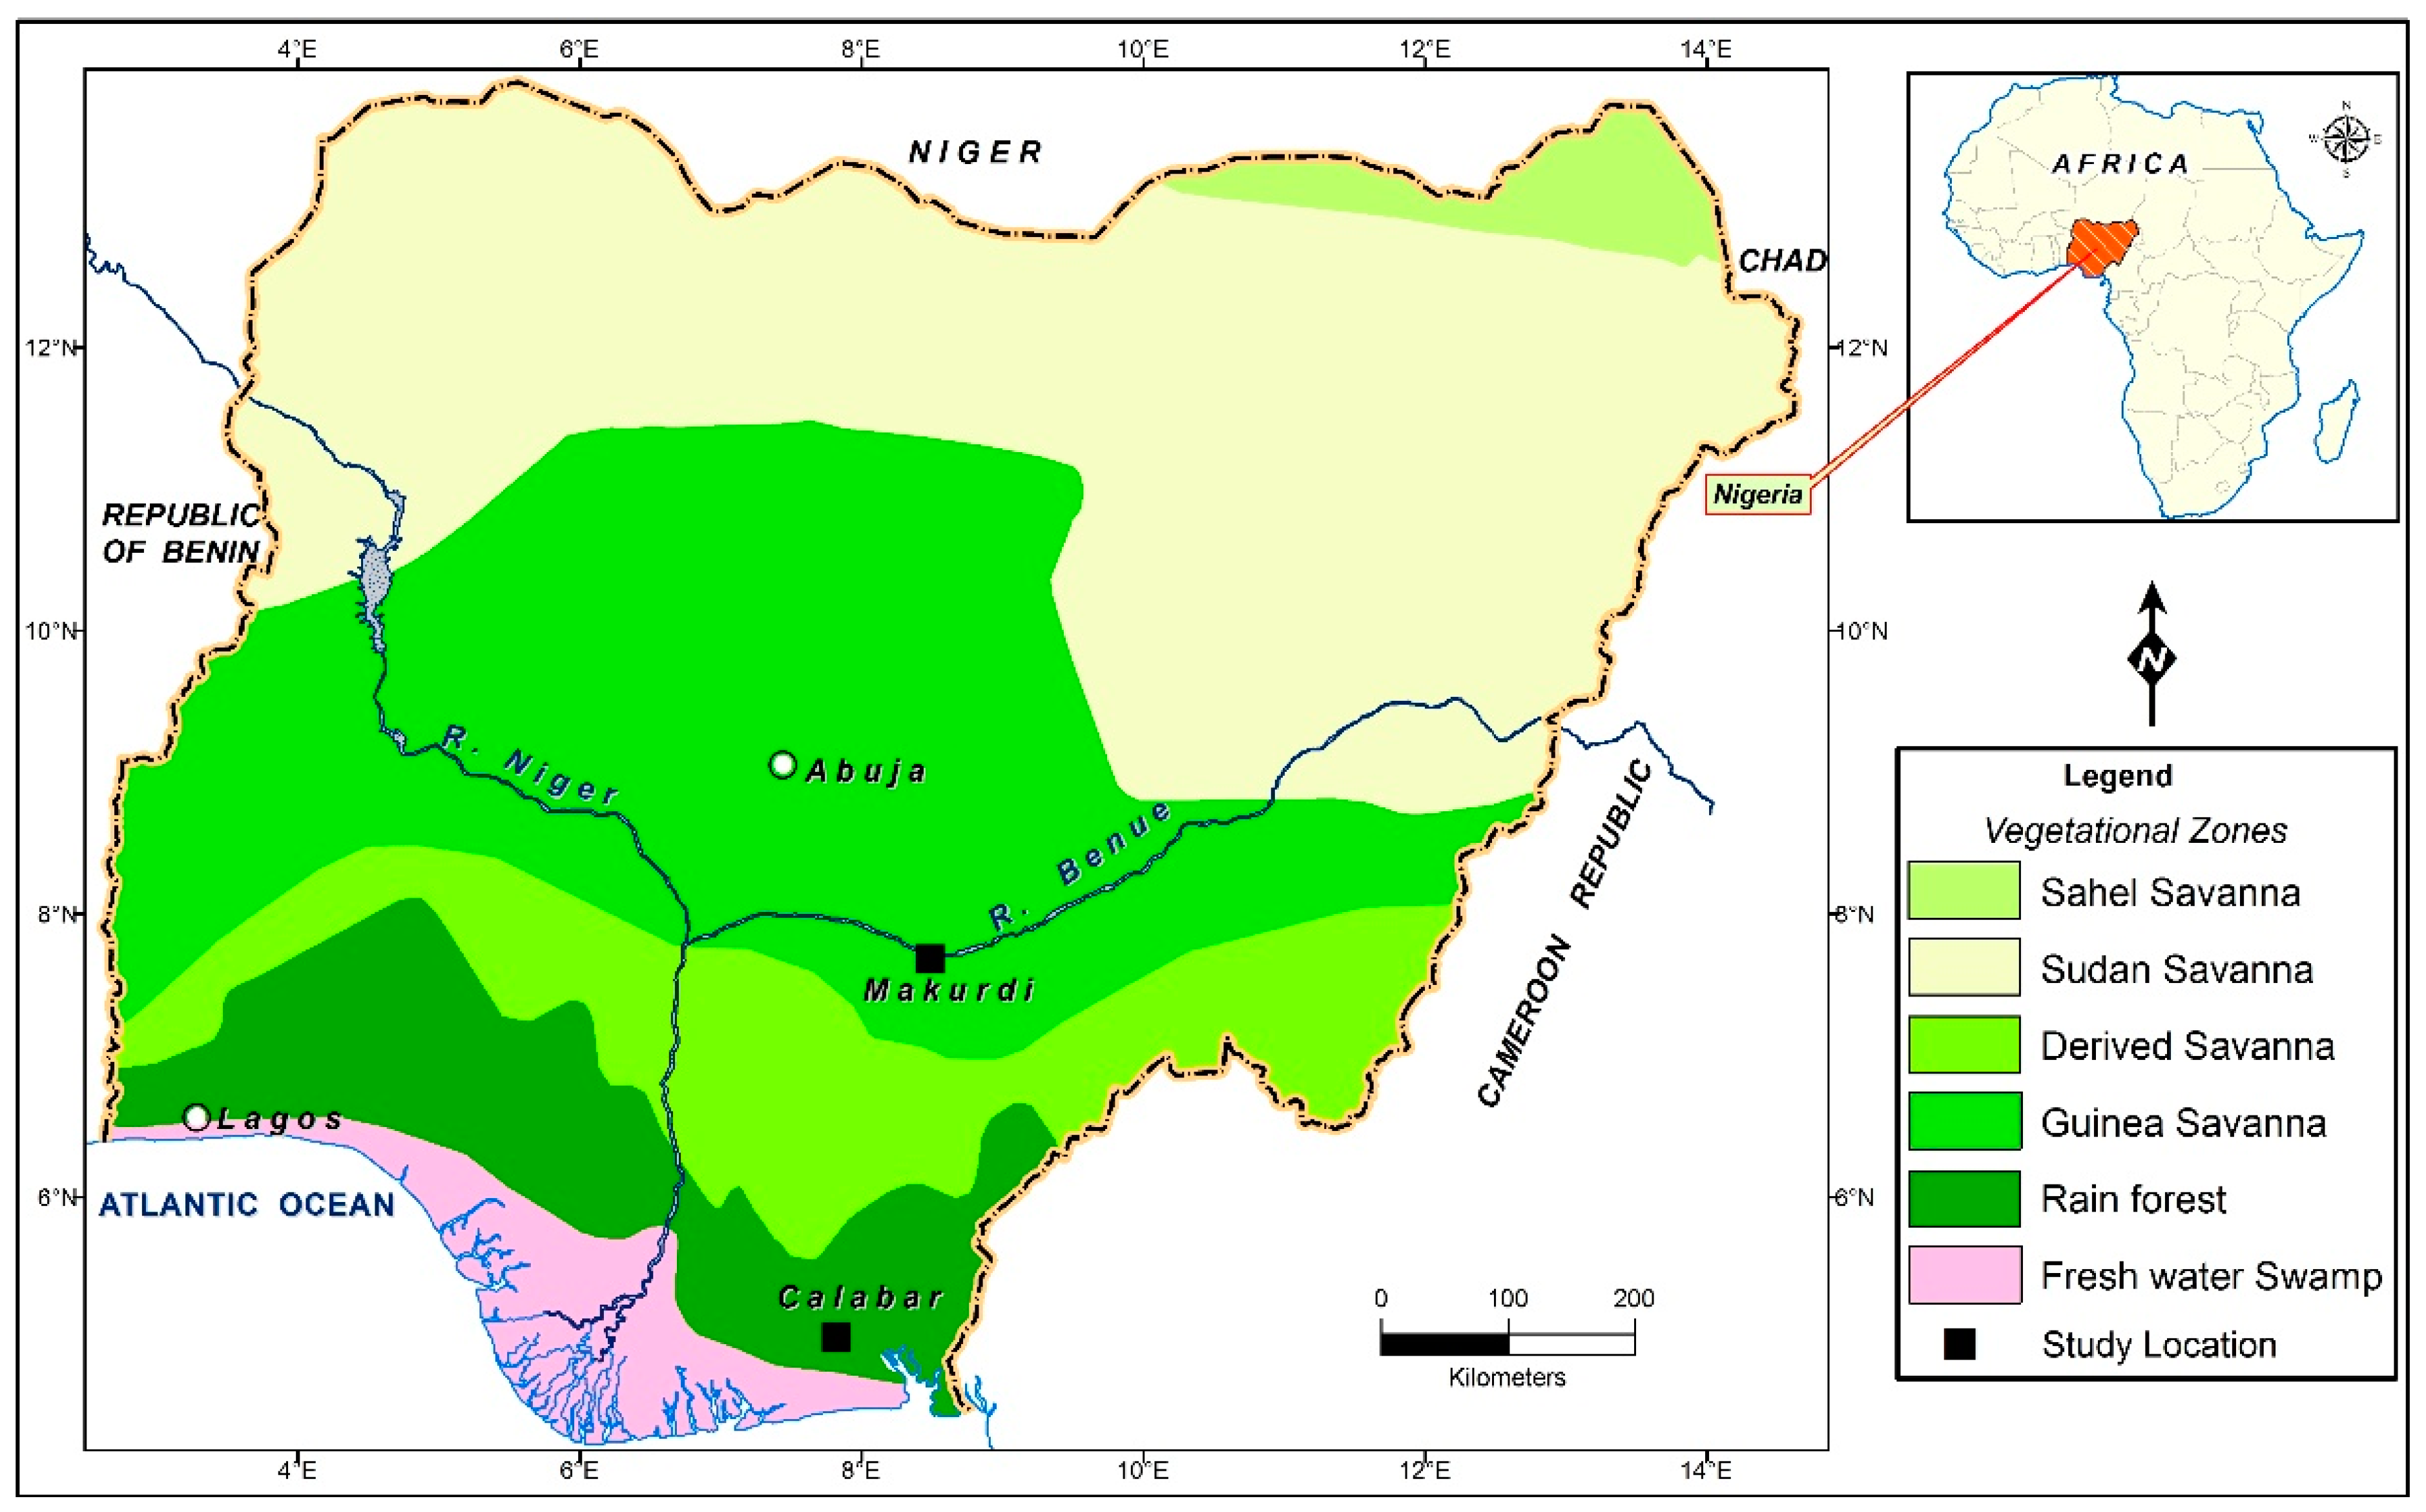
The study focussed on two medium-sized Nigerian cities in two ecological zones, Calabar and Makurdi, one each from the two broad belts of vegetation types (forest zone and savannah zone) in Nigeria (see Figure 1). They are also at risk from multiple climate hazards including flooding, extreme heat, drought and windstorm.
The sites were selected purposively from a long list of medium-sized cities in Nigeria to be: cities at risk from coastal or fluvial risks in addition to the ever present pluvial flood risk; and cities that have experienced recent large flood incidents. Both are state capitals (capital cities) with populations less than one million and are centres of administration, commerce and economic activities (See Table 1 for the site characteristics). The city of Calabar, in the forest zone, has a population of about 600,000 and comprises two LGAs (Calabar Municipal and Calabar South). There are 12 wards in Calabar South and 10 wards in Calabar Municipal. The residents are predominantly of the Efik tribe and are largely Christians. Makurdi, located in the Savanah zone and along the Benue River with a population of 500,000, consist of 11 administrative wards. The people are predominantly of the Tiv tribe and are largely Christians.
2.2. Data Collection
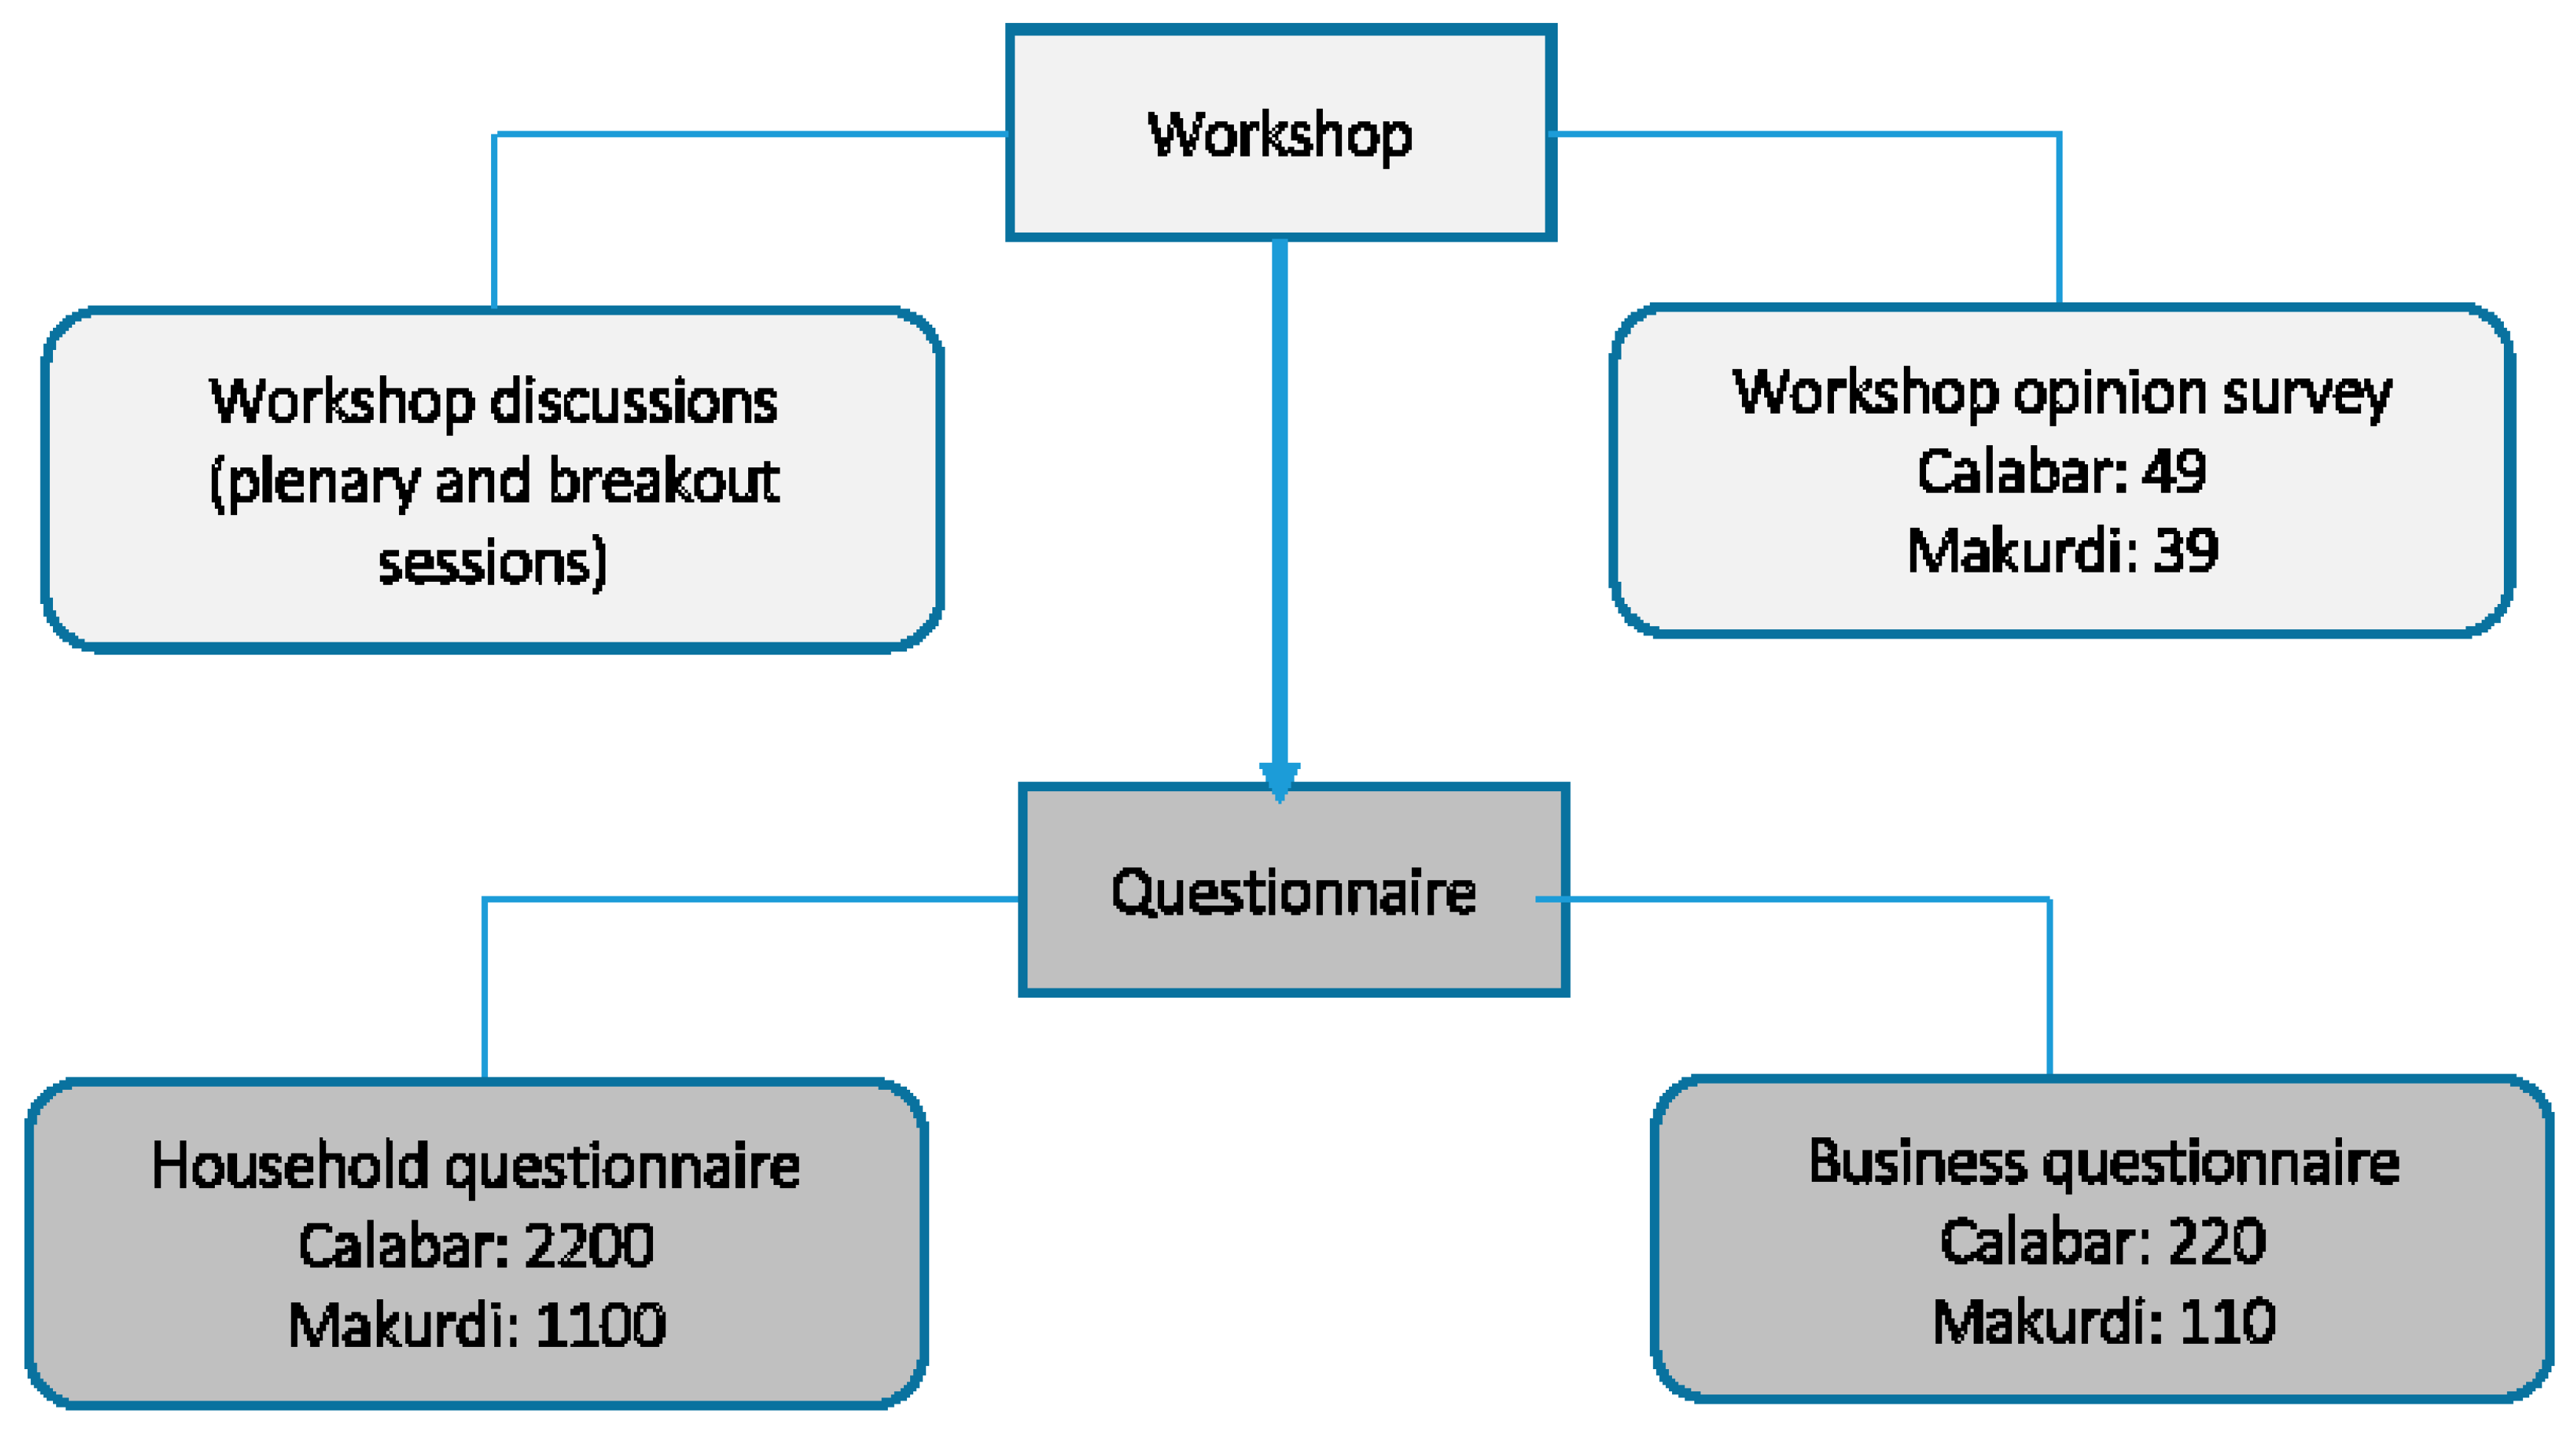
The study used a combination of workshops and purposely designed questionnaires to elicit information from a range of stakeholders. Opinions were sought on the provision and use of information in managing climate hazards in general and on flood risk specifically. Figure 2 summarises the data collection process.
Stakeholder workshops were held in Makurdi and Calabar (one workshop in each city) in June 2016 to understand the capacities and vulnerabilities of stakeholders. The workshops provided the opportunity to understand key issues through a combination of plenary discussions, break out discussions and feedback sessions around key themes (data collected through notes and flipcharts) and also to collect an opinion survey designed to collect perceptions of individual attendees. While discussions were highly valuable in understanding the collective views and dominant issues, the collection of individual views via an anonymous survey was considered important in order to quantify perceptions for comparison with community views and to allow individuals to express differences from the collective view, minimising peer influence or desirability bias. Participants (shown in Table 2) were drawn from a wide range of organisational stakeholders in the decision-making arena including academics, government, media, traditional institution, military and non-governmental organisations. Organisations identified through initial stakeholder mapping were invited to identify representatives to participate in the workshop. Individuals were also identified through the knowledge of local academic partners. In Calabar, participants were academic (14); Business (3); Government (29); NGO (13); and Media (3). Participants at Makurdi workshop are academic (12); Business (11); Government (24); NGO (7); Media (1); Military (1) and Traditional (2). Participants discussed among other things the strategies currently adopted to manage climate hazards and the information needed to make communities and infrastructure resilient and where this information can be sourced. Of the 58 participants at the first stakeholder workshop in Makurdi, 38 workshop opinion surveys were returned: academic (10), business (3), government (19), NGO (3), community leaders (2) and others (2). In Calabar, of the 62 participants, 49 workshop opinion surveys were returned: academic (11), NGO (11), business (2), government (18) and 7 others, who did not indicate their stakeholder affiliation. Personal data of workshop participants were not collected. The findings from the stakeholder workshops were used in facilitating the design of the household and business survey which was then the next stage of data collection. Some of the options provided in the closed ended questionnaires were identified during the workshops.
Questionnaire survey instruments were designed and administered on households and small-scale businesses in the two case study cities in October/November 2016. The survey was administered face to face by trained research assistants who were able to clarify any unfamiliar terms to households and small businesses. The questionnaire had three main sections that contained a mixture of question types including closed selection, ranking and Likert scale. Section A elicited a set of demographic data from the respondents; section B focused on respondent’s views of climatic hazards generally, including impacts, preferred adaptation approaches and sources of climate hazard information. Section C explored coping strategies specific to flooding, extreme heat and windstorm
The administration of the structured questionnaires used a stratified systematic sampling strategy stratified on a ward basis in both study sites and visiting every nth household or business (n calculated based on the estimated number of households per ward). A total of 330 business questionnaires (110 from the 11 wards in Makurdi and 220 from the 22 wards in Calabar) and 3300 household questionnaires (1100 from the 11 wards in Makurdi and 2200 from the 22 wards in Calabar) were collected. The resulting sample characteristics are summarised in the next section.
2.3. Characteristic of Questionnaire Survey Respondents
The average age of household heads is 43.7 years (46.5 years in Makurdi and 44.4 years in Calabar). The average household monthly income amounted to N 105,000 ($333) (at average 2016 exchange rate of $US1 = 315 Naira (N)). This is higher for Makurdi households at $390 than households in Calabar for which average monthly income is about $305. In Calabar, 93% of the respondents are Christians (3.4% Muslims), while in Makurdi, 80% are Christians (17.4% Muslims). There was a mix of business types covered in the survey, with 14.8% of respondents engaged in mechanic or car and other machinery spare part business, 15.5% in restaurant and fast food, 13.3% tailoring; 8.5% construction; 9.1% electronics; 8.8% hair dressing including barbing; 7.0% furniture; 3.0% cleaning including dry cleaning and another 20.03% who indicated others, the majority of whom are retailers trading in general household provisions (groceries) (see Table 3).
2.4. Data Analysis
Analysis of the quantitative data was undertaken through Excel and statistical software SPSS version 25. The data were categorical (both nominal and ordinal) with no purely numerical (continuous data) questions. Accordingly, ranking and descriptive frequencies are presented with some non-parametric tests for equivalence of means.
Where ranking questions were asked (either in the opinion survey or the questionnaire), participants selected and ranked their top three choices from a list. To identify the overall order, the ranked mean rank (RMR) is computed (Equation (1)) [25].
where: a is the number of respondents ranking an option as the least ranked of the selected options, b is the number ranking an option as the middle ranked of the selected options, c is the number of respondents ranking an option as the highest ranked of the selected options and n is the total number of respondents in this category.
The options were then ordered by RMR and final ranking assigned based on their position in this list.
Non-parametric tests were used to check for significant differences between groups of households based on demographic characteristics. The Mann-Whitney U test is employed where there are two independent groups and the Kruskal-Wallis one-way non-parametric Analysis of Variance test is used to test where more than two groups are present. Both these tests are suitable to apply for nominal and ordinal independent variables on ordinal dependent variables. The qualitative data was collated under themes and analysed through traditional text analysis (TTA) [26].
Full ethics approval was sought and granted for this study (UWE FREC/FET.16.08.001). Informed consent was given by all participants. Participants were notified that they could withdraw at any point of the study. The data reported in this paper represent a subset of data collected through the workshop discussions, the opinion survey and the questionnaires (as part of the wider study on resilience) that relate to information services, their availability, their importance in adaptive behaviours and the preferences of communities in receiving such information and their suggestions for improvement.
3. Results
The results of the workshop discussions, opinion survey and household and business questionnaire are presented below under five themes related to the study objectives.
3.1. Information for Better Hazard Management and Governance
Stakeholders at the workshops agreed in discussion that information is critical for better management of hazards and perceived the need for more data and information on climate and weather (temperature, rainfall and wind), and physical and environmental conditions (river hydrology, land degradation, soils, land use) to inform hazard mapping. Furthermore, they recognised the need to combine this environmental information with data on socio-economic and preparedness data. There are national agencies that hold national and local climate data, and participants felt confident that this information could be sourced locally, although very few examples of actual data access and use were cited either in the discussion or in the opinion survey; the availability of detailed environmental, social and preparedness data to create hazard and risk maps was seen as more problematic with nearly 80% of respondents calling for more information in the opinion survey. Projections of the impact of changing climates and urban growth are considered as not available with further information on climate uncertainties called for by 90% of respondents.
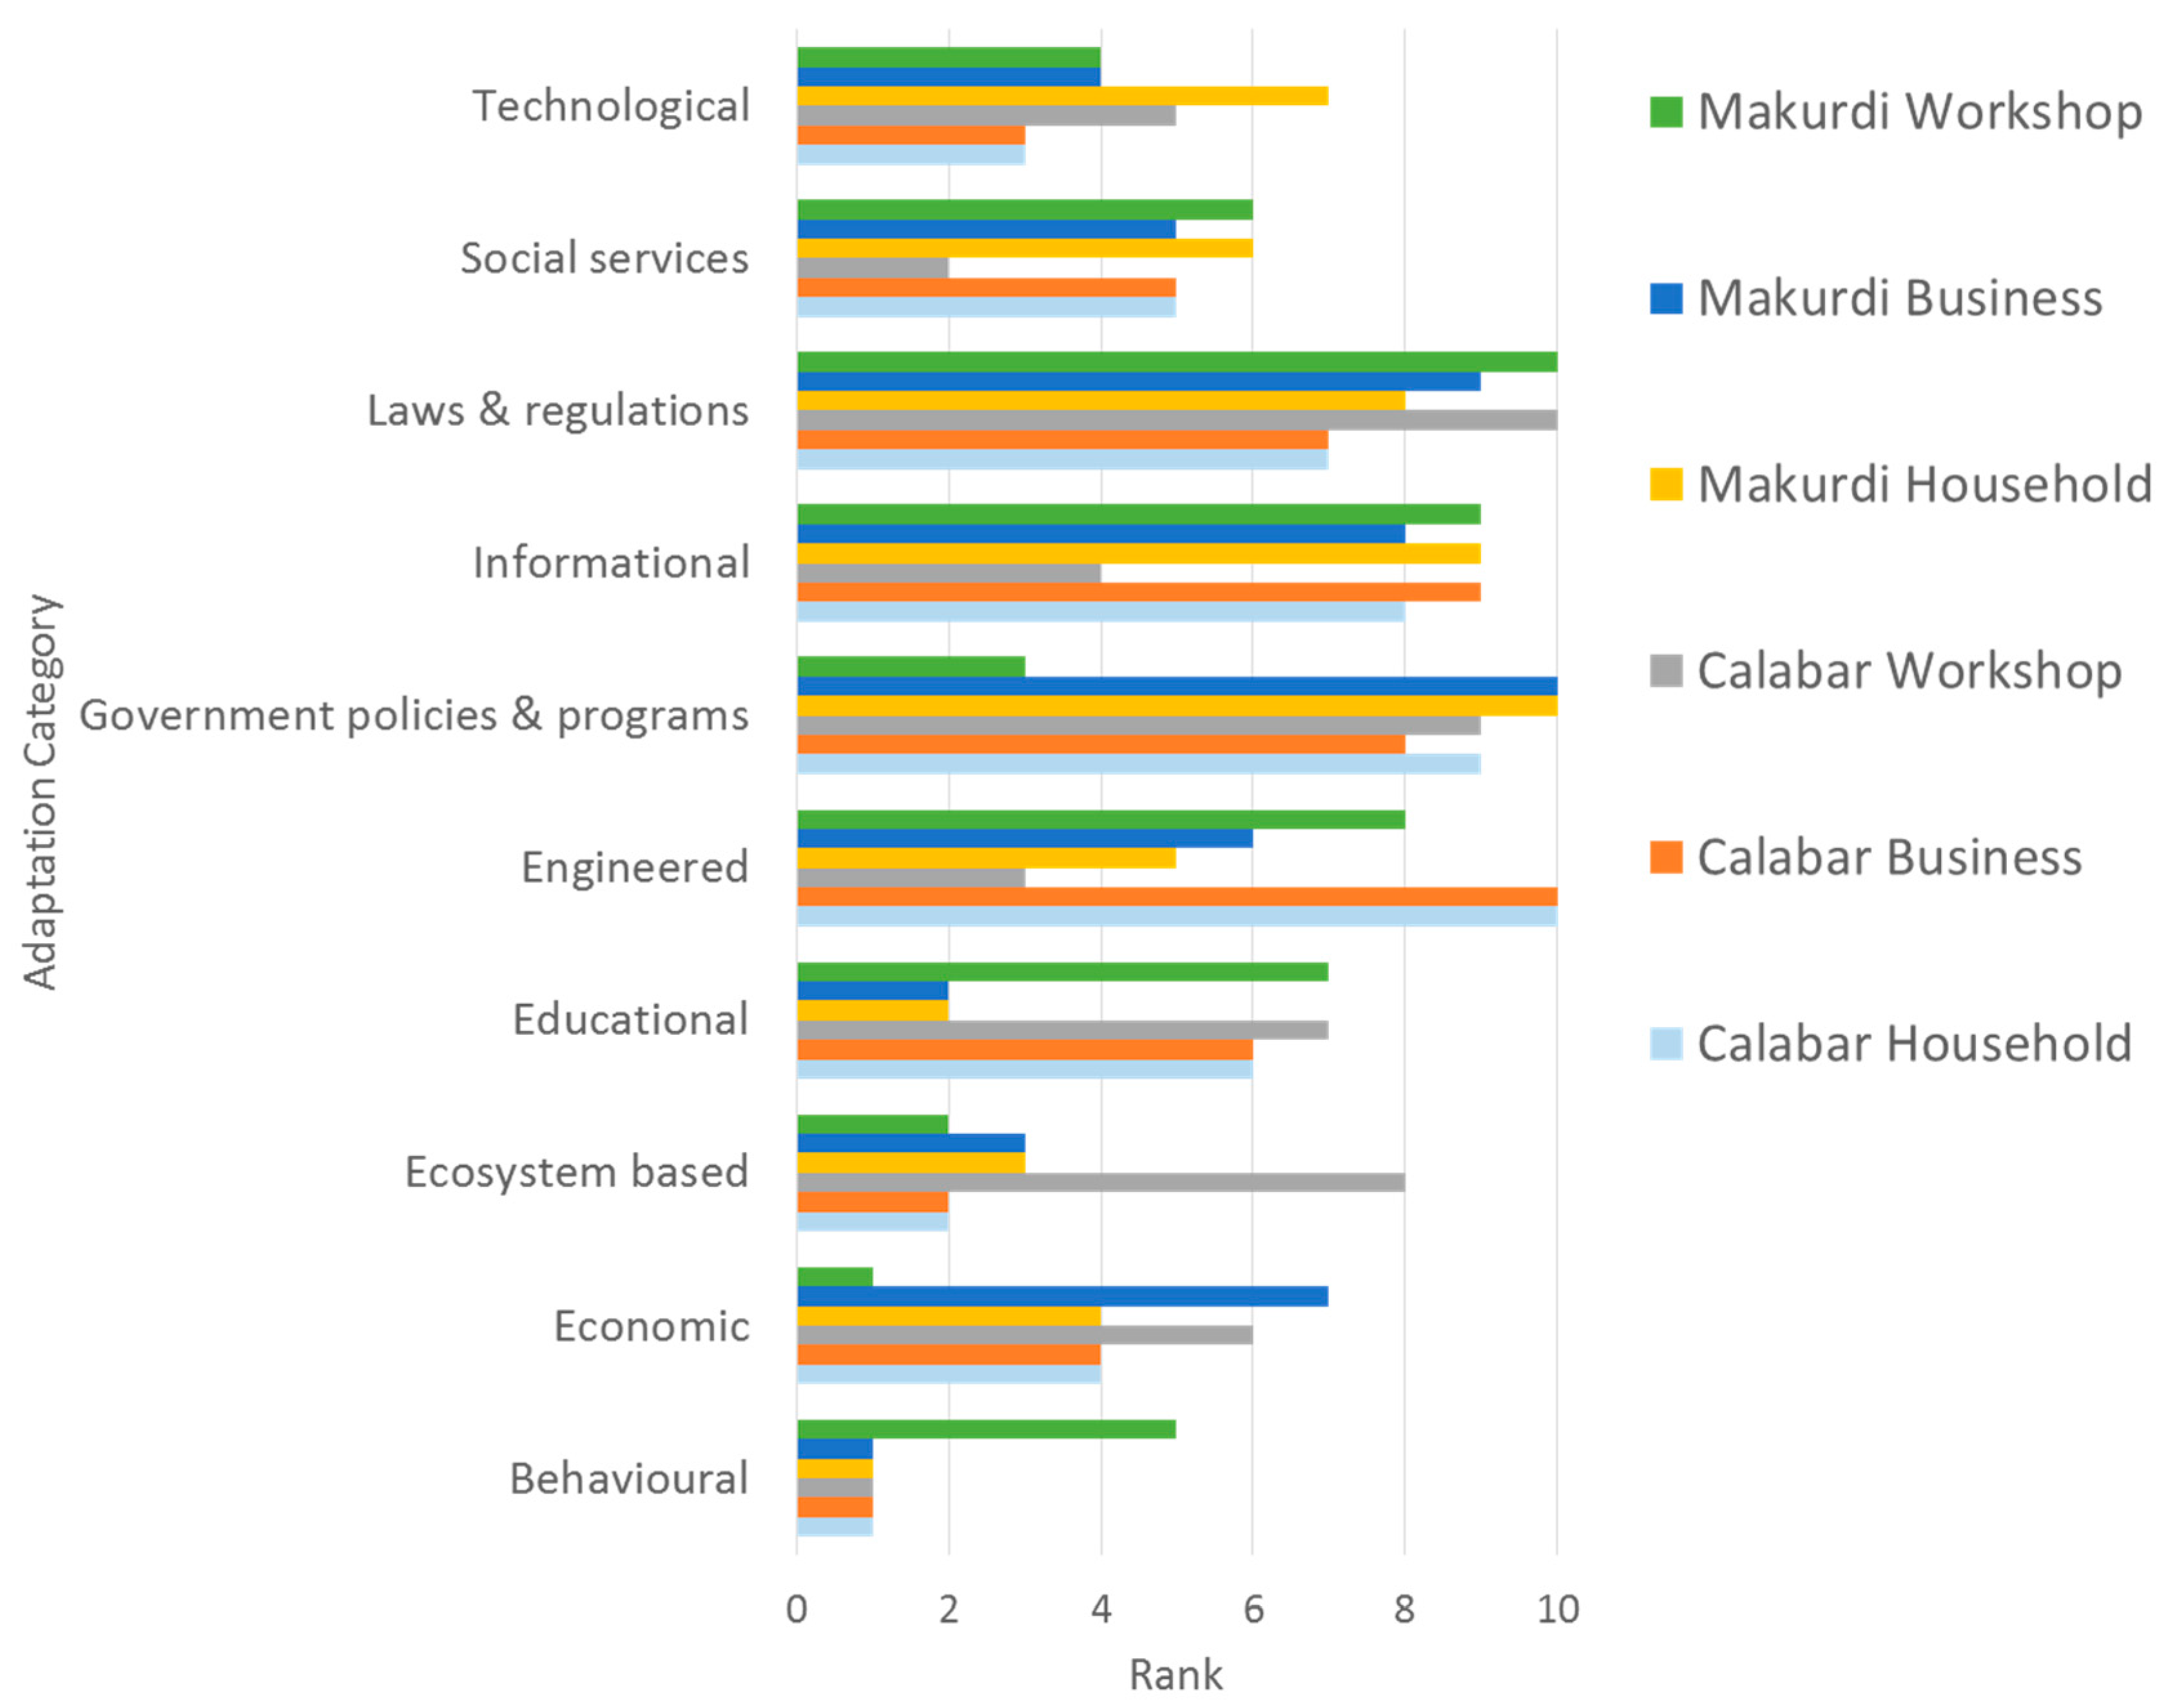
Aside from data requirements, the skills required to provide information and knowledge from the available data were perceived to be lacking in relevant agencies. Stakeholders recognised in the discussion that adaptation strategies such as laws and regulations, informational approaches and even engineered approaches require detailed hazard and vulnerability information. Through the opinion survey, they also ranked these approaches as important as shown in Figure 3. Individuals were confident in their own ability to manage data and information in their current prescribed roles with almost 60% of the opinion survey respondents having high confidence in understanding probabilities and over 80% understanding risk assessment in both cities. However, more training and greater expertise was called for in general to support adaptation including climate change mitigation and adaptation; GIS skills and impact assessment; and understanding the links between waste management, drainage and hazards, emergency management and response, forecast and early warning, environmental communication and enlightenment, United Nations frameworks, and solar and clean energy technology.
The paucity of data and skills is seen to be compounded by the lack of synergy between departments within government and between government and other agencies and individuals. In the Makurdi opinion survey, only 17% and in the Calabar opinion survey, only 25% of respondents felt there was adequate exchange and interaction among stakeholders. Participants felt that available data and skills are not always exploited or sufficiently joined up. For example, the states do not have ongoing contact with the relevant agency, the National Space Research and Development Agency (NSRDA), a Federal agency responsible for Nigeria satellites and warehouse for the nation’s geospatial data useful for managing disaster preparedness and response [27]. Additionally, the planning review committees are perceived by some as lacking in technical planning expertise and being overly political. Furthermore, communities are rarely consulted. Therefore, both experts and lay voices outside the existing relevant governance structures may be ignored.
Households and businesses also ranked adaptation categories during the questionnaire survey. These responses reinforced the relative importance of information. While there are differences as to the main approach to be used, informational approaches are generally highly ranked by households and businesses. Laws and regulations and government policies (highly dependent on climate information for planning and enforcement) are also highly ranked (Figure 3).
Given the perceptions of stakeholders that more data and information is required to properly plan, manage, adapt and respond to hazards in Nigeria (as expressed in the workshop discussions and opinion survey), workshop participants in discussion suggested that, at the moment, there is little in the way of educating households and businesses on ways to adapt to climate-related hazards. They believe people are resorting to self-help which may be even more damaging and ineffective. The next section explores the provision of information in more detail from the perspective of households and communities.
3.2. Receipt of Information on Hazards and Adaptation for Communities (Households and Businesses)
In terms of the information supply for communities in Calabar and Makurdi, the questionnaires revealed that receiving information was not a universal experience. Households and businesses were asked to report whether they had received climate hazard information in the last 12 months. Less than 60% reported receiving information in any community. There was also significant variability observed between the cities and between the different communities within them.
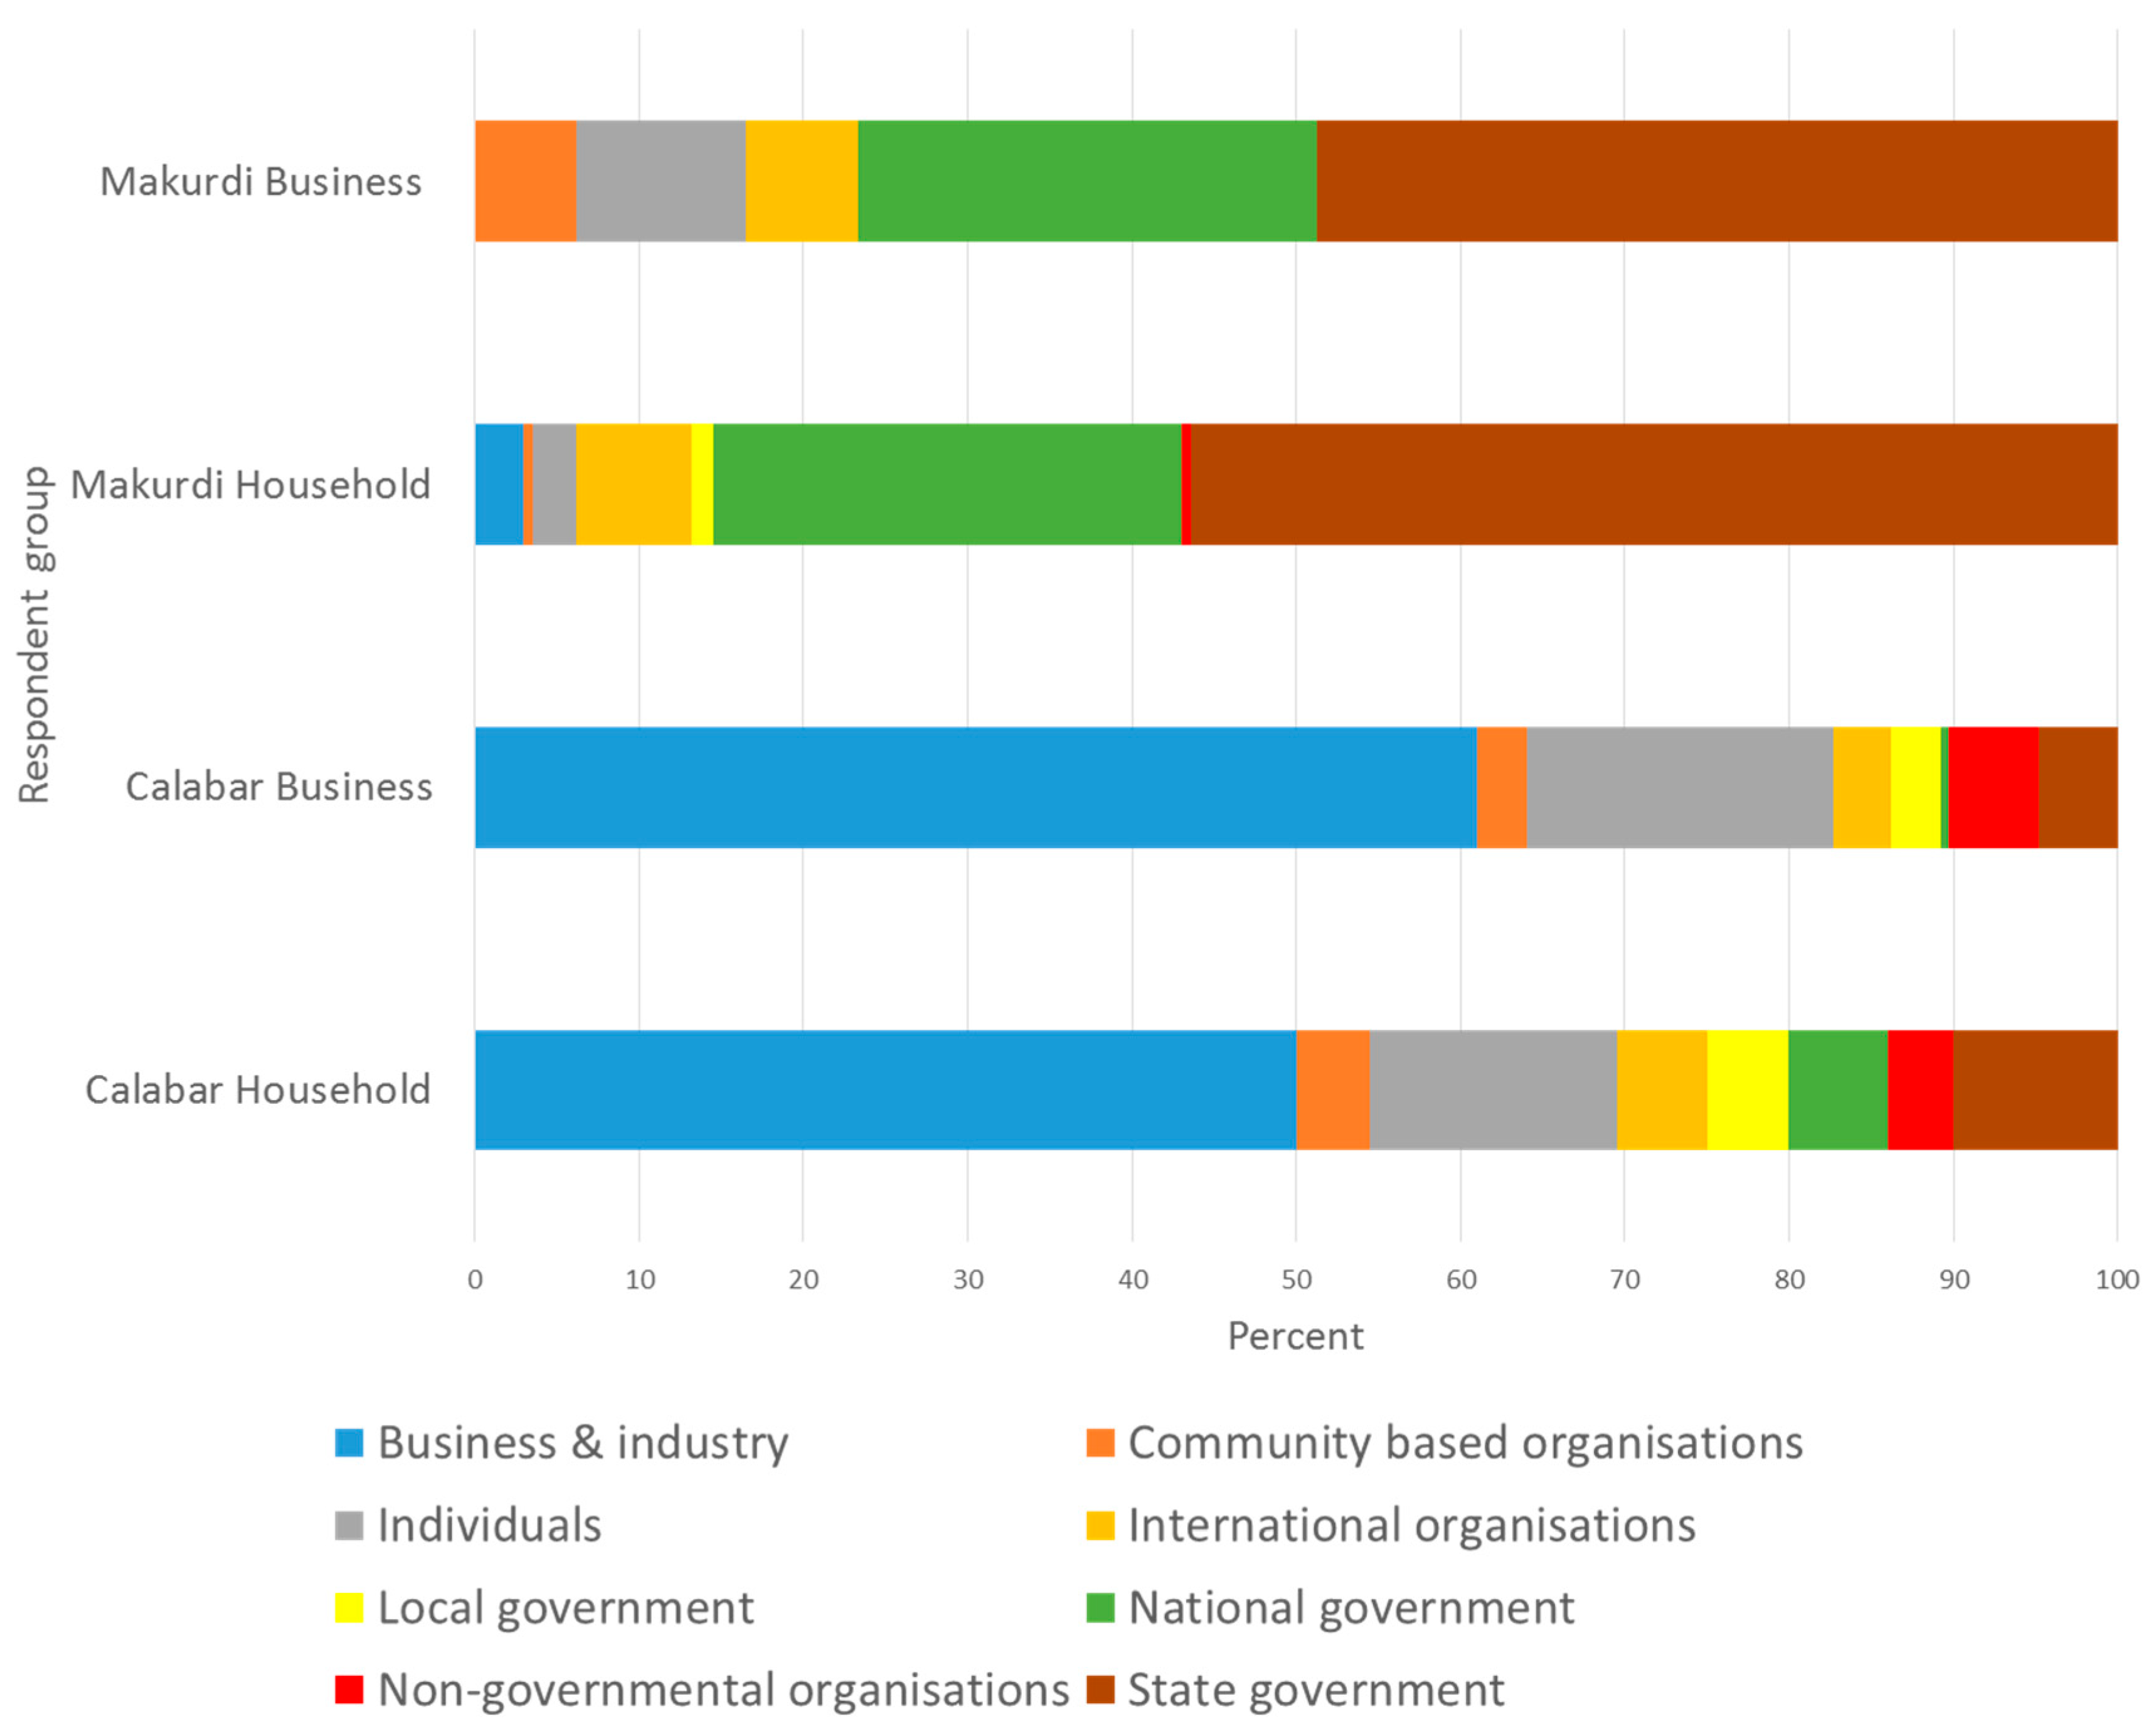
Businesses and households in Calabar were more likely to have received climate hazard information in the last 12 months (58.2% of households and 49.5% of businesses) than in Makurdi (27.4% households and 26.4% businesses). Information sourced from business and industry, including the media, may be part of the explanation for this discrepancy since this is the main source of information in Calabar as opposed to government information in Makurdi for both households and businesses (see Figure 4).
The influence of household characteristics both on the receipt of information and the preferences of households for mode and source of information was explored through the household questionnaire data. This analysis suggests that in general demographic characteristics have a greater association with perceptions of and access to information in Makurdi than in Calabar.
In Calabar, income had a small but statistically significant association with the receipt of information (4% less received information in low income households) as indicated in Table 4. However, in Makurdi, those with lower than average income were much less likely to have received information. Only 6.8% of low income households have received information compared to 34.1% of higher income households. Coupled with the fact that, in general, households in Makurdi were less likely to receive information than those in Calabar, further investigation into the source of such information appears to be important.
Differences between households include the larger contribution of business and industry to information provision in Calabar regardless of income level; most provision in Makurdi is governmental with a small amount from international organisations. There is almost a complete absence of receipt of community-based provision of information in Makurdi, with low income households in Makurdi receiving no information except that from business and industry, and national and state government.
The gender of the head of household has very little impact on the likelihood of receiving information; although slightly more female headed households received information (6% in Makurdi, 1% in Calabar), this is not a statistically significant difference.
Age had a small but statistically significant association with receipt of information (Makurdi, Kruskall-Wallis significant at 5%, Calabar, Kruskall-Wallis significant at 1%). Those with a head of household in the dependent age group were less likely than others to have received information (lower by 9% in Makurdi and 2% in Calabar). Households in Makurdi with heads within the dependent age group received information from four sources only, business and industry, international organisations, national government and state government.
The more educated a household head is, the more likely that member of their household will receive climate hazard information (Kruskall-Wallis & Median test, significant at 1%). In Makurdi, 4% of those with no schooling, 9% with primary, 13% with secondary and 41% of those with educational level above secondary level have received climate hazard information. In Calabar, the educational level also made a difference with 52% of those with up to secondary level education and 63% of those with education above secondary receiving information. However, the range of sources of information was also greater for those without schooling.
There were differences by religion in terms of level and sources of information (Makurdi, Kruskall-Wallis significant at 1%, Calabar, Kruskall-Wallis significant at 1%). In Calabar and Makurdi, respondents who were Christians were in the majority. Christians were also the most likely to have received information in Makurdi but least likely in Calabar. Those with traditional religious affiliation were more likely to get their information from friends, neighbours and community sources and less likely to get information from business and industry than Christians as were Muslims.
The occupation of the head of household was also associated with differences in receipt of climate hazard information (Makurdi, Kruskall-Wallis significant at 1%, Calabar, Kruskall-Wallis significant at 1%). Agricultural workers were least likely to receive information in both Makurdi and Calabar, and health and education, public service workers and business workers were more likely to be informed.
Housing tenure does not have any major or statistically significant effect on the ability to receive climate hazard information in either site.
3.3. Preferences and Trust
The top three most trusted sources of information in Calabar are business and industry, state government and national government, respectively (for both households and business respondents). State government and national government are also in the top three in Makurdi. However, business and industry which ranked highest in Calabar was the least trusted among households in Makurdi. In Makurdi, international organisations and neighbours/individuals were more readily trusted. In Makurdi 77% and in Calabar 59% of households received the information from their most trusted organisation. Those receiving the information from organisations they trusted less would usually trust a government source above their current source. In Makurdi, the government was the main source and those receiving information from international sources also trusted that source the most. Makurdi businesses similarly relied on and trusted government information. Among Calabar households and businesses, only one third of those receiving information from friends and neighbours trusted this source the most. Those receiving information from business and media in Calabar generally trusted it (67% of households and 75% of businesses trusting it the most).
Differences in trust that relate to household income are shown in Table 5. Although those on lower incomes in Makurdi showed some tendency to trust local and neighbourhood sources more than those on higher incomes, still state or national provision was more trusted. In Calabar, the pattern in preferences related to income are less clear and are not statistically significant; state government was more trusted by lower income households. However, business and industry was most trusted.
Radio and television are the most preferred medium to receive information across cities and for both households and businesses, with radio being the top choice. The proportion is higher in Makurdi than Calabar i.e., 79.3% of households and 78.2% of businesses in Makurdi favour this medium while 56.7% of households and 62.3% of businesses in Calabar favour it. SMS/text messaging was the third most preferred medium among both groups in both sites. These differences are not statistically significant. Female heads of household were slightly more likely to prefer radio compared to males who use newspapers and digital sources. Households with dependent aged heads were most likely to prefer radio and word of mouth than those with independent aged households.
3.4. The Importance of Information for Warning and Adaptation
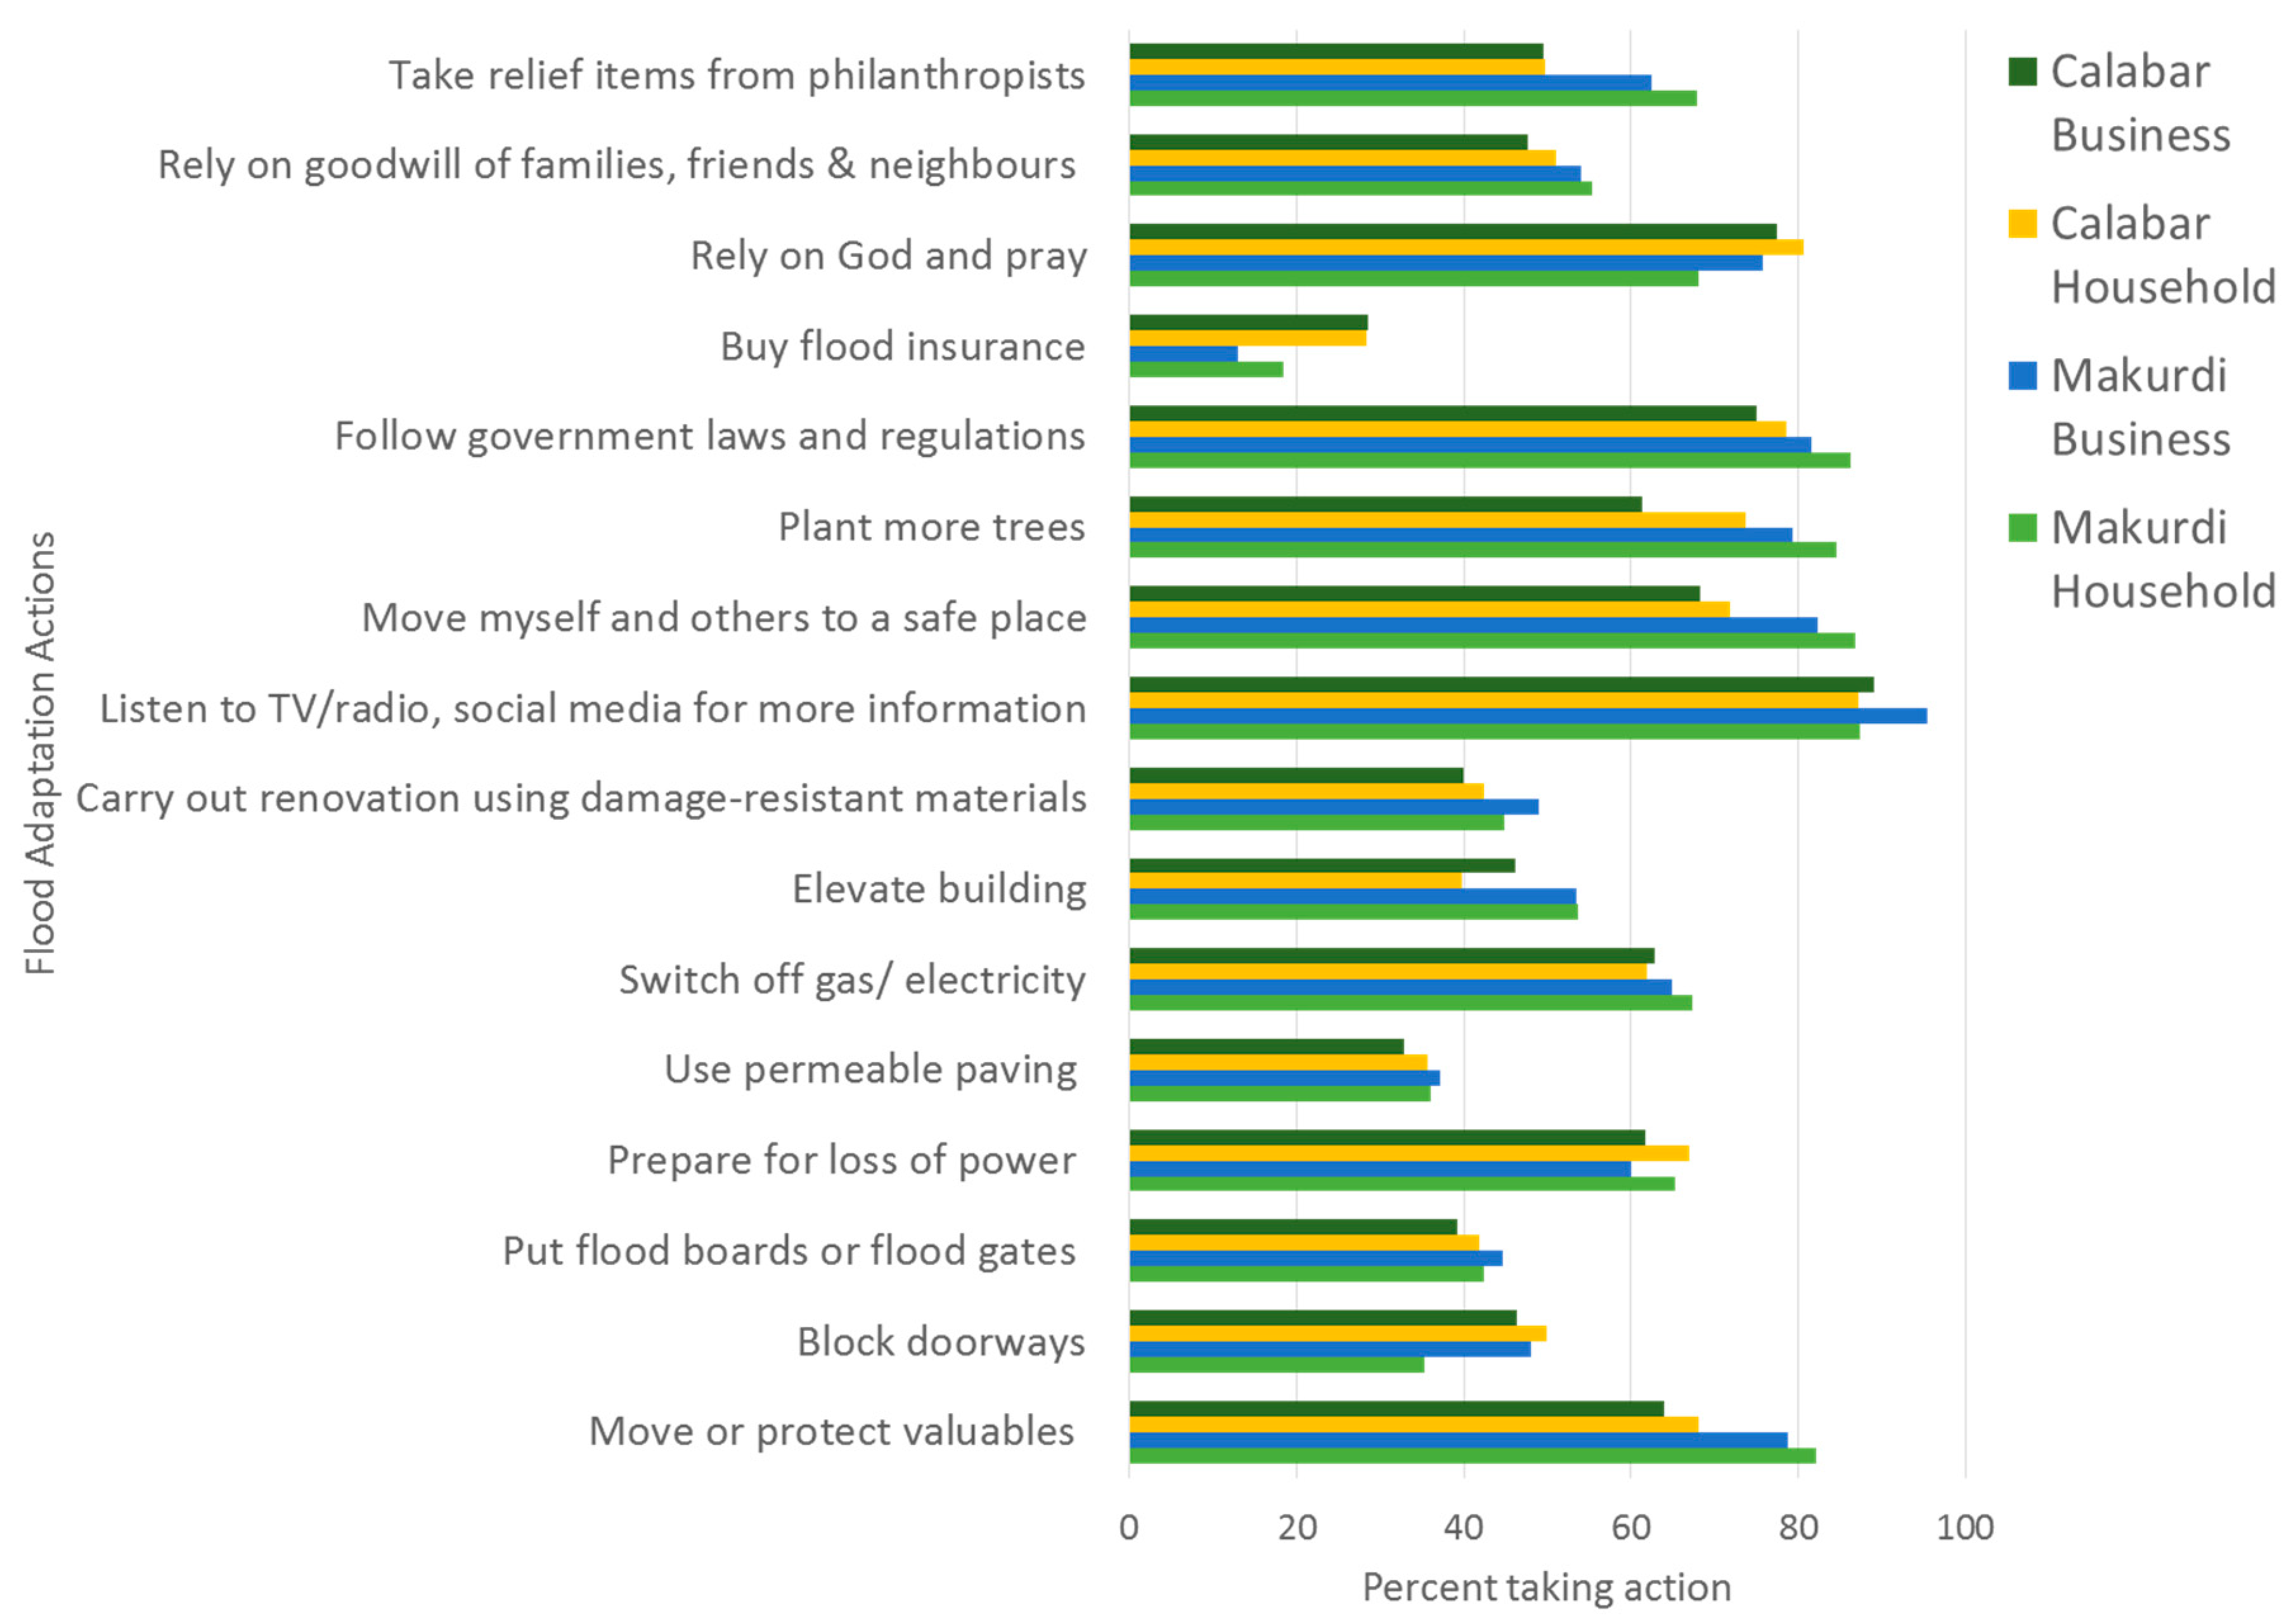
Households and businesses were asked about their coping strategies; respondents could select multiple actions from a predetermined list derived from the literature or state “other” (see Figure 5). The majority of community members indicated that they listened to media to get information and this appeared to be in order to move people and belongings to safety. They also indicated that they followed laws and regulations, another activity that relies on the provision of information such as hazard maps. To a great extent, during a hazard event, communities rely on government action in terms of provision of warnings and emergency management.
Adaptation strategies such as flood boards and elevating homes are less widely practiced although reasonably common. Coping strategies that were seen by significant numbers of households and businesses as not effective included: flood gates and barriers, and relying on the goodwill of neighbours. Ecosystems and behavioural adaptation are not selected as preferred approaches to adaptation by respondents, but planting trees was seen as a helpful strategy for flooding.
Linked to this, it is apparent that community capital and community-based resilience is low in the studied communities. Individuals take actions but do not appear to be able to rely on others for help or support; more respondents would rely on prayer than on their neighbours. These findings imply that the most economically vulnerable are likely to be least resilient since they cannot rely on social or other capital. They also reinforce the findings from the stakeholder workshops that suggest a lack of synergy and consultation is a barrier to management of climate adaptation.
3.5. Suggested Way Forward
Suggestions from the stakeholder workshops discussions to address informational gaps included the establishment of new government agencies with a mandate to provide coordination of data and information on risk management. Such data could be made widely available and subjected to validation by non-governmental experts. This was suggested to be enabled through widening participation in climate debates of stakeholder groups, professional organisations and academics during regular deliberative meetings and consultations. Increased training for professionals was also called for.
There was also a perceived need to constantly educate and sensitise residents to risk and adaptation opportunities. Many participants in the workshops believed that greater involvement of professionals in raising environmental awareness would bring in valuable skills and knowledge and that local government could establish units to encourage environmental education, manned by professionals in the field.
4. Discussion
4.1. Government Stakeholder Perspectives
It is clear from the results of the workshops and the two surveys that levels of provision and communication of information to manage the risk of flooding could be improved. The findings from stakeholders regarding the lack of adequate data largely supports previous findings by Adedeji et al. [28], Adelekan [29] and others. Currently, the reliance on information provided by the National government body (Nigerian Meteorological Agency) that is unable to provide a full range of local climate services contributes to the information gap [17]. There is a slight contradiction inherent in the survey responses from stakeholders regarding their perception that there is a capacity gap in handling information that belies their confidence in their ability to manage risk. However, this may be linked to their belief that risk management is adequate within the narrow confines of their organisational goals and expectations surfacing in response to the survey. This is in contrast with the view of risk management as ideally more integrated that was expressed during workshop discussions.
Stakeholders required information for urban land planning and management, prioritising action to strengthen preparedness and for response to emergencies. However, preparedness activities were less prevalent in discussion than the prevention and response activities. This accords with findings from media discourse [15]. Stakeholders’ view was also borne out by the household and business surveys that implied a shortfall of communication of information to households and businesses by governmental and non-governmental sources.
4.2. Understanding Community Needs and Preferences
The results of the household surveys concur broadly with previous surveys of households at risk from flooding in Nigeria with regard to preferred adaptation strategies, for example, in preferring structural approaches, government intervention and regulation and low reliance on insurance, ecosystem and behavioural responses [17]. These factors were also somewhat similar between the two cities in this study. New insights have helped in understanding the differences between communities in their current receipt of information and their trust and preferences. The finding that some more vulnerable groups such as lower income or less educated households differ not only in their receipt of information but also their preferences accords with other international studies [7,24]. An understanding of user needs is acknowledged as a vital step in designing appropriate information services [18,27]. Comparing between the two cities in information sources, trust and preferences reveals differences in risk communication and perception that could be further explored. For example, differences in the receipt of information based on income suggests that many sources might not have targeted the lower income households successfully and raises concern regarding their targeting strategies. Differences between cities also suggest that the involvement of business, industry and media can raise the level of information provided to households. However, the present surveys and workshop discussions did not explore the details of industry business and media communication that appear to be critical in raising the level of information provision in Calabar. Willingness to adapt to flood risk through a variety of actions varied less than information preferences between the two cities. This is an interesting finding that may suggest the additional information received in Calabar is related to warnings and measured risk rather than preparedness. However, in Calabar, there is also a move towards general climate education sponsored by business through the annual Calabar carnival.
The link between receipt of and trust in information from businesses and industry is also revealing. The implication suggested is that such sources of information are seen to be reliable, possibly due to a previous experience with warning information.
4.3. Implications
The issues with provision and communication of information that were identified might be alleviated by the provision of state level enhancements of data and forecast services to facilitate local early warning as suggested by the workshop participants. However, the workshops also suggested that these new roles for state level risk managers would require investment in new expertise, potentially transferred from the private sector, and extensive training of state and local government officials. As this improvement would require significant investment and transformation of culture, the changes should be informed by greater knowledge of the needs and uses of information by all stakeholders.
Proposed actions by stakeholders also involved widening participation in risk management and involvement of professionals and academics as well as communities in the design of strategies. There appears to be potential to open dialogue that would improve flood information services through the involvement of the private sector. These suggestions accord with recent calls for co-production as a route to improving the relevance of climate services [30].
The dialogue would need to consider the appropriate channels for different types of warning and preparedness advice. Results suggest that educational attainment affects the receipt of information. This could mean that for the less educated members of society, information is either not accessible or not accessible in a format they can understand and use, for example due to language of communication in English which the less educated may not fully understand. Furthermore, there is a suggestion that religion could play a role in access to information. Both cities are predominantly Christian states, and Muslim residents in these cities may have migrated from other parts of the country and with a different local language. When considered together, the foregoing underscores the importance of a factor such as language of communication in flood risk communication especially in heterogeneous societies like Nigeria. The findings here concur with Archer’s [31] observation that climate information that is inappropriate, badly disseminated or untrusted is not acted on by affected farming communities in many Sub-Saharan African countries. Language, resources and other marginalising factors, such as disagreements with traditional leaders or caste have been shown to have an impact. It is therefore incumbent on risk managers in these societies to be conscious of the social–demographic mix of communities in their communication as advocated by current good practice examples [32]. For instance, the state and federal governments communicating on television or radio using English may not reach the most vulnerable population. The potential of neglecting minority groups in risk communication may be addressed through more targeted communication. Authorities also need to consider how to address the issues surrounding trust and to provide information over a variety of media to reach those marginalised by the current communication.
4.4. Study Limitations
This paper reports selected results from a wider study on climate resilience in two medium-sized Nigerian cities. It reports those elements that relate to provision and use of climate hazard information by stakeholders, households and businesses in those cities. The mixed method approach allowed for contextualisation of quantitative findings using the views expressed in workshop discussions. However, practical considerations did not allow for a representative sample of stakeholders to be used in the opinion survey; therefore, it is possible that attendees were either more or less informed about climate hazard than the general stakeholder group they represented. The use of stakeholder and community surveys gave a uniquely holistic overview and extra weight to conclusions that were common between the two groups. However, neither survey was detailed enough to provide guidance on the exact shortfalls and requirements for climate hazard information. Furthermore, the revealed differences between the two cities implies that such detailed information would need to be collected on a city by city basis reducing the applicability of the specific patterns beyond the case study sites.
5. Conclusions
The study sought to explore the adequacy and use of information by stakeholders and communities in two Nigerian cities with a view to understanding future requirements and preferences.
The study found that there is a perceived need for improved data and information for all local actors in that they required improved information to pursue their current risk management strategies. However, it was also clear that the current range of strategies employed was constrained by the available information. Improved information together with capacity building for state and local government could allow implementation of more adaptive risk management strategies such as risk zoning and risk communication.
Communities rated information very highly within their adaptation strategies, however, the study underscores the often observed disconnect in climate hazard information provision to local communities. Differences in the receipt and trust in information between cities and groups within cities were found, and this demonstrates that risk communication and adaptation strategies will need to be cognisant of the needs of diverse communities. There is a need to institutionalise climate hazard information at a local level.
The study suggested that widening participation in risk management to include professionals, experts, academics and communities could increase focus on preparedness and increase compliance with government strategies. Increased synergy between governmental actors is also required to exploit the available data.
Both cities are well positioned to access promising resources to draw on in responding to the findings of this study. For instance, in Makurdi, the presence of two universities, the Lower-Benue River Basin Development Agency and the Nigerian Air Force base with expertise and some longitudinal climate data. Differences in information provided to communities (households and businesses) between cities also appears to suggest a wider role for business, industry and media which might improve risk communication. Although this study has indicated a direction of travel in the provision of climate services, further research is required to determine the appropriate roles for governmental and non-governmental organisations in providing warning and preparedness information that is reliable and trusted.
However, when designing improved climate information services, care must be taken to ensure that this information is available to the most vulnerable in a form that they can use and that they trust. This could be facilitated through the involvement of community representatives from the very early stages to define appropriate end user requirements.
The questionnaire results presented here are highly innovative. By asking the same questions in two Nigerian cities within one study, they can reveal similarities and differences not usually captured. The results show some remarkable similarities in respect to the preferred strategies for adaptation, indicating some common attitudes and perceptions that are slightly tempered by differences in hazard experience. These also accord broadly with results of previous studies on preferred strategies. However, there are much greater differences in responses related to the receipt of climate hazard information. Based on this finding, it would be unwise to generalise to other Nigerian cities regarding details of the availability of information or preferences of local communities. What can be learned from this study is the requirement to consult communities and stakeholders on their needs before assuming a national approach to climate information provision. While this study has been conducted with the case study of Makurdi and Calabar, other studies could focus on other developing cities in Nigeria or elsewhere to identify climate hazard information needs and availability to a wide range of stakeholders.
Author Contributions
Conceptualization, J.L. and I.A.; Data curation, O.A. and B.E.; Formal analysis, J.L. and O.A.; Funding acquisition, J.L.; Investigation, J.L., O.A., B.E. and F.U.; Methodology, J.L., O.A. and F.U.; Project administration, F.U.; Supervision, B.E.; Writing—original draft, J.L. and O.A.; Writing—review & editing, I.A.
Funding
This research was funded by Department for International Development, UK Government: AC/201433.
Conflicts of Interest
The authors declare no conflict of interest
References
- Birkman, J. Risk and vulnerability indicators at different scales: Applicability, usefulness and policy implications. Environmental Hazards 2007, 7, 20–31. [Google Scholar] [CrossRef]
- Krasovskaia, I.; Ibrekk, A.S.; Gottschalk, L.; Berg, H. Perception and communication of flood risk—Preliminary results from the flows project. In Proceedings of the International Conference on Innovation Advances and Implementation of Flood Forecasting Technology, Tromse, Norway, 17–19 October 2005. [Google Scholar]
- Steinführer, A.; Kuhlicke, C.; De Marchi, B.; Scolobig, A.; Tapsell, S.; Tunstall, S. Local Communities at Risk from Flooding: Social Vulnerability, Resilience and Recommendations for Flood Risk Management in Europe; Helmholtz Centre for Environmental Research—UFZ: Leipzig, Germany, 2009. [Google Scholar]
- Lamond, J.; Proverbs, D. Resilience to flooding: Learning the lessons from an international comparison of the barriers to implementation. Urban Des. Plan. 2009, 162, 63–70. [Google Scholar]
- Douglas, I.; Alam, K.; Maghenda, M.; Mcdonnell, Y.; McLean, L.; Campbell, J. Unjust Waters: Climate Change, Flooding and the Urban Poor in Africa. Environ. Urban. 2008, 20, 187–205. [Google Scholar] [CrossRef]
- Bradshaw, C.J.; Sodhi, N.S.; PEH, K.S.H.; Brook, B.W. Global Evidence that Deforestation Amplifies Flood Risk and Severity in the Developing World. Glob. Chang. Biol. 2007, 13, 2379–2395. [Google Scholar] [CrossRef]
- Thrush, D.; Burningham, K.; Fielding, J. Flood Warning for Vulnerable Groups: A Qualitative Study, in R&D; Technical Report; Environment Agency/Department of the Environment Food and Rural Affairs: London, UK, 2005.
- Parker, D.J.; Priest, S.J.; Tapsell, S.M. Understanding and enhancing the public’s behavioural response to flood risk. Meteorol. Appl. 2009, 16, 103–114. [Google Scholar] [CrossRef]
- Kellens, W.; Terpstra, T.; De Maeyer, P. Perception and Communication of Flood Risks: A Systematic Review of Empirical Research. Risk Anal. 2013, 33, 24–49. [Google Scholar] [CrossRef] [PubMed]
- Harries, T.; McEwen, L.; Wragg, A. Why it takes an ‘ontological shock’ to prompt increases in small firm resilience: Sensemaking, emotions and flood risk. Int. Small Bus. J. 2018, 36, 712–733. [Google Scholar] [CrossRef] [Green Version]
- Bouckaert, G.; Van de Walle, S. Comparing Measures of Citizen Trust and User Satisfaction as Indicators of ‘good Governance’: Difficulties in Linking Trust and Satisfaction Indicators. Int. Rev. Adm. Sci. 2003, 69, 329–343. [Google Scholar]
- Osuteye, E.; Johnson, C.; Brown, D. The data gap: An analysis of data availability on disaster losses in sub-Saharan African cities. Int. J. Disaster Risk Reduct. 2017, 26, 24–33. [Google Scholar] [CrossRef]
- Komi, K.; Neal, J.; Trigg, M.A.; Diekkrüger, B. Modelling of Flood Hazard Extent in Data Sparse Areas: A Case Study of the Oti River Basin, West Africa. J. Hydrol. Reg. Stud. 2017, 10, 122–132. [Google Scholar] [CrossRef]
- Haigh, I.D.; Wadey, M.P.; Gallop, S.L.; Loehr, H.; Nicholls, R.J.; Horsburgh, K.; Brown, J.M.; Bradshaw, E. A User-Friendly Database of Coastal Flooding in the United Kingdom from 1915–2014. Scientific Data 2015, 2, 150021. [Google Scholar] [CrossRef] [PubMed]
- Adekola, O.; Lamond, J. A media framing analysis of urban flooding in Nigeria: Current narratives and implication for policy. Reg. Environ. Chang. 2018, 18, 1145–1159. [Google Scholar] [CrossRef]
- Ologunorisa, T.E.; Adeyemo, A. Public Perception of Flood Hazard in the Niger Delta, Nigeria. Environmentalist 2005, 25, 39–45. [Google Scholar] [CrossRef]
- Adelekan, I.O. Flood risk management in the coastal city of Lagos, Nigeria. J. Flood Risk Manag. 2015, 9, 255–264. [Google Scholar] [CrossRef]
- Dayamba, D.S.; Ky-Dembele, C.; Bayala, J.; Dorward, P.; Clarkson, G.; Sanogo, D.; Mamadou, L.D.; Traoré, I.; Diakité, A.; Nenkam, A. Assessment of the use of Participatory Integrated Climate Services for Agriculture (PICSA) approach by farmers to manage climate risk in Mali and Senegal. Clim. Serv. 2018, 12, 27–35. [Google Scholar] [CrossRef]
- Tall, A.; Coulibaly, J.Y.; Diop, M. Do climate services make a difference? A review of evaluation methodologies and practices to assess the value of climate information services for farmers: Implications for Africa. Clim. Serv. 2018, 11, 1–12. [Google Scholar] [CrossRef]
- Adelekan, I.O. Vulnerability of poor urban coastal communities to flooding in Lagos, Nigeria. Environ. Urban. 2010, 22, 433–450. [Google Scholar] [CrossRef] [Green Version]
- Clement, A.R. Causes of seasonal flooding in flood plains: A case of Makurdi, Northern Nigeria. Int. J. Environ. Stud. 2012, 69, 904–912. [Google Scholar] [CrossRef]
- Ocheri, M.; Okele, E. Social Impact and People’s Perception of Flooding in Makurdi Town, Nigeria. Hydrology for Disaster Management: Special Publication of the Nigerian Association of Hydrological Sciences. 2012. [Google Scholar]
- Ndoma, E.E. Effectiveness of Drainage Networks on Floods in Calabar Metropolis, Nigeria; Ahmadu Bello University: Zaria, Nigeria, 2015. [Google Scholar]
- Antigha, R.E.E.; Akor, A.J.; Ayotamuno, M.J.; Ologhodien, I.; Ogarekpe, N.M. Rainfall runoff model for Calabar metropolis using multiple regression. Niger. J. Technol. 2014, 33, 566–573. [Google Scholar] [CrossRef]
- Lavrakas, P.J. Encyclopedia of Survey Research Methods; Sage Publications: Los Angeles, CA, USA, 2008. [Google Scholar]
- Bright, M.A.; O’Connor, D. Qualitative data analysis: Comparison between traditional and computerized text analysis. Osprey J. Ideas Inquiry 2007, 21. [Google Scholar]
- Olaide, A.; Bassey, P.; Ademuyiwa, O.; Onuoha, H.U. Optimization of Nigerian satellites in flood disaster preparedness and response. OSR J. Environ. Sci. Toxicol. Food Technol. 2014, 8, 49–54. [Google Scholar] [CrossRef]
- Adedeji, O.H.; Odufuwa, B.O.; Adebayo, O.H. Building capabilities for flood disaster and hazard preparedness and risk reduction in Nigeria: Need for spatial planning and land management. J. Sustain. Dev. Africa 2012, 14, 45–58. [Google Scholar]
- Donnelly, C.; Ernst, K.; Arheimer, B. A comparison of hydrological climate services at different scales by users and scientists. Clim. Serv. 2018, 11, 24–35. [Google Scholar] [CrossRef]
- Vincent, K.; Daly, M.; Scannell, C.; Leathes, B. What can climate services learn from theory and practice of co-production? Clim. Serv. 2018, 12, 48–58. [Google Scholar] [CrossRef]
- Archer ERM. Identifying Underserved End-User Groups in the Provision of Climate Information. In Bulletin of the American Meteorological Society; American Meteorological Society: Boston, MA, USA, 2003; pp. 1525–1532. [Google Scholar]
- Mercy Corps. Climate Information for Those Who Need It Most: Contributions of a Participatory Systems Mapping Approach in Niger, in A Learning Agenda for Climate Information Services in Sub-Saharan Africa; USAID: Washington, DC, USA, 2018.
Figure 1.
Nigeria and location of study sites.

Figure 2.
Summary of data collection.

Figure 3.
Ranking of adaptation categories by various groups.

Figure 4.
Source of climate hazard information for households and businesses.

Figure 5.
Flood adaptation actions: percent of respondents which have adopted or would adopt in advance of flooding.
Figure 5.
Flood adaptation actions: percent of respondents which have adopted or would adopt in advance of flooding.


Table 1.
Characteristics of study sites.
| Characteristic | Calabar | Makurdi |
|---|---|---|
| *Location | Coastal city bordering the Atlantic ocean; located on coordinates 4°57′ N 8°19′ E | Floodplain, bisected by the Benue River. 7°44′ N 8°31′ E |
| Ecological Zone | Mangrove forest | Guinea Savannah |
| ^Climatic characteristic | Temperature average 26.7 °C. (25.4 °C–27.8 °C). The average annual rainfall is 3239 mm. The Köppen-Geiger climate classification is Am. | Temperature averages 26.1 °C (21.3 °C–30.9 °C). The average annual rainfall is 623 mm. This Köppen-Geiger climate classification is BSh. |
| Land size (km2) | 328.234 | 835.624 |
| ~Population | 600,000; The major ethnic group is Efik. | 500,000; the major ethnic group is Tiv. |
| Main economic activities | Commercial (mainly retail) Popular tourist destination in Nigeria. | Commercial (Farming and Fishing) Predominantly an agricultural catchment |
| Administration | Two LGAs (Calabar Municipal and Calabar South). There are twelve wards in Calabar South and ten wards in Calabar Municipal. | One LGA with eleven administrative wards. Located along the Benue river. |
| Flood vulnerability | In addition to its geographical location on a major river, other drivers of flooding are increasing urban development, lack of, or poor drainage networks, dumping of solid wastes in drainage and water channels, low infiltration due to high water table and extent of built-up areas leading to increased runoffs [21,22] | The use of flood plains for urban development, land cover changes, destruction of the mangroves in the coastal areas and absence of drainage in many parts of the city has contributed to the occurrence flooding on an annual basis [23,24] |
* https://latitude.to/; ^ https://en.climate-data.org Climate Data.org; ~ National Population Commission (2006).
Table 2.
Distribution of workshop participants.
| Participant Group | Calabar | Makurdi | ||
|---|---|---|---|---|
| Workshop Participants | Questionnaires Returned | Workshop Participants | Questionnaires Returned | |
| Academic | 14 | 11 | 12 | 10 |
| Business | 03 | 02 | 11 | 03 |
| Government | 29 | 18 | 24 | 19 |
| NGO | 13 | 11 | 07 | 03 |
| Media | 03 | 0 | 01 | 0 |
| Military | 0 | 01 | 0 | |
| Community leader | 0 | 02 | 02 | |
| Total | 62 | 42 + 7 unspecified | 58 | 37 + 2 unspecified |
Table 3.
Socio-demographic profile of survey respondents.
| Particulars | Description | Household | Business | ||
|---|---|---|---|---|---|
| Calabar (N = 2200) | Makurdi (N = 1100) | Calabar (N = 220) | Makurdi (N = 110) | ||
| % | % | % | % | ||
| Gender | Female | 37.4 | 18.4 | 40.5 | 40.9 |
| Male | 62.6 | 81.6 | 59.5 | 59.1 | |
| Religion | Christian | 92.6 | 80.2 | 94.5 | 83.6 |
| Muslim | 3.4 | 17.4 | 2.3 | 13.6 | |
| Others | 4.0 | 2.4 | 3.2 | 2.8 | |
| Age group | <18 | 0.9 | 0.1 | 1.4 | 0.9 |
| 18–24 | 7.4 | 1.7 | 15.9 | 6.4 | |
| 25–34 | 21.8 | 14.6 | 30.5 | 34.5 | |
| 35–44 | 26.5 | 27 | 25 | 38.2 | |
| 45–54 | 24 | 31.1 | 20 | 14.5 | |
| 55–64 | 13.1 | 19.1 | 5 | 3.6 | |
| >65 | 5.5 | 6.1 | 2.3 | 0.9 | |
| Rather not say | 0.8 | 0.3 | 0 | 0.9 | |
| Education | No schooling | 2.5 | 9.4 | 2.3 | 4.5 |
| Primary/Secondary | 36.1 | 31.6 | 59.6 | 64.6 | |
| Post-secondary | 50.9 | 45.8 | 33.6 | 26.3 | |
| Post graduate | 6.9 | 9.5 | 3.2 | 1.8 | |
| Others | 3.6 | 3.7 | 1.3 | 2.8 | |
| Household income/Business profit | Up to 50,000 | 39.1 | 38.2 | 1.8 | 2.4 |
| 50,001–250,000 | 38.4 | 35.3 | 31.8 | 32.5 | |
| 250,001–500,000 | 53.2 | 56.3 | 31.9 | 29.4 | |
| Above 5,000,000 | 0.4 | 1.6 | 0 | 0 | |
| Rather not say | 11.9 | 15.1 | 13.1 | 21 | |
| Ownership of dwelling place/business | Family owned (house) | 23.5 | 35.8 | 15 | 10 |
| Self-owned | 20.3 | 21.2 | 73.6 | 85.5 | |
| Rent/part owned | 54.3 | 42.9 | 5.5 | 1.8 | |
| Others | 1.9 | 0.1 | 5.9 | 2.7 | |
Table 4.
Proportion of households that received information by household income and source.
| Sources of Information (Percentage) | Makurdi | Calabar | ||
|---|---|---|---|---|
| Below Average Income | Above Average Income | Below Average Income | Above Average Income | |
| No | 93.2 | 65.9 | 39.8 | 35.7 |
| Yes | 6.8 | 34.1 | 60.2 | 64.3 |
| Mann-Whitney test of means by income | statistic 83,274 | significance 0.000 ** | statistic 363,953 | significance 0.000 ** |
| Business and industry | 2.0 | 0.6 | 31.6 | 32.6 |
| Community based organisation | 0.0 | 0.0 | 3.1 | 3.3 |
| Individuals (friends, neighbours) | 0.0 | 0.9 | 8.5 | 9.1 |
| International organisations | 0.0 | 2.6 | 2.0 | 4.2 |
| Local government | 0.0 | 0.6 | 3.3 | 3.3 |
| National government | 2.0 | 8.9 | 3.8 | 4.2 |
| Non governmental organisation | 0.0 | 0.4 | 1.6 | 2.3 |
| State government | 2.7 | 20.2 | 6.4 | 5.3 |
** significant at 1%.
Table 5.
Proportion of households and the source of information they trust by household income.
| Source of Information | Makurdi | Calabar | ||
|---|---|---|---|---|
| Below Average Income | Above Average Income | Below Average Income | Above Average Income | |
| Mann-Whitney test of means by income | statistic 91,832 | significance 0.000 ** | statistic 424,122 | sigificance 0.3 |
| Business and industry | 8.4 | 2.6 | 32.9 | 35.7 |
| Community based organisation | 5.8 | 5.9 | 6.1 | 5.2 |
| Individuals (friends, neighbours) | 11.5 | 6.7 | 7.9 | 6.8 |
| International organisations | 8.4 | 18.8 | 6.4 | 9.7 |
| Local government | 17.3 | 4.2 | 5.4 | 6.9 |
| National government | 22.0 | 19.3 | 13.7 | 15.3 |
| Non governmental organisation | 3.1 | 4.8 | 4.0 | 4.3 |
| State government | 23.6 | 37.7 | 23.4 | 15.7 |
** significant at 1%.
© 2019 by the authors. Licensee MDPI, Basel, Switzerland. This article is an open access article distributed under the terms and conditions of the Creative Commons Attribution (CC BY) license (http://creativecommons.org/licenses/by/4.0/).
Share and Cite
MDPI and ACS Style
Lamond, J.; Adekola, O.; Adelekan, I.; Eze, B.; Ujoh, F. Information for Adaptation and Response to Flooding, Multi-Stakeholder Perspectives in Nigeria. Climate 2019, 7, 46. https://0-doi-org.brum.beds.ac.uk/10.3390/cli7040046
AMA Style
Lamond J, Adekola O, Adelekan I, Eze B, Ujoh F. Information for Adaptation and Response to Flooding, Multi-Stakeholder Perspectives in Nigeria. Climate. 2019; 7(4):46. https://0-doi-org.brum.beds.ac.uk/10.3390/cli7040046
Chicago/Turabian StyleLamond, Jessica, Olalekan Adekola, Ibidun Adelekan, Bassey Eze, and Fanan Ujoh. 2019. "Information for Adaptation and Response to Flooding, Multi-Stakeholder Perspectives in Nigeria" Climate 7, no. 4: 46. https://0-doi-org.brum.beds.ac.uk/10.3390/cli7040046
Note that from the first issue of 2016, this journal uses article numbers instead of page numbers. See further details here.