Cross-Comparison between MODIS and VIIRS Snow Cover Products for the 2016 Hydrological Year


1
Department of Earth Science and Geography, California State University Dominguez Hills, Carson, CA 90747, USA
2
Department of Geography, Texas A&M University, College Station, TX 77843, USA
*
Author to whom correspondence should be addressed.
Climate 2019, 7(4), 57; https://0-doi-org.brum.beds.ac.uk/10.3390/cli7040057
Submission received: 18 March 2019
/
Revised: 12 April 2019
/
Accepted: 13 April 2019
/
Published: 16 April 2019
Abstract
:The VIIRS (Visible Infrared Imaging Radiometer Suite) instrument on board the Suomi-NPP (National Polar-Orbiting Partnership) satellite aims to provide long-term continuity of several environmental data series including snow cover initiated with MODIS (Moderate Resolution Imaging Spectroradiometer). Although it is speculated that MODIS and VIIRS snow cover products may differ because of their differing spatial resolutions and spectral coverage, quantitative comparisons between their snow products are currently limited. Therefore, this study intercompares MODIS and VIIRS snow products for the 2016 Hydrological Year over the Midwestern United States and southern Canada. Two hundred and forty-four swath snow products from MODIS/Aqua (MYD10L2) and the VIIRS EDR (Environmental Data Records) (VSCMO/binary) were intercompared using confusion matrices, comparison maps and false color imagery. Thresholding the MODIS NDSI (Normalized Difference Snow Index) Snow Cover product at a snow cover fraction of 30% generated binary snow maps are most comparable to the NOAA VIIRS binary snow product. Overall agreement between MODIS and VIIRS was found to be approximately 98%. This exceeds the VIIRS accuracy requirements of 90% probability of correct typing. The agreement was highest during the winter but lower during late fall and spring. MODIS and VIIRS often mapped snow/no-snow transition zones as a cloud. The assessment of total snow and cloud pixels and comparison snow maps of MODIS and VIIRS indicate that VIIRS is mapping more snow cover and less cloud cover compared to MODIS. This is evidenced by the average area of snow in MYD10L2 and VSCMO being 5.72% and 11.43%, no-snow 26.65% and 28.67% and cloud 65.02% and 59.91%, respectively. While VIIRS and MODIS have a similar capacity to map snow cover, VIIRS has the potential to map snow cover area more accurately, for the successful development of climate data records.
1. Introduction
Snow cover extent is one of the most useful indicators of climate conditions [1,2,3]. Precise monitoring and mapping of snow cover extent are critical for understanding climate change, climate dynamics and hydrological phenomena. The information on spatial extent and distribution of snow cover is an important input factor for climate and hydrological modeling [4,5,6,7], weather forecasting [8], determining Earth radiation budget [9], estimating snowmelt runoff for water resource management and hydropower production [10,11] and for modeling flood hazard potential from snowmelt [12,13]. Moreover, snow cover information is used in monitoring snow cover extent and duration, validating the hydrological models and in developing environmental data records [14,15].
Satellite remote sensing allows for the detection and mapping of snow cover extent (SCE) at regional and global scales and has a potential for extending local in situ snow measurements [2]. Satellite remote sensing also offers consistent snow cover observation over large and remote areas, which can be used in long term environmental studies [14]. Satellite snow cover mapping was initiated when TIROS-1 (Television and InfraRed Observation Satellite) captured the first snow cover image of Eastern Canada on April 1, 1960 [16,17]. In the mid-1960s, weekly snow maps at 3.7 km spatial resolution were produced following the launch of the Environmental Science Service Administration (ESSA) satellite in 1965. In 1966, the National Oceanic and Atmospheric Administration (NOAA) began to produce weekly snow cover maps from polar-orbiting and geostationary satellites and surface observations [7,18]. However, the revolution of satellite snow cover mapping started with the launch of the first Landsat satellite (Landsat-1) in 1972 that offered basin scale snow cover mapping at 60 m spatial resolution [4,19]. In 1982, short wave infrared (SWIR) band of Landsat-4 TM allowed for the snow/cloud discrimination and snow cover mapping at 30 m spatial resolution [9]. Since then, regional and global snow cover maps have been developed using satellite data from Geostationary Operational Environmental Satellite (GEOS), AVHRR, Landsat, Airborne Visible/Infrared Imaging Spectrometer (AVIRIS) [13,16] and most significantly from the Moderate Resolution Imaging Spectroradiometer (MODIS).
The MODIS on board Terra (EOS-AM1) and Aqua (EOS-PM1) is a multispectral instrument that provides global daily coverage data in 36 spectral bands ranging from 0.405 µm to 14.385 µm at various spatial resolutions (2 bands at 250 m, 5 bands at 500 m and 29 bands at 1 km) [7,20]. Terra and Aqua are the sun-synchronous multi-national NASA scientific research satellites that revolve around the Earth, carrying five remote sensing instruments including the MODIS. The Terra was launched on 18 December 1999 and provided data from 24 February 2000 to the present, while the Aqua was launched on 4 May 2002 and provided data from 24 June 2002 to present. Since 2000, MODIS has greatly contributed to the historical record of snow cover extent by providing moderate resolution (500 m) snow cover products ranging from 5-minute swath products, daily products to monthly SCE products. Furthermore, Visible Infrared Imaging Radiometer Suite (VIIRS) on board Suomi-National Polar-orbiting Partnership (NPP) satellite and future Joint Polar Satellite System (JPSS) satellite was launched on 28 October 2011 with a critical role of providing long-term observations of the earth surface [21,22]. The VIIRS is a scanning radiometer that provides global daily coverage data in 22 spectral bands ranging from 0.412 µm to 12.01 µm at various spatial resolutions, which includes 16 moderate resolution bands (M-bands) with 750 m spatial resolution, 5 spectral bands (I-bands) centered at visible, near infrared, shortwave infrared, middle infrared and far infrared spectral range at 375 m spatial resolution and one panchromatic day/night band (DNB) with a 750 m spatial resolution [22]. The VIIRS swath area is about 3040 km by 570 km and completes the Earth’s surface coverage at least twice a day [8]. The VIIRS instrument represents the extension of the MODIS and AVHRR sensors [23].
Through the launch of VIIRS, there is a potential for the long-term continuity of several environmental data series including snow cover initiated with the MODIS aboard Aqua and Terra satellites for eventually developing moderate resolution climate data record (CDR). The 375 m spatial resolution of VIIRS likely to provide a more accurate map of snow cover extent compared to 500 m MODIS products. Despite of the different spatial resolution, both MODIS and VIIRS snow products used similar wavelength bands in snow detection algorithm. The MODIS/Aqua swath snow product utilized band 4 (0.545 μm–0.565 μm) and band 6 (1.628 μm–1.652 μm) and the VIIRS snow product utilized band I1 (0.600–0.680 μm) and band I3 (1.580–1.640 μm) for snow cover detection [15,22,24]. The general hypothesis is that the VIIRS and MODIS snow cover products should have similar accuracy for snow cover detection since the same algorithm is used for both instruments [24]. There are also speculations regarding the similarity and differences between MODIS and VIIRS snow cover products because of different spatial resolution and spectral coverage. However, the quantitative comparisons between VIIRS and MODIS snow products are currently limited. Intercomparison of the MODIS and VIIRS snow products is crucial to ensure the smooth transition of snow cover products from MODIS to VIIRS for the successful development of climate data records (CDR) [22,24]. Although there are two sets of VIIRS snow cover products, one developed by NOAA (National Oceanic and Atmospheric Administration) and the other by NASA (National Aeronautics and Space Administration), only the NOAA VIIRS snow cover product was publicly available for the 2016 hydrological year. Consequently, the overall objective of this study is to compare the MODIS and NOAA VIIRS snow products during the 2016 hydrological year. The general objectives are to intercompare the daily swath snow cover products from the Aqua MODIS (MYD10L2) and the NOAA VIIRS (VSCMO) to assess their agreement using confusion matrices and qualitative analysis and to identify the fractional snow cover (FSC) threshold of the Aqua MODIS swath snow map (MYD10L2) that best approximates the VIIRS binary snow map (VSCMO) using snow omission and commission errors between the two products.
2. Materials and Methods
2.1. Study Area
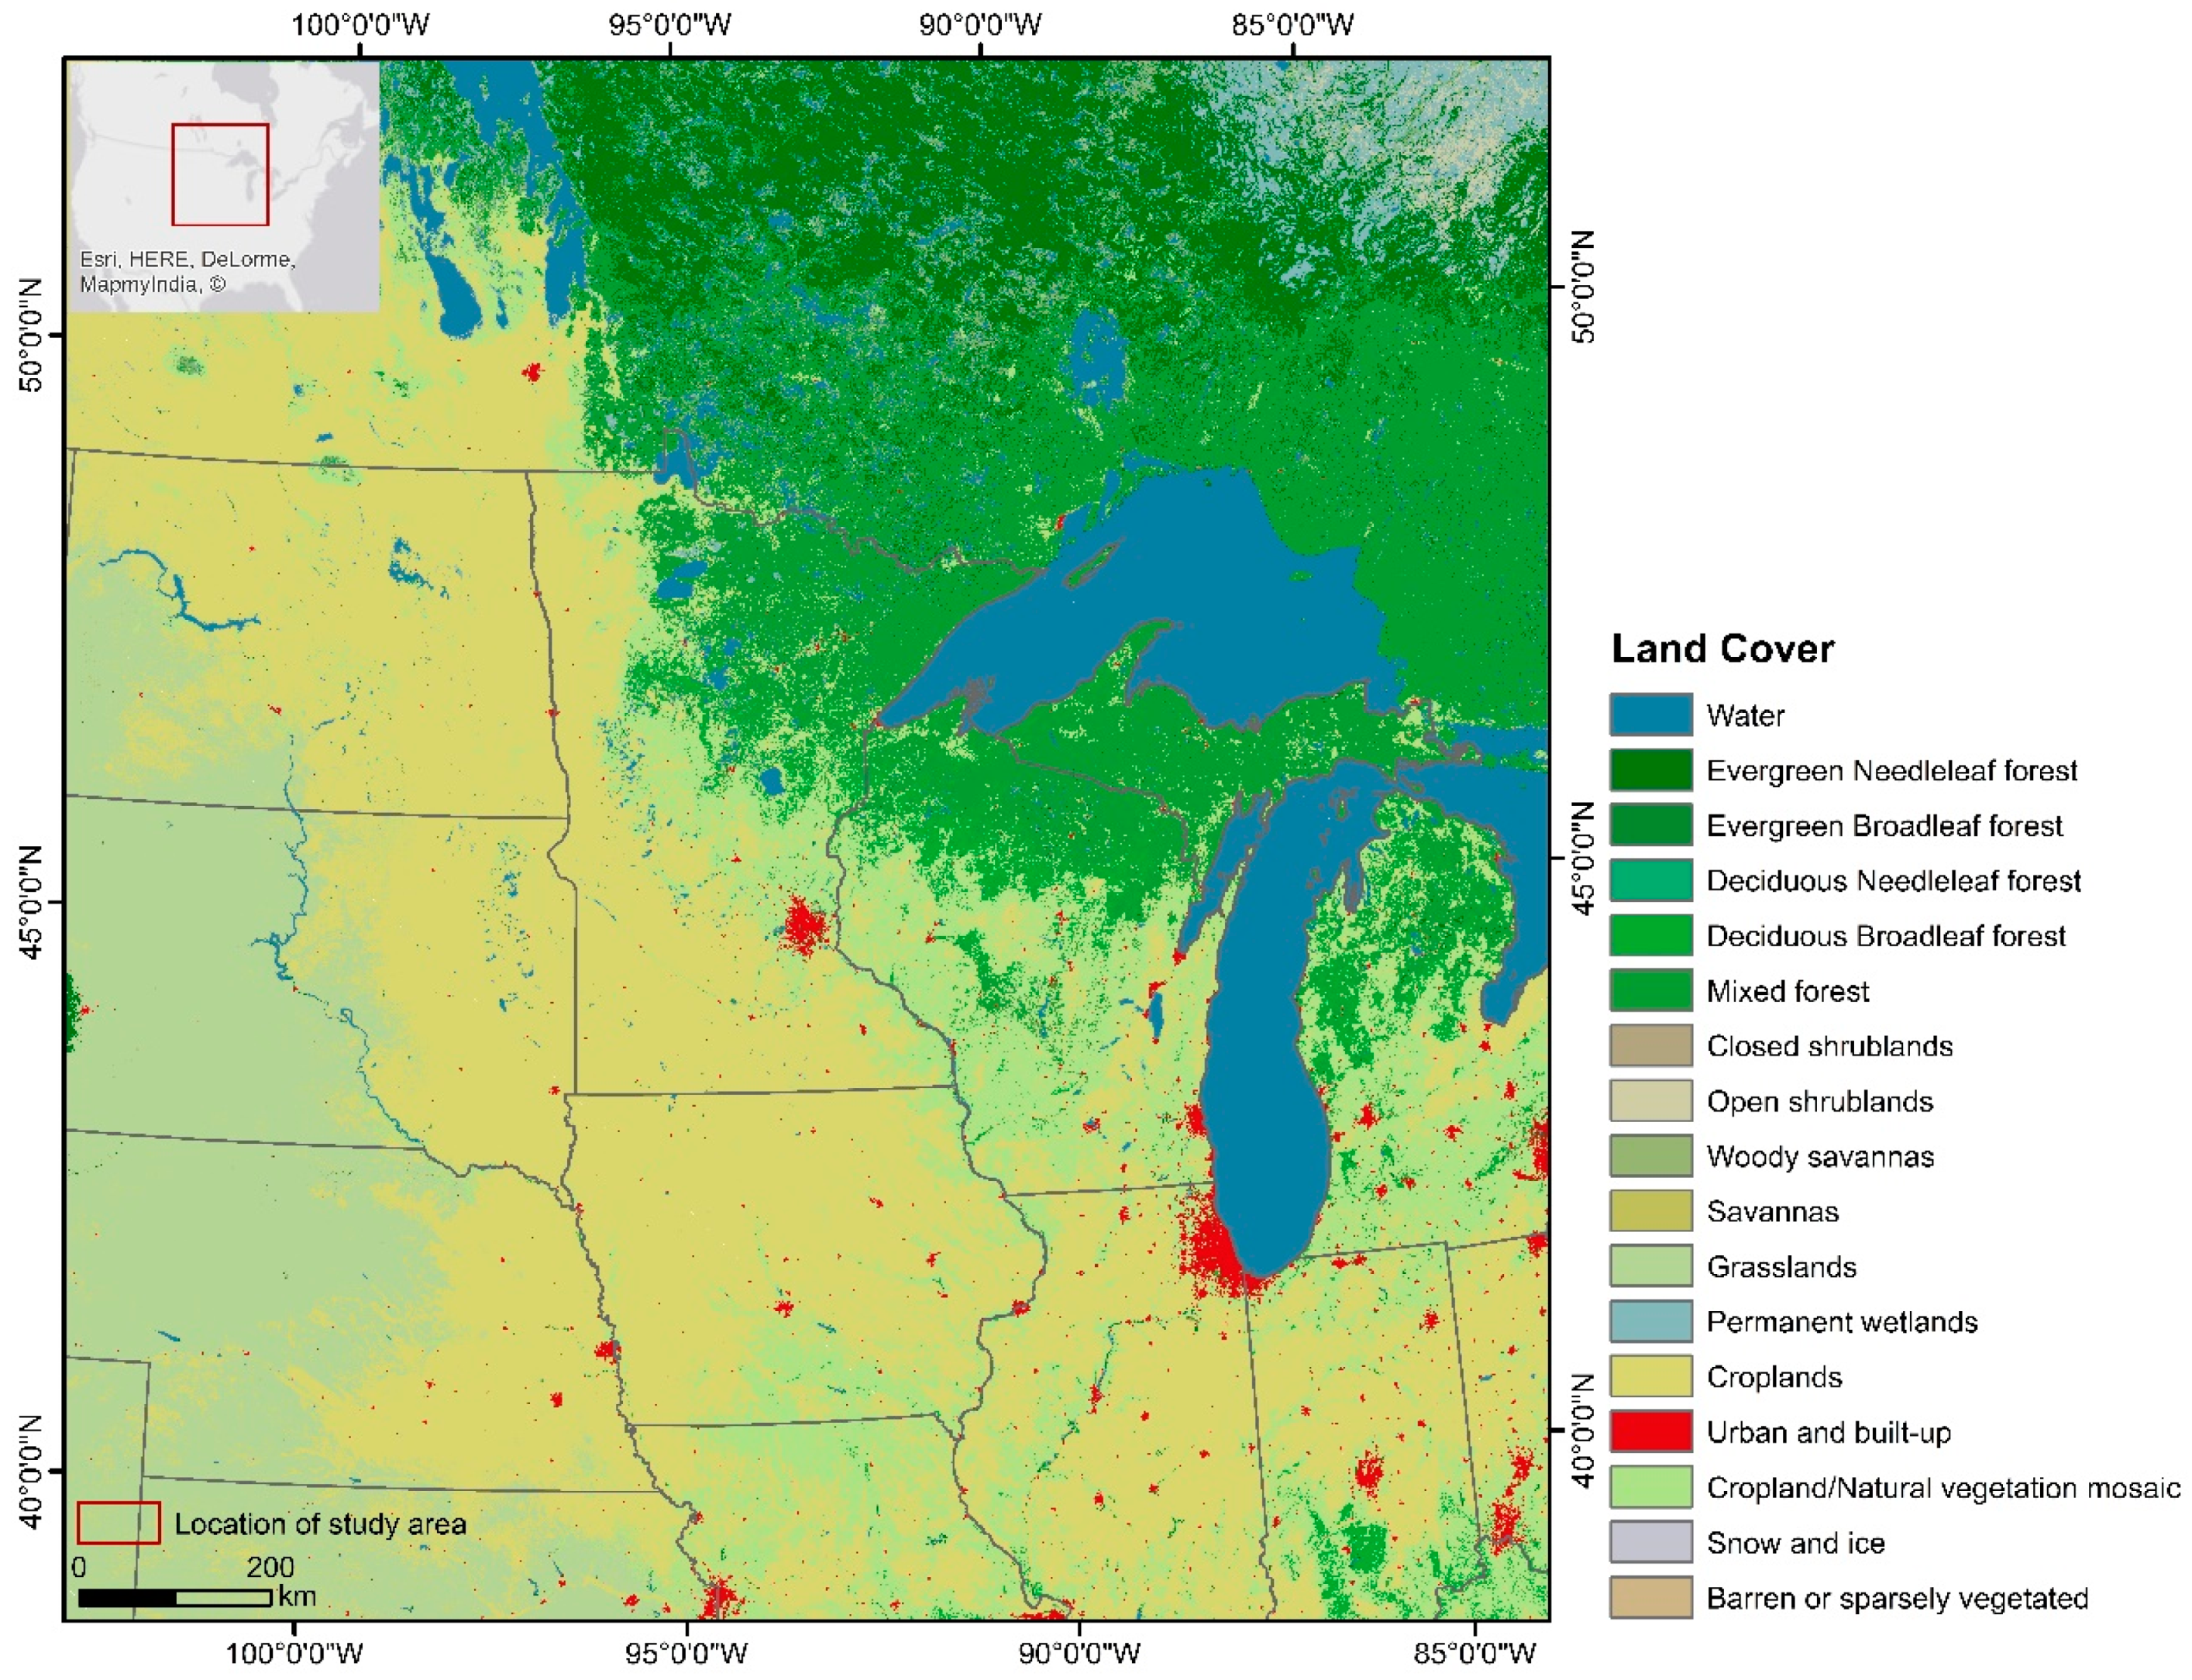
The study area includes a portion of Central and Western Canada and the Midwestern United States, which lies roughly between 38.29°–52.71° N and 80.92°–104.75° W (Figure 1) and covers approximately 2,528,690 sq. km. The study area covering Canadian provinces include portions of Ontario, Manitoba and Saskatchewan while the Midwestern United States includes Iowa, Minnesota, Wisconsin and parts of Illinois, Indiana, Kansas, Michigan, Missouri, Nebraska, North Dakota, Ohio and South Dakota. The study area is representative of seventeen International Geosphere-Biosphere Program (IGBP) land cover types, including evergreen needleleaf and broadleaf forest, deciduous needleleaf and broadleaf forest, mixed forest, open and closed shrublands, grasslands, woody savannas, cropland and natural vegetation mosaic, croplands, urban and built-up, permanent wetlands, water, snow and ice and barren or sparsely vegetated (Figure 1). Croplands is the most dominant land cover types covering 35% of the total area followed by mixed forest (15%), cropland/natural vegetation (14%) and grasslands (13%). Water and wetlands comprise about 10% of total area. The land cover map for the study area was obtained from the Global Land Cover Facility (GLCF), which is 2013 MODIS land cover type data product (MCD12Q1) in the IGBP Land Cover Type Classification with 500 m spatial resolution [25,26].
2.2. Data Description
The swath snow products from two different sources, that is, MODIS/Aqua Collection 6 (MYD10_L2) and the NOAA VIIRS EDR (VSCMO/binary), were used in this study. The MODIS Aqua swath product is selected over the MODIS Terra snow product because the Aqua satellite carrying MODIS instrument and Suomi NPP satellite carrying VIIRS instrument crosses the equator from south to north (ascending node) each day at the same time, that is approximately 1:30 P.M. local time, whereas the Terra satellite cross the equator from north to south (descending node) at approximately 10:30 A.M. [27]. Furthermore, the swath product is selected because it is the first order snow product from which other higher-level snow products are developed and their validation is relevant to other higher-level snow cover products [27]. Additionally, only the VIIRS swath snow product is currently available. The MODIS snow cover data were obtained online from the Distributed Active Archive Center (DAAC) at the National Snow and Ice Data Center (NSIDC) and the NOAA VIIRS data were obtained from NOAA Comprehensive Large Array-Data Stewardship System (CLASS). The swath snow products come from two different sources, that is, MODIS/Aqua Collection 6 (MYD10L2) and NOAA VIIRS EDR (VSCMO/binary) and encompass the 2016 hydrological year (snow season) from 1 October 2015 to 31 May 2016, which includes 244 snow cover maps from MODIS and VIIRS.
The MODIS/Aqua swath snow product (MYD10L2) is a Level 2 snow product. Collection 6 represents the recent version of MODIS snow cover products. Only the Normalized Difference Snow Index (NDSI) Snow Cover dataset is used for this study. The NDSI Snow Cover has the coded integer values which represent different features. For example, NDSI Snow has values ranging from 0 to 100% that characterize the percentage of snow cover in a pixel [15,28].
NOAA’s VIIRS (VIIRS/NOAA) snow cover products are developed based on MODIS Collection 5 (C5) snow cover algorithms and are thus different than NASA’s VIIRS snow products [22]. The VIIRS/NOAA snow cover products include the VIIRS Snow Cover Binary (snow/no snow) EDR and the VIIRS Snow Cover Fraction EDR [3,21]. The detail explanation of NOAA’s VIIRS snow cover products are available in Joint Polar Satellite System (JPSS) VIIRS snow cover Algorithm Theoretical Basis Document (ATBD) [8,18]. The VSCMO is an Environmental Data Record (EDR) Level 2 product. The VSCMO is integrated with GITCO file (VIIRS Image Bands SDR Ellipsoid Terrain Corrected Geolocation) in a compressed Hierarchical Data Format Release 4 (HDF4) format. The GITCO-VSCMO includes Snow Cover Binary Map along with geolocation files such as Height, Satellite Azimuth Angle, Satellite Range, Satellite Zenith Angle, Solar Azimuth Angle and Solar Zenith Angle. However, only the Snow Cover Binary Map is used for this study and the value of Snow Cover Binary Map includes 0 representing snow free pixels, 1 representing snow pixels and 255 representing fill value [29].
2.3. Data Preprocessing
The Modis Conversion Toolkit (MCTK) in ENVI IDL8.3 was used to automatically extract the NDSI Snow Cover dataset from MYD10L2 and re-project the dataset into a North America Albers Equal Area Conic projection using nearest neighbor resampling. MCTK is an HDF file conversion and projection plugin that can be run in ENVI and IDL, which facilitates the extraction and projection of the target data [30]. The NDSI Snow Cover dataset of MYD10L2 was oversampled to a spatial resolution of 375 m using nearest neighbor resampling to match the spatial resolution of VIIRS snow maps in ENVI IDL8.3. The VIIRS Conversion Toolkit (VCTK) in ENVI IDL8.3 was used to extract the Snow Cover Binary Map from GITCO-VSCMO and re-project the dataset into the North America Albers Equal Area Conic projection using nearest neighbor resampling similar to MODIS in step 1. The VCTK is a plugin similar to MCTK that can be used to convert, extract and project VIIRS HDF files [31]. The extracted datasets were mosaicked based on matching dates, clipped to study area extent and saved in the Geotiff file format using ArcGIS 10.5 software. A MODIS water mask, which was resampled to 375 m from 250 m resolution using nearest neighbor resampling, was applied to the datasets to extract only land pixels using ArcGIS 10.5. The water pixels were not included in the analysis because the MYD10L2 mapped some water pixels as snow.
2.4. Data Analysis
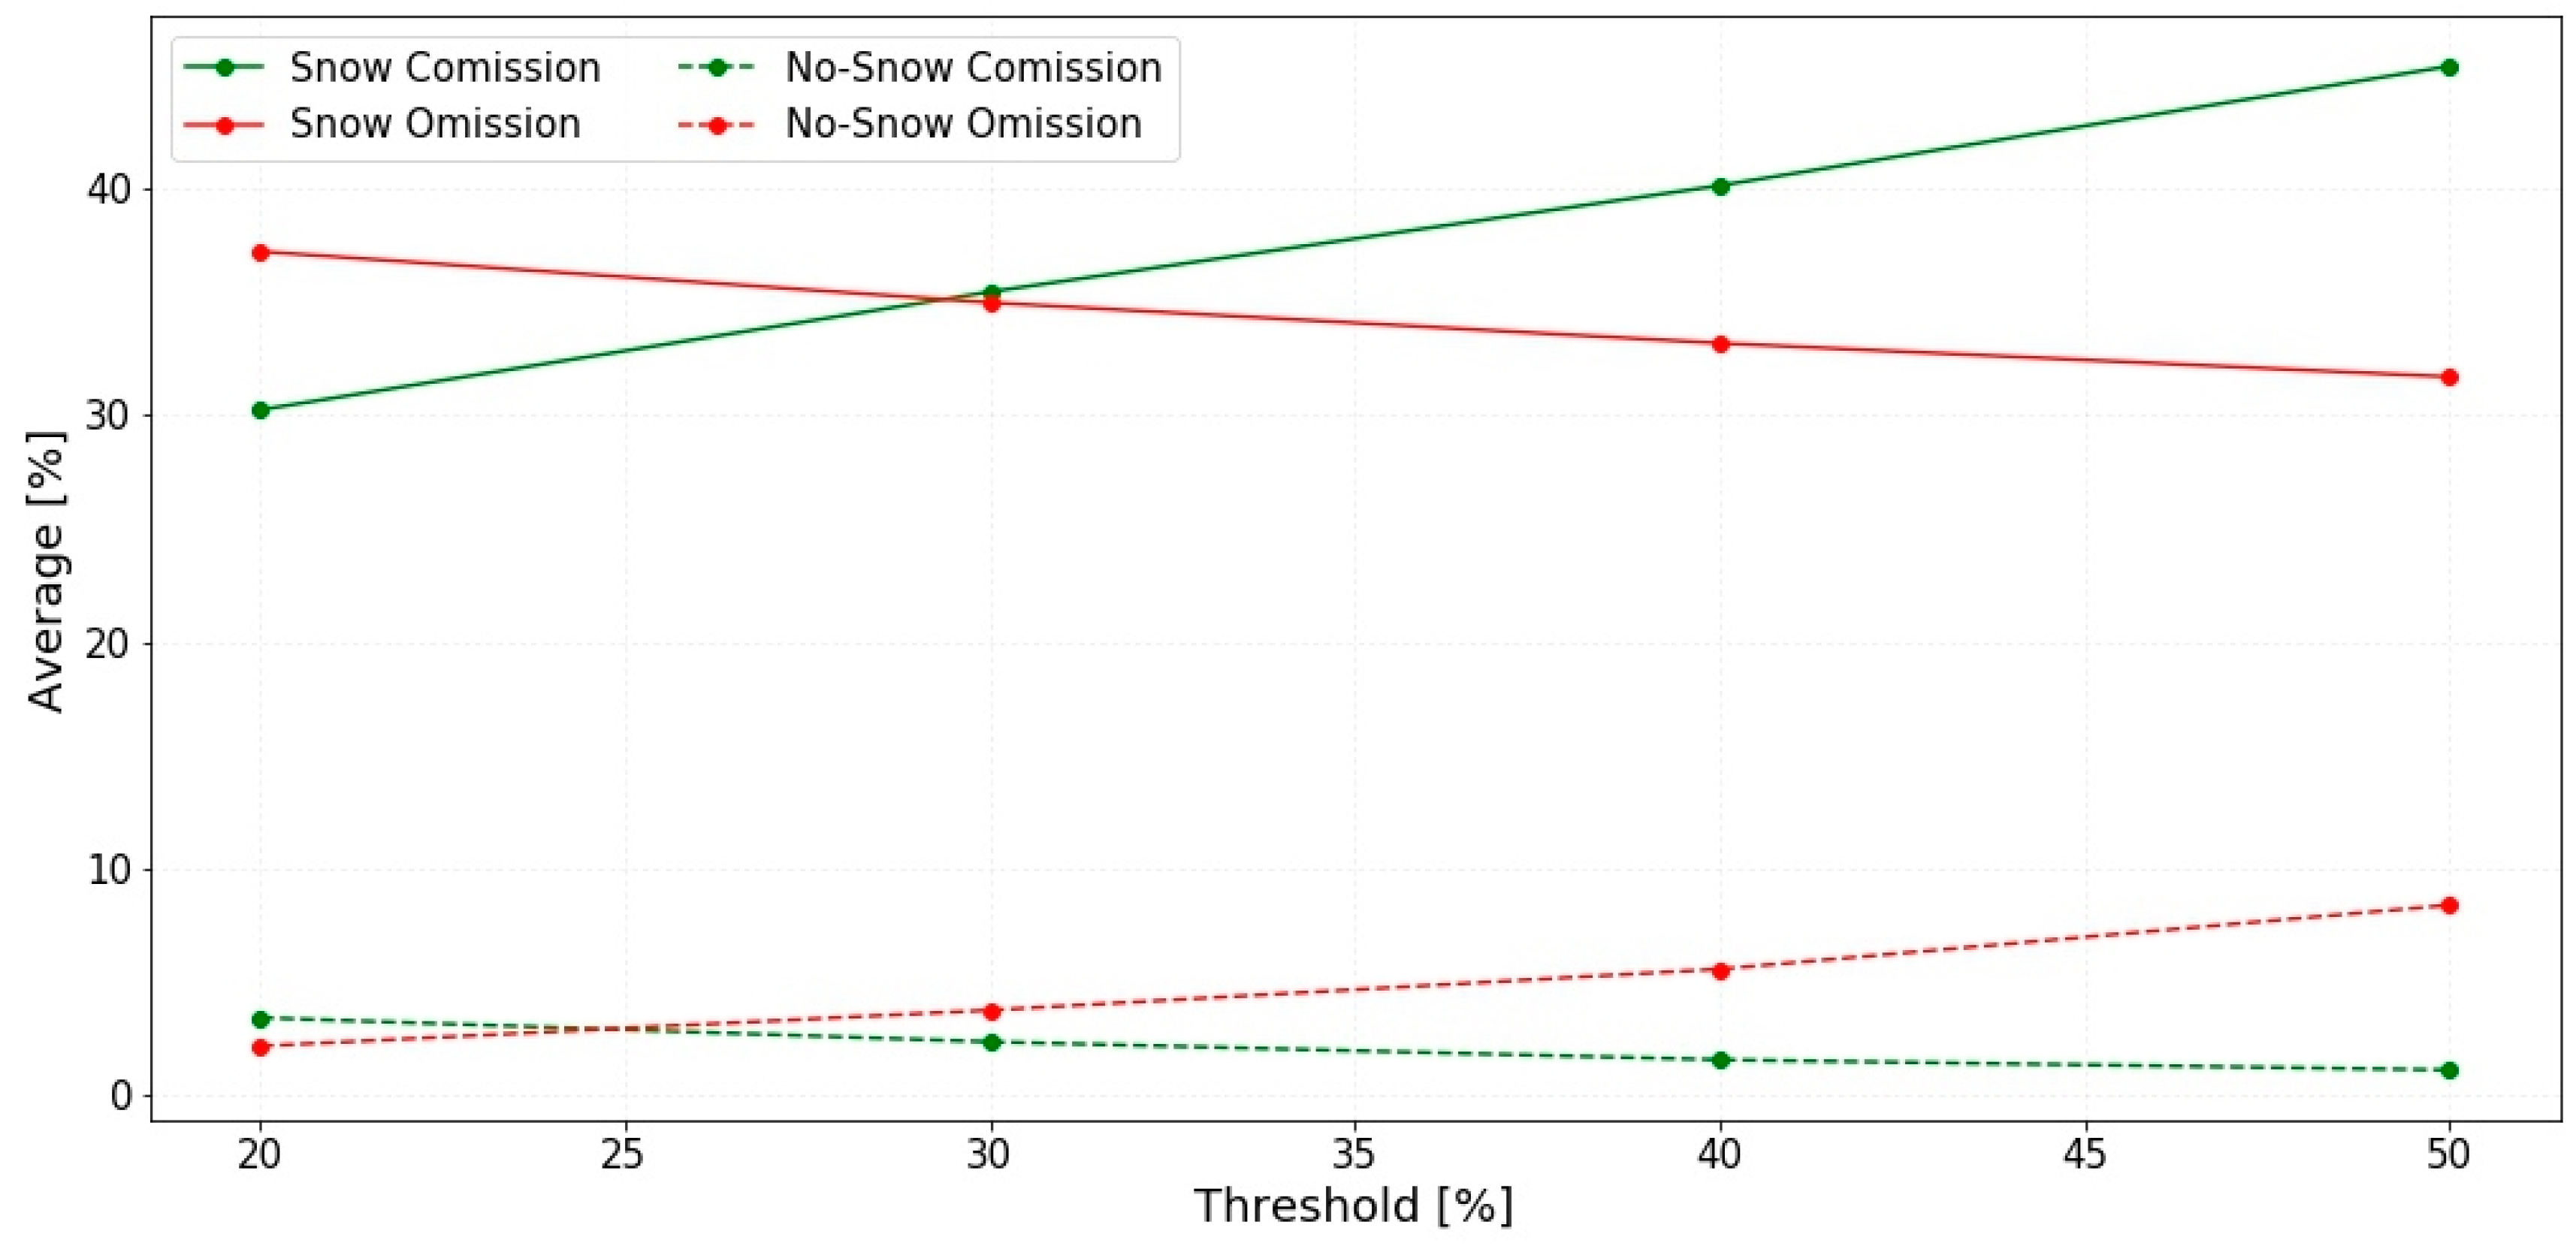
The NDSI Snow Cover dataset of MYD10L2 includes the information on the snow cover fraction as the NDSI Snow layer with its value ranging from 0 to 100% [15]. This layer was converted into Snow Cover Binary Maps by thresholding to facilitate comparison with the VIIRS Snow Cover Binary Map. Different fractional snow cover thresholds (20%, 30%, 40% and 50%) were examined for the binary conversion of MODIS NDSI Snow Cover dataset. For example, in 20% thresholding, NDSI Snow Cover value of 20% or less is considered as no-snow pixels and NDSI Snow Cover value greater than 20% is considered as snow pixels. All the other values of the NDSI Snow Cover dataset such as missing data, no decision, night, water, cloud, detector saturation and fill value were categorized as no-data. The VIIRS Snow Cover Binary Map is in the binary form and thresholding is not required.
MODIS and VIIRS snow binary maps were then recoded/reclassified into binary categories of snow and no-snow. The snow pixels were coded as value 1 and no-snow pixels were coded as 0. Then, the reclassified MODIS and VIIRS snow maps were combined using map algebra operation (Combinatorial OR function in ArcGIS 10.5) to create a series of daily snow maps in which pixels were classified into four different categories based on the decision rules highlighted in Table 1: MODIS snow and VIIRS snow, MODIS snow and VIIRS no-snow, MODIS no-snow and VIIRS snow and MODIS no-snow and VIIRS no-snow. This approach is adapted from Klein and Barnett [20], Parajka and Bloschl [32] and Wang et al. [33]. The comparison was carried out for 244-days during the 2016 hydrological year (1 October 2015–31 May 2016).
Using the computed MODIS Binary snow map as the reference, the snow and no-snow omission and commission were calculated and their average values were plotted with respect to the fractional snow cover thresholds to find optimal MODIS FSC threshold for the MODIS-VIIRS snow map intercomparison.
2.5. MODIS-VIIRS Comparison
A confusion matrix, which is an effective way of representing the accuracy of remote sensing data classification [34], was used for quantitative comparison between MODIS and VIIRS snow maps. MODIS served as the reference/ground truth data since this product is both well established and well validated while VIIRS snow products are recently available and its validation is at the early phase. The confusion matrix was also used to determine the Kappa coefficient (Khat), level of agreement (both mapping snow) and disagreement (only one approach mapping snow, that is, commission/inclusion and omission/exclusion errors) and the overall agreement between MODIS and VIIRS snow maps. The Kappa coefficient (Khat) test statistics [35] delivers improved accuracy measurement of remote sensing image classification as it accounts for both agreement and disagreement information of classification [20]. Omission or exclusion errors refer to those pixels that belong to the class of interest but which the classifier has failed to identify, while commission errors refer to those pixels from other classes that the classifier has labeled as belonging to the class of interest [36]. For qualitative analysis, MODIS and VIIRS snow cover maps were compared with their corresponding false color imagery. Furthermore, to assess the differences in snow mapping between MODIS and VIIRS, comparison maps for selected individual days of the interval during the 2016 hydrological year was produced [20].
3. Results
Two hundred and forty-four daily swath snow maps from MODIS and VIIRS were intercompared for the 2016 hydrological year, running from 1 October 2015 to 31 May 2016 using confusion matrices and qualitative analysis. An appropriate NDSI threshold was selected to create a MODIS binary snow map to compare to VIIRS through minimization of commission and omission errors between the two sets of snow maps. The validation was based on snow commission and omission errors, overall agreement and khat as well as through qualitative analysis of the resulting maps, illustrating agreements and commission/omission in conjunction with false color composites of the companion MODIS and VIIRS optical images.
3.1. MODIS Fractional Snow Cover Threshold
The optimal fractional snow cover threshold of the MODIS swath snow map was determined by examining snow cover area at four different FSC thresholds (20%, 30%, 40% and 50%) and comparing the resulting binary snow maps with those of VIIRS. There was tradeoff between the snow and no-snow cover area with the change in snow cover fraction thresholds. The snow cover area in MODIS increases with any decrease in the selected threshold value and vice-versa. Similarly, a trade-off between snow commission and omission was observed with changes in FSC thresholds. The average snow commission and omission was plotted against the four FSC threshold values to determine the optimal MODIS NDSI Snow Cover threshold. From Figure 2, it is evident that the MODIS snow commission and snow omission was equal when the NDSI Snow Cover threshold was near 30%. Therefore, a 30% MODIS NDSI Snow Cover threshold was chosen to produce MODIS binary snow map for comparison with VIIRS. The MODIS NDSI Snow Cover dataset represents snow cover fractions ranging from 0 to100% [15].
3.2. Total Snow, No-Snow and Cloud
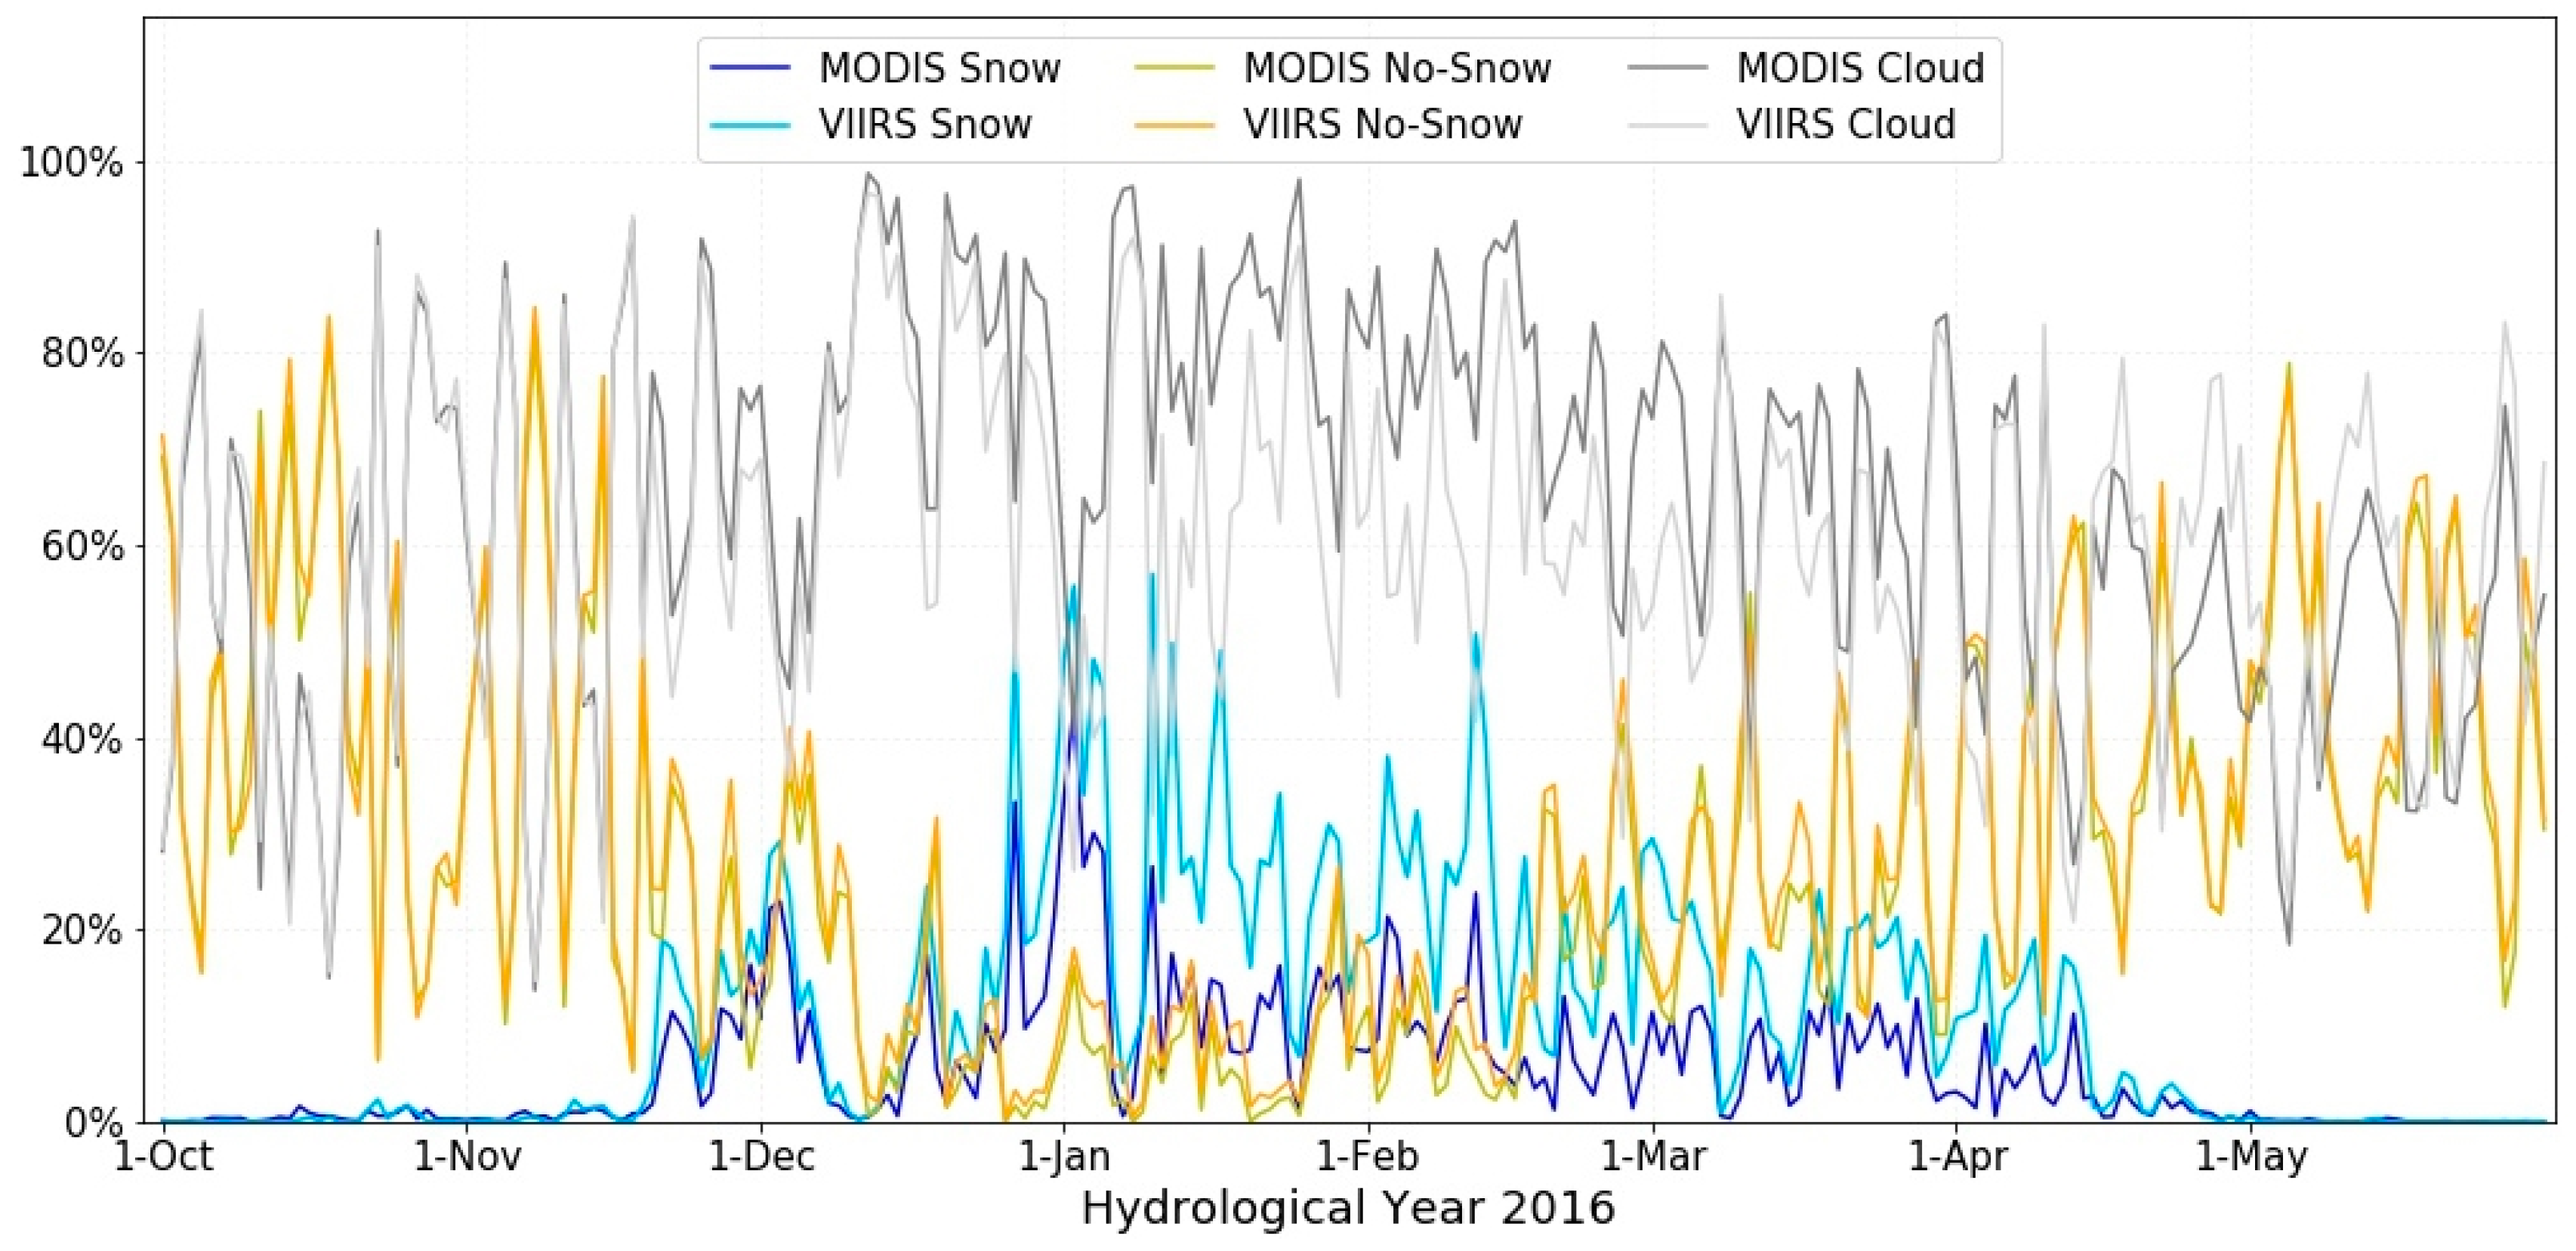
Total snow, no-snow and cloud pixels were determined individually for all 244 MODIS and VIIRS binary snow maps. Figure 3 represents total snow, no-snow and cloud pixels over the study area during the study period for the MODIS and VIIRS snow maps. When comparing all the pixels in each day of the 2016 hydrological year, total no-snow area was similar in the MODIS and VIIRS snow maps, whereas MODIS was mapping more clouds and less snow compared to VIIRS, significantly during winter and spring season (Figure 3).
The average percentages of snow, no-snow and cloud portions on MODIS and VIIRS daily swath snow products during the 2016 hydrological year demonstrated in Table 2. The average area of snow in MYD10L2 and VSCMO were 5.72% and 11.43%, no-snow 26.65% and 28.67% and cloud 65.02% and 59.91%, respectively. It is evident that, on average, VIIRS has more snow and no-snow pixels but fewer cloud pixels compared to MODIS.
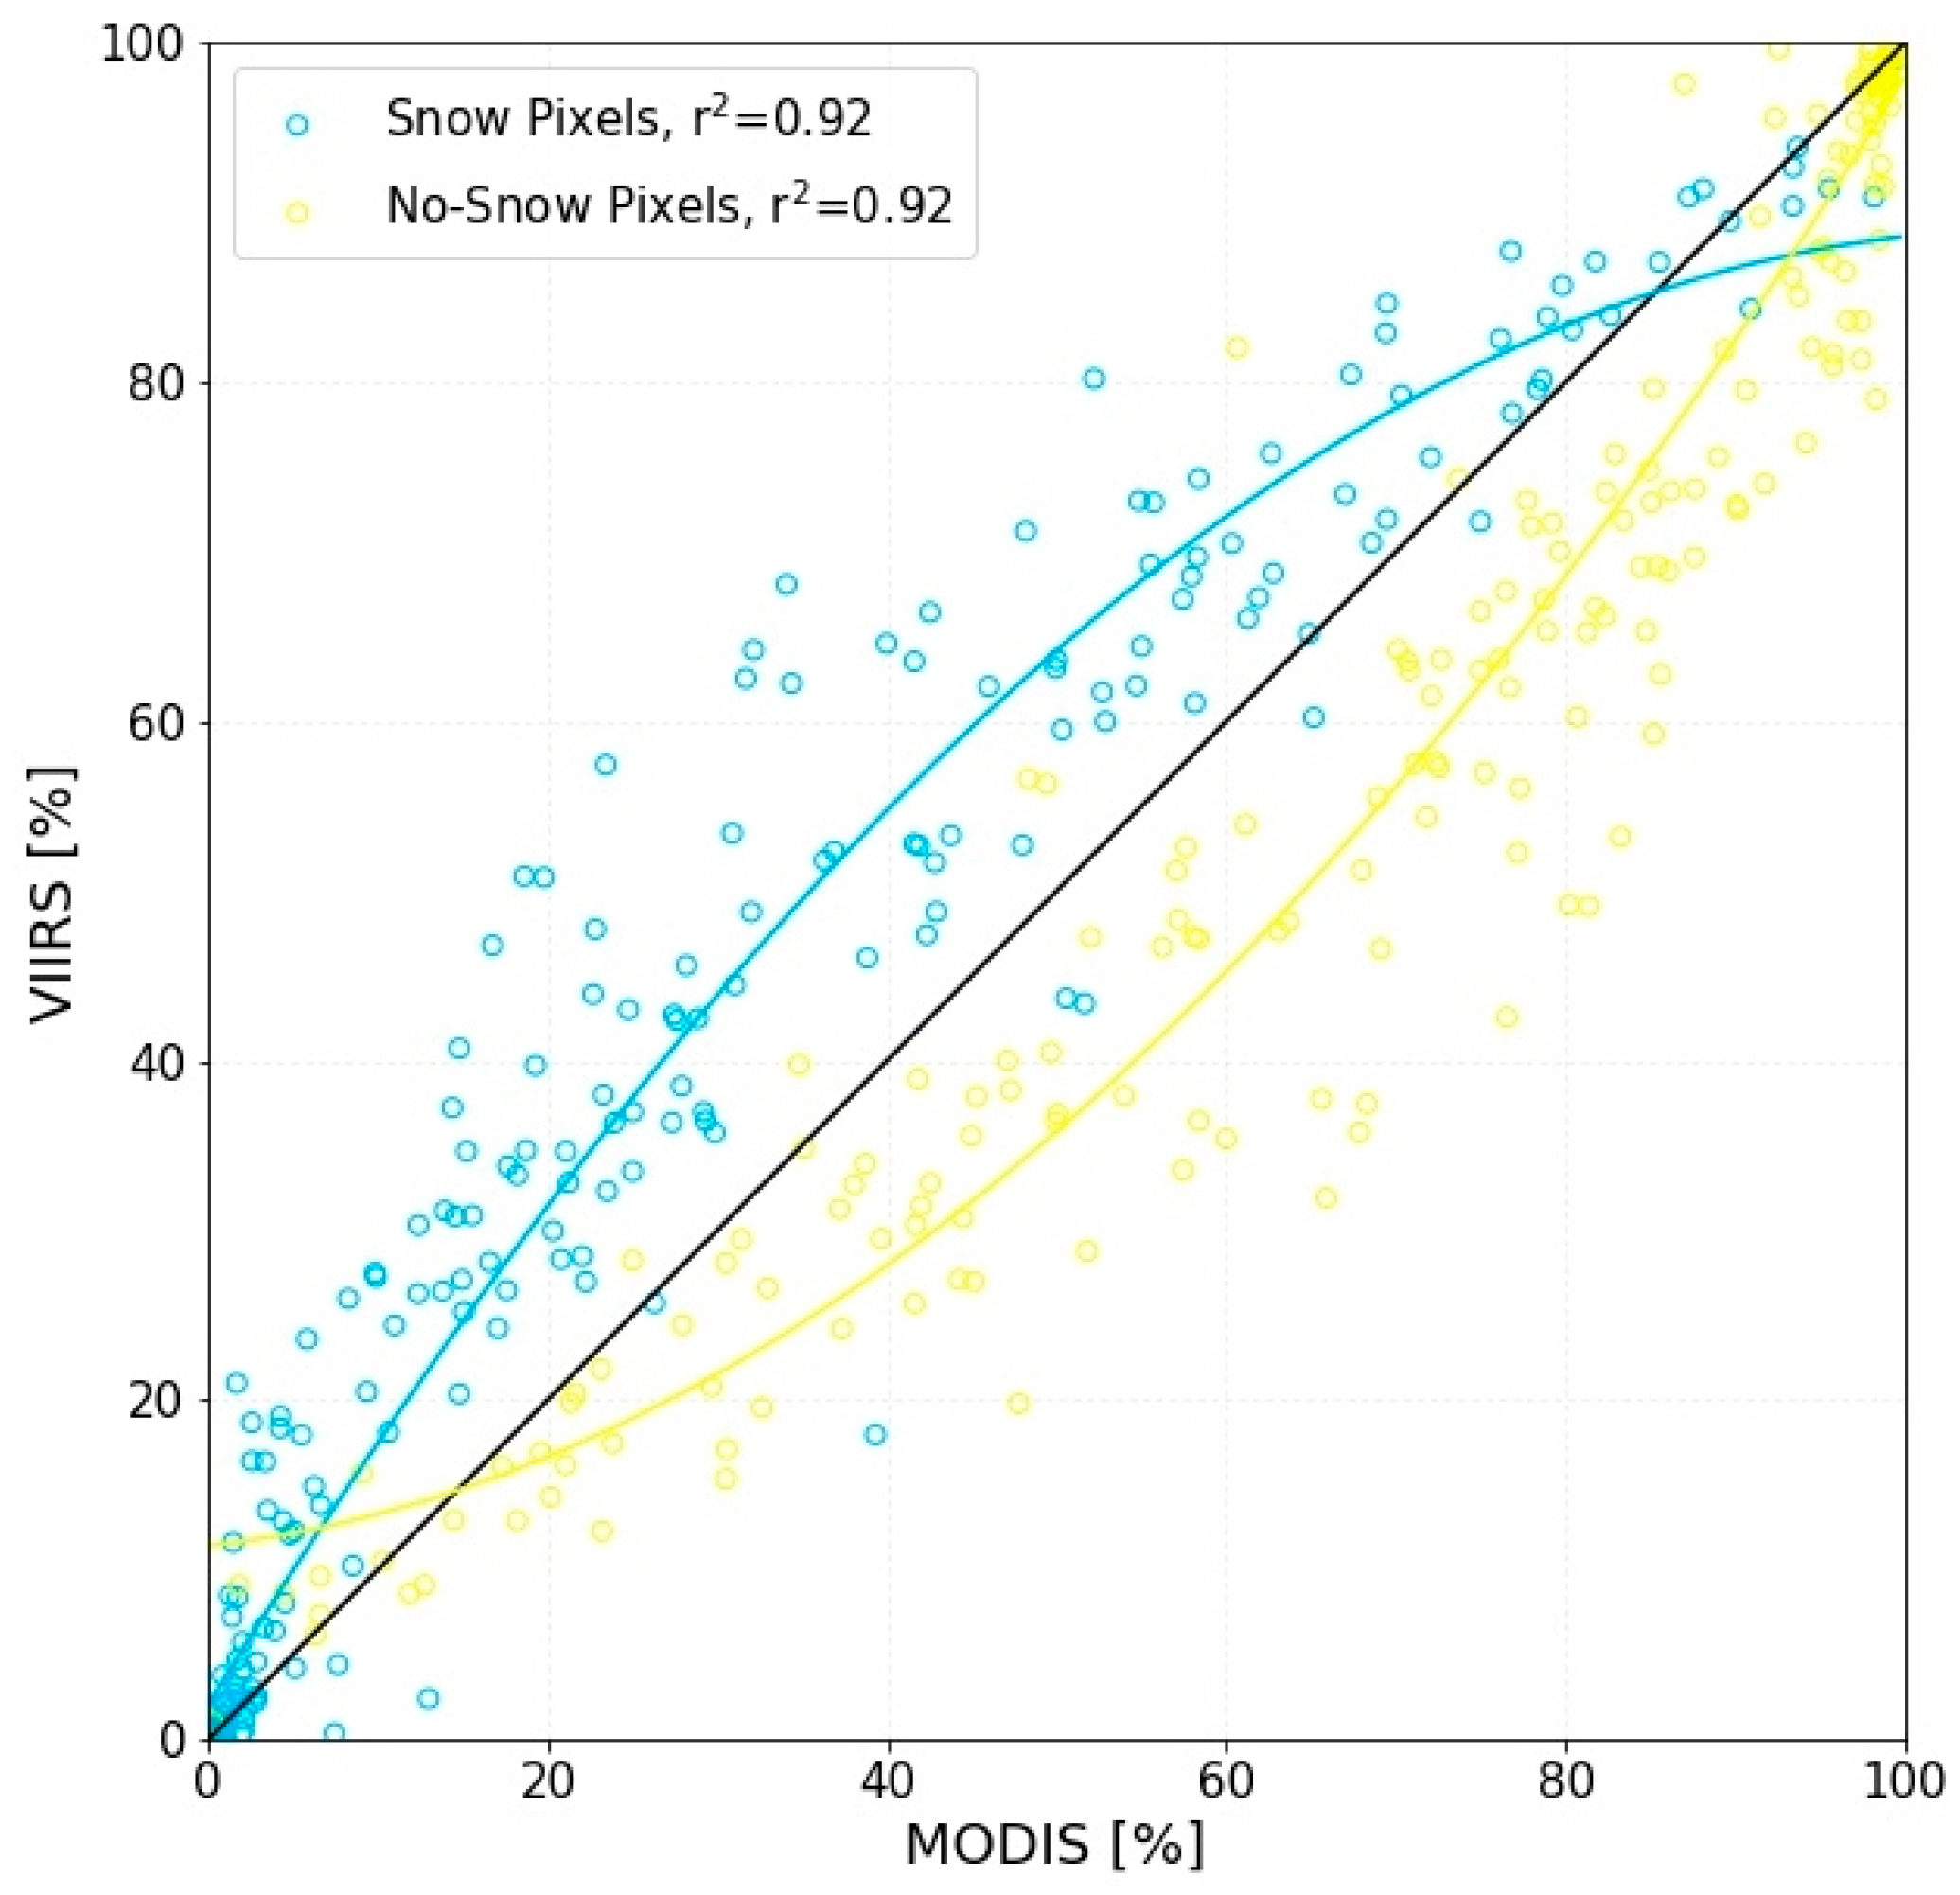
Figure 4 depicts that VIIRS consistently maps more snow and also has fewer no-snow pixels than MODIS when cloud pixels were excluded from analysis. On average, snow pixels of MODIS and VIIRS comprises of 24.45% and 31.15% and no-snow pixels comprises of 75.55% and 68.85%, respectively.
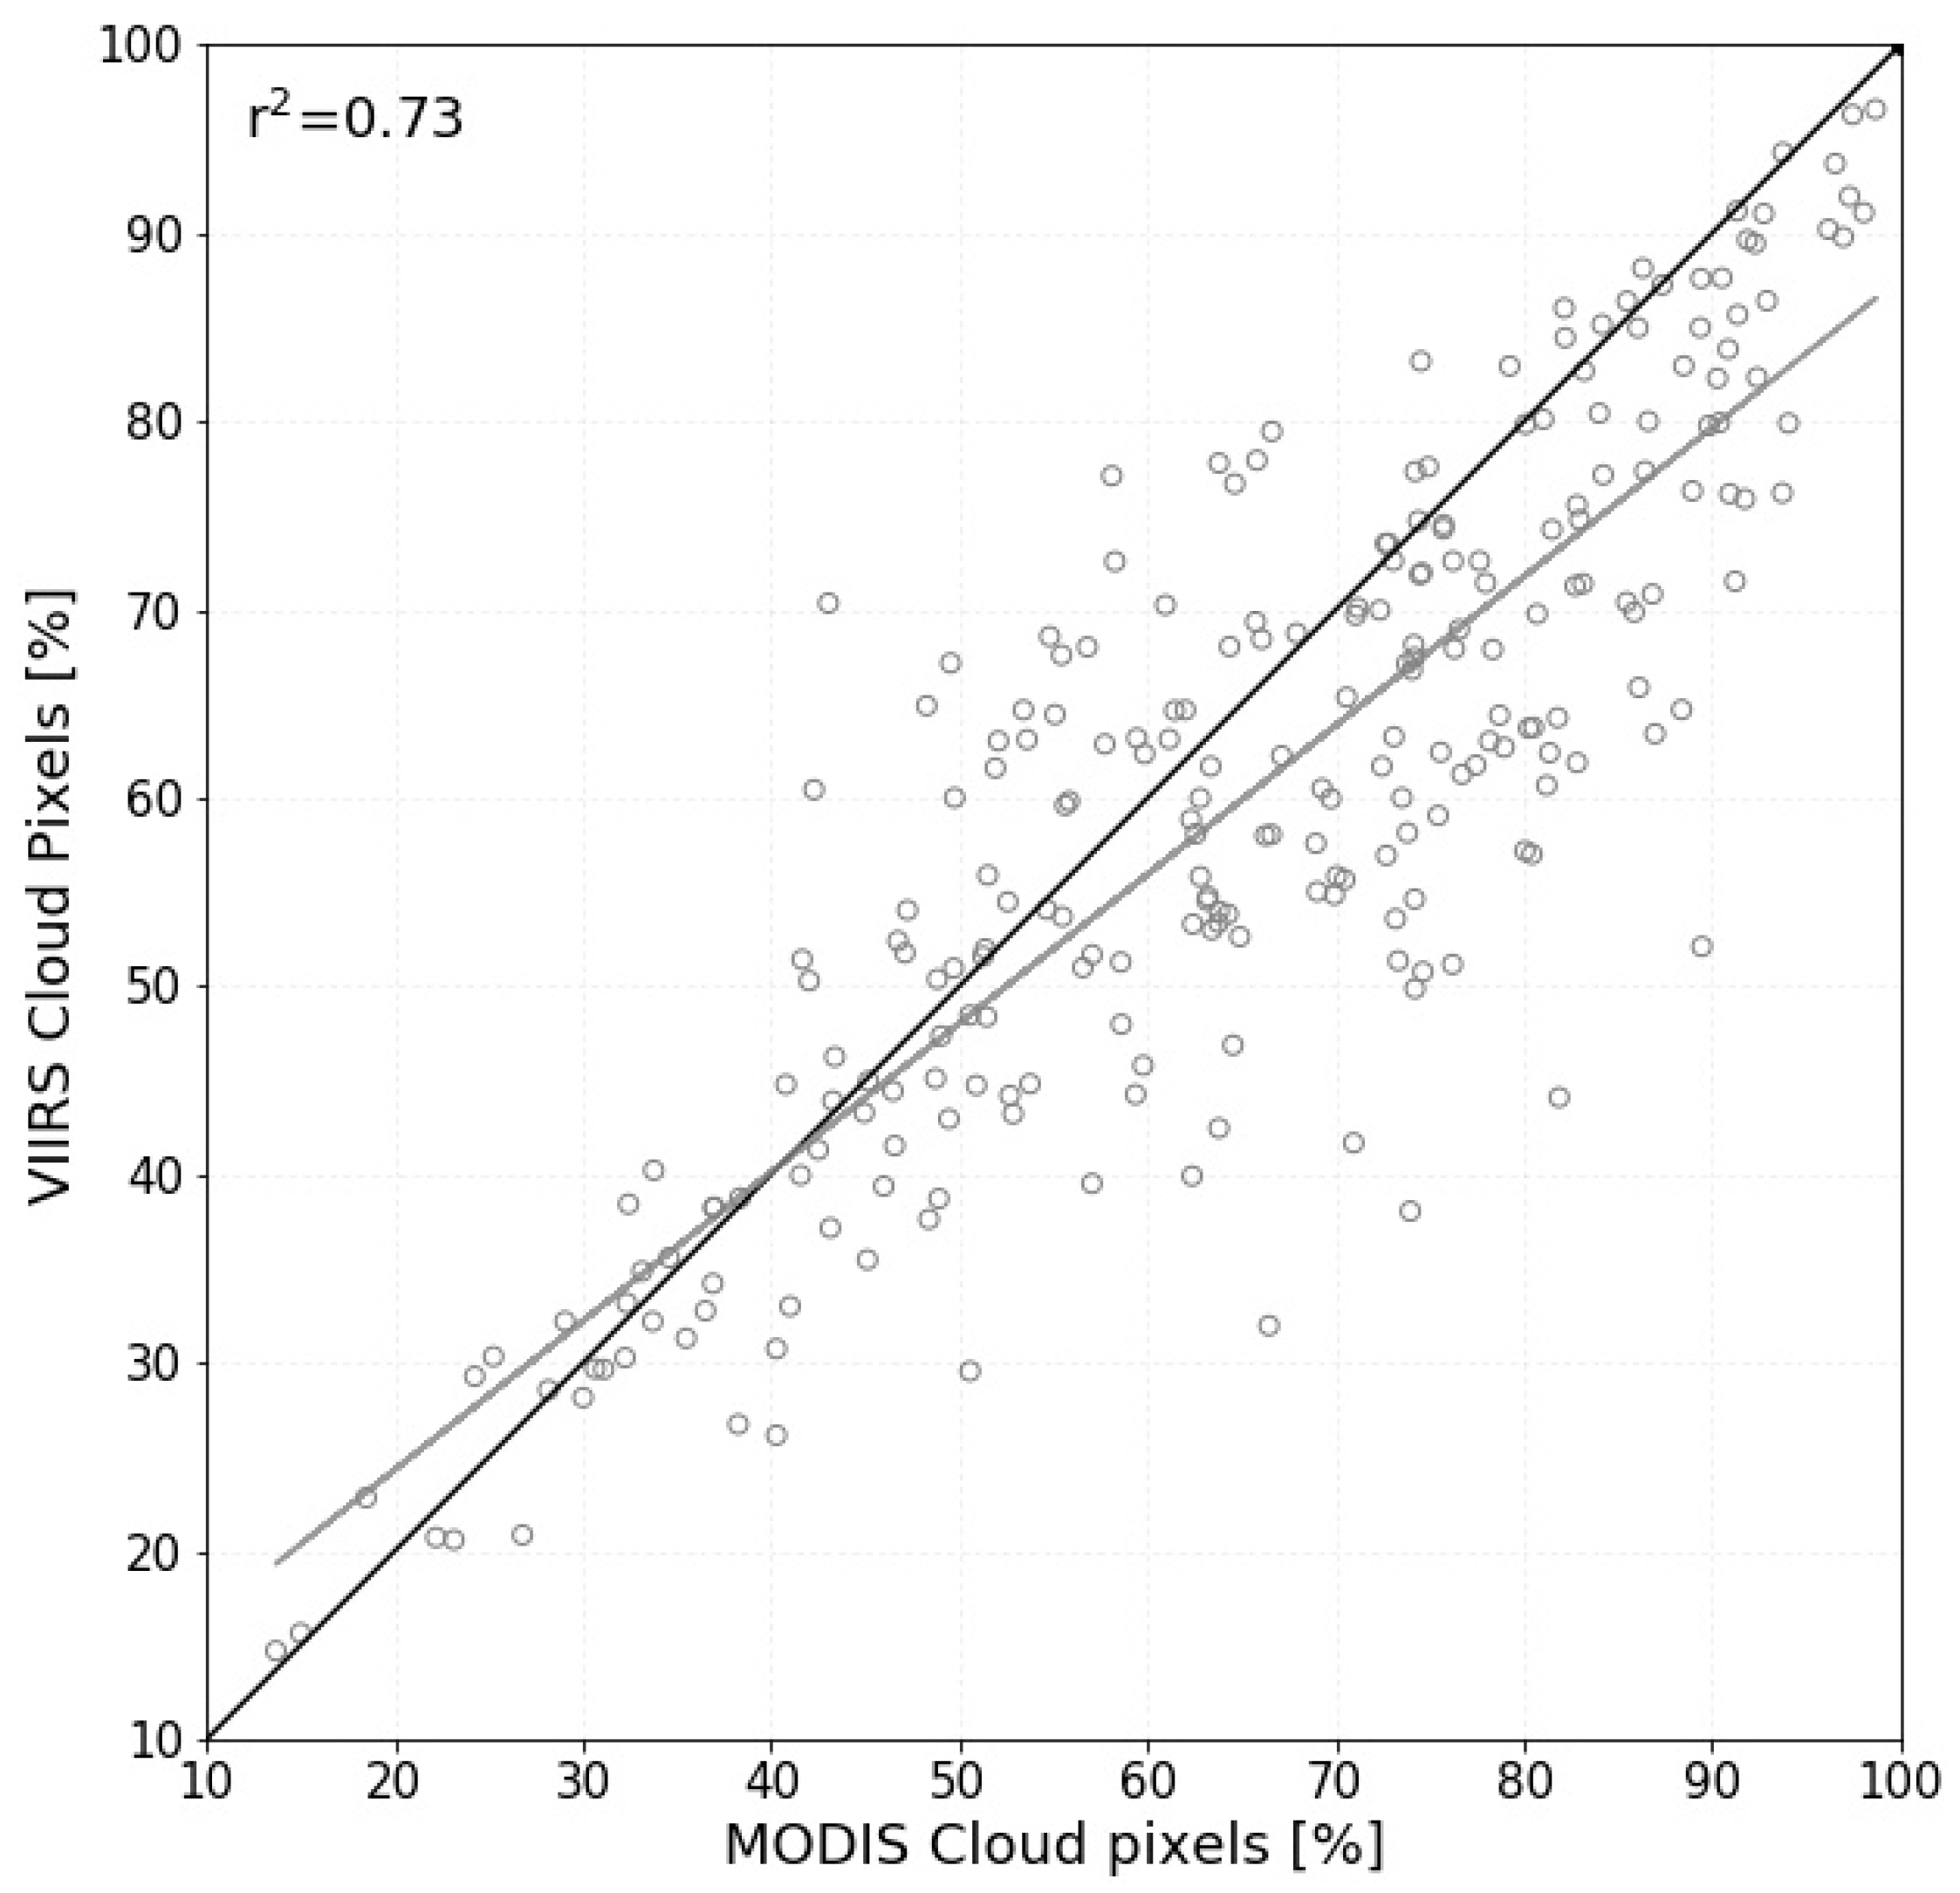
Furthermore, cloud is one of the limiting factors for optical snow cover area mapping in this study. The scatter plot between VIIRS and MODIS cloud pixels (Figure 5) indicated more MODIS cloud pixels than VIIRS. On average, MODIS had about 65% of cloud cover while VIIRS had about 60% of cloud cover during the study period.
3.3. Quantitative Comparison between MODIS and VIIRS Snow Maps
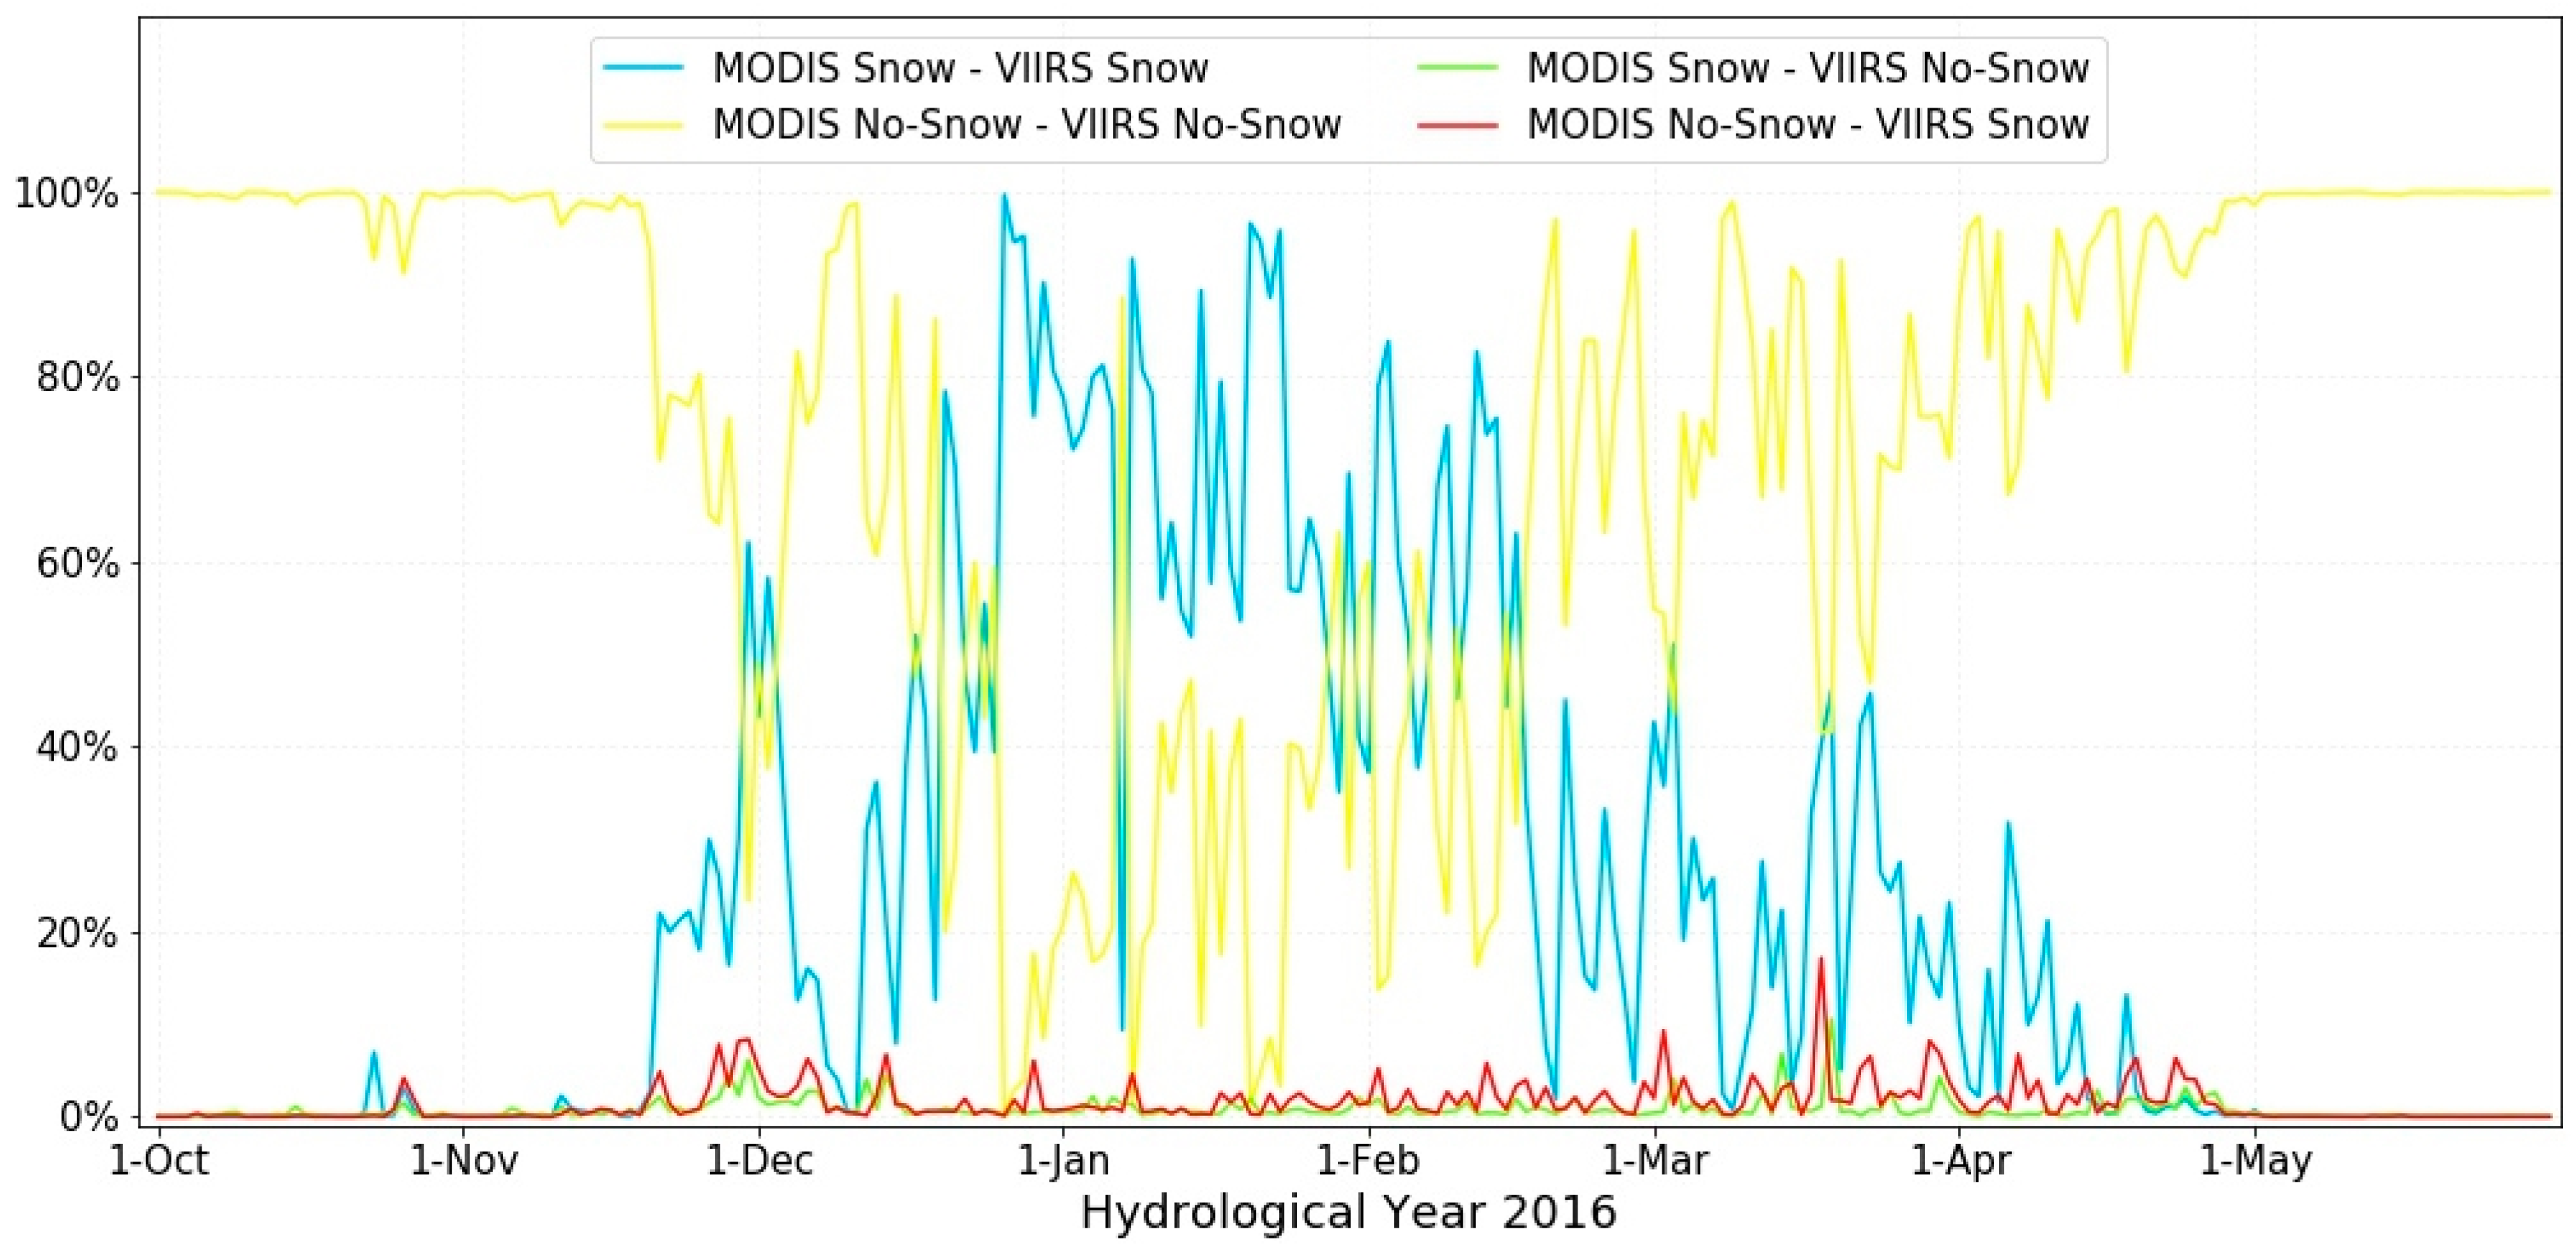
The snow and no-snow classification agreement and disagreement between MODIS and VIIRS binary snow maps during each day of the 2016 hydrological year on a pixel by pixel basis were summarized in Figure 6. The level of agreement between MODIS and VIIRS snow map is measured by MODIS snow – VIIRS snow and MODIS no-snow – VIIRS no-snow pixels, which are the cases where both MODIS and VIIRS agree on snow-covered and snow-free conditions to the total number of comparisons as recommended by Klein and Barnett [20]. The MODIS snow – VIIRS snow (blue line) and MODIS no-snow – VIIRS no-snow (yellow line) representation on Figure 6 also indicates the general timing of the snow and no-snow season over the study area. The major snow season over the study area was during mid-November to mid-April. On the other hand, the level of disagreement between MODIS and VIIRS snow map is measured by MODIS snow – VIIRS no-snow and MODIS no-snow – VIIRS snow pixels which are the cases where either MODIS or VIIRS maps snow but the other does not [20]. In Figure 6, the green line is the case where MODIS maps snow but VIIRS does not (omission errors), while the red line no-snow while red line is the case where MODIS maps no-snow but VIIRS maps snow (commission errors). These two lines depict that typically VIIRS maps more snow pixels compared to MODIS even at the 30% NDIS Snow Cover threshold.
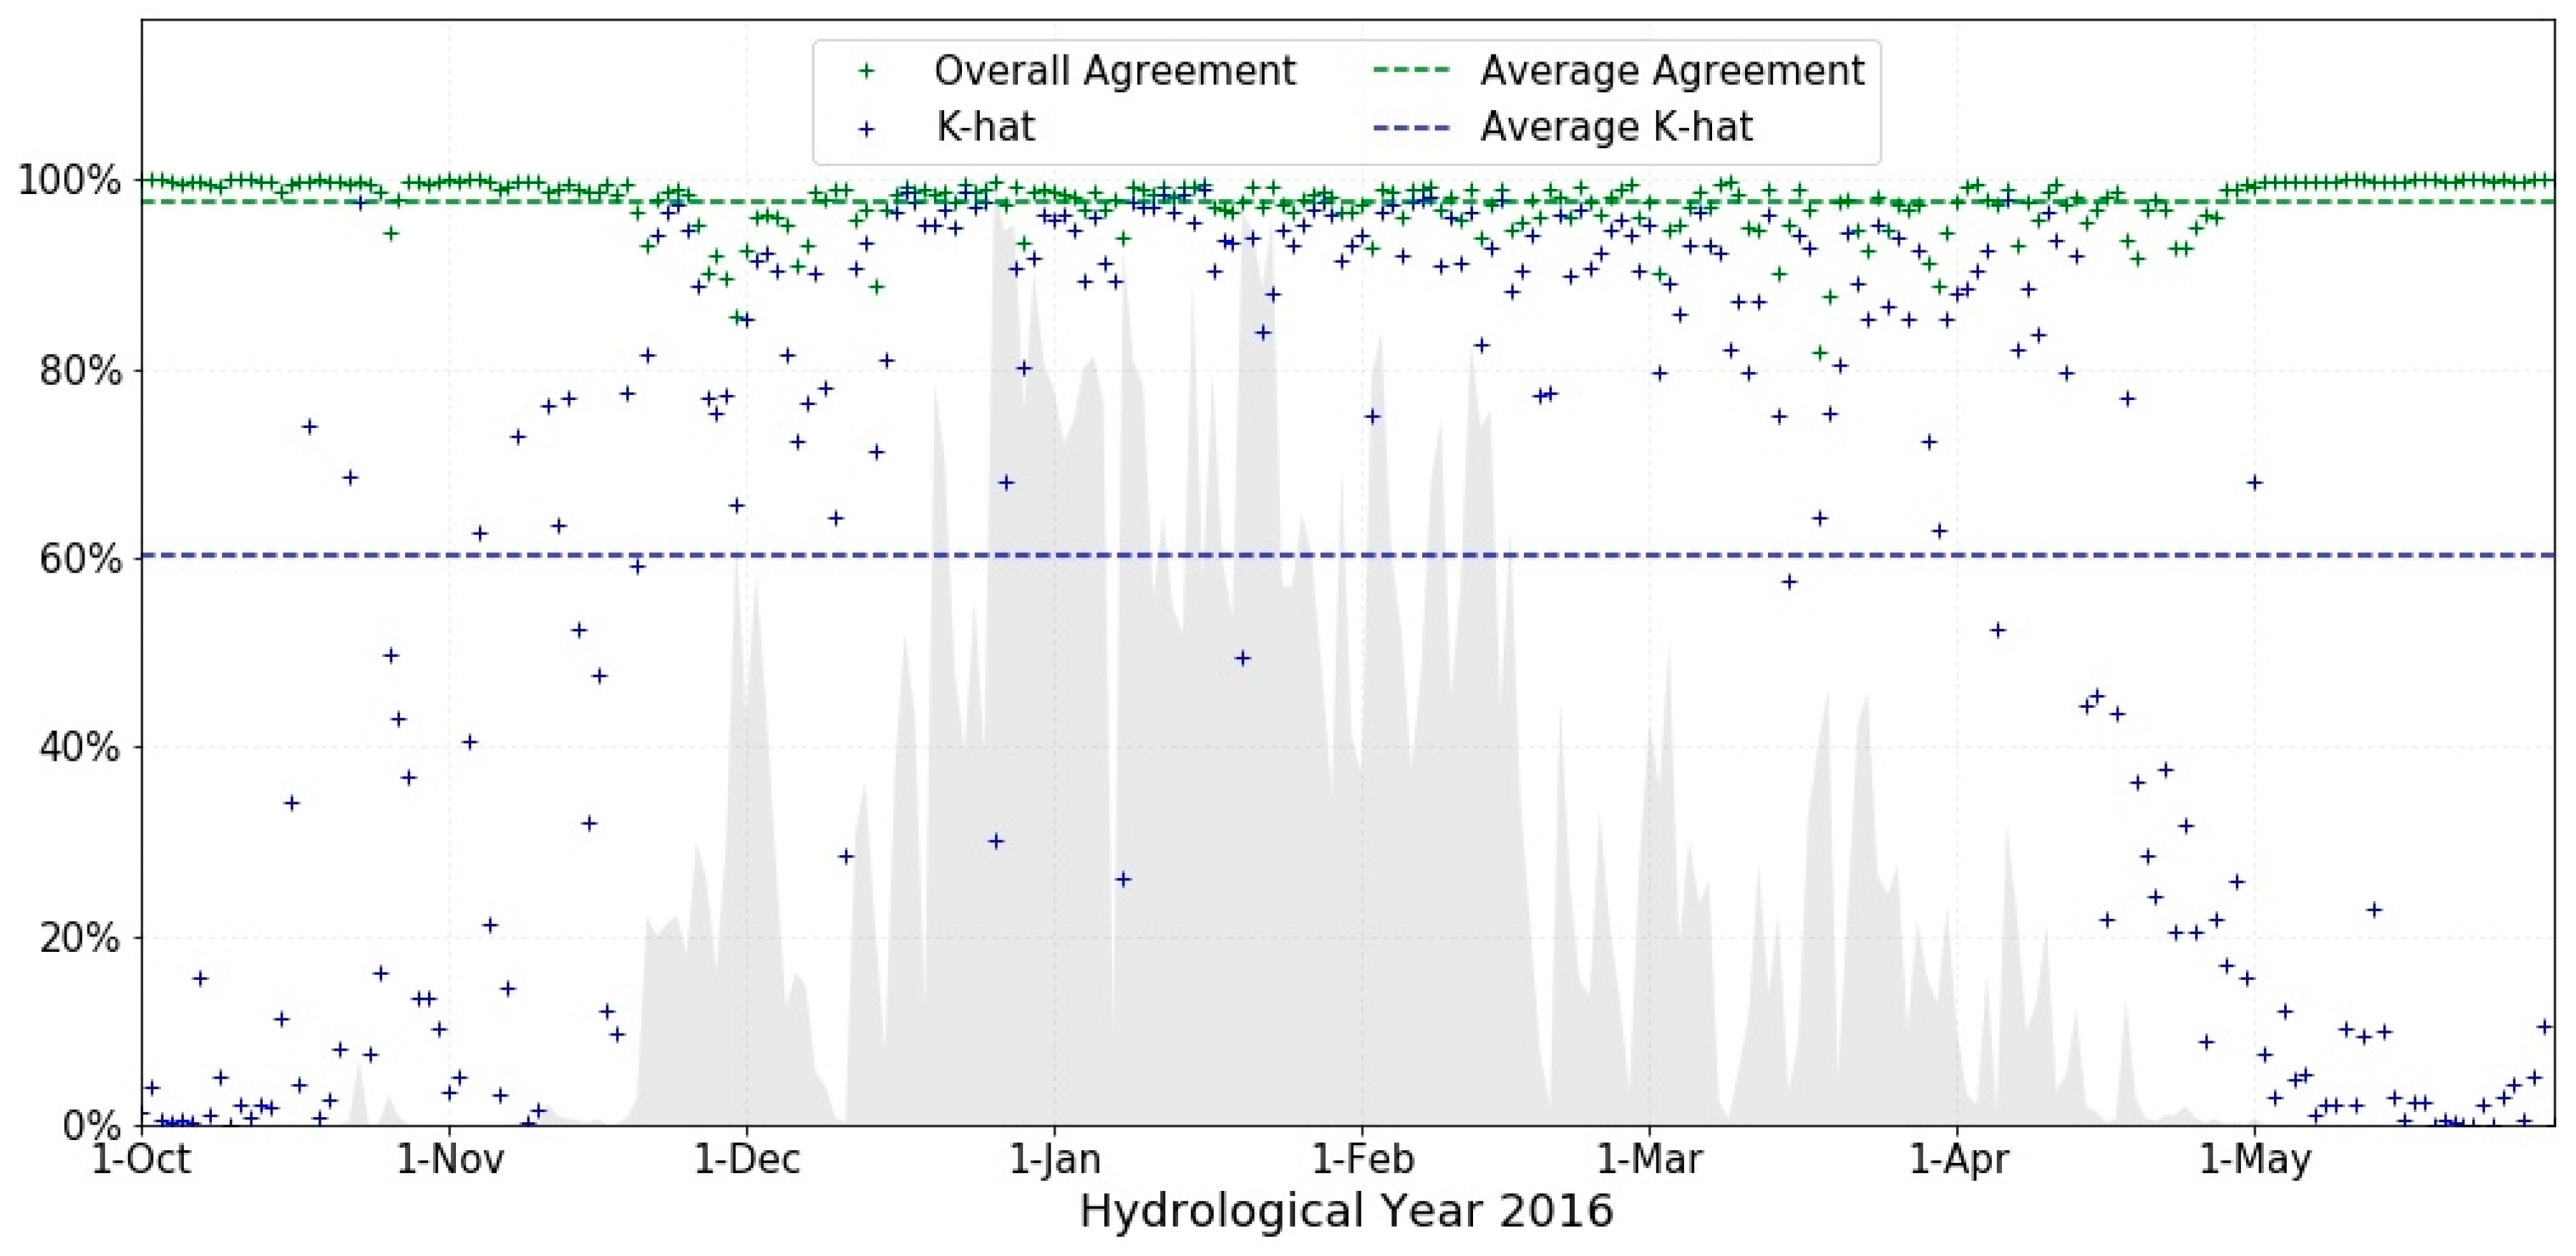
The confusion matrix for all non-cloudy pixels mapped during the study period presented in Table 3. The first number in the cell indicates the total number of pixel counts while the number in parenthesis indicates the percentage of these counts. On average during the study period, about 1% of time MODIS mapped snow but VIIRS did not, whereas 2% of the time VIIRS mapped snow but MODIS did not. So, overall VIIRS is slightly overestimating the snow cover area during the 2016 hydrological year compared to MODIS. The overall agreement between MODIS and VIIRS was about 98% with Cohen’s Kappa 0.601, indicating a moderate level of agreement according to Landis and Koch [37]. The pattern of overall agreement and Kappa statistics during each day of the 2016 hydrological year over the study area is illustrated in Figure 7.
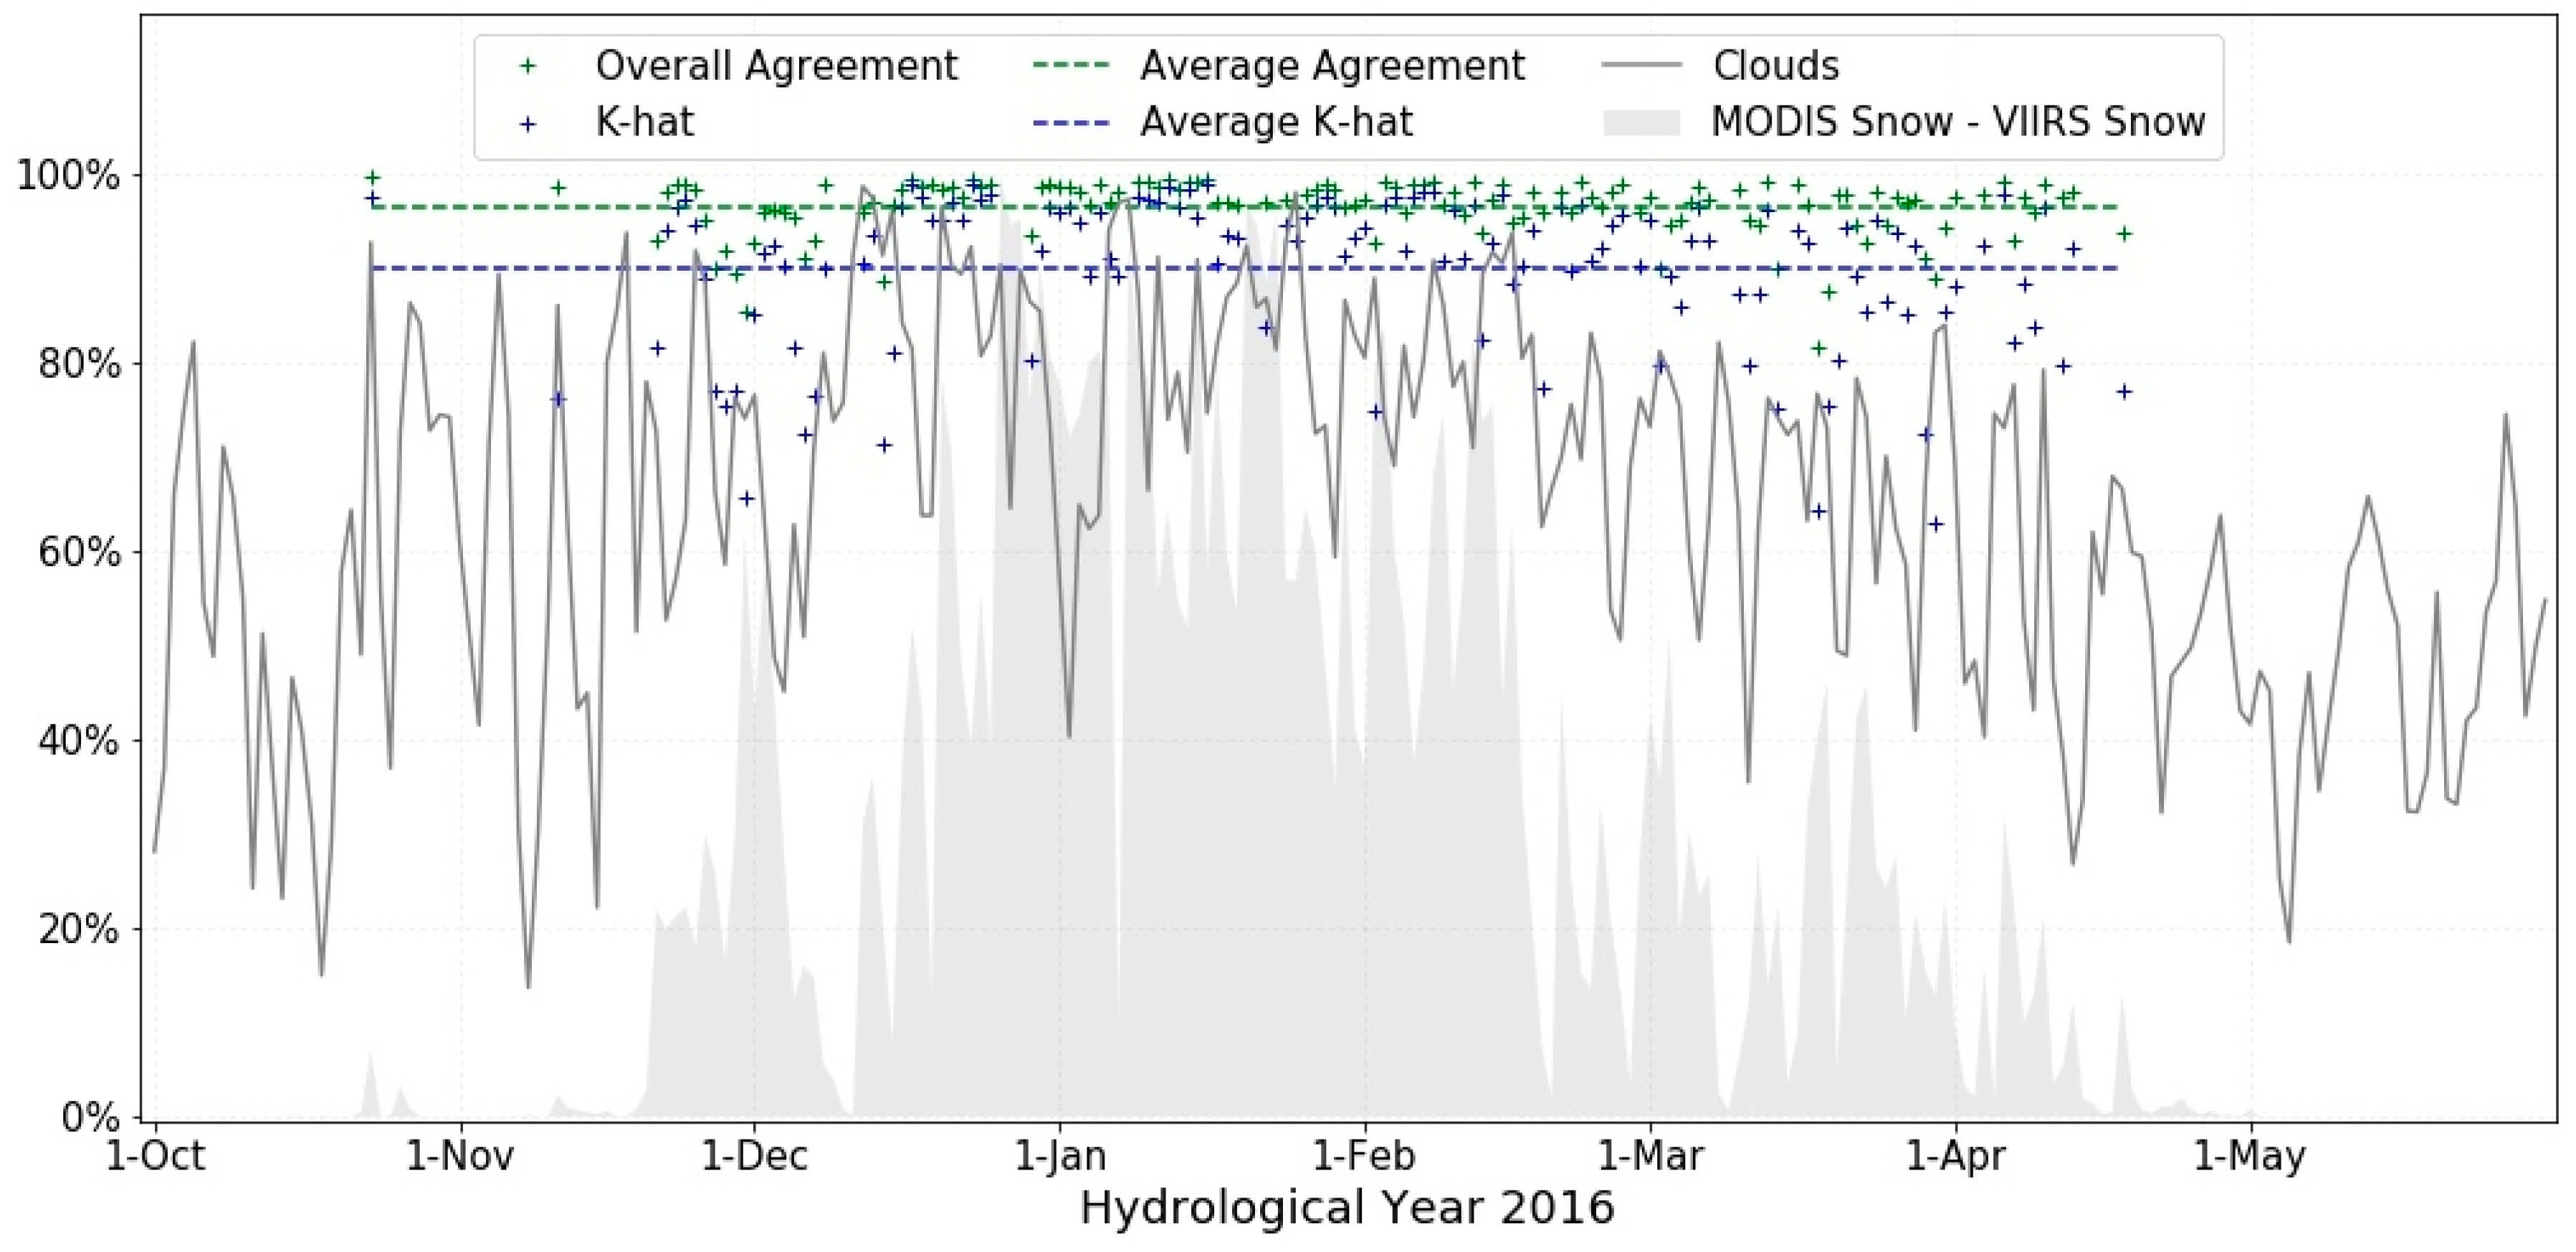
In the analysis, when either the agreement between MODIS and VIIRS for snow or non-snow become small, approximately 5% of the total pixels, the Kappa statistics become unreliable estimates of the agreement between the two snow products. This is more typically a problem in the snow-free season when few snow-covered pixels occur. Thus, all data with MODIS snow – VIIRS snow or MODIS no-snow – VIIRS no-snow value less than 5% were removed and reanalyzed. Table 4 and Figure 8 is an example demonstrating improvement on the Cohen’s Kappa with 0.899 indicating almost perfect level of agreement according to Landis and Koch [37].
3.4. Qualitative Comparison with False Color Composite Imagery
The false color imagery of both MODIS and VIIRS were compared with their corresponding snow maps. The visual comparison depicts good qualitative agreement between visible snow cover areas in the MODIS and VIIRS false color images (blue hue) and mapped in their respective snow cover products. The false color comparison between MODIS and VIIRS demonstrates that snow cover area is slightly higher in VIIRS compared to MODIS while cloud cover portion is higher in MODIS, which could be associated with different cloud cover mask used for MODIS and VIIRS snow cover product. Figure 9; Figure 10 exhibits more area mapped as snow in VIIRS compared to MODIS. Also, snow/cloud confusion over the traces of snow, particularly in snow/no-snow transition zone is higher in MODIS as compared to VIIRS as depicted in Figure 9; Figure 10, which could be the reason for higher VIIRS snow commission.
3.5. Qualitative Comparison for Individual Days
Comparison maps for individual days were developed for a better assessment of snow mapping differences between MODIS and VIIRS [20]. The visual assessment of the comparison maps indicates that the overall agreement between MODIS and VIIRS is high during the winter season. Figure 11; Figure 12 depicts that MODIS has mapped more clouds as compared to VIIRS, particularly over the edges of snow-covered areas. Furthermore, snow/no-snow transition zone is mapped as clouds in both MODIS and VIIRS (Figure 11; Figure 12).
4. Discussion
4.1. MODIS Fractional Snow Cover Threshold
The optimal fractional snow cover threshold of the MODIS swath snow map was determined as 30% to generate MODIS binary snow cover maps most comparable to the VIIRS products over the study area. Before MODIS C6 snow products, NDSI threshold value of 0.4 recommended by Dozier [9] was used to produce MODIS binary snow map. However, this value is not universally applicable [19] and the binary map was deleted in MODIS Collection 6 where snow cover area is represented as NDSI Snow Cover in the range of 0–100% [15]. The user can select the NDSI threshold for snow using the NDSI Snow Cover based on land cover types of the study area to produce binary snow maps [15].
The NDSI threshold of 0.4 is equivalent to 50% or more snow cover fraction in a pixel [28] and VIIRS binary snow map is limited to an NDSI range of 0.4 to 1.0 [18,21]. However, in this study, when MODIS binary snow map generated at 50% FSC threshold was compared with VIIRS snow map, average snow omission for MODIS was high around 45%. However, the snow omission decreases with the decrease in threshold values and at nearly 30% threshold value, snow omission error for both MODIS and VIIRS was equivalent. Consequently, 30% FSC value was used as a threshold to produce MODIS binary snow maps. Thus, 0.4 NDSI threshold is not applicable to produce MODIS binary snow maps most comparable to VIIRS binary snow map over the study area.
VIIRS is considered as an extension of MODIS [23]. In order to ensure the smooth transition of MODIS to VIIRS in climate data records developed from both satellites, snow cover extent needs to be comparable between MODIS and VIIRS. The higher spatial resolution of VIIRS potentially enables it to map snow cover area more accurately than MODIS. This study suggests that VIIRS is slightly overestimating (6% more) the snow when compared to MODIS at the 30% FSC threshold which appears to produce the most comparable snow cover maps. However, VIIRS snow commission errors relative to MODIS increase with increases in MODIS FSC thresholds, which could mislead that snow cover is increasing once VIIRS replaces MODIS. Thus, 50% MODIS FSC threshold does not best approximate the VIIRS binary snow product in this study.
4.2. Total Snow, No-Snow and Cloud
On average, MODIS and VIIRS snow map classified comparable areas as no-snow pixels. However, VIIRS categorized fewer pixels (5% less on average) as cloud compared to MODIS. Key et al. [3] depicted that the fraction of cloud pixels in VIIRS binary snow map was 65–70% during a six-month period running from December 2012 to May 2013. However, this study exhibited 59.91% as the average cloud pixel in VIIRS during the study period of the 2016 hydrological year. This difference could be due to the improvement in the VIIRS Cloud Mask algorithm. Similarly, this study depicted 65.02% as the cloud pixel in MODIS which is within the range of 65–70% illustrated by Wang et al. [33] in collection 4 MODIS snow products. Although the cloud mask used for MODIS C6 snow cover product has been revised, it has not been able to reduce cloud/snow confusion completely [15], which is also present in VIIRS snow products. Thus, the cloud is a major limiting factor in optical snow cover mapping. The average aerial coverage of snow pixels is 5.72% and 11.43% of the total area in MODIS and VIIRS snow cover maps, respectively. Thus, VIIRS classified almost 6% more of the study area snow compared to MODIS. These differences were more prevalent during the winter and spring season.
4.3. Quantitative Comparison between MODIS and VIIRS Snow Maps
The quantitative intercomparison between MODIS and VIIRS snow cover map indicates good agreement between them with 97.67% average agreement during the 2016 hydrological year. Thus, VIIRS has the potential of providing continuity to binary MODIS snow products. The agreement between MODIS and VIIRS snow map is higher during winter season than during late fall or spring season. For example, on 17 December 2015, the overall agreement was 99.40% with Kappa statistics 0.988 indicating the almost perfect level of agreement according to Landis and Koch [37]. However, during early spring on 18 March 2016 when snow cover is patchy, the overall agreement between MODIS and VIIRS decreases to 81.73% with Kappa statistics 0.644 indicating a moderate level of agreement. Similar results were observed by Ault et al. [2] and Key et al. [3] in their studies of MODIS and VIIRS snow cover products. Many factors affect the agreement between MODIS and VIIRS snow maps. One of the potentially important factors are errors associated with the preprocessing steps including data projection and resampling [38]. In this study, 500 m MODIS was oversampled to 375 m for MODIS-VIIRS binary comparison. Additionally, the 250 m water mask was undersampled to 375 m before extracting the land pixels. In addition, differences in spatial and spectral resolution between MODIS and VIIRS could influence their agreement.
4.4. Qualitative Comparison with False Color Composite Imagery
The visual comparison of MODIS and VIIRS with their corresponding false color imagery (Figure 9; Figure 10) exhibited good agreement with the major patterns of the snow cover distribution. Some irregularities were observed in forested areas during early spring that could be associated with low reflectance of aged melting snow in the visible spectral bands [3]. VIIRS tends to map more snow in forest areas than MODIS. The false color imagery of MODIS and VIIRS also exhibit that snow cover area represented by blue hue is more visible and clearer in VIIRS that could be due to the higher spatial resolution of VIIRS. Moreover, comparison of false color imagery with the snow cover map reveals that MODIS cloud mask tends to map more areas as cloudy as compared to VIIRS, specifically along the snow/no-snow transition zone and when snow cover is patchy. However, snow/cloud confusion is prevalent in both MODIS and VIIRS snow maps.
4.5. Qualitative Comparison for Individual Days
To assess the differences in snow mapping between MODIS and VIIRS, comparison maps (Figure 11; Figure 12) for individual days during the 2016 hydrological year was produced [20]. The comparison maps exhibited that both MODIS and VIIRS snow map recorded the boundaries of the snow-covered areas or the snow/land transition zone as cloudy. MODIS cloud mask is more likely to map the boundaries of snow-covered areas as cloudy as depicted by Ault et al. [2] and Wang et al. [33]. Snow/cloud confusion in the land-snow transition is due to thin, sparse or lower fraction of snow on the edges [2,20,27,33]. The cloud mask often identifies thin, sparse snow cover as cloud because snow may not cover a large percentage pixel to exhibit strong spectral signature when trace amounts of snow are present, which is more common on the edge of the snow-covered area [27]. Key et al. [3] also reported that even during the clear atmosphere, the transition zone between snow and land is often recorded as cloudy in the VIIRS snow map and they concluded that conservative VIIRS cloud mask was one of the reasons for the snow/cloud confusion. The comparison maps also exhibit that MODIS tends to map more clouds in the transition zone as compared to VIIRS. Snowmelt condition, snow cover patchiness or shallow snow depth and vegetation cover visible in the traces of snow also affects the accuracy of snow cover mapping [2,27]. Furthermore, the cloud mask more often likely to mask more clouds than are present and sometimes it does not identify certain cloud as cloud [27]. For example, cirrus cloud is often mapped as snow [2].
5. Conclusions
The analysis and intercomparison of 244 MODIS and VIIRS swath snow maps during the 2016 hydrological year exhibited good overall agreement between them. Furthermore, MODIS NDSI Snow Cover threshold of 30% was determined as optimal for generating MODIS binary snow maps most comparable to VIIRS binary snow maps over the study area. However, this value cannot be generalized beyond this study area. Additionally, the assessment of total snow and cloud pixels and comparison snow maps of MODIS and VIIRS indicates that VIIRS is mapping more snow cover and less cloud cover compared to MODIS. This could be associated with VIIRS being higher spatial resolution (375 m). The overall agreement of 97.67% between MODIS and VIIRS exceeds the VIIRS accuracy requirements of 90% probability of correct typing. From the overall assessment, it can be concluded that VIIRS and MODIS have a similar capacity to map snow cover. Moreover, VIIRS has more potential to accurately map the snow cover area. Additionally, VIIRS can fulfill the aim of providing long-term continuity of satellite snow cover maps for the successful development of a climate data record.
Author Contributions
S.T. and A.G.K. conceived and designed the study; S.T. performed literature review and wrote the first draft of the manuscript; S.T., P.K.C. and A.G.K. revised and proofread the manuscript for publication.
Funding
This research received no external funding.
Acknowledgments
The authors would like to thank anonymous reviewers for their critical feedback on the manuscript.
Conflicts of Interest
The authors declare no conflict of interest.
References
- Leathers, D.J.; Luff, B.L. Characteristics of snow cover duration across the northeast United States of America. Int. J. Climatol. 1997, 17, 1535–1547. [Google Scholar] [CrossRef] [Green Version]
- Ault, T.W.; Czajkowski, K.P.; Benko, T.; Coss, J.; Struble, J.; Spongberg, A.; Templin, M.; Gross, C. Validation of the MODIS snow product and cloud mask using student and NWS cooperative station observations in the Lower Great Lakes Region. Remote Sens. Environ. 2006, 105, 341–353. [Google Scholar] [CrossRef]
- Key, J.R.; Mahoney, R.; Liu, Y.; Romanov, P.; Tschudi, M.; Appel, I.; Maslanik, J.; Baldwin, D.; Wang, X.; Meade, P. Snow and ice products from Suomi NPP VIIRS. J. Geophys. Res. Atmos. 2013, 118, 12816–12830. [Google Scholar] [CrossRef]
- Solberg, R.; Andersen, T. An automatic system for operational snow-cover monitoring in the Norwegian mountain regions. In Proceedings of the Geoscience and Remote Sensing Symposium, 1994 (IGARSS ‘94), Pasadena, CA, USA, 8–12 August 1994; Volume 2084, pp. 2084–2086. [Google Scholar]
- Rosenthal, W.; Dozier, J. Automated Mapping of Montane Snow Cover at Subpixel Resolution from the Landsat Thematic Mapper. Water Resour. Res. 1996, 32, 115–130. [Google Scholar] [CrossRef]
- Vikhamar, D.; Solberg, R. Subpixel mapping of snow cover in forests by optical remote sensing. Remote Sens. Environ. 2003, 84, 69–82. [Google Scholar] [CrossRef]
- Salomonson, V.V.; Appel, I. Estimating fractional snow cover from MODIS using the normalized difference snow index. Remote Sens. Environ. 2004, 89, 351–360. [Google Scholar] [CrossRef]
- Romanov, P. Algorithm Theoretical Basis Document: VIIRS Binary Snow Cover Product; NOAA NESDIS: Silver Spring, MD, USA, 2015.
- Dozier, J. Spectral Signature of Alpine Snow Cover from the Landsat Thematic Mapper. Remote Sens. Environ. 1989, 28, 9–22. [Google Scholar] [CrossRef]
- Butt, M.J.; Bilal, M. Application of snowmelt runoff model for water resource management. Hydrol. Process. 2011, 25, 3735–3747. [Google Scholar] [CrossRef]
- Dietz, A.J.; Kuenzer, C.; Gessner, U.; Dech, S. Remote sensing of snow—A review of available methods. Int. J. Remote Sens. 2012, 33, 4094–4134. [Google Scholar] [CrossRef]
- Maurer, E.P.; Rhoads, J.D.; Dubayah, R.O.; Dennis, P.L. Evaluation of the Snow-Covered Area Data Product from Modis. Hydrol. Process. 2003, 17, 59–71. [Google Scholar] [CrossRef]
- Huang, X.D.; Liang, T.G.; Zhang, X.T.; Guo, Z.G. Validation of MODIS snow cover products using Landsat and ground measurements during the 2001–2005 snow seasons over northern Xinjiang, China. Int. J. Remote Sens. 2011, 32, 133–152. [Google Scholar] [CrossRef]
- Dobreva, I.D.; Klein, A.G. Fractional snow cover mapping through artificial neural network analysis of MODIS surface reflectance. Remote Sens. Environ. 2011, 115, 3355–3366. [Google Scholar] [CrossRef] [Green Version]
- Riggs, G.A.; Hall, D.K.; Roman, M.O. MODIS Snow Products Collection 6 User Guide; version 1.0; NASA Goddard Space Flight Center: Greenbelt, MD, USA, August 2016.
- Lucas, R.M.; Harrison, A.R. Snow observation by satellite: A review. Remote Sens. Rev. 1990, 4, 285–348. [Google Scholar] [CrossRef]
- Deng, J.; Huang, X.D.; Feng, Q.S.; Ma, X.F.; Liang, T.G. Toward Improved Daily Cloud-Free Fractional Snow Cover Mapping with Multi-Source Remote Sensing Data in China. Remote Sens. 2015, 7, 6986–7006. [Google Scholar] [CrossRef] [Green Version]
- Baker, N. Joint Polar Satellite System (JPSS) VIIRS Snow Cover Algorithm Theoretical Basis Document (ATBD); Northrop Grumman Aerospace Systems: Redondo Beach, CA, USA, 2011. [Google Scholar]
- Solberg, R.; Koren, H.; Amlien, J. A Review of Optical Snow Cover Algorithms; Note, No. SAMBA/40/06; Norwegian Computing Center: Oslo, Norway, 2006. [Google Scholar]
- Klein, A.G.; Barnett, A.C. Validation of daily MODIS snow cover maps of the Upper Rio Grande River Basin for the 2000–2001 snow year. Remote Sens. Environ. 2003, 86, 162–176. [Google Scholar] [CrossRef]
- Justice, C.O.; Román, M.O.; Csiszar, I.; Vermote, E.F.; Wolfe, R.E.; Hook, S.J.; Friedl, M.; Wang, Z.; Schaaf, C.B.; Miura, T.; et al. Land and cryosphere products from Suomi NPP VIIRS: Overview and status. J. Geophys. Res. Atmos. 2013, 118, 9753–9765. [Google Scholar] [CrossRef] [Green Version]
- Riggs, G.A.; Hall, D.K.; Roman, M.O. NASA S-NPP VIIRS Snow Products Collection 1 User Guide; version 1.0; NASA Goddard Space Flight Center: Greenbelt, MD, USA, 2016.
- Zhang, R.; Huang, C.; Zhan, X.; Dai, Q.; Song, K. Development and validation of the global surface type data product from S-NPP VIIRS. Remote Sens. Lett. 2016, 7, 51–60. [Google Scholar] [CrossRef]
- Riggs, G.A.; Hall, D.K.; Roman, M.O. VIIRS Snow Cover Algorithm Theoretical Basis Document (ATBD); version 1.0; NASA Goddard Space Flight Center: Greenbelt, MD, USA, 2015.
- Friedl, M.A.; Sulla-Menashe, D.; Tan, B.; Schneider, A.; Ramankutty, N.; Sibley, A.; Huang, X. MODIS Collection 5 Global Land Cover: Algorithm Refinements and Characterization of New Datasets, 2001–2012; Boston University: Boston, MA, USA, 2010. [Google Scholar]
- Channan, S.; Collins, K.; Emanuel, W.R. Global Mosaics of the Standard MODIS Land Cover Type Data; University of Maryland and the Pacific Northwest National Laboratory: College Park, MD, USA, 2014. [Google Scholar]
- Hall, D.K.; Riggs, G.A. Accuracy assessment of the MODIS snow cover products. Hydrol. Process. 2007, 21, 1534–1547. [Google Scholar] [CrossRef]
- Hall, D.K.; Riggs, G.A.; Salomonson, V.V.; Barton, J.; Casey, K.; Chien, J.; DiGirolamo, N.; Klein, A.; Powell, H.; Tait, A. Algorithm Theoretical Basis Document (ATBD) for the MODIS Snow and Sea Ice-Mapping Algorithms; NASA Goddard Space Flight Center: Greenbelt, MD, USA, 2001.
- Reed, B. Joint Polar Satellite System (JPSS) Operational Algorithm Description (OAD) Document for VIIRS Snow Cover Environmental Data Record (EDR) Software; NASA Goddard Space Flight Center: Greenbelt, MD, USA, 2013.
- White, D.A. The MODIS Conversion Toolkit (MCTK) User’s Guide. Available online: https://github.com/dawhite/MCTK/releases (accessed on 15 December 2016).
- White, D.A. The VIIRS Conversion Toolkit (MCTK) User’s Guide. Available online: https://github.com/dawhite/VCTK/releases (accessed on 15 December 2016).
- Parajka, J.; Blöschl, G. Validation of MODIS snow cover images over Austria. Hydrol. Earth Syst. Sci. Discuss. 2006, 3, 1569–1601. [Google Scholar] [CrossRef]
- Wang, X.W.; Xie, H.J.; Liang, T.G.; Huang, X.D. Comparison and validation of MODIS standard and new combination of Terra and Aqua snow cover products in northern Xinjiang, China. Hydrol. Process. 2009, 23, 419–429. [Google Scholar] [CrossRef]
- Congalton, R.G. A review of assessing the accuracy of classifications of remotely sensed data. Remote Sens. Environ. 1991, 37, 35–46. [Google Scholar] [CrossRef]
- Cohen, J. A coefficient of agreement for nominal scales. Educ. Psychol. Meas. 1960, 20, 37–46. [Google Scholar] [CrossRef]
- Richards, J.A. Remote Sensing Digital Image Analysis: An Introduction, 3rd ed.; Springer: Berlin/Heidelberg, Germany, 1999. [Google Scholar]
- Landis, J.R.; Koch, G.C. The measurement of observer agreement for categorical data. Biometrics 1977, 33, 159–174. [Google Scholar] [CrossRef] [PubMed]
- Lunetta, R.S.; Congalton, R.G.; Fenstermaker, L.K.; Jensen, J.R.; McGwire, K.C.; Tinney, L.R. Remote Sensing and Geographic Information System Data Integration: Error Sources and Research Issues. Photogramm. Eng. Remote Sens. 1991, 57, 677–687. [Google Scholar]
Figure 1.
Study area with land cover types representing the portion of Central and Western Canada and the Midwestern United States.
Figure 1.
Study area with land cover types representing the portion of Central and Western Canada and the Midwestern United States.

Figure 2.
Line plots showing average snow and no-snow commission and omission between MODIS (reference) and VIIRS snow maps with respect to different snow cover fraction thresholds. (MODIS: Moderate Resolution Imaging Spectroradiometer; VIIRS: Visible Infrared Imaging Radiometer Suite)
Figure 2.
Line plots showing average snow and no-snow commission and omission between MODIS (reference) and VIIRS snow maps with respect to different snow cover fraction thresholds. (MODIS: Moderate Resolution Imaging Spectroradiometer; VIIRS: Visible Infrared Imaging Radiometer Suite)

Figure 3.
Line plots illustrating MODIS and VIIRS total snow, no-snow and cloud pixels concerning each day of the 2016 hydrological year.
Figure 3.
Line plots illustrating MODIS and VIIRS total snow, no-snow and cloud pixels concerning each day of the 2016 hydrological year.

Figure 4.
Scatter plots illustrating VIIRS snow and no-snow pixels with respect to MODIS snow and no-snow pixels, excluding all cloud pixels. The deep sky blue and yellow lines represent a second-degree polynomial fit for snow and no-snow pixels, respectively.
Figure 4.
Scatter plots illustrating VIIRS snow and no-snow pixels with respect to MODIS snow and no-snow pixels, excluding all cloud pixels. The deep sky blue and yellow lines represent a second-degree polynomial fit for snow and no-snow pixels, respectively.

Figure 5.
Scatter plots illustrating VIIRS cloud pixels with respect to MODIS cloud pixels. The gray line represents a first degree polynomial fit while black line indicates a 1:1 relationship.
Figure 5.
Scatter plots illustrating VIIRS cloud pixels with respect to MODIS cloud pixels. The gray line represents a first degree polynomial fit while black line indicates a 1:1 relationship.

Figure 6.
Line plots illustrating MODIS snow – VIIRS snow agreement, MODIS no-snow—VIIRS no-snow agreement, MODIS snow—VIIRS no-snow omission and MODIS no-snow—VIIRS snow commission with respect to each day of the 2016 hydrological year.
Figure 6.
Line plots illustrating MODIS snow – VIIRS snow agreement, MODIS no-snow—VIIRS no-snow agreement, MODIS snow—VIIRS no-snow omission and MODIS no-snow—VIIRS snow commission with respect to each day of the 2016 hydrological year.

Figure 7.
Marker plots showing Overall Agreement and Kappa statistics between MODIS and VIIRS snow maps with respect to each day of the 2016 hydrological year. The green and blue dash lines respectively represent the average overall agreement (97.67%) and average Kappa statistics (0.601) between MODIS and VIIRS snow maps. The gray area represents the percentage of cells mapped by both MODIS and VIIRS as snow each day.

Figure 8.
Marker plots showing improvement in Kappa statistics between MODIS and VIIRS snow maps with respect to each day of the 2016 hydrological year. The green and blue dash lines respectively represent the average overall agreement (96.51%) and average kappa statistics (0.899) between MODIS and VIIRS snow maps.

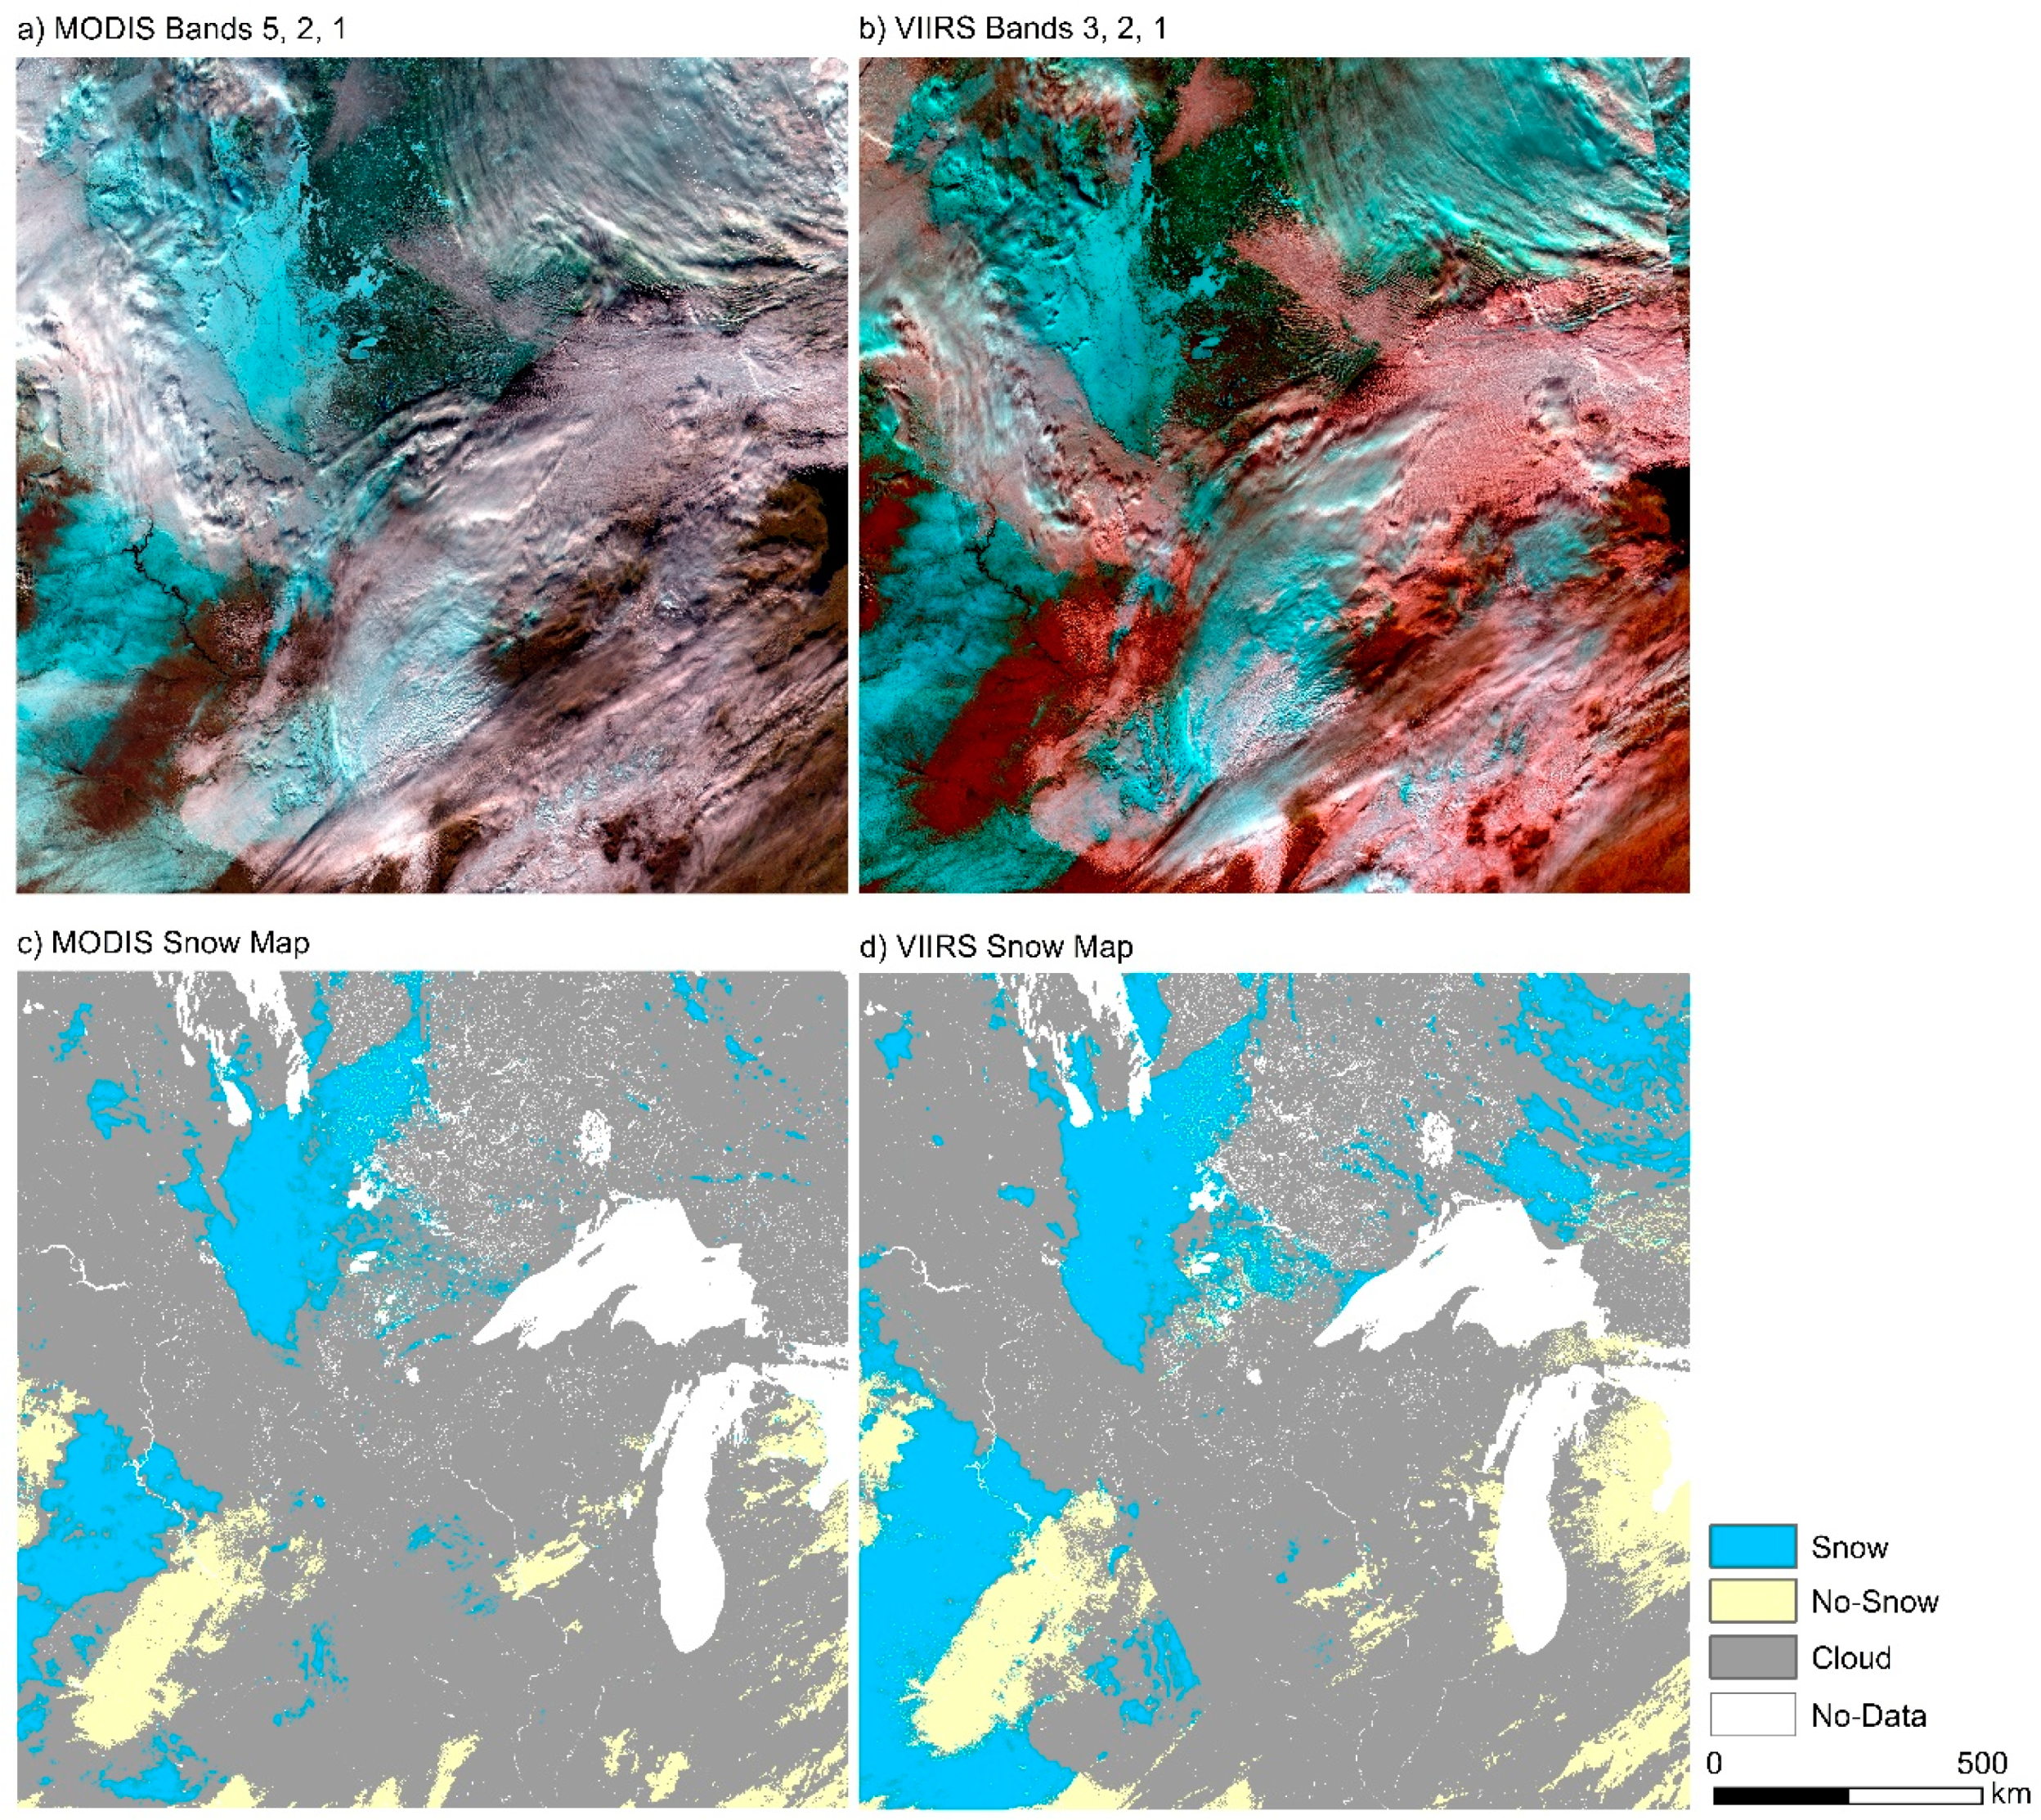
Figure 9.
Qualitative comparison during Dec 24, 2015. (a) A false-color composite image of MODIS bands 5 (1230–1250 nm), 2 (841–876 nm), 1 (620–670 nm) as R, G and B that shows snow as cyan colors; (b) a false-color composite image of VIIRS bands I3 (1580–1640 nm), I2 (846–885 nm), I1 (600–680 nm) as R, G and B that shows snow as cyan colors; (c) MODIS binary snow map and (d) VIIRS binary snow map.

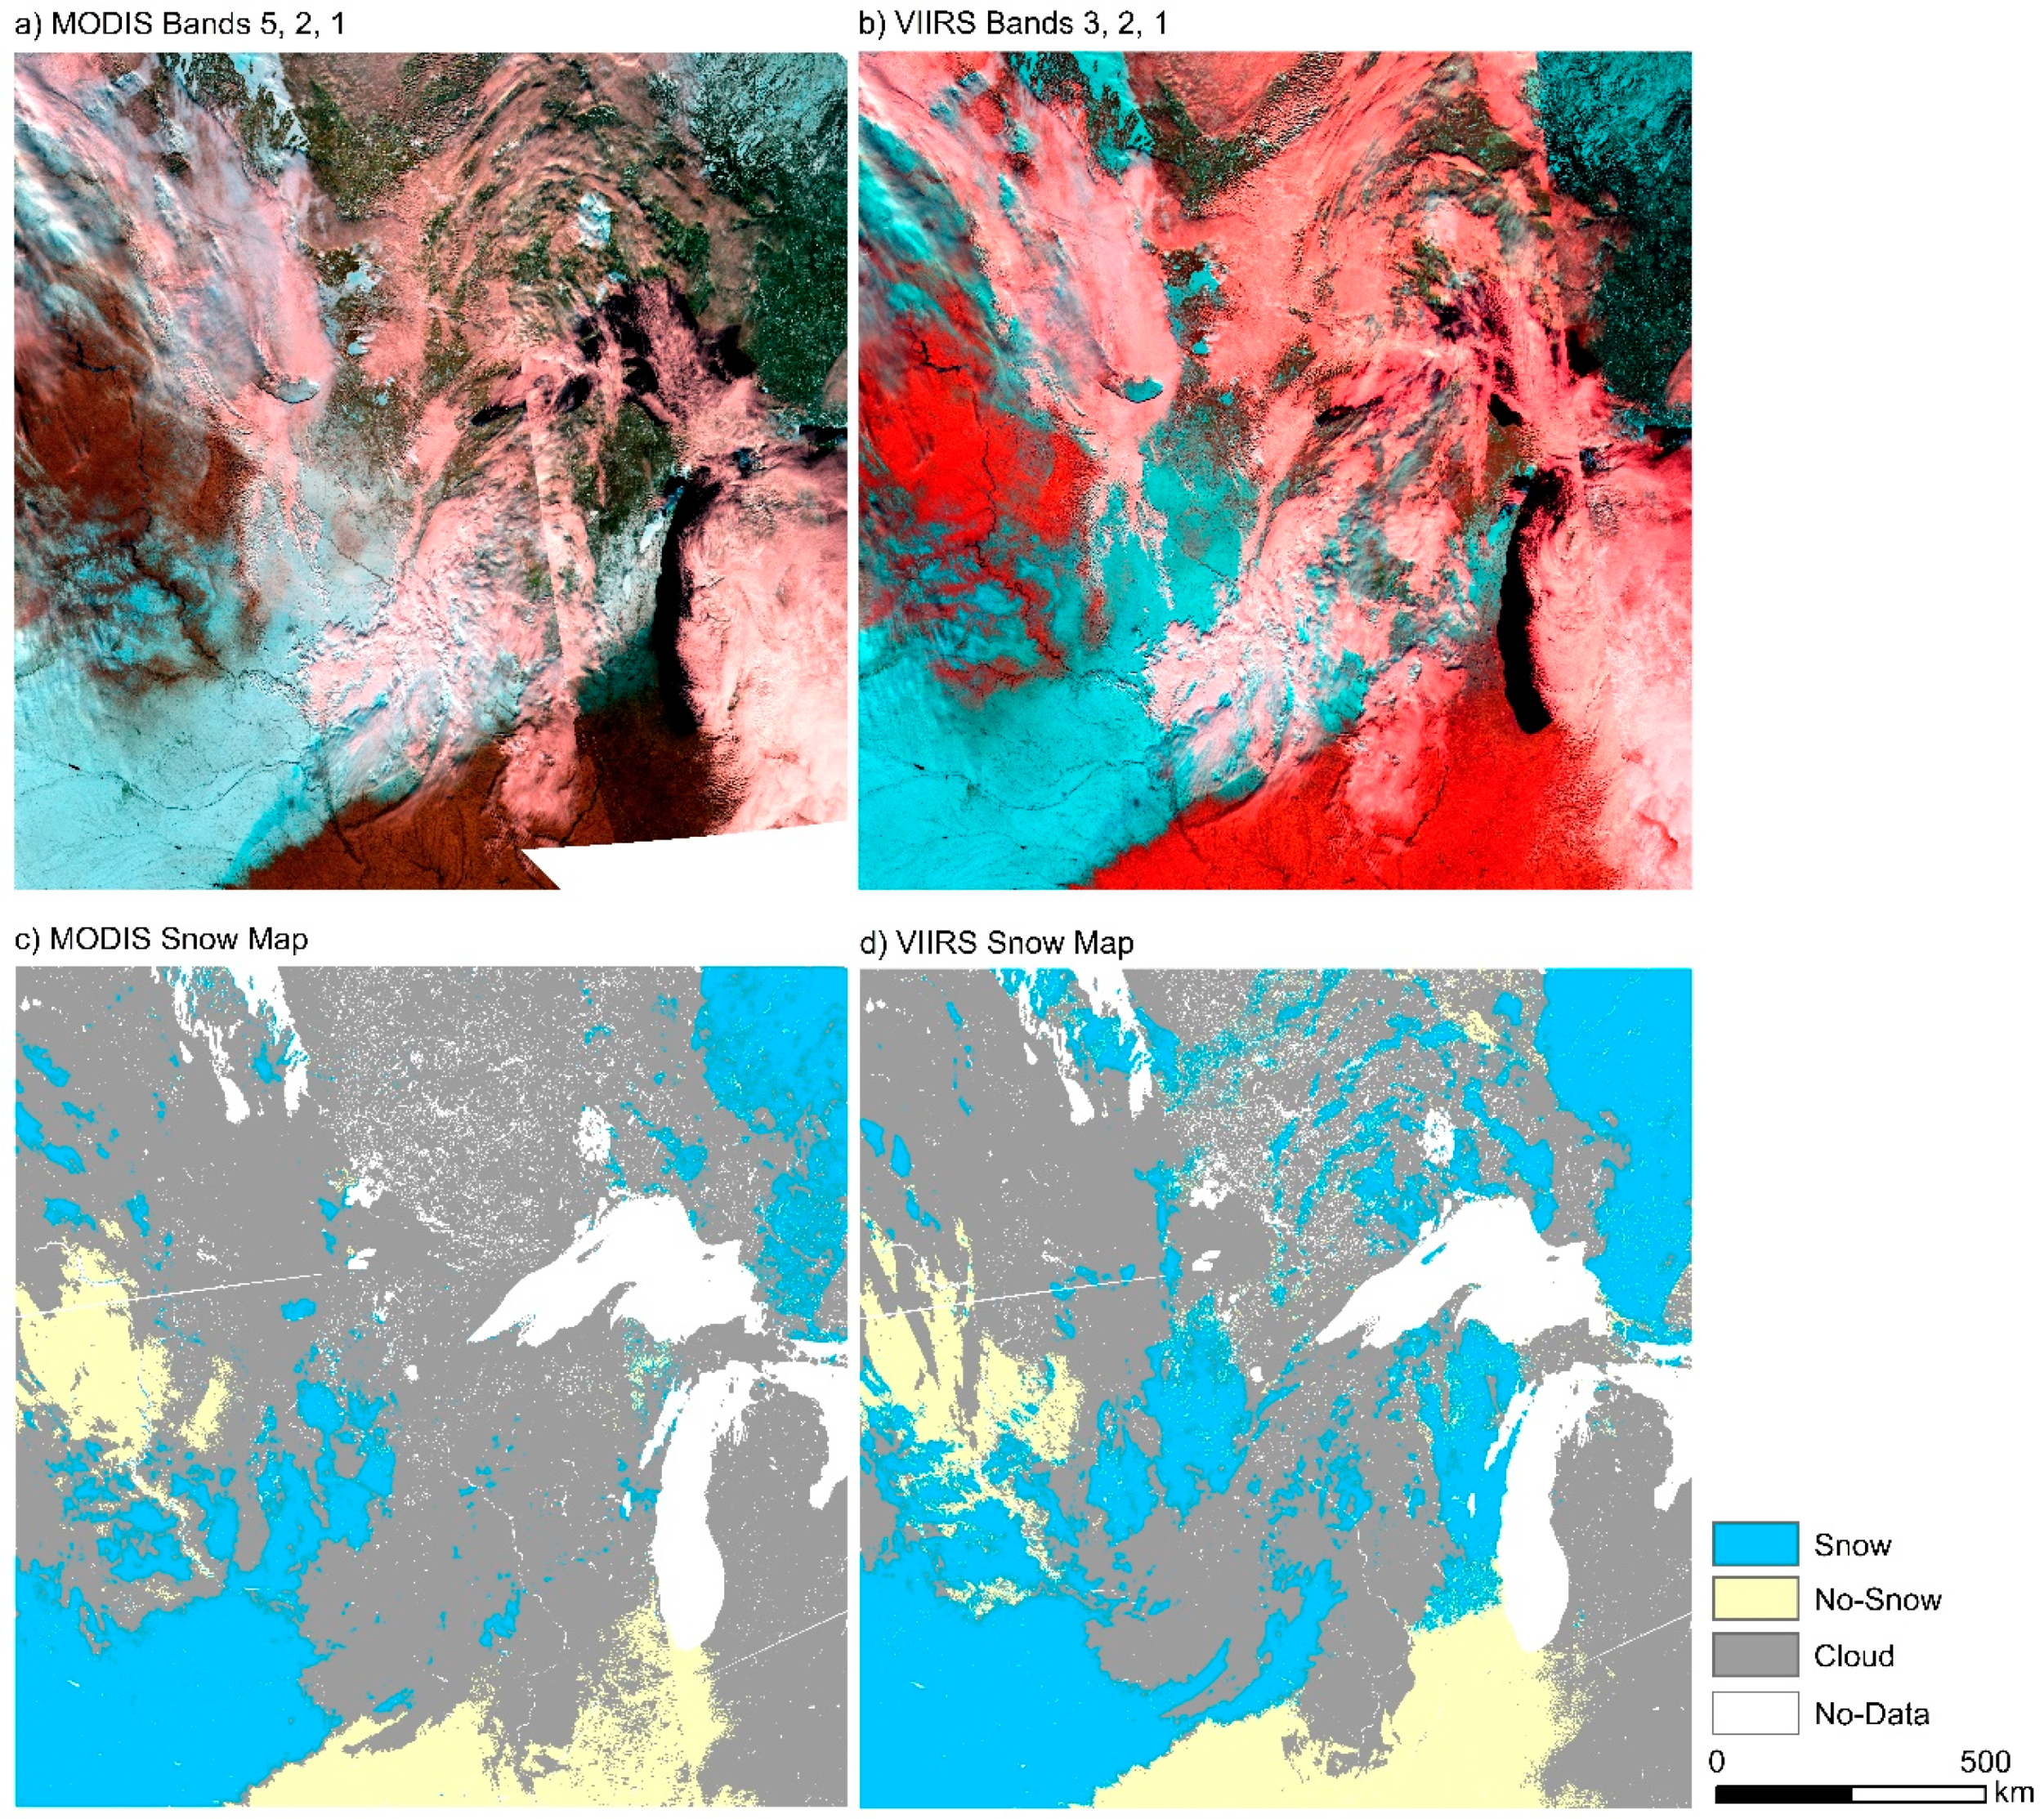
Figure 10.
Qualitative comparison during 4 Feburary 2016. (a) A false-color composite image of MODIS bands 5 (1230–1250 nm), 2 (841–876 nm), 1(620–670 nm) as R, G and B that shows snow as cyan colors; (b) a false-color composite image of VIIRS bands I3 (1580–1640 nm), I2 (846–885 nm), I1 (600–680 nm) as R, G and B as R, G and B that shows snow as cyan colors; (c) MODIS binary snow map and (d) VIIRS binary snow map.

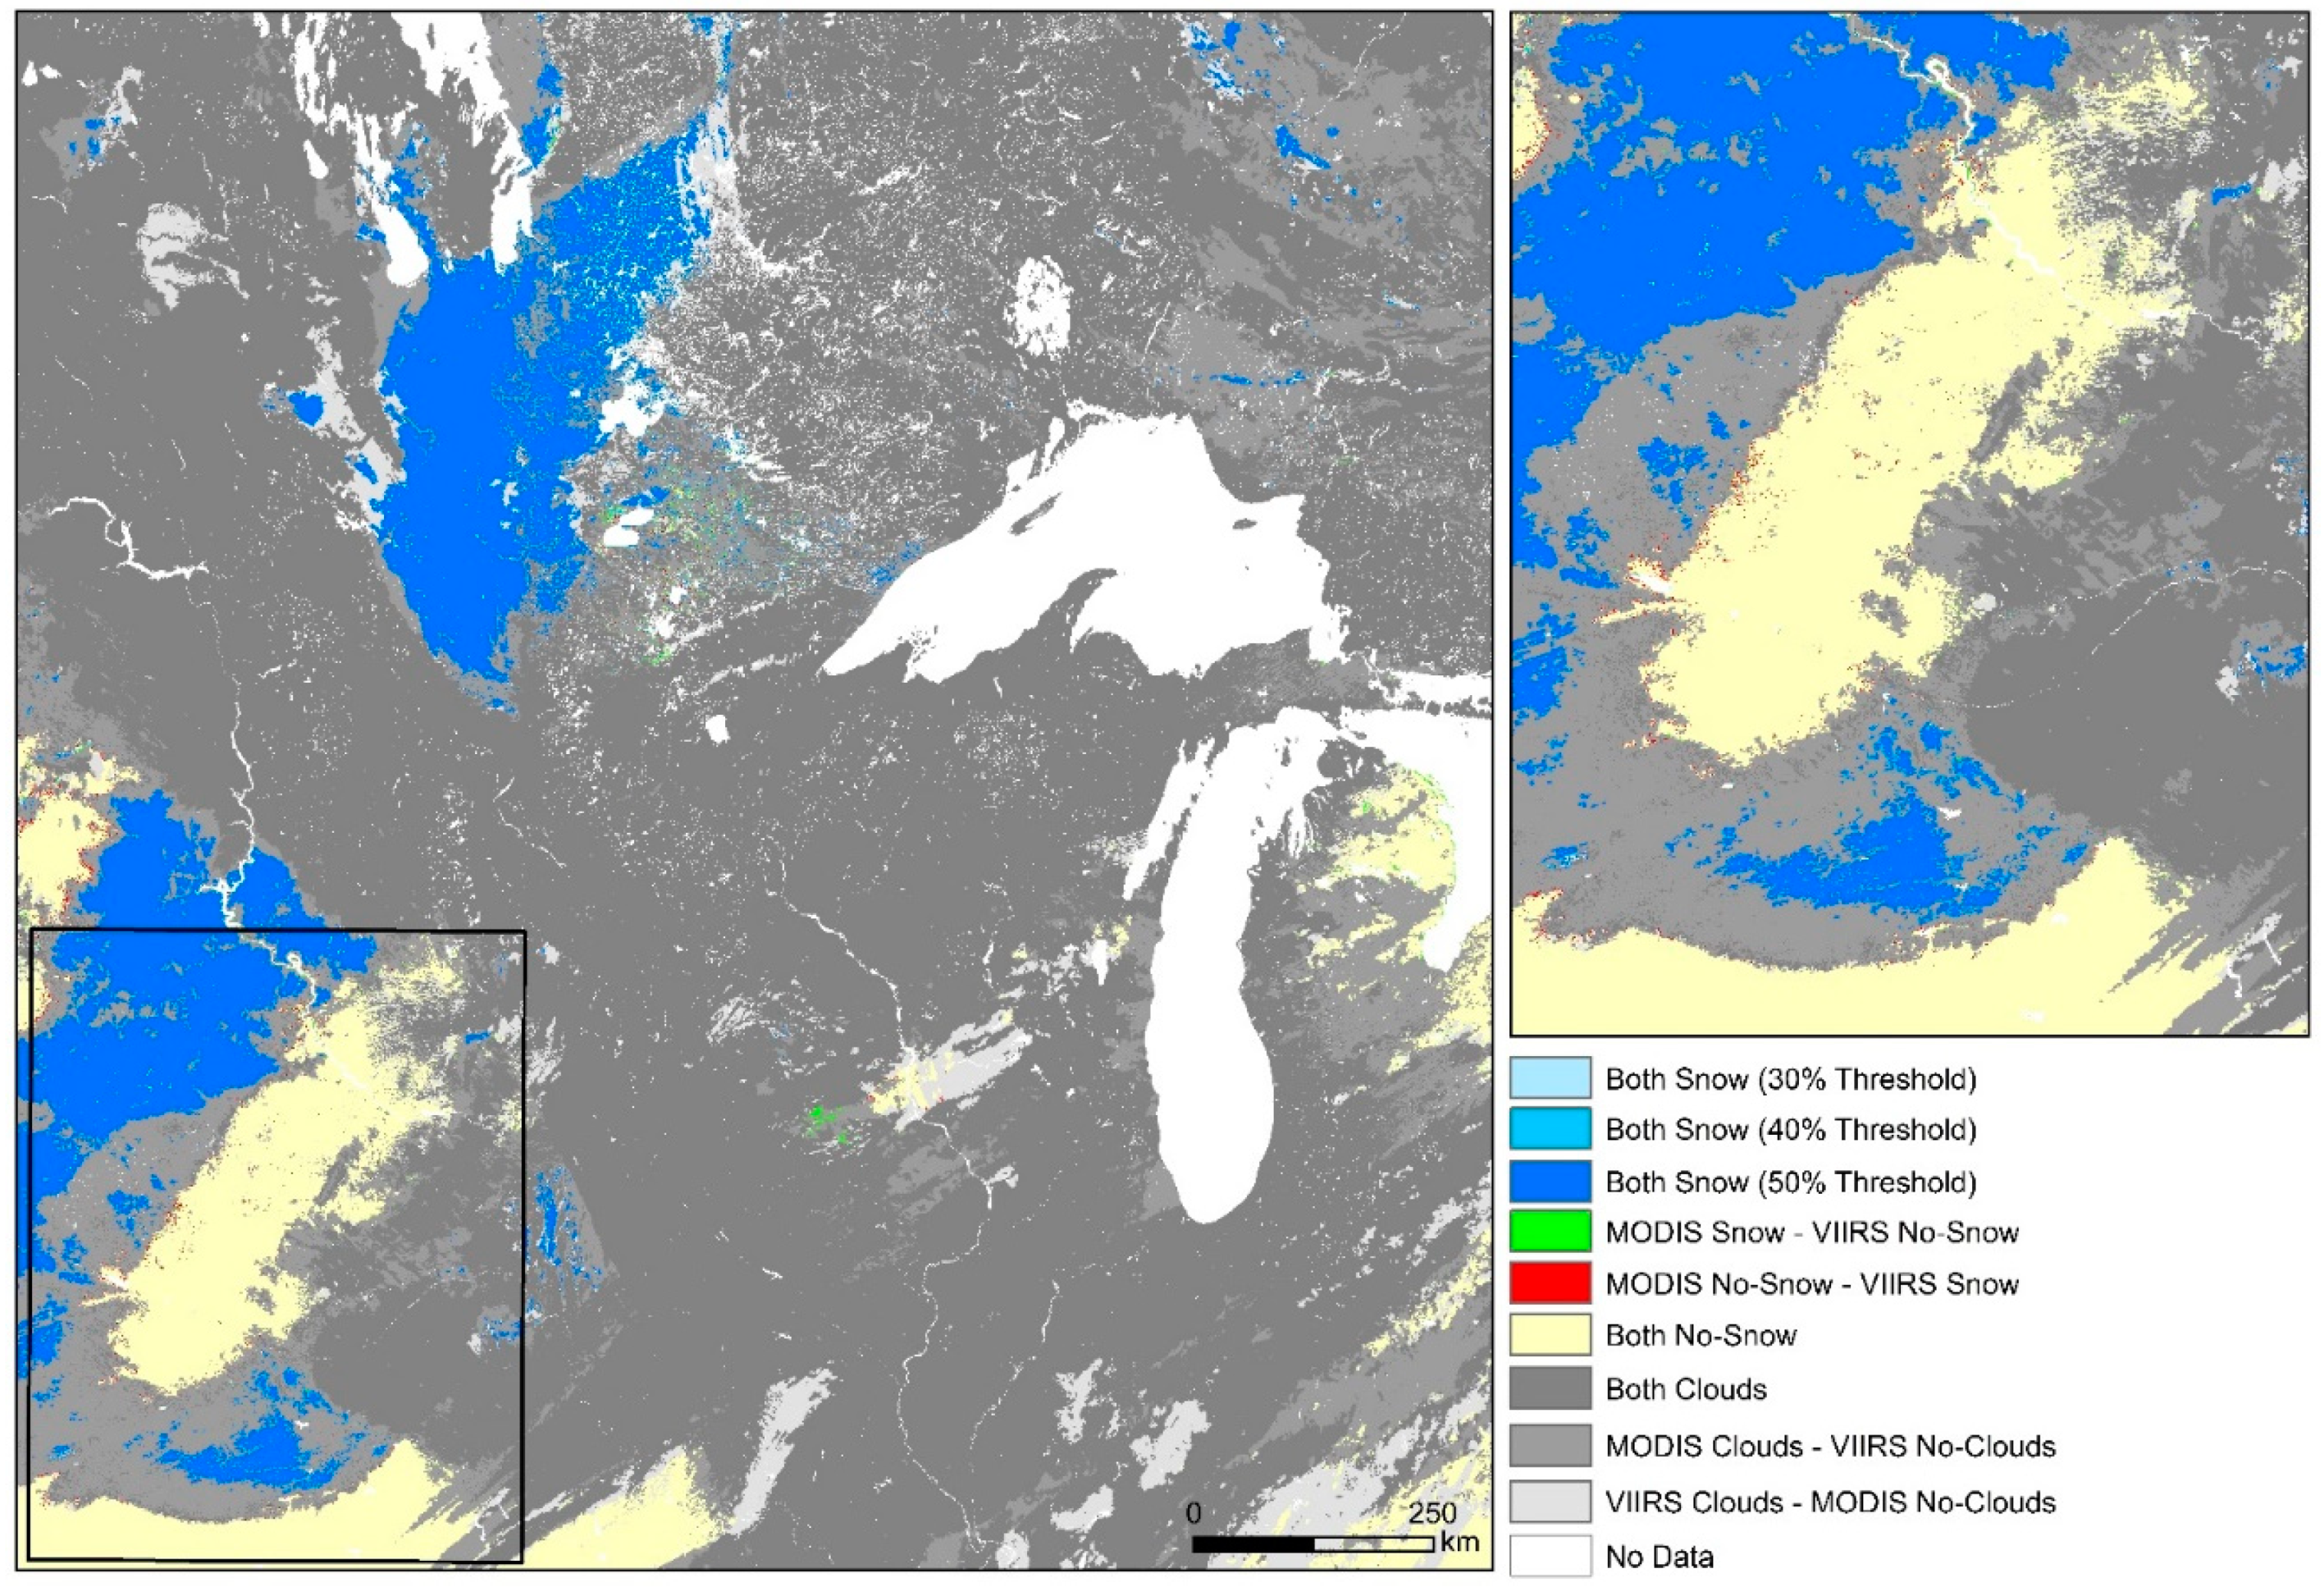
Figure 11.
MODIS and VIIRS snow comparison map for 24 December 2015 illustrating disagreement over snow/no-snow transition zone where MODIS mapped cloud but VIIRS did not.
Figure 11.
MODIS and VIIRS snow comparison map for 24 December 2015 illustrating disagreement over snow/no-snow transition zone where MODIS mapped cloud but VIIRS did not.

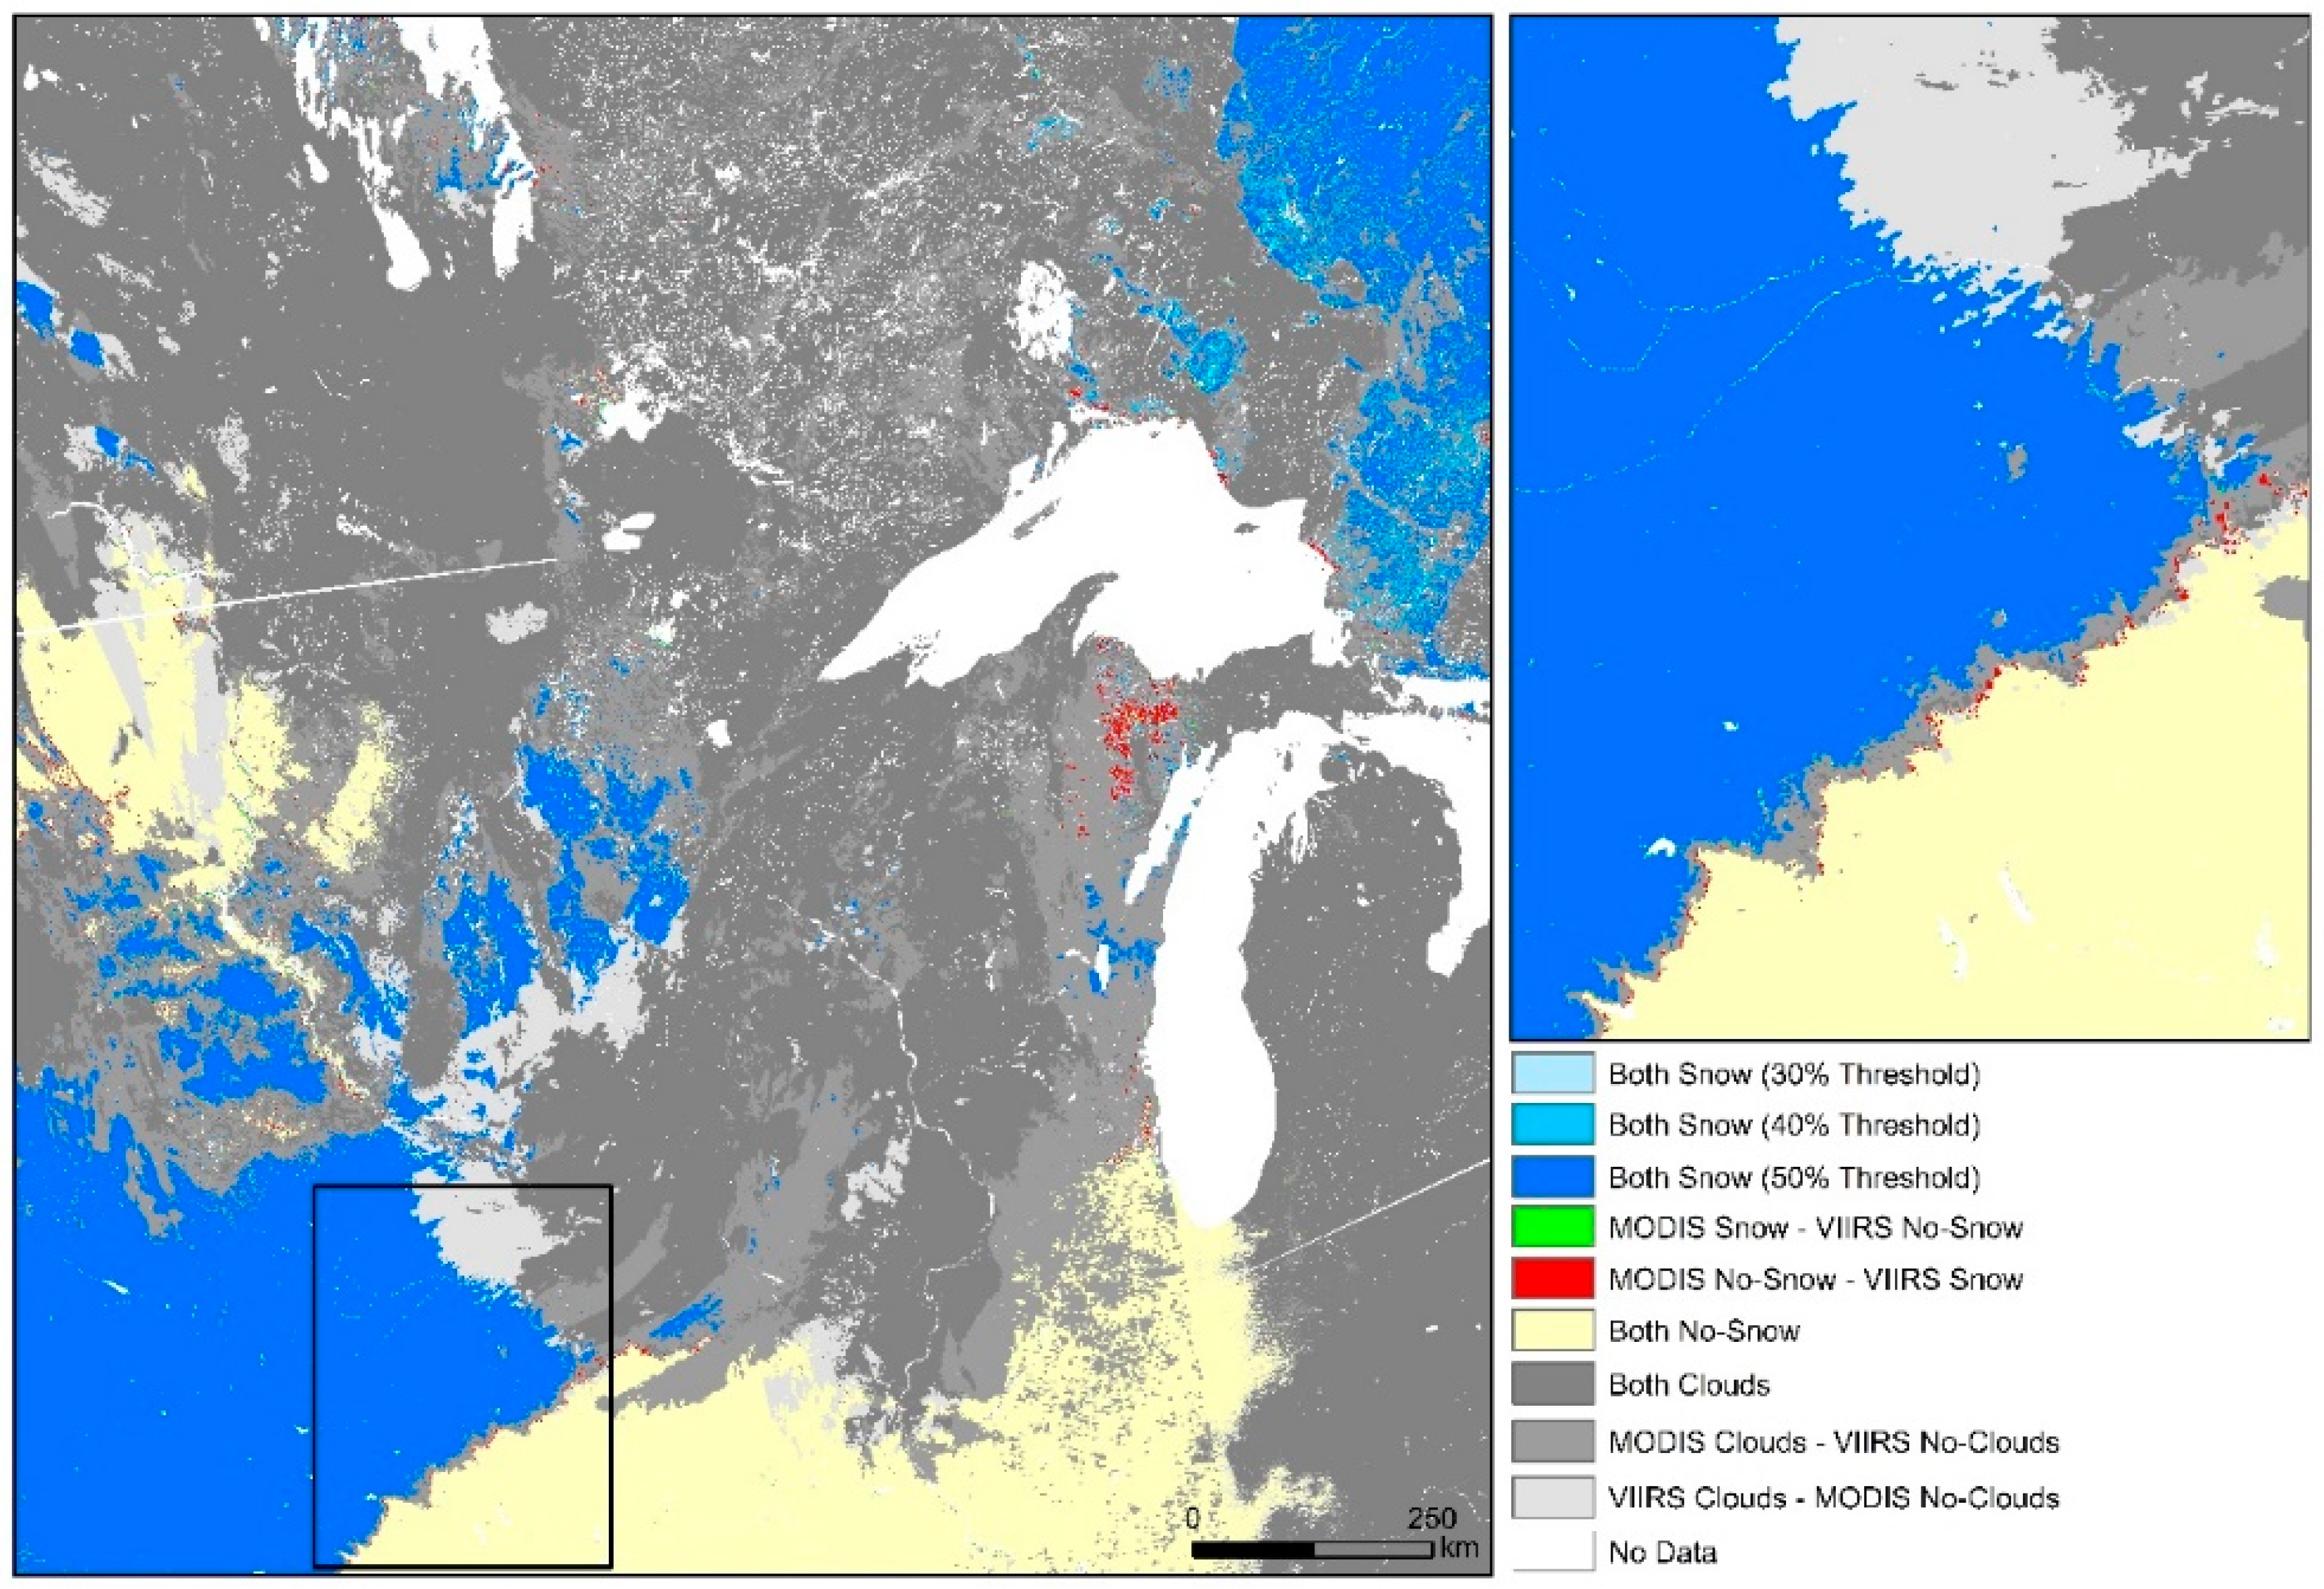
Figure 12.
MODIS and VIIRS snow comparison map for 4 February 2016 illustrating disagreement over snow/no-snow transition zone where MODIS mapped cloud but VIIRS did not and snow/no-snow transition zone mapped as clouds.
Figure 12.
MODIS and VIIRS snow comparison map for 4 February 2016 illustrating disagreement over snow/no-snow transition zone where MODIS mapped cloud but VIIRS did not and snow/no-snow transition zone mapped as clouds.


Table 1.
Decision rules based pixel classification with coded values.
| MODIS Pixels | VIIRS Pixels | Output Category |
|---|---|---|
| 1 | 1 | Both snow (11) |
| 1 | 0 | Modis snow-VIIRS no-snow (10) |
| 0 | 1 | Modis no-snow-VIIRS snow (01) |
| 0 | 0 | Both no-snow (00) |
Table 2.
Percentage of total snow, no-snow and cloud fractions of the MODIS and VIIRS daily swath snow products in the study area during the 2016 hydrological year.
Table 2.
Percentage of total snow, no-snow and cloud fractions of the MODIS and VIIRS daily swath snow products in the study area during the 2016 hydrological year.
| MODIS (MYD10L2) | VIIRS (VSCMO) | |||||
|---|---|---|---|---|---|---|
| Snow | No-Snow | Cloud | Snow | No-Snow | Cloud | |
| Min | 0.01 | 0.01 | 13.69 | 0.00 | 0.19 | 14.70 |
| Max | 43.14 | 81.96 | 98.69 | 57.04 | 84.74 | 96.58 |
| Mean | 5.72 | 26.65 | 65.02 | 11.43 | 28.67 | 59.91 |
| STD | 7.08 | 20.12 | 19.36 | 12.81 | 19.98 | 17.96 |
Table 3.
Confusion matrix between MYD10L2 and VSCMO during the 2016 hydrological year. (Note: MYD10L2 is Aqua MODIS swath snow map product and VSCMO is NOAA VIIRS binary snow map product)
Table 3.
Confusion matrix between MYD10L2 and VSCMO during the 2016 hydrological year. (Note: MYD10L2 is Aqua MODIS swath snow map product and VSCMO is NOAA VIIRS binary snow map product)
| MODIS | |||
| Snow | No snow | ||
| VIIRS | Snow | 719,307.73 (24.08%) | 55,370.78 (1.53%) |
| No snow | 28,203.70 (0.80%) | 3,604,280.79 (73.59%) | |
| Overall agreement: 97.67%, Khat: 0.601 | |||
Table 4.
Average confusion matrix between MYD10L2 and VSCMO.
| MODIS | |||
| Snow | No snow | ||
| VIIRS | Snow | 1,238,750.13 (39.92%) | 79,840.82 (2.35%) |
| No snow | 36,895.04 (1.14%) | 2,145,007.33 (56.59%) | |
| Overall agreement: 96.51%, Khat: 0.899 | |||
© 2019 by the authors. Licensee MDPI, Basel, Switzerland. This article is an open access article distributed under the terms and conditions of the Creative Commons Attribution (CC BY) license (http://creativecommons.org/licenses/by/4.0/).
Share and Cite
MDPI and ACS Style
Thapa, S.; Chhetri, P.K.; Klein, A.G. Cross-Comparison between MODIS and VIIRS Snow Cover Products for the 2016 Hydrological Year. Climate 2019, 7, 57. https://0-doi-org.brum.beds.ac.uk/10.3390/cli7040057
AMA Style
Thapa S, Chhetri PK, Klein AG. Cross-Comparison between MODIS and VIIRS Snow Cover Products for the 2016 Hydrological Year. Climate. 2019; 7(4):57. https://0-doi-org.brum.beds.ac.uk/10.3390/cli7040057
Chicago/Turabian StyleThapa, Shubhechchha, Parveen K. Chhetri, and Andrew G. Klein. 2019. "Cross-Comparison between MODIS and VIIRS Snow Cover Products for the 2016 Hydrological Year" Climate 7, no. 4: 57. https://0-doi-org.brum.beds.ac.uk/10.3390/cli7040057
Note that from the first issue of 2016, this journal uses article numbers instead of page numbers. See further details here.