Monitoring Hydrometeorological Droughts Using a Simplified Precipitation Index


Civil Engineering Department, College of Engineering and Petroleum (COEP), Khaldiya Campus, Kuwait University, P.O. Box 5969, Safat 13060, Kuwait
Climate 2020, 8(2), 19; https://0-doi-org.brum.beds.ac.uk/10.3390/cli8020019
Submission received: 17 December 2019
/
Revised: 16 January 2020
/
Accepted: 21 January 2020
/
Published: 23 January 2020
(This article belongs to the Special Issue Long-Term Climate Modeling and Hydrological Projection)
Abstract
:Efficient water management plans should rely on quantitative metrics for assessing water resource shortage scenarios. This study develops a simplified precipitation index (PI) requiring precipitation data only in order to assess hydrometeorological droughts affecting various hydrological systems. The PI index is inspired by the famous Standardized Precipitation Index (SPI), and it aims to provide the same indication for drought severity and duration while overcoming the disadvantage of needing hydrological data normalization. Avoiding hydrological data normalization overcomes the non-satisfactory results of this procedure that were reported in previous studies. Analysis of groundwater drought drivers in the arid region of Kuwait is presented to test the index applicability at timescales 12 and 24 months using available historical precipitation data from 1958 to 2017. A bivariate joint probability analysis was conducted by Clayton copula to assess the occurrence of certain drought severities and durations. The results showed that PI is comparable to the original SPI and provides drought severity linearly propagating with respect to time. This index constitutes a simple means to help water managers assess and describe the impact of droughts in precipitation-controlled systems and establish appropriate water management plans.
1. Introduction
Drought is an extreme event that can affect soil moisture, agriculture, and hydrologic systems, such as groundwater aquifers, rivers, lakes, and reservoirs. Droughts usually deplete water reserves slowly, with durations lasting from a few months to years. They can occur in any climatic zone and usually feature a substantial reduction in normal precipitation rates over years or seasons. The population growth and expansion of industrial and agricultural sectors in recent decades have vastly increased the freshwater demand worldwide. Other environmental stresses such as climate change and water contamination have contributed to the emergence of drought management concepts, especially with the recent documentation of increased extreme hydrologic event occurrences [1,2]. Moreover, the drought may extend to socio-economic activities [3,4]. Droughts can also affect the quality of water as, organic matter, nutrient, or sediment pathways through surface water streams can be significantly decreased due to reduced flow [5]. The urgent need to establish a proper water management plan that meets the demands of freshwater to population growth requires a quantitative drought impact assessment.
The impact of drought in arid regions is a major concern due to limited conventional water resources. Arid regions usually receive total annual precipitation of less than 250 mm, and they are highly vulnerable to water reserve depletion. As groundwater may represent the only naturally available conventional water resource, it should be managed efficiently to avoid catastrophic water shortage scenarios. Mishra and Singh [6] highlighted that groundwater reserve depletion in arid regions has adverse impacts on water supply and crop irrigation. Thus, water managers in arid regions should strictly implement efficient water management practices.
Drought indices are quantitative metrics to assess drought severity and durations by assimilating meteorological or hydrological data into a simple numeric output. They have been widely used by water management entities to communicate drought levels and water operation practices [7,8]. Two common indices have been widely reported in the literature. The first one is the Palmer index, which has been used intensively to assess the areal extent of drought severity across the United States [9,10]. This index was developed by Palmer [11] to assess the wet season, and it relies on the water balance calculations using estimations of evapotranspiration and soil moisture measures. The computation for the Palmer index follows arbitrary rules for quantifying drought properties and limitations when using water balance models [12]. The second index is the Standardized Precipitation Index (SPI) [13]. This index was introduced by McKee et al. [13] and identified by the World Meteorological Organization as the index of choice for droughts in humid and arid environments [14]. SPI represents the difference of precipitation mean divided by the precipitation standard deviation. A key disadvantage is that the SPI computation involves normalizing precipitation data by applying a certain probability distribution transformation [13]. The difficulty becomes worse for data with short timescales. In general, it is well-documented that hydrologic data are not normally distributed in short timescales. Thom [15], however, noted that the gamma distribution is better suited for precipitation data with a timescale less than 12 months.
Owing to its model’s form simplicity, the SPI index received a wide attention in the literature to establish a solid understanding of drought drivers. Different hydrologic variables were utilized to calculate drought indicators analogous to SPI. For example, a recent paper by Goodarzi et al. [16] developed the Groundwater Recharge Drought Index (GRDI). This method substitutes the precipitation term in the original SPI index with a recharge term. The GRDI represents the difference in recharge amount in standard normal distribution divided by the standard deviation. Several probabilistic distributions were fitted to the recharge data, and the best match distribution was selected to standardize the recharge dataset in a comparable procedure with SPI calculations. Another index has been developed by Bloomfield and Marchant [17] for groundwater levels. They normalized groundwater level data to calculate the Standardized Groundwater level Index (SGI). In their conclusion, the researchers mentioned that using a normalizing procedure is undesirable, to avoid model overfitting [17].
Shukla et al. [18] presented the Surface Runoff Index (SRI). They employed physically-based surface water models to simulate runoff time series and used gamma distribution to fit simulation results. Fitted runoff distribution was then transformed to the standard normal deviate. The authors noted that fitting probability distribution for simulated runoff records should be done with care to avoid errors associated with estimating the probability of surface runoff especially in the regions of arid climate as runoff is usually intermittent.
Lopez-Moreno et al. [19] calculated drought index based on stream flow anomalies for the transboundary Lower River Tagus in Spain and Portugal. They used Pearson type III probability distribution for normalizing stream flow data before computing the drought index. They concluded that the developed drought index could not be generalized for other basins as hydroclimatic conditions vary and the selected distribution for normalizing stream flow series may not be suitable. Sheffield et al. [20] used soil moisture to characterize drought severity, as it reflects recent precipitation status. Soil moisture time series were fitted to probability distributions and compared soil moisture deficit with seasonal averages as an indicator for major droughts. The authors used optimization to reduce the error associated with the poor fit of skew coefficient. The error associated with the model stems from the fact that soil moisture does not perfectly follow theoretical probability distributions.
Despite the prolific literature addressing index-based drought analysis, most of the developed methodologies propose a theoretical or empirical probability fit for various hydrologic variables before performing the computations, while others require many input parameters or lack simplicity by which they become not universally applicable especially in arid regions. The presented methodologies analogous to SPI did not overcome the main disadvantage regarding normalizing the input parameter by applying a certain probability distribution transformation. In this paper, a simplified precipitation index (PI) is presented to overcome the major disadvantage of SPI-inspired indices. The proposed index relies on precipitation data and relaxes the requirement for fitting a certain probabilistic distribution to precipitation data by replacing the standard deviation term with precipitation mean in the denominator of the SPI formula. Additionally, the simplified index presented does not require a minimum length of precipitation record, which is considered another disadvantage in SPI [6]. The simplified PI was tested to characterize groundwater drought conditions of the arid environment in Kuwait, and the results are presented here.
2. Methodology
2.1. Study Area
2.1.1. Climatology and Water Supply
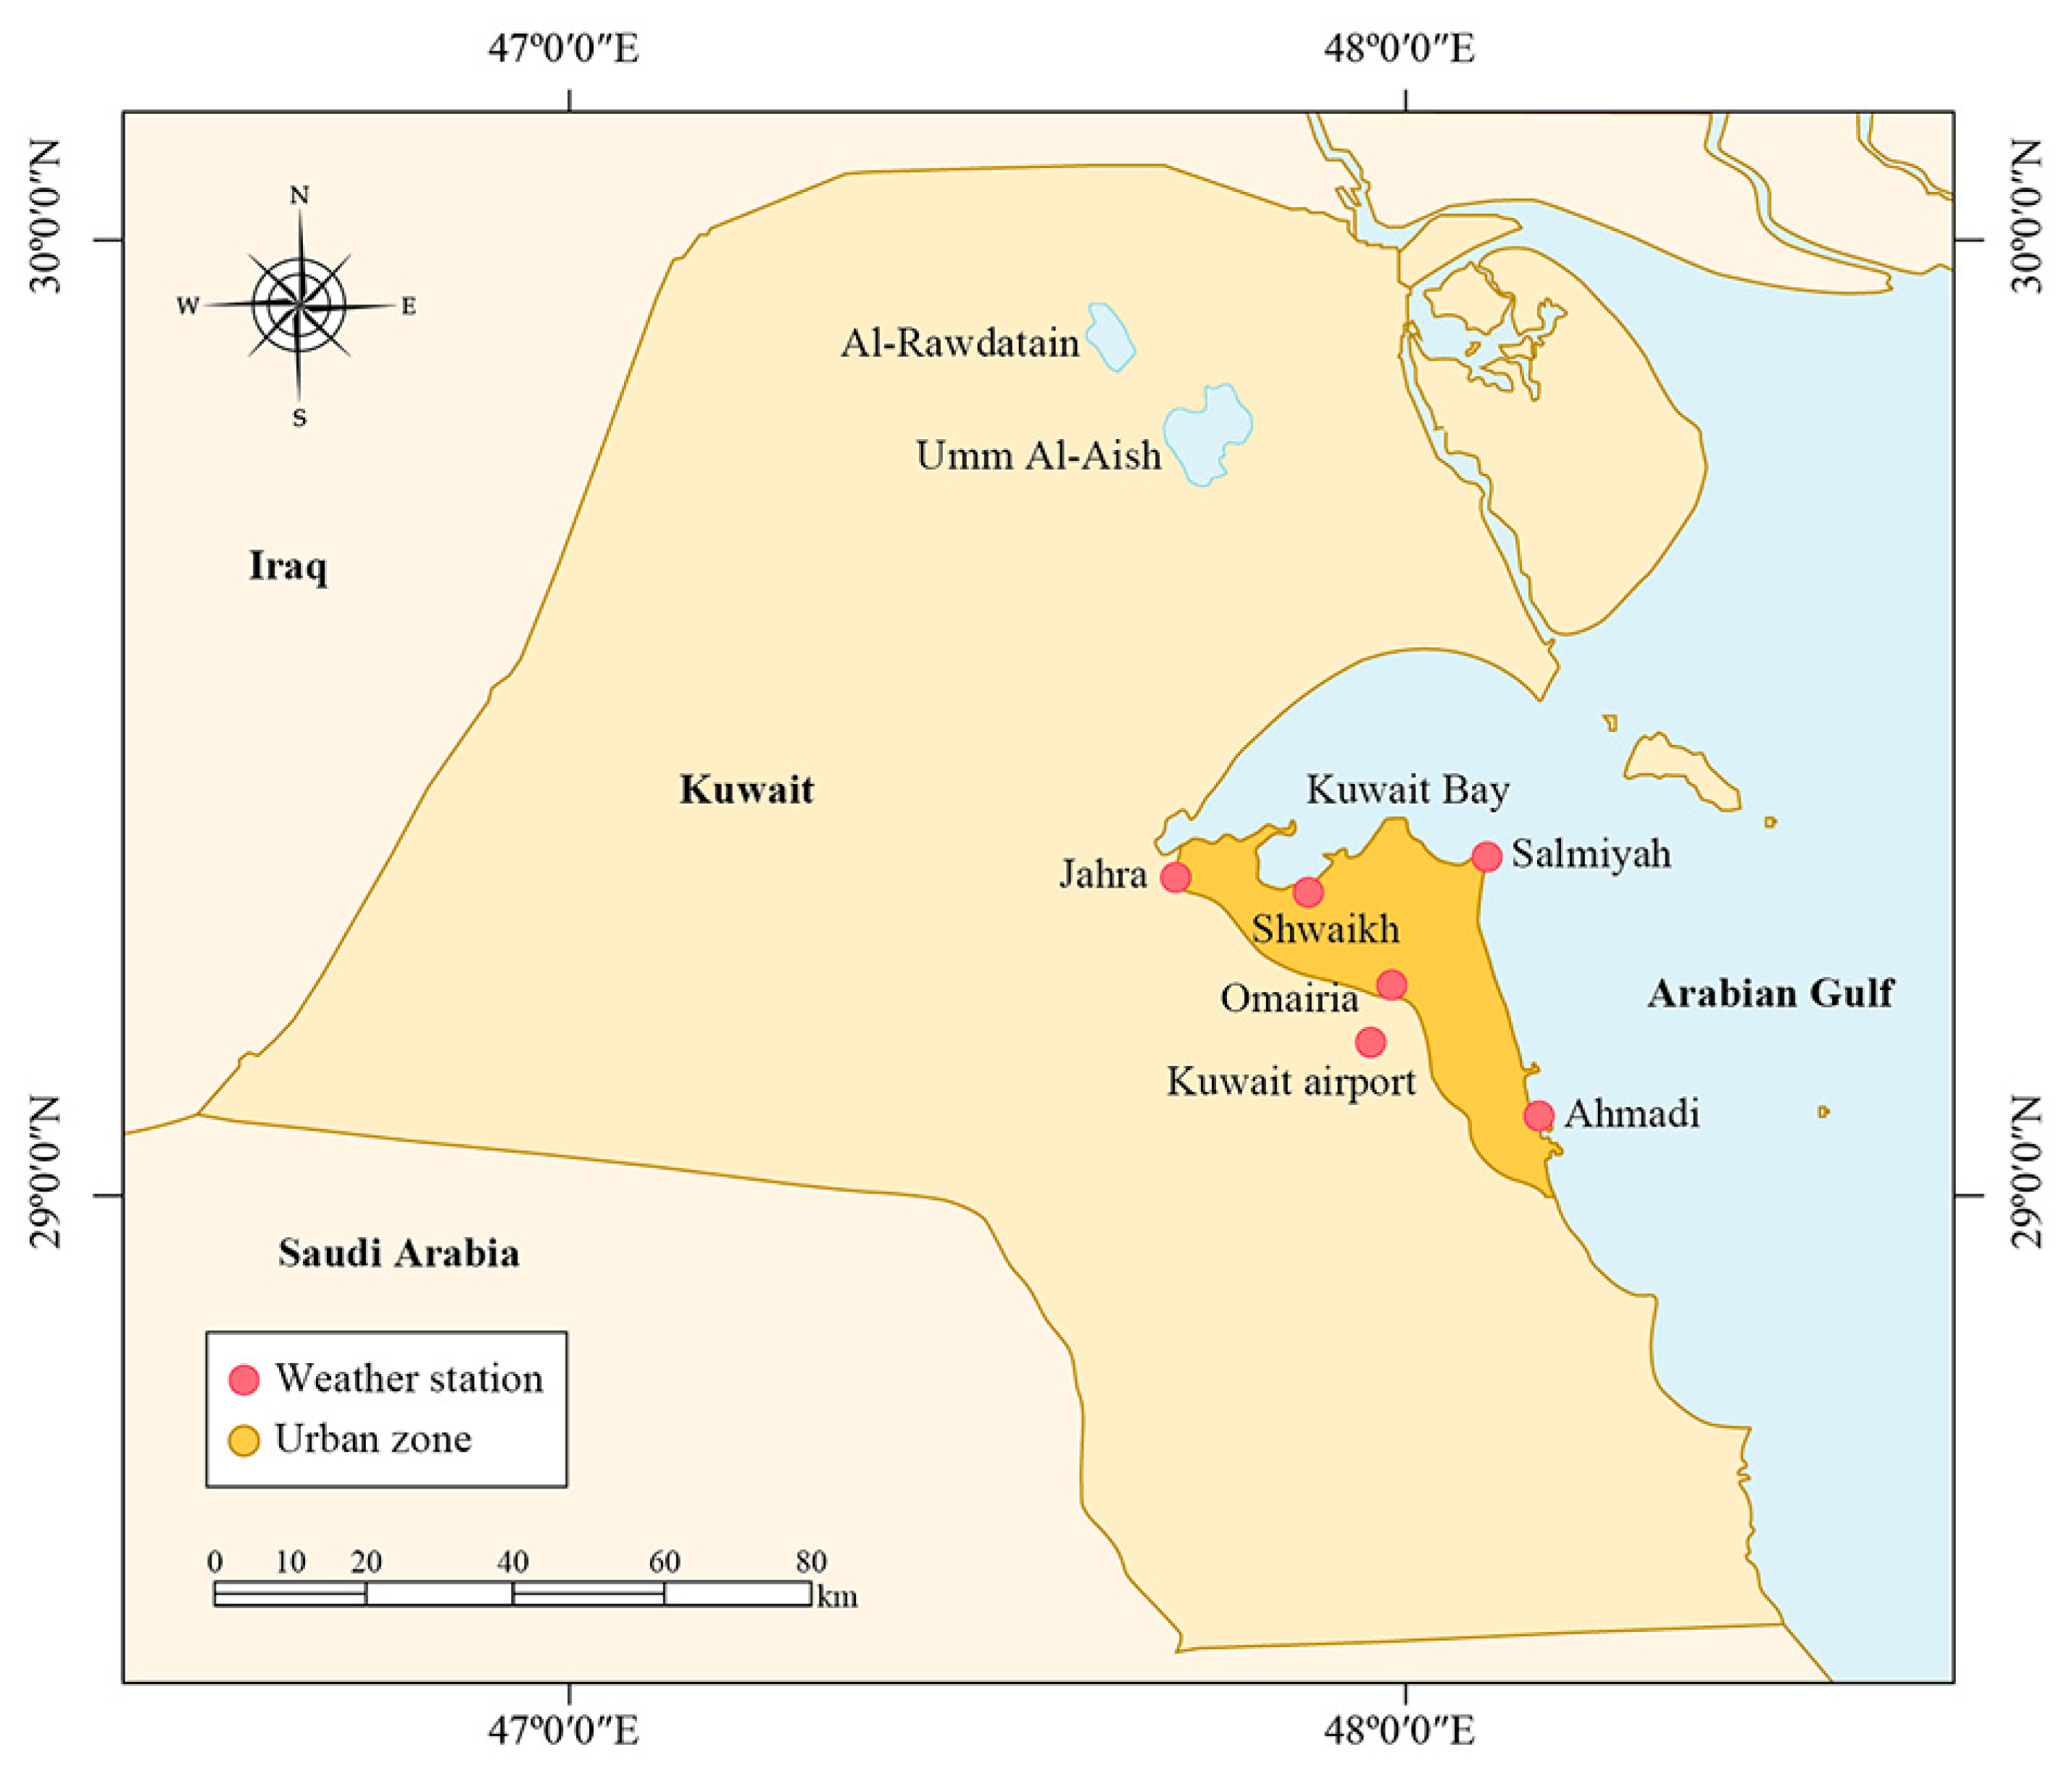
The state of Kuwait, which has one of the most arid and dry inhabited climates in the world, is located on the west side of Asia (Figure 1). With an average long-term annual precipitation depth of 115.7 mm, the extremely hot and dry summer months from May to August develop annual evaporation depths exceeding 3500 mm. Such arid climatic conditions diminish annual precipitation and place the country under high stress of water scarcity as no freshwater surface bodies exist.
With the rapid increase in population, efficient water management practices are needed to sustain prolonged drought periods. The water supply in Kuwait is produced through seawater desalination processes, which can barely fortify against the increasing water demand. Groundwater resources represent another alternative. Brackish groundwater reserves are primarily used for irrigation or mixing with desalinated water [21]. Substantial quantities of freshwater lenses, which represent the only natural potable water available, are found in the northern part of the country in Al-Rawdatain and Umm Al-Aish depressions.
2.1.2. Groundwater Resources
In general, groundwater resources in Kuwait occur in two major aquifers (Figure 2). The upper one is known as the Kuwait group, consisting of silty and gravelly sand. The Kuwait group is unconfined, with upper and lower formations separated by an aquitard layer. The lower aquifer is confined known as the Dammam group, consisting of chalky-dolomitic limestone [21]. Freshwater lenses of Al-Rawdatain and Umm Al-Aish depressions are found in the upper formation of Kuwait group. The water there has total dissolved solids (TDS) less than 1000 ppm. Because they float above saline groundwater, the freshwater lenses of Al-Rawdatain and Umm Al-Aish depressions are considered highly vulnerable to overexploitation.
Owing to the low annual rainfall and high evaporation rates, groundwater recharge through rainfall is generally negligible. However, due to the topographic setting at the Al-Rawdatain and Umm Al-Aish depressions, rainwater accumulates and infiltration delivers freshwater to the subsurface within a short period [22]. Since rainfall is the only natural inflow at the freshwater lenses, understanding precipitation patterns and the contribution of prolonged droughts to alternating recharge is vital for water managers to achieve long-term sustainability.
2.1.3. Available Data
Monthly precipitation data are collected from a synoptic weather station installed at Kuwait International Airport (KIA). The weather station is about 70 km and 60 km away from Al-Rawdatain and Umm Al-Aish depressions, respectively. Although other weather stations are available, a single dataset from KIA is spatially representative for the climate in the entire country, since the variance in topography in the state is relatively small with nearly flat surface elevations. A comparison performed in Figure 3 demonstrates that the weather stations in the urban zone provide seasonal averages of monthly total rainfall very similar, within ±3 mm variations. Table 1 shows descriptive statistics for precipitation data collected from KIA station.
For the study area, automated weather station was not installed in the vicinity Al-Rawdatain and Umm Al-Aish depressions until 2011. Table 2 shows a comparison between KIA weather station and the recently installed Saberya station from May 2011 until May 2018. It is evident from the descriptive statistics shown in the table that the variability between the two stations is minimal. Considering the short precipitation record available at Saberya, the appropriateness of this station in drought analysis would be questionable. Therefore, precipitation records from KIA are used in this study as they are considered reliable regarding drought analysis purposes. The range of rainfall data from this station is long and continuous enough, from January 1958 to December 2017, that it can be implemented for comprehensive meteorological analysis [23]. Table 2 demonstrates the descriptive statistics for annual precipitation records at Kuwait International Airport weather station. The rainfall records from Kuwait International Airport will be used here in this study to indicate, on average, the rainfall pattern near the depressions of Al-Rawdatain and Umm Al-Aish. It should be mentioned that a small range of rainfall data from KIA is not available, as it was not recorded for the entire country from August 1990 to May 1991 due to the second Gulf War.
2.2. Model Development
McKee et al. [13] introduced the Standardized Precipitation Index (SPI) as an indicator for drought assessment. If the probability distribution of monthly total rainfall data is normal, then SPI is given as follows
where is the precipitation, is the sample mean precipitation, and is the sample standard deviation of precipitation. Table 3 provides the SPI classifications based on SPI values.
Equation (1) requires normalization for the precipitation time series. The normalization procedure aims to give SPI a uniform measure of drought in different climatic regimes [24]. Stagge et al. [25] evaluated candidate probability distributions suitable for the normalization procedure. They recommended the two-parameter gamma distribution
where α and β represent the shape and location parameters for gamma distribution, and Γ(α) represents gamma function. Although the gamma distribution is skewed to the right with a lower bound of zero much like a precipitation frequency distribution, Sienz et al. [24] showed that the distribution can fail to represent drought in many cases, especially at short timescales. The main interest in drought applications is not in the but in the integral form that provides the probability
It is known that cannot be found except as an expansion in series or continued fractions, which is also the case for when is a real number.
Another statistical problem in gamma distribution is realized in the estimation of the parameters α and β from a sample precipitation record. For gamma distribution, the population mean and variance are given by
which are expressed in terms of probability function as
To overcome the difficulty in performing the numerical integration, Thom [26] provided α and β estimates from maximum likelihood solutions
where is the sample mean
In this procedure, the sample mean is used to estimate the parameters α and β, because it is considered an unbiased estimator of the population mean, converging to the correct value as the number of data points grow arbitrarily large. Determining the variance is usually considered less straightforward. However, determining the exact probability distribution for the data is impossible, although the assumption of gamma is useful.
Another approximation is considered by realizing that Equation (3) is undefined for zero measurements. The following mixed distribution function of zeros and continuous precipitation has been employed
where represents the probability of having zero measurement, such that if is the number of zero precipitation measurements in the data series of records then . That is if , then and as it should be. The cumulative probability can then be converted to the standard random variable using the typical standardized normal cumulative probability table found in statistical textbooks or the rational approximation provided by Abramowitz and Stegun [27]
where
with the coefficients being equal to , , , , and . Apparently, the approximation in handling zero rainfall events is problematic as it is associated with assigning higher SPI values for that period. The improper use of probabilistic distribution will bias the drought index value and lead to misleading drought severity characterizations [25].
An alternative criterion suggested here is to use a precipitation index () analogous to the error equation obtained by subtracting the mean precipitation from the precipitation value and then dividing by the mean precipitation, such as
In this simple expression, the extreme condition of produces . The average precipitation results with . For the expression becomes . Table 3 shows the proposed classifications. This criterion assesses precipitation deficit in a manner similar to the original SPI, but it is not uniquely tied to a probability distribution. While the original SPI is defined to be equivalent to the Z-score in normal probability deviate, PI evaluates precipitation deficit and divide that deficit with a long-term average to relax the requirement for normalization.
The drought computation based on Equation (18) will be straightforward with timescales 12 and 24 months, which may be convenient for groundwater drought assessments [7]. For timescales less than 12 months, Equation (18) can still be used but with seasonal mean accounting for the average precipitation within the last N months
For example, short term drought analysis using N = 1 month is appropriate for assessing soil moisture deficit and crops stress. An analysis based on N = 9 months may be relevant for other agricultural applications [7].
Two important drought measures are of interest here. Drought severity is a measure for the accumulated drought magnitude. This parameter is calculated by adding values less than zero for consecutive occurrences
where x is the total number of consecutive occurrences. The negative sign in Equation (20) is added for convenience to render S positive. Even though Table 3 defines drought to occur with PI less than −0.5, the severity calculation is carried out when PI is less than zero. The drought duration d is a measure for the drought temporal extent, defined as the time within which the drought severity occurs. Similar to the severity, drought duration is calculated starting from PI less than zero. For many cases with long timescales, droughts of one-month durations are neglected, as they occur frequently just before the start of a rainfall season.
The assessment of drought impact on hydrologic systems based on the two variables of drought severity and duration can be accomplished using bivariate probability analysis. Here, the joint distribution for two independent variables and is
If the two variables are dependent, then the joint probability becomes
In this case, the estimation of the conditional probability is not straightforward, because it requires fitting parameters from the data. However, the mathematical difficulty can be handled by using copulas (e.g., [4,27,28,29]), which are multivariate cumulative probability functions used to describe the dependence between random variables while separating the effect of dependence without using sophisticated joint probability modeling [30]. The asymmetric Archimedean copula known as a Clayton copula is appropriate for drought simulation and will thus be used here, because the tail structure of droughts is well-reflected using Clayton copula [31,32,33]. The Clayton copula is given by
where A and B stand for the marginal probability for drought severity and duration, and is Kendall’s Tau. The coefficient will address the dependency requirement. That is, if the agreement between the two variables is perfect, then will be equal to 1; if the disagreement between the two variables is perfect, then it will be −1. However, if the two variables are independent, then will be close to zero.
3. Results and Discussion
3.1. PI Implementation Results
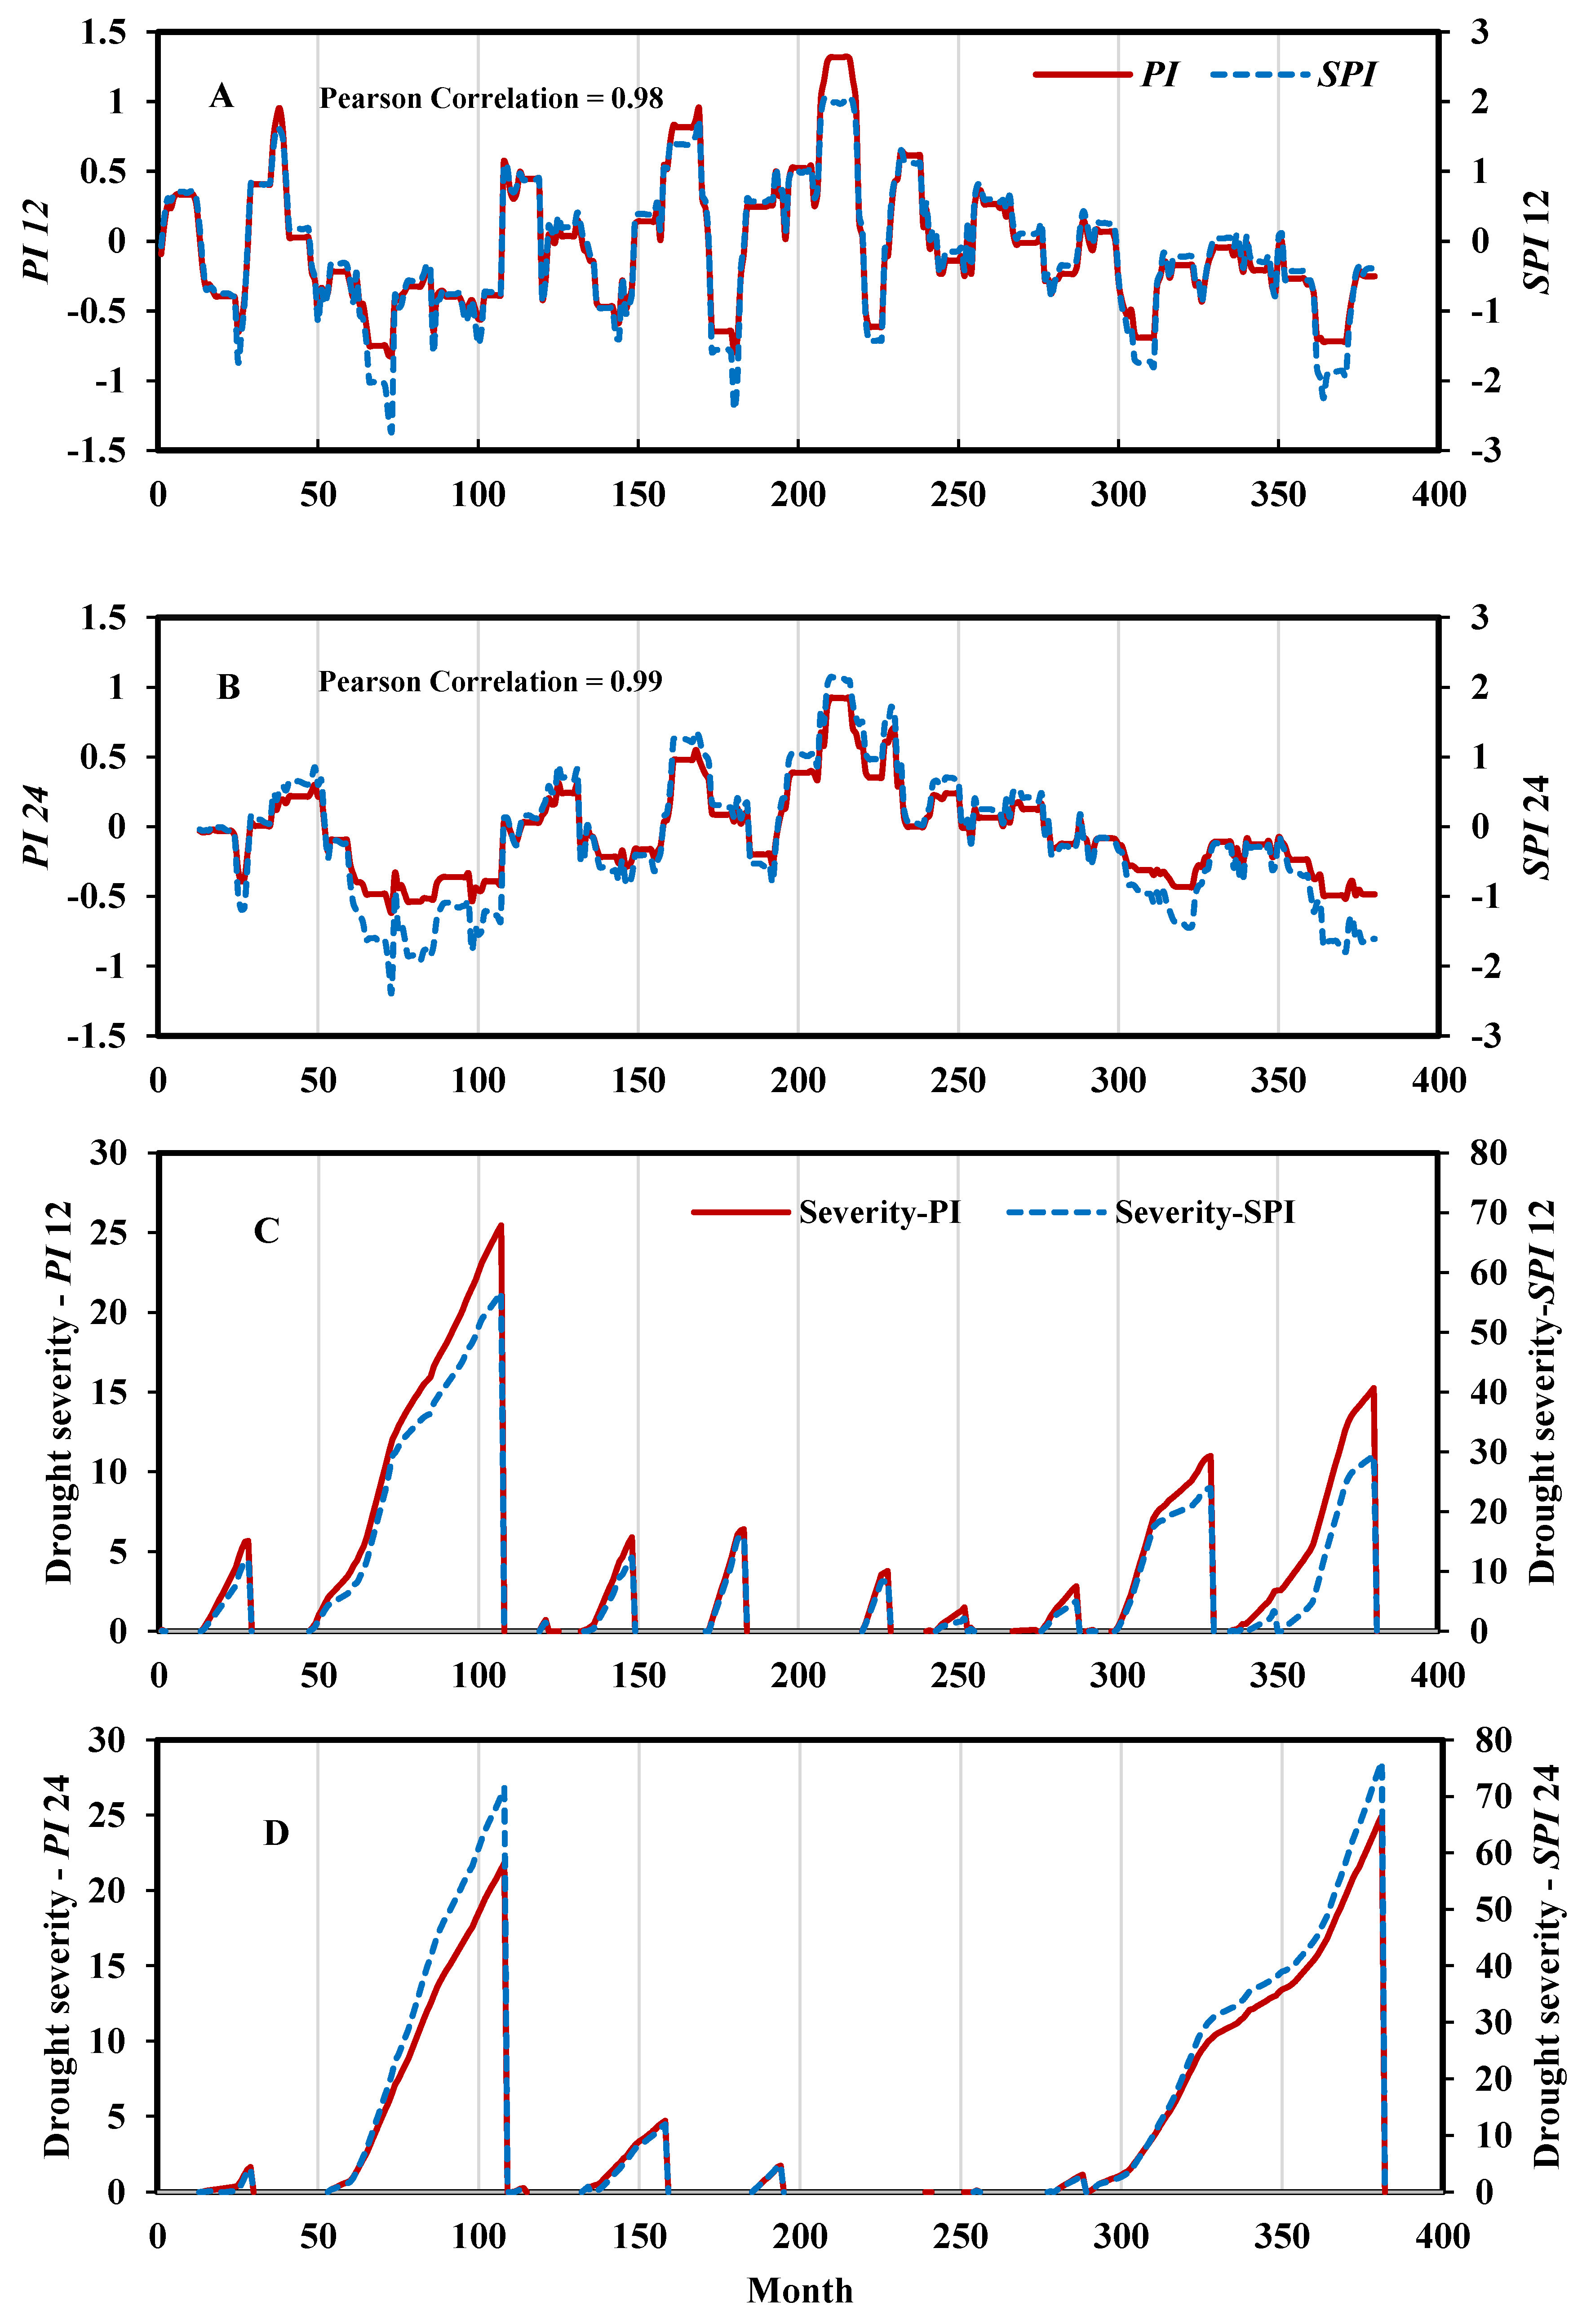
PI can be used for the assessment of groundwater drought scenarios in the arid region of Kuwait. In such an arid climate, groundwater represents the only available conventional water resource. Hence, detailed knowledge of freshwater shortage scenarios is essential to establish resilient water management plans. Initially, Figure 4 presents time series and drought severity comparisons between PI and SPI based on 12- and 24-month timescales, performed for a range of precipitation data from December 1958 to July 1990 (380 months). It is evident that PI is strongly correlated with SPI. Further, drought durations are similarly captured by the two indices. The worst case of drought occurs when the precipitation is zero in the analyzed area. In such case, PI will always have a value of -1. On the other hand, according to Equation (1), SPI would equal to the negative of the ratio of the average precipitation to the standard deviation. Thus, PI, will always have a common indication for the worst case of no precipitation, that is PI = -1, in comparison to the variable indication provided by SPI depending on the ratio of the average precipitation to the standard deviation for the analyzed area.
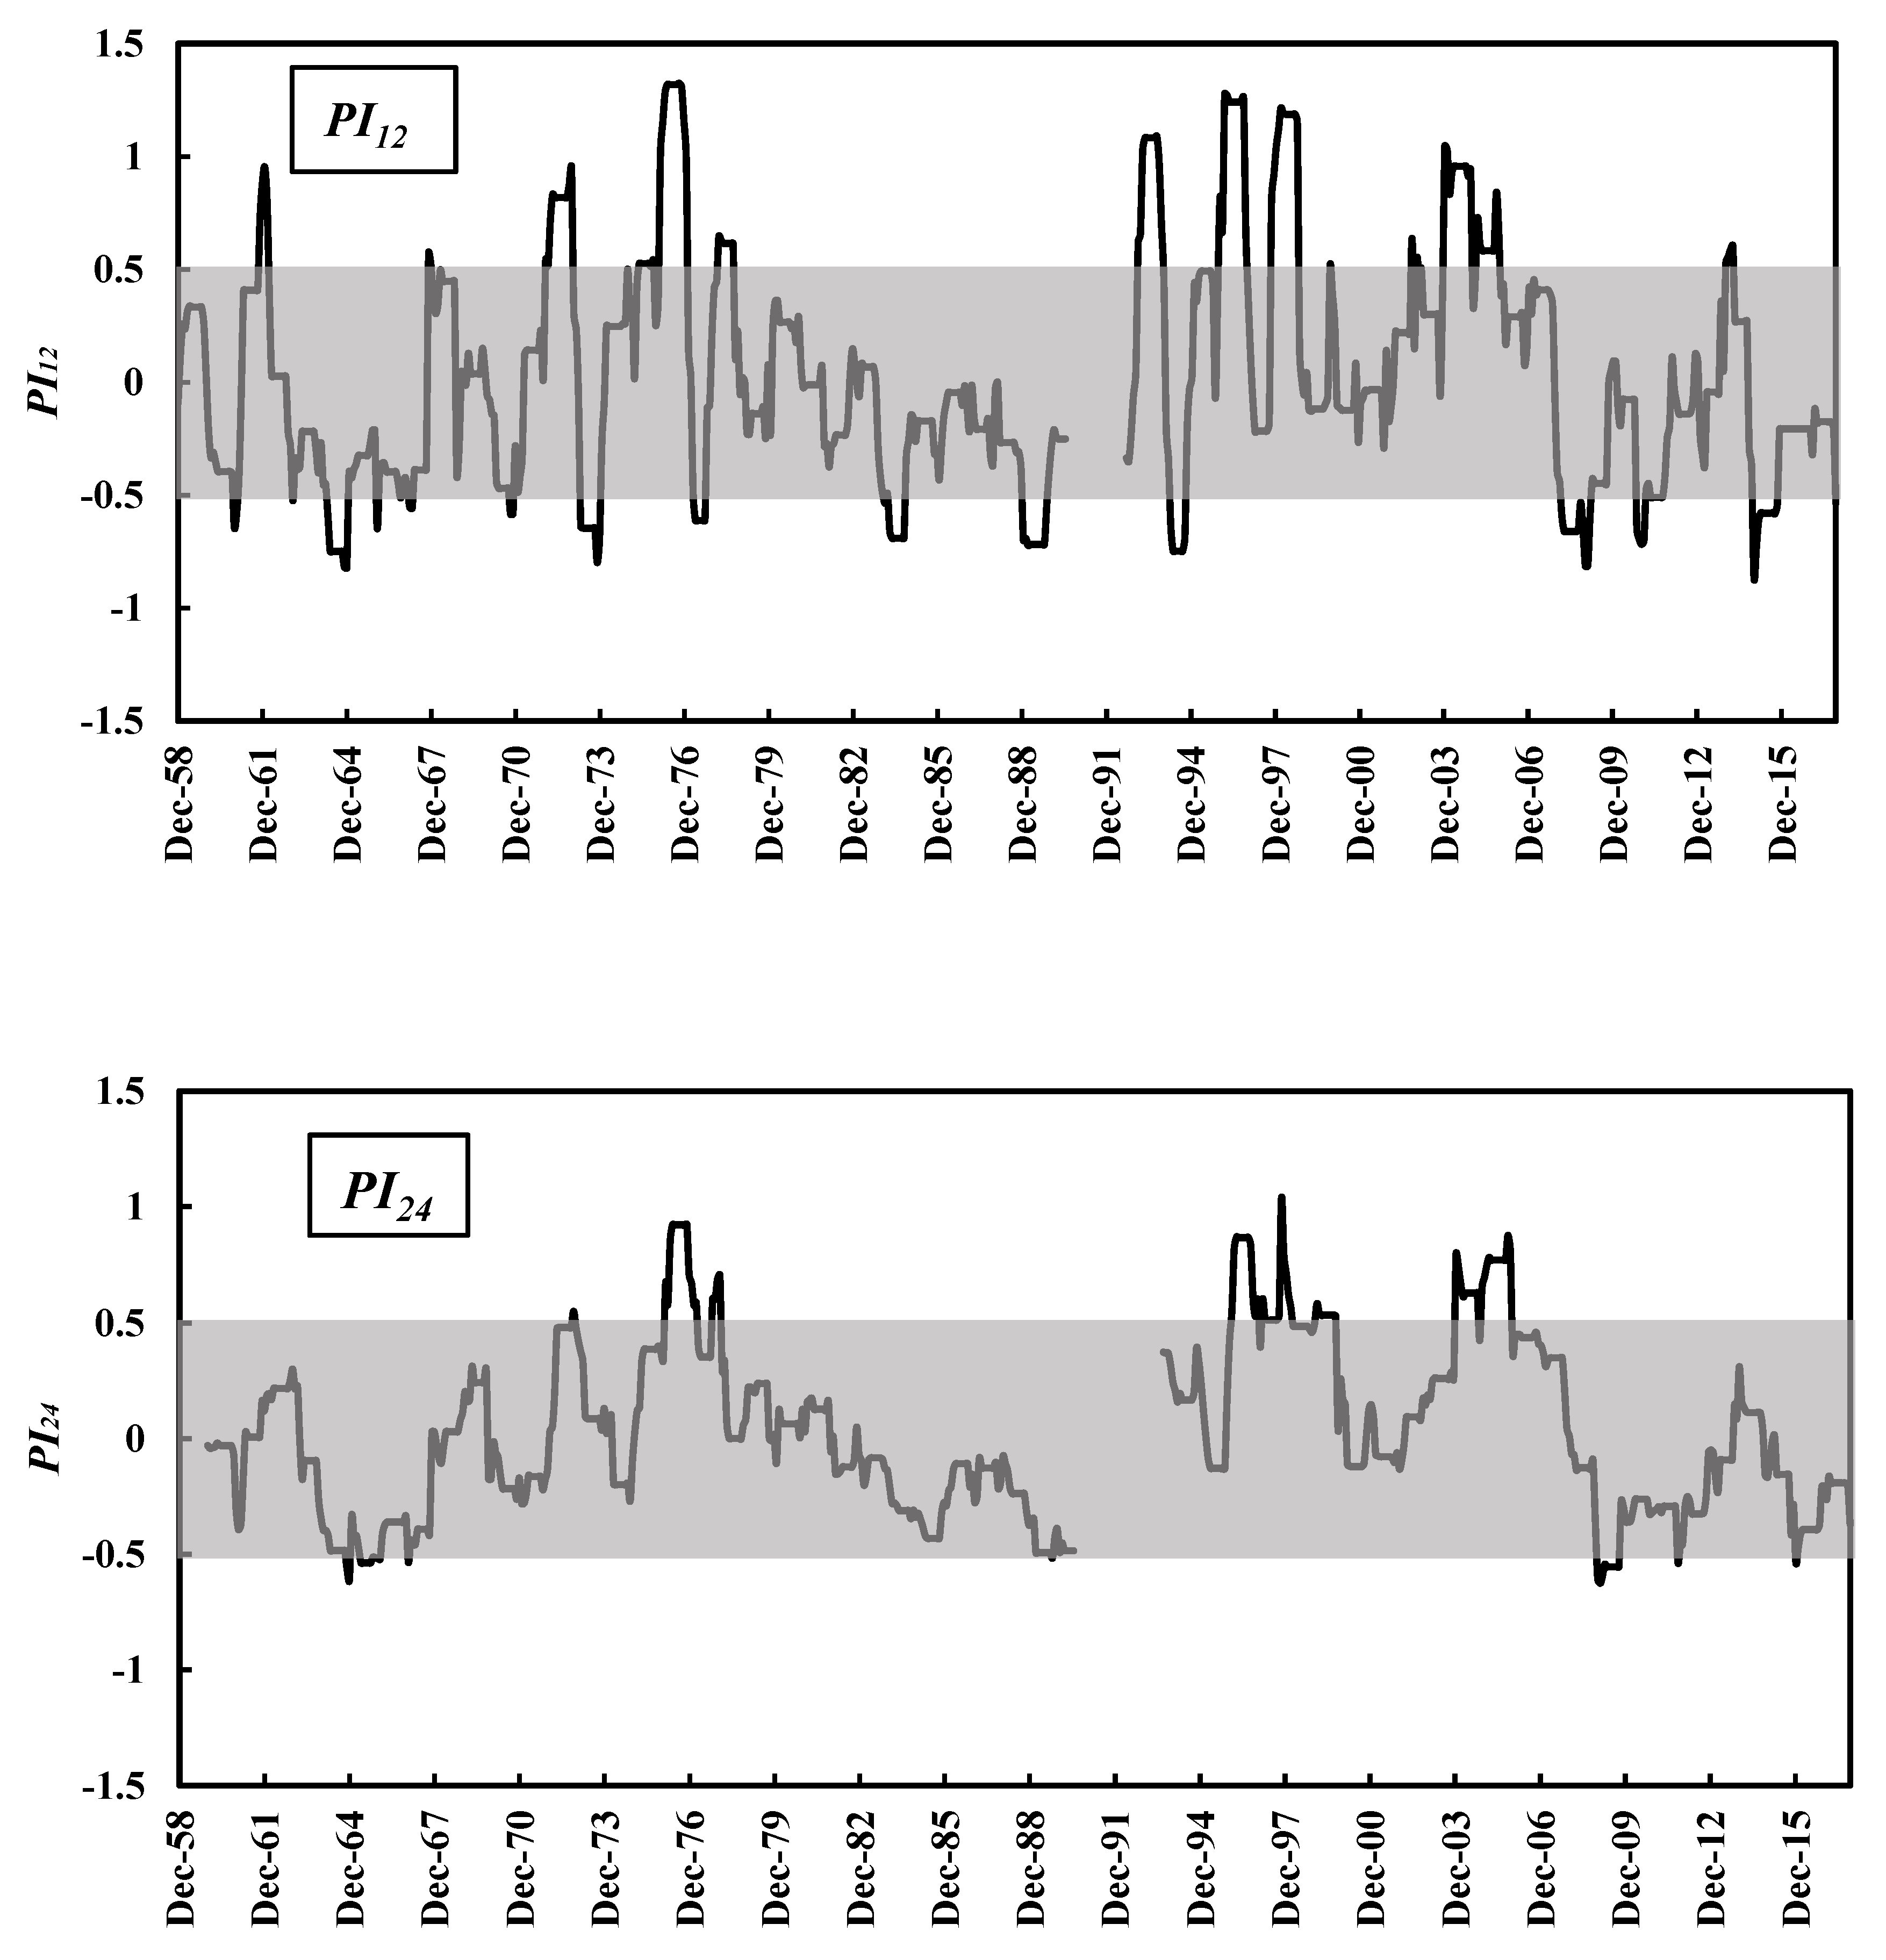
Figure 5 presents the computations of PI for the entire precipitation data until December 2017 for both 12- and 24-month timescales. The shaded area denotes the no-drought condition, with PI between ± 0.5. The gap shown in the computation from August 1990 to May 1991 is, as mentioned earlier, due to the lost precipitation data in the second Gulf War. This figure shows that the drought patterns for the two timescales are similar, but for the 12-month timescale it demonstrates more frequent occurrences, because precipitation records have less seasonality trend in interannual scales. There is no apparent long-term trend in both timescales computed.
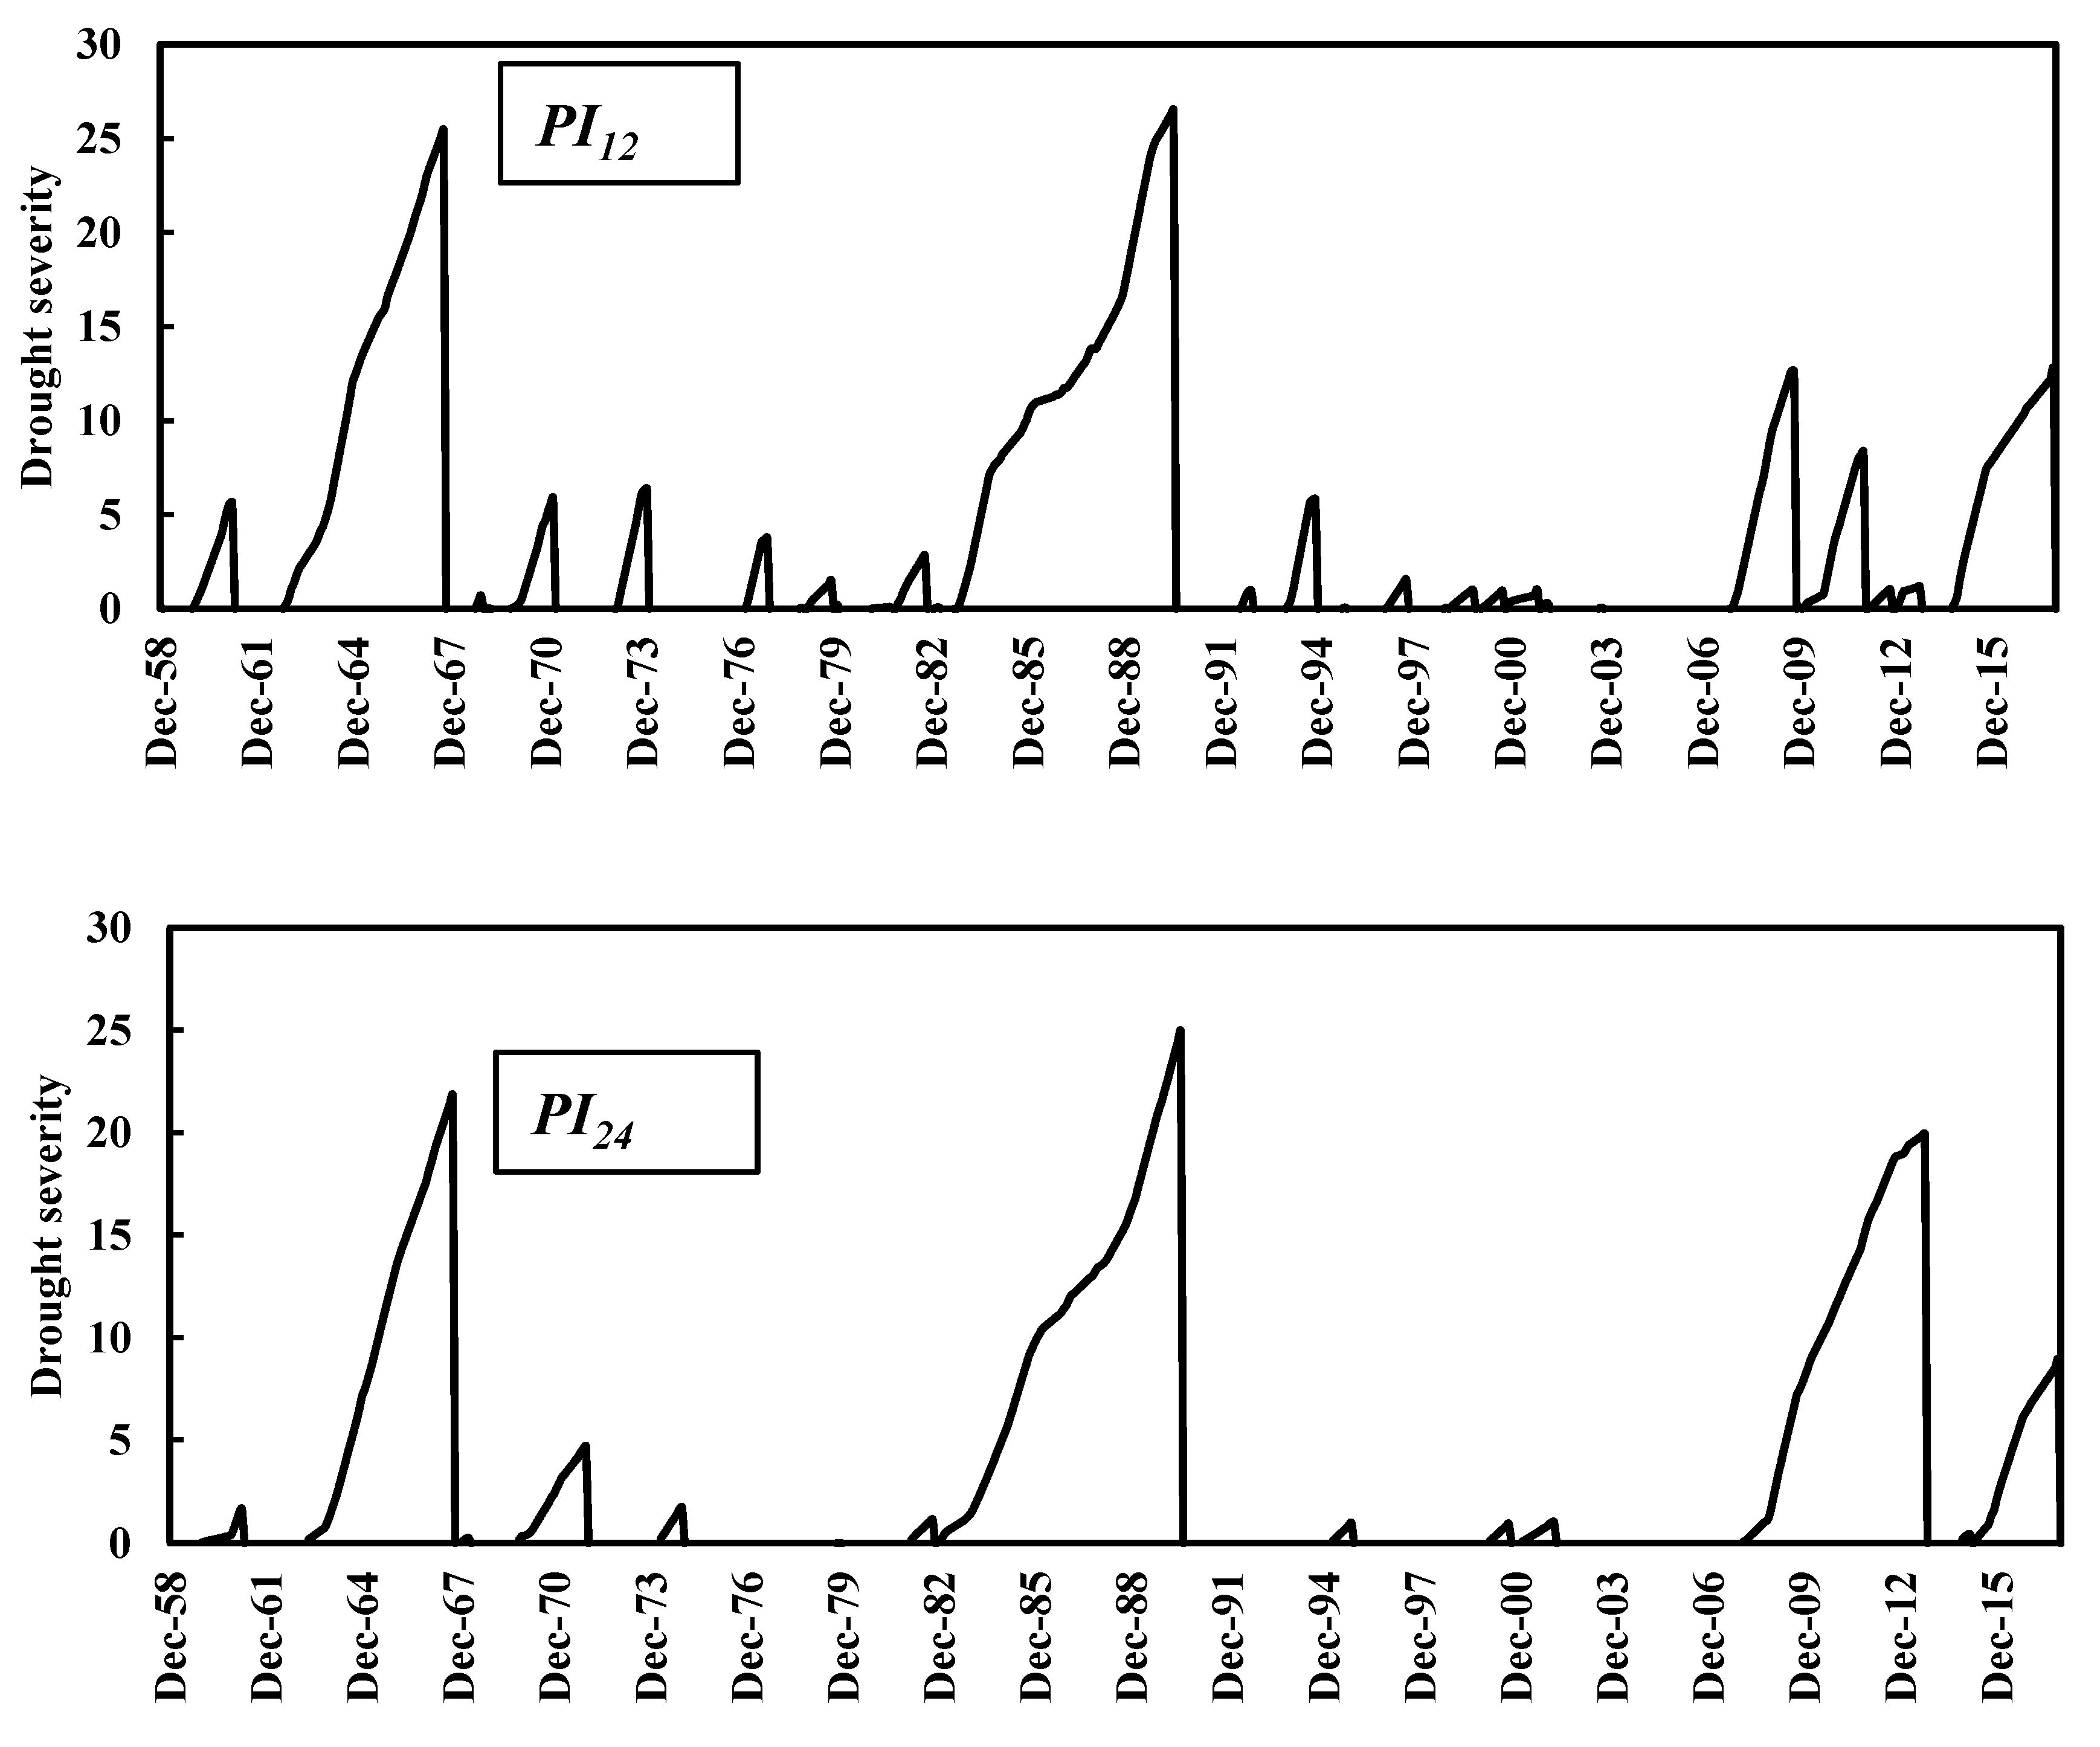
The no-trend observation must be confirmed with longer precipitation records to establish a solid conclusion. Figure 6 shows the cumulative drought severity versus time for the two timescales. The drought severities for major drought events greater than 10 are similarly characterized in both timescales. However, the 12-month timescale is more capable of capturing the severity for minor drought events.
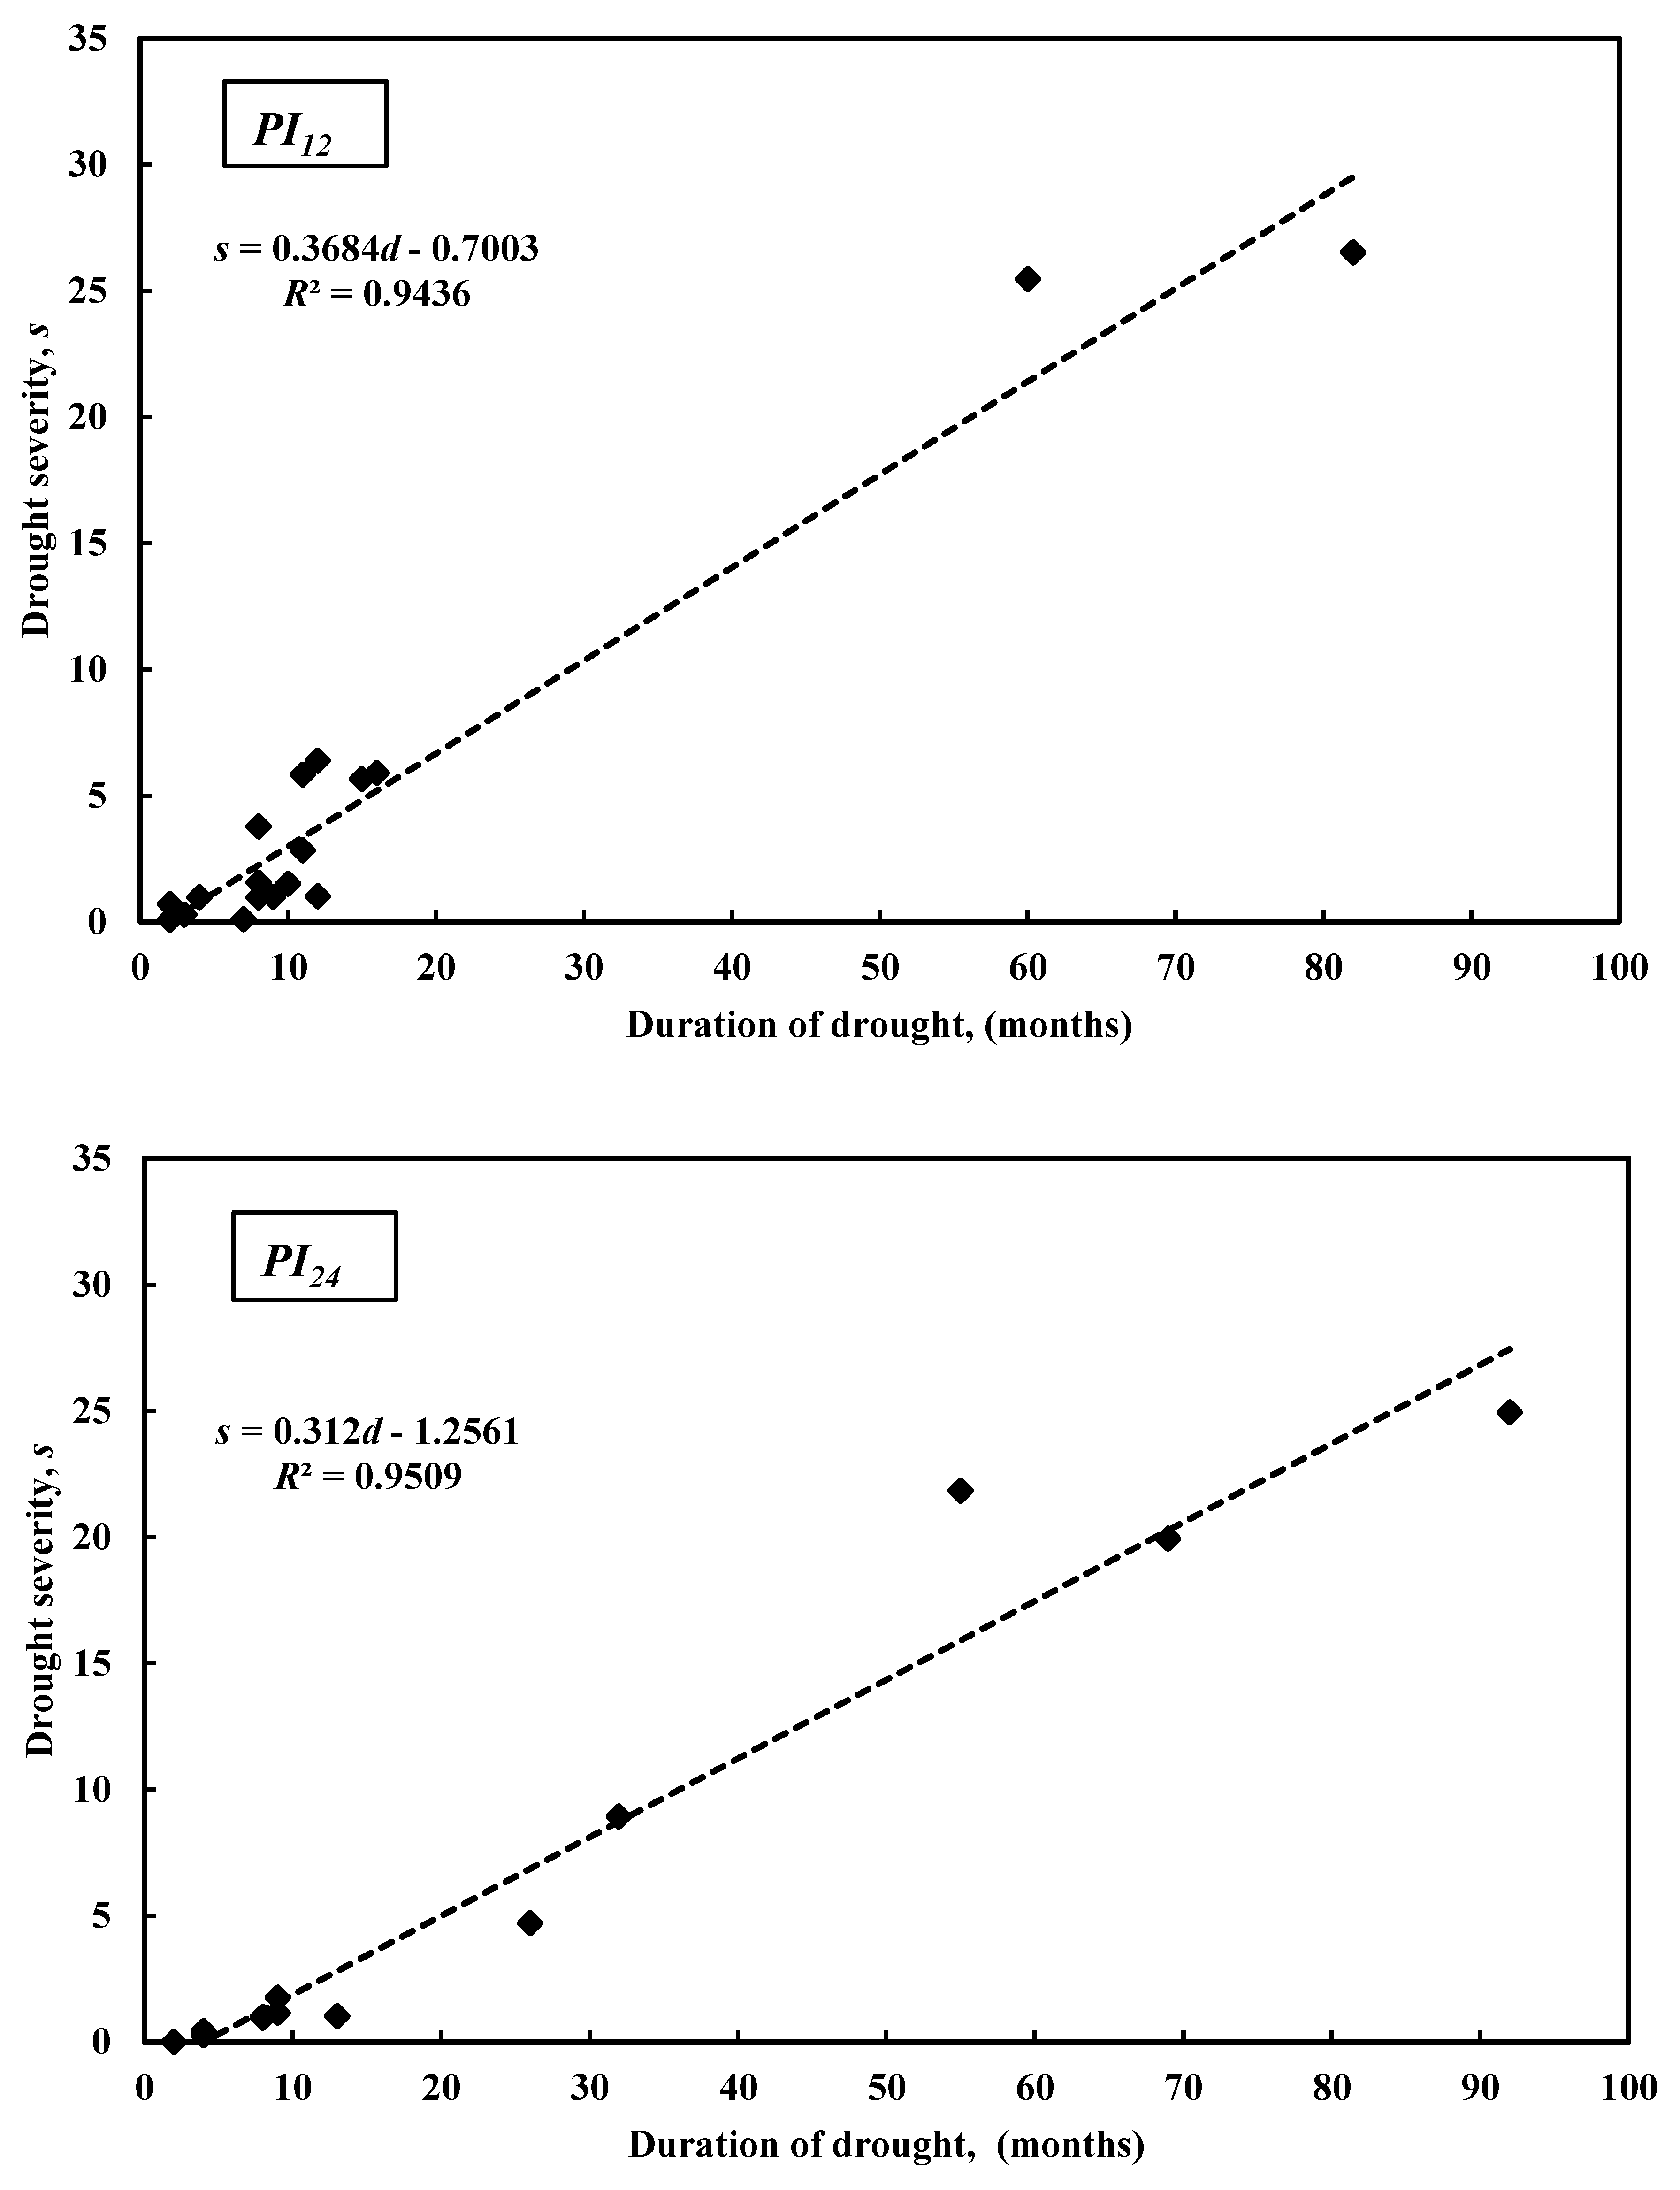
Figure 7 shows the observed drought event severities versus drought durations. The relation between the two drought variables is found to be linear with significant correlation, which means that drought propagates linearly through time. This linear relation was also observed by others, such as Guo et al. [4], who used the Multivariate Standardized Reliability and Resilience Index (IMSRRI) for assessing socioeconomic impacts of drought in Yellow river basin, China. 13 drought events were observed on a 24-month timescale, in comparison with 18 events observed on the 12-month timescale. The 12-month timescale drought analysis captured the occurrence of 5 minor drought events, which were not captured in the 24-month timescale.
A key aspect of drought management is the appropriate selection of drought analysis scale. It is evident that selecting a long timescale for drought analysis will not capture the occurrences of shorter drought events. Recharge to groundwater aquifers is significantly influenced by precipitation; however, short-term drought events may not alternate water inflow to aquifers through recharge. A 24-month timescale drought characterization is found to be more appropriate in predicting significant variations of groundwater recharge induced by major drought events. Groundwater systems react slowly to hydrometeorological forcing [34]. Thus, a longer temporal scale is considered more suitable in characterizing groundwater drought using indices.
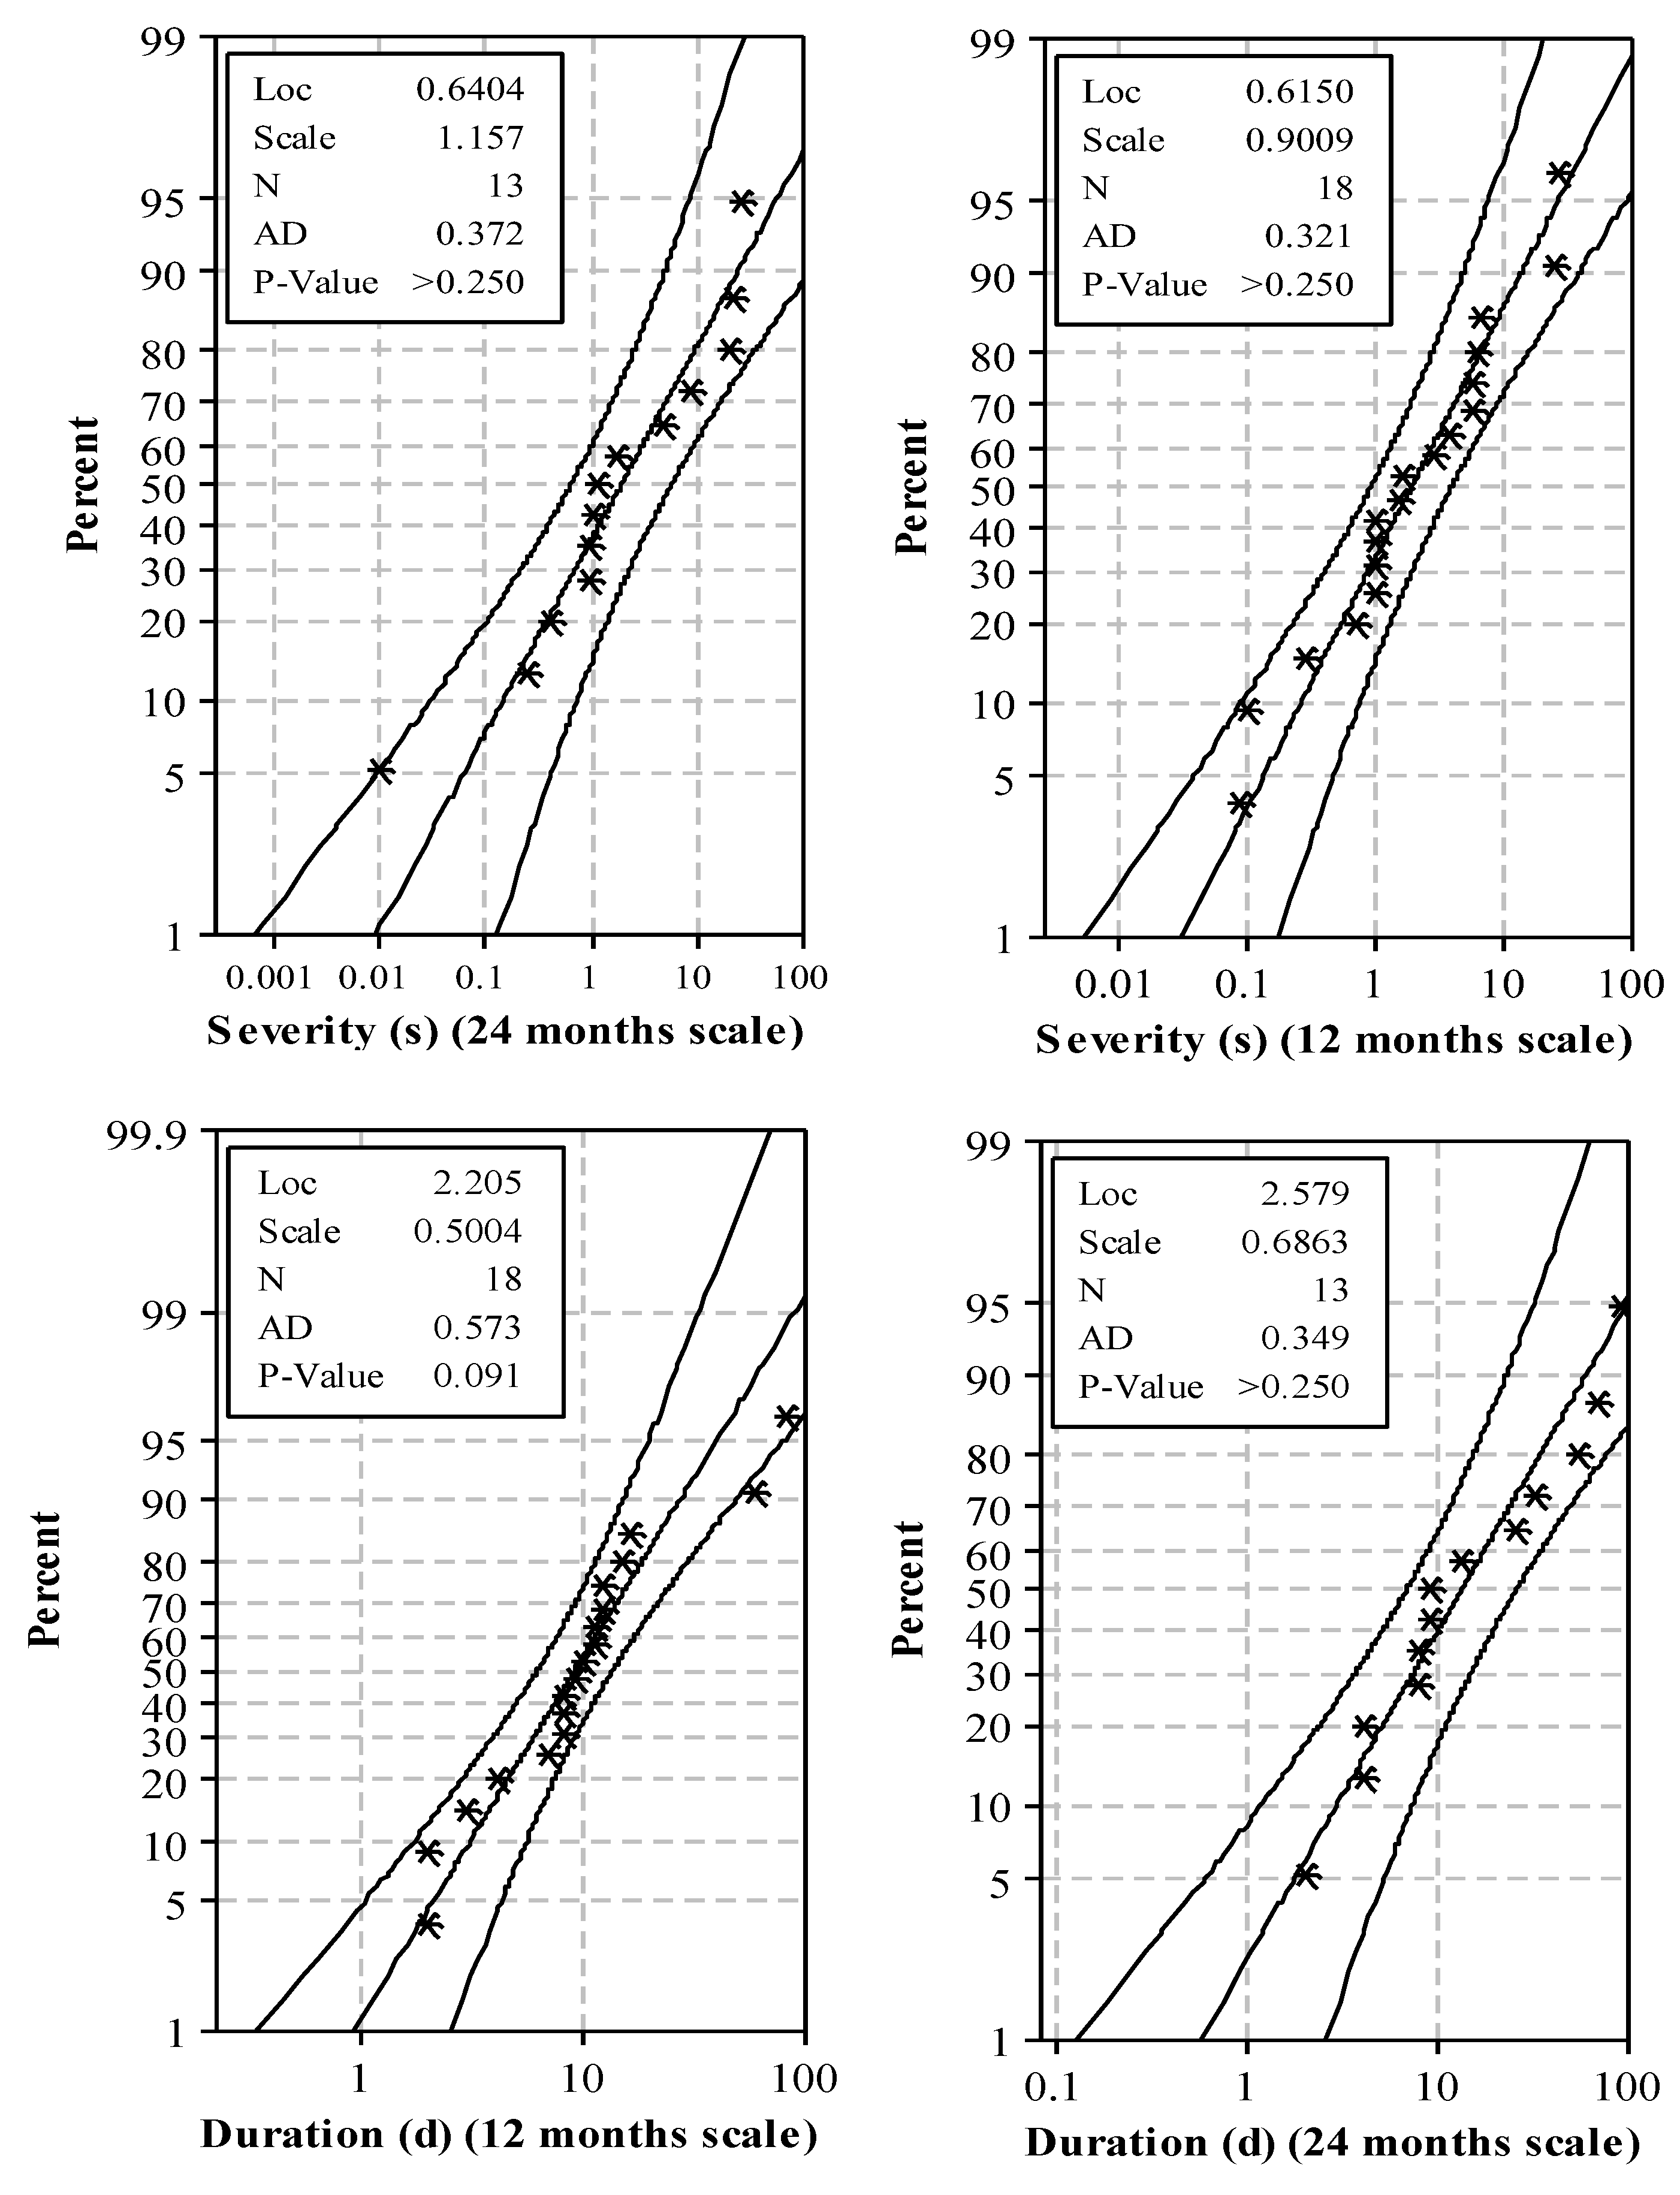
The log-logistic distribution can be employed to calculate the cumulative probability for both drought severity and drought duration
where μ, and b denote the location and scale parameters, respectively. The maximum likelihood estimation method was utilized to calculate location and scale parameters for Equation (25). Figure 8 demonstrates the log-logistic probability fits for drought severity and drought duration for 12- and 24-month timescales with the Anderson Darling test assessing the probability distribution goodness fit. The 95% Confidence interval for the probability distribution is also presented. The p-value for all probability fits is greater than 0.05, so the probabilistic fits can be considered appropriate for modeling the drought duration and severity data. This conclusion, that this probability type is suitable here, was also drawn by other researchers. For example, log-logistic distribution was adapted by Vicente-Serrano et al. [35] to standardize drought duration in developing standardized precipitation evapotranspiration index. The researchers found that the log-logistic probability distribution is best for drought duration. Log-logistic distribution for modeling drought status was later adopted by Vicente-Serrano et al. [36] in computing a streamflow drought index.
Table 4 demonstrates the bivariate correlations for drought severity and duration for the two timescales. The data show strong Pearson correlation values due to the linear dependency between drought variables. The computed Pearson and Kendall correlation coefficients values for both timescales tested are comparable with the results of Guo et al. [4], who obtained correlation coefficients equal to 0.91 for Pearson correlation coefficient and 0.77 for Kendall’s tau.
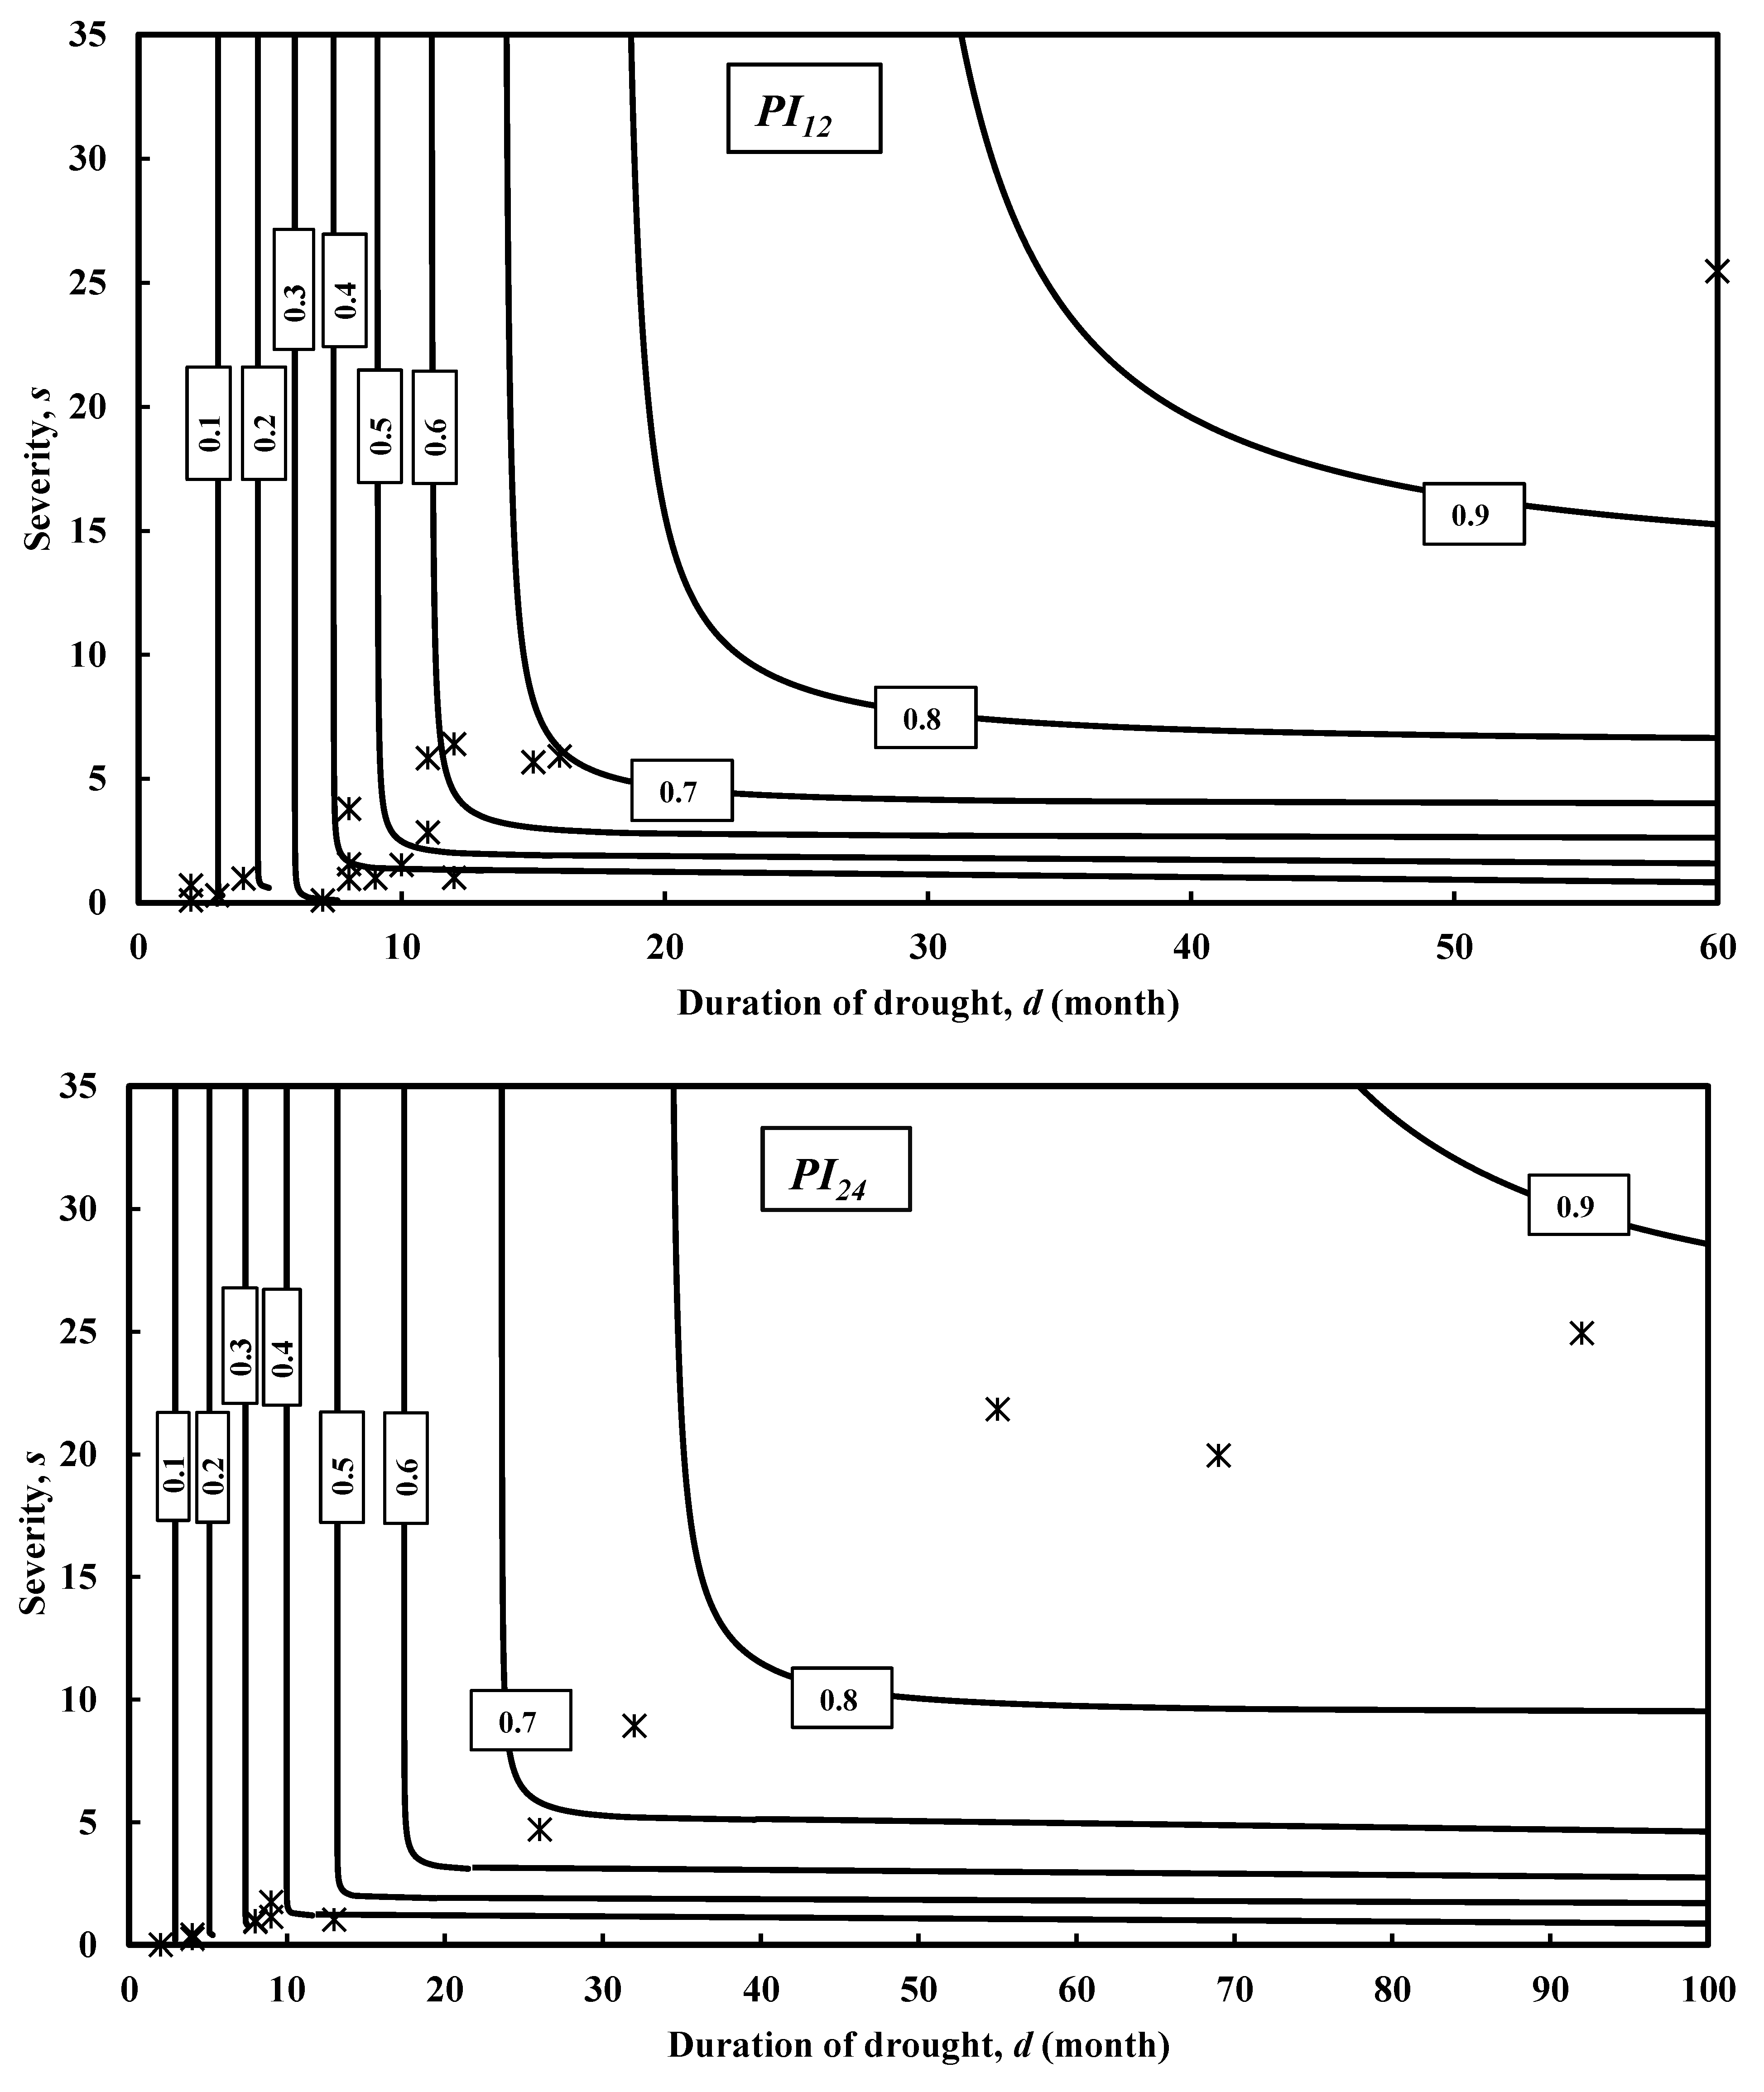
The Clayton copula bivariate probability for drought severity and drought duration can now be estimated from Equation (23). Figure 9 demonstrates the results of joint probability distribution for both drought variables based on 12- and 24-month timescales. The probability presented in this figure can be utilized to estimate the occurrence of various combinations of drought variables at a specific joint probability value. Formulating drought occurrence probability plots is vital for efficient drought management practices. By comparing the tested temporal scales, it is evident that the 24-month timescale contour plot exhibits more severe and prolonged drought events at C > 0.8. The 12-month timescale exhibits more drought events of less severity and duration at C < 0.8.
Previous research efforts in analyzing droughts employed primarily a normalization approach to produce indices. A normalization procedure for the targeted hydrologic variable is often not satisfactory (e.g., [16,17,18,20]). The methodology presented for calculating PI does not require such a normalization approach, which is usually associated with uncertainty as hydrologic data sets may not necessarily obey the normal distribution pattern. This feature is considered a key advantage of PI. Additionally, the calculations of PI do not require a minimum length of data record, as the original SPI does [13]. However, the current study suggests that the 30 years requirement, which was originally recommended by McKee et al. [13] as minimum precipitation record length for the best drought analysis outcomes, is not a prerogative of the SPI and is applied as well for the current index for better drought assessment.
3.2. Suitability of PI as a Meteorological Drought Index for Hydrological Droughts Assessment
3.2.1. Case Study of Groundwater Aquifers in the State of Kuwait
The methodology presented considers only the meteorological driver (precipitation deficit) for assessing hydrological drought in terms of water reserve depletion with no signature of anthropogenic activities that may contribute to the worst drought scenarios, for example, groundwater overexploitation. For the case study considered here, nearly all groundwater originates from precipitation, which percolates through the unsaturated zone to recharge the subsurface freshwater lens. In such an arid climate, the amount of water that is deliverable to the freshwater reserve is strongly controlled by precipitation frequency and intensity. PI is a drought index that is solely dependent on precipitation, therefore it presents an efficient tool for reflecting drought status in the precipitation-controlled aquifer system in the study area.
In addition, anthropogenic stresses to the groundwater reserves through abstraction in the study area are minimal. Previous studies estimated that the annual recharge volumes to Al-Rawdatain basin are in the order of millions of cubic meters while current withdrawals rates do not exceed 100,000 m3/year [22,37,38,39,40]. On the other hand, at Umm-Al-Aish basin, there are no current withdrawals due to the lower quality of groundwater. The estimated recharge and current withdrawals rates reported in the literature support the suitability of PI application as a meteorologically based index for the hydrological drought assessment of Al-Rawdatain and Umm-Al-Aish basins in the State of Kuwait.
3.2.2. Limitations of PI for Hydrological Droughts Assessment
Even though the PI was tested for assessing groundwater drought in the study area, its application to other groundwater systems should be done with caution. PI should only be applied to groundwater systems (or any other hydrological systems that are solely dependent on precipitation). The existence of extensive anthropogenic stresses and other hydrological variables which can contribute to the fluctuations of water reserves such as the regional lateral flows can limit the capabilities of PI. In such conditions, PI cannot present robust results for drought assessment. However, it could provide preliminary drought assessment that needs to be furtherly validated by considering major factors affecting the groundwater system of interest. Therefore, it is essential to establish a hydrological framework for the system of interest before applying PI for drought assessment.
3.2.3. Non-Normality of Precipitation Time Series in Arid Climates
The major objective of the current study was to present a surrogate drought index for when SPI fails to characterize droughts status. SPI calculations require using probabilistic transformation to normalize precipitation time series before applying the SPI equation. Wu et al. [41] utilized date from 218 weather stations across 40 states in the United States to examine the effect of no-precipitation seasons and dry climates on SPI calculations. The study concluded that under dry climate conditions SPI fails to indicate drought status. That is because precipitation time series is lower bounded by zero. Further, when the frequency of zero precipitation records increases, the accuracy of estimating the normal distribution tail is suspect, as the probability of zero rainfall events increases. This problem becomes even worse with shorter time scales of SPI calculations as the chances of zero rainfall increase.
The study of Wu et al. [41] recommended that SPI should be used with caution, especially in arid regions. Thus, the requirement of lifting normality in short term data sets becomes crucial. On the other hand, fitting normal distribution to long term precipitation data is less problematic as longer precipitation records tend to be closer to normal distribution deviate, therefore SPI can be used with higher level of confidence. Hence, PI may not be an efficient surrogate for SPI in cases when hydrological data are close to normal distribution.
Considering the time scales used for analyzing drought status in this study, SPI and PI are exhibiting similar drought characterization capabilities, However, if SPI and PI were used for drought analysis for other hydrological regimes which require shorter time scales (e.g., soil moisture, or irrigation systems), significant differences between the two indices is expected. Future research is required to further investigate the differences in drought analysis capabilities of the two indices in various temporal scales and in different hydrological regimes. Such research investigations require detailed hydrologic data from rivers, lakes, and soil moisture, which are important to agricultural countries that are not highly relevant to the arid country of Kuwait.
4. Conclusions
This study presented the development and implementation of PI for analyzing droughts. The index was inspired by the widely accepted SPI, with modification of the original SPI formula. The modification presented was meant to overcome a key disadvantage in the original SPI calculation procedure by replacing the standard deviation term in the original SPI formula with a sample mean. PI was found to have similar and comparable drought characterization capabilities as the original SPI. Future research is needed to quantify how strong PI is in comparison to SPI, especially in the cases exhibiting non-satisfactory probability distribution fitting. The PI was tested for the assessment of the groundwater drought status in the state of Kuwait. The results showed precipitation drought propagating linearly through time. Contour plots for the bivariate probability of occurrence of drought severity and duration showed that the 24-month timescale was more appropriate in providing indications regarding groundwater reserve depletion. The application of PI showed no major trend in the occurrence of drought in the period tested for the case study, from 1958 to 2017. Further research is needed to confirm this finding, which is subject to the availability of longer precipitation records. As a meteorological drought index, PI was found suitable for assessing the hydrological drought status in a precipitation-controlled groundwater system. The implementation of PI to other hydrological regimes for drought assessment should be done with caution if these systems of interest are being influenced by other factors which can affect their water reserve fluctuation. The simplified PI can be used with a proper selection of timescale to assess drought impacts on hydrological systems according to Equation (19). The results here aim to help water managers develop drought mitigation plans, especially in regions with high water stress.
Funding
The author acknowledges the funding of this research through Kuwait University (research sector grant: ZE01/19)
Conflicts of Interest
The author declares no conflict of interest.
References
- Lettenmaier, D.P.; McCabe, G.; Stakhiv, E.Z. Global climate change: Effect on hydrologic cycle. In Water Resources Handbook; McGraw-Hill: New York, NY, USA, 1996; pp. 21–29. [Google Scholar]
- Aswathanarayana, U. Water Resources Management and the Environment; CRC Press: Boca Raton, FL, USA, 2001; ISBN 1439834288. [Google Scholar]
- Riebsame, W.E.; Changnon, S.A., Jr.; Karl, T.R. Drought and Natural Resources Management in the United States: Impacts and Implications of the 1987–89 Drought; Westview Press Inc.: Boulder, CO, USA, 1991; ISBN 081338026X. [Google Scholar]
- Guo, Y.; Huang, S.; Huang, Q.; Wang, H.; Wang, L.; Fang, W. Copulas-based bivariate socioeconomic drought dynamic risk assessment in a changing environment. J. Hydrol. 2019. [Google Scholar] [CrossRef]
- Mosley, L.M. Drought impacts on the water quality of freshwater systems; review and integration. Earth Sci. Rev. 2015, 140, 203–214. [Google Scholar] [CrossRef]
- Mishra, A.K.; Singh, V.P. A review of drought concepts. J. Hydrol. 2010, 391, 202–216. [Google Scholar] [CrossRef]
- Zargar, A.; Sadiq, R.; Naser, B.; Khan, F.I. A review of drought indices. Environ. Rev. 2011, 19, 333–349. [Google Scholar] [CrossRef]
- Tsakiris, G.; Loukas, A.; Pangalou, D.; Vangelis, H.; Tigkas, D.; Rossi, G.; Cancelliere, A. Drought characterization. Drought Management Guidelines Technical Annex. In Options Méditérr; CIHEAM: Zaragoza, Spain, 2007; pp. 85–102. [Google Scholar]
- Lawson, M.P.; Reiss, A.; Phillips, R.; Livingston, K. Nebraska Droughts A Study of Their Past Chronological and Spatial Extent with Implications for the Future. 1971. Available online: https://digitalcommons.unl.edu/geographyfacpub/31/ (accessed on 10 January 2020).
- Karl, T.R.; Quayle, R.G. The 1980 summer heat wave and drought in historical perspective. Mon. Weather Rev. 1981, 109, 2055–2073. [Google Scholar] [CrossRef] [Green Version]
- Palmer, W.C. Meteorological Drought; Reserch Paper No. 45; US Weather Bureau: Silver Spring, MD, USA, 1965.
- Alley, W.M. The Palmer drought severity index: Limitations and assumptions. J. Clim. Appl. Meteorol. 1984, 23, 1100–1109. [Google Scholar] [CrossRef] [Green Version]
- McKee, T.B.; Doesken, N.J.; Kleist, J. The relationship of drought frequency and duration to time scales. In Proceedings of the 8th Conference on Applied Climatology, Anaheim, CA, USA, January 1993; Volume 17, pp. 179–183. [Google Scholar]
- Svoboda, M.; Hayes, M.; Wood, D. Standardized Precipitation Index User Guide; World Meteorological Organization: Geneva, Switzerland, 2012. [Google Scholar]
- Thom, H.C.S. A note on the gamma distribution. Mon. Weather Rev. 1958, 86, 117–122. [Google Scholar] [CrossRef]
- Goodarzi, M.; Abedi-Koupai, J.; Heidarpour, M.; Safavi, H.R. Development of a new drought index for groundwater and its application in sustainable groundwater extraction. J. Water Resour. Plan. Manag. 2016, 142, 4016032. [Google Scholar] [CrossRef]
- Bloomfield, J.P.; Marchant, B.P. Analysis of groundwater drought building on the standardised precipitation index approach. Hydrol. Earth Syst. Sci. 2013, 17, 4769–4787. [Google Scholar] [CrossRef] [Green Version]
- Shukla, S.; Wood, A.W. Use of a standardized runoff index for characterizing hydrologic drought. Geophys. Res. Lett. 2008, 35. [Google Scholar] [CrossRef] [Green Version]
- López-Moreno, J.I.; Vicente-Serrano, S.M.; Beguería, S.; García-Ruiz, J.M.; Portela, M.M.; Almeida, A.B. Dam effects on droughts magnitude and duration in a transboundary basin: The Lower River Tagus, Spain and Portugal. Water Resour. Res. 2009, 45. [Google Scholar] [CrossRef] [Green Version]
- Sheffield, J.; Goteti, G.; Wen, F.; Wood, E.F. A simulated soil moisture based drought analysis for the United States. J. Geophys. Res. Atmos. 2004, 109. [Google Scholar] [CrossRef]
- Mukhopadhyay, A.; Al-Sulaimi, J.; Barrat, J.M. Numerical Modeling of Ground-Water Resource Management Options in Kuwait. Groundwater 1994, 32, 917–928. [Google Scholar] [CrossRef]
- Kwarteng, A.Y.; Viswanathan, M.N.; Al-Senafy, M.N.; Rashid, T. Formation of fresh ground-water lenses in northern Kuwait. J. Arid Environ. 2000, 46, 137–155. [Google Scholar] [CrossRef]
- Almedeij, J. Modeling rainfall variability over urban areas: A case study for Kuwait. Sci. World J. 2012, 2012. [Google Scholar] [CrossRef] [Green Version]
- Sienz, F.; Bothe, O.; Fraedrich, K. Monitoring and quantifying future climate projections of dryness and wetness extremes: SPI bias. Hydrol. Earth Syst. Sci. 2012, 16, 2143–2157. [Google Scholar] [CrossRef] [Green Version]
- Stagge, J.H.; Tallaksen, L.M.; Gudmundsson, L.; Van Loon, A.F.; Stahl, K. Candidate distributions for climatological drought indices (SPI and SPEI). Int. J. Climatol. 2015, 35, 4027–4040. [Google Scholar] [CrossRef]
- Thom, H.C.S. Some Methods of Climatological Analysis; Note 81; WMO Tech: Geneva, Switzerland, 1966. [Google Scholar]
- Abramowitz, M.; Stegun, I.A. Handbook of Mathematical Functions: With Formulas, Graphs, and Mathematical Tables; Courier Corporation: North Chelmsford, MA, USA, 1965; Volume 55, ISBN 0486612724. [Google Scholar]
- Chen, L.; Singh, V.P.; Guo, S.; Zhou, J.; Zhang, J. Copula-based method for multisite monthly and daily streamflow simulation. J. Hydrol. 2015, 528, 369–384. [Google Scholar] [CrossRef]
- Chang, J.; Li, Y.; Wang, Y.; Yuan, M. Copula-based drought risk assessment combined with an integrated index in the Wei River Basin, China. J. Hydrol. 2016, 540, 824–834. [Google Scholar] [CrossRef]
- Shiau, J.T. Fitting drought duration and severity with two-dimensional copulas. Water Resour. Manag. 2006, 20, 795–815. [Google Scholar] [CrossRef]
- Shiau, J.; Feng, S.; Nadarajah, S. Assessment of hydrological droughts for the Yellow River, China, using copulas. Hydrol. Process. 2007, 21, 2157–2163. [Google Scholar] [CrossRef]
- Laux, P.; Wagner, S.; Wagner, A.; Jacobeit, J.; Bárdossy, A.; Kunstmann, H. Modelling daily precipitation features in the Volta Basin of West Africa. Int. J. Climatol. 2009, 29, 937–954. [Google Scholar] [CrossRef] [Green Version]
- Shiau, J.-T.; Modarres, R. Copula-based drought severity-duration-frequency analysis in Iran. Meteorol. Appl. 2009, 16, 481–489. [Google Scholar] [CrossRef]
- Li, B.; Rodell, M. Evaluation of a model-based groundwater drought indicator in the conterminous US. J. Hydrol. 2015, 526, 78–88. [Google Scholar] [CrossRef] [Green Version]
- Vicente-Serrano, S.M.; Beguería, S.; López-Moreno, J.I. A multiscalar drought index sensitive to global warming: The standardized precipitation evapotranspiration index. J. Clim. 2010, 23, 1696–1718. [Google Scholar] [CrossRef] [Green Version]
- Vicente-Serrano, S.M.; López-Moreno, J.I.; Beguería, S.; Lorenzo-Lacruz, J.; Azorin-Molina, C.; Morán-Tejeda, E. Accurate computation of a streamflow drought index. J. Hydrol. Eng. 2011, 17, 318–332. [Google Scholar] [CrossRef] [Green Version]
- Al-Senafy, M.; Fadlelmawla, A.; Bhandary, H.; Al-Khalid, A.; Rashid, T.; Al-Fahad, K.; Al-Salman, B. Assessment of Usable Groundwater Reserve in Northern Kuwait. Int. J. Sci. Eng. Res. 2013, 4, 2427–2436. [Google Scholar]
- Al-Dousari, A.; Milewski, A.; Din, S.U.; Ahmed, M. Remote sensing inputs to SWAT model for groundwater recharge estimates in Kuwait. Adv. Nat. Appl. Sci. 2010, 4, 71–77. [Google Scholar]
- Al-Otaibi, M.M. Artificial Groundwater Recharge in Kuwait: Planning and Management. 1997. Available online: https://theses.ncl.ac.uk/jspui/handle/10443/3581 (accessed on 10 January 2020).
- Alrashidi, M.S.; Bailey, R.T. Estimating Groundwater Recharge for a Freshwater Lens in an Arid Region: Formative and Stability Assessment. Hydrol. Process. 2019. [Google Scholar] [CrossRef]
- Wu, H.; Svoboda, M.D.; Hayes, M.J.; Wilhite, D.A.; Wen, F. Appropriate application of the standardized precipitation index in arid locations and dry seasons. Int. J. Climatol. 2007, 27, 65–79. [Google Scholar] [CrossRef]
Figure 1.
Study Area and the Location of Major Fresh Groundwater Aquifers.

Figure 2.
Schematic Diagram for Freshwater Lens Formation in Northern Kuwait. (Vertical Scale is Exaggerated).
Figure 2.
Schematic Diagram for Freshwater Lens Formation in Northern Kuwait. (Vertical Scale is Exaggerated).

Figure 3.
Monthly total rainfall data averages within 12-year duration for six weather stations located in the urban zone of Kuwait City.
Figure 3.
Monthly total rainfall data averages within 12-year duration for six weather stations located in the urban zone of Kuwait City.

Figure 4.
SPI and PI time series comparison at (A) 12-month time scale and (B) 24-month timescale. In addition, drought severities as calculated by SPI and PI methods are compared at (C) 12-month time scale and (D) 24-mont time scale. Comparisons were performed using precipitation data from December 1958 (month 1) until July 1990 (month 380) collected from Kuwait International Airport (KIA) station.

Figure 5.
PI versus time at: 12-month timescale and 24-month timescale. Shaded area denotes no drought condition. PI was not calculated for the missing data period.
Figure 5.
PI versus time at: 12-month timescale and 24-month timescale. Shaded area denotes no drought condition. PI was not calculated for the missing data period.

Figure 6.
Cumulative drought severity versus time at 12- and 24-month timescales.

Figure 7.
Drought severity versus duration of drought for 12- and 24-month timescales.

Figure 8.
Log-logistic probability fit for drought severity and duration based on 12-month and 24-month timescales. AD stands for Anderson darling test score.
Figure 8.
Log-logistic probability fit for drought severity and duration based on 12-month and 24-month timescales. AD stands for Anderson darling test score.

Figure 9.
Contour plot for bivariate probability distribution for drought duration and severity. Scattered points denote observed drought event.
Figure 9.
Contour plot for bivariate probability distribution for drought duration and severity. Scattered points denote observed drought event.


Table 1.
Descriptive statistics for annual precipitation records at Kuwait International Airport weather station (KIA) from 1958-2017. Units are in millimeters.
Table 1.
Descriptive statistics for annual precipitation records at Kuwait International Airport weather station (KIA) from 1958-2017. Units are in millimeters.
| KIA Station | N (years) | Mean | Standard Deviation | Maximum |
| 55 | 115.7 | 52.2 | 242.4 | |
| Minimum | Q1 | Median | Q3 | |
| 19.9 | 79.4 | 110.5 | 140.5 |
Table 2.
A comparison between monthly precipitation records at Kuwait international airport (KIA) and Saberya meteorological stations. Units are in millimeters.
Table 2.
A comparison between monthly precipitation records at Kuwait international airport (KIA) and Saberya meteorological stations. Units are in millimeters.
| Station | Period | N (Months) | Mean | Std dev. | Q1 | Median | Q3 | Maximum |
|---|---|---|---|---|---|---|---|---|
| KIA | May 2011- May 2018 | 85 | 7.51 | 13.66 | 0 | 0.45 | 7.46 | 63.21 |
| Saberya | 85 | 7.44 | 12.69 | 0 | 1.89 | 8.25 | 57.12 |
Table 3.
SPI and suggested PI classifications.
| Class | SPI value | PI value |
|---|---|---|
| Extremely wet | >2.0 | >1.0 |
| Very wet | 1.5 to 2.0 | 0.75 to 1.0 |
| Moderately wet | 1.0 to 1.5 | 0.5 to 0.75 |
| Normal | 1.0 to -1.0 | 0.5 to -0.5 |
| Moderate drought | −1.0 to −1.5 | −0.5 to −0.75 |
| Severe drought | −1.5 to −2.0 | −0.75 to −1.0 |
| Extreme drought | <−2.0 | −1.0 |
Table 4.
Correlations between drought severity and duration and corresponding θ calculated from Equation (24).
Table 4.
Correlations between drought severity and duration and corresponding θ calculated from Equation (24).
| Statistical Measure | 12-Month Scale | 24-Month Scale |
|---|---|---|
| Kendall’s tau (τ) | 0.740 | 0.902 |
| Spearman correlation | 0.886 | 0.974 |
| Pearson correlation | 0.971 | 0.975 |
| θ | 5.692 | 18.408 |
© 2020 by the author. Licensee MDPI, Basel, Switzerland. This article is an open access article distributed under the terms and conditions of the Creative Commons Attribution (CC BY) license (http://creativecommons.org/licenses/by/4.0/).
Share and Cite
MDPI and ACS Style
Alsumaiei, A.A. Monitoring Hydrometeorological Droughts Using a Simplified Precipitation Index. Climate 2020, 8, 19. https://0-doi-org.brum.beds.ac.uk/10.3390/cli8020019
AMA Style
Alsumaiei AA. Monitoring Hydrometeorological Droughts Using a Simplified Precipitation Index. Climate. 2020; 8(2):19. https://0-doi-org.brum.beds.ac.uk/10.3390/cli8020019
Chicago/Turabian StyleAlsumaiei, Abdullah A. 2020. "Monitoring Hydrometeorological Droughts Using a Simplified Precipitation Index" Climate 8, no. 2: 19. https://0-doi-org.brum.beds.ac.uk/10.3390/cli8020019
Note that from the first issue of 2016, this journal uses article numbers instead of page numbers. See further details here.