Assessing the Potential Impacts of Climate Changes on Rainfall and Evapotranspiration in the Northwest Region of Bangladesh


Abstract
:1. Introduction
2. Data and Methods
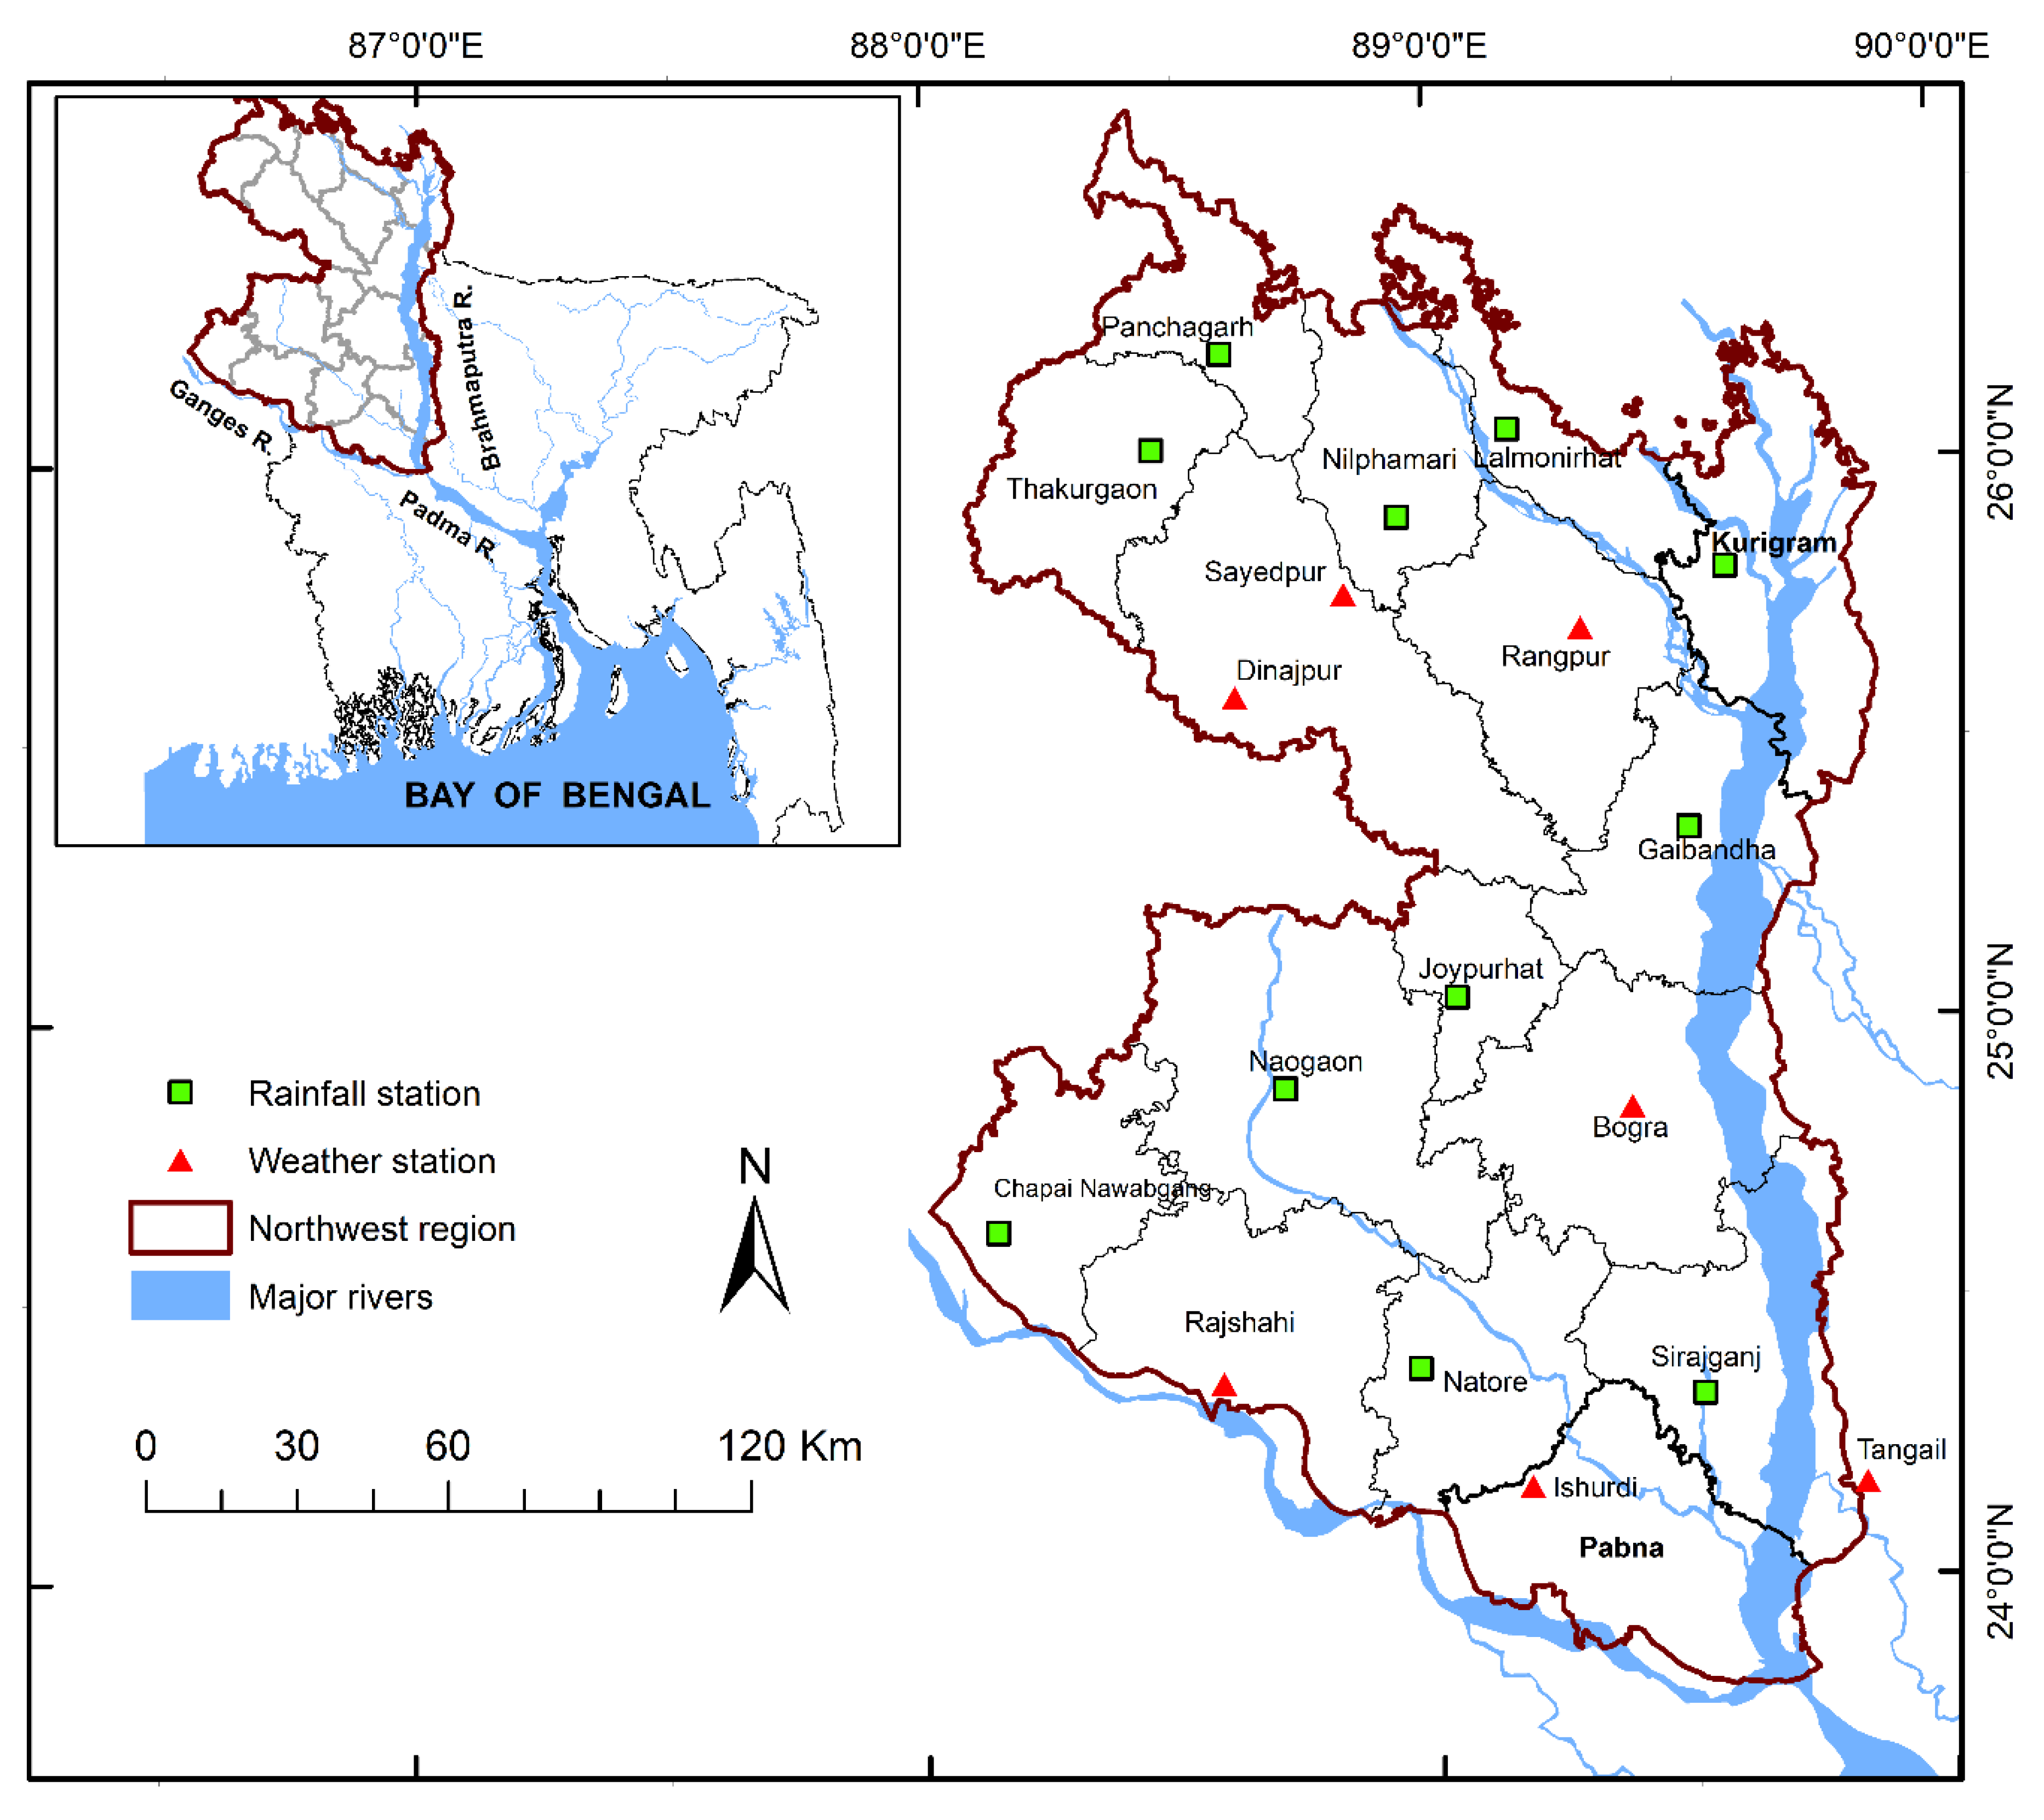
2.1. Study Area
2.2. Data Sources for Present and Future Climate
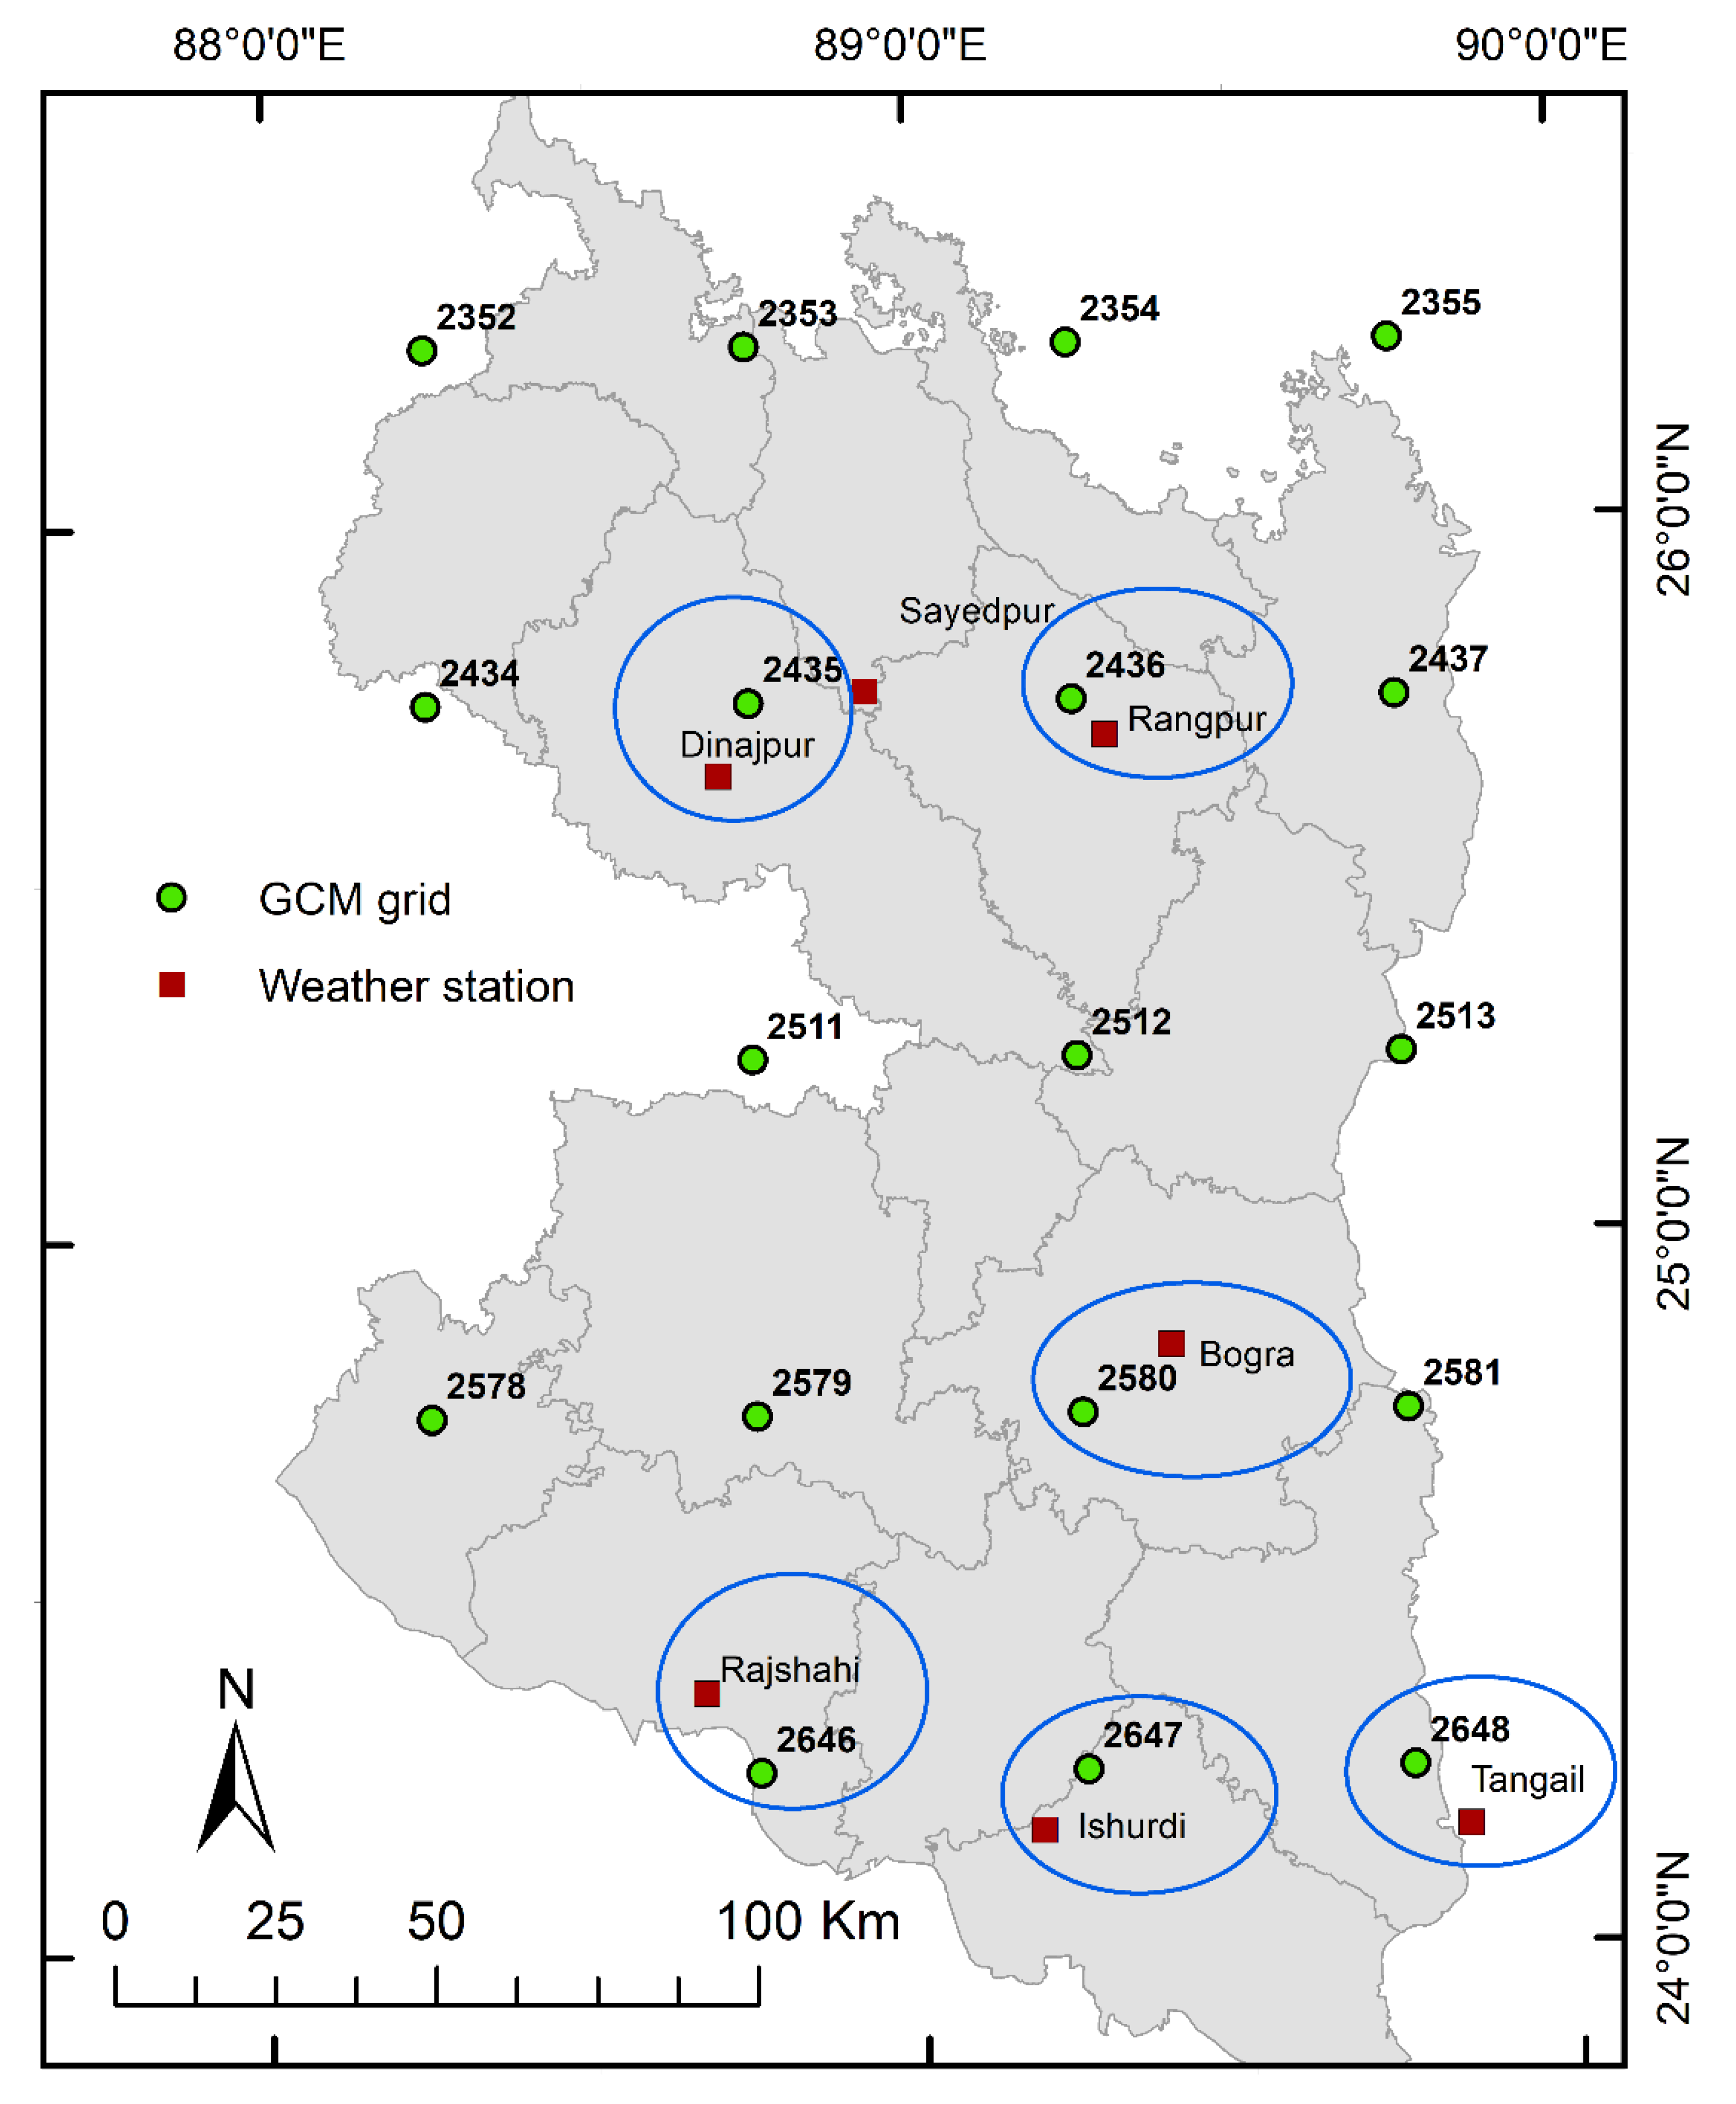
2.3. Downscaling of GCM Results
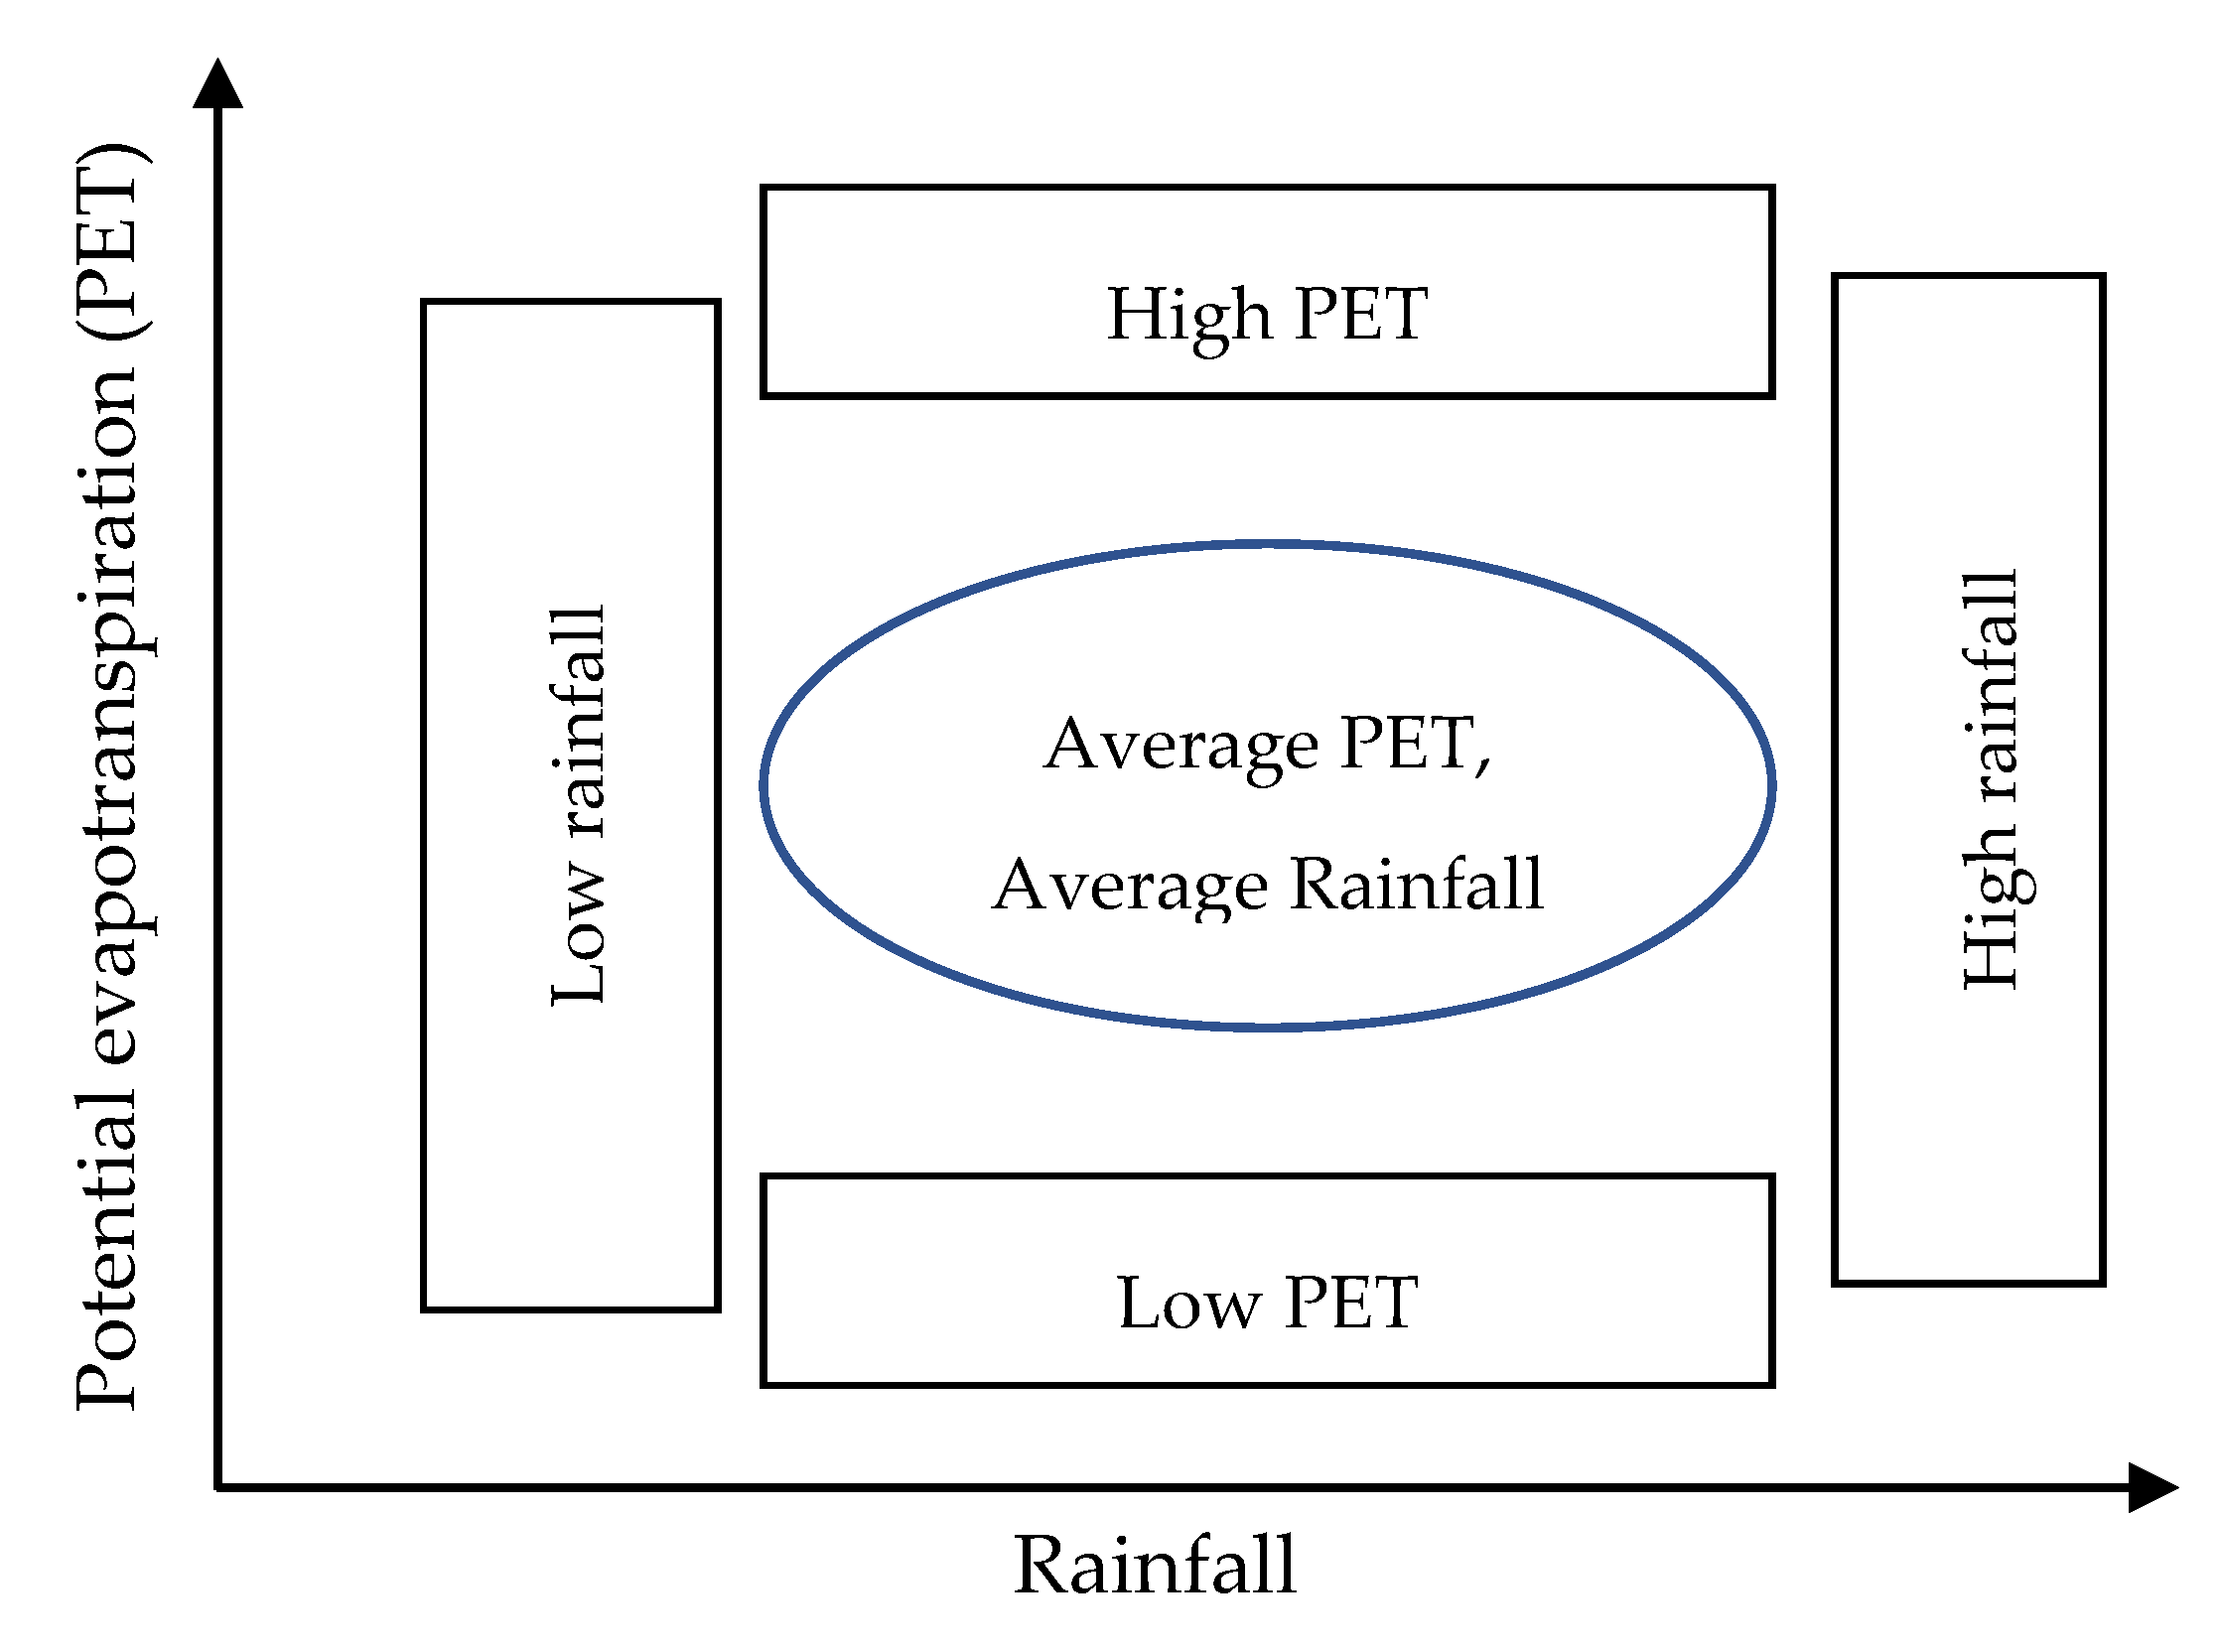
2.4. Selection of Climate Models
3. Results
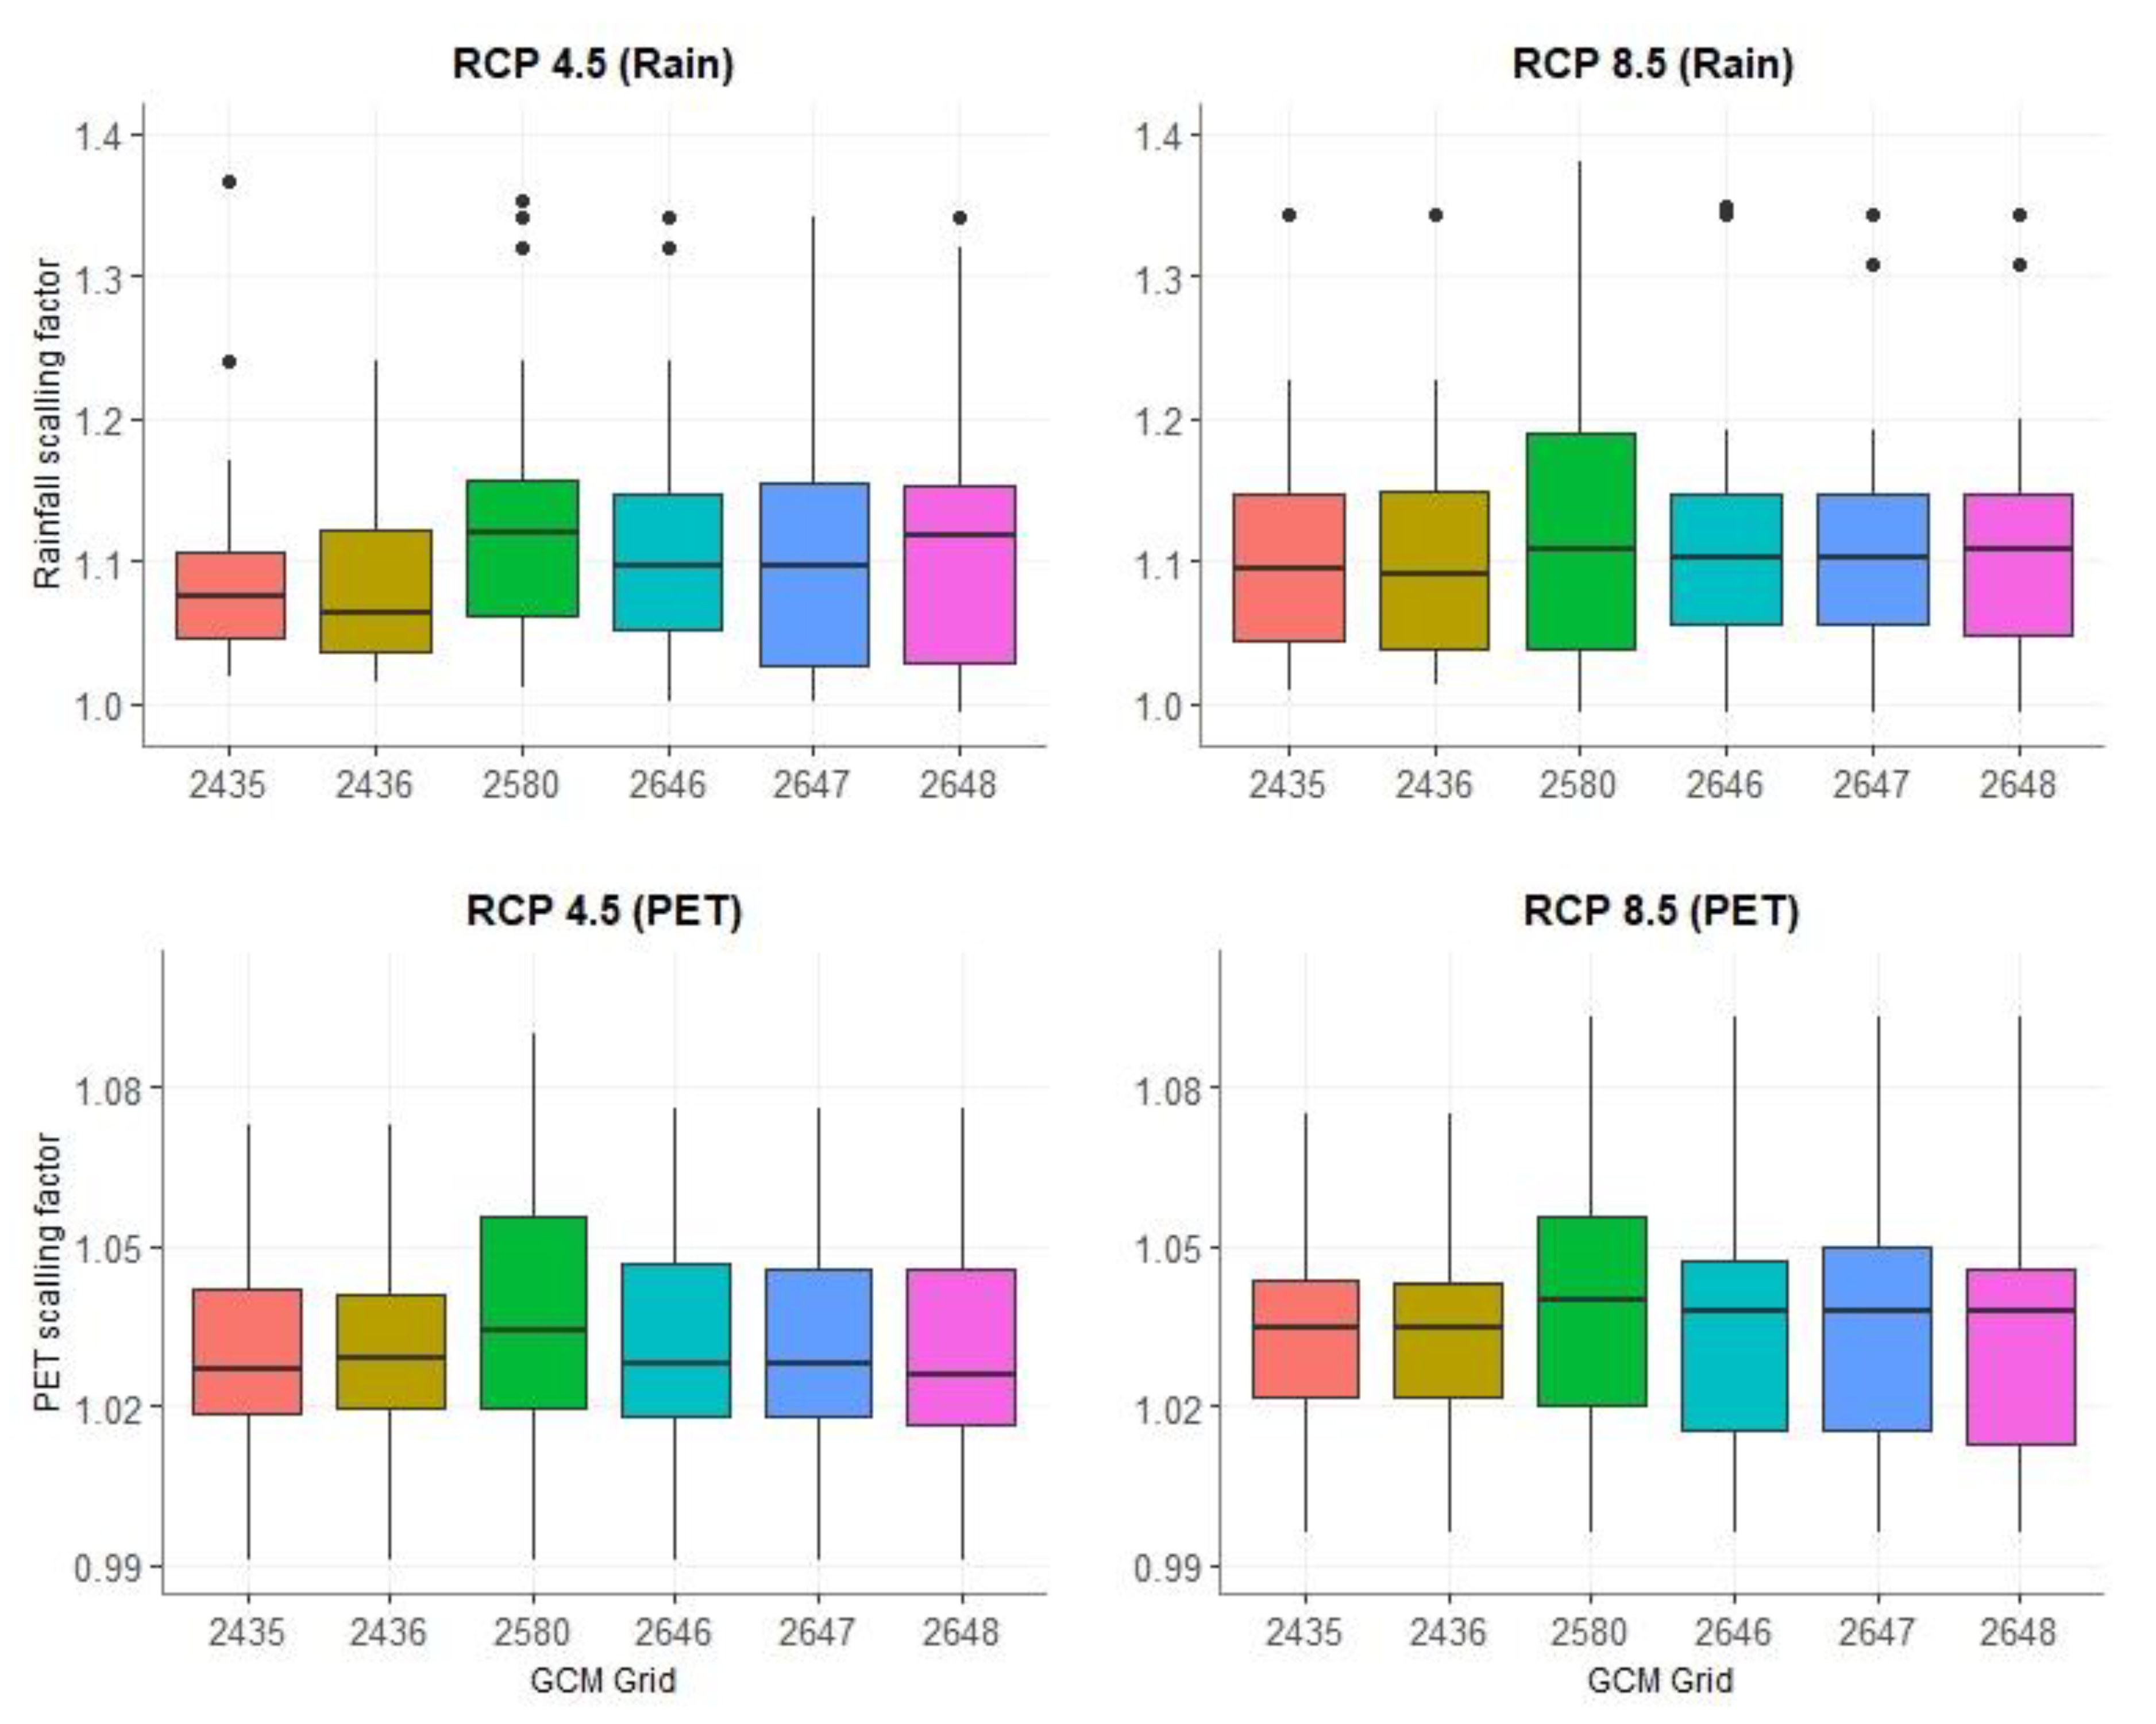
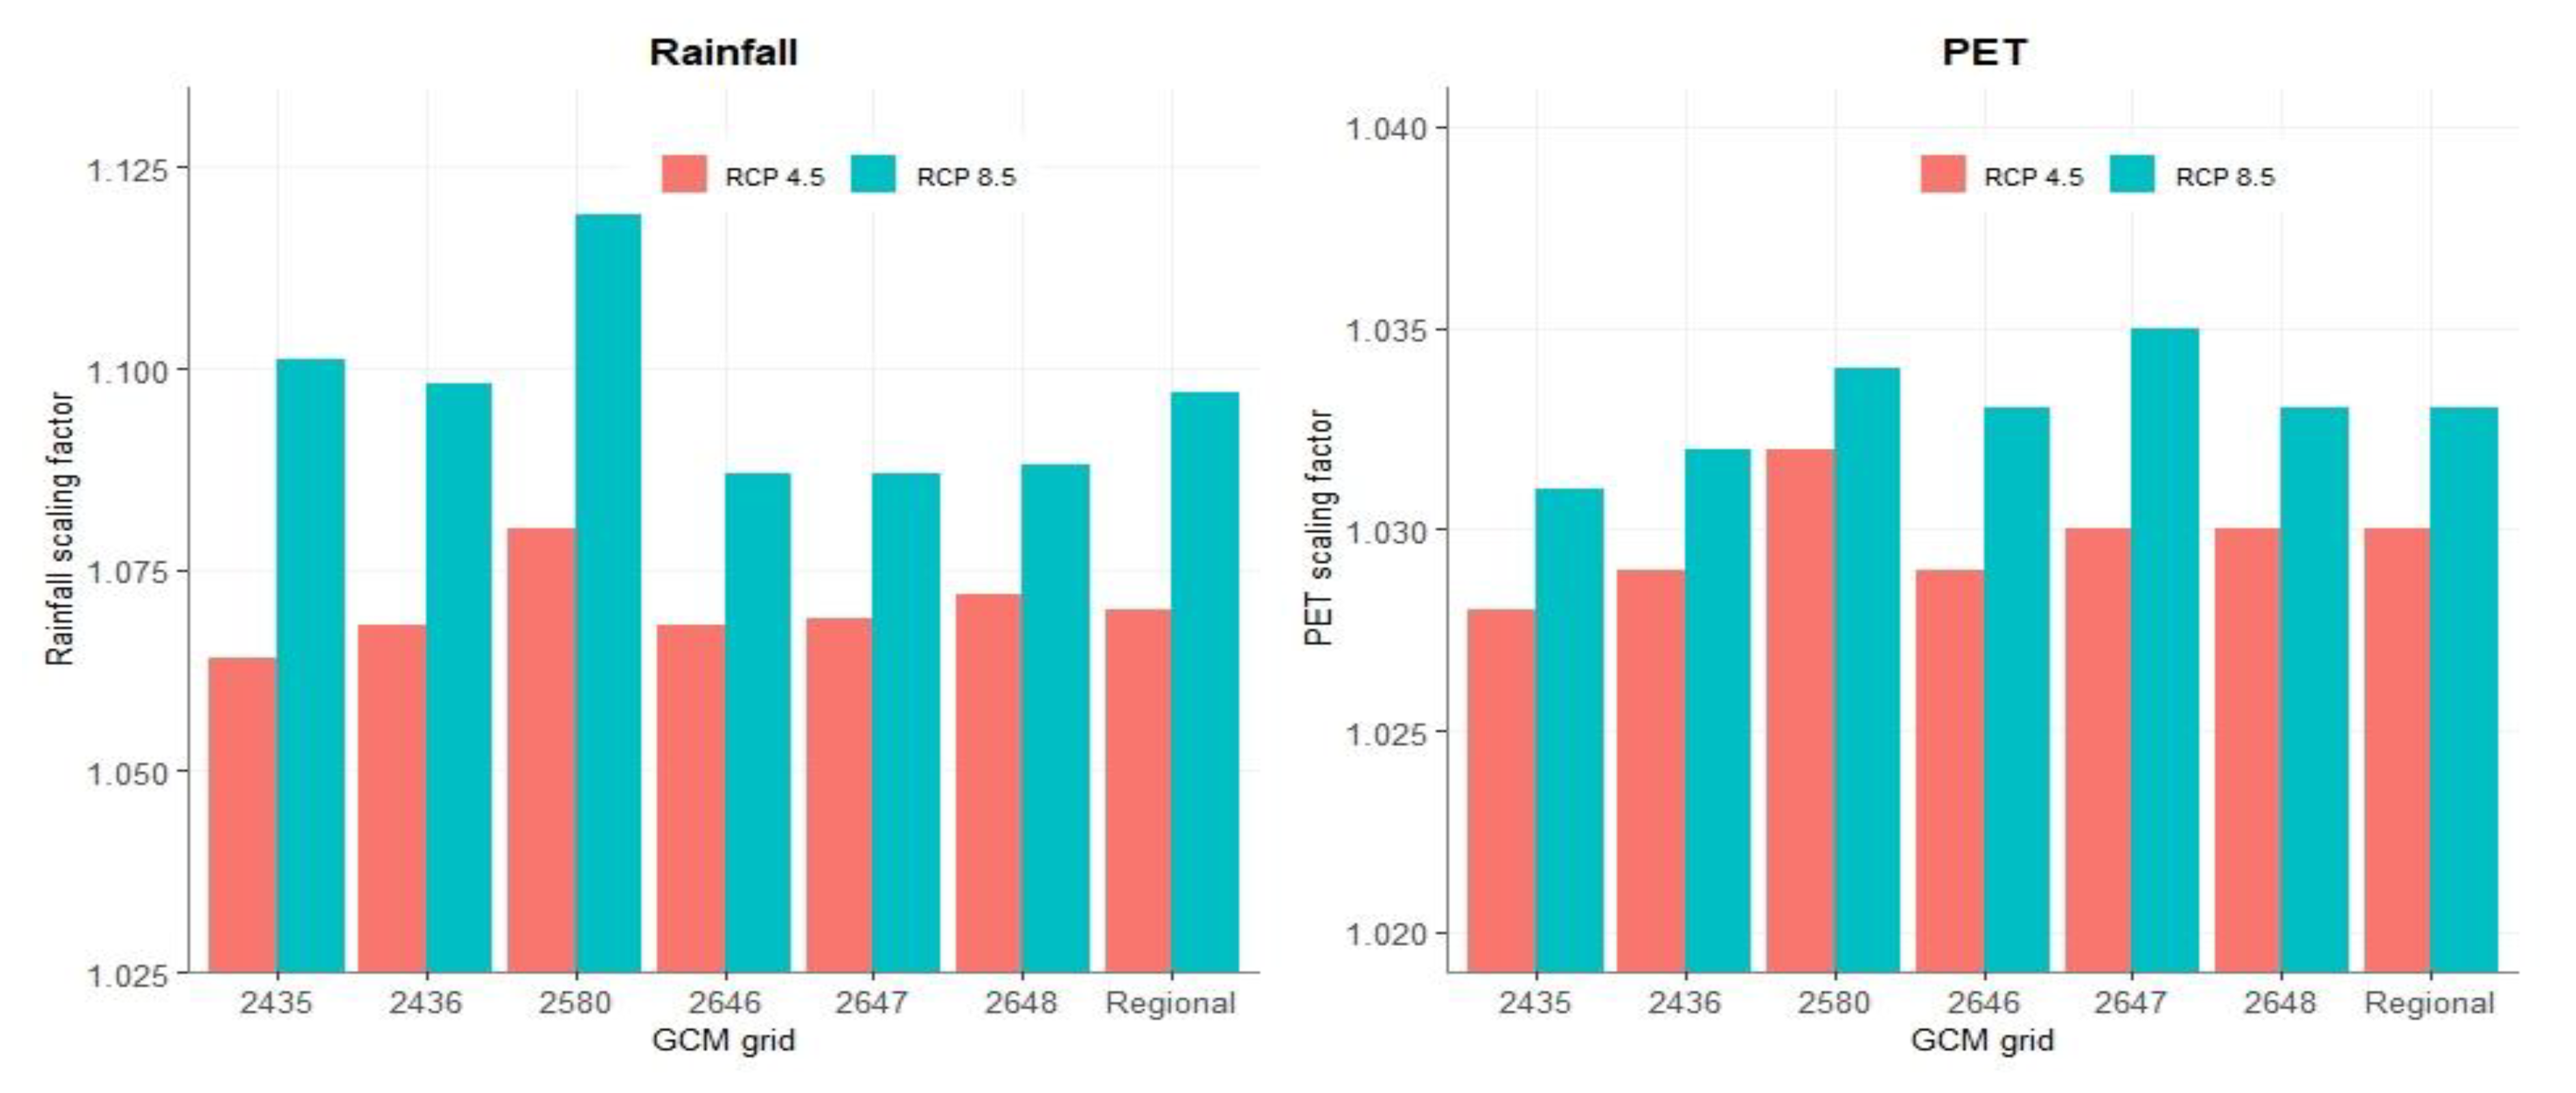
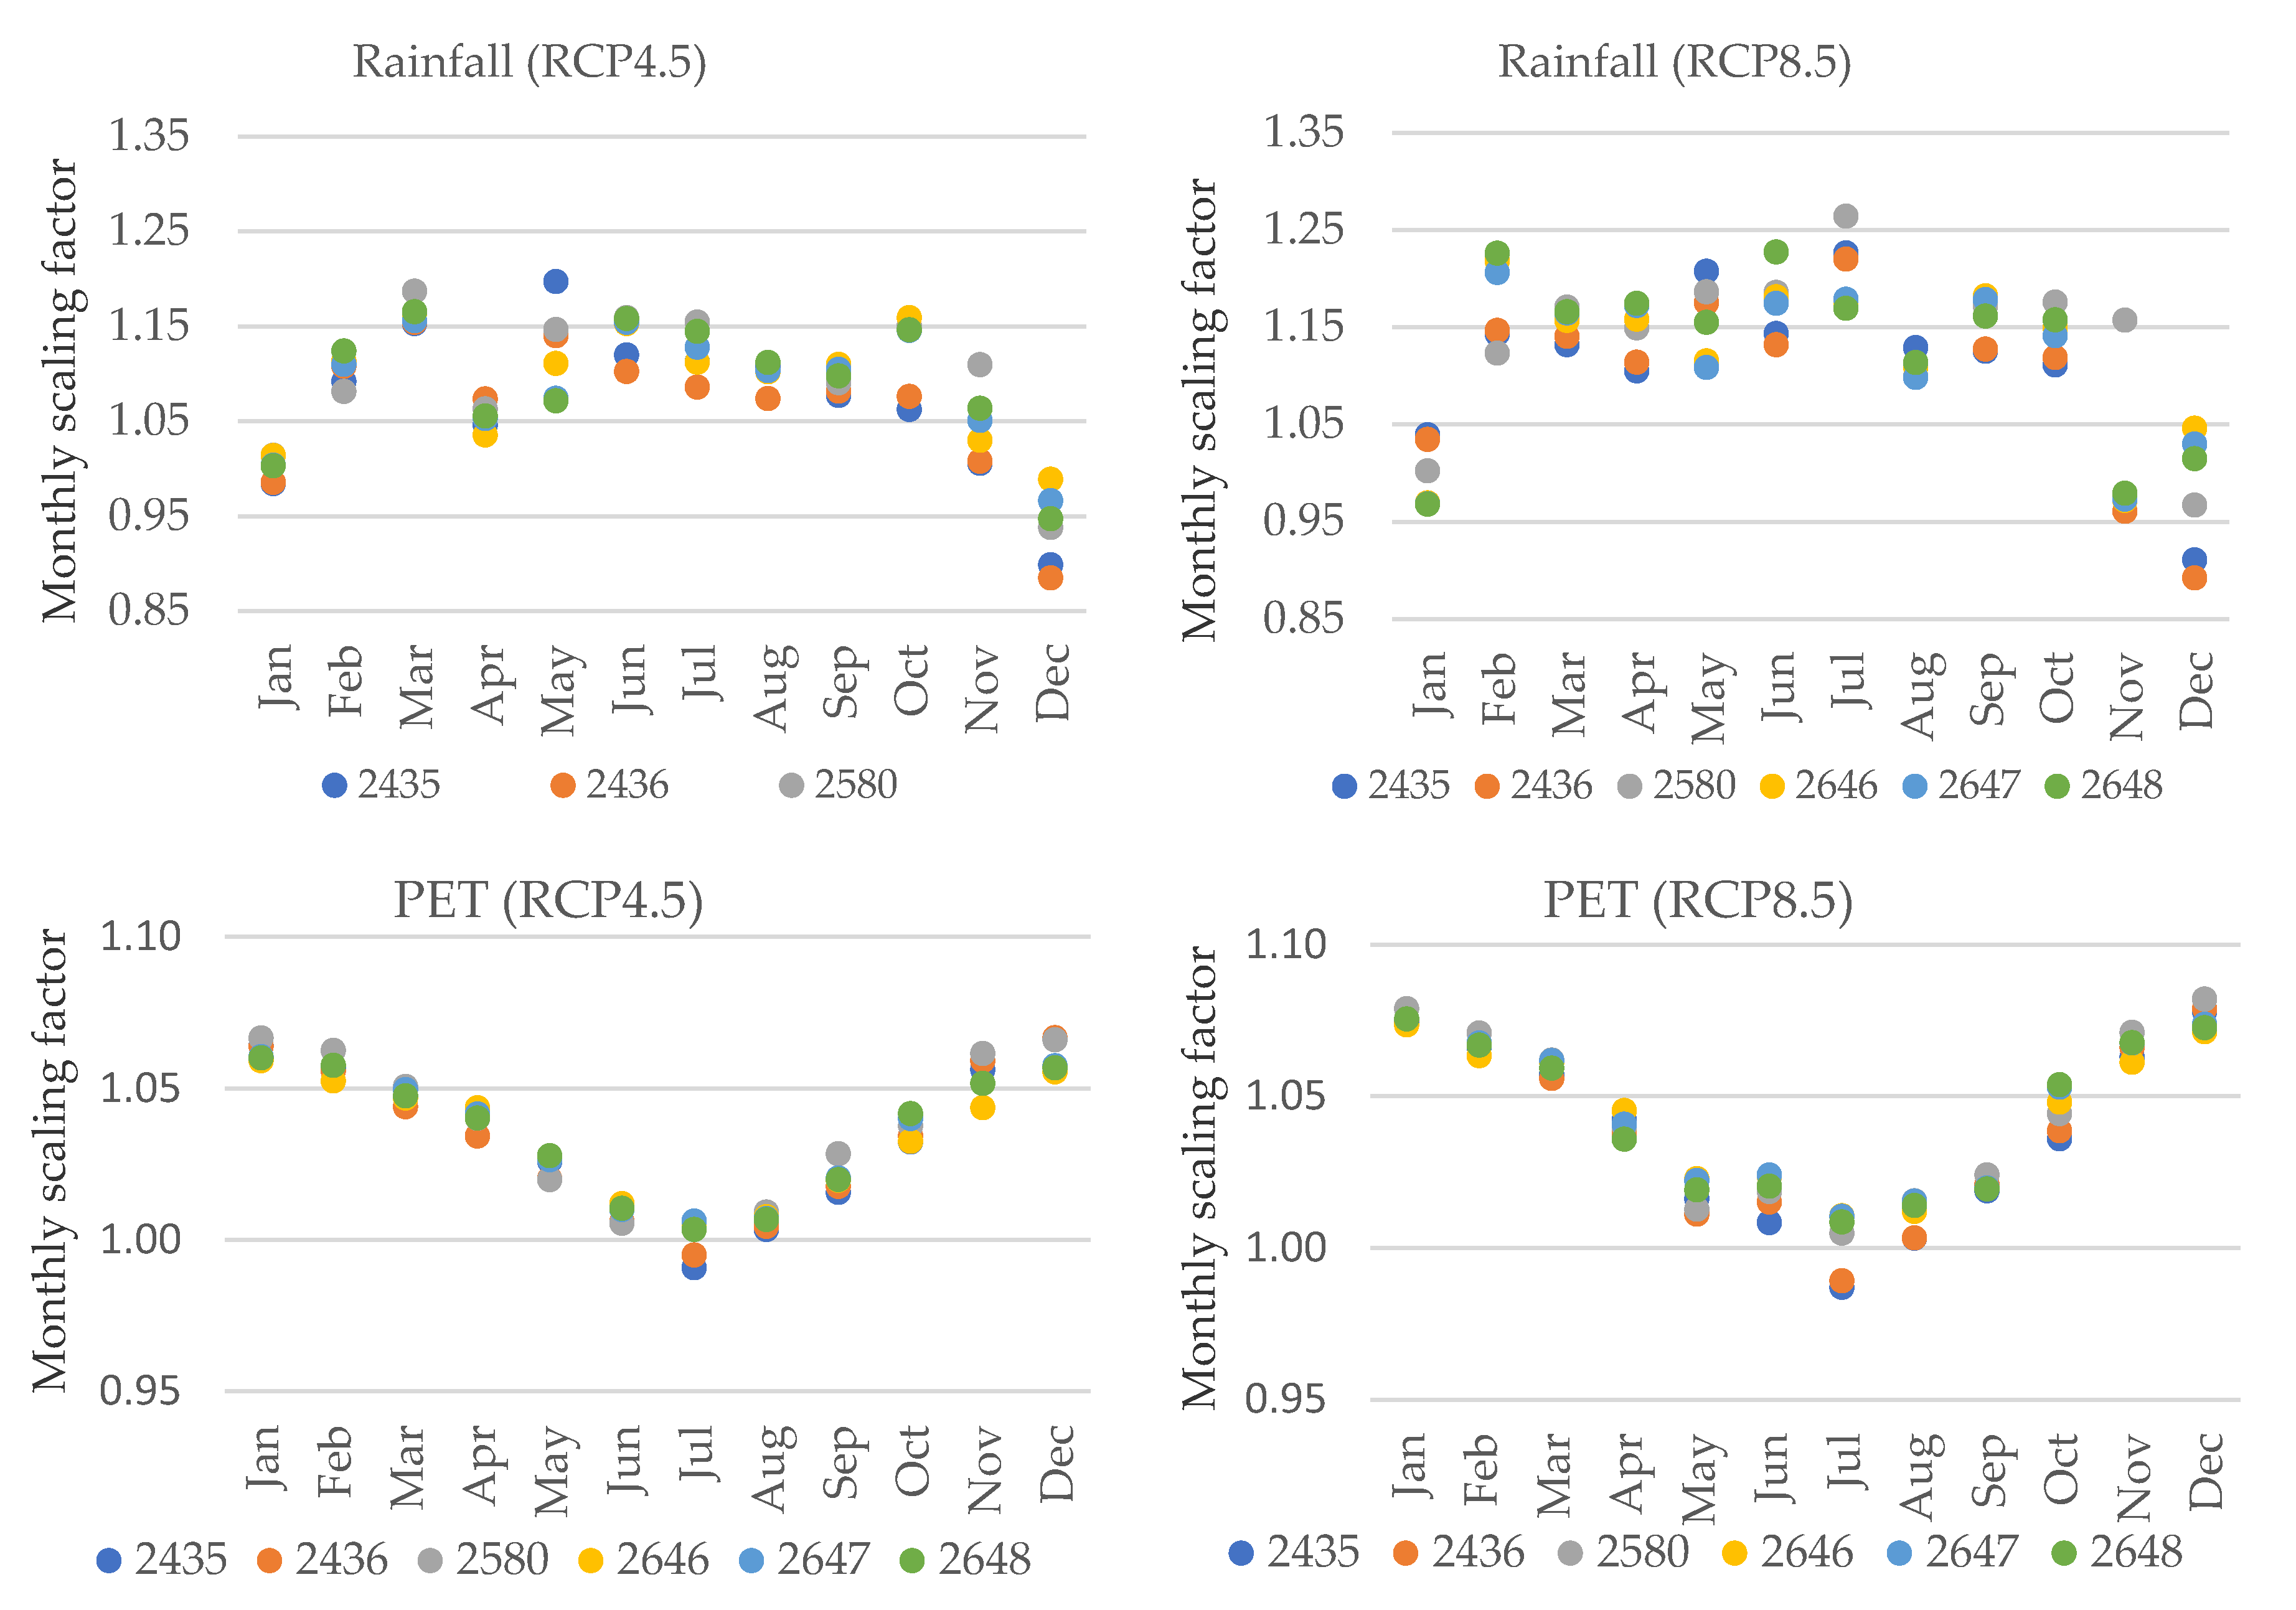
3.1. Variability in GCM Predictions
3.2. Projection of Future Change
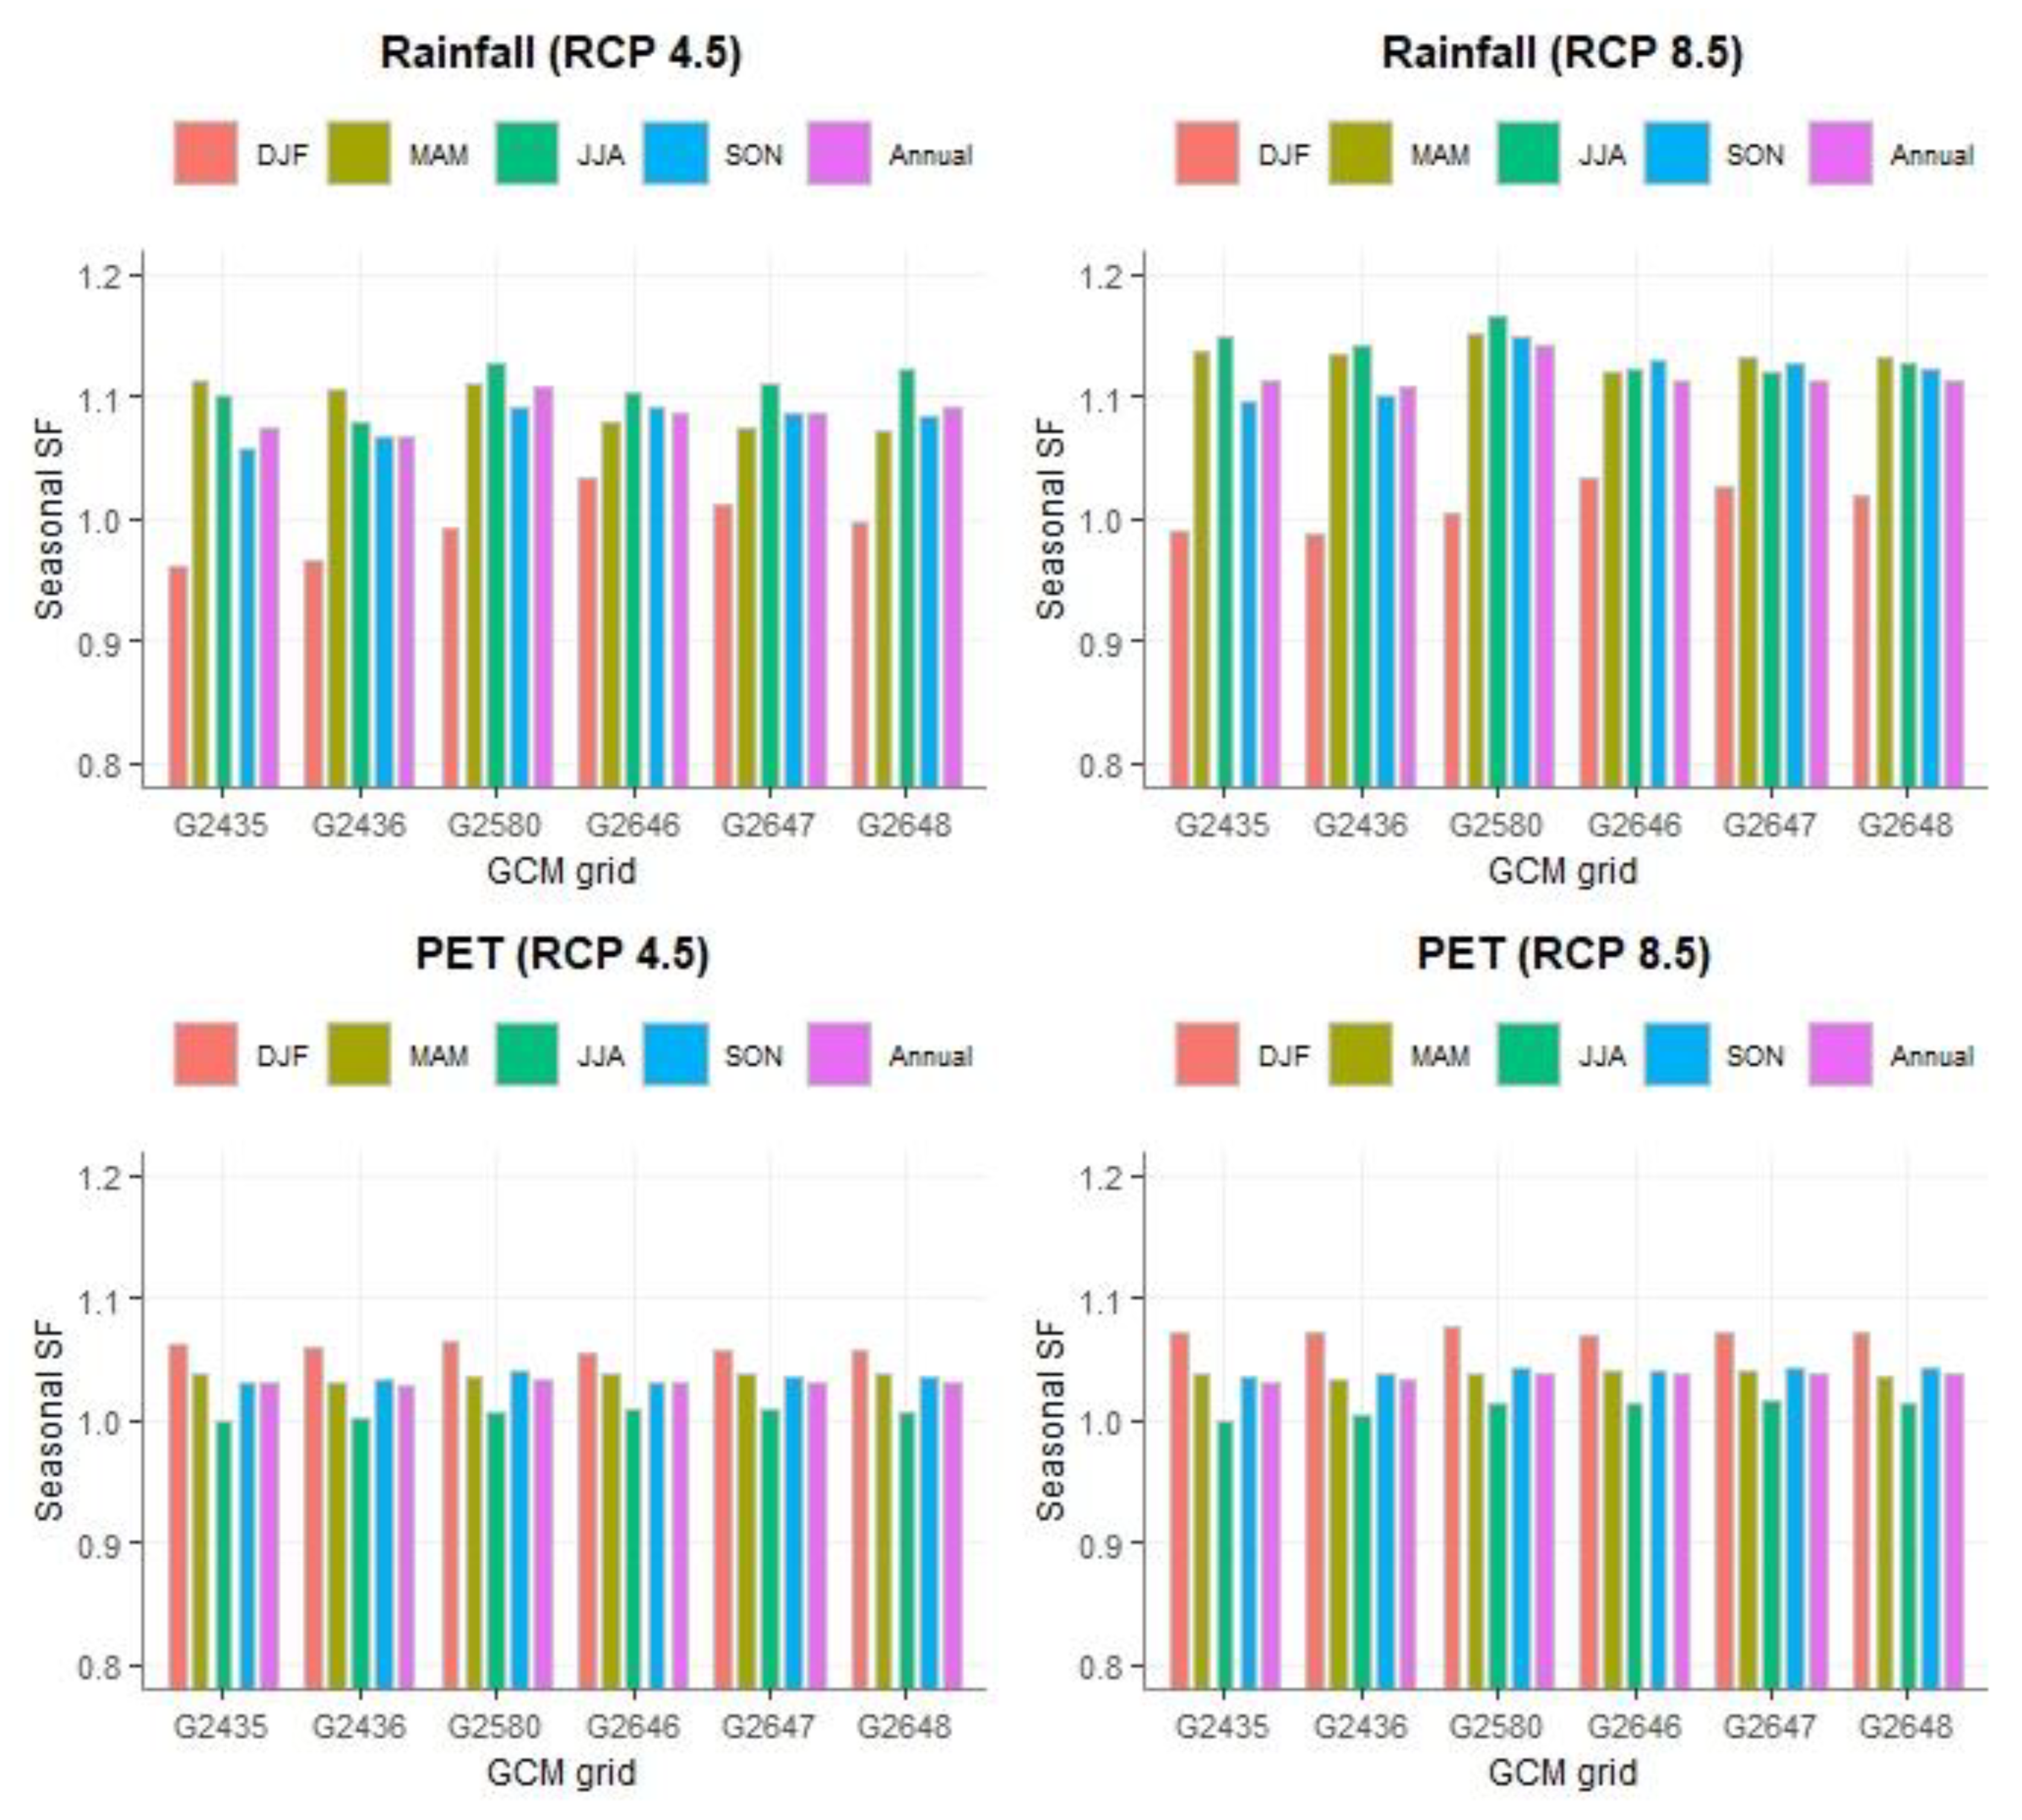
3.2.1. Changes at Annual Scale
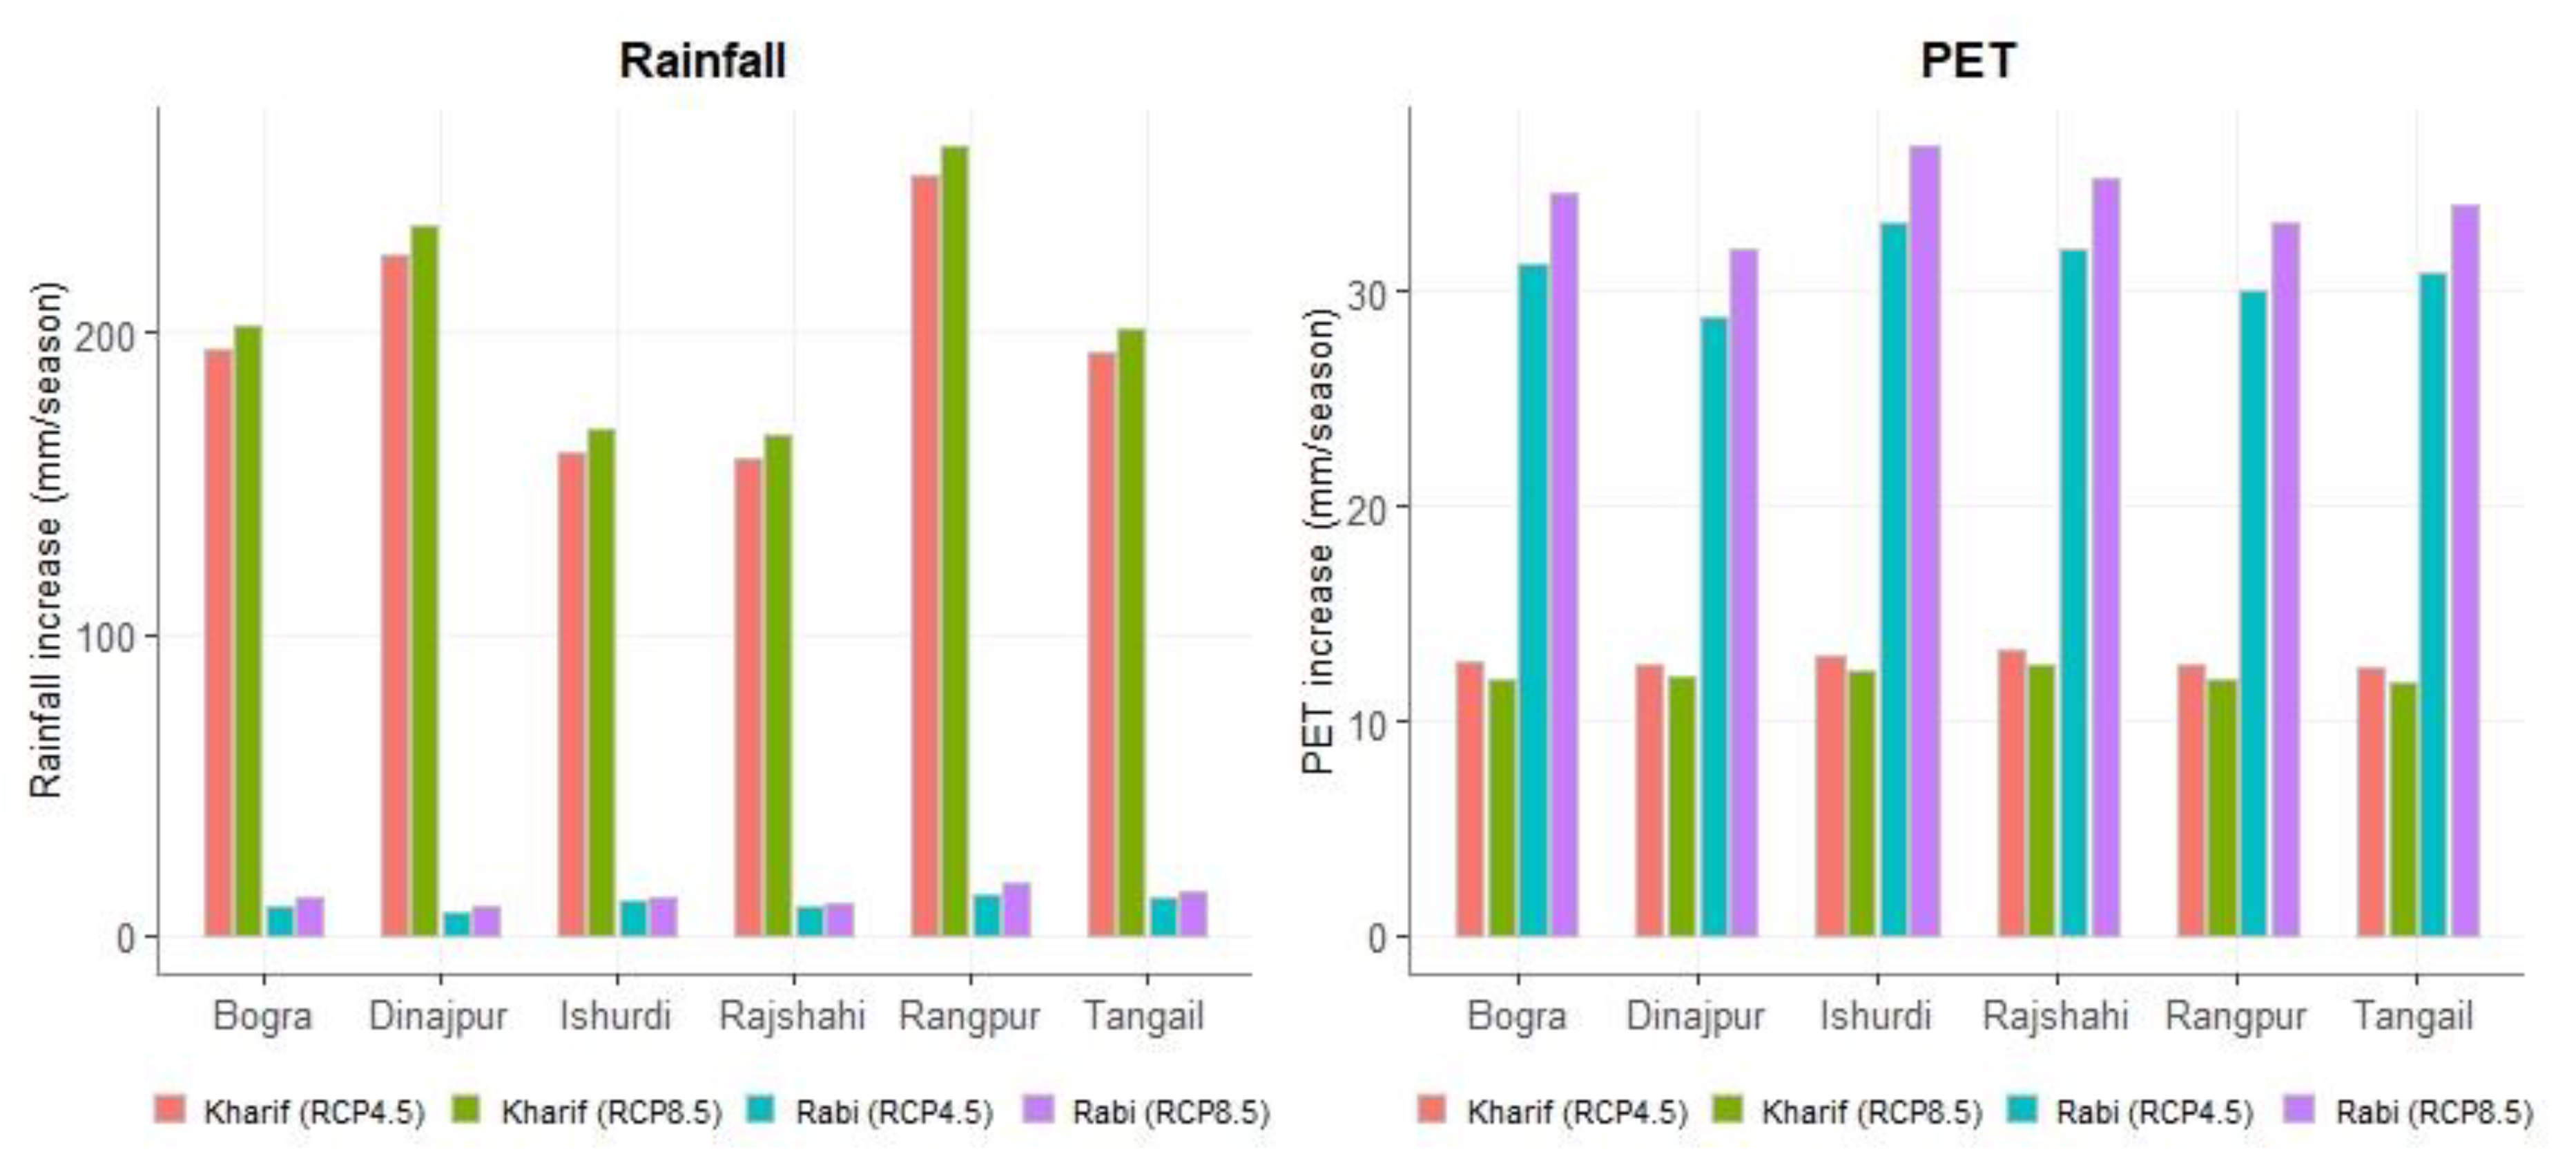
3.2.2. Changes at Crop Growing Seasons
4. Discussion
5. Conclusions
Author Contributions
Funding
Acknowledgments
Conflicts of Interest
References
- IPCC. Climate Change 2014, Synthesis Report, Contribution of Working Groups I, II and III to the Fifth Assessment Report of the Intergovernmental Panel on Climate Change; IPCC: Geneva, Switzerland, 2014; p. 151. [Google Scholar]
- Dastagir, M.R. Modeling recent climate change induced extreme events in Bangladesh: A review. Weather Clim. Extrem. 2015, 7, 49–60. [Google Scholar] [CrossRef] [Green Version]
- Kamruzzaman, M.; Rahman, A.T.M.S.; Ahmed, M.S.; Kabir, M.E.; Mazumder, Q.H.; Rahman, M.S.; Jahan, C.S. Spatio-temporal analysis of climatic variables in the western part of Bangladesh. Environ. Dev. Sustain. 2018, 20, 89–108. [Google Scholar] [CrossRef]
- Khan, M.H.R.; Rahman, A.; Luo, C.; Kumar, S.; Islam, G.M.A.; Hossain, M.A. Detection of changes and trends in climatic variables in Bangladesh during 1988–2017. Heliyon 2019, 5, e01268. [Google Scholar] [CrossRef] [Green Version]
- Mojid, M.A.; Rannu, R.P.; Karim, N.N. Climate change impacts on reference crop evapotranspiration in North-West hydrological region of Bangladesh. Int. J. Climatol. 2015, 35, 4041–4046. [Google Scholar] [CrossRef]
- Bhuyan, M.D.I.; Islam, M.M.; Bhuiyan, M.E.K. A Trend analysis of temperature and rainfall to predict climate change for northwestern region of Bangladesh. Am. J. Clim. Chang. 2018, 7, 115–134. [Google Scholar] [CrossRef] [Green Version]
- Shahid, S. Trends in extreme rainfall events of Bangladesh. Theor. Appl. Climatol. 2011, 104, 489–499. [Google Scholar] [CrossRef]
- Mondal, M.S.; Jalal, M.R.; Khan, M.S.A.; Kumar, U.; Rahman, R.; Huq, H. Hydro-meteorological trends in southwest coastal Bangladesh: Perspectives of climate change and human interventions. Am. J. Clim. Chang. 2013, 2, 62–70. [Google Scholar] [CrossRef]
- Nowreen, S.; Murshed, S.B.; Islam, A.K.M.S.; Bhaskaran, B.; Hasan, M.A. Changes of rainfall extremes around the haor basin areas of Bangladesh using multi-member ensemble RCM. Theor. Appl. Climatol. 2015, 119, 363–377. [Google Scholar] [CrossRef]
- Basher, M.A.; Stiller-Reeve, M.A.; Saiful Islam, A.K.M.; Bremer, S. Assessing climatic trends of extreme rainfall indices over northeast Bangladesh. Theor. Appl. Climatol. 2017, 134, 441–452. [Google Scholar] [CrossRef]
- Dey, N.C.; Saha, R.; Parvez, M.; Bala, S.K.; Islam, A.K.M.S.; Paul, J.K.; Hossain, M. Sustainability of groundwater use for irrigation of dry-season crops in northwest Bangladesh. Groundw. Sustain. Dev. 2017, 4, 66–77. [Google Scholar] [CrossRef]
- Hossain, M.M.; Hasan, M.Z.; Alauddin, M.; Akhter, S. Historical and future rainfall variations in Bangladesh. Int. J. Environ. Ecol. Eng. 2017, 11, 694–699. [Google Scholar]
- Jahan, C.S.; Mazumder, Q.H.; Islam, A.T.M.M.; Adham, M.I. Impact of irrigation in Barind area, NW Bangladesh—An evaluation based on the meteorological parameters and fluctuation trend in groundwater table. J. Geol. Soc. India 2010, 76, 134–142. [Google Scholar] [CrossRef]
- Rahman, M.A.; Yunsheng, L.; Sultana, N. Analysis and prediction of rainfall trends over Bangladesh using Mann–Kendall, Spearman’s rho tests and ARIMA model. Meteorol. Atmos. Phys. 2017, 129, 409–424. [Google Scholar] [CrossRef]
- Gornall, J.; Betts, R.; Burke, E.; Clark, R.; Camp, J.; Willett, K.; Wiltshire, A. Implications of climate change for agricultural productivity in the early twenty-first century. Philos. Trans. R. Soc. B 2010, 365, 2973–2989. [Google Scholar] [CrossRef]
- Rosenzweig, C.; Tubiello, F.N.; Goldberg, R.; Mills, E.; Bloomfield, J. Increased crop damage in the US from excess precipitation under climate change. Glob. Environ. Chang. 2002, 12, 197–202. [Google Scholar] [CrossRef] [Green Version]
- Dahal, V.; Gautam, S.; Bhattarai, R. Analysis of the long-term precipitation trend in illinois and its implications for agricultural production. Water 2018, 10, 433. [Google Scholar] [CrossRef] [Green Version]
- Mainuddin, M.; Kirby, M. National food security in Bangladesh to 2050. Food Secur. 2015, 7, 633–646. [Google Scholar] [CrossRef]
- Rahman, M.S.; Rahman, M.A. Impacts of climate change on crop production in Bangladesh: A review. J. Agric. Crop. 2018, 6–14. [Google Scholar] [CrossRef] [Green Version]
- Kreft, S.; Eckstein, D.; Melchior, I. Global Climate Risk Index 2017: Who Suffers Most from Extreme Weather Events? Germanwatch e.V.: Bonn, Germany, 2016; p. 32. [Google Scholar]
- World Bank. High and Dry: Climate Change, Water, and the Economy; World Bank: Washington, DC, USA, 2016; p. 69. [Google Scholar]
- Immerzeel, W.W.; van Beek, L.P.H.; Bierkens, M.F.P. Climate change will affect the Asian water towers. Science 2010, 328, 1382–1385. [Google Scholar] [CrossRef]
- Devkota, L.P.; Gyawali, D.R. Impacts of climate change on hydrological regime and water resources management of the Koshi River Basin, Nepal. J. Hydrol. Reg. Studies 2015, 4, 502–515. [Google Scholar] [CrossRef] [Green Version]
- Nepal, S.; Shrestha, A.B. Impact of climate change on the hydrological regime of the Indus, Ganges and Brahmaputra river basins: A review of the literature. Int. J. Water Resour. Dev. 2015, 31, 201–218. [Google Scholar] [CrossRef] [Green Version]
- United Nations. World Population Prospects 2019, Volume I: Comprehensive Tables, Department of Economic and Social Affairs; United Nations: New York, NY, USA, 2019. [Google Scholar]
- Peña-Arancibia, J.L.; Mainuddin, M.; Ahmad, M.D.; Hodgson, G.; Ibn Murad, K.F.; Ticehurst, C.; Maniruzzaman, M.; Golam Mahboob, M.; Kirby, J.M. Groundwater use and rapid irrigation expansion in a changing climate: Hydrological drivers in one of the world’s food bowls. J. Hydrol. 2020, 581. [Google Scholar] [CrossRef]
- Sperber, K.R.; Annamalai, H.; Kang, I.S.; Kitoh, A.; Moise, A.; Turner, A.; Wang, B.; Zhou, T. The Asian summer monsoon: An intercomparison of CMIP5 vs. CMIP3 simulations of the late 20th century. Clim. Dyn. 2013, 41, 2711–2744. [Google Scholar] [CrossRef]
- Bhaskaran, B.; Ramachandran, A.; Jones, R.; Moufouma-Okia, W. Regional climate model applications on sub-regional scales over the Indian monsoon region: The role of domain size on downscaling uncertainty. J. Geophys. Res. Atmos. 2012, 117. [Google Scholar] [CrossRef]
- Smid, M.; Costa, A.C. Climate projections and downscaling techniques: A discussion for impact studies in urban systems. Int. J. Urban Sci. 2018, 22, 277–307. [Google Scholar] [CrossRef] [Green Version]
- Zheng, H.; Chiew, F.H.S.; Charles, S.; Podger, G. Future climate and runoff projections across South Asia from CMIP5 global climate models and hydrological modelling. J. Hydrol. Reg. Studies 2018, 18, 92–109. [Google Scholar] [CrossRef]
- Xu, Z.; Han, Y.; Yang, Z. Dynamical downscaling of regional climate: A review of methods and limitations. Sci. China Earth Sci. 2018, 62, 365–375. [Google Scholar] [CrossRef]
- Foley, A.M. Uncertainty in regional climate modelling: A review. Prog. Phys. Geogr. Earth Environ. 2010, 34, 647–670. [Google Scholar] [CrossRef] [Green Version]
- Teng, J.; Vaze, J.; Chiew, F.H.S.; Wang, B.; Perraud, J.-M. Estimating the relative uncertainties sourced from GCMs and hydrological models in modeling climate change impact on runoff. J. Hydrometeorol. 2012, 13, 122–139. [Google Scholar] [CrossRef]
- Chen, J.; Brissette, F.P.; Leconte, R. Uncertainty of downscaling method in quantifying the impact of climate change on hydrology. J. Hydrol. 2011, 401, 190–202. [Google Scholar] [CrossRef]
- Vetter, T.; Reinhardt, J.; Flörke, M. Evaluation of sources of uncertainty in projected hydrological changes under climate change in 12 large-scale river basins. Clim. Chang. 2017, 141, 419–433. [Google Scholar] [CrossRef]
- Chaturvedi, R.K.; Joshi, J.; Jayaraman, M.; Bala, G.; Ravindranath, N.H. Multi-model climate change projections for India under representative concentration pathways. Curr. Sci. 2012, 103, 791–802. [Google Scholar]
- Ogata, T.; Ueda, H.; Inoue, T.; Hayasaki, M.; Yoshida, A.; Watanabe, S.; Kira, M.; Ooshiro, M.; Kumai, A. Projected future changes in the Asian monsoon: A comparison of CMIP3 and CMIP5 model results. J. Meteorol. Soc. Jpn. Ser. II 2014, 92, 207–225. [Google Scholar] [CrossRef] [Green Version]
- Saha, A.; Ghosh, S.; Sahana, A.S.; Rao, E.P. Failure of CMIP5 climate models in simulating post-1950 decreasing trend of Indian monsoon. Geophys. Res. Lett. 2014, 41, 7323–7330. [Google Scholar] [CrossRef]
- Freychet, N.; Hsu, H.-H.; Chou, C.; Wu, C.-H. Asian summer monsoon in CMIP5 projections: A link between the change in extreme precipitation and monsoon dynamics. J. Clim. 2015, 28, 1477–1493. [Google Scholar] [CrossRef]
- Palazzi, E.; von Hardenberg, J.; Terzago, S.; Provenzale, A. Precipitation in the Karakoram-Himalaya: A CMIP5 view. Clim. Dyn. 2014, 45, 21–45. [Google Scholar] [CrossRef]
- Rahman, M.M.; Islam, M.N.; Ahmed, A.U.; Georgi, F. Rainfall and temperature scenarios for Bangladesh for the middle of 21st century using RegCM. J. Earth Syst. Sc. 2012, 121, 287–295. [Google Scholar] [CrossRef] [Green Version]
- Rahman, M.A.; Yunsheng, L.; Sultana, N.; Ongoma, V. Analysis of reference evapotranspiration (ET0) trends under climate change in Bangladesh using observed and CMIP5 data sets. Meteorol. Atmos. Phys. 2019, 131, 639–655. [Google Scholar] [CrossRef]
- Hasan, M.A.; Islam, A.K.M.S.; Bokhtiar, S.M. Future change of the metrological drought over Bangladesh using high-resolution climate scenarios. In Proceedings of the International Conference on Climate Change Impact and Adaptation, Gazipur, Bangladesh, 14–16 November 2013. [Google Scholar]
- Caesar, J.; Janes, T.; Lindsay, A.; Bhaskaran, B. Temperature and precipitation projections over Bangladesh and the upstream Ganges, Brahmaputra and Meghna systems. Environ. Sci. Process. Impacts 2015, 17, 1047–1056. [Google Scholar] [CrossRef]
- Fahad, M.G.R.; Saiful Islam, A.K.M.; Nazari, R.; Alfi Hasan, M.; Tarekul Islam, G.M.; Bala, S.K. Regional changes of precipitation and temperature over Bangladesh using bias-corrected multi-model ensemble projections considering high-emission pathways. Int. J. Climatol. 2018, 38, 1634–1648. [Google Scholar] [CrossRef]
- Hasan, M.A.; Islam, A.K.M.S.; Akanda, A.S. Climate projections and extremes in dynamically downscaled CMIP5 model outputs over the Bengal delta: A quartile based bias-correction approach with new gridded data. Clim. Dyn. 2018, 51, 2169–2190. [Google Scholar] [CrossRef]
- Kamruzzaman; Jang; Cho; Hwang. Future changes in precipitation and drought characteristics over Bangladesh under CMIP5 climatological projections. Water 2019, 11, 2219. [Google Scholar] [CrossRef] [Green Version]
- BBS. Statistical Year Book Bangladesh 2018; Bangladesh Bureau of Statistics: Dhaka, Bangladesh, May 2019; p. 599.
- Shahid, S. Rainfall variability and the trends of wet and dry periods in Bangladesh. Int. J. Climatol. 2010, 30, 2299–2313. [Google Scholar] [CrossRef]
- Shahid, S.; Harun, S.B.; Katimon, A. Changes in diurnal temperature range in Bangladesh during the time period 1961–2008. Atmos. Res. 2012, 118, 260–270. [Google Scholar] [CrossRef]
- Van Vuuren, D.P.; Edmonds, J.; Kainuma, M. The representative concentration pathways: An overview. Clim. Chang. 2011, 109, 5–31. [Google Scholar] [CrossRef]
- Kumar, P.; Wiltshire, A.; Mathison, C.; Asharaf, S.; Ahrens, B.; Lucas-Picher, P.; Christensen, J.H.; Gobiet, A.; Saeed, F.; Hagemann, S.; et al. Downscaled climate change projections with uncertainty assessment over India using a high resolution multi-model approach. Sci. Total Environ. 2013, 468–469, S18–S30. [Google Scholar] [CrossRef]
- Chiew, F.H.S.; Kirono, D.G.C.; Kent, D.M.; Frost, A.J.; Charles, S.P.; Timbal, B.; Nguyen, K.C.; Fu, G. Comparison of runoff modelled using rainfall from different downscaling methods for historical and future climates. J. Hydrol. 2010, 387, 10–23. [Google Scholar] [CrossRef]
- Frost, A.J.; Charles, S.P.; Timbal, B.; Chiew, F.H.S.; Mehro-tra, R.; Nguyen, K.C.; Chandler, R.E.; McGregor, J.L.; Fu, G.; Kirono, D.G.C. A comparison of multi-site daily rainfall downscaling techniques under Australian conditions. J. Hydrol. 2011, 408, 1–18. [Google Scholar] [CrossRef]
- Su, F.; Duan, X.; Chen, D.; Hao, Z.; Cuo, L. Evaluation of the global climate models in the CMIP5 over the Tibetan Plateau. J. Clim. 2013, 26, 3187–3208. [Google Scholar] [CrossRef] [Green Version]


| Emission Scenario | Temperature Increase (°C) by 2046–2065 | Temperature Increase (°C) by 2081–2100 | ||
|---|---|---|---|---|
| Mean | Likely Range | Mean | Likely Range | |
| RCP2.6 | 1.0 | 0.4 to 1.6 | 1.0 | 0.3 to 1.7 |
| RCP4.5 | 1.4 | 0.9 to 2.0 | 1.8 | 1.1 to 2.6 |
| RCP6.0 | 1.3 | 0.8 to 1.8 | 2.2 | 1.4 to 3.1 |
| RCP8.5 | 2.0 | 1.4 to 2.6 | 3.7 | 2.6 to 4.8 |
| CMIP5 Model ID | Institution and Country of Origin | Atmospheric Horizontal Resolution (°lat × °long) |
|---|---|---|
| Access-1.0 | CSIRO-BOM, Australia | 1.9 × 1.2 |
| Access-1.3 | CSIRO-BOM, Australia | 1.9 × 1.2 |
| BCC-CSM1-1 | Beijing Climate Center, China | 2.8 × 2.8 |
| BCC-CSM1-M | Beijing Climate Center, China | 1.1 × 1.1 |
| CanESM2 | Canadian Centre for Climate Modelling and Analysis | 2.8 × 2.8 |
| CCSM4 | National Center for Atmospheric Research, USA | 1.2 × 0.9 |
| CESM1-BGC | National Center for Atmospheric Research, USA | 1.2 × 0.9 |
| CESM1-CAM5 | National Center for Atmospheric Research, USA | 1.2 × 0.9 |
| CNRM CM5 | National Centre for Meteorological Research, France | 1.4 × 1.4 |
| CSIRO MK3-6 | Commonwealth Scientific and Industrial Research Organisation, Australia | 1.9 × 1.9 |
| GFDL-CM3 | Geophysical Fluid Dynamics Laboratory, USA | 2.5 × 2.0 |
| GFDL-ESM2G | Geophysical Fluid Dynamics Laboratory, USA | 2.5 × 2.0 |
| GFDL-ESM2M | Geophysical Fluid Dynamics Laboratory, USA | 2.5 × 2.0 |
| GISS-E2-H | NASA/Goddard Institute for Space Studies, USA | 2.5 × 2.0 |
| GISS-E2-H-CC | NASA/Goddard Institute for Space Studies, USA | 1.0 × 1.0 |
| GISS-E2-R | NASA/Goddard Institute for Space Studies, USA | 2.5 × 2.0 |
| GISS-E2-R-CC | NASA/Goddard Institute for Space Studies, USA | 1.0 × 1.0 |
| HadGEM2-AO | National Institute of Meteorological Research and Korea Meteorological Administration (NIMR-KMA), Korea | 1.9 × 1.2 |
| HadGEM2-CC | Met Office Hadley Centre, UK | 1.9 × 1.2 |
| HadGEM2-ES | Met Office Hadley Centre, UK | 1.9 × 1.2 |
| INMCM4 | Institute of Numerical Mathematics, Russia | 2.0 × 1.5 |
| IPSL-CM5A-LR | Institute Pierre Simon Laplace, France | 3.7 × 1.9 |
| IPSL-CM5A-MR | Institute Pierre Simon Laplace, France | 2.5 × 1.3 |
| MIROC5 | Japan Agency for Marine-Earth Science and Technology, Japan | 1.4 × 1.4 |
| MIROC-ESM | JAMSTEC, Japan | 2.8 × 2.8 |
| MIROC-ESM-CHEM | JAMSTEC, Japan | 2.8 × 2.8 |
| MRI-CGCM3 | Meteorological Research Institute, Japan | 1.1 × 1.1 |
| NorESM1-M | Norwegian Climate Centre, Norway | 2.5 × 1.9 |
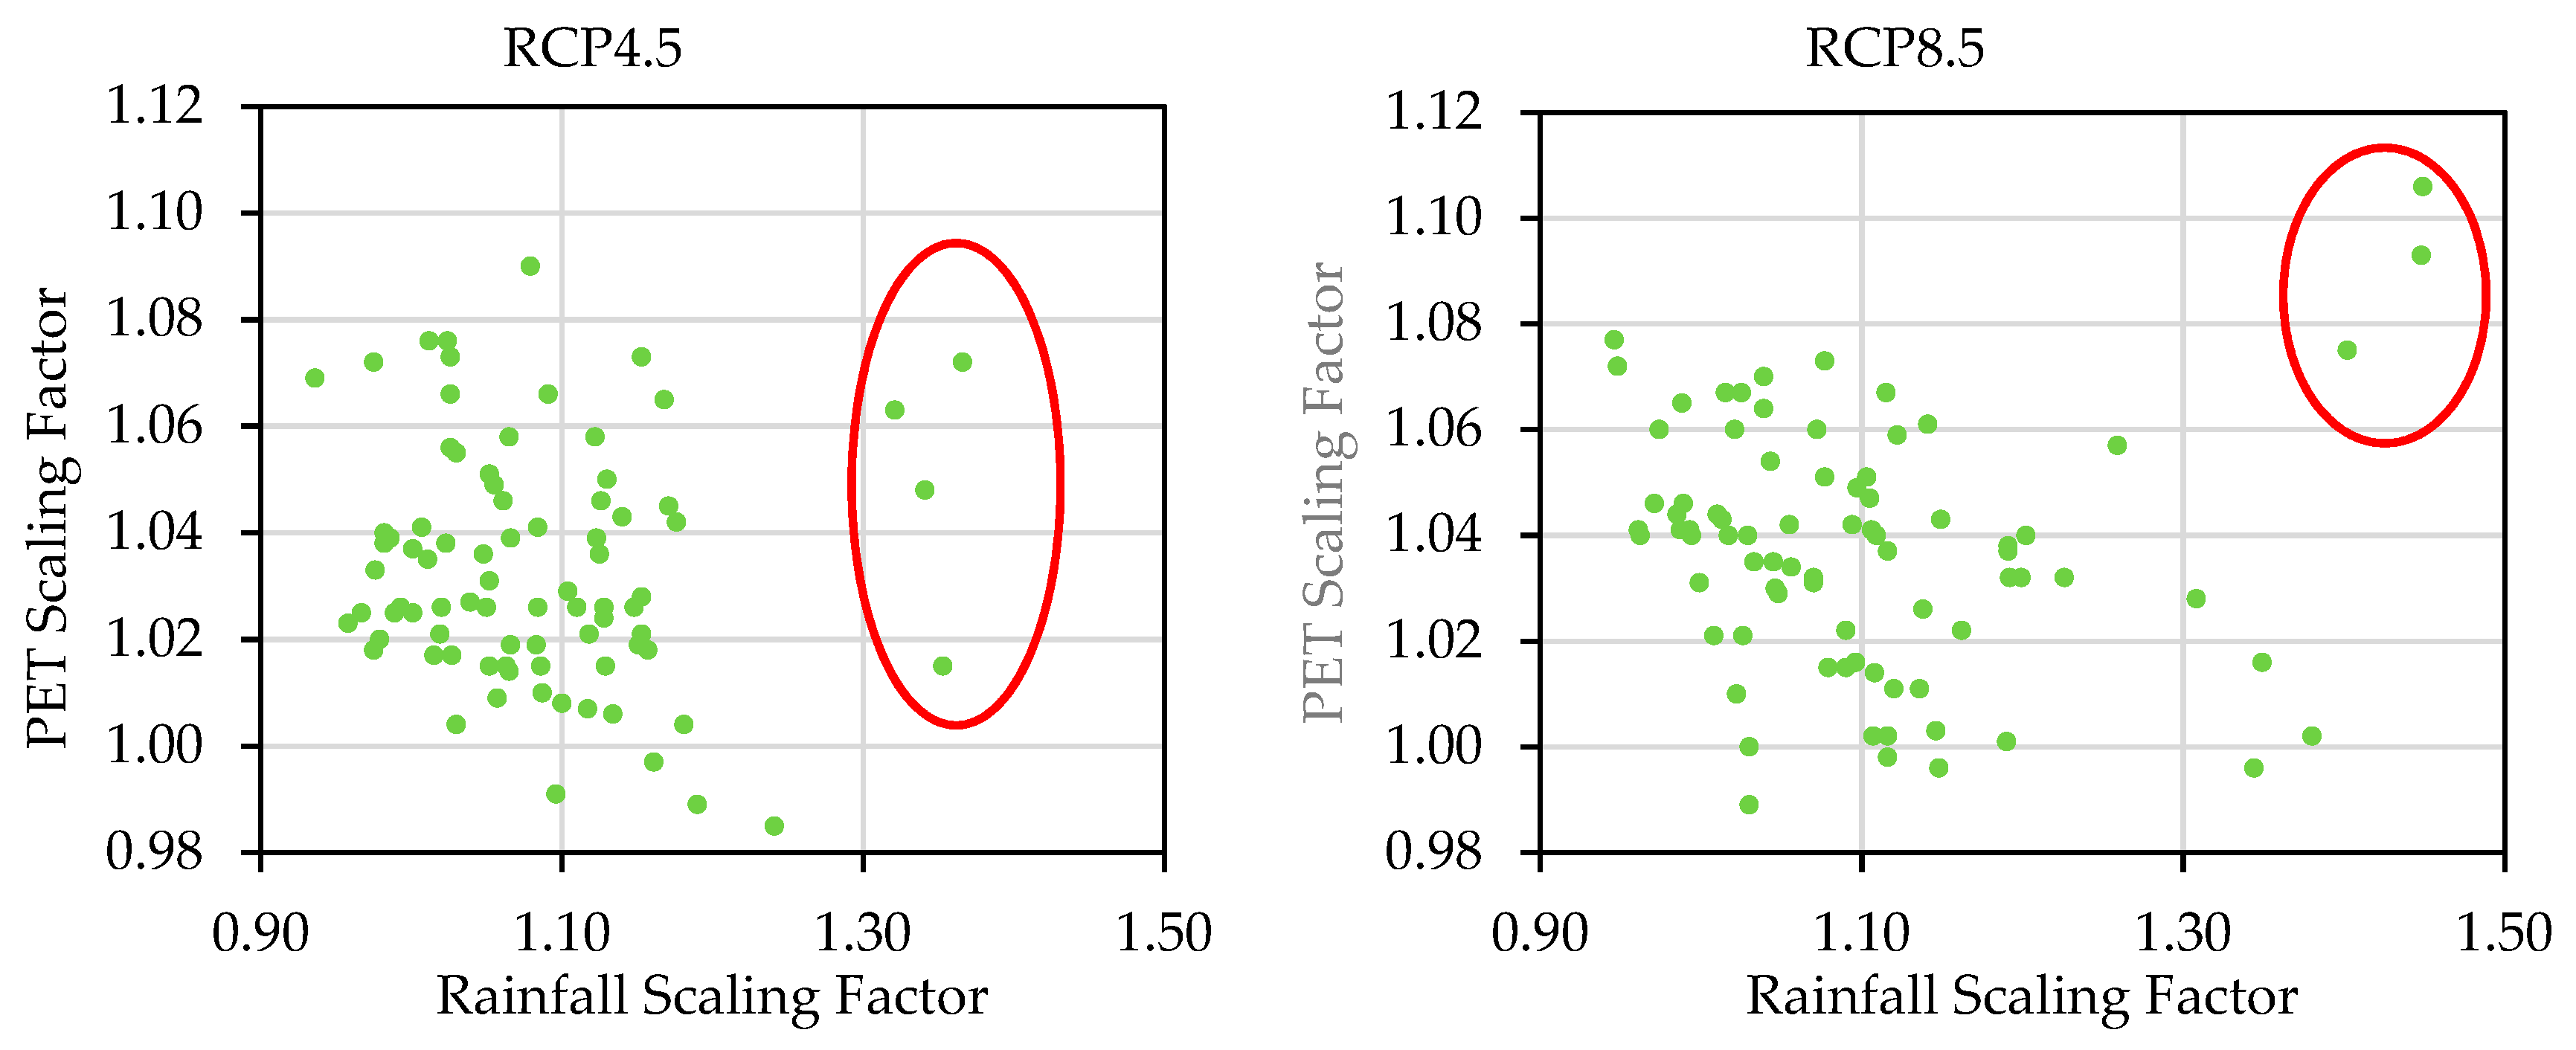
| Climate Index | RCP 4.5 | RCP 8.5 | ||||||
|---|---|---|---|---|---|---|---|---|
| All Data | Excluding Outlier | All Data | Excluding Outlier | |||||
| Rainfall | PET | Rainfall | PET | Rainfall | PET | Rainfall | PET | |
| Minimum | 0.936 | 0.985 | 0.936 | 0.985 | 0.946 | 0.969 | 0.946 | 0.969 |
| 25th percentile | 1.019 | 1.017 | 1.014 | 1.015 | 1.027 | 1.015 | 1.025 | 1.015 |
| Mean | 1.086 | 1.031 | 1.070 | 1.030 | 1.117 | 1.036 | 1.097 | 1.033 |
| Median | 1.081 | 1.027 | 1.065 | 1.026 | 1.097 | 1.039 | 1.092 | 1.037 |
| 75th Percentile | 1.133 | 1.045 | 1.125 | 1.042 | 1.183 | 1.049 | 1.148 | 1.044 |
| Maximum | 1.366 | 1.090 | 1.241 | 1.090 | 1.449 | 1.106 | 1.380 | 1.077 |
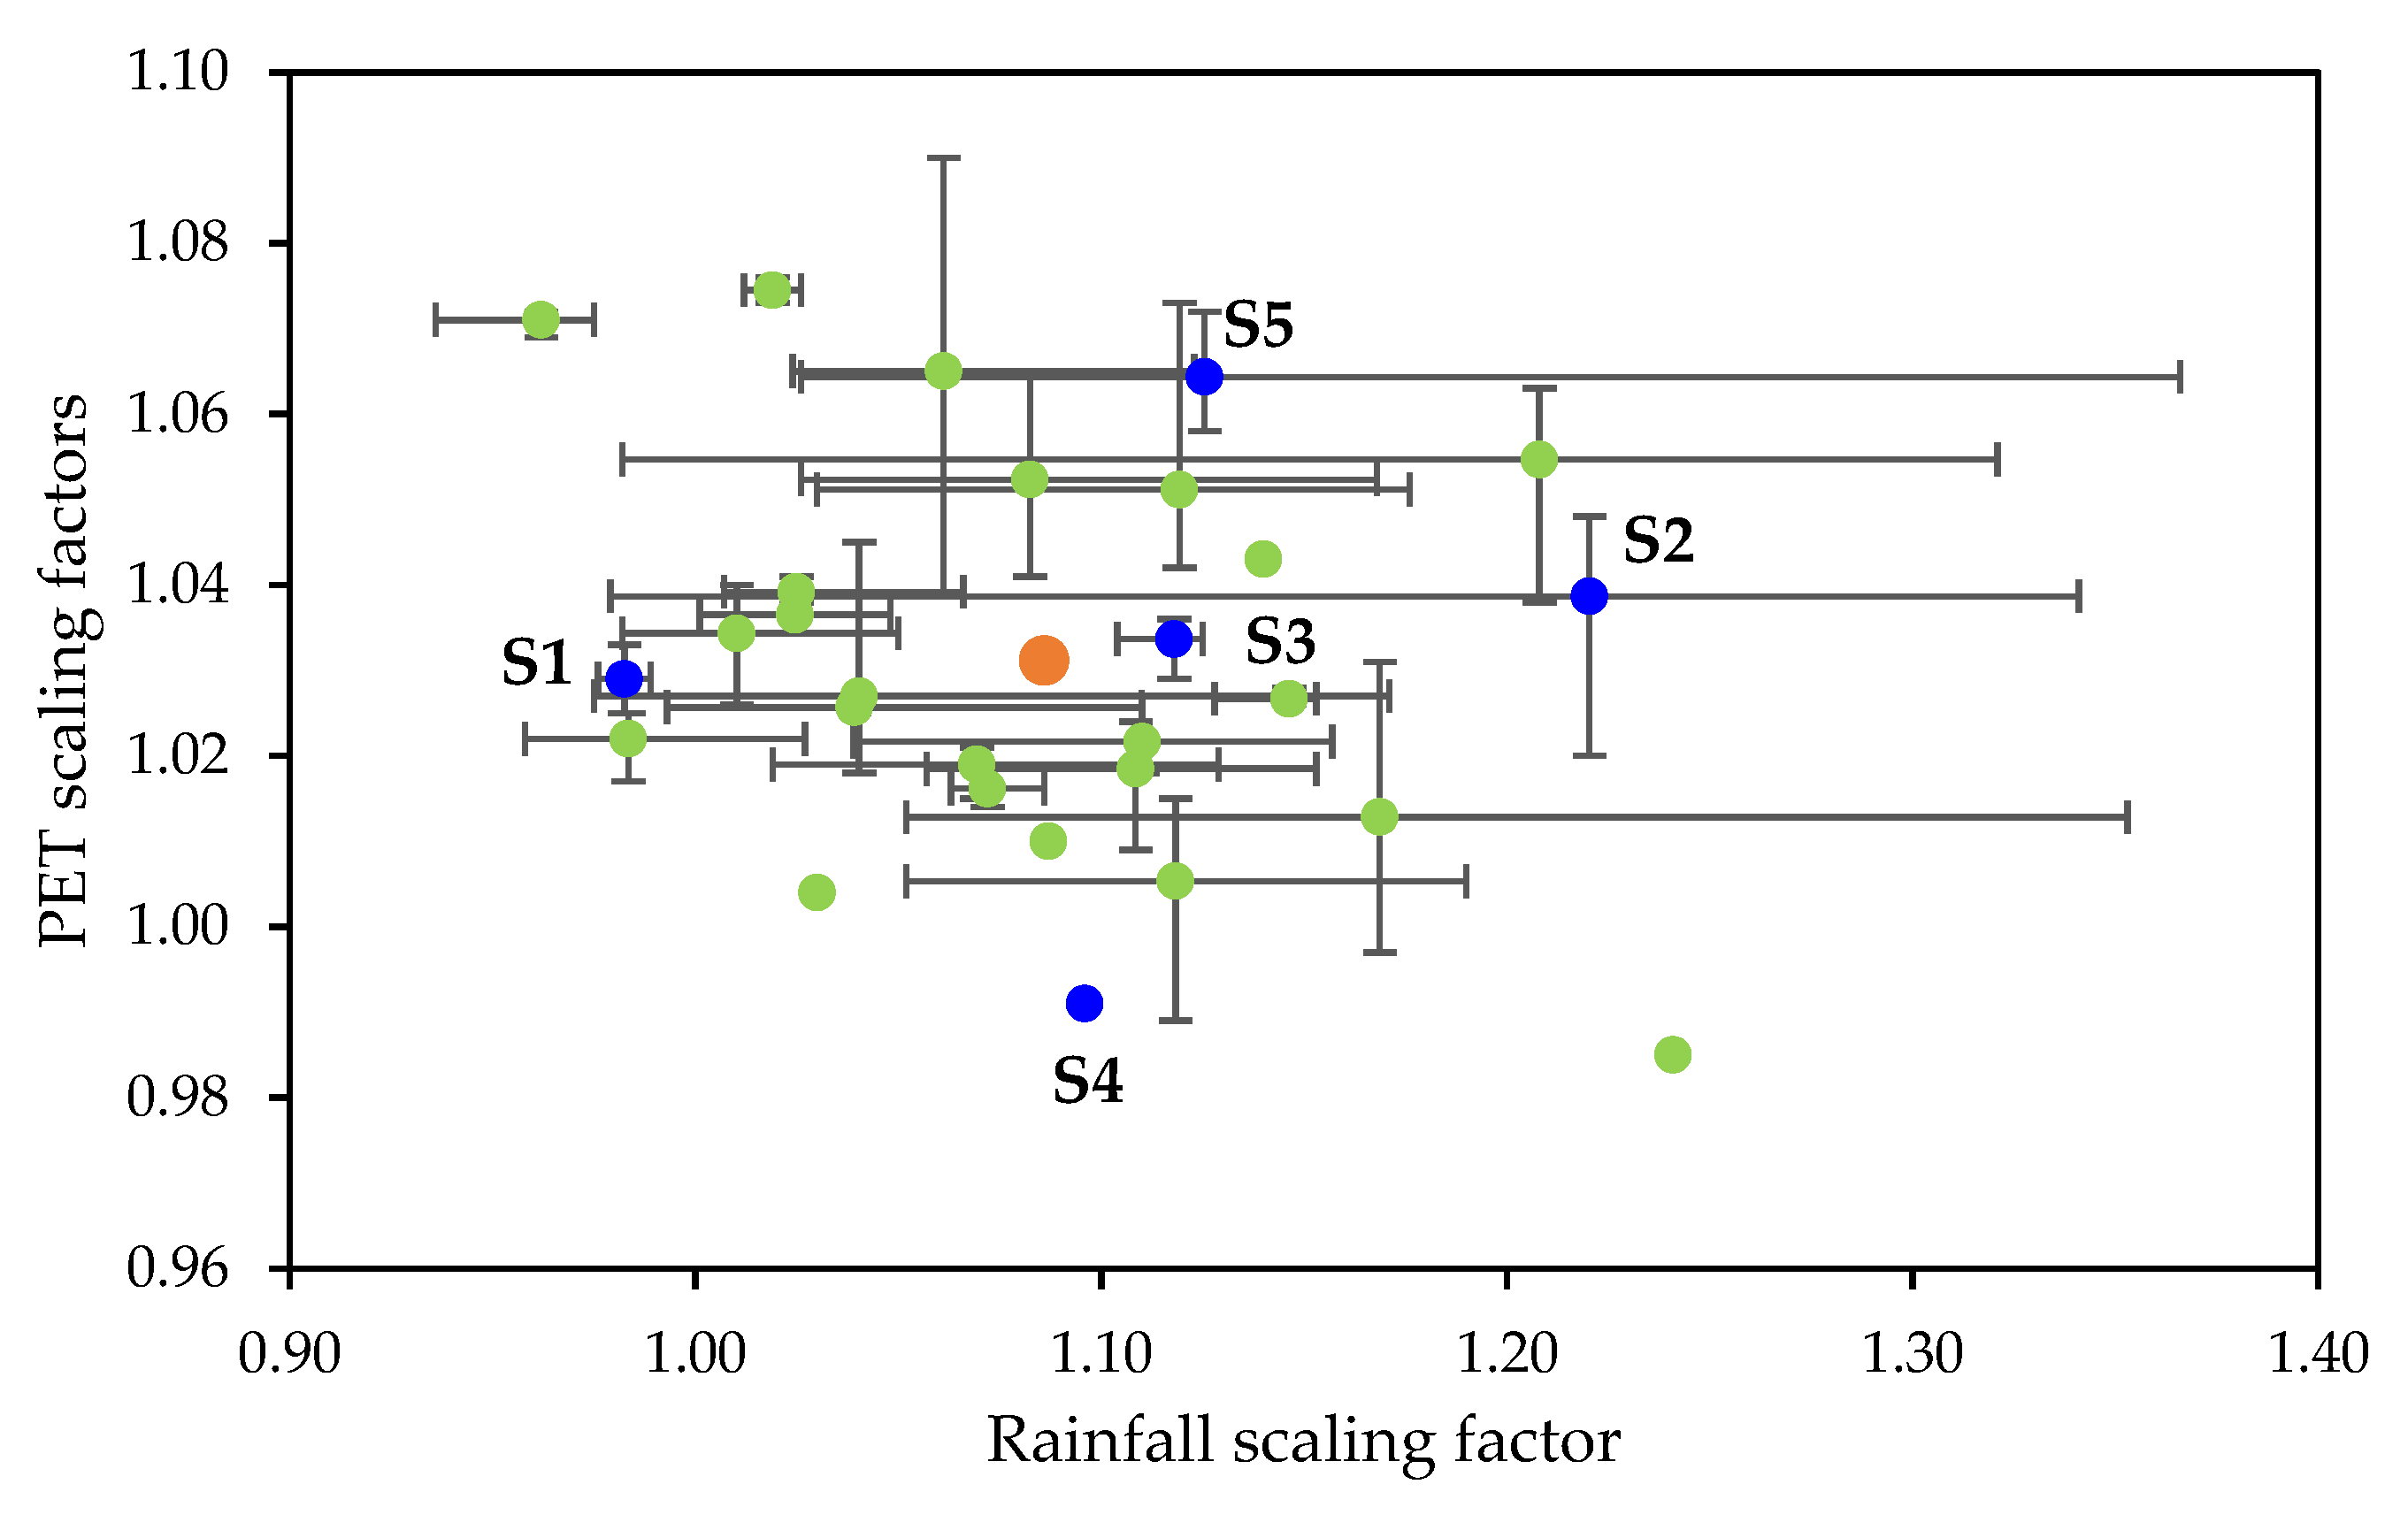
| Scen. | Description | Selected GCM | SF for Rainfall | SF for PET | |||
|---|---|---|---|---|---|---|---|
| RCP4.5 | RCP8.5 | RCP4.5 | RCP8.5 | RCP4.5 | RCP8.5 | ||
| S1 | Low rainfall, Average PET | GFDL-ESM2G | GFDL-ESM2G | 0.983 | 0.997 | 1.029 | 1.038 |
| S2 | High rainfall, Average PET, | MIROC-ESM | HADGEM2-CC | 1.220 | 1.238 | 1.039 | 1.041 |
| S3 | Average rainfall, Average PET | BCC-CSM1-1 | BCC-CSM1-1M | 1.118 | 1.124 | 1.034 | 1.036 |
| S4 | Average rainfall, Low PET | GISS-E2-H-CC | ACCESS1.3 | 1.096 | 1.098 | 0.991 | 0.997 |
| S5 | Average rainfall, High PET, | IPSL-CM5A-LR | IPSL-CM5A-MR | 1.126 | 1.130 | 1.064 | 1.071 |
© 2020 by the authors. Licensee MDPI, Basel, Switzerland. This article is an open access article distributed under the terms and conditions of the Creative Commons Attribution (CC BY) license (http://creativecommons.org/licenses/by/4.0/).
Share and Cite
Karim, F.; Mainuddin, M.; Hasan, M.; Kirby, M. Assessing the Potential Impacts of Climate Changes on Rainfall and Evapotranspiration in the Northwest Region of Bangladesh. Climate 2020, 8, 94. https://0-doi-org.brum.beds.ac.uk/10.3390/cli8080094
Karim F, Mainuddin M, Hasan M, Kirby M. Assessing the Potential Impacts of Climate Changes on Rainfall and Evapotranspiration in the Northwest Region of Bangladesh. Climate. 2020; 8(8):94. https://0-doi-org.brum.beds.ac.uk/10.3390/cli8080094
Chicago/Turabian StyleKarim, Fazlul, Mohammed Mainuddin, Masud Hasan, and Mac Kirby. 2020. "Assessing the Potential Impacts of Climate Changes on Rainfall and Evapotranspiration in the Northwest Region of Bangladesh" Climate 8, no. 8: 94. https://0-doi-org.brum.beds.ac.uk/10.3390/cli8080094