Promoting Low-Carbon Tourism through Adaptive Regional Certification


1
TD School, University of Technology Sydney, 15 Broadway, Ultimo, NSW 2007, Australia
2
Blue Mountains World Heritage Institute, 16 Dunmore Ln, Katoomba, NSW 2780, Australia
3
Ecodweller Sustainability Assessments, 19 Hume Rd, Lapstone, NSW 2773, Australia
*
Author to whom correspondence should be addressed.
Climate 2021, 9(1), 15; https://0-doi-org.brum.beds.ac.uk/10.3390/cli9010015
Submission received: 21 December 2020
/
Revised: 12 January 2021
/
Accepted: 13 January 2021
/
Published: 14 January 2021
(This article belongs to the Section Climate Adaptation and Mitigation)
Abstract
:Climate change is a key issue in sustainable tourism, both in terms of the greenhouse gas emissions generated by the tourism sector and the potential impacts of climate change on tourism-dependent regions. Low-carbon tourism is an emerging paradigm based around emissions reduction by tourism businesses, as well as broader values of adaptation, transition and behavioral change. This article presents the results of a low-carbon tourism case study in the Blue Mountains of New South Wales, Australia, where the Low-Carbon Living Program has successfully designed and implemented a low-carbon rating and certification scheme. This scheme covers emissions related to energy, waste and water and is based on regionally-specific data. The program has also succeeded in its aim of using the tourism industry as a catalyst for broader community action, having been expanded to schools and retailers in the case study region. A transferable regional model has been developed that is being adapted for use in new regions under a modular and decentralised program structure. However, questions remain around the impact of the program on participants’ carbon footprints and customer levels over time, as well as the suitability of a common scorecard system to diverse participant types.
1. Introduction
In recent decades, sustainability has become a critical consideration for tourism-dependent regions around the world [1]. Within a framework of coordinated action by government, industries and individuals, marketing has an important role to play in promoting sustainable tourism offerings, influencing tourist behavior and encouraging tourism businesses to behave ethically [2]. One key marketing response to the challenge of sustainable tourism has been the emergence of eco-certification schemes, with more than 100 such schemes emerging over the past 30 years [3].
As concerns around tourism sustainability have risen, the relationship between tourism and climate change has also become an important focus [4,5,6]. Bramwell et al. [1] argue that climate change has become “a key issue for the future of sustainable tourism”, albeit one that is “much more contested” than some other sustainability issues (p. 2). While some researchers have criticised the degree to which climate change has come to dominate discussions around sustainable tourism [7,8], it has also been argued that “any retreat from engagement with climate change issues by the tourism industry or its researchers would be to their substantial detriment” [9] (p. 17) and that an emerging “low-carbon tourism” paradigm could eventually displace the dominant paradigm built around technological optimism, individual property rights and the pre-eminence of free markets [10].
In this article, we evaluate the Low-Carbon Living Program in the tourism-dependent Blue Mountains region of New South Wales, Australia, as a case study in low-carbon tourism. The pilot phase of this program involved the development of a certification scheme to reduce greenhouse gas emissions, which we evaluate for its potential to balance the competing goals of competition and collaboration in advancing low-carbon tourism within a tourism-dependent region and to serve as an adaptable model for extension to other tourism-dependent regions.
Background to Low-Carbon Tourism
Greenhouse gas emissions from domestic and international tourism have been estimated to make up more than 5% of total global emissions, with transport-related emissions, the largest component of tourism-related emissions, having grown by 62% between 2005 and 2016 [11]. Gössling and Peeters [12] modelled tourism emissions growth under a business-as-usual scenario and forecast a trebling of emissions from 2005 levels by 2050. Scott et al. [13] outline a range of potential mitigation strategies for the tourism industry globally, including abatement through energy efficiency measures (some of which is possible at negative cost), abatement through a switch to renewable energy (more challenging for aviation than for accommodation) and offsets from biosequestration (e.g., tree planting).
While climate change is a key issue for tourism, it can often be overlooked in tourism policy. For example, Moyle et al. [14] found that only 21% of tourism policy strategies in the Australian tourism sector from 2000 to 2014 mentioned climate change, despite the threat posed by climate change to key Australian tourism sites such as the Great Barrier Reef. Other challenges include uncertainty around how the tourism industry is likely to respond to climate change policy [6] and a lack of user-friendly tools for tourists to estimate the greenhouse gas impacts of their travel decisions [15]. Eco-certification with a strong focus on greenhouse gas emissions has the potential to address both of these challenges by reducing the reliance on government policy to drive low-carbon action in the tourism sector and providing potential tourists with credible information on the low-carbon credentials of tourism offerings in a user-friendly format.
Sustainable tourism certification has been argued to offer a range of potential benefits for tourism businesses, including reducing costs by becoming more efficient, attracting more customers through the use of a recognised certification brand in marketing and helping businesses identify aspects of their operations to focus on [16]. However, certification continues to face challenges, including low uptake and high certification costs [17], as well as uncertainty around whether certification provides a competitive advantage for certified businesses [18] or leads to more sustainable tourist behavior [19].
The marketing of tourism enterprises or destinations as “carbon neutral” has been one approach to embedding climate change mitigation into sustainable tourism certification. However, determining whether a tourism enterprise or destination is genuinely carbon neutral can be complicated by issues of boundary-setting and attribution, such as the inclusion or exclusion of emissions from international flights or offsets from activities such as tree planting [20]. A “low-carbon” approach presents an alternative to carbon neutrality for tourism enterprises and destinations that shifts the focus from quantitative analysis of emissions and offsets to the promotion of low-carbon practices and values. Social research by Becken [10] involving tourism experts identified key characteristics of an emerging “low-carbon tourism” paradigm as adaptation, transition, behavioral change and a solution-focused mentality.
An adaptive approach to achieving low-carbon tourism requires consideration of both technical solutions and behavioral change, implemented through localised strategies at the “destination” scale [21]. Zhang and Zhang [22] evaluate the low-carbon credentials of two tourism destinations in China using four categories, with Lhasa falling in their second-lowest category (“insufficient”) and Guilin in their second-highest (“relatively good”). Notably, their low-carbon index includes tourism-specific factors such as the carbon footprint of tourism and the proportion of hotels and attractions that are “green”, as well as broader community-scale factors such as the carbon literacy of residents and low-carbon public infrastructure. Ma et al. [23] also highlight the important role of online tourism agencies in promoting low-carbon destinations and achieving low-carbon supply chains.
Font and McCabe [2] argue that local sustainability criteria have the potential to create a “snowball” effect in tourism-dependent regions that involve tourism-related businesses, local governments and other stakeholders. Citing survey data from Kazakhstan, Mamirkulova et al. [24] highlight how these reinforcing feedback loops between sustainable tourism operations and local communities can enhance both quality of life and sustainable development opportunities in emerging tourism destinations. This focus on tourism sustainability at the local scale lends itself to further case study research and aligns with the argument of Bramwell et al. [1] (p. 1) that “sustainable tourism goals are usually now seen as adaptable according to the circumstances of different contexts and changing circumstances over time”.
2. Materials and Methods
2.1. Case Study Introduction
The Low-Carbon Living Program (initially “Low-Carbon Tourism: Building Sustainable Communities”) commenced in October 2013 with a focus on facilitating and incentivizing emissions reductions in tourism-dependent regions of Australia. The initial pilot region was the Blue Mountains of New South Wales (NSW). Start-up funding for the program was provided by the Cooperative Research Centre for Low-Carbon Living for an initial two-year period, with the program managed under the auspices of the Blue Mountains World Heritage Institute (BMWHI). Key partners for the pilot phase included the Blue Mountains City Council, the NSW Office of Environment and Heritage, Blue Mountains Lithgow and Oberon Tourism (BMLOT) and the University of New South Wales (UNSW). Following the end of the pilot phase in 2016, the program was required to be self-funding.
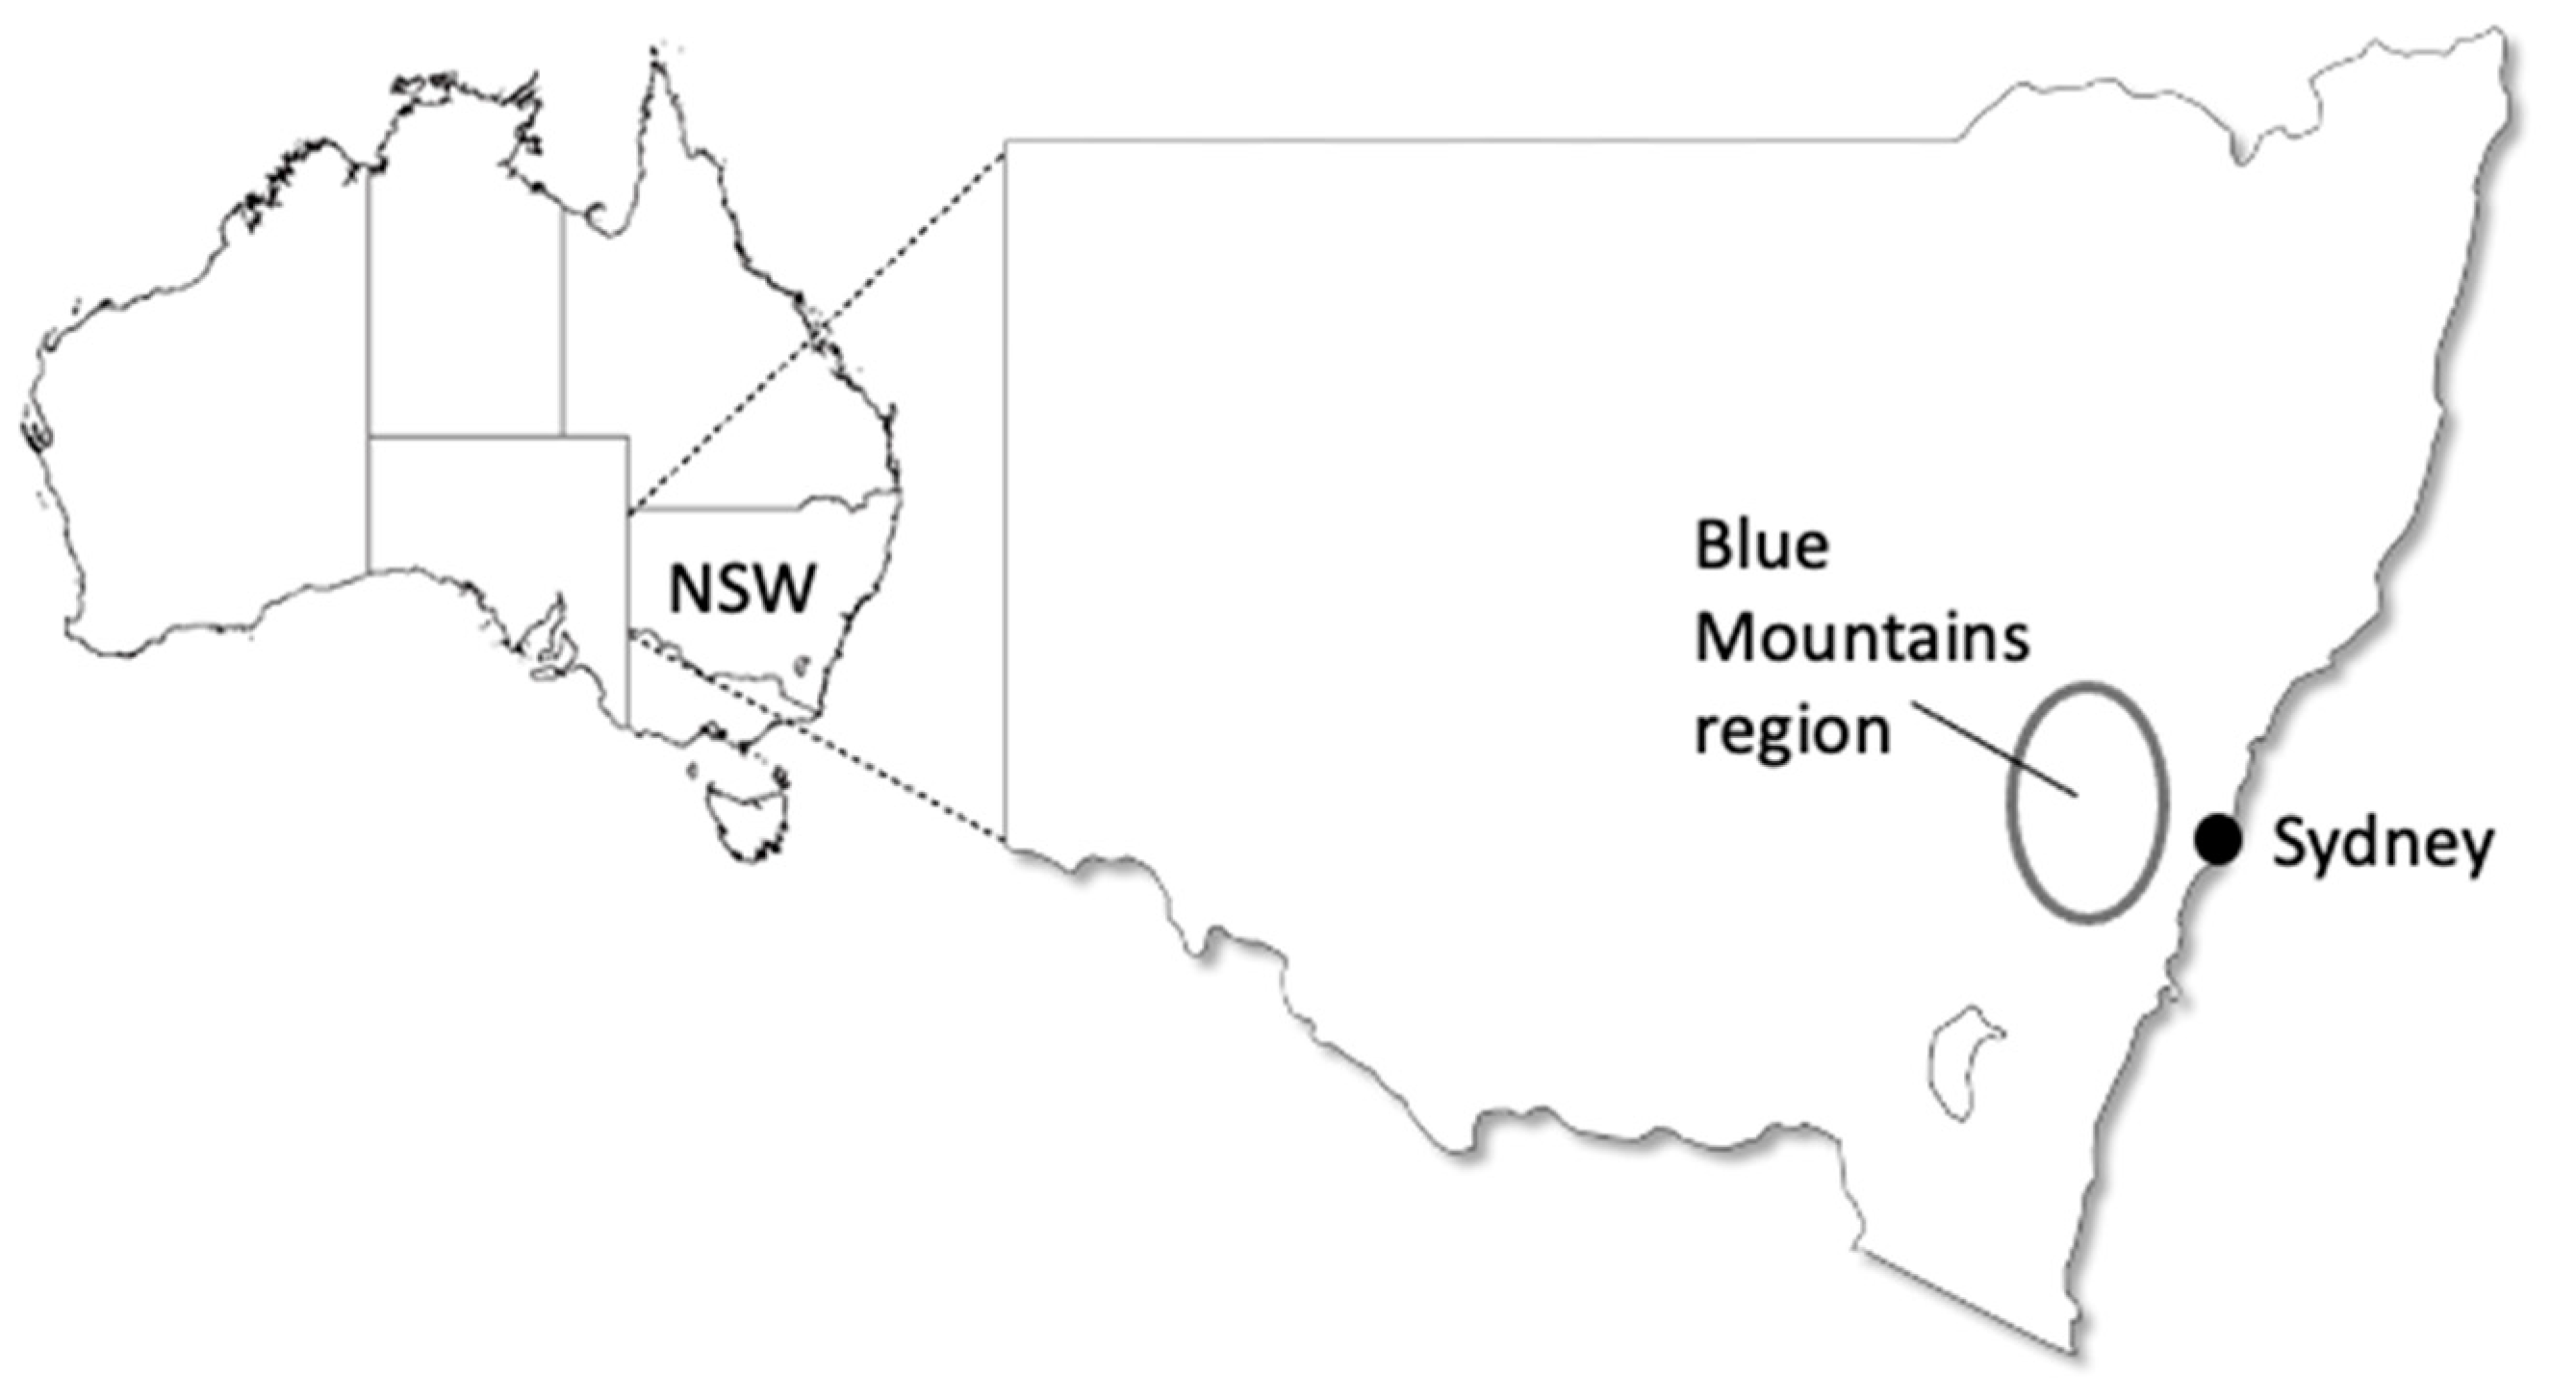
The Blue Mountains region is centred on Katoomba, 100 km west of Sydney, and is a major tourism destination with a focus on nature-based tourism in and around the Greater Blue Mountains World Heritage Area (Figure 1). The region attracted over 3,000,000 visitors in 2015, with day-trippers constituting the majority of visitors (due to the region’s proximity to Sydney) and overnight visitors responsible for the majority of total visitor expenditure [25].
2.2. Aims
The pilot project was underpinned by the following aims:
- To enable visitors and businesses to access reliable information on the low-carbon credentials of local tourism businesses in the Blue Mountains.
- To encourage competition between local tourism businesses to reduce emissions.
- To facilitate collaboration amongst regional tourism operators and other community members to make the Blue Mountains a recognised low-carbon destination.
- To develop a transferable regional model that could be applied to other regions.
A key motivation behind Aim 1 was an observed lack of simple online tools that allowed tourists to compare the low-carbon credentials of tourism businesses in the Blue Mountains, including accommodation, food service and attractions. This lack of user-friendly carbon comparison tools has been noted in previous international research [15] and was also identified for the pilot region through initial discussions with tourism businesses and other project partners. It is exemplified by the following quote from a post on the sustainable living website, the Fifth Estate:
“As a Sydney-sider, I adore skirmishes around our beautiful countryside in NSW… What I have found disappointing, however, is the lack of sustainable travel options available to me… I am responsible in my mode of transportation, offsetting carbon emissions whenever I fly, but staying in responsible accommodation never proves quite as simple”.[26] (p. 1)
In terms of incentivizing emission reductions (Aim 2), the project team chose to focus on accommodation, food service, attractions and local transport services as strategic intervention points. An initial scoping study of the carbon footprint for the region identified accommodation as the third highest sources of emissions after aviation and road transport, which reflects global patterns [11,12]. Aviation and road transport to and from the region were not selected as intervention points for incentivizing emission reductions under the program due to the lack of influence of local businesses on tourist travel arrangements and challenges attributing emissions to individual businesses (e.g., allocating aviation emissions from overseas visitors to Blue Mountains businesses that represent a minor part of their reason for visiting Australia). It was determined that these emissions were best dealt with through the collaborative dimension of the program (Aim 3) and through partnerships with bodies such as Sydney Trains, which provides a carbon calculator for travellers to compare emissions from different transport options [27].
Achieving Aims 2 and 3 required a balance to be struck between competition and collaboration. The program was based on the premise that the adoption and promotion of low-carbon practices by individual businesses could induce competing businesses to adopt similar practices. While some researchers have questioned the extent to which sustainability certification provides a competitive advantage [18], proximity to “green competitors” has been shown to be related to the uptake of sustainable practices in Costa Rica [28]. Collaboration has also been shown to be important in the successful branding of tourism destinations as “sustainable” or “green” in Italy [29] and Costa Rica [30]. As such, the Blue Mountains pilot project was carefully designed to ensure that competition amongst participating businesses did not prevent collaboration in creating a regional sustainable tourism brand. This collaborative philosophy also recognised the potential for action by local leaders in the tourism sector to create a “snowball” effect [2] and induce action amongst other stakeholders in the local Blue Mountains community.
The fifth and final aim of the pilot project was to develop a model for low-carbon certification that could be expanded to other regions. Important considerations included costs, administrative arrangements and the flexibility of the ratings and certification system to be adapted to new regions with differing local characteristics.
2.3. Research Questions
The research questions for the pilot project were:
- Q1.
- Which sources of emissions contribute most to the carbon footprint of participating businesses and which sources present the greatest opportunities for emissions reductions?
- Q2.
- What is the most cost-effective auditing strategy for the program?
- Q3.
- What design features are required for a ratings and certification system to balance the goals of incentivizing emissions reductions, fostering collaboration amongst participating businesses, keeping costs low enough to facilitate widespread participation and maintaining confidence in the fairness, rigour and objectivity of the rating and certification process?
- Q4.
- What mechanisms are required to ensure that the program is appropriately reviewed and adapted over time?
- Q5.
- How could the program be expanded to new regions, including consideration of local administrative arrangements, relationship to a central low-carbon living organisation and adaptation to local conditions?
These questions were addressed sequentially over three stages:
- Stage 1:
- Initial environmental audits of local tourism businesses in the Blue Mountains to determine key emissions sources and opportunities for emissions reductions.
- Stage 2:
- Development of a ratings and certification system to reward low-carbon businesses, encourage competition and promote the combined efforts of businesses across the region.
- Stage 3:
- Development of an adaptive regional model for expansion to other regions.
3. Pilot Study Results
3.1. Stage 1 Environmental Audits
3.1.1. Auditing Approach
The first stage of the program involved free environmental audits for twenty tourism-related businesses in the Blue Mountains region. These audits covered a representative cross section of tourism-related businesses in the region, with patrticipants selected based on the major categories of tourism-related emissions identified by Forsyth et al. [31] and consultations with local tourism stakeholders. The audits covered four accommodation providers (both large and small), two food service providers (i.e., restaurants and cafes), six integrated accomodation and food service providers, five attractions (both major and minor) and three local transport service providers.
The audits had a focus on greenhouse gas emissions and were undertaken between October 2013 and January 2015. The initial pilot phase involved free on-site audits of energy, water and waste management practices for tourism businesses. Reports were provided to each business that included a carbon footprint calculation, discussion of previous actions that had been undertaken to reduce greenhouse gas emissions and recommendations for future actions.
The carbon footprinting methodology used in the pilot phase was designed to produce results quickly using easily obtainable data sources, allow the carbon footprints of similar businesses to be compared in a consistent manner and to follow accepted norms for carbon footprint analysis. In order to balance these three objectives, the program methodology was based on the Australian Government’s National Carbon Offset Standard v2 [32]. However, while the National Carbon Offset Standard is designed for use by individual businesses, some elements of the carbon footprint analysis and methodology for the pilot program (emission sources included, assumptions and calculation of baselines) were standardised across all participating businesses for the purposes of speed, consistency and comparison of participating businesses. Carbon footprints were calculated as totals for each business as well being divided by annual customer data provided by business managers to determine per-customer emissions (per guest-night in the case of accommodation).
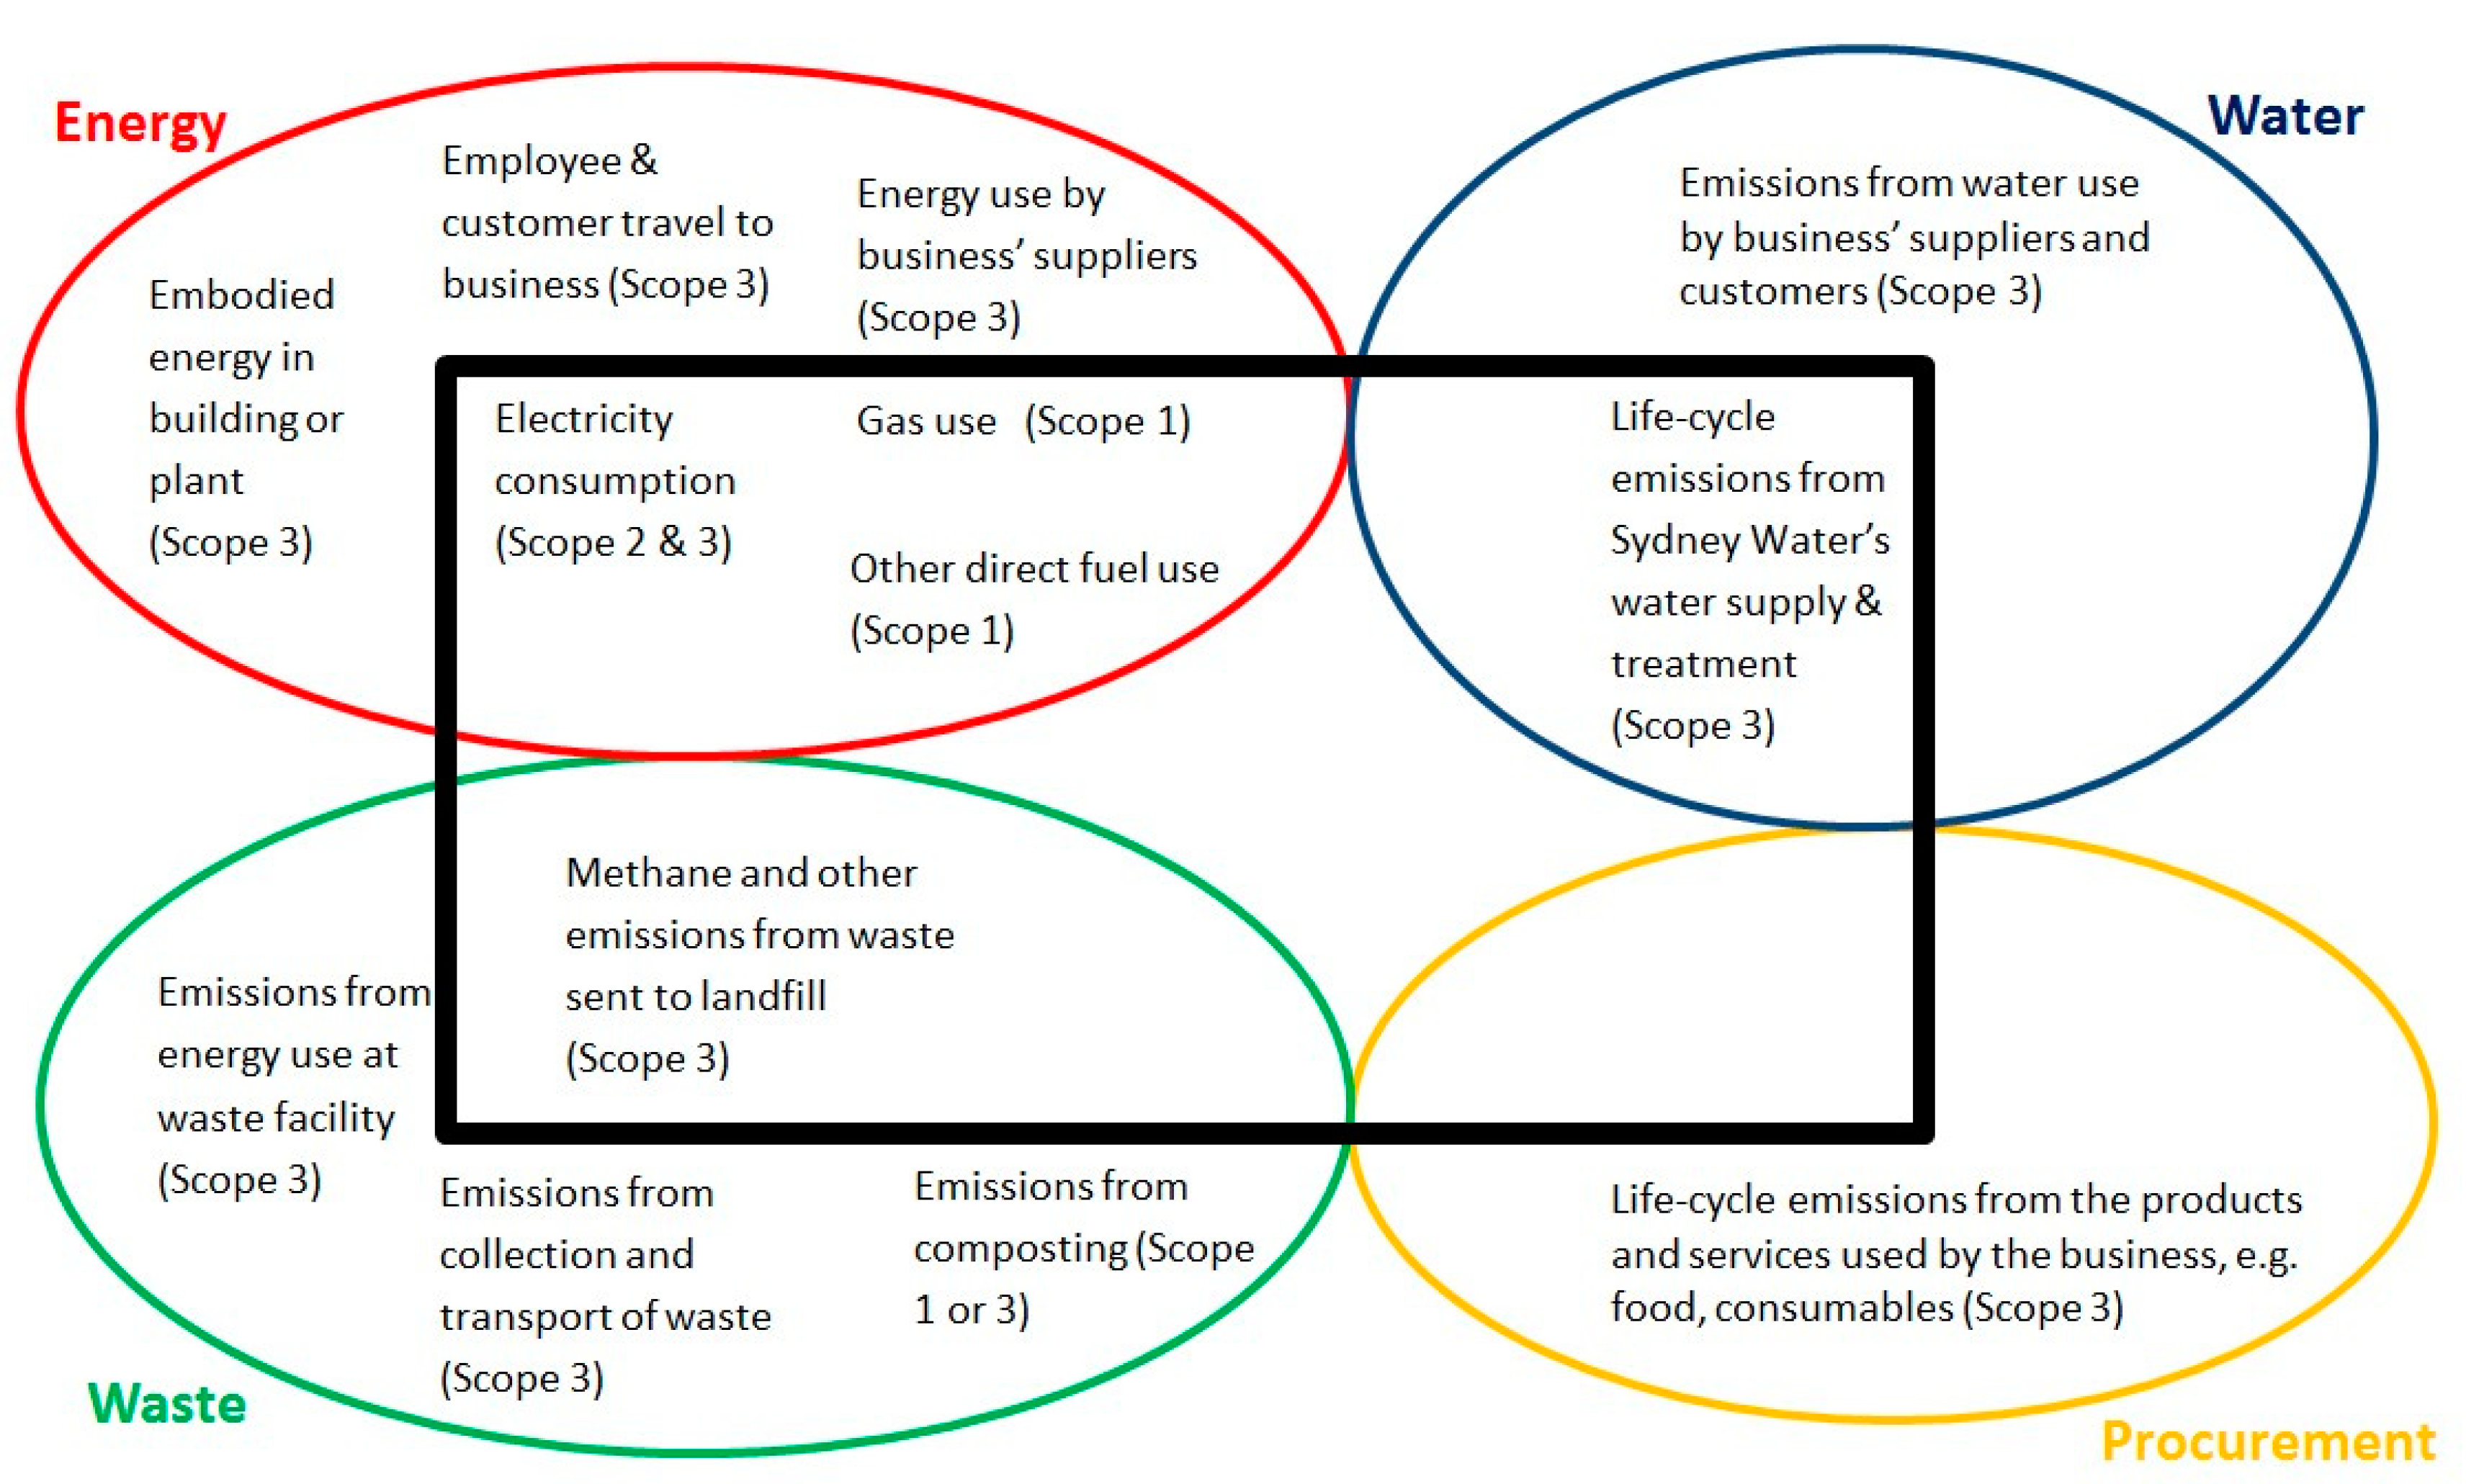
The emissions sources included in the carbon footprint calculations for the twenty initial business are shown within the black rectangle in Figure 2 below. Following the National Carbon Offset Standard, calculations included all emissions classed as Scope 1 (direct on-site emissions such as from natural gas or transport fuel usage) and Scope 2 (indirect off-site emissions that can be clearly attributed to the business such as emissions from electricity generation). Scope 3 emissions were included in cases where it was determined that reliable data existed or reasonable assumptions could be made for all participating businesses.
Scope 3 emissions from waste disposed to landfill and electricity generation were able to be estimated using data from the Australian Government’s annual National Greenhouse Accounts Factors report [33], while Scope 3 emissions relating to water supply were based on carbon footprint data published by Sydney Water, the government-owned utility supplying potable water to the Blue Mountains [34]. Visitor transport to and from the region was excluded from each business’ carbon footprint, but emissions from fuel use within the region by transport-related businesses (e.g., adventure tour providers) were included.
Table 1 shows the data sources and key assumptions used to calculate carbon footprints for each emissions source. Billing data were used to calculate emissions from electricity, natural gas and potable water. Alternative energy sources such as firewood, biofuels and on-site water supply were assumed to be carbon neutral. Electricity generation from solar photovoltaics or other renewable sources was assumed to be carbon neutral and any electricity exported to the grid was deducted from grid electricity imported by the business. Certified GreenPower purchased from electricity retailers was assumed to be carbon neutral but offsets purchased from other sources were considered outside the scope of the carbon footprint analysis due to the lack of a direct link to business-related energy, water or waste practices.
For waste, the carbon footprint analysis was based primarily on the lifetime emissions from all waste disposed of in landfill in the audit year, even though in practice these emissions would be released slowly over time. General waste collected by the Blue Mountains City Council or other waste collection services was assumed to end up at the Blaxland Waste Management Facility where no methane capture was undertaken at the time of assessment.
Emissions associated with the collection and transport of waste (e.g., diesel consumed by waste trucks) were not included in the carbon footprint analysis. Emissions associated with recycling also fell outside the scope of the analysis and were assumed to be zero.
An attempt was also made through the audits to assess energy and water usage for different activities, such as lighting, heating and cooling, bathroom water use and kitchen water use. Consultations were undertaken with business managers about how often fixtures and equipment were used across the course of a week and in different seasons. However, this analysis proved highly labour intensive and managers were often unable to provide complete and reliable estimates. Accommodation businesses that also included a restaurant were treated as a single entity due to the difficulties in calculating carbon footprints for different parts of an integrated business.
In addition to calculating a carbon footprint for each of the initial businesses, auditors also made recommendations on low-carbon practices that could be adopted. Where possible, recommendations were modelled to determine the annual emissions reductions that could be achieved. This modelling was primarily undertaken for measures such as switching to energy-efficient lighting or appliances, reducing unnecessary lighting, installing solar photovoltaic systems, fuel switching (e.g., electric hot water to gas), switching to water-efficient fixtures (or installing flow restrictors), installing rainwater tanks, measures to reduce waste generation, diverting paper and cardboard from landfill to recycling and diverting food and garden waste from general waste to composting. The resulting reductions in energy and water use (and hence emissions levels) were calculated based on commercially-available equipment and usage levels estimated through consultations with business managers. Reductions in hot water usage (e.g., from showers) were assumed to reduce both water and energy use. Impacts on waste emissions were estimated based on the waste types and volumes affected. More complex recommendations relating to improvements in building envelope or passive solar heating were not modelled.
3.1.2. Stage 1 Results
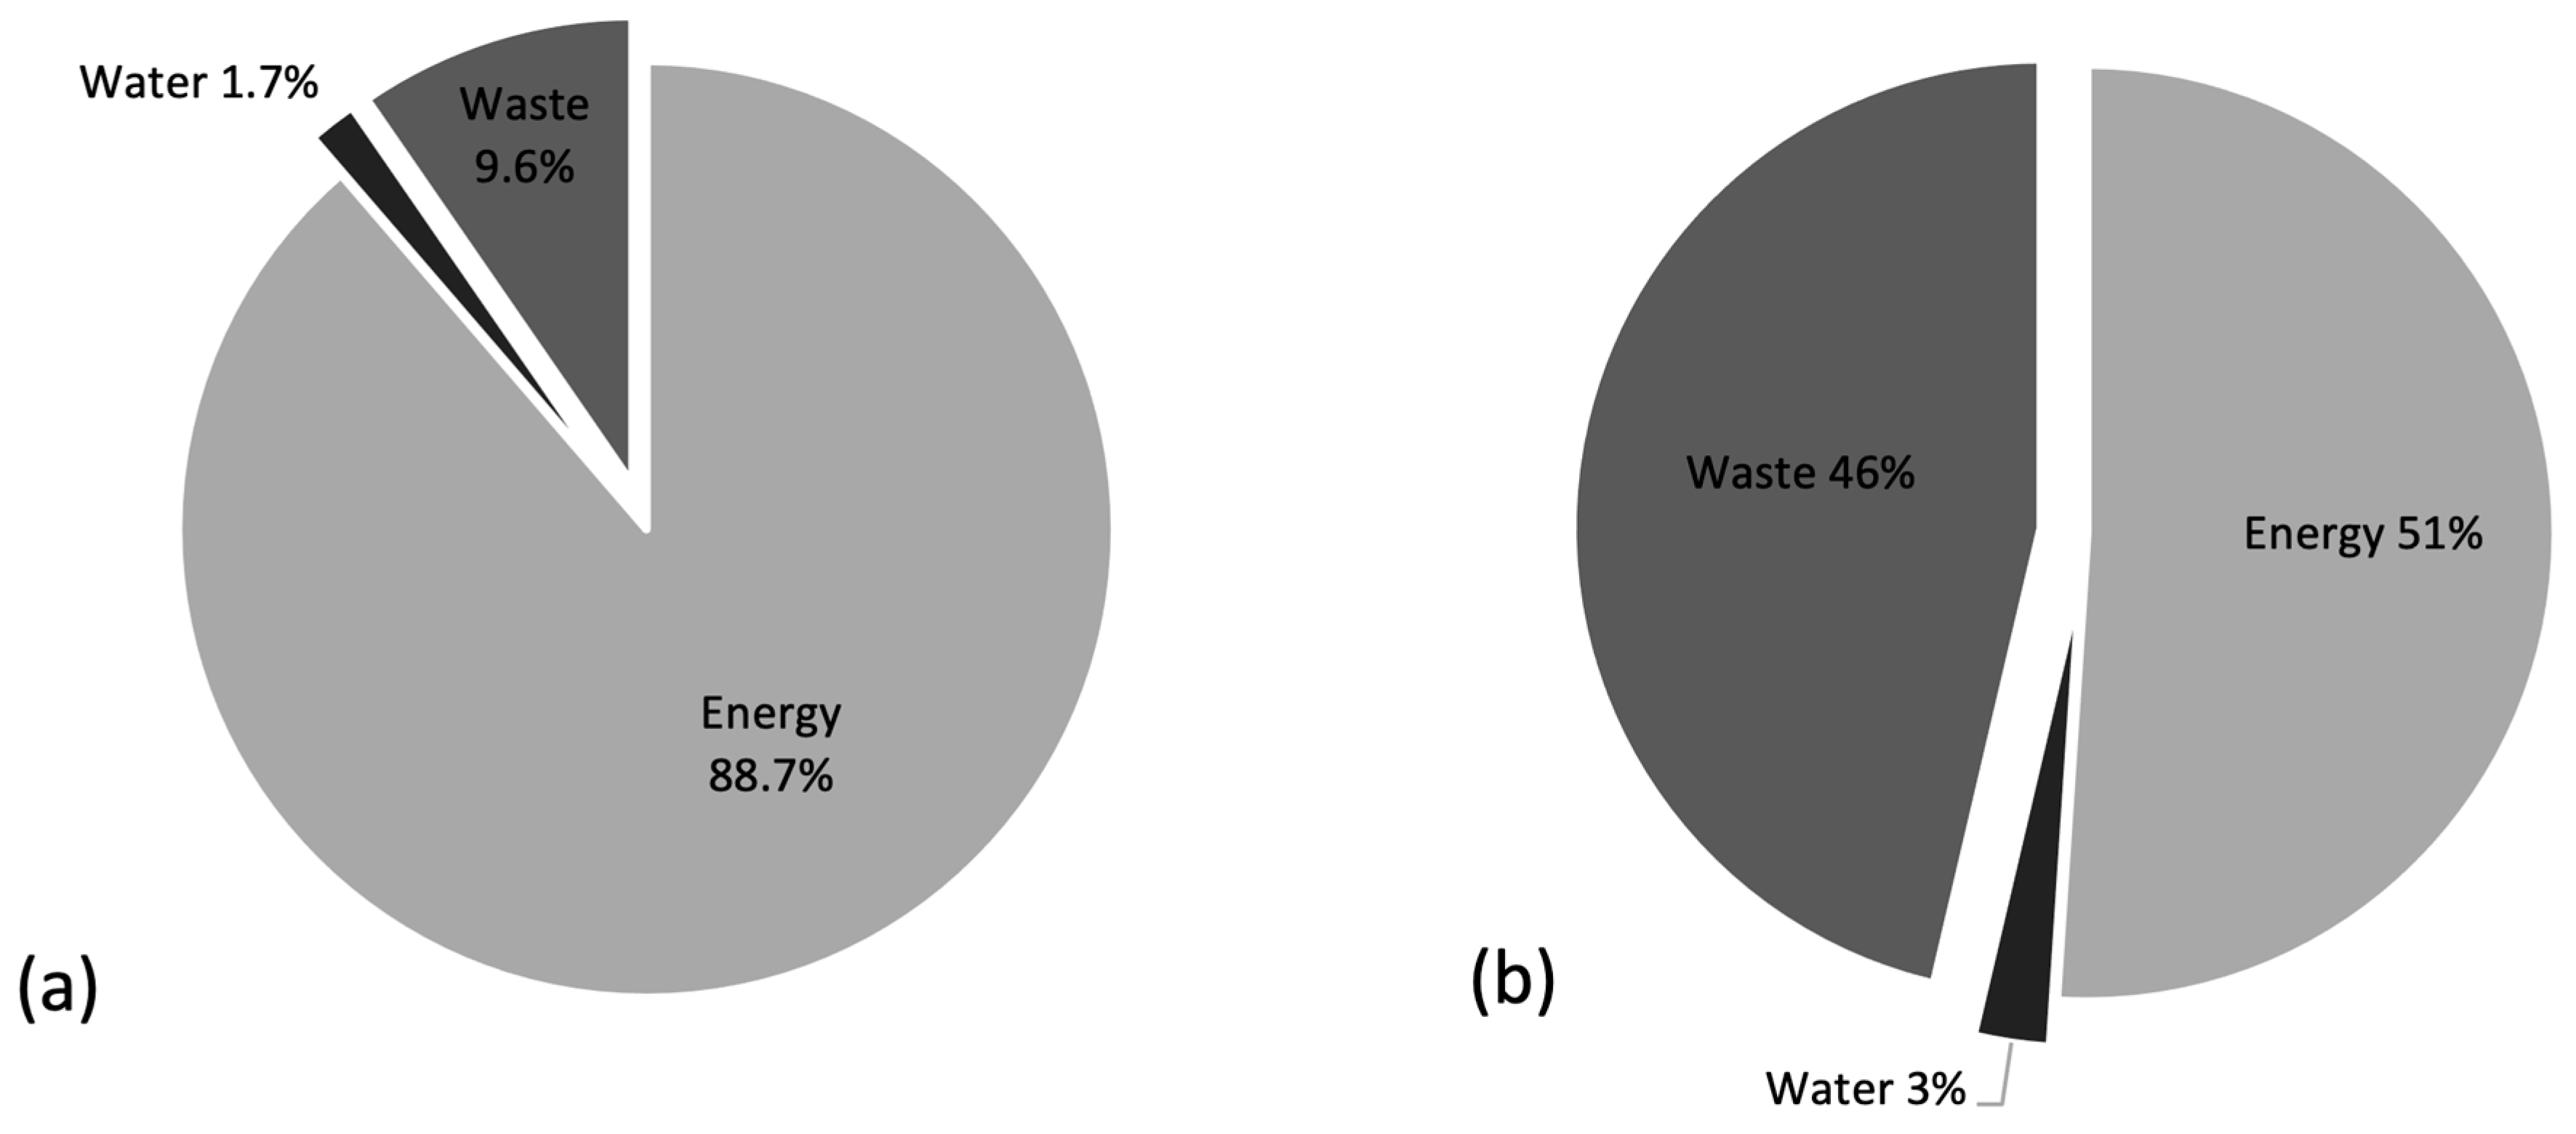
Figure 3a shows the results of the carbon footprint analysis for the initial batch of twenty businesses audited. Overall, energy-related emissions made up an average of 88.7% of each business’ carbon footprint, with waste making up 9.6% and water 1.7%. However, the analysis of opportunities to reduce emissions through the adoption of auditor recommendations (Figure 3b) revealed a different pattern. Despite energy dominating the average carbon footprint, average opportunities to reduce emissions similar between waste and energy. This result was heavily influenced by the identification of paper recycling and composting of food and garden waste as “low-hanging fruit” that businesses could adopt at low cost and effort, while some of the more complex energy-related recommendations (e.g., changes to building envelopes) were not modelled.
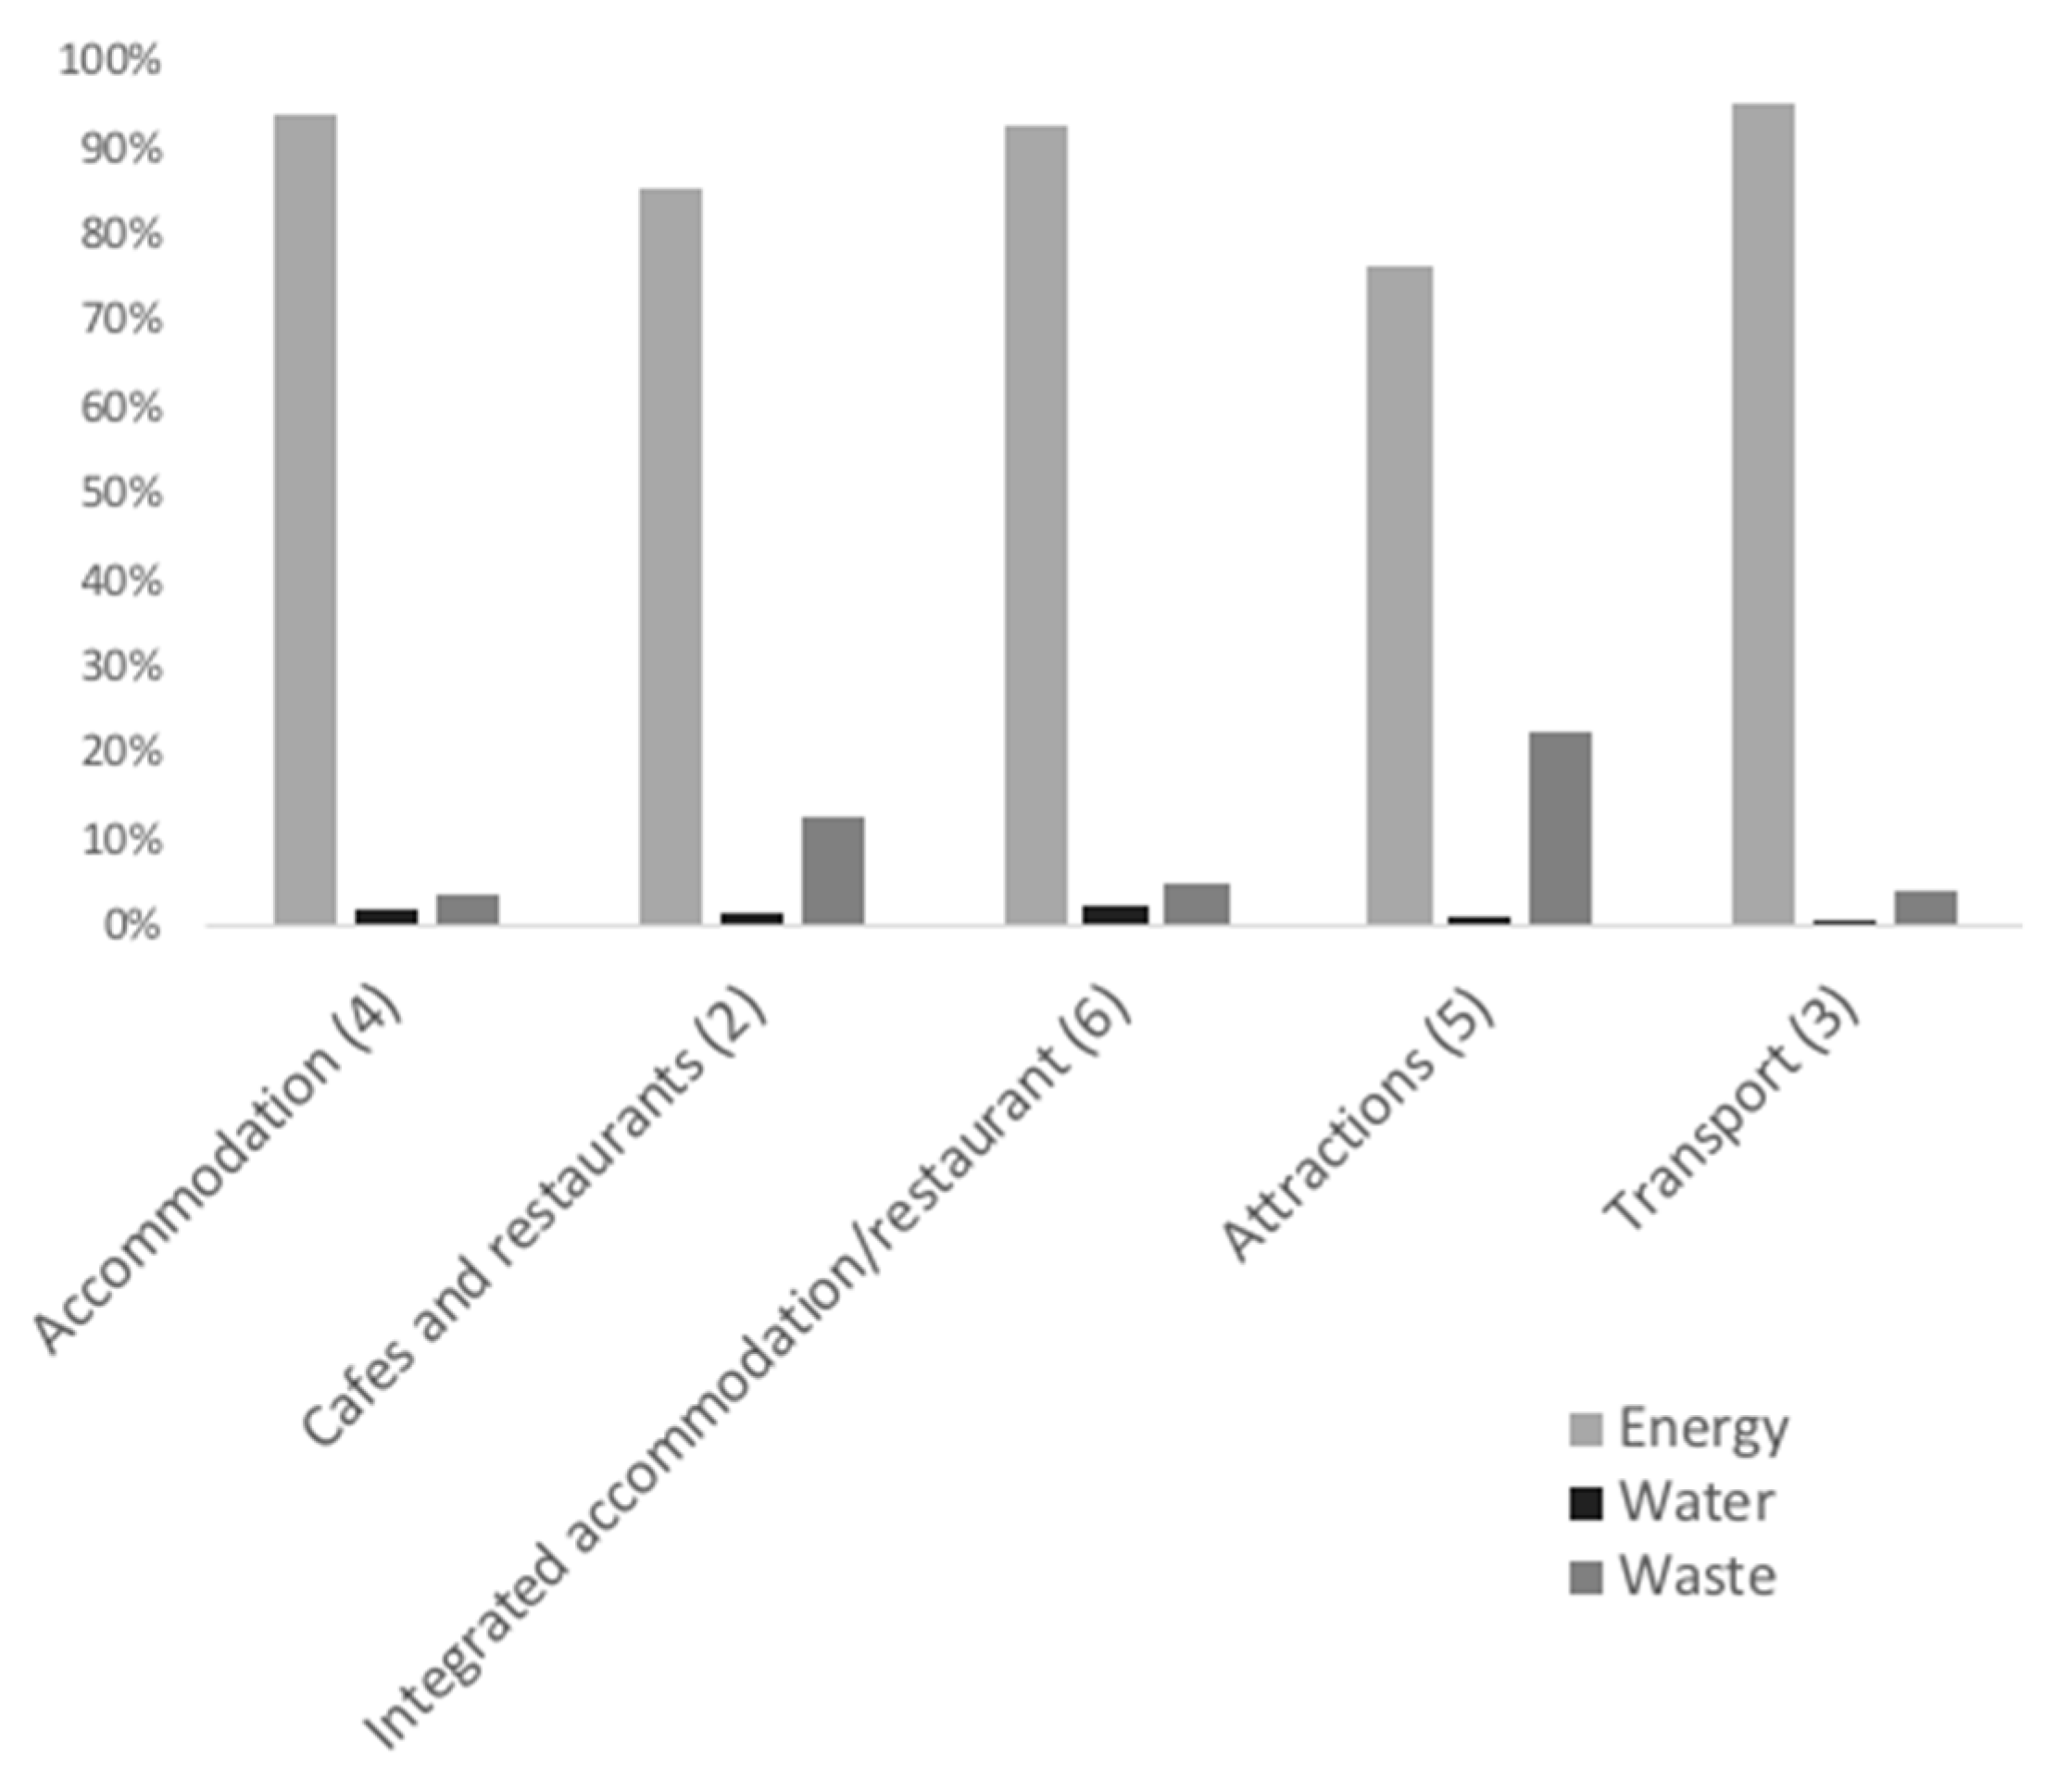
The average breakdown between emissions related to energy, waste and water was similar across the different business categories (Figure 4). The most notable exceptions were restaurants and cafes, which showed a higher average percentage of emissions from waste relative to energy. This result was linked to high volumes of food waste. Attractions also produced a higher average percentage of emissions from waste relative to energy, but this result was heavily influenced by a single business that was self-sufficient in energy and water (which resulted in 100% of emissions coming from waste). Excluding this business produced attraction results that were similar to accommodation and transport businesses (96% of emissions from and 3% from waste). Given the very similar carbon footprint breakdowns for accommodation businesses with or without a restaurant, these two categories were combined into a single accommodation category going forward.
With regards to the pilot project research questions, Stage 1 helped to identify energy-related activities as the greatest source of emissions across each business category (Q1) as well as identifying waste as an important source of opportunities for emissions reductions (Q2). In addition, insights into cost-effectiveness were also gained for the design of the ratings system in Stage 2 (Q3). The waste audits emerged as a significant cost and safety issue due to the process of physically sorting waste from bins. Similarly, the attempt to estimate energy and water usage for different appliances and fixtures through consultation with business managers proved labour intensive, unreliable and incomplete. Conversely, billing data emerged as a low-cost data source capable of providing reliable data on total energy and water use, albeit without allowing energy and water to be estimated for different activities (e.g., lighting, heating, kitchens, bathrooms).
3.2. Stage 2 Development of Ratings and Certification System
3.2.1. Approach
A review was undertaken of existing sustainable tourism ratings schemes to determine whether such a scheme was desirable in the Blue Mountains and whether an existing or new ratings system should be applied. This review focused on two schemes exclusive to Australia and three overseas schemes (Table 2). The results of this review, along with analysed audit data from Stage 1, were presented at a stakeholder workshop in Katoomba in October 2014. Following the workshop, the project team developed a draft ratings and certification system that was evaluated through further consultation with program participants and a survey of Blue Mountains visitors and residents. The final ratings and certification system was launched in May 2016 via the website lowcarbonliving-bluemountains.com.au.
The National Australian Built Environment Rating System (NABERS) is a nationwide scheme managed by the New South Wales (NSW) state government with a hotel rating component that uses a star system to rate hotels based on their greenhouse gas emissions from energy use [35]. This system compares the energy-related emissions of each participating hotel against an emissions benchmark for an “average” hotel with similar attributes such as location, size, quality and facilities provided. Sustainability Advantage is also operated by the NSW state government, but is broader than just hotels or tourism businesses and bases its ratings on a range of criteria such as active participation, processes for continual improvement and demonstrated environmental achievements [36]. The three international schemes selected were EarthCheck, which was developed in Australia by the Cooperative Research Centre for Sustainable Tourism before expanding globally, TripAdvisor’s Green Leaders scheme, which was active only in North America and Europe only at the time of assessment, and the Green Tourism Business Scheme, which originated in the United Kingdom before expanding to Canada and Ireland. EarthCheck’s ratings system is based on time spent under certification, while TripAdvisor and the Green Tourism Business Scheme uses a points-based approach with broad sustainability criteria.
The Katoomba workshop considered each of the different methods for awarding ratings shown in Table 2. This included a points-based approach similar to that of the Green Tourism Business Scheme and TripAdvisor Green Leaders schemes, an approach based on actions undertaken or committed similar to Sustainability Advantage, and a benchmarking system such as that of the NABERS hotel rating tool. An additional option considered was awarding ratings based on measured reductions in carbon footprint achieved by participating businesses since joining the program, similar to the NSW Government’s Energy Savings Scheme, which awards credits for emissions reductions below an initial baseline [37].
3.2.2. Stage 2 Results
The 2014 Katoomba workshop provided the following guiding principles for a low-carbon tourism rating and certification system for the region:
- It should cover all tourism-related businesses rather than just accommodation providers;
- It should focus primarily on activities where there is a direct link between business practices and greenhouse gas emissions (e.g., exclude transport to and from region);
- Categories should be Gold, Silver, Bronze and Participant rather than a star-based system (which was perceived to risk alienating businesses that achieved low ratings);
- The scheme should recognise actions taken to reduce emissions prior to joining the program;
- Ratings should be linked to the actions undertaken and/or emissions benchmarks rather than years of participation; and
- Emissions benchmarking should only be used if reliable locally-specific data on all tourism business types was available.
As no existing scheme was identified that met all of the guiding principles, it was determined that a new rating system would be developed for the Blue Mountains region. A system based primarily on benchmarking was rejected due to a lack of suitable data, with available data from the NABERS tool limited to business hotels in regions that do not experience the same winter conditions as the Blue Mountains. A scorecard-based approach was selected as the most appropriate format, with scores based on a combination of qualitative assessment by an auditor (i.e., observations and business questionnaire), quantitative assessment by auditor (i.e., counting efficient fixtures and appliance) and benchmarking (for the waste category only). It was decided that businesses scoring 75 points or more out of the maximum 100 points would be awarded a Gold rating, with businesses scoring 50–74 awarded Silver, businesses scoring 25–49 awarded Bronze and scores below 25 classed as Participant.
For the draft scorecard, 70% of the score was based on energy-related actions, 20% on waste and 10% on water. In addition, the energy category was further divided into heating and cooling (40 points), lighting (20 points) and appliances (10 points), based on Australia-wide hotel emissions data (Table 3). This data source was used as an alternative to the auditor estimates sourced from consultations with business managers in Stage 1, which were incomplete and unreliable.
The 70:20:10 split between energy, waste and water in the ratings system broadly followed the carbon footprint results from the Stage 1 audits, albeit with energy weighted lower than its actual contribution to carbon footprint and waste and water weighted higher. The justification for the higher waste weighting was the identification of sizeable emissions reduction opportunities in the Stage 1 audits. The higher water weighting was justified by the potential for water efficiency measures to reduce energy use for water heating, which appears as an important use of energy in Table 3 and is not captured in the energy component of the scorecard. As such, the scorecard design was not based solely on the relative contributions of energy, waste and water to the average carbon footprint of Blue Mountains tourism businesses, but also considers the potential for each category to provide leverage points for emissions reductions.
Calculation methods for each category (Table 4) were determined based on the Stage 1 audit data, the guiding principles from the Katoomba workshop and examination of existing tourism rating schemes. Definitions of efficient lighting and water fixtures were based on TripAdvisor’s Green Leaders program [39]. Of the 20 points for waste, 10 points were based on the uptake of composting and paper recycling practices, with the remaining 10 points based on waste volumes per customer benchmarked against other participating businesses in the same category. This approach provides an incentive to reduce overall waste volumes and to better manage paper and food waste, which emerged as key emissions reduction opportunities in the Stage 1 audits. It also avoids labour-intensive waste separation from bins, with auditors instead determining composting and recycling practices through observation and consultation with business managers and estimating annual waste volumes from bin size, fullness at time of collection and collection frequency. Average commercial waste composition is assumed for carbon footprint calculations [33].
A key innovation of the ratings system is the allocation of bonus points for alternative energy and water supplies. The rationale for this was that renewable energy supply did not constitute a discrete subcategory such as lighting or heating, but instead cut across each of these subcategories. Under the bonus point system, a business that is 100% reliant on renewable energy can earn the maximum energy score of 70 under the scorecard. A similar arrangement applies to alternative water supplies from rainwater tanks or on-site dams. The inclusion of bonus points allows businesses looking to increase their scores for energy and water to either increase efficiency of use or switch to a low-carbon source of energy or water.
Prior to the launch of the ratings system, in May 2016, draft ratings were circulated to each participant, along with a summary of the methodology. Minor modifications were made to individual ratings and to the description of the methodology, but not to the methodology itself. At the launch, results were presented from surveys undertaken with 240 Blue Mountains visitors and 130 residents online in April 2016 (both online and in person at major tourist sites). Overall, 82% of visitors and 91% of residents responded “Yes” to the question: “In the future, would you choose a local business that was making an effort to reduce its carbon footprint, by being more energy, waste and water efficient, over a comparable business that did not participate in such a program?” While this indicates a strong interest in low-carbon tourism choices in the region, there is a well-known gap between stated intentions and actual behavior [3] and evaluation of actual visitor behavior is required after the program has become established in the region.
3.3. Stage 3 Review, Adaptation and Expansion
This stage of the project is ongoing and involves periodic analysis of carbon footprints and ratings for participating businesses, changes to participant categories, modification of the ratings scorecard for transport businesses, streamlining of data collection processes and the development of a strategy for expansion of the program into new regions.
3.3.1. Adaptation of the Blue Mountains Pilot Program
The transition from pilot phase to full operation between 2016 and 2020 saw the program expand to more than eighty businesses in the Blue Mountains. There has also been substantial interest from businesses without a clear connection to tourism, including retailers, banks, schools and even households in the region. This is consistent with the program’s aims of using action by tourism businesses as a catalyst for broader low-carbon action in tourism-dependent regions. In response, the program was renamed from Low-Carbon Tourism to Low-Carbon Living (LCL), with a new category created for schools and the attractions category expanded to include retail and service businesses (pending a final decision on whether these business types require separate categories).
In response to interest from residents of the Blue Mountains, the Low-Carbon Living Blue Mountains program has been developing a residential carbon accounting tool to accompany the business-oriented tool developed during the pilot phase. This has also led to a greater focus on self-assessment, with an app developed for businesses and residents to evaluate their own carbon footprint and identify potential mitigation actions. For businesses seeking formal ratings and certification, self-assessments on the app are complemented with a survey to provide the full details needed to assign a rating.
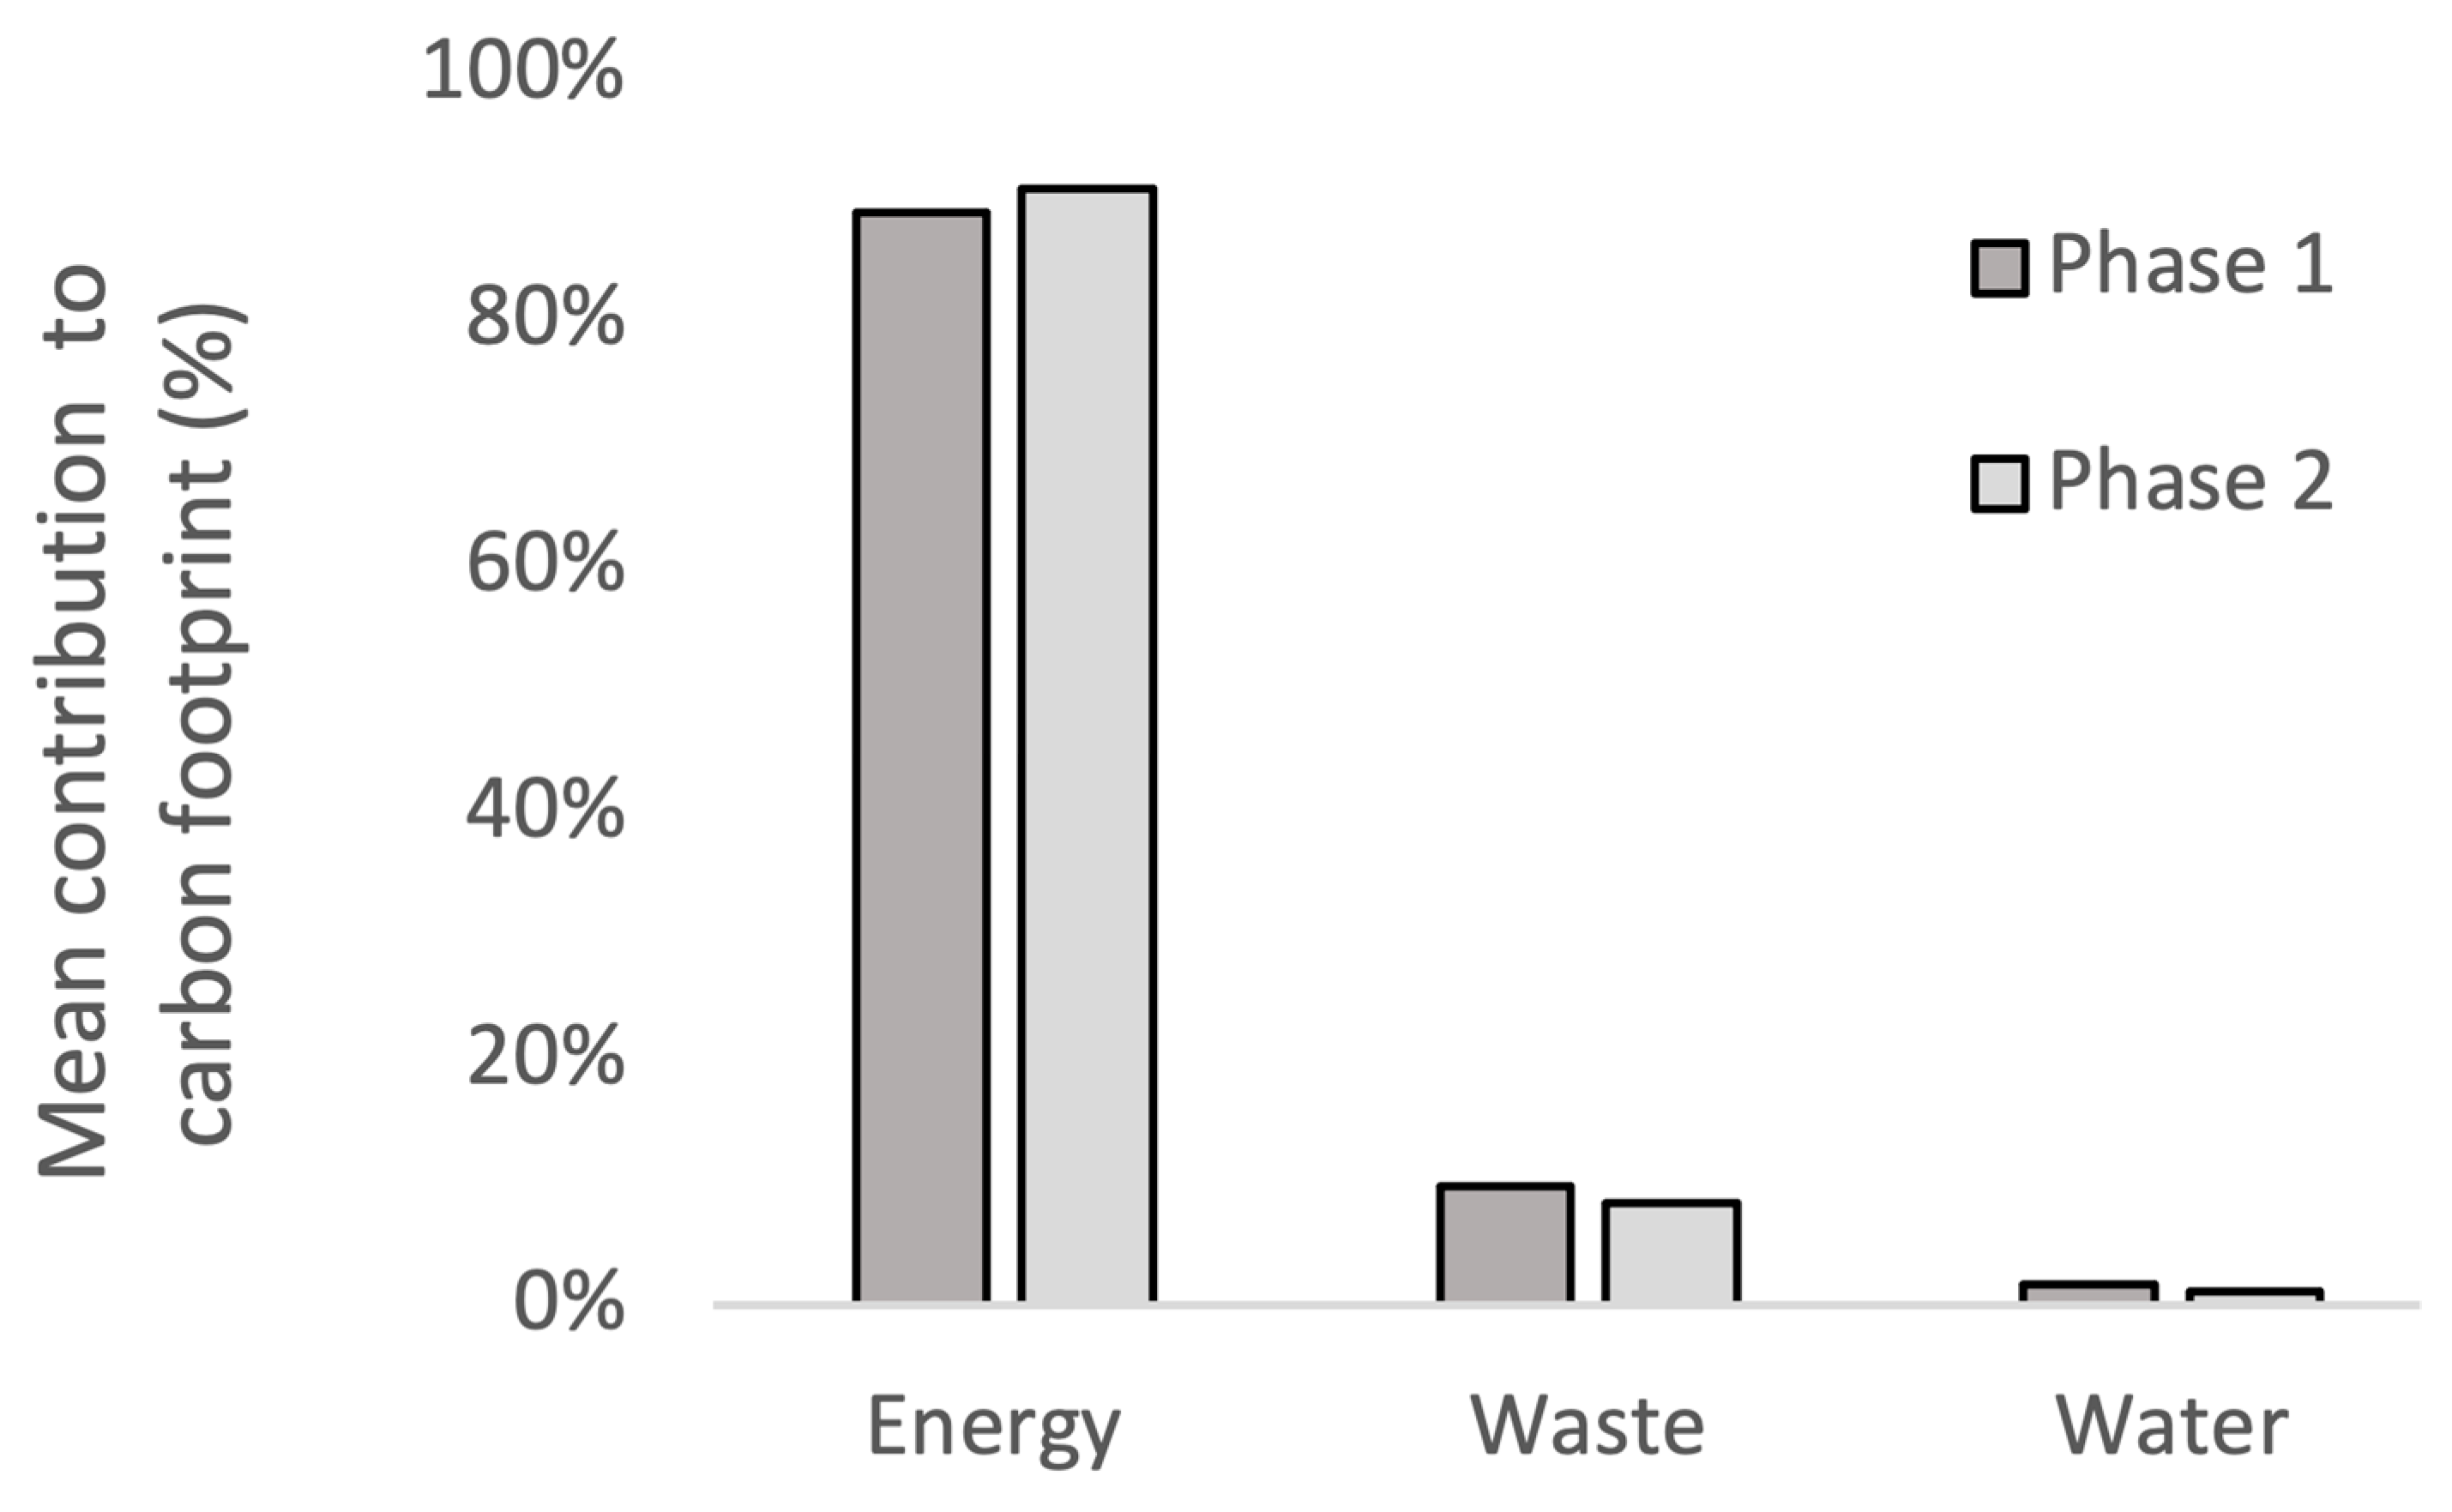
As the program has expanded, the methodology for assigning scorecard ratings and carbon footprints has been reviewed to evaluate whether certain participant types are unfairly advantaged or disadvantaged. Compared with the first 20 participants audited during the pilot phase (Phase 1), the next 24 participants (Phase 2) showed carbon footprints that were slightly more dominated by energy at the expense of waste and water (Figure 5). If this trend persists over time, category weightings may need to be amended, especially if there is evidence that participants have adopted most of the simple waste-related mitigation measures identified in their initial audits.
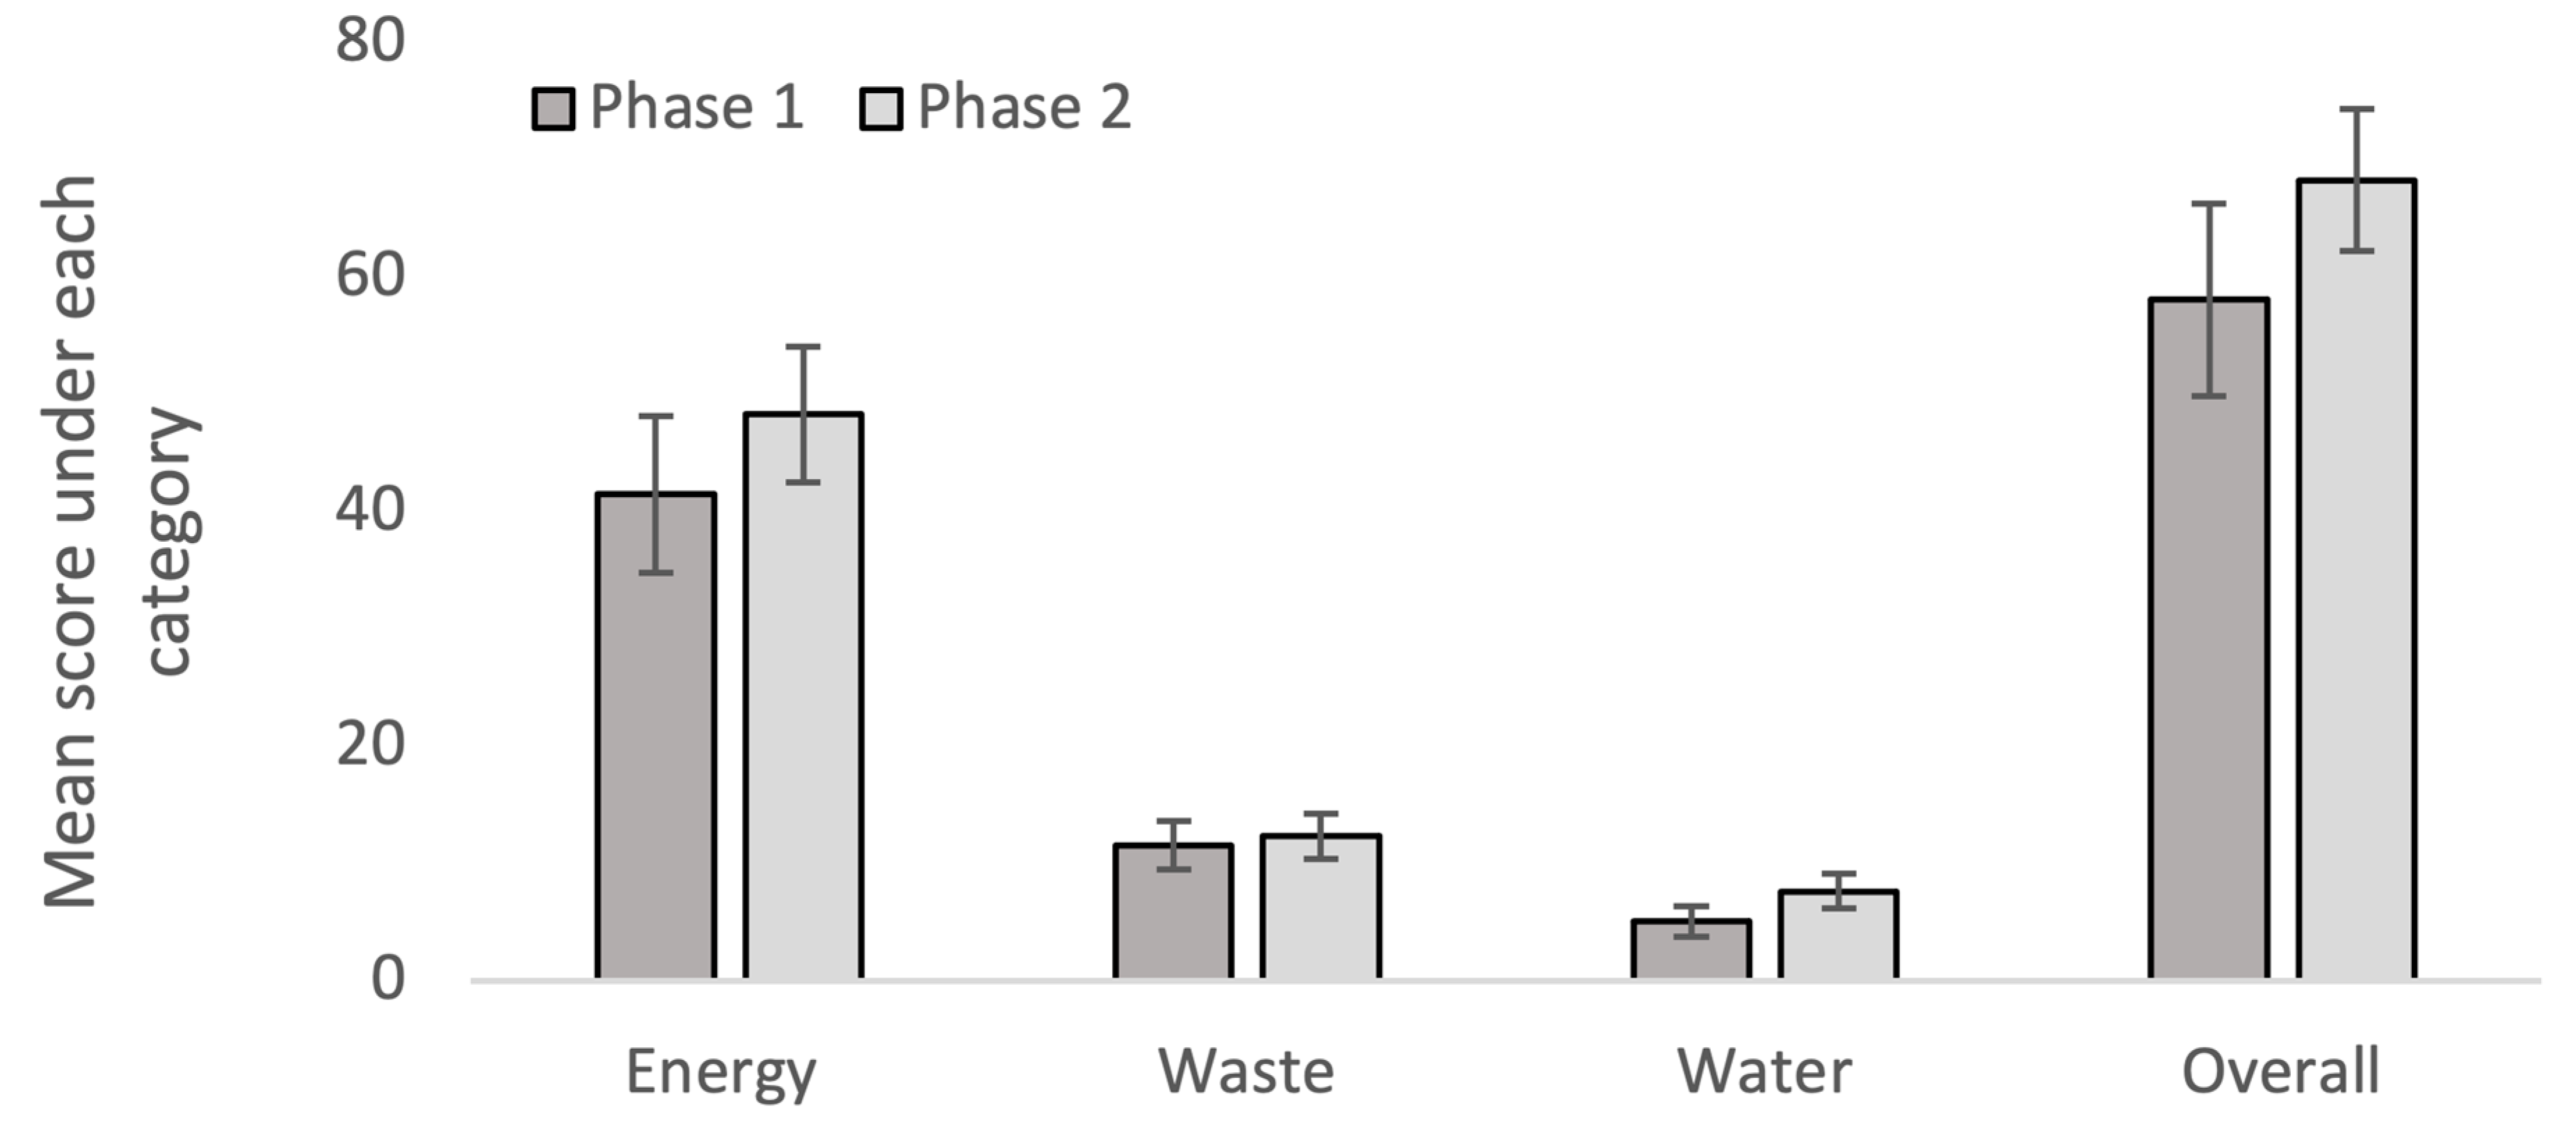
Analysis of ratings scores shows a trend towards higher ratings for Phase 2 participants (Figure 6). However, statistical analysis using two-tailed t-tests [40] for each of the energy, waste and water categories found a significant difference between Phase 1 and Phase 2 businesses only in relation to the water category (α = 0.05, P = 0.01). A subsequent review of scores for the water category revealed that Phase 2 participants had a higher adoption rate for water-efficient fixtures and, as such, the score differential was justified.
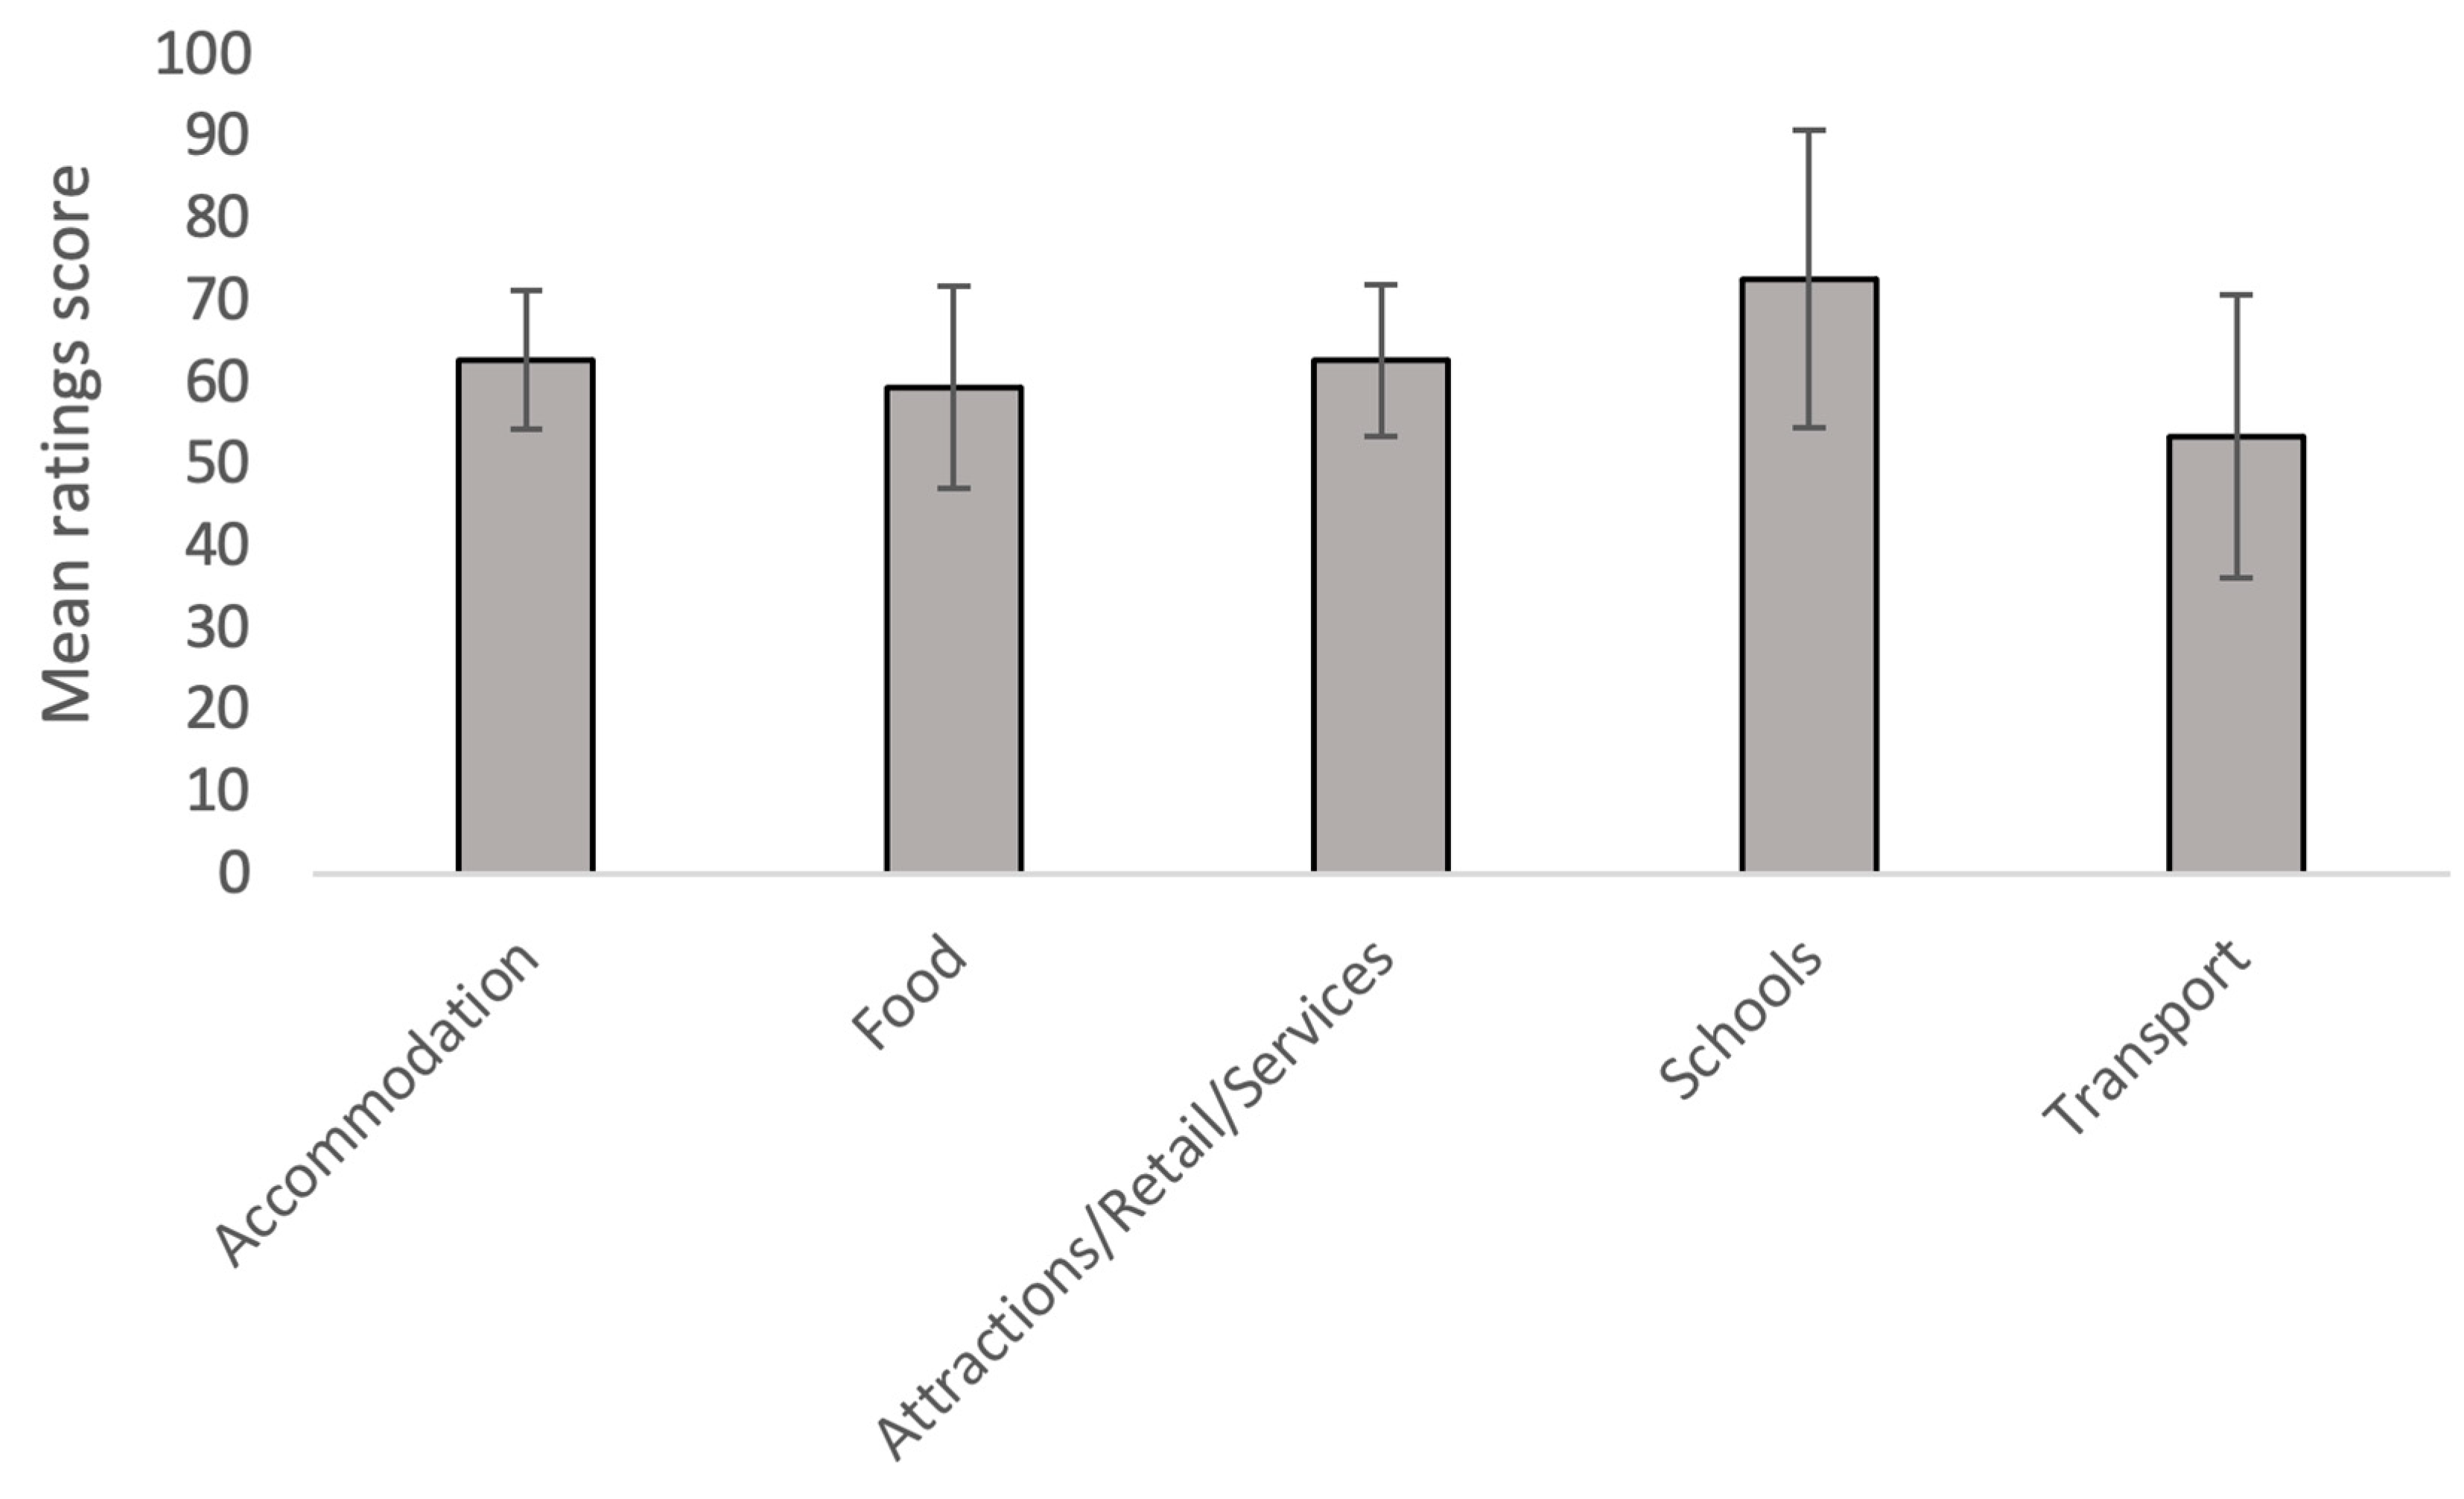
Analysis of ratings scores by category (Figure 7) shows that the three largest categories of accommodation (16 completed ratings), attractions/retail/service (16) and food (5) all produced scores similar to the overall mean score of 63. The review concluded that an average score of 63 (i.e., near the middle of the Silver range) was considered to provide an appropriate balance between rewarding low-carbon actions and incentivizing the additional actions required to reach a Gold rating.
A shown in Figure 7, the mean score for schools was around 10 points higher than the overall mean and for transport businesses it was 10 points below the overall mean. In both of these cases, further statistical analysis is premature due to low participant numbers (four schools, three transport businesses). However, ratings in both categories have been designated as preliminary and an alternative rating scorecard is currently being trialled with transport businesses which includes a greater focus on vehicle efficiency and a lesser focus on lighting, heating and appliances in offices and workshops. The statistical analysis shown in Figure 6 and Figure 7 represents a valuable tool for identifying anomalous trends and results that require closer attention and possible recalibration of the ratings system.
Apart from the regular reviews of ratings as participant numbers grow, a general review of the program is due to be undertaken five years after the launch of ratings system in May 2021. This review will consider whether advances have been made in what constitutes best practice in energy, waste and water management. It will also consider whether the balance between different scorecard categories requires recalibration based on updated carbon footprint analysis. The introduction of a Platinum category will also be considered as part of this review. Further, while participants have provided anecdotal evidence of low-carbon practices adopted as a result of joining the program, future research is planned to systematically evaluate whether participating businesses have reduced emissions since joining the program, how participants’ emissions compare to non-participants and whether participating businesses have obtained competitive advantages in the tourism marketplace through participation in the program.
3.3.2. Expansion to new regions
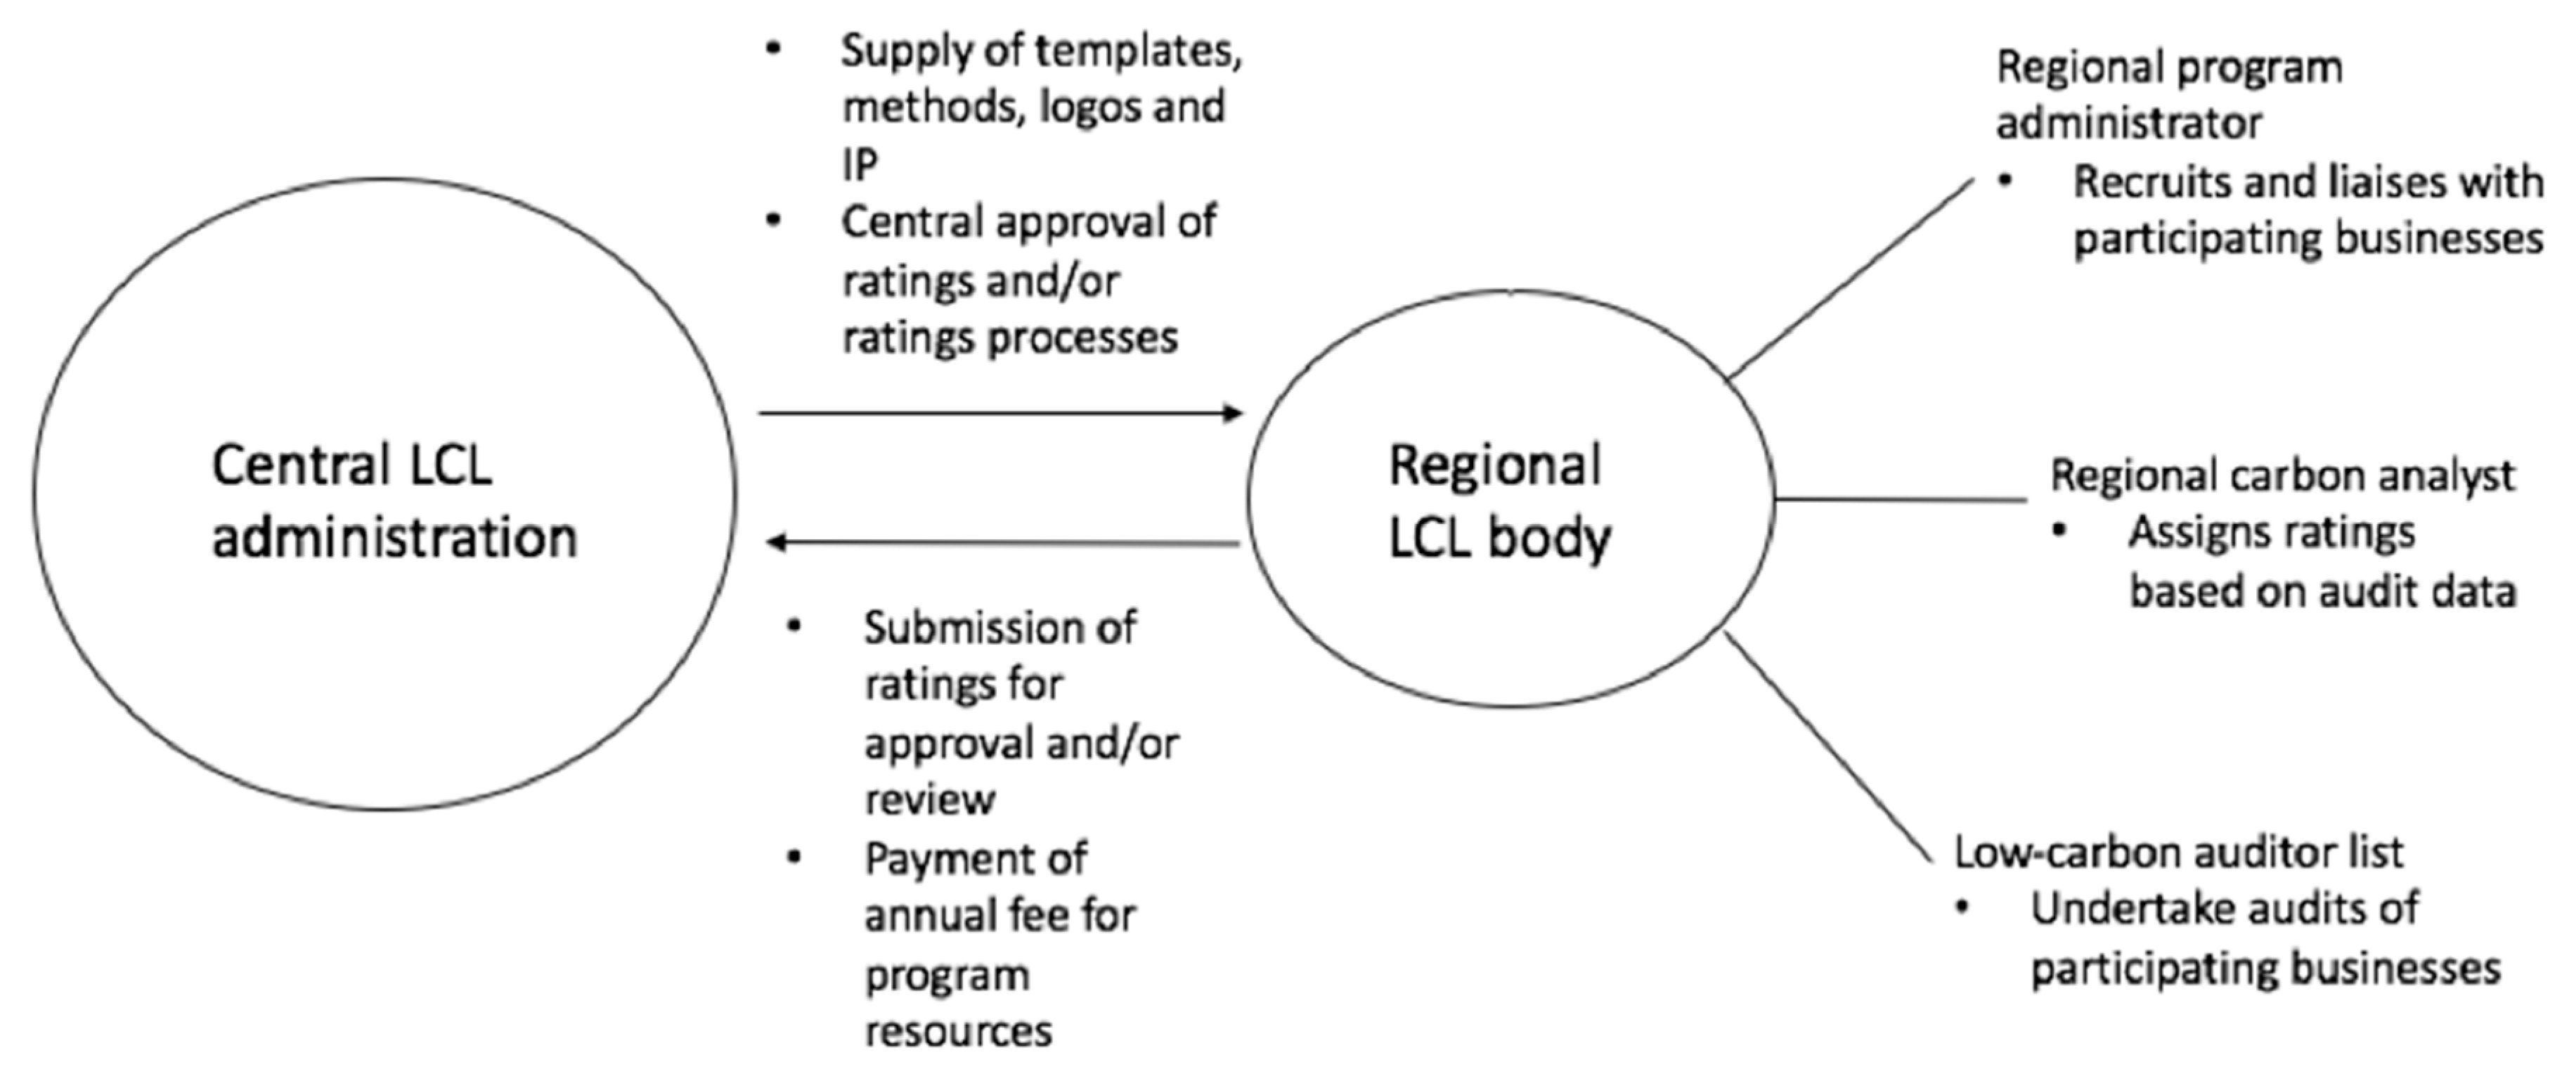
Following the successful establishment of the LCL program in the Blue Mountains pilot region, development work has been undertaken with other tourism-dependent regions in Australia, including the Southern Highlands of New South Wales and the Prot Douglas area in Far North Queensland. The formal launching of these new LCL regions has been delayed by the COVID-19 pandemic, which has severely impacted the Australian tourism sector, but development work is expected to resume in 2021. As part of the LCL expansion program, a guide for new regions has been developed that outlines the relationship that a new region would have with the central program administration, currently hosted by the Blue Mountains World Heritage Institute (Figure 8).
The expansion strategy for the LCL program follows a modular or franchise arrangement, whereby each new region becomes part of the national network and is supported by the central administration while being largely responsible for managing its own recruitment of participants, selection of auditors, website maintenance and communication with stakeholders. The program is flexible regarding which organisations form a regional LCL body, which could include local government or tourism industry groups. The central administration team provides templates for auditing, reporting and producing ratings, as well as the use of LCL branding and intellectual property. The central administration also provides consistency in ratings and certification by overseeing the allocation of ratings. Initially, this will take the form of central approval for each new participant’s rating, but over time is expected to transition to periodic auditing of regional ratings processes.
A key objective of the expansion strategy is to create a ratings and certification model that is adaptable to the unique characteristics of each new region. New regions will be able to create new participant categories as appropriate for their region, such as wineries or golf courses. Ratings from one region will not be directly comparable with those from other regions, which is a key point of difference from schemes such as TripAdvisor’s Green Leaders program. Instead, ratings will act as a guide to the relative low-carbon credentials of different businesses within a region, while the region as a whole will be able to promote itself as a low-carbon destination. Participating regions will not be in direct competition with one another, but rather it is envisioned they will collaborate with one another to share knowledge and experiences while seeking to gain a competitive edge over other tourism regions that have not yet attempted a community-scale move towards a low-carbon paradigm.
4. Discussion
While the case study project is ongoing, each of the five research questions have been informed through the three project stages to date. Stage 1 primarily served to identify major emissions sources (Q1) and opportunities for emissions reductions (Q2). While energy-related activities were identified as the greatest source of emissions, the analysis of audit data led to the key insight that waste emissions were an important inclusion in the scheme due to the substantial emissions reduction opportunities from composting and paper recycling. This result highlights the importance of developing low-carbon tourism strategies at the local scale [1,2], where locally-significant emissions sources and abatement opportunities can be identified.
Stage 2 was primarily focused on the design of the ratings system (Q3), with analysis and consultation helping to identify an appropriate balance between incentivization, collaboration, cost, fairness, rigour and objectivity (Table 5). While these criteria were reflected in the final ratings system, compromises were required in some areas. The decision to base ratings primarily on actions and practices rather than emissions benchmarking resulted in a less direct link between ratings and actual emissions compared to other schemes such as the NABERS hotel rating tool. However, this approach was regarded as fairer by workshop participants because it did not involve benchmarking against businesses from outside the region or discounting emissions reductions achieved prior to joining the program.
While ratings are not based directly on a business’ carbon footprint, scientific rigour was included in the program by basing scorecard categories on the carbon footprint analysis of twenty initial program participants, as well as emissions data from the Australian hotel sector [38]. This analysis process identified energy efficiency and renewable energy as two different pathways to low-carbon tourism, which ultimately led to one of the program’s key innovations, the bonus point system for alternative energy and water supply.
In terms of incentives, the program offers participants a competitive edge over non-participants by promoting their Gold, Silver or Bronze rating on the program website and allowing them to use it in their own marketing materials. Due to the early-stage nature of the LCL program, there is limited direct evidence of its impact on actual visitor behavior. However, evidence from a Google analytics assessment of visitors to one Blue Mountains accommodation business with a Gold rating revealed that 34% came through the local LCL website. Studies in other regions have identified niche groups of environmentally-conscious travellers responsive to eco-labelling [3] and it is intended that the five-year LCL program review evaluates behavior change amongst similar niche groups of visitors to the Blue Mountains.
The final two research questions relate to the ongoing review of the program (Q4) and the development of an adaptive regional model for expansion to new areas (Q5). The ongoing review of the program as new businesses are added has identified important issues around the inclusion of non-tourism businesses and the applicability of a single scorecard to diverse business types. An emergent property of the program has been the interest amongst schools, retailers and service providers without a clear connection to tourism in joining the program. This provides evidence of the “snowball” effect that can be created in tourism-dependent communities when leading institutions implement sustainability criteria and promote their efforts in a collaborative manner [2]. However, preliminary ratings suggest that schools and transport services may require modified scorecards that reflect the differing circumstances of participants in these categories.
The regional expansion model has been developed in a manner that seeks to balance the need for autonomy and adaptability in each new region with the consistency and rigour provided by the oversight of a central low-carbon living body. This approach reflects the argument of Bramwell et al. [1] that sustainable tourism goals are adaptable to different contexts and changing circumstances, as well as that of Scott et al. [21] that climate change mitigation and adaptation strategies need to be implemented at the destination scale. While low-carbon tourism has the potential to act as a catalyst for broader low-carbon action within local communities [2,24], it is important that low-carbon strategies consider localised factors such as the carbon literacy of residents, the presence of low-carbon infrastructure to support tourism and the relationships between local tourism providers and their broader supply chains [22,23].
Future research questions for the LCL program relate to resilience, including whether the program’s structure will make it resilient to future disruptions in the tourism sector (e.g., changing market and regulatory conditions), as well as whether the program helps to enhance the resilience of the communities in which it operates. The program’s adaptive modular structure features a number of characteristics associated with enterprise resilience, such as flexibility, self-organisation, a distributed structure and loose connections between largely autonomous system components [41]. In terms of community resilience, McCool [42] argues that tourism can act as an “intervention” to enhance the capacity of a socio-ecological system to confront and respond to disturbances, while Espiner et al. [43] suggest that a resilience-based approach to tourism could facilitate a shift away from maintaining an unchanging state to recognising that change is inevitable. Key features of the LCL program that could enhance community-scale resilience include the use of the tourism sector as a strategic intervention to catalyse broader uptake of low-carbon practices at a community level and an increase in adaptive capacity brought about through collaboration and sharing of information on emissions sources and mitigation opportunities.
While the pilot project was successful in identifying local criteria for the pilot region, achieving uptake amongst local stakeholders and developing a transferable regional model, it also features some important limitations. One limitation, the lack of direct evidence that the program has altered business or visitor behavior, is scheduled to be addressed as part of the program’s five-year review. Another limitation is that the pilot project did not address the largest sources of tourism-related emissions globally: aviation and road transport. Gössling and Peeters [12] highlight the importance of aviation and road transport for the global carbon footprint of tourism and Scott [9] argues that “full accounting” of tourism impacts requires consideration of this travel phase. Sustainable transport options to and from the region are a planned focus for future research involving all participating businesses working collaboratively with key transport stakeholders including Sydney Trains, NSW Roads and Maritime Authority and private coach services.
5. Conclusions
The case study research presented in this article has revealed important insights about emissions reduction on a local scale, as well as about the nature of low-carbon certification more broadly. The importance of energy to the carbon footprints of local tourism businesses was not surprising, but the identification of waste as a leading opportunity for emissions reduction was an unexpected outcome of the project. Similarities were found in the carbon footprint breakdowns and ratings for local accommodation providers, food service businesses and attractions, but the results raised questions around the application of a standardised ratings scorecard to other participants such as transport businesses, schools, retailers and service providers. The development of the scorecard also identified the need to treat energy efficiency and renewable energy as two different low-carbon pathways, which was achieved through the use of a bonus points system.
Two key contributions of this research are the evidence it provides in favour of taking a localised approach to the development of low-carbon tourism strategies and the potential for tourism-oriented programs to catalyse broader community action. With regards to eco-certification as a tool for encouraging sustainable tourism, the project demonstrated the benefit of taking local contextual factors into account in the allocation of low-carbon ratings. It is unlikely that a standardised “off-the-shelf” certification tool would have been able to appropriately address the case study region’s unique combination of carbon footprint patterns, emissions reduction opportunities and stakeholder perceptions of fairness and accountability. This notion of an adaptable ratings scheme that can be tailored to each new region supports the findings of previous researchers [1,2,22] and has been embedded into the design of the modular regional expansion model for the Low-Carbon Living Program.
The approach taken in this case study has been successful in terms of adoption, with over eighty participants signed up, and in terms of its ability to act as a catalyst for broader regional action beyond the tourism sector, as shown by the interest by schools and retailers. It also has the potential to enhance community resilience and facilitate a broader societal shift towards a low-carbon tourism paradigm, but further research is required to determine whether participation in the program is linked to changes in visitor or participant behavior, whether participants will gain a competitive advantage over non-participants and how other sources of emissions such as aviation and road transport can be captured by the program.
Author Contributions
Conceptualization, J.M.; methodology, A.B.; validation, A.B.; formal analysis, C.L.S. and A.B.; writing—original draft preparation, A.B.; writing—review and editing, J.M. and C.L.S.; visualization, A.B.; supervision, J.M.; project administration, A.B.; funding acquisition, J.M. All authors have read and agreed to the published version of the manuscript.
Funding
This research was funded by the COOPERATIVE RESEARCH CENTRE FOR LOW-CARBON LIVING, grant number RP3010.
Institutional Review Board Statement
Not applicable.
Informed Consent Statement
Not applicable.
Data Availability Statement
Not applicable.
Conflicts of Interest
The authors declare no conflict of interest.
References
- Bramwell, B.; Higham, J.; Lane, B.; Miller, G. Twenty-five years of sustainable tourism and the Journal of Sustainable Tourism: Looking back and moving forward. J. Sustain. Tour. 2017, 25, 1–9. [Google Scholar] [CrossRef] [Green Version]
- Font, X.; McCabe, S. Sustainability and marketing in tourism: Its contexts, paradoxes, approaches, challenges and potential. J. Sustain. Tour. 2017, 25, 869–883. [Google Scholar] [CrossRef] [Green Version]
- Karlsson, L.; Dolnicar, S. Does eco certification sell tourism services? Evidence from a quasi-experimental observation study in Iceland. J. Sustain. Tour. 2016, 24, 694–714. [Google Scholar] [CrossRef]
- Michailidou, A.V.; Vlachokostas, C.; Moussiopoulos, Ν. Interactions between climate change and the tourism sector: Multiple-criteria decision analysis to assess mitigation and adaptation options in tourism areas. Tour. Manag. 2016, 55, 1–12. [Google Scholar] [CrossRef]
- Scott, D.; Hall, C.M.; Gössling, S. A review of the IPCC Fifth Assessment and implications for tourism sector climate resilience and decarbonization. J. Sustain. Tour. 2016, 24, 8–30. [Google Scholar] [CrossRef]
- UNWTO. Responding to Climate Change: Tourism Initiatives in Asia and the Pacific; UNWTO: Madrid, Spain, 2015. [Google Scholar]
- Shani, A.; Arad, B. Climate change and tourism: Time for environmental skepticism. Tour. Manag. 2014, 44, 82–85. [Google Scholar] [CrossRef]
- Weaver, D. Can sustainable tourism survive climate change? J. Sustain. Tour. 2011, 19, 5–15. [Google Scholar] [CrossRef]
- Scott, D. Why sustainable tourism must address climate change. J. Sustain. Tour. 2011, 19, 17–34. [Google Scholar] [CrossRef]
- Becken, S. Evidence of a low-carbon tourism paradigm? J. Sustain. Tour. 2017, 25, 832–850. [Google Scholar] [CrossRef]
- UNWTO. Transport-Related CO2 Emissions of the Tourism Sector; UNWTO: Madrid, Spain, 2019. [Google Scholar]
- Gössling, S.; Peeters, P. Assessing tourism’s global environmental impact 1900–2050. J. Sustain. Tour. 2015, 23, 639–659. [Google Scholar] [CrossRef]
- Scott, D.; Gössling, S.; Hall, C.M.; Peeters, P. Can tourism be part of the decarbonized global economy? The costs and risks of alternate carbon reduction policy pathways. J. Sustain. Tour. 2016, 24, 52–72. [Google Scholar] [CrossRef]
- Moyle, C.-L.J.; Moyle, B.D.; Chai, A.; Hales, R.; Banhalmi-Zakar, Z.; Bec, A. Have Australia’s tourism strategies incorporated climate change? J. Sustain. Tour. 2018, 26, 703–721. [Google Scholar] [CrossRef]
- Juvan, E.; Dolnicar, S. Can tourists easily choose a low carbon footprint vacation? J. Sustain. Tour. 2014, 22, 175–194. [Google Scholar] [CrossRef]
- Graci, S.; Dodds, R. Chapter 15: Certification and labelling. In The Routledge Handbook of Tourism and Sustainability; Hall, C.M., Gossling, S., Scott, D., Eds.; Routledge: Oxford, UK, 2015; pp. 200–208. [Google Scholar]
- Margaryan, L.; Stensland, S. Sustainable by nature? The case of (non)adoption of eco-certification among the nature-based tourism companies in Scandinavia. J. Clean. Prod. 2017, 162, 559–567. [Google Scholar] [CrossRef]
- Bramwell, B.; Lane, B. Sustainable tourism and the evolving roles of government planning. J. Sustain. Tour. 2010, 18, 1–5. [Google Scholar] [CrossRef]
- Esparon, M.; Gyuris, E.; Stoeckl, N. Does ECO certification deliver benefits? An empirical investigation of visitors’ perceptions of the importance of ECO certification’s attributes and of operators’ performance. J. Sustain. Tour. 2015, 22, 148–169. [Google Scholar] [CrossRef]
- Gössling, S. Carbon neutral destinations: A conceptual analysis. J. Sustain. Tour. 2009, 17, 17–37. [Google Scholar] [CrossRef]
- Scott, D.; Hall, C.M.; Gössling, S. A report on the Paris Climate Change Agreement and its implications for tourism: Why we will always have Paris. J. Sustain. Tour. 2016, 24, 933–948. [Google Scholar] [CrossRef]
- Zhang, J.; Zhang, Y. Assessing the low-carbon tourism in the tourism-based urban destinations. J. Clean. Prod. 2020, 276, 124303. [Google Scholar] [CrossRef]
- Ma, D.; Hu, J.; Yao, F. Big Data Empowering Low-carbon Smart Tourism Study on Low-carbon Tourism O2O Supply Chain Considering Consumer Behaviors and Corporate Altruistic Preferences. Comput. Ind. Eng. 2021, 153, 107061. [Google Scholar] [CrossRef]
- Mamirkulova, G.; Mi, J.; Mahmood, S.; Mubeen, R.; Ziapour, A. New Silk Road infrastructure opportunities in developing tourism environment for residents better quality of life. Glob. Ecol. Conserv. 2020, 24, e01194. [Google Scholar] [CrossRef]
- Destination NSW. Travel to Blue Mountains: Year Ended June 2015; Destination NSW: Sydney, Australia, 2015. [Google Scholar]
- A Hunt for Sustainable Tourism in NSW. Available online: https://www.thefifthestate.com.au/home-and-lifestyle/responsible-tourism/a-hunt-for-sustainable-tourism-in-nsw/ (accessed on 12 December 2020).
- Why Is Rail Travel a Better Choice for the Environment? Available online: http://www.sydneytrains.info/about/environment/ (accessed on 7 July 2018).
- DeBoer, J.; Panwar, R.; Rivera, J. Toward a Place-Based Understanding of Business Sustainability: The Role of Green Competitors and Green Locales in Firms’ Voluntary Environmental Engagement. Bus. Strategy Environ. 2017, 26, 940–955. [Google Scholar] [CrossRef]
- Cucculelli, M.; Goffi, G. Does sustainability enhance tourism destination competitiveness? Evidence from Italian Destinations of Excellence. J. Clean. Prod. 2016, 111, 370–382. [Google Scholar] [CrossRef]
- Rivera, J.; Naranjo, M.A.; Robalino, J.; Alpizar, F.; Blackman, A. Local Community Characteristics and Cooperation for Shared Green Reputation. Policy Stud. J. 2017, 45, 613–632. [Google Scholar] [CrossRef]
- Forsyth, P.; Hoque, S.; Dwyer, L.; Spurr, R.; Ho, T.V.; Pambudi, D. The Carbon Footprint of Australian Tourism; Cooperative Research Centre for Sustainable Tourism: Gold Coast, Australia, 2008. [Google Scholar]
- DCCEE. National Carbon Offset Standard; Commonwealth of Australia: Canberra, Australia, 2012. [Google Scholar]
- Commonwealth of Australia. National Greenhouse Accounts Factors July 2013; Commonwealth of Australia: Canberra, Australia, 2013. [Google Scholar]
- Sydney Water. Sydney Water Annual Report 2013; Sydney Water: Sydney, Australia, 2013. [Google Scholar]
- Office of Environment and Heritage. NABERS Energy and Water for Hotels: Rules for Collecting and Using Data; NABERS: Sydney, Australia, 2015. [Google Scholar]
- Sustainability Advantage Recognition Scheme. Available online: http://www.environment.nsw.gov.au/sustainabilityadvantage/recognition.htm (accessed on 12 December 2020).
- Energy Savings Scheme. Available online: https://www.ess.nsw.gov.au/ (accessed on 12 December 2020).
- Commonwealth of Australia. Baseline Energy Consumption and Greenhouse Gas Emissions in Commercial Buildings in Australia; Commonwealth of Australia: Canberra, Australia, 2012. [Google Scholar]
- TripAdvisor. Green Leaders Survey: Australia and New Zealand; TripAdvisor: Sydney, Australia, 2014. [Google Scholar]
- Mason, R.L.; Gunst, R.F.; Hess, J.L. Statistical Design and Analysis of Experiments: With Applications to Engineering and Science, 2nd ed.; Wiley: Hoboken, NJ, USA, 2003. [Google Scholar]
- Erol, O.; Sauser, B.J.; Mansouri, M. A framework for investigation into extended enterprise resilience. Enterp. Inf. Syst. 2010, 4, 111–136. [Google Scholar] [CrossRef]
- McCool, S. Sustainable Tourism: Guiding Fiction, Social Trap or Path to Resilience. In Challenges in Tourism Research; Singh, T.V., Ed.; Channel View Publications: Bristol, UK, 2015; pp. 224–234. [Google Scholar]
- Espiner, S.; Orchiston, C.; Higham, J. Resilience and sustainability: A complementary relationship? Towards a practical conceptual model for the sustainability–resilience nexus in tourism. J. Sustain. Tour. 2017, 25, 1385–1400. [Google Scholar] [CrossRef]
Figure 1.
Blue Mountains tourism region within NSW, Australia.

Figure 2.
Emissions included in carbon footprint analysis of participating businesses.

Figure 3.
Average breakdown between energy, water and waste for (a) the total carbon footprint of initial twenty audited businesses and (b) identified opportunities for emissions reductions.
Figure 3.
Average breakdown between energy, water and waste for (a) the total carbon footprint of initial twenty audited businesses and (b) identified opportunities for emissions reductions.

Figure 4.
Average breakdown of energy, water and waste emissions by business category for initial twenty businesses. The number of businesses in each category is shown in parentheses.
Figure 4.
Average breakdown of energy, water and waste emissions by business category for initial twenty businesses. The number of businesses in each category is shown in parentheses.

Figure 5.
Mean contribution of energy, waste and water to carbon footprints for Phase 1 and 2 participants.
Figure 5.
Mean contribution of energy, waste and water to carbon footprints for Phase 1 and 2 participants.

Figure 6.
Mean scores for energy, waste and water categories for Phase 1 and 2 participants. Error bars show 95% confidence intervals.
Figure 6.
Mean scores for energy, waste and water categories for Phase 1 and 2 participants. Error bars show 95% confidence intervals.

Figure 7.
Mean scores for energy, waste and water across each participant category. Error bars show 95% confidence intervals.
Figure 7.
Mean scores for energy, waste and water across each participant category. Error bars show 95% confidence intervals.

Figure 8.
Relationship between regional program managers and the central program administration.


Table 1.
Data sources and assumptions used in carbon footprint calculations.
| Emissions Source | Primary Data Source(s) | Assumptions |
|---|---|---|
| Electricity | Utility bills | NGA emissions intensity 1 |
| Natural gas (delivered by pipe) | Utility bills | NGA emissions intensity 1 |
| LPG or other gaseous or liquid fuels delivered periodically in containers | Fuel volumes from delivery bills | NGA emissions intensity 1 |
| Transport fuels derived from fossil sources (e.g., diesel, petrol) | Fuel receipts or kilometres driven | NGA emissions intensity 1 |
| Electricity generated on site from renewable sources | Utility bills | Assumed to be carbon neutral (with exports to the grid used to offsets imports) |
| Wood fuel | Not measured | Assumed to be carbon neutral |
| Biofuels | Not measured | Assumed to be carbon neutral |
| Potable water | Utility Bills | Sydney Water emissions intensity 2 |
| Water sourced on site (e.g., rainwater tanks or dams) | Not measured | Assumed to be carbon neutral (with any energy use for pumping captured elsewhere) |
| Waste disposed of to landfill | On-site audit of waste sample (including physical separation into waste types), multiplied by estimated annual waste volume collected | Lifetime emissions for each waste type based on National Greenhouse Accounts Factors (including methane and other non-CO2 emissions from waste breakdown) |
| Waste composted | Estimated from daily waste sample | NGA emissions intensity for default composting system |
| Waste collected for recycling | Not measured | Assumed to be carbon neutral |
1 Emissions intensity from National Greenhouse Accounts Factors (for energy, this includes indirect emissions associated with the extraction and transport of fuels used by the business or used to generate the electricity used by the business). 2 Based on Sydney Water 2013 Annual Report (including indirect emissions from water supply, storage and treatment).
Table 2.
Key features of other ratings schemes selected for review in 2014.
| Scheme | System | Coverage | Ratings criteria |
|---|---|---|---|
| The NABERS Hotel Tool (Australia) | Stars (1–6) | Hotels, but not food or attractions | Energy-related emissions compared with industry averages |
| Sustainability Advantage (Australia) | Bronze, Silver, Gold, Platinum | All business types | Commitments and achievements (broad range) |
| EarthCheck (Global) | Bronze, Silver, Gold, Platinum | Tourism businesses | No. of years in program (5 = Gold, 10 = Platinum) |
| Green Tourism Business Scheme (UK, Ireland, Canada) | Bronze, Silver, Gold | Tourism businesses | Score based on a broad set of sustainability criteria |
| Green Leaders (TripAdvisor—North America and Europe) | Bronze, Silver, Gold, Platinum | Hotels and B&Bs | % score from survey of green practices (30% = Bronze, 60% = Platinum) |
Table 3.
Energy use by Australian hotels, 1999–2012, by end use. Total energy use in this period was 65% electricity and 35% gas and emissions intensity for electricity and gas is 0.29 and 0.07 kg CO2-e/MJ, respectively. Sources: Commonwealth of Australia [33,38].
| Electricity | Gas | ||
|---|---|---|---|
| End Use | % of Energy Used | End Use | % of Energy Used |
| HVAC (heating, ventilation and air-conditioning) | 52 | Space heating | 26 |
| Lighting | 20 | Domestic hot water | 23 |
| Total equipment | 11 | Laundry | 13 |
| Pool heating | 6 | Kitchen | 11 |
| Domestic hot water | 1 | Pool heating | 6 |
| Other | 9 | Other | 21 |
Table 4.
Calculation methods for each category in the Low-Carbon Living Rating System.
| Category | Subcategory | Maximum score | How the score is calculated |
|---|---|---|---|
| Energy | Efficient lighting | 20 | Proportion of lighting that is efficient (i.e., CFLs, LEDs, T5s/T8s battens). Sliding scale to promote best practice, with 2 points for every 15% of light fixtures that are efficient up to 75%, then 2 points for every additional 5% of fixtures that are efficient above 75% |
| Energy | Heating and cooling | 40 |
|
| Energy | Appliances | 10 | Extent to which the business employs the most efficient options for major energy-using appliances |
| Energy bonus | Renewable energy bonus | 70 | 7 bonus points awarded for every 10% energy from renewable sources (e.g., solar panels, GreenPower), up to maximum of 70 points for the overall energy score |
| Water | Efficient water use | 10 | Proportion of water fixtures that are efficient (e.g., taps <4.5 L/min, showerheads <9 L/min, toilets <4.5 L/flush or with dual flush). Sliding scale to promote best practice, with 1 point for every 15% of water fixtures that are efficient up to 75% and 1 point every additional 5% of fixtures that are efficient above 75% |
| Water bonus | Alternative water source bonus | 10 | 1 bonus point awarded for every 10% of water sourced from an alternative sustainable source (e.g., rainwater tanks, greywater, on-site dam), up to a maximum cap of 10 points for the overall water score |
| Waste | Composting and recycling | 10 | 5 points awarded based on degree of composting (or wormfarming) practiced and 5 points awarded based on degree of recycling of paper and cardboard practiced |
| Waste | Relative waste emissions | 10 | Emissions from waste to landfill relative to other businesses in the same category on a per-customer basis, e.g., median waste emissions = 5 points, 10% or less of median = 10 points, 1000% of median or higher = 0 points |
Table 5.
Key design features of the Low-Carbon Living Rating Systems.
| Criteria | Design Features |
|---|---|
| Incentivization of emissions reduction |
|
| Fostering collaboration |
|
| Cost |
|
| Fairness |
|
| Rigour and objectivity |
|
Publisher’s Note: MDPI stays neutral with regard to jurisdictional claims in published maps and institutional affiliations. |
© 2021 by the authors. Licensee MDPI, Basel, Switzerland. This article is an open access article distributed under the terms and conditions of the Creative Commons Attribution (CC BY) license (http://creativecommons.org/licenses/by/4.0/).
Share and Cite
MDPI and ACS Style
Baumber, A.; Merson, J.; Lockhart Smith, C. Promoting Low-Carbon Tourism through Adaptive Regional Certification. Climate 2021, 9, 15. https://0-doi-org.brum.beds.ac.uk/10.3390/cli9010015
AMA Style
Baumber A, Merson J, Lockhart Smith C. Promoting Low-Carbon Tourism through Adaptive Regional Certification. Climate. 2021; 9(1):15. https://0-doi-org.brum.beds.ac.uk/10.3390/cli9010015
Chicago/Turabian StyleBaumber, Alex, John Merson, and Chris Lockhart Smith. 2021. "Promoting Low-Carbon Tourism through Adaptive Regional Certification" Climate 9, no. 1: 15. https://0-doi-org.brum.beds.ac.uk/10.3390/cli9010015
Note that from the first issue of 2016, this journal uses article numbers instead of page numbers. See further details here.