
Climate Change in the 2019 Canadian Federal Election


1
Department of Sociology, MacEwan University, Edmonton, AB T5J 4S2, Canada
2
Department of Psychology, MacEwan University, Edmonton, AB T5J 4S2, Canada
3
Department of Political Science, University of Alberta, Edmonton, AB T6G 2H4, Canada
4
Department of Communication, School of Communication, Leadership, and Marketing, Kristiania University College, 0153 Oslo, Norway
*
Author to whom correspondence should be addressed.
Climate 2021, 9(5), 70; https://0-doi-org.brum.beds.ac.uk/10.3390/cli9050070
Submission received: 7 April 2021
/
Revised: 20 April 2021
/
Accepted: 21 April 2021
/
Published: 24 April 2021
(This article belongs to the Special Issue Anthropogenic Climate Change: Social Science Perspectives)
Abstract
:In the weeks before the 2019 federal election, climate change strikes occurred in Canada and across the globe, which may have increased the salience of this policy issue. We use two data sources to examine the role of climate change in the 2019 federal election: a representative survey of 1500 Canadians and 2109 Facebook posts from the five major party leaders. After accounting for political ideology and region, we find that concern about climate change was a strong positive predictor of liberal support. We triangulate these findings by analyzing Facebook posts. We find that left-wing politicians were more likely to post about climate change and that posts about climate change received more likes, comments, and shares than other posts. This higher level of user engagement did not differ depending on which political party posted the climate change message. The combination of sources offers news insights into citizen-elite interactions and electoral outcomes. Climate change was important in the election, whether this importance was measured through survey data or user engagement with leaders’ climate change posts.
1. Introduction
On 22 April 2015, leaders from over 150 nations signed the Paris Climate Agreement, pledging that their countries would make a concerted and well-regulated effort to reduce greenhouse gas emissions (GHGs) and ensure that global temperatures would rise no more than 2 °C above pre-industrial levels [1]. According to PEW data, 78% of respondents favored the notion of their country signing the Paris Climate Agreement with the goal of limiting GHGs [1]. The failure of global leaders to fulfill their climate pledges has led to widespread protests, including the climate strike movement spearheaded by young Swedish activist Greta Thunberg [2]. In 2019, the global protest events drew more than 1 million participants on many occasions, including events on 20 and 27 September, approximately one month prior to the Canadian election (https://en.wikipedia.org/wiki/September_2019_climate_strikes (accessed on 20 April 2021)). The events may have increased the salience of climate change as an election issue, with citizens using this policy issue as a deciding factor in their votes. Political leaders may have used these events as an opportunity to outline their climate change plans. Social media offers an opportunity to communicate about these plans and to gather citizens’ feedback about these plans using user reactions to posts, such as likes, comments, and shares.
In this paper, we use survey data collected immediately after the 27 September climate strike and before the October election. Using an online panel matched to the age and gender composition of the Canadian population, we examine levels of concern about climate change, offering insight into the role of region as distinct from ideology in predicting patterns of concern. We also examine how climate change views factor into people’s voting preferences in the lead up to the 2019 Canadian federal election. Level of concern about climate change has a distinct impact on voter choices, even after accounting for ideology and region.
We use Facebook trace data and user engagement statistics (likes, comments, and shares) to examine similar questions about political ideology and concern/attention related to climate change. We examine the Facebook posts of the leaders of five political parties. We find that left-wing politicians were more likely to post about climate change, reflecting the role of ideology documented in survey research on citizens. Reflecting survey data about climate change concern and the importance of the environment in voting decisions, we document that climate change posts received higher levels of user engagement compared to other posts. This pattern was consistent across the five political leaders/parties. In sum, climate change was important in the election, whether this importance was measured through survey data or user engagement with leaders’ climate change posts. This mixed method approach offers new insights into the role of political ideology related to climate change. In particular, while right-wing political leaders may not post often about climate change, their posts yield similar levels of user engagement as other leaders’ posts.
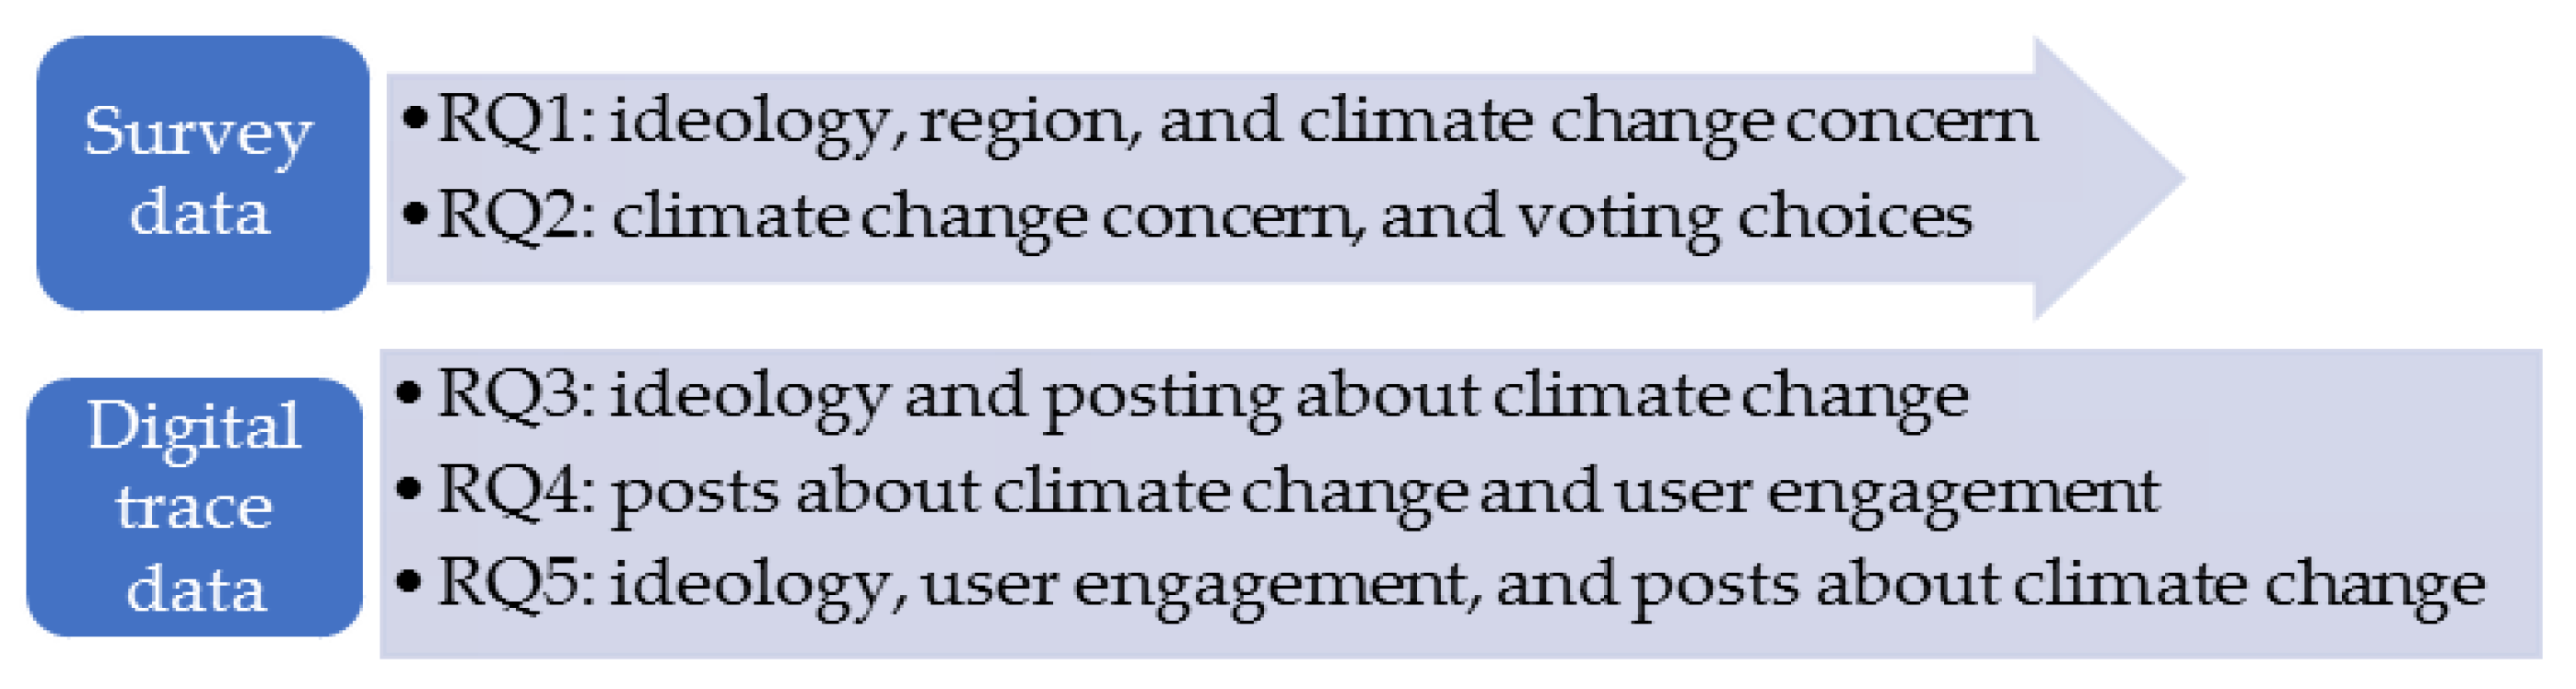
In sum, Research Question 1 examines citizens’ climate change opinions, Research Question 2 explores the connection between these opinions and voter preferences for specific parties, and Research Questions 3 to 5 are about how party leaders address climate change and how citizens’ engagement with these party posts match patterns observed in the survey about climate change opinions.
This research makes three contributions to the existing literature. One, we advance understanding of variations in climate change views in Canada, highlighting that region and political ideology are both important and offer independent effects on climate change views. Two, we document the importance of climate change and environmental attitudes in voter preferences in the lead up to the Canadian election, providing insights into electoral outcomes. Three, we use multimethods to demonstrate how political ideology influences both citizens and political leaders’ concern about/attention to climate change. Political ideology influences which party leaders post about climate change and levels of concern about climate change expressed in citizen surveys. Surveys and digital trace offer some symmetry in documenting public opinion on this topic. Climate change was a key issue in the 2019 federal election.
1.1. Environmental Concern: Ideology, Partisanship, and Region
Hornsey et al. [3] conducted a meta-analysis of 25 polls about climate change views. These polls were conducted in 56 countries and published in 171 academic studies. They conclude that political orientation is one of the strongest predictors of concern about climate change and believing that humans are the cause of climate change. They theorize that right-wing ideology does not support state intervention in the economy, preferring a laissez faire approach in economic matters. As such, right-wing leaders and citizens do not support interventions in the market to address climate change [3]. In the United States, the conservative movement has not only defended free market enterprise but also launched an attack on the scientific community, environmentalists, and liberal leaders [4].
In contemporary research, political ideology continues to be an important predictor of climate change views [5]. However, research has also explored some nuances. Ballew et al. [6] examined climate change concern and validated the Cool Dudes hypothesis: conservative white males, as a group, are less concerned about climate change, compared to other people (also see [7]). McCright and Dunlap explain that this subset of the population accepts more risk in the world because they expect to benefit from it, and therefore tends to “defend the status quo and resist attempts to change it” [7] (p. 1164). Ballew et al. [6] showed those who are conservative, white, and male are less concerned about climate change, compared to liberals, nonwhites, and females (also see [4,5,7,8,9]).
Contemporary research also explores the interaction of individual viewpoints with political and economic context. However, these studies offer conflicting findings. Unemployment rates have been considered as a predictor of concern (null: [10], significant and negative: [11,12]). Using macrodata only and the 2010 Gallup World Poll data, Knight [10] documented that countries with higher gross domestic product (GDP) per capita score higher on the perceived risk of climate change, but Kvaløy et al. [13] did not find that GDP per capita impacted climate change concern, using the World Values Survey for 47 countries. A variety of other political and economic variables have been considered. Kvaløy et al. [13] tested but did not find that CO2 emissions per capital impacted level of concern for climate change.
Continuing along those lines, we consider regional differences in views about climate change amongst Canadians. Existing research demonstrates regional differences in views about climate change in Canada [14,15,16]. Aside from documenting these regional differences, minimal research explores whether these differences might be due to political ideology, partisanship, economic factors (unemployment, wealth, emissions), or some other community or social network explanation. Lachapelle et al. [14] offered descriptive statistics for beliefs about climate change and find that respondents in the Prairie Provinces (Alberta, Saskatchewan, Manitoba) are less likely to believe in climate change. They also presented data in the same figure showing CO2 emissions by province, implying a correlation between the two variables (vs. [13]). Alberta and Saskatchewan stand out as provinces with high emissions, but Manitoba does not have high emissions, offering counter-evidence of this implied correlation [14]. In 2014, they offered an updated account pointing out the Prairie Provinces’ differences in relation to believing in the existence of solid evidence of climate change [15]. Thus, research indicates the Prairies Provinces are different, but the reasons why are not clear.
The existing Canadian research focuses on whether climate change exists and whether it is human-caused, rather than level of concern [14,16,17]. Lachapelle et al. [14,15] find that conservative supporters are the least likely to believe in the existence of solid evidence of climate change. Unfortunately, the analysis does not isolate the effects of partisanship from other possible explanations. Heath and Gifford [17] studied a single western Canadian city. Aside from age, they did not find that demographic factors (education, gender, income) influence views about climate change happening and its causes; they did not consider ideology or partisanship, despite research suggesting political affiliation is the strongest predictor of climate change views [3]. Davidson and Haan [18] considered gender and ideology in predicting beliefs about climate change occurring, human-causes of climate change, and the impacts of climate change. They also find that age impacts views about climate change [18].
While regional differences may reflect political and economic context, they may also reflect a social network or community effect that is independent of GDP or CO2 emissions. Instead, people may form political views to align with those around them [19]. In this context, living in a region where people are concerned about climate change might heighten an individual’s level of concern for this issue; citizens pick up cues from other citizens in their region and form their views accordingly. Our first research question addresses the gap in international studies about region/community effects and advances understanding of regional differences related to climate change concern in Canada.
Research Question 1. To what extent is concern about climate change driven by political ideology as opposed to regional variations?
1.2. Single Issues and Electoral Politics
Based on the Digital Democracy Project (2019), “the environment” was a key policy issue for most voters, except for Conservative Party supporters (https://ppforum.ca/articles/ddp-research-memo-1/ (accessed on 20 April 2021)). Parties varied in their environmental policy platforms in the 2019 federal election. The Conservatives offered no incentives for businesses and consumers to lower their emissions, while the Green Party proposed the opposite [20]. All major party leaders believe in climate change, but differed in how to deal with it and the ambitiousness of their proposed policies. Fringe party leader Maxine Bernier suggested climate change concern was inflated because these changes were due to natural variations rather than human causes [21]. As his party failed to secure a seat in the new Parliament, his unusual position about climate change is not a focal point in our subsequent analysis.
A citizen’s opinion on a specific issue can result in a shift in party affiliation [22] and influence how they cast their vote [23], thus driving election outcomes. The connection between issue importance and voter preference is explained by three factors: first, these attitudes are more accessible, so a voter remembers these issues when deciding how to cast their vote; second, they use the issue to decide between different candidates or parties; and third, these attitudes are often more informed and can be used in the evaluation of candidates or parties [24,25,26]. In addition, issue-based support for a political party depends on whether the party can claim ownership of that issue [26].
In the 2016 US presidential elections, different issues such as economic versus group rights and social justice issues were strongly correlated with a final vote for Republican Donald Trump [23]. In Canada, the issues that are most important to Canadians change between election cycles. In most recent decades, these issues have included two that are often at odds: the environment and the economy. Canada’s Green Party, like Australia’s, would be the niche party for climate change [25]. Other parties must tread carefully in pursuing this issue for their own agenda. However, in Canada, the Green Party has poor electoral support which makes it easier to usurp this issue from the niche party.
National polls revealed that 50% of Canadians felt that “urgent” action was needed to curb climate change [27], and most felt Canada was not doing enough to combat climate change [27]. Approximately 41% of those polled said a “serious plan to combat climate change” is a “must have” in a new leader for the Conservatives [28]. Due to the complexities of Canada’s electoral system, national sentiment is not the only factor that drives electoral outcomes. Members of Parliament are elected based on their performance in their local ridings as well as a party’s entire policy platform. Our second research question addresses how climate change opinions factored into people’s voting preferences:
Research Question 2. How important were views about climate change in voting choices in the 2019 Canadian federal election?
1.3. Political Elites, Social Media, and Climate Change
Politicians use social media posts to directly communicate with citizens. In the past, they relied on mass media to cover their election platforms and communicated with known party supporters through political rallies or mailed materials. In this context, candidates relied on political parties to help communicate, but with social media, individual candidates can now connect with individual voters [29]. These social media posts can be analyzed to determine political platforms during election campaigns [30]. While survey data have established that citizens’ political ideology predicts climate change views, we seek to advance knowledge by examining whether party ideology predicts whether a leader posts about climate change. This is important because citizens often form their views about a policy issue based on elites’ cues [11,31,32]. Using social media trace data, we examine the linkage between political ideology and posts about climate change among party leaders. Based on the abundance of survey data, we propose that left-wing party leaders would post more about climate change than right-wing party leaders.
Research Question 3. Do leaders of left-wing political parties post more about climate change, compared to other political parties?
User engagement metrics (likes, shares, comments) have been used as proxies for voting intentions [33]. Facebook offers a range of options for user engagement with posts. Not only can users “like” a post, they can express a range of emotions to the posts: sad, angry, love, wow, and haha. In addition, citizens can engage by means of sharing or commenting on a post. Gerbaudo et al. [34] (p. 4) employed these user engagement metrics as “a measure of popularity…to identify which topics attracted the most attention.” Others have employed the user engagement metrics in election prediction models. Kristensen et al. [33] (p. 2) reported that, using likes, their models “reach a prediction accuracy of between 60% and 70%.”
Electoral decisions in multiparty systems are complex, weighing party platforms and individual candidates’ personal qualifications. To increase the connection between voting intention and user engagement, we focus on a high salience issue in the election cycle. We expect that we can replicate survey data about concern/attention to climate change using the trace data. In particular, we expect to find climate change posts yielding greater user engagement (likes, shares, comments) than other types of posts. We also seek to examine whether this user engagement differs based on the political ideology of the party leader posting the message. We thus anticipate social media will replicate survey research showing climate change is ideologically polarized. In the case of social media, we expect climate change messages to resonate, and produce more engagement, when a left-wing leader posts as opposed to a right-wing leader.
Research Question 4. Do climate change posts produce greater user engagement (likes, shares, comments), compared to the other posts?
Research Question 5. Does user engagement with climate change posts differ by party/leaders’ ideology?
2. Materials and Methods
2.1. Survey Data
The survey data were collected using an online panel (n = 1545) matched to the census profile (age, gender) for Canada. Respondents had to be a minimum of 18 years old to participate in the survey. The data were collected between 27 September and 3 October 2019. Table 1 outlines the descriptive statistics. Further details about the survey sample are available here: https://www.digitalecosystem.ca/report (accessed on 20 April 2021).
Quota sampling was used to ensure the gender distribution matched estimates from Statistics Canada [35]. According to the 2016 Census Profile, 51% of Canadians were females. The variable was recoded to a binary dummy variable where 1 is female and 0 is male. Respondents were also provided with an “other” category, but given the small number we excluded these responses from our analysis. Approximately 52% of the sample (n = 1537) are female.
Quota sampling was used to ensure the age distribution matched estimates for 2016 from Statistics Canada [35]. The Canadian census and sample estimates are as follows: aged 18 to 24 years (census: 10.9%; survey: 8.5%); aged 25 to 34 years (census: 16.4%; survey: 22.9%); aged 35 to 44 years (census: 16.2%; survey: 16.7%); aged 45 years to 54 years (census: 17.9%; survey: 18.3%); and aged 55 or more (census: 38.6%; survey: 33.6%).
The education variable was recoded into two categories. Respondents with bachelor’s degree, master’s degree, professional, or doctorate are coded as 1 and everyone else is coded as zero. The online panel data are not matched to education because education is not included in the census. The data may over-represent educated people, which is why it is important to control for education in the multivariate models.
For income, respondents were asked to identify a specific amount, but if they refused, they were then offered categories. The two questions were combined and coded as follows: 1 as no income; 2 as between $1 and $30,000, continuing in $30,000 intervals. The last three groups are $110,001 to $150,000 (coded as 6), $150,000 to $200,000 (coded as 7), then $200,000 or more (coded as 8).
Given the regional variations in climate change views and voting patterns, we included a series of dummy variables to identify respondents from different regions. Respondents from Alberta or Saskatchewan were coded as a distinct group (coded 1; others coded 0). Manitoba was not included in this coding because it differs from these other two provinces, e.g., the economy is different (much lower CO2 emissions). Québec respondents were coded as a distinct group (coded 1; others coded as 0), which is a necessity when considering voter preferences as Québeckers are offered the option of voting for Bloc Québecois candidates. Moreover, Québeckers’ views about climate change may differ from other Canadians’ [36].
Respondents were asked, “In politics, people sometimes talk of left and right. Where would you place YOURSELF on this scale? Note: sometimes people refer to the left as liberal and to the right as conservative.” Respondents could specify an answer between 0 (left) and 10 (right).
Respondents were asked about their main source of information about climate change. They were offered the following options: mainstream news media, such as Global News, Globe & Mail, CBC (coded as 1), alternative media (coded as 0), scientists (coded as 0), government (coded as 0), family and friends (coded as 0), and other (coded as 0). This coding used the most popular information source as the reference category.
Respondents were asked, “Do you think that climate change is a natural occurrence or human-caused?” They were given the following response options: natural; human-caused; both equally; and climate change does not exist. Only 2% of Canadians selected the last category, which we coded as 1 along with responses about “natural causes”; all other responses were coded as 0.
Respondents were asked, “Generally speaking, how concerned are you about climate change?” Response options were 1 (not at all concerned) to 5 (very concerned).
Respondents were also asked, “How important are candidates’ positions on environmental issues when making your choice about which party to vote for?” Response options were 1 (not at all important) to 7 (very important).
Respondents’ voting preferences were gathered using a series of survey questions. People were asked which party they thought they might vote for. People who were undecided were further prompted with a question about whether they were leaning towards a party, and if so, which party. These answers were then recoded into a series of dummy variables: Liberals was one category, Conservatives was another category, and all other preferences were grouped and put into a separate category of “other”. Voting intentions have been assessed in prior studies related to climate change and elections [25].
The survey data file, analysis syntax, and SPSS output are available through Figshare, see: https://0-doi-org.brum.beds.ac.uk/10.6084/m9.figshare.14079683.v1 (accessed on 20 April 2021).
2.2. Facebook Trace Data
Given the ethical issues, it is difficult to connect a specific survey respondent to their social media activities to identify whether their concern about climate change translates into “likes” of climate change posts. As such, we concurrently collected data about Facebook engagement and survey data (Figure 1). The digital trace data were gathered using CrowdTangle—a service owned by Facebook and employed for similar purposes in previous work [30]—for the period from July 22 to October 22, 2019. We gathered all of the posts on the Facebook pages operated by leaders Andrew Scheer (Conservative), Elizabeth May (Green), Jagmeet Singh (New Democratic Party, NDP), Justin Trudeau (Liberal), and Yves-François Blanchet (Bloc Québécois, BQ). We coded the text associated with each post and did not code the images. We focused on original posted materials, rather than shared materials from other sources. We searched for the “climat” root word to identify both English and French content related to climate change. This coding approach yielded 100% agreement among three coders about the presence of climate change content in the posts.
Following existing scholarship, we keep “likes” and reactions separate from commenting and sharing, and we provide a summary statistic of all user engagement [37]. As observed by others, user engagement metrics tend to offer highly skewed distributions [37]. Thus, this violates the expectations of a normal distribution related to parametric analytical techniques. To address this issue, we use the log-transformed version of the variable. In our case of trivariate analysis, we decided to address the issue by presenting the median, rather than the mean [38].
3. Results
To answer RQ1, we conducted an ordinary least squares regression (Table 2). We find that gender, political ideology, region, and belief in the natural causes of climate change are the strongest predictors in the model. As evident from Table 2 and previous literature, female respondents express more concern, on average, about climate change than male respondents (B = 0.088). Ideology is another strong predictor of such a concern. Respondents on the right side of the political spectrum are less concerned, on average, about climate change than those on the left end (B = −0.171). Climate deniers are also less likely to be concerned about climate change (B = −0.390). Living in the Canadian prairies (Alberta/Saskatchewan) also significantly lowers one’s climate change concerns (B = −0.067) after accounting for the role of political ideology and being a climate denier. The findings offer support for regional variations offering a distinct effect on views about climate change.
As a secondary measure of concern, we also asked respondents about the importance of candidates’ environmental policy in voting decisions. Again, we find that gender, age, political ideology, location (whether the respondent lives in AB/SK), and climate denial are the strongest predictors in the model. Female respondents attach more importance to environmental policies, compared to male respondents (B = 0.109). Respondents on the right side of the political spectrum are less likely to attach importance to environmental policies compared to those on the left side (B = −0.150). Climate deniers are also less likely to attach importance to environmental issues (B = −0.257). Living in the Canadian prairies (AB/SK) also significantly lowers one’s perceived importance of environmental issues (B = −0.056). Age also impacts the perceived importance of environmental positions, with younger people attaching more importance and older people attaching less importance to environmental positions when casting their vote (B = −0.083).
To shed light on the importance of concerns about climate change in voting (RQ2), we carried out a series of logistic regression models predicting voter preferences for Liberal, Conservative, or another party (Table 3). Across all three models, ideology and concern for climate change hold significant predictive power over voting choice. Right-wing ideology increases the likelihood of voting Conservative (Exp(b) = 1.498) and reduces the likelihood of voting for Liberals (Exp(b) = 0.909) or another party (Exp(b) = 0.837). As for concern for climate change, we see a similar pattern with Conservative supporters as distinct from other party supporters. Those who are concerned about climate change are less likely to vote Conservative (Exp(b) = 0.593) and more likely to vote for Liberals (Exp(b) = 1.389) or another party (Exp(b) = 1.143). Climate change denial views did not influence voting for Conservatives or Liberals, but climate change deniers were less likely to vote for other parties, such as the NDP, Green Party, Bloc Québécois, and other parties.
Those who relied on mainstream media for their information about climate change were more likely to vote Liberal (Exp(b) = 1.616), but less likely to vote for other parties (Exp(b) = 0.695). In sum, views about climate change were significant predictors of voting intention (RQ2). We see this reflected in levels of concern about climate change, being a climate change denier, and use of mainstream news sources for climate change information. Climate change views influenced voter preferences, after accounting for ideology and region.
After accounting for ideology and climate change views, region remains a significant predictor of voting patterns. Respondents in Alberta or Saskatchewan are less likely to vote Liberal (Exp(b) = 0.494) and more likely to vote Conservative (Exp(b) = 2.235). Residents of Québec are less likely to vote Conservative (Exp(b) = 0.396) and more likely to vote for another party (Exp(b) = 1.962).
Older people are more likely to vote Conservative (Exp(b) = 1.011) compared to younger people. Higher household income is associated with a greater likelihood of voting Liberal (Exp(b) = 1.123) and lower likelihood of voting for a party other than the Liberals or Conservatives (Exp(b) = 0.835).
With the trace data, we examine the likelihood of posting about climate change as well as engagement with these Facebook posts. Between 22 July and 22 October 2019, only 130 of 2109 posts were about climate change. We find that Conservative Scheer posted the least about climate change compared to other candidates. Green May posted the most about climate change, with 26 of her 92 posts using “climat” in the message. If we think about these party extremes (right = Conservative, left = Green), then RQ3 finds some support.
Overall, user engagement is higher on climate change posts compared to posts that do not mention climate change (RQ4). As mentioned, this user engagement could be used as a proxy for the popularity of this topic. Overall, across all political leaders, posts about climate change (n = 130) received 1896 engagements (median, see Methods section), whereas posts that were not about climate change received 1204 engagements (median). We also include an analysis by type of engagement (likes/reactions, comments, and shares). The findings are similar in that climate change posts produce more user engagement than posts that do not mention climate change. The significance levels of median differences were assessed using Wilcoxon signed-rank tests (as shown in Table 4).
Our last research question is about whether engagement differs by who posts about climate change (RQ5). As mentioned in relation to RQ3, Conservative Scheer posted the least about climate change, with only two posts over this three-month period. This number makes it difficult to compare levels of engagement for the most right-wing of the five parties. The Bloc Québécois leader also had few posts (only eight). For the rest of the major parties/leaders, we do not see any significant differences in levels of user engagement based on whether the topic is about climate change. In other words, no party differences are evident in terms of user engagement on climate change. Instead, there is a broader pattern (RQ4) where all posts about climate change produce higher levels of engagement, regardless of party/leader.
4. Discussion
A meta-analysis of 25 polls about climate change views suggests that political orientation is one of the strongest predictors of climate change concern and that humans are the cause of climate change [3]. However, individuals do not form their political views in isolation from political, economic, and social factors. A handful of studies have examined how political and economic context shapes an individual’s views about climate change. However, these studies do not offer consistent evidence about the importance of unemployment rates [10,11,12] or GDP per capita on climate change views [10,13]. In Canada, we might consider CO2 emissions as an explanation of regional variations in views about climate change [14,16], but, globally, CO2 emissions per capital do not appear to impact level of concern for climate change [13]. However, this study, as well as others, demonstrates that climate change views differ across Canada [15,16]. These studies have established that the Prairie Provinces are different but focus on bivariate analysis, which cannot untangle regional variations from ideological or partisanship differences. When controlling for political ideology and climate change denial, we find that regional differences were still evident: respondents in Alberta and Saskatchewan are less concerned about climate change compared to respondents in other provinces. We explain these differences as a social network or community effect that is independent of GDP, CO2, ideology, or partisanship. Instead, people form their political views to align with those around them [19]. In this context, being in a region where people are concerned about climate change increases one’s level of concern. Alternatively, living in a region where climate change is of low concern might impact one’s views about the importance of climate change. We observed these regional effects after accounting for political ideology.
Prior research focuses on the existence of climate change or whether humans are causing climate change [14,16,17]. This study addresses an important gap by examining the perceived importance of climate change, as measured by level of concern about climate change. Public concern about climate change speaks to issue salience, which in the context of a federal election can impact voter preferences. As Fournier et al. [24] outline, issue importance offers a readily available cue on which to judge candidates and make voting decisions. Climate change views had a major impact on voting patterns in the Canadian election, after accounting for region and ideology. We cannot directly attribute this level of concern with the climate strikes across the globe and across Canada, but these strikes may have played some role in the salience of this issue. The climate strikes gave politicians an opportunity to outline their climate change plans. However, politicians’ posts may also have influenced the perceived importance of this issue among citizens. Public opinion research shows that elite cues are important for public opinion [11,31,32].
Concern about climate change was an important factor with respect to whether respondents planned to vote Liberal, Conservative, or for some other party. None of the five major party leaders denied climate change. Respondents who denied climate change were not more or less likely to vote Conservative or Liberal. The key question is about issue salience—to what degree does climate change impact one’s choice of parties to vote for? Accounting for ideology and regional variations in partisanship, climate change concern had a distinct and important impact on voter preferences. As observed with other issues, a citizen’s opinion on a specific issue can influence who they vote for [23], thus driving election outcomes. In Canada, the deciding issues vary by election cycles, but the environment and the economy are key factors. In 2019, opinions about the environment, as indicated by climate change views, determined voter preferences.
Further research should examine whether this outcome is specific to Canada or whether the pressure to adhere to the Paris Agreement and the year-long climate strikes influence other election outcomes. In particular, how do views about climate change factor into voting decisions in the 2020 US presidential election or the 2021 national elections in Germany? These countries are important players in climate change policy and popular locations of climate strike protests [39]. Another suggested line of research is to directly test the role of social networks or community effects. Surveys could ask questions about friend and neighbors’ views about climate change and whether a respondent’s views align with those of their community. Regional or community effects could also be indicative of experiences of natural disasters due to climate change [40]. Further research might consider whether a particular region has been impacted by such disasters and whether these disasters impact the prominence of climate change in one’s voting decisions.
In other studies, education affects the likelihood of believing in the existence of climate change [4,6,7,8]. However, education impacts views about climate change’s existence, more so than concern [4,5,6]. Specifically, Ballew et al. [6] used US data from 2008 to 2017, finding that the coefficient for education and climate change concern is 0.04 on a standardized scale ranging from zero to one. This is a small effect. Other studies do not find an effect of education on concern about climate change [4,9,18]. Likewise, we did not find that education influences concern about climate change or using the environment as a deciding factor in one’s vote. We also did not find educational differences in voter preferences.
5. Conclusion
In sum, we used two datasets to document the importance of climate change in the 2019 Canadian federal election. We used survey data as well as engagement with politicians’ climate change posts on Facebook. The combination of sources is important for addressing the limitations of any single method. In particular, we see symmetry in this concurrently collected data. While existing research clearly establishes the importance of political ideology in predicting climate change views, we offer some nuances when it comes to elites and political ideology. In particular, right-wing candidates (Conservative Scheer) were the least likely to post, and left-wing candidates were the most likely to post (Green May) about climate change. However, we did not see differences in engagement based on who posts. The failure to see significant differences could be a function of sample size, or it could speak to the importance of this issue among all citizens. At the very least, the findings offer caution about the growing narrative of political polarization, as we did not find evidence of polarization in Canada about climate change in the context of the 2019 federal election.
Author Contributions
Conceptualization, S.B. (Shelley Boulianne); literature review, S.B. (Shelley Boulianne), S.B. (Stephanie Belland); methodology, S.B. (Shelley Boulianne); formal analysis, N.S., A.O.L., S.B. (Shelley Boulianne); data curation, A.O.L. for trace data; writing—original draft preparation, all authors; writing—review and editing, S.B. (Shelley Boulianne); project administration, S.B. (Shelley Boulianne); funding acquisition, S.B. (Shelley Boulianne), A.O.L. All authors have read and agreed to the published version of the manuscript.
Funding
This work was made possible [in part] by an award from the Digital Ecosystem Research Challenge, funded in part by the Government of Canada.
Institutional Review Board Statement
The digital trace data is in the public domain and does not require human ethics review. The survey data collection was conducted by Eric Merkley at the University of Toronto. The authors of this paper are secondary users of the data, as per Canada’s Tri-council Policy Statement: Ethical Conduct for Research Involving Humans. We received a subset of the anonymous data file for our analysis. The data are shared with other researchers as per the data-sharing agreement arranged through the Digital Ecosystem Research Challenge.
Data Availability Statement
The survey data file, analysis syntax, and SPSS output are available through Figshare, see: https://0-doi-org.brum.beds.ac.uk/10.6084/m9.figshare.14079683.v1 (accessed on 20 April 2021).
Conflicts of Interest
The authors declare no conflict of interest. The funders had no role in the design of the study; in the collection, analyses, or interpretation of data; in the writing of the manuscript, or in the decision to publish the results.
References
- Wike, R. What the World Thinks about Climate Change in 7 Charts. Pew Research Center. Available online: https://www.pewresearch.org/ (accessed on 27 January 2019).
- Warren, M. Thousands of scientists back kids’ climate strike. Nature 2019, 567, 291–292. [Google Scholar] [CrossRef]
- Hornsey, M.J.; Harris, E.A.; Bain, P.G.; Fielding, K.S. Meta-analyses of the determinants and outcomes of belief in climate change. Nat. Clim. Chang. 2016, 6, 622–627. [Google Scholar] [CrossRef] [Green Version]
- McCright, A.M.; Dunlap, R.E. Cool dudes: The denial of climate change among conservative white males in the United States. Glob. Environ. Chang. 2011, 21, 1163–1172. [Google Scholar] [CrossRef]
- Benegal, S.D. The spillover of race and racial attitudes into public opinion about climate change. Environ. Politics 2018, 27, 733–756. [Google Scholar] [CrossRef]
- Ballew, M.T.; Pearson, A.R.; Goldberg, M.H.; Rosenthal, S.A.; Leiserowitz, A. Does socioeconomic status moderate the political divide on climate change? The roles of education, income, and individualism. Glob. Environ. Chang. 2020, 60, 102024. [Google Scholar] [CrossRef]
- McCright, A.M.; Dunlap, R.E. The politicization of climate change and polarization in the American public’s views of global warming, 2001–2010. Sociol. Q. 2011, 52, 155–194. [Google Scholar] [CrossRef]
- Krange, O.; Kaltenborn, B.P.; Hultman, M. Cool dudes in Norway: Climate change denial among conservative Norwegian men. Environ. Sociol. 2019, 5, 1–11. [Google Scholar] [CrossRef]
- Kellstedt, P.M.; Zahran, S.; Vedlitz, A. Personal efficacy, the information environment, and attitudes toward global warming and climate change in the United States. Risk Anal. 2008, 28, 113–126. [Google Scholar] [CrossRef]
- Knight, K. Public awareness and perception of climate change: A quantitative cross-national study. Environ. Sociol. 2016, 1, 101–113. [Google Scholar] [CrossRef]
- Sohlberg, J. The effect of elite polarization: A comparative perspective on how party elites influence attitudes and behavior on climate change in the European Union. Sustainability 2017, 9, 39. [Google Scholar] [CrossRef] [Green Version]
- Benegal, S. The impact of unemployment and economic risk perceptions on attitudes towards anthropogenic climate change. J. Environ. Stud. Sci. 2018, 8, 300–311. [Google Scholar] [CrossRef]
- Kvaløy, B.; Finseraas, H.; Listhaug, O. The publics’ concern for global warming: A cross-national study of 47 countries. J. Peace Res. 2012, 49, 11–22. [Google Scholar] [CrossRef]
- Lachapelle, E.; Borick, C.P.; Rabe, B. Public attitudes toward climate science and climate policy in federal systems: Canada and the United States compared. Rev. Policy Res. 2012, 29, 334–357. [Google Scholar] [CrossRef] [Green Version]
- Lachapelle, E.; Borick, C.P.; Rabe, B. Public Opinion on Climate Change and Support for Various Policy Instruments in Canada and the US: Findings from a Comparative 2013 Poll; The Center for Local, State and Urban Policy: Ann Arbor, MI, USA, 2014; p. 11. Available online: http://closup.umich.edu/issues-in-energy-and-environmental-policy/11/public-opinion-on-climate-change-and-support-for-various-policy-instruments-in-canada-and-the-us (accessed on 20 April 2021).
- Mildenberger, M.; Howe, P.; Lachapelle, E.; Stokes, L.; Marlon, J.; Gravelle, T. The distribution of climate change public opinion in Canada. PLoS ONE 2016, 11, e0159774. [Google Scholar] [CrossRef] [PubMed]
- Heath, Y.; Gifford, R. Free-market ideology and environmental degradation: The case of belief in global climate change. Environ. Behav. 2006, 38, 48–71. [Google Scholar] [CrossRef]
- Davidson, D.J.; Haan, M. Gender, political ideology, and climate change beliefs in an extractive industry community. Popul. Environ. 2012, 34, 217–234. [Google Scholar] [CrossRef]
- Huckfeldt, R.; Beck, P.A.; Dalton, R.J.; Levine, J. Political environments, cohesive social groups, and the communication of public opinion. Am. J. Political Sci. 1995, 39, 1025–1054. [Google Scholar] [CrossRef]
- McCarthy, S.; Walsh, M. Federal Election 2019: Where the Four Main Parties Stand on Climate Policy. The Globe and Mail. Available online: https://www.theglobeandmail.com/ (accessed on 27 January 2021).
- Bernier, M. Commentary by Maxime Bernier: Reject Global Warming Alarmism. Times Colonist. Available online: https://www.timescolonist.com/opinion/op-ed/commentary-by-maxime-bernier-reject-global-warming-alarmism-1.23978027 (accessed on 27 January 2021).
- Schmidt, M.B. Voting with the crowd: Do single issues drive partisanship? Appl. Econ. 2013, 45, 1691–1700. [Google Scholar] [CrossRef]
- Blankenship, B.T.; Savaş, Ö.; Frederick, J.K.; Stewart, A.J. Piecing together the American voting puzzle: How voters’ personalities and judgements of issue importance mattered in the 2016 presidential election. Anal. Soc. Issues Public Policy 2018, 18, 172–197. [Google Scholar] [CrossRef]
- Fournier, P.; Blais, A.; Nadeau, R.; Gidengil, E.; Nevitte, N. Issue importance and performance voting. Political Behav. 2003, 25, 51–67. [Google Scholar] [CrossRef]
- Barber, G.; Klassen, A. Climate change, the Australian Greens, and dynamics of party competition across five national elections in Australia. Aust. J. Political Sci. 2021, 56, 56–72. [Google Scholar] [CrossRef]
- Meguid, B.M. Party Competition between Unequals: Strategies and Electoral Fortunes in Western Europe; Cambridge University Press: New York, NY, USA, 2008. [Google Scholar]
- Abacus Data. 1 in 2 Canadians Say Action to Reduce Climate Change is “Urgent”. Graph Illustration of Abacus Data on International Climate Change Concern. Available online: https://abacusdata.ca/1-in-2-canadians-say-action-to-reduce-emissions-is-urgent/ (accessed on 27 January 2021).
- Grenier, E. Andrew Scheer’s Climate Plan Speaks to a Smaller Audience: Conservatives. CBC News. Available online: https://www.cbc.ca/news (accessed on 27 January 2021).
- Blumler, J.G. The fourth age of political communication. Polit. Commun. 2016, 6, 19–30. [Google Scholar] [CrossRef]
- Larsson, A.O. Right-wingers on the rise online: Insights from the 2018 Swedish elections. New Media Soc. 2020, 22, 2108–2127. [Google Scholar] [CrossRef]
- Birch, S. Political polarization and environmental attitudes: A cross-national analysis. Environ. Politics 2020, 29, 697–718. [Google Scholar] [CrossRef]
- Zaller, J. The Nature and Origins of Mass Opinion; Cambridge University Press: Cambridge, UK, 1992. [Google Scholar]
- Kristensen, J.B.; Albrechtsen, T.; Dahl-Nielsen, E.; Jensen, M.; Skovrind, M.; Bornakke, T. Parsimonious data: How a single Facebook like predicts voting behavior in multiparty systems. PLoS ONE 2017, 12, e0184562. [Google Scholar] [CrossRef] [Green Version]
- Gerbaudo, P.; Marogna, F.; Alzetta, C. When “positive posting” attracts voters: User engagement and emotions in the 2017 UK election campaign on Facebook. Soc. Media Soc. 2019, 5, 1–11. [Google Scholar] [CrossRef]
- Statistics Canada. 2016 Census of Population—Age and Sex. Available online: https://www12.statcan.gc.ca/datasets/Index-eng.cfm?Temporal=2016&Theme=115&VNAMEE=&GA=-1&S=0 (accessed on 27 January 2021).
- Turcotte, A.; Raynauld, V. Divide et impera: Wedge politics in the 2019 Canadian federal election. In Political Marketing in the 2019 Canadian Federal Election; Gillies, J., Raynauld, V., Turcotte, A., Eds.; Springer: Berlin/Heidelberg, Germany, 2021; pp. 127–140. [Google Scholar] [CrossRef]
- Kim, C.; Yang, S.U. Like, comment, and share on Facebook: How each behavior differs from the other. Public Relat. Rev. 2017, 43, 441–449. [Google Scholar] [CrossRef]
- Raynauld, V.; Greenberg, J. Tweet, click, vote: Twitter and the 2010 Ottawa municipal election. J. Inf. Technol. Politics 2014, 11, 412–434. [Google Scholar] [CrossRef]
- Boulianne, S.; Lalancette, M.; Ilkiw, D. “School Strike 4 Climate”: Social media and the international youth protest on climate change. Media Commun. 2020, 8, 208–218. [Google Scholar] [CrossRef]
- Haney, T.; McDonald-Harker, C. ‘The river is not the same anymore’: Environmental risk and uncertainty in the aftermath of the High River, Alberta, flood. Soc. Curr. 2017, 4, 594–612. [Google Scholar] [CrossRef] [Green Version]
Figure 1.
Methodological framework.


Table 1.
Descriptive Statistics.
| Min and Max | Mean | St.Dev | Valid n | |
|---|---|---|---|---|
| Independent variables | ||||
| Females | 1 = Females; 0 = Males | .524 | 1537 | |
| Age | 18; 91 | 46.39 | 16.62 | 1545 |
| Post-secondary education | 1 = Yes; 0 = No | .732 | 1545 | |
| Household income | 1 = No income; 8 = More than $200 K | 3.64 | 1.52 | 1462 |
| Region Prairie (Alberta = 1, Sask = 1) Québec = 1 | 1 = Yes; 0 = No 1 = Yes; 0 = No | .148 .233 | 1545 1545 | |
| Ideology | 0 = Left; 10 = Right | 5.03 | 2.43 | 1332 |
| Mainstream news | 1 = Yes; 0 = No | .406 | 1545 | |
| Climate change denier | 1 = Naturally caused or does not exist; 0 = Other | .139 | 1545 | |
| Dependent variables | ||||
| Environment in voting | 1 = Not at all; 7 = Very | 4.94 | 1.55 | 1545 |
| Concern about climate change | 1 = Not at all; 5 = Very | 3.72 | 1.16 | 1545 |
| Plan to vote Liberal | 1 = Yes; 0 = No | .310 | 1545 | |
| Plan to vote Conservative | 1 = Yes; 0 = No | .277 | 1545 | |
| Plan to vote for another party | 1 = Yes; 0 = No | .413 | 1545 |
Table 2.
OLS regression on concern about climate change and the environment in voting decisions.
| Concern about Climate Change | Environment in Voting Decisions | |||||||
|---|---|---|---|---|---|---|---|---|
| b | Std. Error | B | p | B | Std. Error | B | p | |
| Female | 0.199 | 0.058 | 0.088 | .001 | 0.327 | 0.082 | 0.109 | .000 |
| Age | −0.003 | 0.002 | −0.040 | .128 | −0.007 | 0.003 | −0.083 | .003 |
| Post-secondary Education | −0.043 | 0.068 | −0.016 | .529 | −0.004 | 0.095 | −0.001 | .968 |
| Income | 0.003 | 0.019 | 0.004 | .874 | 0.003 | 0.026 | 0.003 | .913 |
| Prairie (AB or SK) | −0.215 | 0.081 | −0.067 | .008 | −0.236 | 0.114 | −0.056 | .039 |
| Québec | 0.064 | 0.069 | 0.023 | .357 | −0.048 | 0.097 | −0.013 | .623 |
| Ideology | −0.080 | 0.012 | −0.171 | .000 | −0.092 | 0.017 | −0.150 | .000 |
| Mainstream news | −0.025 | 0.059 | −0.011 | .674 | −0.037 | 0.082 | −0.012 | .651 |
| Climate change denier | −1.245 | 0.083 | −0.390 | .000 | −1.081 | 0.116 | −0.257 | .000 |
| Model characteristics | n = 1262 | r-square .246 | n = 1262 | r-square .147 | ||||
Table 3.
Logistic regression on plans to vote for Liberals, Conservatives, and Other parties.
| Voting Liberal | Voting Conservatives | Voting Other Parties | ||||||||||
|---|---|---|---|---|---|---|---|---|---|---|---|---|
| b | Std. Error | Odds Ratio Exp(b) | p | b | Std. Error | Odds Ratio Exp(b) | p | b | Std. Error | Odds Ratio Exp(b) | p | |
| Female | −0.106 | 0.130 | 0.899 | 0.415 | −0.197 | 0.152 | 0.821 | 0.195 | 0.242 | 0.130 | 1.274 | 0.062 |
| Age | −0.006 | 0.004 | 0.994 | 0.116 | 0.011 | 0.005 | 1.011 | 0.018 | −0.002 | 0.004 | 0.998 | 0.595 |
| Post-secondary education | −0.011 | 0.154 | 0.989 | 0.941 | 0.107 | 0.178 | 1.113 | 0.547 | −0.085 | 0.150 | 0.918 | 0.570 |
| Income | 0.116 | 0.041 | 1.123 | 0.005 | 0.086 | 0.048 | 1.090 | 0.075 | −0.180 | 0.043 | 0.835 | <0.001 |
| Prairie (AB or SK) | −0.706 | 0.200 | 0.494 | <0.001 | 0.804 | 0.201 | 2.235 | <0.001 | −0.062 | 0.188 | 0.940 | 0.742 |
| Québec | −0.070 | 0.151 | 0.932 | 0.643 | −0.927 | 0.201 | 0.396 | <0.001 | 0.674 | 0.149 | 1.962 | <0.001 |
| Ideology | −0.095 | 0.027 | 0.909 | <0.001 | 0.404 | 0.037 | 1.498 | <0.001 | −0.178 | 0.027 | 0.837 | <0.001 |
| Mainstream news | 0.480 | 0.129 | 1.616 | <0.001 | −0.156 | 0.154 | 0.856 | 0.312 | −0.364 | 0.131 | 0.695 | 0.005 |
| Climate change denier | 0.055 | 0.213 | 1.057 | 0.795 | 0.176 | 0.208 | 1.193 | 0.397 | −0.454 | 0.220 | 0.635 | 0.039 |
| Concern about climate change | 0.329 | 0.067 | 1.389 | <0.001 | −0.523 | 0.070 | 0.593 | <0.001 | 0.133 | 0.065 | 1.143 | 0.040 |
| Model characteristics | n = 1262 | r-square .101 | n = 1262 | r-square .361 | n = 1262 | r-square .149 | ||||||
Table 4.
Engagement with Social Media Posts.
| Right | Left | ||||||
|---|---|---|---|---|---|---|---|
| Andrew Scheer, Conservative | Justin Trudeau, Liberals | Yves-François Blanchet, BQ | Jagmeet Singh, NDP | Elizabeth May, Green | Totals | ||
| Facebook posts | cc/total | 2/774 = 0.3% | 65/559 = 11.6% | 8/376 = 2.1% | 29/308 = 9.4% | 26/92 = 28.3% | 130/2109 = 6.2% |
| Sum of all engagement | cc | 3497 | 528,783 | 3323 | 60,235 | 42,080 | 637,918 |
| Not cc | 1,875,705 | 5,198,288 | 119,946 | 749,809 | 126,778 | 8,070,526 | |
| Median engagement per post | cc | 1748 | 5570 | 267 | 1043 | 1318 | 1896 |
| Not cc | 1231 1 | 5514 5 | 242 9 | 1251 13 | 1162 17 | 1204 21 | |
| Median likes/ reactions | cc | 1184 | 3987 | 192 | 895 | 988 | 1422 |
| Not cc | 862 2 | 4356 6 | 182 10 | 1050 14 | 828 18 | 953 22 | |
| Median comments | cc | 84.5 | 650 | 16 | 48 | 84.5 | 170 |
| Not cc | 98 3 | 607 7 | 14 11 | 51 15 | 75 19 | 93 23 | |
| Median shares | cc | 480 | 216 | 45.5 | 113 | 259 | 190 |
| Not cc | 173 4 | 262 8 | 35.5 12 | 96 16 | 219 20 | 117 24 | |
Cells containing significant median differences between posts mentioning climate change (cc) or not mentioning climate change (Not cc) as indicated by Wilcoxon signed-rank tests are marked in grey. 1 = W = 943, p-value = 0.5892; 2 = W = 946.5, p-value = 0.5816; 3 = W = 1030.5, p-value = 0.4139; 4 = W = 811.5, p-value = 0.9017; 5 = W = 16798, p-value = 0.5439; 6 = W = 16862, p-value = 0.5103; 7 = W = 15646, p-value = 0.7389; 8 = W = 16424, p-value = 0.7637; 9 = W = 1298, p-value = 0.5683; 10 = W = 1315, p-value = 0.6068; 11 = W = 1343.5, p-value = 0.6737; 12 = W = 1185, p-value = 0.3461; 13 = W = 4243, p-value = 0.6659; 14 = W = 4342, p-value = 0.5165; 15 = W = 3991, p-value = 0.9058; 16 = W = 3754, p-value = 0.5234; 17 = W = 815, p-value = 0.7125; 18 = W = 822.5, p-value = 0.7615; 19 = W = 763.5, p-value = 0.415; 20 = W = 783, p-value = 0.5183; 21 = W = 101092, p-value = 0.00004222; 22 = W = 100496, p-value = 0.00002869; 23 = W = 99613, p-value = 0.00001596; 24 = W = 107632, p-value = 0.001792.
Publisher’s Note: MDPI stays neutral with regard to jurisdictional claims in published maps and institutional affiliations. |
© 2021 by the authors. Licensee MDPI, Basel, Switzerland. This article is an open access article distributed under the terms and conditions of the Creative Commons Attribution (CC BY) license (https://creativecommons.org/licenses/by/4.0/).
Share and Cite
MDPI and ACS Style
Boulianne, S.; Belland, S.; Sleptcov, N.; Larsson, A.O. Climate Change in the 2019 Canadian Federal Election. Climate 2021, 9, 70. https://0-doi-org.brum.beds.ac.uk/10.3390/cli9050070
AMA Style
Boulianne S, Belland S, Sleptcov N, Larsson AO. Climate Change in the 2019 Canadian Federal Election. Climate. 2021; 9(5):70. https://0-doi-org.brum.beds.ac.uk/10.3390/cli9050070
Chicago/Turabian StyleBoulianne, Shelley, Stephanie Belland, Nikita Sleptcov, and Anders Olof Larsson. 2021. "Climate Change in the 2019 Canadian Federal Election" Climate 9, no. 5: 70. https://0-doi-org.brum.beds.ac.uk/10.3390/cli9050070
Note that from the first issue of 2016, this journal uses article numbers instead of page numbers. See further details here.