
An Alternative Co-Benefit Framework Prioritizing Health Impacts: Potential Air Pollution and Climate Change Mitigation Pathways through Energy Sector Fuel Substitution in South Korea


Abstract
:1. Introduction
2. Materials and Methods
3. Results
4. Discussion and Conclusions
Author Contributions
Funding
Institutional Review Board Statement
Informed Consent Statement
Data Availability Statement
Acknowledgments
Conflicts of Interest
Appendix A

| Ischemic Heart Disease, Male | Ischemic Heart Disease, Female | Stroke, Male | Stroke, Female | COPD, Male | COPD, Female | Lung Cancer, Male | Lung Cancer, Female | |
|---|---|---|---|---|---|---|---|---|
| 30–34 years old | 2.3 | 0.2 | 1.8 | 1.6 | 0.2 | 0.1 | 0.2 | 0.3 |
| 35–39 years old | 4.1 | 0.5 | 4.5 | 2.5 | 0.2 | 0.1 | 1.0 | 0.6 |
| 40–44 years old | 6.4 | 0.9 | 8.2 | 4.3 | 0.2 | 0.1 | 3.2 | 2.3 |
| 45–49 years old | 12.6 | 1.7 | 12.8 | 6.9 | 0.4 | 0.3 | 6.6 | 4.0 |
| 50–54 years old | 21.9 | 2.3 | 22.0 | 9.6 | 1.4 | 0.6 | 13.0 | 7.3 |
| 55–59 years old | 28.3 | 4.1 | 31.1 | 13.1 | 3.5 | 0.6 | 34.5 | 11.8 |
| 60–64 years old | 42.8 | 8.3 | 45.0 | 17.9 | 8.0 | 2.1 | 75.1 | 22.2 |
| 65–69 years old | 62.4 | 15.7 | 75.9 | 33.3 | 21.5 | 4.0 | 157.8 | 34.6 |
| 70–74 years old | 98.8 | 34.0 | 128.9 | 65.2 | 45.9 | 10.3 | 264.1 | 55.4 |
| 75–79 years old | 174.9 | 96.4 | 294.9 | 166.5 | 123.4 | 23.0 | 446.7 | 89.3 |
| 80 years or older | 437.3 | 352.2 | 702.8 | 603.7 | 397.8 | 140.8 | 674.1 | 174.8 |
References
- World Health Organisation (WHO). Ambient Air Pollution. Available online: https://www.who.int/teams/environment-climate-change-and-health/air-quality-and-health/ambient-air-pollution (accessed on 3 January 2021).
- Cohen, A.J.; Brauer, M.; Burnett, R.; Anderson, H.R.; Frostad, J.; Estep, K.; Balakrishnan, K.; Brunekreef, B.; Dandona, L.; Dandona, R.; et al. Estimates and 25-Year Trends of the Global Burden of Disease Attributable to Ambient Air Pollution: An Analysis of Data from the Global Burden of Diseases Study 2015. Lancet 2017, 389, 1907–1918. [Google Scholar] [CrossRef] [Green Version]
- European Environmental Agency (EEA). Air Quality in Europe—2018 Report No. 12/2018; European Environmental Agency (EEA): Copenhagen, Denmark, 2018. [Google Scholar] [CrossRef]
- Sicard, P.; Agathokleous, E.; De Marco, A.; Paoletti, E.; Calatayud, V. Urban Population Exposure to Air Pollution in Europe over the Last Decades. Environ. Sci. Eur. 2021, 33, 28. [Google Scholar] [CrossRef] [PubMed]
- Environmental Protection Agency (EPA). Particulate Matter (PM) Basics. Available online: https://www.epa.gov/pm-pollution/particulate-matter-pm-basics (accessed on 14 January 2021).
- Burnett, R.T.; Pope, C.A.; Ezzati, M.; Olives, C.; Lim, S.S.; Mehta, S.; Shin, H.H.; Singh, G.; Hubbell, B.; Brauer, M.; et al. An Integrated Risk Function for Estimating the Global Burden of Disease Attributable to Ambient Fine Particulate Matter Exposure. Environ. Health Perspect. 2014, 122, 397–403. [Google Scholar] [CrossRef] [PubMed]
- OECD. The Economic Consequences of Outdoor Air Pollution; OECD: Paris, France, 2016; Available online: www.oecd.org/environment/the-economic-consequences-of-outdoor-air-pollution-%0A9789264257474-en.htm (accessed on 8 December 2020).
- WHO. Ambient Air Pollution: A Global Assessment of Exposure and Burden of Disease; World Health Organization: Geneva, Switzerland, 2016. [Google Scholar]
- WHO. WHO Air Quality Guidelines for Particulate Matter, Ozone, Nitrogen Dioxide and Sulfur Dioxide; World Health Organization: Geneva, Switzerland, 2005. [Google Scholar]
- OECD. Air Quality and Health: Exposure to PM2.5 Fine Particles—Countries and Regions; OECD Environment Statistics: Paris, France, 2020. [Google Scholar] [CrossRef]
- Yoon, H. Effects of Particulate Matter (PM10) on Tourism Sales Revenue: A Generalized Additive Modeling Approach. Tour. Manag. 2019, 74, 358–369. [Google Scholar] [CrossRef]
- Choi, Y.; Yoon, H.; Kim, D. Where Do People Spend Their Leisure Time on Dusty Days? Application of Spatiotemporal Behavioral Responses to Particulate Matter Pollution. Ann. Reg. Sci. 2019, 63, 317–339. [Google Scholar] [CrossRef]
- Jeon, H.S.; Lee, S.; Lee, J.; Chun, J.S. Impacts of Multilevel Factors on Depressive Symptoms among Adolescents in South Korea. Child. Youth Serv. Rev. 2020, 119, 105591. [Google Scholar] [CrossRef]
- Intergovernmental Panel on Climate Change (IPCC). Climate Change 2014: Synthesis Report. Contribution of Working Groups I, II and III to the Fifth Assessment Report of the Intergovernmental Panel on Climate; IPCC: Geneva, Switzerland, 2014; Available online: https://www.ipcc.ch/report/ar5/syr/ (accessed on 24 February 2021).
- OECD. Ancillary Benefits and Costs of Greenhouse Gas Mitigation; OECD: Paris, France, 2000. [Google Scholar] [CrossRef]
- Parry, I.; Veung, C.; Heine, D. How Much Carbon Pricing Is in Countries’ Own Interests? The Critical Role of Co-Benefits. Clim. Chang. Econ. 2015, 6, 1550019. [Google Scholar] [CrossRef] [Green Version]
- Air Pollution No. 1 Environmental Concern for Koreans: Survey; The Korea Times: Seoul, Korea, 2020; Available online: https://www.koreatimes.co.kr/www/nation/2020/07/371_292668.html (accessed on 4 September 2020).
- Polled Citizens, Experts Prioritize Fine Dust in Environmental Policies; The Korea Times: Seoul, Korea, 2020; Available online: https://www.koreatimes.co.kr/www/nation/2020/06/371_291148.html (accessed on 4 September 2020).
- Ministry of Trade Industry and Energy Republic of Korea. The 9th Basic Plan for Long-Term Electricity Supply and Demand; Ministry of Trade Industry and Energy Republic of Korea: Sejong, Korea, 2020. Available online: http://www.motie.go.kr/motie/ne/presse/press2/bbs/bbsView.do?bbs_seq_n=163670&bbs_cd_n=81 (accessed on 25 January 2021).
- LEAP Introduction. Available online: https://leap.sei.org/default.asp?action=introduction (accessed on 9 October 2020).
- Stockholm Environment Institute (SEI). The Long-Range Energy Alternatives Planning-Integrated Benefits Calculator (LEAP-IBC) Key Features in LEAP-IBC; Stockholm Environment Institute: Stockholm, Sweden, 2017; Available online: https://mediamanager.sei.org/documents/Publications/SEI-Factsheet-LEAP-IBC-2.pdf (accessed on 21 September 2020).
- IIASA ECLIPSE V5a Global Emission Fields. Available online: https://iiasa.ac.at/web/home/research/researchPrograms/air/ECLIPSEv5a.html (accessed on 17 February 2021).
- Henze, D.K.; Hakami, A.; Seinfeld, J.H. Development of the Adjoint of GEOS-Chem. Atmos. Chem. Phys. 2007, 7, 2413–2433. [Google Scholar] [CrossRef] [Green Version]
- Kuylenstierna, J.C.I.; Heaps, C.G.; Ahmed, T.; Vallack, H.W.; Hicks, W.K.; Ashmore, M.R.; Malley, C.S.; Wang, G.; Lefevre, E.N.; Anenberg, S.C.; et al. Development of the Low Emissions Analysis Platform—Integrated Benefits Calculator (LEAP-IBC) Tool to Assess Air Quality and Climate Co-Benefits: Application for Bangladesh. Environ. Int. 2020, 145, 106155. [Google Scholar] [CrossRef] [PubMed]
- Nakarmi, A.M.; Sharma, B.; Rajbhandari, U.S.; Prajapati, A.; Malley, C.S.; Kuylenstierna, J.C.I.; Vallack, H.W.; Henze, D.K.; Panday, A. Mitigating the Impacts of Air Pollutants in Nepal and Climate Co-Benefits: A Scenario-Based Approach. Air Qual. Atmos. Health 2020, 13, 361–370. [Google Scholar] [CrossRef] [Green Version]
- Park, N.B.; Yun, S.J.; Jeon, E.C. An Analysis of Long-Term Scenarios for the Transition to Renewable Energy in the Korean Electricity Sector. Energy Policy 2013, 52, 288–296. [Google Scholar] [CrossRef]
- Hong, J.H.; Kim, J.; Son, W.; Shin, H.; Kim, N.; Lee, W.K.; Kim, J. Long-Term Energy Strategy Scenarios for South Korea: Transition to a Sustainable Energy System. Energy Policy 2019, 127, 425–437. [Google Scholar] [CrossRef]
- Lee, S.; Park, J.W.; Song, H.J.; Maken, S.; Filburn, T. Implication of CO2 Capture Technologies Options in Electricity Generation in Korea. Energy Policy 2008, 36, 326–334. [Google Scholar] [CrossRef]
- Korean Statistical Information Service (KOSIS). Deaths and Death Rates by Cause (236 Item), Sex, and Age (by Five-Year Age Group); Korean Statistical Information Service (KOSIS): Daejeon, Korea, 2020; Available online: https://kosis.kr/eng/ (accessed on 25 December 2020).
- United Nations Department of Economic and Social Affairs. World Population Prospect 2019: Population by Age Groups—Both Sexes 2019; United Nations: New York, NY, USA, 2019. [Google Scholar]
- Korean Statistical Information Service (KOSIS). Complete Life Tables; Korean Statistical Information Service (KOSIS): Daejeon, Korea, 2020; Available online: https://kosis.kr/statHtml/statHtml.do?orgId=101&tblId=DT_1B42 (accessed on 10 November 2020).
- Korean Energy Economics Institute (KEEI). Monthly Energy Statistics 2020/12; Korean Energy Economics Institute: Ulsan, Korea, 2020; Available online: http://www.kesis.net/sub/sub_0003.jsp (accessed on 11 February 2021).
- IPCC. IPCC Guidelines for National Greenhouse Gas Inventories Stationary Combustion; IPCC: Geneva, Switzerland, 2006; Volume 2. [Google Scholar] [CrossRef]
- EEA; Berdowski, J.J.M.; Verhoeve, P. EEA Combustion in Energy and Transformation Industries; European Environment Agency: Copenhagen, Denmark, 2016; pp. 1–124. [Google Scholar]
- Bond, T.C.; Streets, D.G.; Yarber, K.F.; Nelson, S.M.; Woo, J.H.; Klimont, Z. A Technology-Based Global Inventory of Black and Organic Carbon Emissions from Combustion. J. Geophys. Res. Atmos. 2004, 109, 1–43. [Google Scholar] [CrossRef] [Green Version]
- Battye, R.; Battye, W.; Overcash, C.; Fudge, S. Development and Selection of Ammonia Emission Factors. In EPA Contract 68-D3 0034; EPA: Research Triangle Park, NC, USA, 1994; pp. 1–111. [Google Scholar]
- Ministry of Trade, industry and Energy (MOTIE). Third Energy Master Plan; Ministry of Trade, Industry and Energy: Sejong, Korea, 2019.
- National Center for Fine Dust Information, Emissions by Sector. Available online: https://airemiss.nier.go.kr (accessed on 26 December 2020).
- Korea Electric Power Corporation KEPCO. 2020 KEPCO in Brief; Korea Electric Power Corporation: Naju, Korea, 2020; Available online: https://home.kepco.co.kr/kepco/KO/ntcob/list.do?boardCd=BRD_000098&menuCd=FN05030102 (accessed on 13 March 2021).
- Jung, T.Y.; Park, C. Estimation of the Cost of Greenhouse Gas Reduction in Korea under the Global Scenario of 1.5 °C Temperature Increase. Carbon Manag. 2018, 9, 503–513. [Google Scholar] [CrossRef]
- Kim, K.J.; Lee, H.; Koo, Y. Research on Local Acceptance Cost of Renewable Energy in South Korea: A Case Study of Photovoltaic and Wind Power Projects. Energy Policy 2020, 144, 111684. [Google Scholar] [CrossRef]
- Ministry of Trade, Industry and Energy (MOTIE). Second Energy Master Plan; Ministry of Trade, Industry and Energy: Sejong, Korea, 2014.
- Kim, Y.; Kim, S.W.; Yoon, S.C.; Kim, M.H.; Park, K.H. Aerosol Properties and Associated Regional Meteorology during Winter Pollution Event at Gosan Climate Observatory, Korea. Atmos. Environ. 2013, 85, 9–17. [Google Scholar] [CrossRef]
- Lee, S.; Ho, C.H.; Choi, Y.S. High-PM10 Concentration Episodes in Seoul, Korea: Background Sources and Related Meteorological Conditions. Atmos. Environ. 2011, 45, 7240–7247. [Google Scholar] [CrossRef]
- Lee, S.; Ho, C.H.; Lee, Y.G.; Choi, H.J.; Song, C.K. Influence of Transboundary Air Pollutants from China on the High-PM10 Episode in Seoul, Korea for the Period October 16–20, 2008. Atmos. Environ. 2013, 77, 430–439. [Google Scholar] [CrossRef]
- Lee, H.; Park, S.S.; Kim, K.W.; Kim, Y.J. Source Identification of PM2.5 Particles Measured in Gwangju, Korea. Atmos. Res. 2008, 88, 199–211. [Google Scholar] [CrossRef]


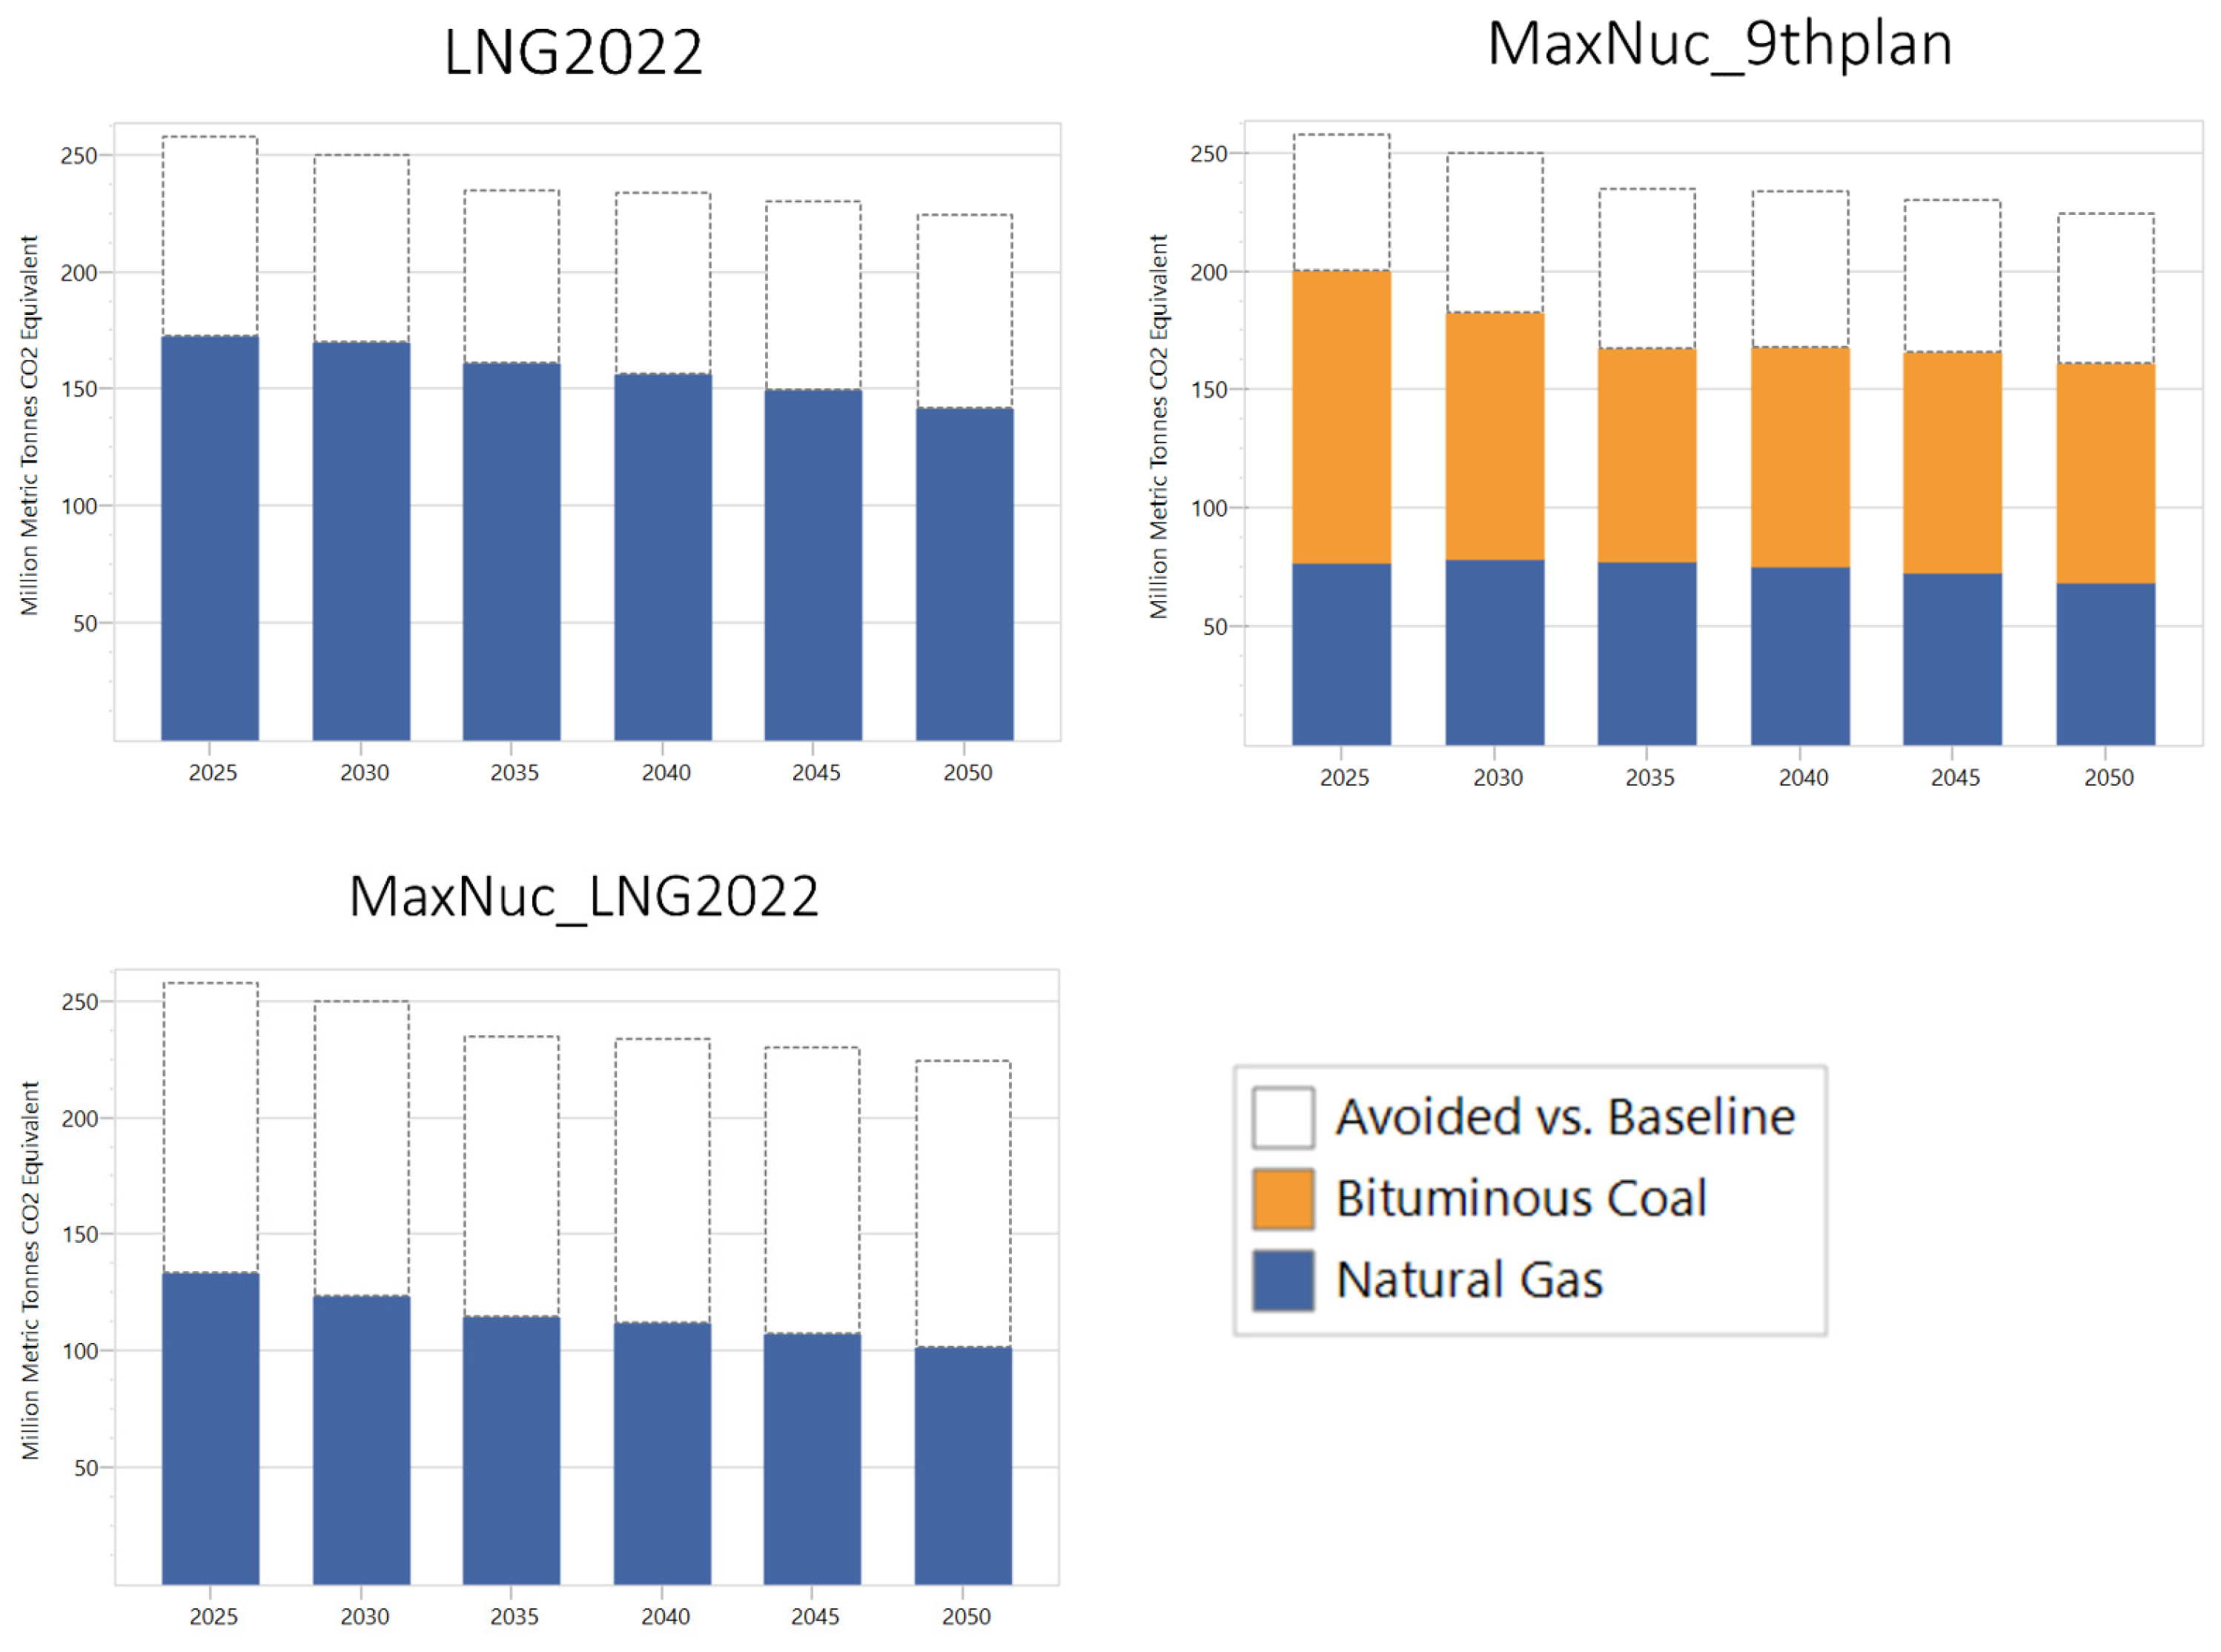
| Scenario Name | Description |
|---|---|
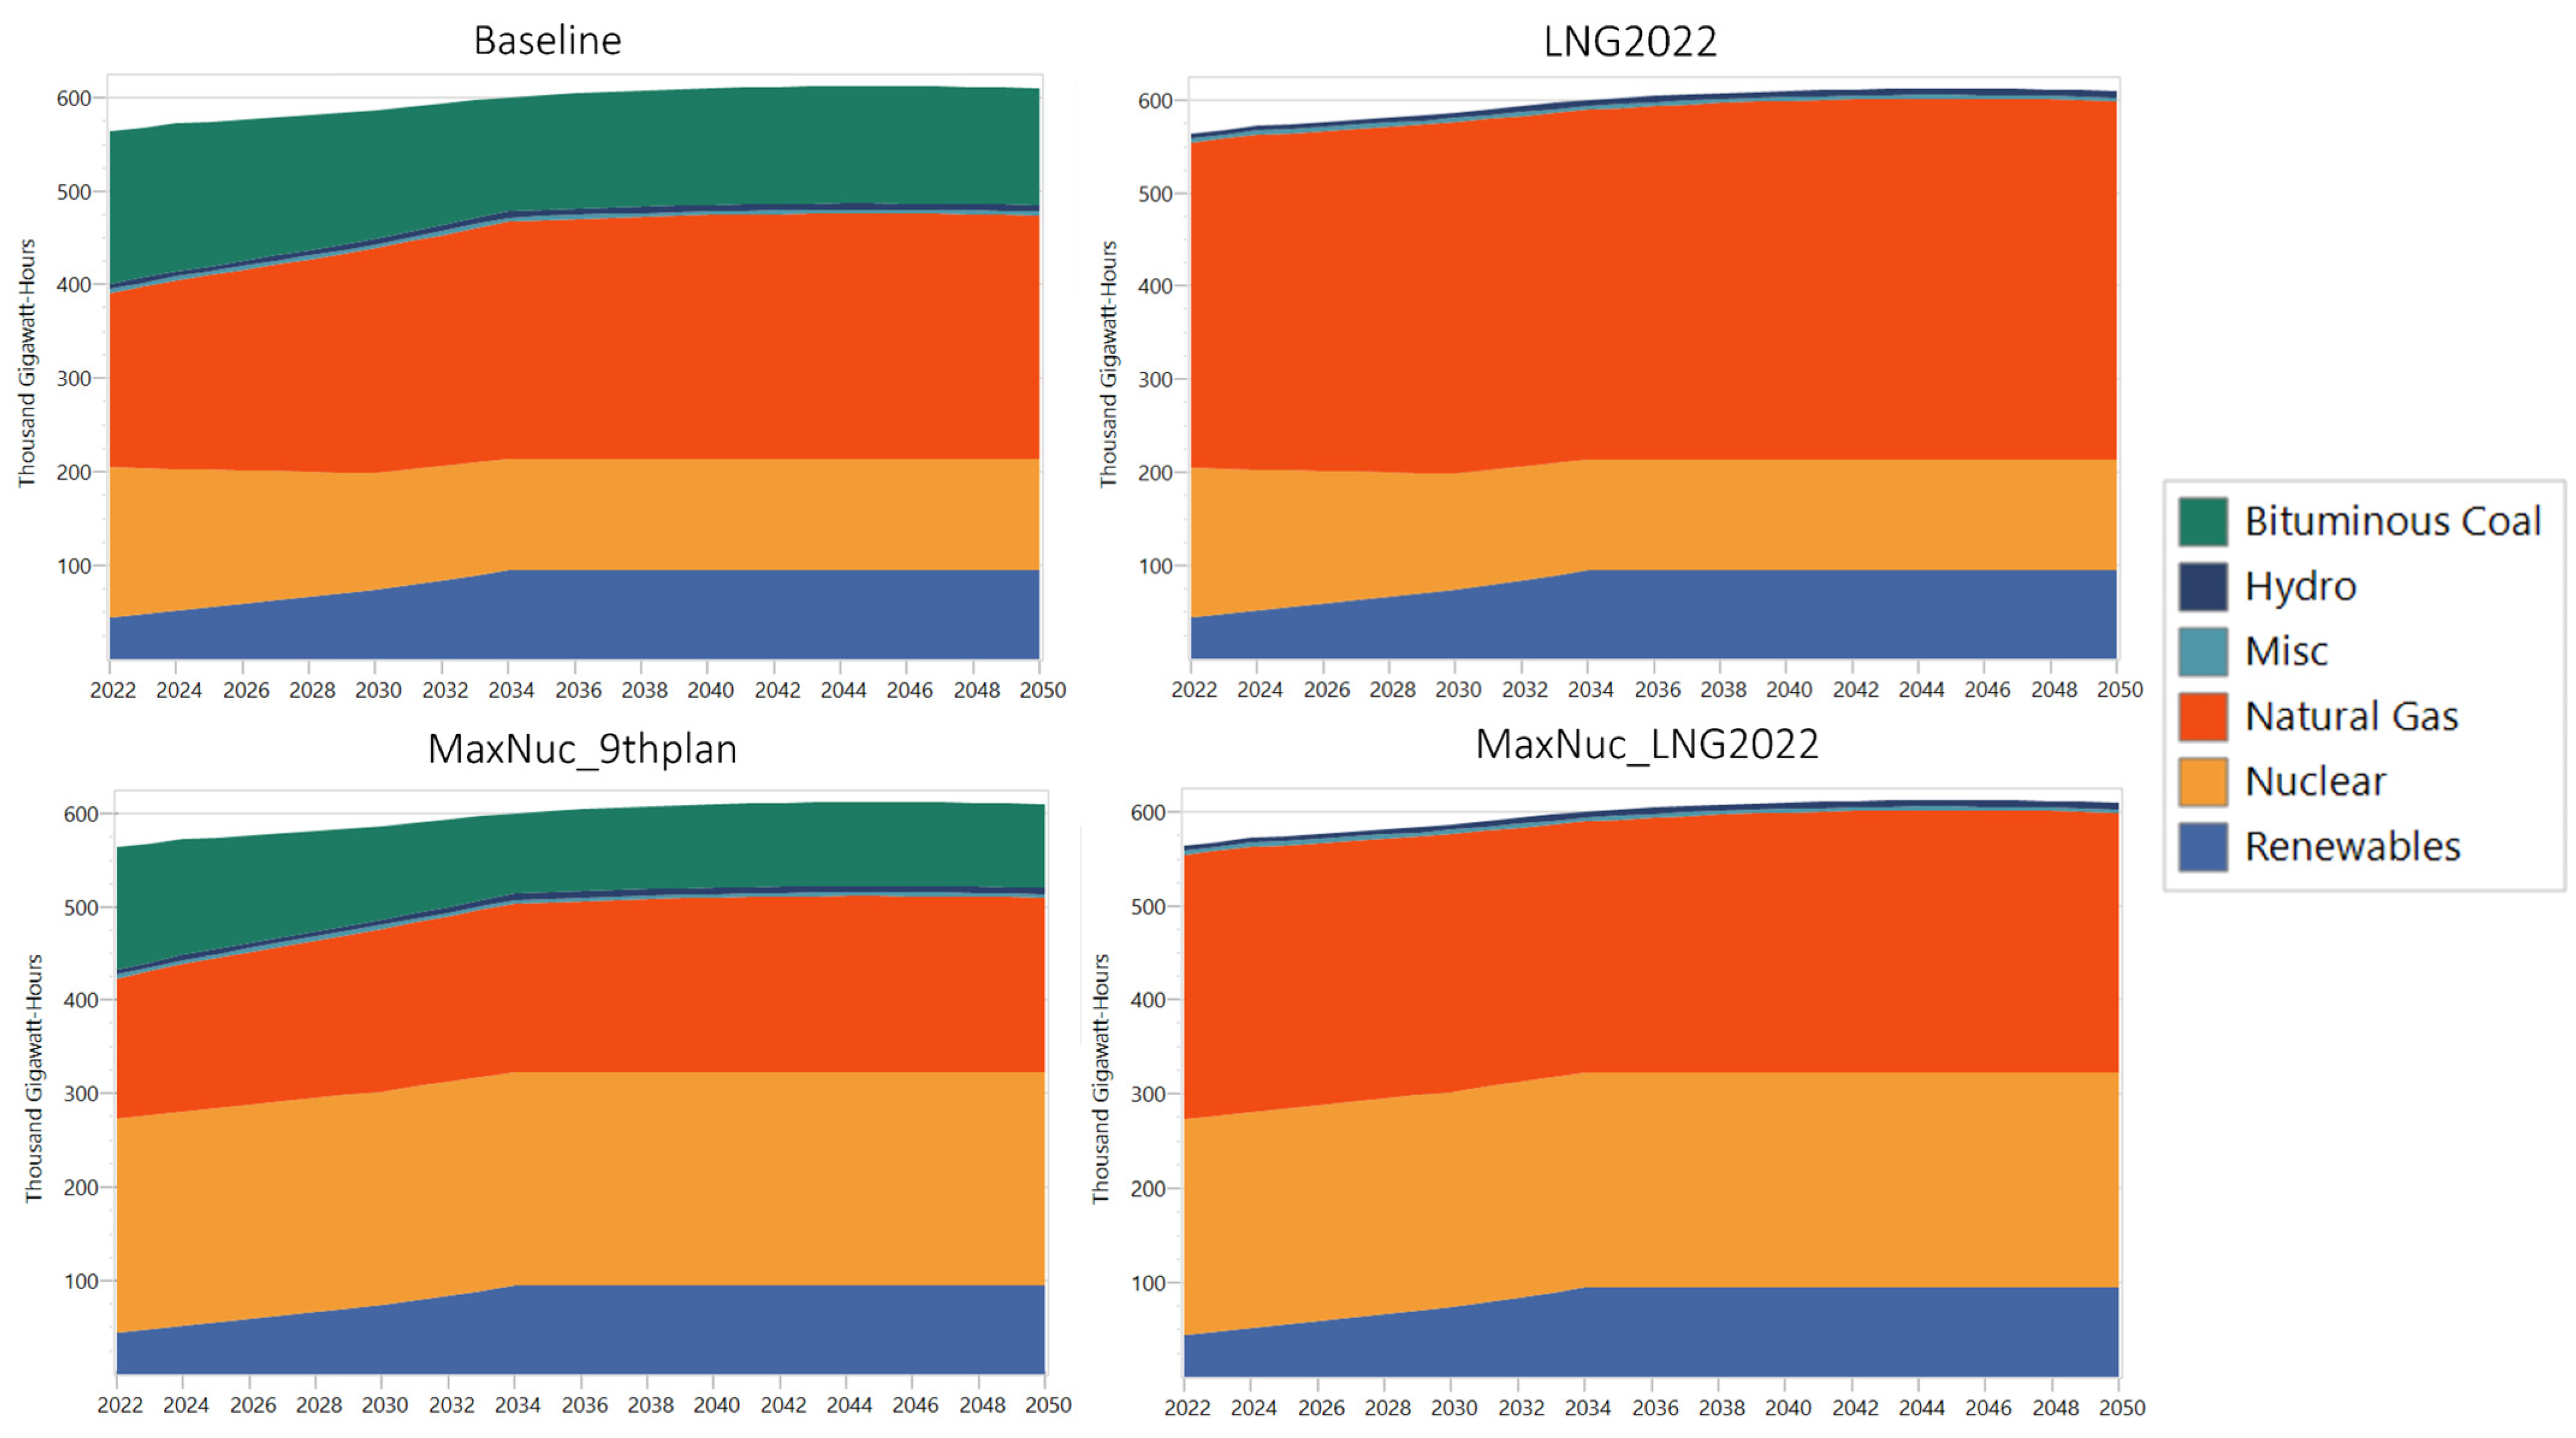
| Baseline | Coal and LNG dispatch in proportion to their effective capacities outlined in 9th Basic Plan. Renewable energy (RE) dispatches according to its full effective capacity of 9th Basic Plan. Nuclear, hydro, and others are dispatched according to their average percent of effective capacity utilized over the 2016–2019 period. |
| LNG2022 | From 2022 all coal electricity generation ceases and is replaced by LNG. |
| MaxNuc_ 9thplan | 2022 nuclear capacity is maintained, and its use maximized. Coal and LNG dispatch proportionally to their effective capacities outlined in 9th Basic Plan. |
| MaxNuc_ LNG2022 | 2022 nuclear capacity is maintained, and its use maximized. From 2022 all coal electricity generation ceases and is replaced by LNG. |
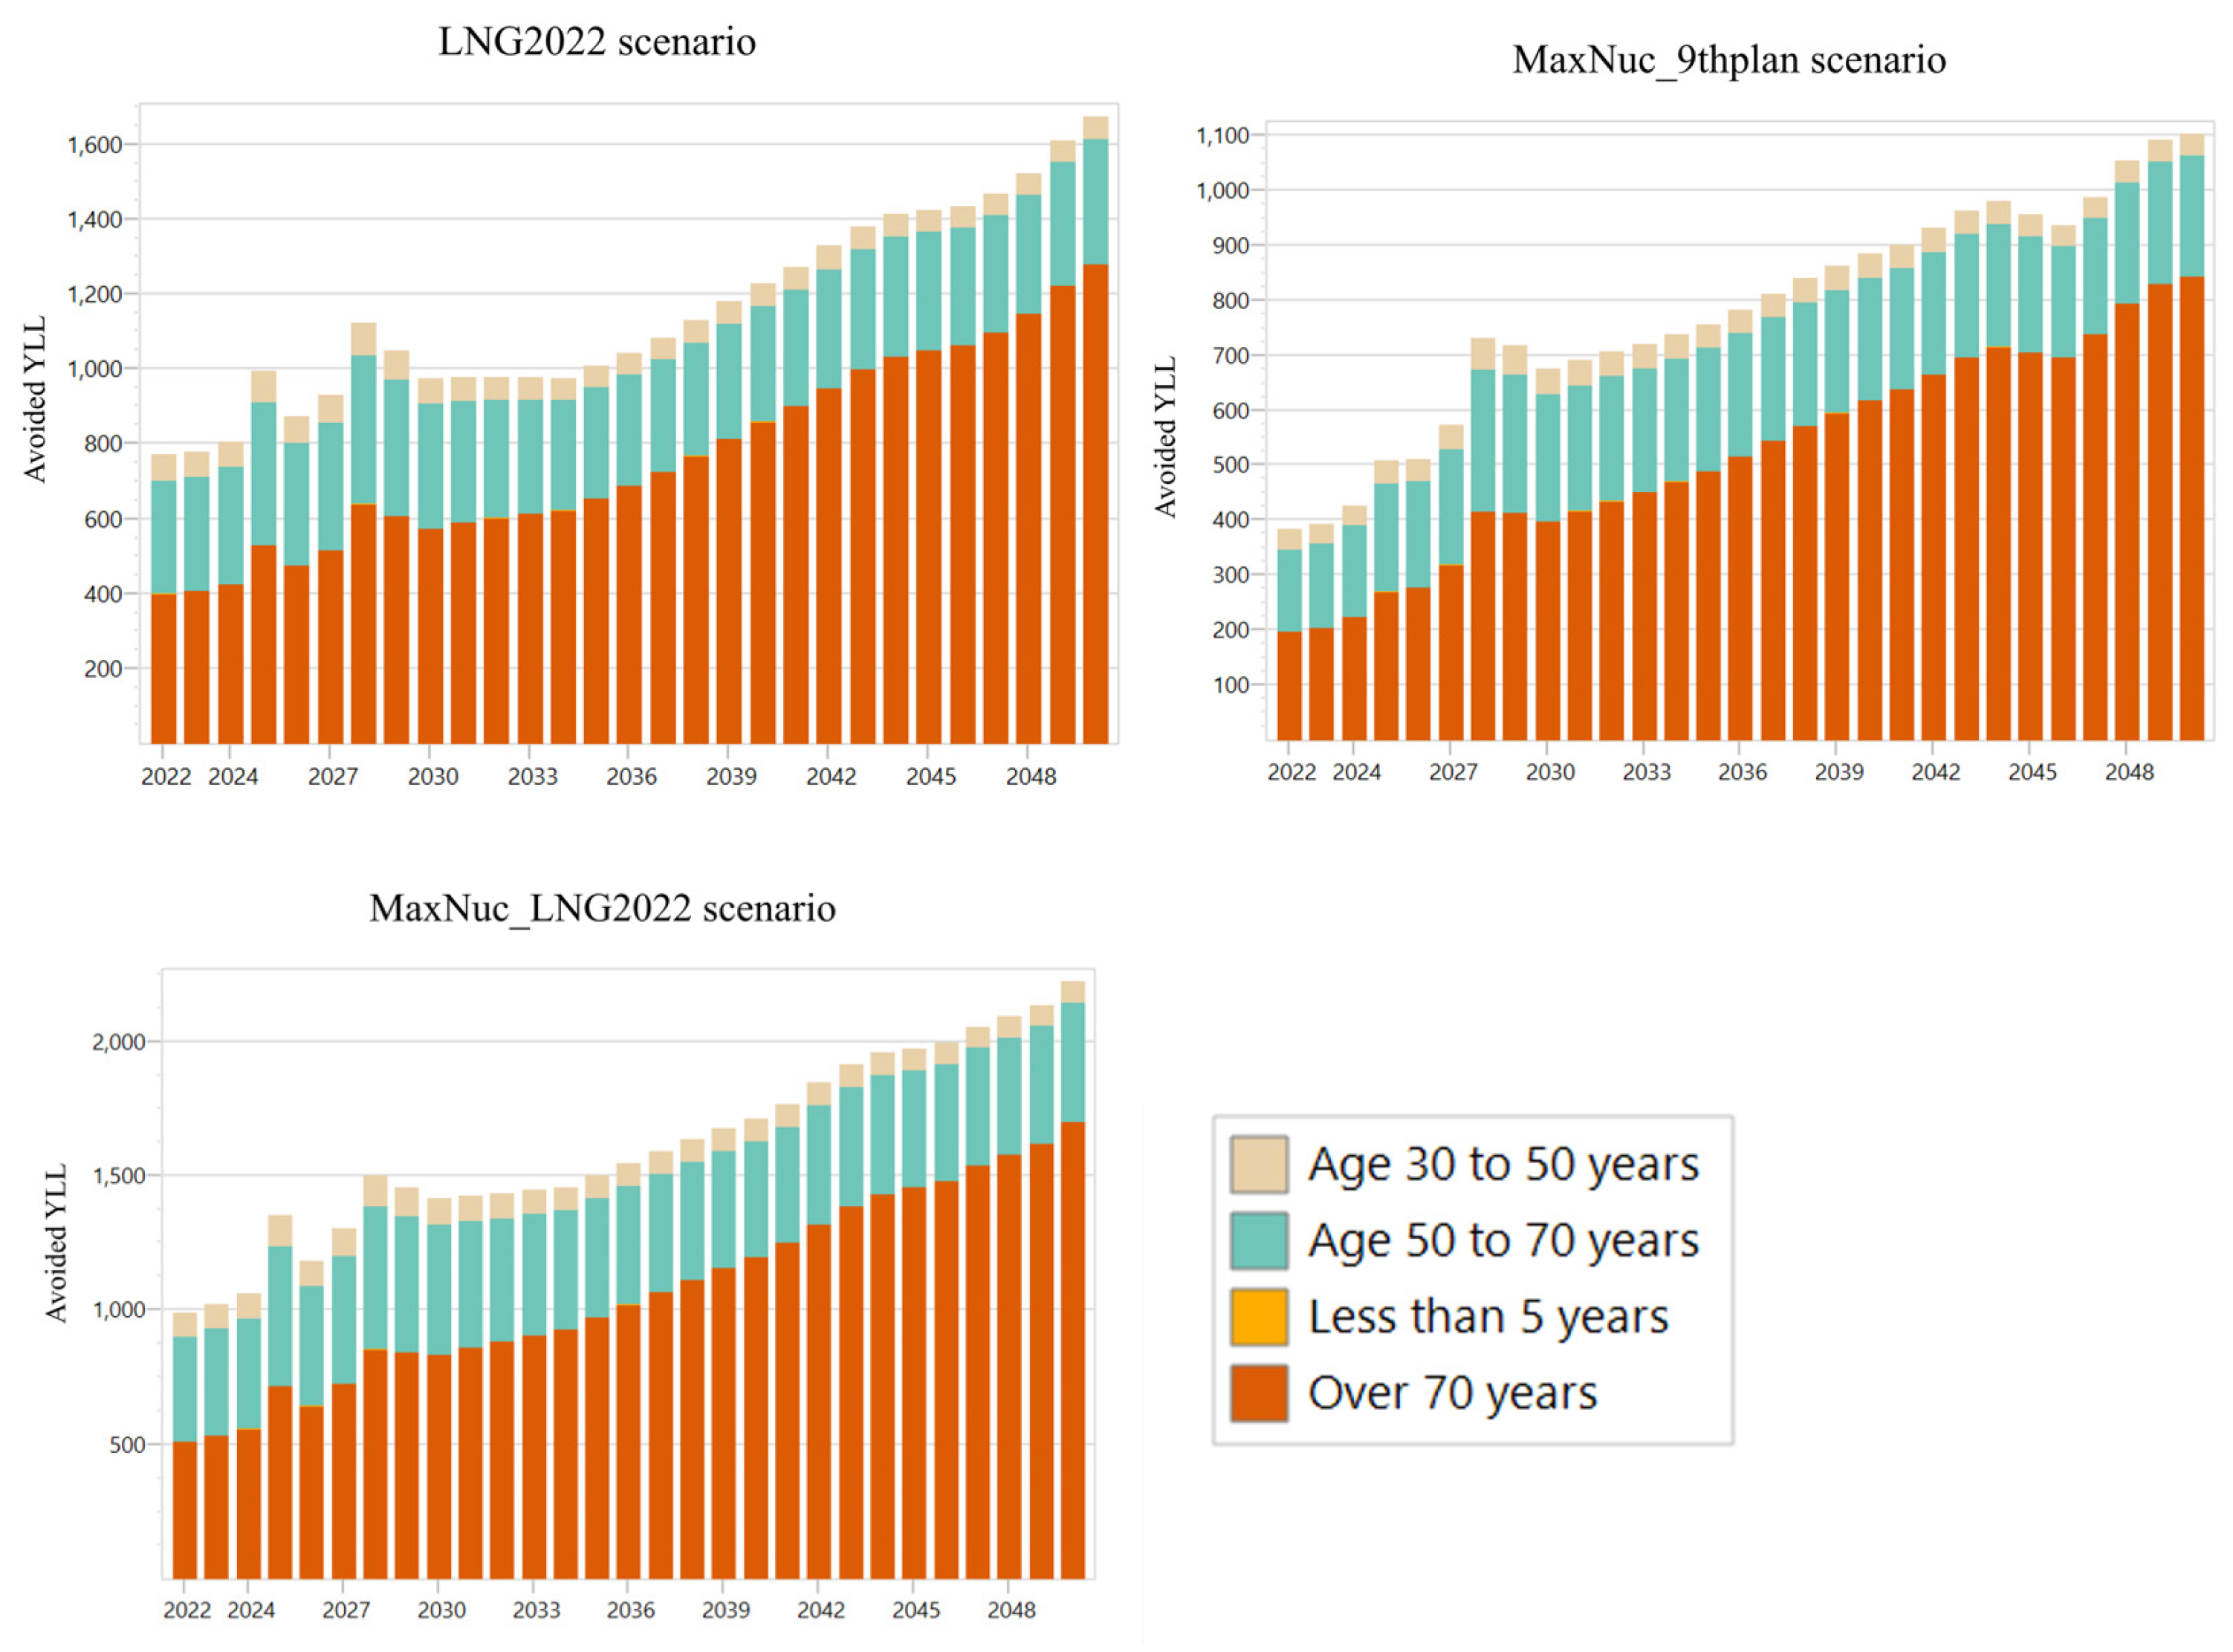
| LNG2022 | MaxNuc_9thplan | MaxNuc_LNG2022 | |||||||
|---|---|---|---|---|---|---|---|---|---|
| Year | Premature Mortality | YLL | MtCO2e | Premature Mortality | YLL | MtCO2e | Premature Mortality | YLL | MtCO2e |
| 2022 | 66 | 771 | 88.1 | 33 | 383 | 51.1 | 84 | 988 | 121.9 |
| 2023 | 67 | 778 | 87.8 | 34 | 392 | 53.6 | 88 | 1020 | 123.3 |
| 2024 | 70 | 805 | 87.4 | 37 | 426 | 56.0 | 91 | 1058 | 124.6 |
| 2025 | 87 | 995 | 86.2 | 44 | 508 | 58.3 | 117 | 1350 | 125.0 |
| 2026 | 76 | 872 | 85.1 | 45 | 510 | 60.5 | 103 | 1182 | 125.6 |
| 2027 | 82 | 928 | 84.1 | 51 | 573 | 62.7 | 115 | 1301 | 126.1 |
| 2028 | 100 | 1122 | 82.9 | 65 | 730 | 64.7 | 134 | 1498 | 126.5 |
| 2029 | 94 | 1049 | 81.7 | 64 | 716 | 66.7 | 131 | 1455 | 126.8 |
| 2030 | 88 | 974 | 80.7 | 61 | 674 | 68.6 | 128 | 1414 | 127.2 |
| 2031 | 89 | 977 | 78.9 | 63 | 690 | 68.7 | 130 | 1424 | 125.6 |
| 2032 | 91 | 978 | 77.1 | 65 | 705 | 68.7 | 132 | 1431 | 124.0 |
| 2033 | 92 | 978 | 75.4 | 67 | 719 | 68.7 | 135 | 1445 | 122.4 |
| 2034 | 92 | 975 | 73.5 | 70 | 736 | 68.6 | 138 | 1456 | 120.6 |
| 2035 | 96 | 1008 | 74.5 | 72 | 754 | 68.3 | 143 | 1500 | 121.1 |
| 2036 | 101 | 1041 | 75.4 | 76 | 782 | 67.9 | 150 | 1545 | 121.6 |
| 2037 | 107 | 1082 | 76.3 | 80 | 812 | 67.6 | 157 | 1590 | 122.0 |
| 2038 | 113 | 1129 | 77.1 | 84 | 839 | 67.3 | 164 | 1635 | 122.3 |
| 2039 | 120 | 1180 | 77.9 | 88 | 862 | 67.0 | 170 | 1674 | 122.6 |
| 2040 | 127 | 1229 | 78.6 | 91 | 885 | 66.7 | 177 | 1712 | 122.9 |
| 2041 | 133 | 1272 | 79.3 | 94 | 901 | 66.4 | 185 | 1766 | 123.2 |
| 2042 | 141 | 1328 | 79.9 | 98 | 930 | 66.1 | 195 | 1844 | 123.4 |
| 2043 | 148 | 1381 | 80.5 | 103 | 963 | 65.8 | 205 | 1914 | 123.5 |
| 2044 | 153 | 1413 | 81.0 | 106 | 980 | 65.5 | 212 | 1958 | 123.6 |
| 2045 | 156 | 1424 | 81.5 | 105 | 955 | 65.3 | 216 | 1973 | 123.7 |
| 2046 | 158 | 1434 | 81.9 | 103 | 936 | 65.0 | 220 | 1993 | 123.8 |
| 2047 | 164 | 1467 | 82.3 | 110 | 987 | 64.7 | 229 | 2054 | 123.7 |
| 2048 | 171 | 1522 | 82.6 | 119 | 1053 | 64.5 | 236 | 2093 | 123.7 |
| 2049 | 183 | 1610 | 82.9 | 124 | 1091 | 64.2 | 242 | 2135 | 123.6 |
| 2050 | 192 | 1674 | 83.1 | 126 | 1103 | 64.0 | 255 | 2223 | 123.4 |
| 2022–2034 | 2035–2050 | Total | Average per Year | |
|---|---|---|---|---|
| LNG2022 | 1093 (12,203) | 2263 (21,193) | 3356 (33,396) | 116 (1152) |
| MaxNuc_9thplan | 698 (7762) | 1581 (14,831) | 2278 (22,593) | 79 (779) |
| MaxNuc_LNG2022 | 1527 (17,022) | 3156 (29,609) | 4683 (46,631) | 161 (1608) |
| 2022–2034 | 2035–2050 | Total | Average per Year | |
|---|---|---|---|---|
| LNG2022 | 1069 | 1275 | 2344 | 80.8 |
| MaxNuc_9thplan | 817 | 1056 | 1873 | 65 |
| MaxNuc_LNG2022 | 1619 | 1968 | 3588 | 123.7 |
Publisher’s Note: MDPI stays neutral with regard to jurisdictional claims in published maps and institutional affiliations. |
© 2021 by the authors. Licensee MDPI, Basel, Switzerland. This article is an open access article distributed under the terms and conditions of the Creative Commons Attribution (CC BY) license (https://creativecommons.org/licenses/by/4.0/).
Share and Cite
Phillips, D.; Jung, T.Y. An Alternative Co-Benefit Framework Prioritizing Health Impacts: Potential Air Pollution and Climate Change Mitigation Pathways through Energy Sector Fuel Substitution in South Korea. Climate 2021, 9, 101. https://0-doi-org.brum.beds.ac.uk/10.3390/cli9060101
Phillips D, Jung TY. An Alternative Co-Benefit Framework Prioritizing Health Impacts: Potential Air Pollution and Climate Change Mitigation Pathways through Energy Sector Fuel Substitution in South Korea. Climate. 2021; 9(6):101. https://0-doi-org.brum.beds.ac.uk/10.3390/cli9060101
Chicago/Turabian StylePhillips, Dafydd, and Tae Yong Jung. 2021. "An Alternative Co-Benefit Framework Prioritizing Health Impacts: Potential Air Pollution and Climate Change Mitigation Pathways through Energy Sector Fuel Substitution in South Korea" Climate 9, no. 6: 101. https://0-doi-org.brum.beds.ac.uk/10.3390/cli9060101