
Integrated Water Vapor during Rain and Rain-Free Conditions above the Swiss Plateau
by
 , ,
, ,
Klemens Hocke
1,* ,
,
Leonie Bernet
2,
Wenyue Wang
1,
Christian Mätzler
1,
Maxime Hervo
3 and
Alexander Haefele
3 1
Institute of Applied Physics and Oeschger Centre for Climate Change Research, University of Bern, 3012 Bern, Switzerland
2
Norwegian Institute for Air Research (NILU), 2027 Kjeller, Norway
3
Federal Office of Meteorology and Climatology, MeteoSwiss, 1530 Payerne, Switzerland
*
Author to whom correspondence should be addressed.
Climate 2021, 9(7), 105; https://0-doi-org.brum.beds.ac.uk/10.3390/cli9070105
Submission received: 29 May 2021
/
Revised: 19 June 2021
/
Accepted: 23 June 2021
/
Published: 25 June 2021
(This article belongs to the Special Issue Climate Change Impacts at Various Geographical Scales)
Abstract
:Water vapor column density, or vertically-integrated water vapor (IWV), is monitored by ground-based microwave radiometers (MWR) and ground-based receivers of the Global Navigation Satellite System (GNSS). For rain periods, the retrieval of IWV from GNSS Zenith Wet Delay (ZWD) neglects the atmospheric propagation delay of the GNSS signal by rain droplets. Similarly, it is difficult for ground-based dual-frequency single-polarisation microwave radiometers to separate the microwave emission of water vapor and cloud droplets from the rather strong microwave emission of rain. For ground-based microwave radiometry at Bern (Switzerland), we take the approach that IWV during rain is derived from linearly interpolated opacities before and after the rain period. The intermittent rain periods often appear as spikes in the time series of integrated liquid water (ILW) and are indicated by ILW ≥ 0.4 mm. In the present study, we assume that IWV measurements from radiosondes are not affected by rain. We intercompare the climatologies of IWV(rain), IWV(no rain), and IWV(all) obtained by radiosonde, ground-based GNSS atmosphere sounding, ground-based MWR, and ECMWF reanalysis (ERA5) at Payerne and Bern in Switzerland. In all seasons, IWV(rain) is 3.75 to 5.94 mm greater than IWV(no rain). The mean IWV differences between GNSS and radiosonde at Payerne are less than 0.26 mm. The datasets at Payerne show a better agreement than the datasets at Bern. However, the MWR at Bern agrees with the radiosonde at Payerne within 0.41 mm for IWV(rain) and 0.02 mm for IWV(no rain). Using the GNSS and rain gauge measurements at Payerne, we find that IWV(rain) increases with increase of the precipitation rate during summer as well as during winter. IWV(rain) above the Swiss Plateau is quite well estimated by GNSS and MWR though the standard retrievals are limited or hampered during rain periods.
1. Introduction
Water vapor is the most important gaseous source of infrared opacity in the atmosphere and accounts for about 60% of the natural greenhouse effect for clear sky [1]. Global warming due to man-made emissions of carbon dioxide is amplified by an increase of water vapor abundance in a warmer world. This water vapor feedback is up by a factor of two [2].
Latent heat release by condensation of water vapor is crucial for atmospheric dynamics and energetics. Water vapor is the raw material for cloud and rain droplets. A cold front lifts up the warm moist air so that condensation of water vapor and precipitation occur. Convergence of moist air and subsequent uplift within cyclones, hurricanes, storm cells or convective clouds also lead to precipitation. Atmospheric rivers transport moist air over the oceans to coastal mountains where intense orographic precipitation occurs [3]. Deep convection over the tropical oceans increases IWV and precipitation [4]. Zhang et al. [5] performed a superposed epoch analysis of rain events during the monsoon in China. They found that IWV increased by about 5–10 mm after the onset of the precipitation. Because of measurement limits of the multi-channel microwave radiometer, they only considered rain rates below 12 mm/h. Graham et al. [6] analyzed IWV measurements before and during thunderstorms in the Alps using the GNSS ground station network in Switzerland. They found advection of moist air from the Swiss plain to the Alps so that IWV increased up to 50% when the maximum extent of the thunderstorm development appeared.
These examples show that a positive change of IWV due to the uplift of moist air can be expected when it rains. The present study partly investigates the question if IWV measurements are reliable during rain. There are only a few techniques that can measure IWV when it rains. First of all, water vapor profiles measured by radiosondes are not biased by rain and should be a reference for IWV. Space geodetic techniques (Very Long Baseline Interferometry (VLBI) and GNSS) can provide IWV during rain, though the extra rain path delay of the received microwave signals is usually neglected in the data analysis. The extra path delay of the GNSS signal due to rain droplets was estimated by [7]. They reported that the rain path delay of the ionospheric corrected GNSS signal is almost 20 mm when the signal propagates through 3 km of rain with a rain rate of 50 mm/h.
Microwave radiometers can measure IWV during rain. However, the radiometers have to measure both the vertically- and the horizontally-polarized microwave radiance (V and H). Otherwise, it is not possible to separate between the microwave emission of IWV, cloud and rain liquid water. Battaglia et al. [8] characterized precipitating clouds by ground-based measurements with a triple-frequency, dual-polarisation microwave radiometer. Spaceborne microwave radiometers such as the Special Sensor Microwave/Imager (SSM/I) also can measure IWV during rain [9]. SSM/I is a seven-channel, four-frequency, dual-polarisation passive microwave radiometer system which provided IWV and rain rate data for the study of [4] about the correlation of IWV and rain rate over the tropical oceans.
The IWV trend studies of [10,11] are based on rain-free measurements of IWV by the dual-frequency, single-polarisation, tropospheric water radiometer (TROWARA) at Bern. The observed integrated liquid water (ILW) is less than 0.4 mm during rain-free periods. The IWV trend studies of [10,11] are accurate, since their trend models adequately handle the IWV data gaps of the rain periods in the long-term time series of IWV at Bern. In the present study, we show that IWV during a rain period (ILW ≥ 0.4 mm) can be derived by means of a linear interpolation between the rain-free opacities before and after the rain period. The separation between rain and rain-free data is excellent, since TROWARA with its high temporal resolution of 6–13 s does not overlook intermittent rain and rain spikes. Morland [12] investigated the influence of rain on the IWV measurements of TROWARA. They concluded that TROWARA can measure IWV in light rain conditions with rain rates up to 2.4 mm/h. This is more than the precipitation rate threshold, which is later used in the present study (0.1 mm/10 min).
The present study derives climatologies of IWV during rain and rain-free periods at Bern and Payerne within the Swiss Plateau. The rain rate in Bern and Payerne is mostly below 12 mm/h. The measurement techniques, data analyses and datasets are described in Section 2. The IWV results from TROWARA, radiosondes, GNSS and ERA5 are intercompared in Section 3. A discussion is given in Section 4, while conclusions are presented in Section 5.
2. Instruments, Datasets and Data Analysis
2.1. Radiosonde
We use IWV data, which were derived from radiosonde measurements at Payerne (46.81° N, 6.94° E, 491 m a.s.l), from June 2001 to March 2018. The radiosondes were launched every day at 11:00 and 23:00 UTC. Until January 2017, the Swiss RadioSonde SRS-C34 was used and later it changed to SRS-C50 [13]. The SRS-C34 is manufactured by MeteoLabor and is equipped with a Sippican hygristor measuring the relative humidity with an accuracy of 2% [14].
Payerne is also a reference site of the Global Climate Observing System (GCOS) (https://www.gruan.org accessed on 10 June 2021). The IWV data of SRS-C50 agree with coincident data of the GCOS Reference Upper-Air Network (GRUAN)-certified radiosondes Vaisala RS92 at Payerne: the mean difference and the standard deviation are 0.8± 3.7% [13].
The radiosonde provides vertical profiles of pressure p, temperature T and relative humidity . The partial pressure of water vapor is
where is the saturation water vapor pressure. We calculated by means of [15]
where is in [Pa] and T in °K.
The water vapor density is related to the water vapor pressure by
where J/(°K kg) is the specific gas constant of water vapor. Finally, IWV is obtained by vertical integration of the altitude profile of .
2.2. Rain Gauge
We are using precipitation measurements of a rain gauge at Payerne which has a temporal resolution of 10 min. The rain gauge is part of the SwissMetNet of MeteoSwiss consisting of about 160 automated weather stations in Switzerland. Periods with a precipitation rate >0.1 mm/10 min are marked as rain periods. The rain flags are taken for separation of the IWV data at Payerne into a “rain group” and a “no rain group”. In case of Bern, we are using the integrated liquid water (ILW) measurements of the TROWARA radiometer as an indicator of rain periods (ILW ≥ 0.4 mm). The 0.4 mm-threshold for rain occurrence was found in previous studies, e.g., [16,17,18]. Later in the Section Discussion, we also derive the results for an ILW threshold of 0.2 mm, and the data of the rain gauge at the University of Bern (temporal resolution: 10 min) are also used.
2.3. GNSS Remote Sensing
For the derivation of IWV, we start with the hourly data of zenith total delay (ZTD) which are processed by the Swiss Federal Office of Topography (swisstopo) for the GNSS ground stations at Payerne and Bern. These data were part of a trend study of IWV observed by different measurement techniques in Switzerland [11]. However, the operation of the GNSS station at the University of Bern was stopped in 2017.
ZTD is the sum of the zenith hydrostatic delay (ZHD), the zenith wet delay (ZWD), zenith rain delay (ZD) and zenith particulates delay (ZD). ZHD is due to the refraction of the GNSS signal by the dry atmosphere, and ZWD is caused by the refraction of the GNSS signal by water vapor [19]. ZD is due to the refraction of the GNSS signal by hydrometeors, and ZD is due to the refraction of the GNSS signal by particulates such as sand, dust, aerosols and volcanic ash. Solheim et al. [7] calculated the GNSS path delays due to hydrometeors and particulates. Propagation through 1 km of heavy rain induces a ZD of about 15 mm which is not negligible compared to ZWD.
ZHD of the dry atmosphere is estimated by using the measurement of the surface air pressure at the station. Then, IWV is given by [20]
where IWV and ZWD are both in millimeter. The dimensionless factor depends on the mean atmospheric temperature which can be estimated from the surface air temperature. Here, we derive by this formula
with K/hPa and K/hPa [20]. Please note that Equation (7) contains the factor while [20] used the factor . Anyway, Equation (7) delivers a value of about 6.5 for when we insert K and J/(K kg). This agrees with = ZWD/IWV in [21] who found ratios between 6 and 7. Thus, IWV is, in our example, 6.5 times smaller than ZWD.
It is clear that the neglection of ZD and ZD in Equation (5) leads to an overestimation of ZWD and IWV during rainy or dusty conditions. To our knowledge, all GNSS data analyses of IWV in the literature are based on Equation (5), even studies about GNSS IWV during heavy rainfall are based on this approximation [22,23]. A theoretical study of [7] indicated that the rain path delay of the ionospheric corrected GNSS signal is almost 20 mm when the signal propagates through 3 km of rain with a rain rate of 50 mm/h. The 20 mm-overestimation of ZWD would induce a positive IWV bias of roughly 3 mm (ΔIWV ≈ 20 mm/6.5). Such rainfalls rarely occur above the Swiss Plateau but our study aims to investigate if some smaller errors of GNSS IWV appear for low and moderate rain rates.
2.4. Ground-Based Microwave Radiometry
Our study analyzes the IWV observations of the TROWARA radiometer at Bern from January 2004 to December 2016. The time interval is constrained by the quality of the ILW data which is good after January 2004 and by the closure of the GNSS station at Bern in January 2017. TROWARA is a dual-channel microwave radiometer (21.4 and 31.5 GHz), and its design and construction were described by [24,25]. The instrument is operated inside a temperature-controlled room on the roof of the building for Exakte Wissenschaften (EXWI) of the University of Bern (46.95° N, 7.44° E, 575 m a.s.l.). The antenna receives the atmospheric radiation inside the room through a microwave transparent window. This indoor operation of TROWARA avoids a bias due to rain drops on the antenna. IWV and ILW are retrieved for rain-free periods (ILW < 0.4 mm), while the rain rate is retrieved when it rains (ILW ≥ 0.4 mm) [18,26,27,28]. The elevation angle of the antenna is 40°, and it points towards South–East. Further details about TROWARA and the retrieval technique are provided by [18,29].
In the following, the measurement principle and the retrieval are briefly explained. The radiative transfer equation of a non-scattering atmosphere is
where is the opacity of the i-th frequency channel (e.g., 21 GHz) along the line of sight of the radiometer. is the observed brightness temperature, and is the brightness temperature of the cosmic microwave background. denotes the effective mean temperature of the troposphere [18,30].
Equation (8) can be solved for the opacities
where the TROWARA observations yield the radiances .
The opacities are related to IWV, ILW, integrated rain liquid (IRL) and integrated snow liquid (ISL) by
where is the Mie gain which increases rapidly for drop diameters larger than 0.3 mm, reaching values up to 7 at 31.5 GHz, and almost up to 10 at 21.4 GHz [26]. Thus, the opacity due to rain is much larger than the opacity due to clouds. It is clear that Equation (10) cannot be solved without additional information, e.g., measurement of the vertically and horizontally polarized radiance. Battaglia et al. [8] were able to retrieve water vapor, cloud water and rainwater by using the measurements of a triple-frequency, dual-polarisation microwave radiometer.
In the case of TROWARA, we can precisely derive IWV for rain-free periods. IWV during rain is derived from linearly interpolated opacities using the rain-free opacities before and after the rainfall. In the present study, we will investigate the goodness of this approximation. In a plane-parallel and rain-free atmosphere, the opacity is linearly related to IWV and ILW
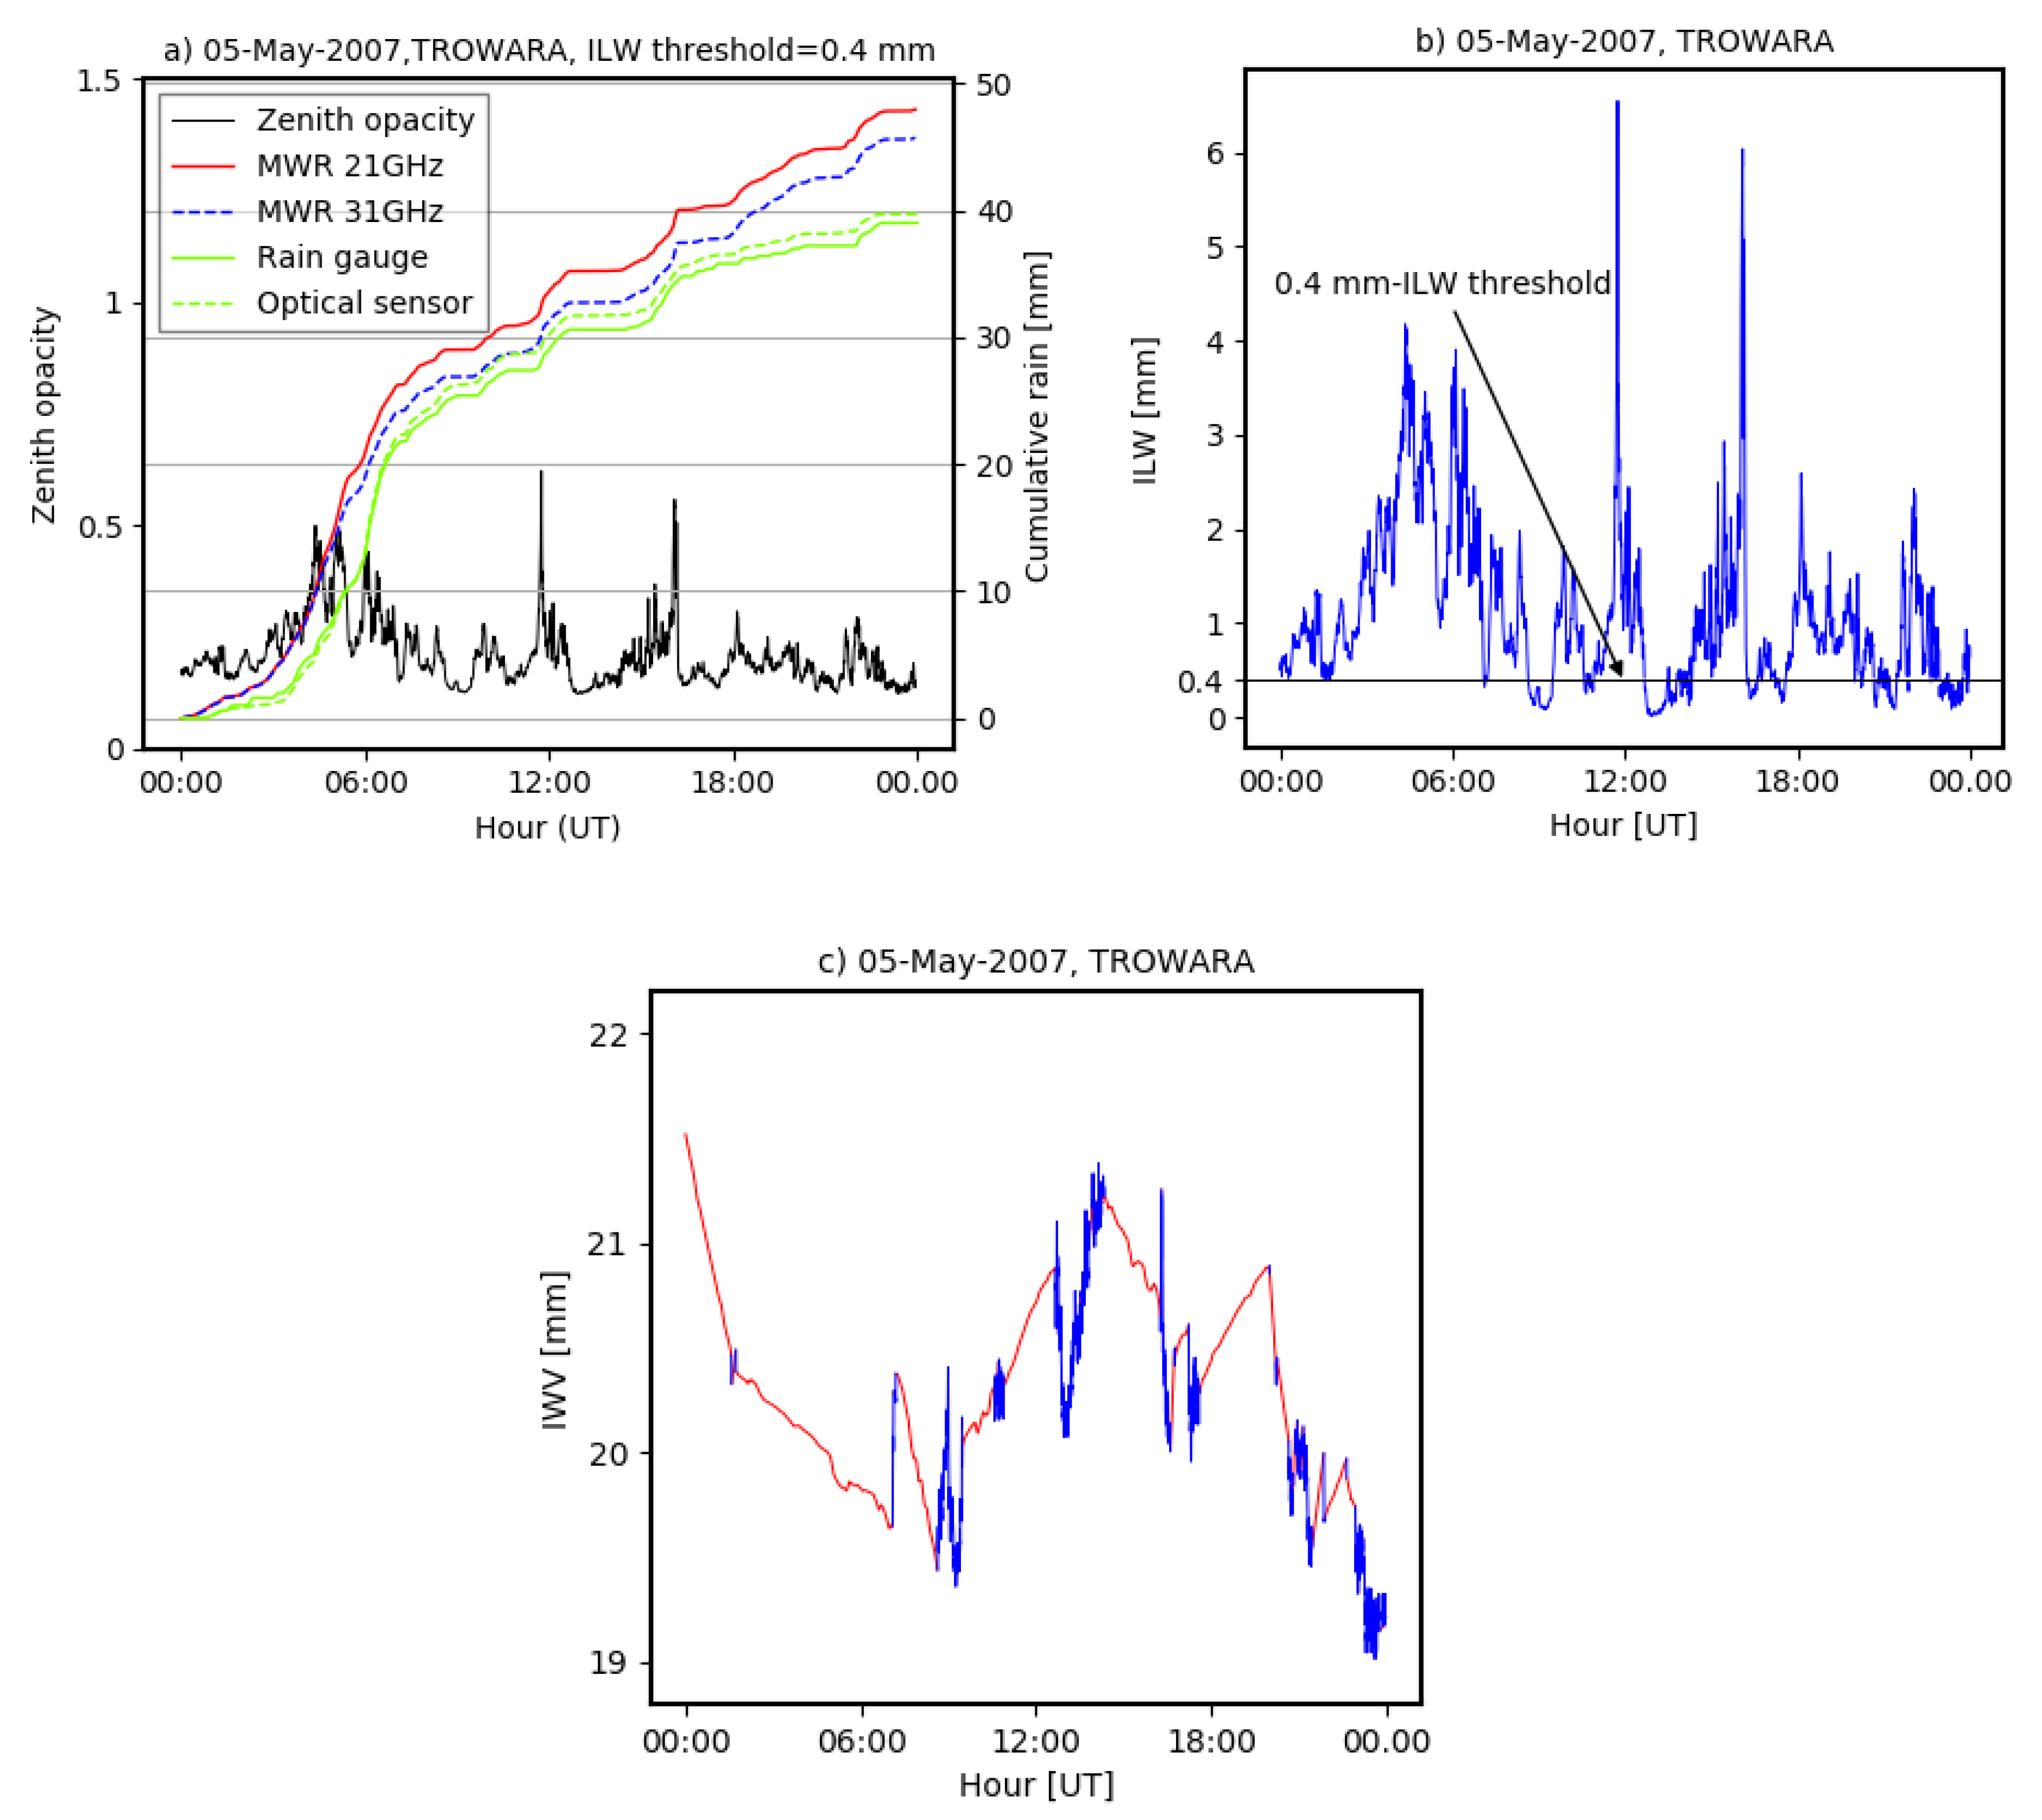
where the coefficients a and b partly depend on air pressure. The coefficients can be statistically derived by means of coincident measurements of radiosondes and fine-tuned at times of periods with a clear atmosphere [18]. The coefficient c indicates the mass absorption coefficient of cloud water. Parameter c depends on temperature (and frequency), but not on pressure. It is derived from the physical expression of Rayleigh absorption by clouds [18]. After determination of the coefficients, the opacity measurements at 21 and 31 GHz yield the desired parameters IWV and ILW in Equation (11). The temporal resolution of the time series of IWV and ILW is between 6 and 13 s. Figure 1 shows the TROWARA data products for a rainy day at Bern. Rainfall often occurs over a short time interval visible as a spike in the time series of zenith opacity at 31 GHz (Figure 1a) and ILW (Figure 1b). The high temporal resolution of TROWARA permits the fast distinction between rain (ILW ≥ 0.4 mm), and rain-free (ILW < 0.4 mm) periods. During rain-free periods, IWV is precisely measured by TROWARA (blue line in Figure 1c) while during rain IWV is estimated from opacities which are derived by linear interpolation between the rain-free opacities before and after the rain period (Equation (11)). The red line in Figure 1c) shows the estimated values of IWV(rain) during a rainy day at Bern. Nonlinear variations of IWV(rain) are due to the pressure or temperature dependences of the coefficients a, b and c in Equation (11).
2.5. Meteorological Reanalysis
The ERA5 reanalysis is the latest atmospheric reanalysis from the European Centre for Medium-Range Weather Forecasts (ECMWF) [31]. The Copernicus Climate Data Store (CDS, https://cds.climate.copernicus.eu accessed on 14 May 2021) provides hourly IWV data of ERA5 with a horizontal grid resolution of 0.25° latitude × 0.25° longitude. We are not sure if the IWV field is interpolated to the selected locations, in our case Payerne and Bern, or if the CDS web interface only provides the IWV of the nearest grid point. Anyway, the latitude and longitude values in the generated netcdf files of CDS exactly agree with those of the stations in Payerne and Bern.
Since the altitude of the lowest model level is a few hundred meters above the altitude of Payerne, the ERA5 IWV values have to be corrected as described by [32]
where the altitude values are in meters. In the present study, we have to keep in mind that ERA5 depends on the Payerne radiosonde data which are assimilated into the ECMWF model.
3. Results
In the present study, we derive climatologies of IWV by using all data which are available for one instrument, for example, the hourly GNSS data are not reduced to the two radiosonde launch times per day. Thus, we derive for each data set the optimal IWV climatology. However, the temporal coincidence for the derived IWV climatologies of the different datasets is not strictly fulfilled.
3.1. Payerne
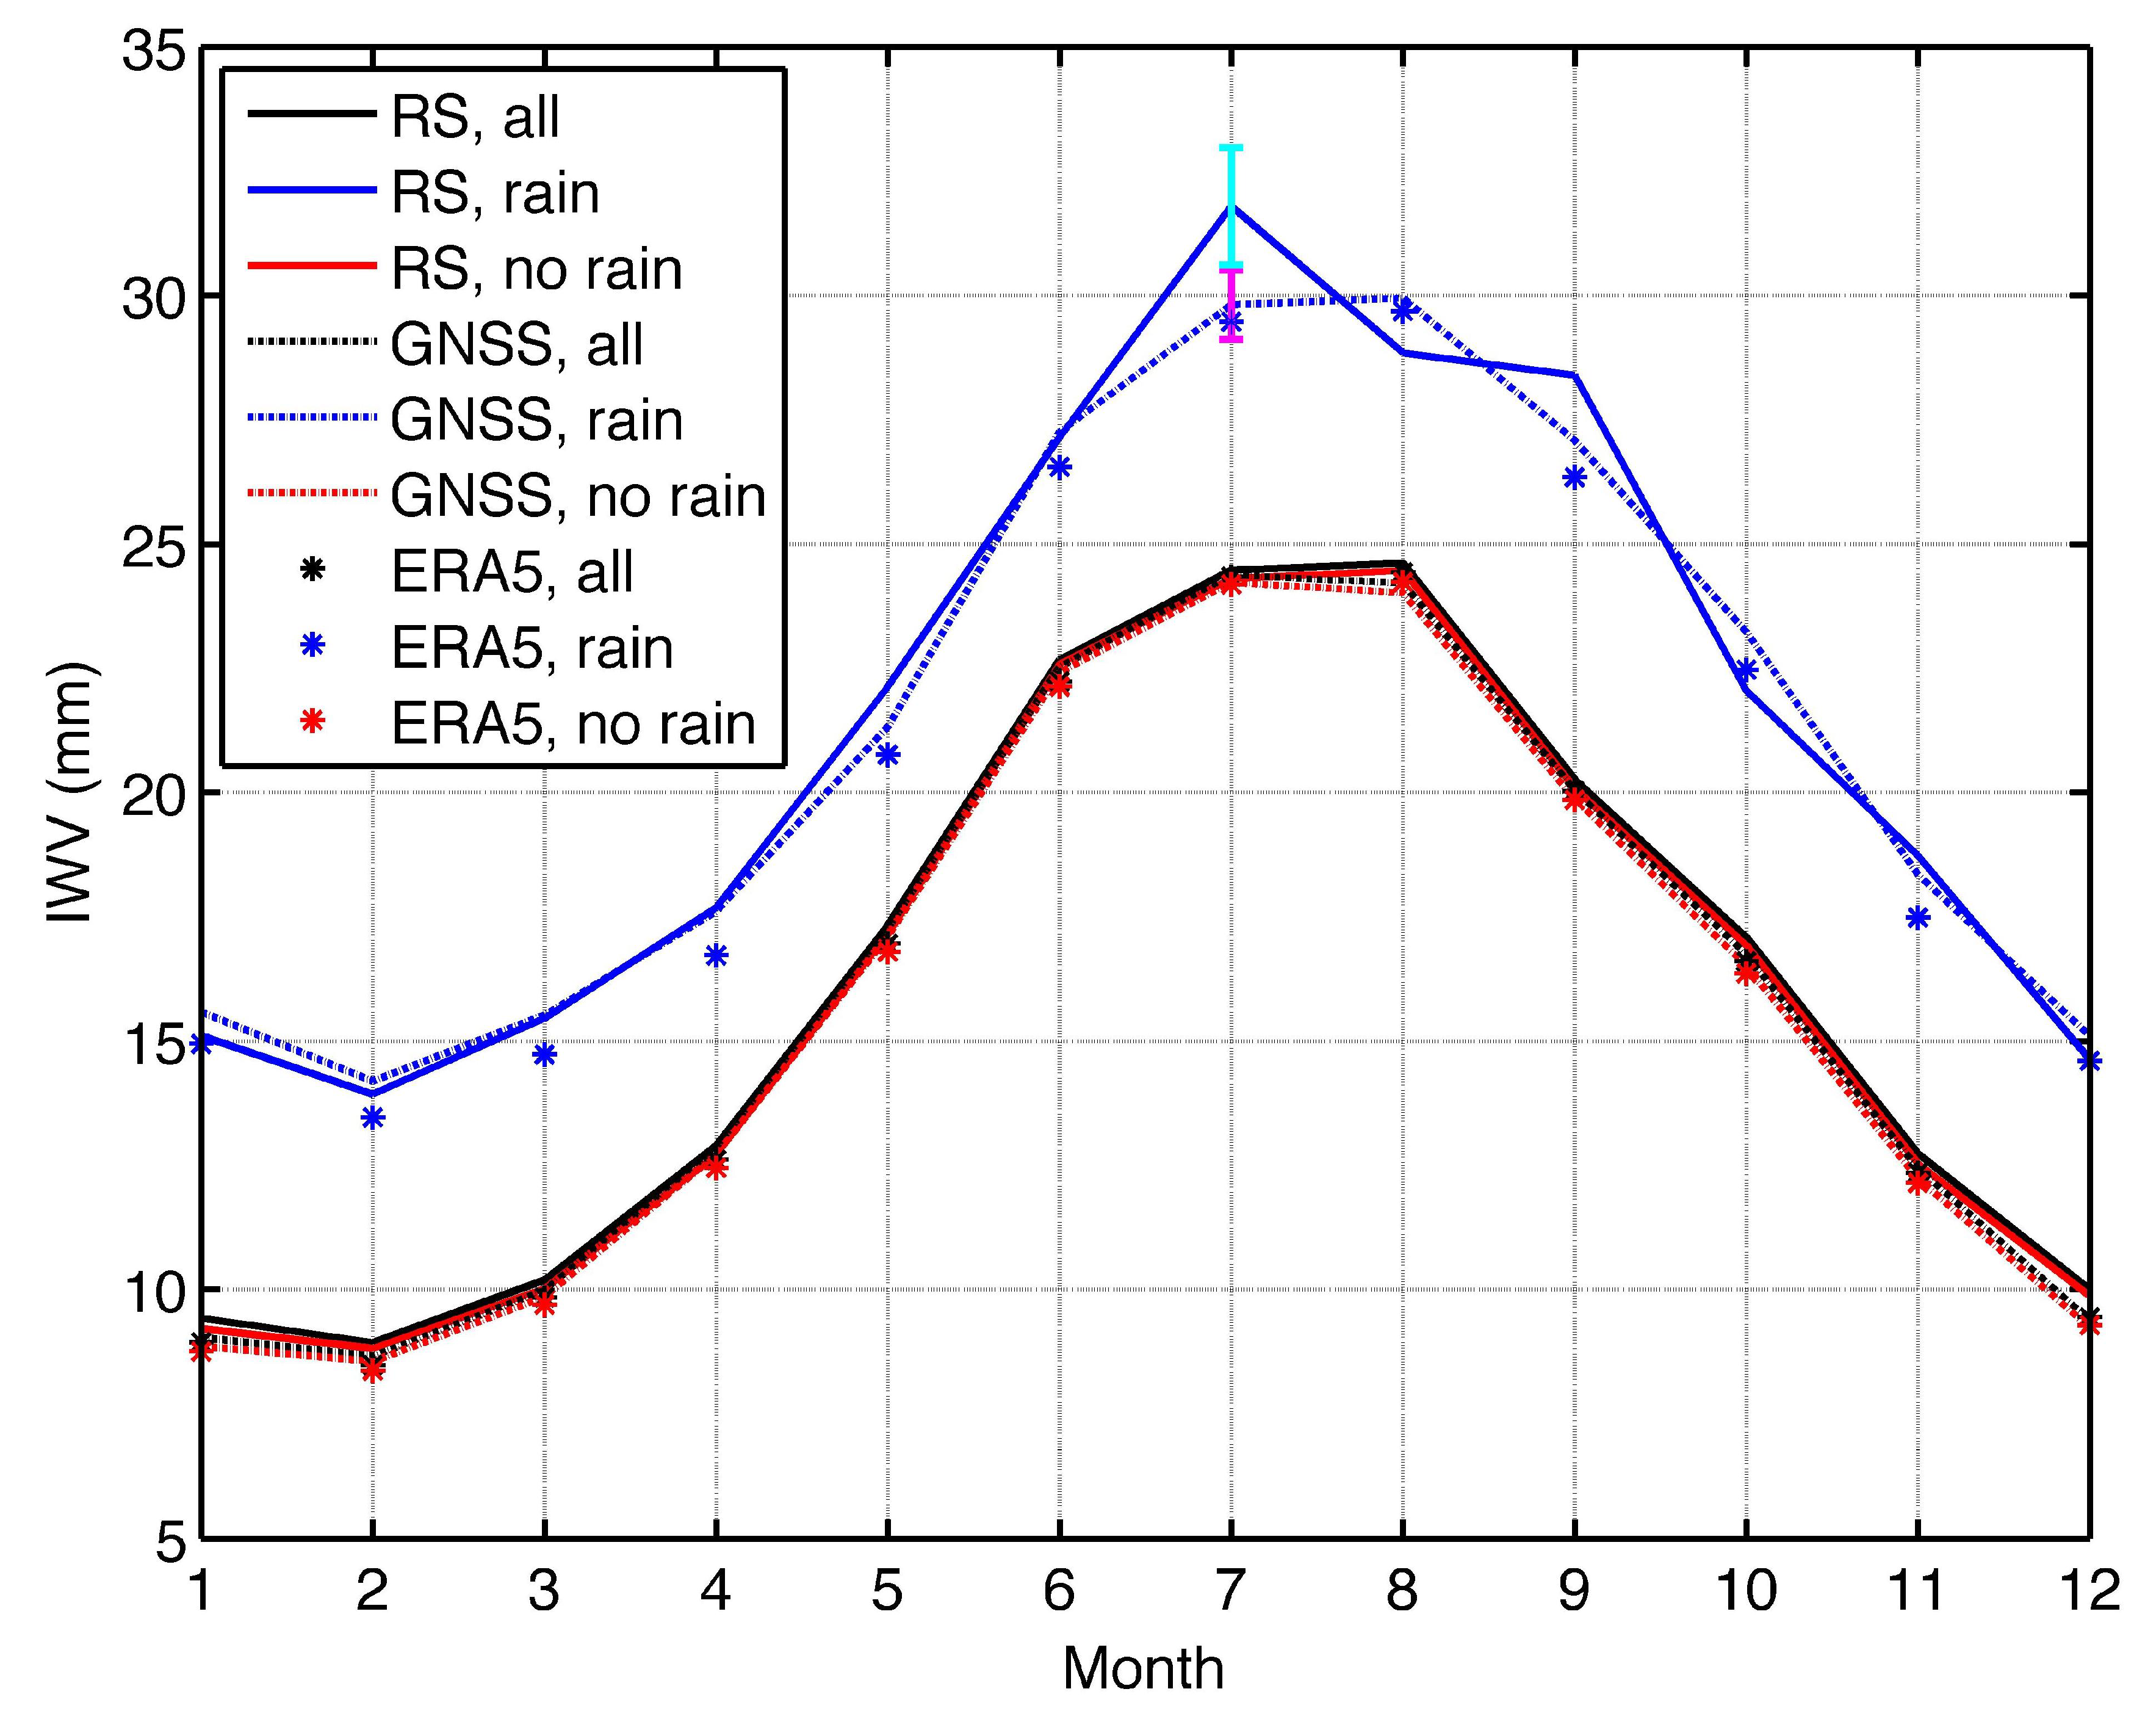
The climatology of IWV is shown in Figure 2 for the different datasets at Payerne from June 2001 to March 2018. First of all, the agreement between the different curves is remarkable. Rain periods are indicated by precipitation rates >0.1 mm/10 min as measured by the rain gauge at Payerne. The uncertainty of GNSS is indicated by the magenta error bar in July which has a size of ±0.7 mm according to the error estimation of [11]. The error of the mean would be too small because of the high number of GNSS IWV samples during a month, and the standard deviation would be too large because of the natural variability of IWV. For the radiosonde (RS), the error of the mean is the limiting factor because of the coarse sampling (two measurements per day). Rainfall events can be easily missed by the radiosonde. The error of the mean is indicated by the cyan error bar which has a size of ±1.2 mm in July. The uncertainty of RS IWV(rain) ranges from about 0.5 mm in winter to 1.2 mm in summer.
During all months, all IWV(rain) curves are about 5 to 6 mm higher than the IWV(no rain) curves. Thus, it makes sense to derive annual mean values which are listed in Table 1. In addition, the IWV(all) curves are only slightly higher than the IWV(no rain) curves so that it is not a big deal when an instrument cannot measure IWV during rain.
Table 1 presents the annual mean differences of the atmospheric states for the different datasets. The mean differences are derived from the 12 monthly mean values. For example, we calculated the annual mean difference between ‘rain’ and ‘no rain’ in this manner
The difference between IWV(rain) and IWV(no rain) ranges from 5.25 to 5.78 mm. The RS values are in between the GNSS and ERA5 values. Of course, we should keep in mind that the ERA5 values depend on the assimilated RS data at Payerne. IWV(all) is only slightly greater than IWV(no rain) by 0.16 to 0.17 mm.
In the present study, we consider the radiosonde as the reference instrument. Table 2 shows the mean differences and the root mean square errors (RMSE) of GNSS and ERA5 with respect to the radiosonde. The annual mean differences are derived in such a manner
GNSS and ERA5 slightly underestimate IWV compared to the radiosonde by up to 0.26 mm (GNSS) and 0.72 mm (ERA5).
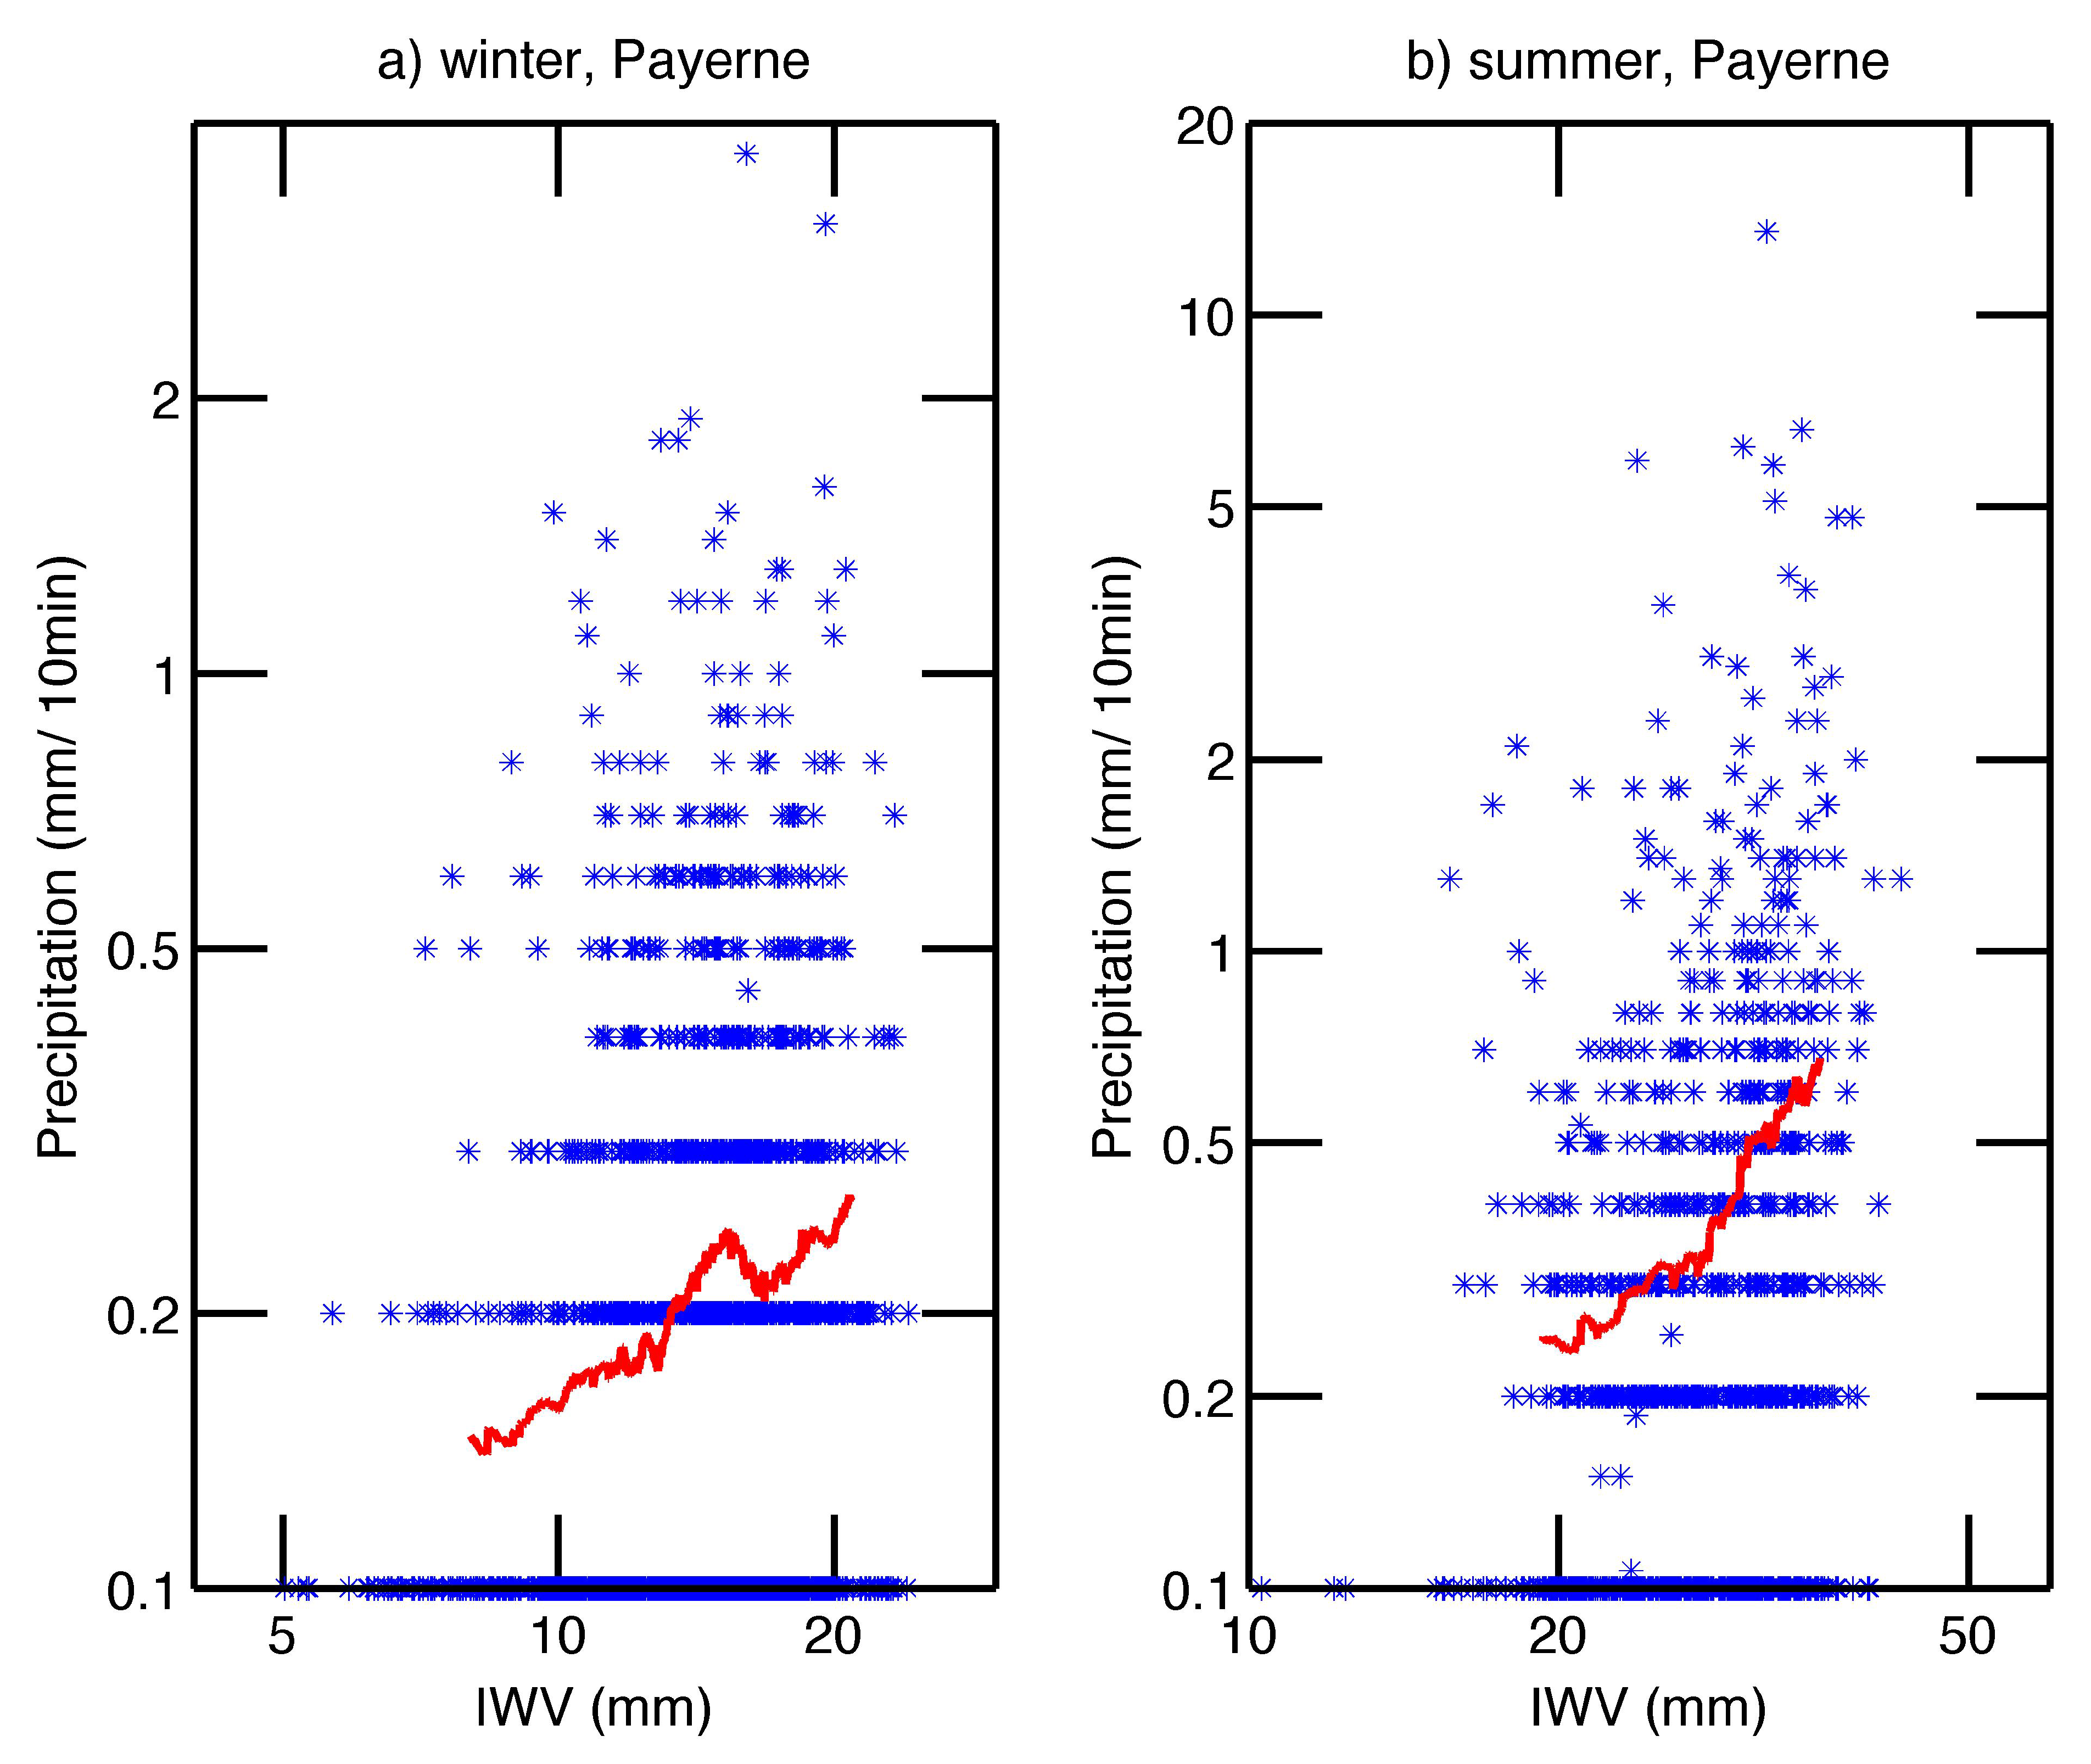
We would also like to investigate the relationship between IWV and the precipitation rate. Here, we focus on winter and summer in order to avoid the strong seasonal change of IWV around the equinox. Figure 3a shows a logarithmic scatter plot for winter (December, January, February) in Payerne. The rain gauge measurements of the precipitation rate are interpolated to the hourly grid of the GNSS receiver. We only consider the data pairs (IWV, prec) with a precipitation rate ≥0.1 mm/10 min. The blue stars have a correlation coefficient (with 95% confidence interval). So, the correlation of IWV and precipitation rate is weak. Figure 3b shows the results for summer (June, July, August) in Payerne. The correlation coefficient is . The relationship between IWV and the precipitation rate becomes clear when we apply a moving average over 250 data pairs to the observations. For this sake, the data pairs (IWV, prec) are sorted in ascending order of IWV. Then, the moving average is shifted from the low to the high values of IWV so that smoothed data pairs are obtained. The red curves in Figure 3 clearly show an increase of the precipitation rate with an increase of IWV for the winter and summer. This result is in a qualitative agreement with the study of [4] about the correlation of IWV and rain rate over the tropical oceans. The precipitation rate at Payerne is mostly below 2 mm/10 min which corresponds to 12 mm/h. A time-lagged correlation analysis is not possible, since the data pairs are irregularly spaced in time. However, it would be interesting to perform a superposed epoch analysis of IWV before, during and after rainfall, in order to study how rain removes the water vapor from the atmosphere. But this is a topic for a follow-on study.
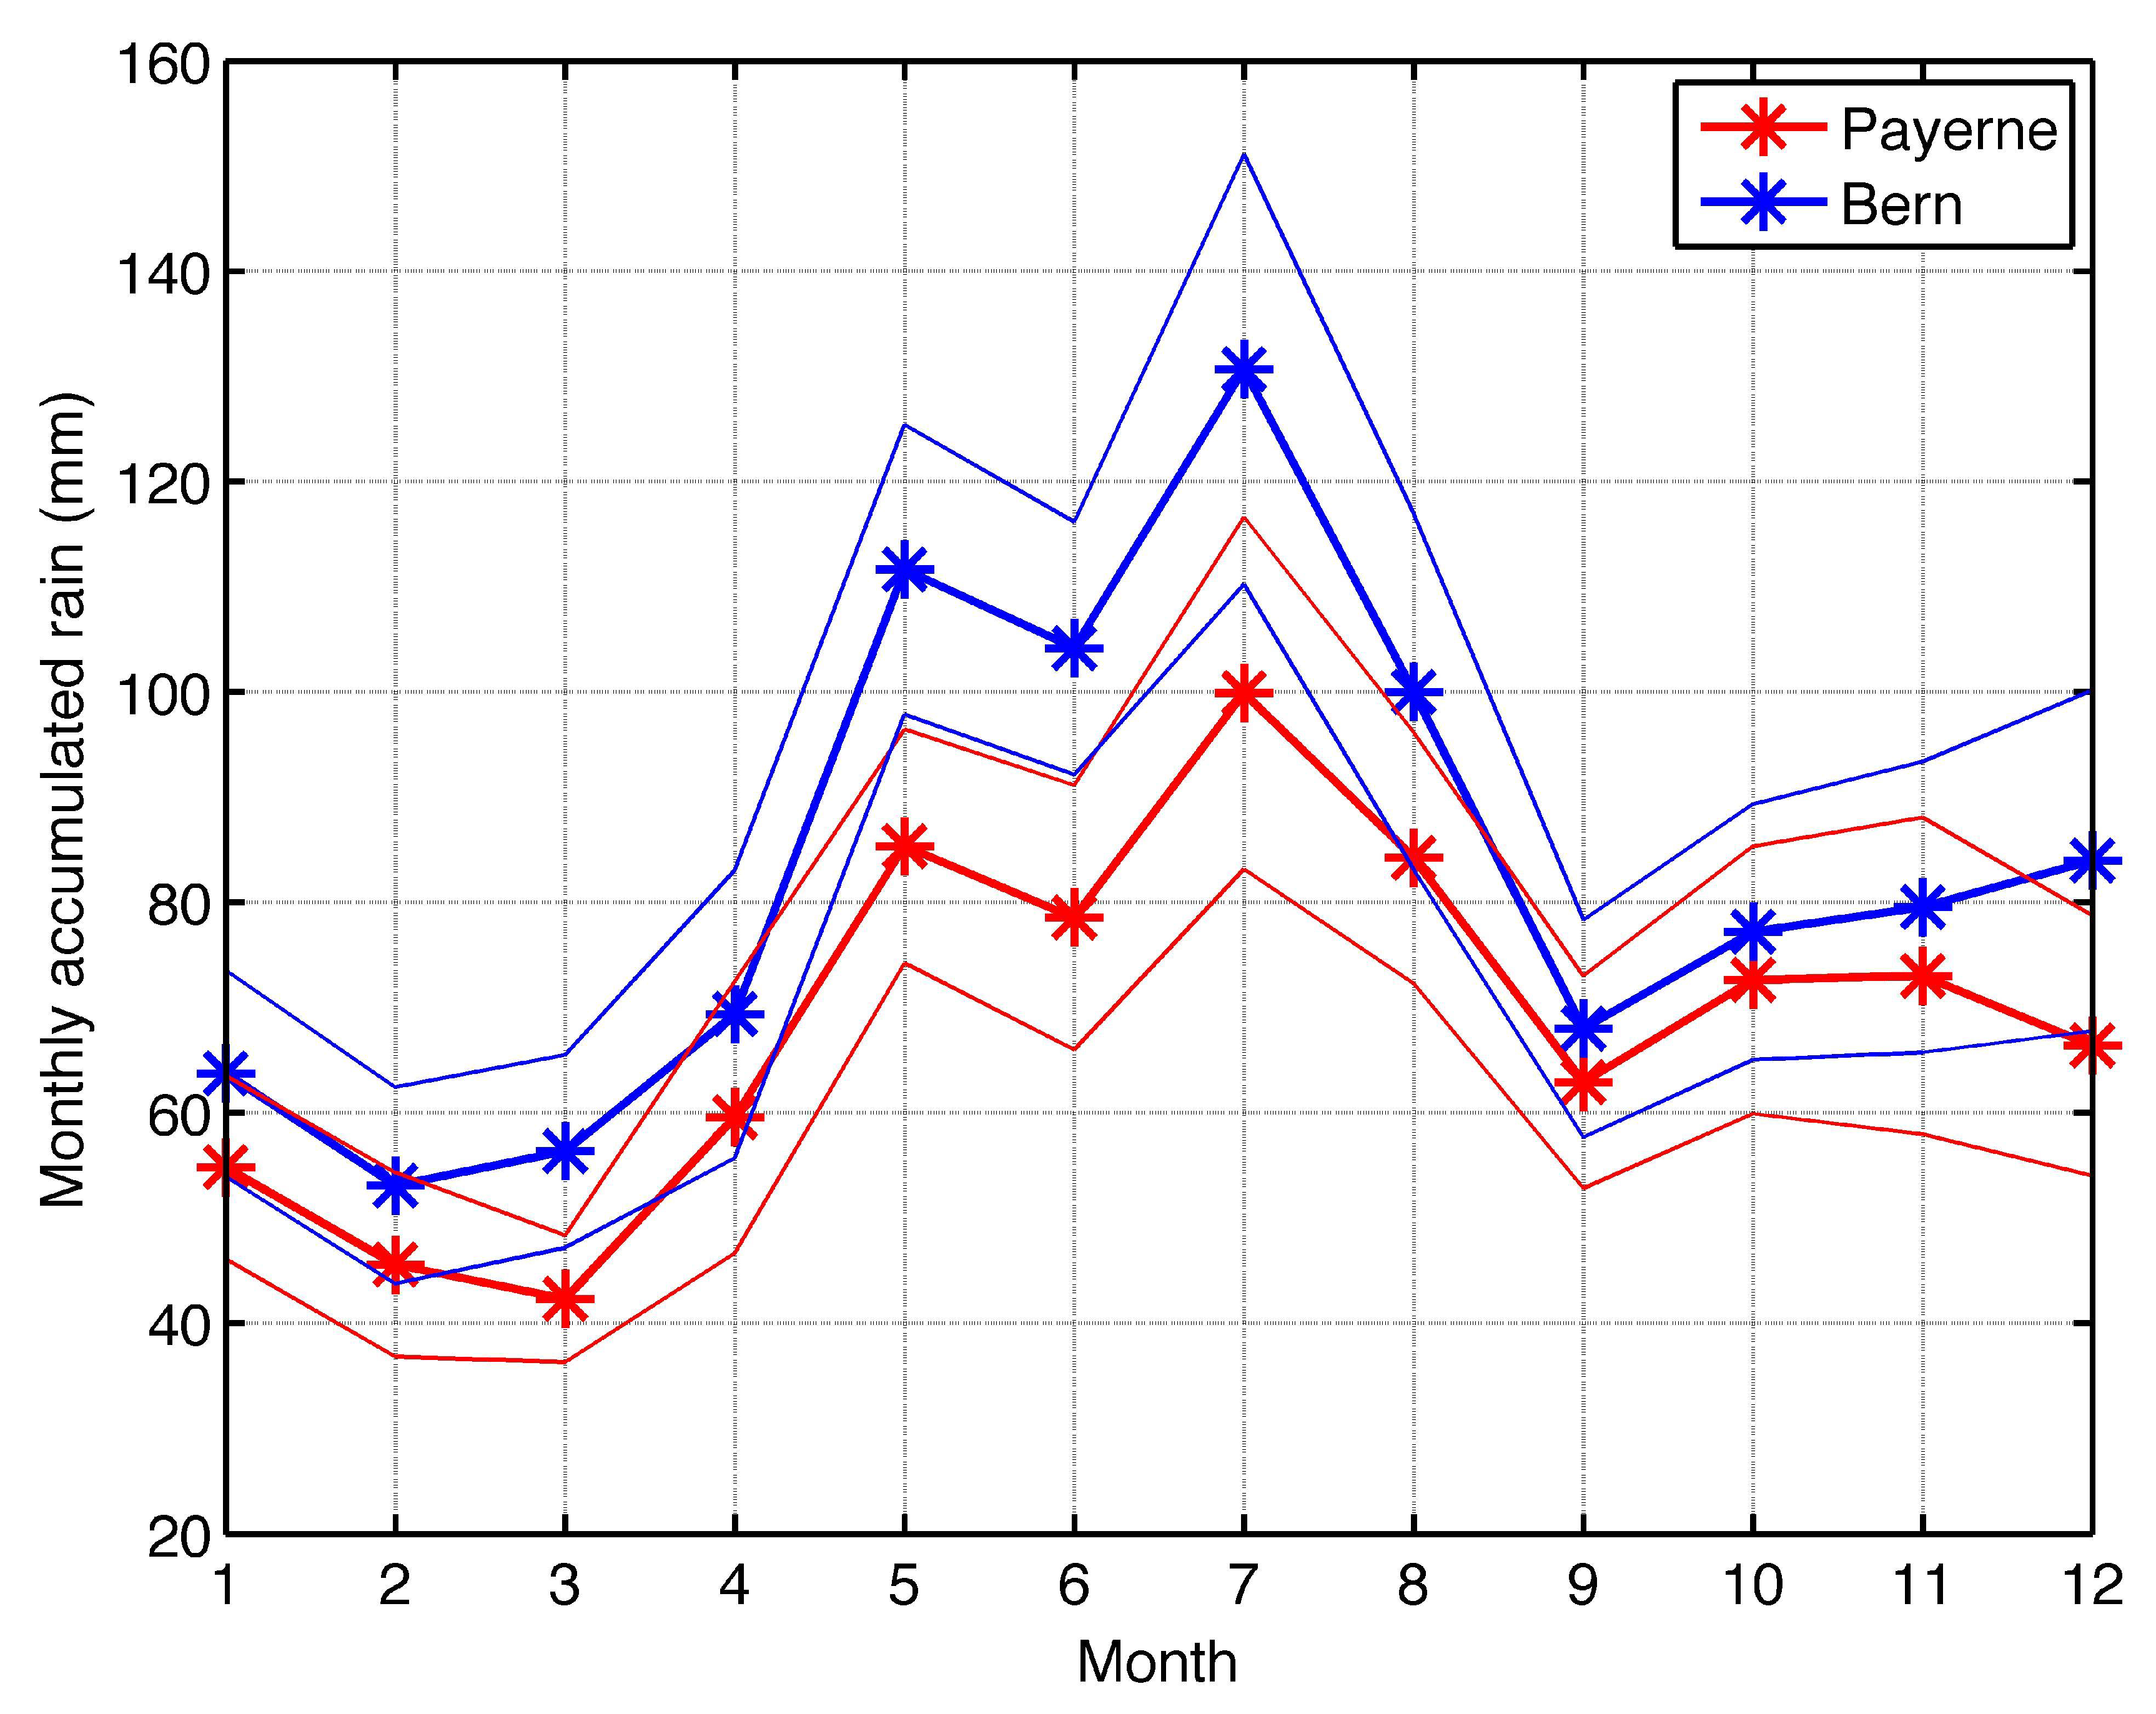
The seasonal variation of the monthly accumulated precipitation is derived from ten years of rain gauge measurements at Payerne and Bern (January 2007–December 2016). The observations before January 2007 were not included because of data gaps in the rain gauge series at Bern. Figure 4 shows that precipitation is increased during summer which is similar to the IWV increase during summer. Precipitation maxima occur in May and July at Payerne and Bern. During all months, the mean precipitation at Bern is greater than at Payerne. This cannot be explained by differences in IWV at the two locations. Possibly, it is due to differences in the advection and convection processes of moist air at Payerne and Bern. Figure 4 shows a large interannual variability of the monthly precipitation which is denoted by the error of the mean (thin lines). On the other hand, the interannual variability of IWV above the Swiss Plateau is quite small [11]. It is beyond the scope of the present study to investigate the reasons for precipitation, and thus we return to the climatology of IWV in the next subsection.
3.2. Bern
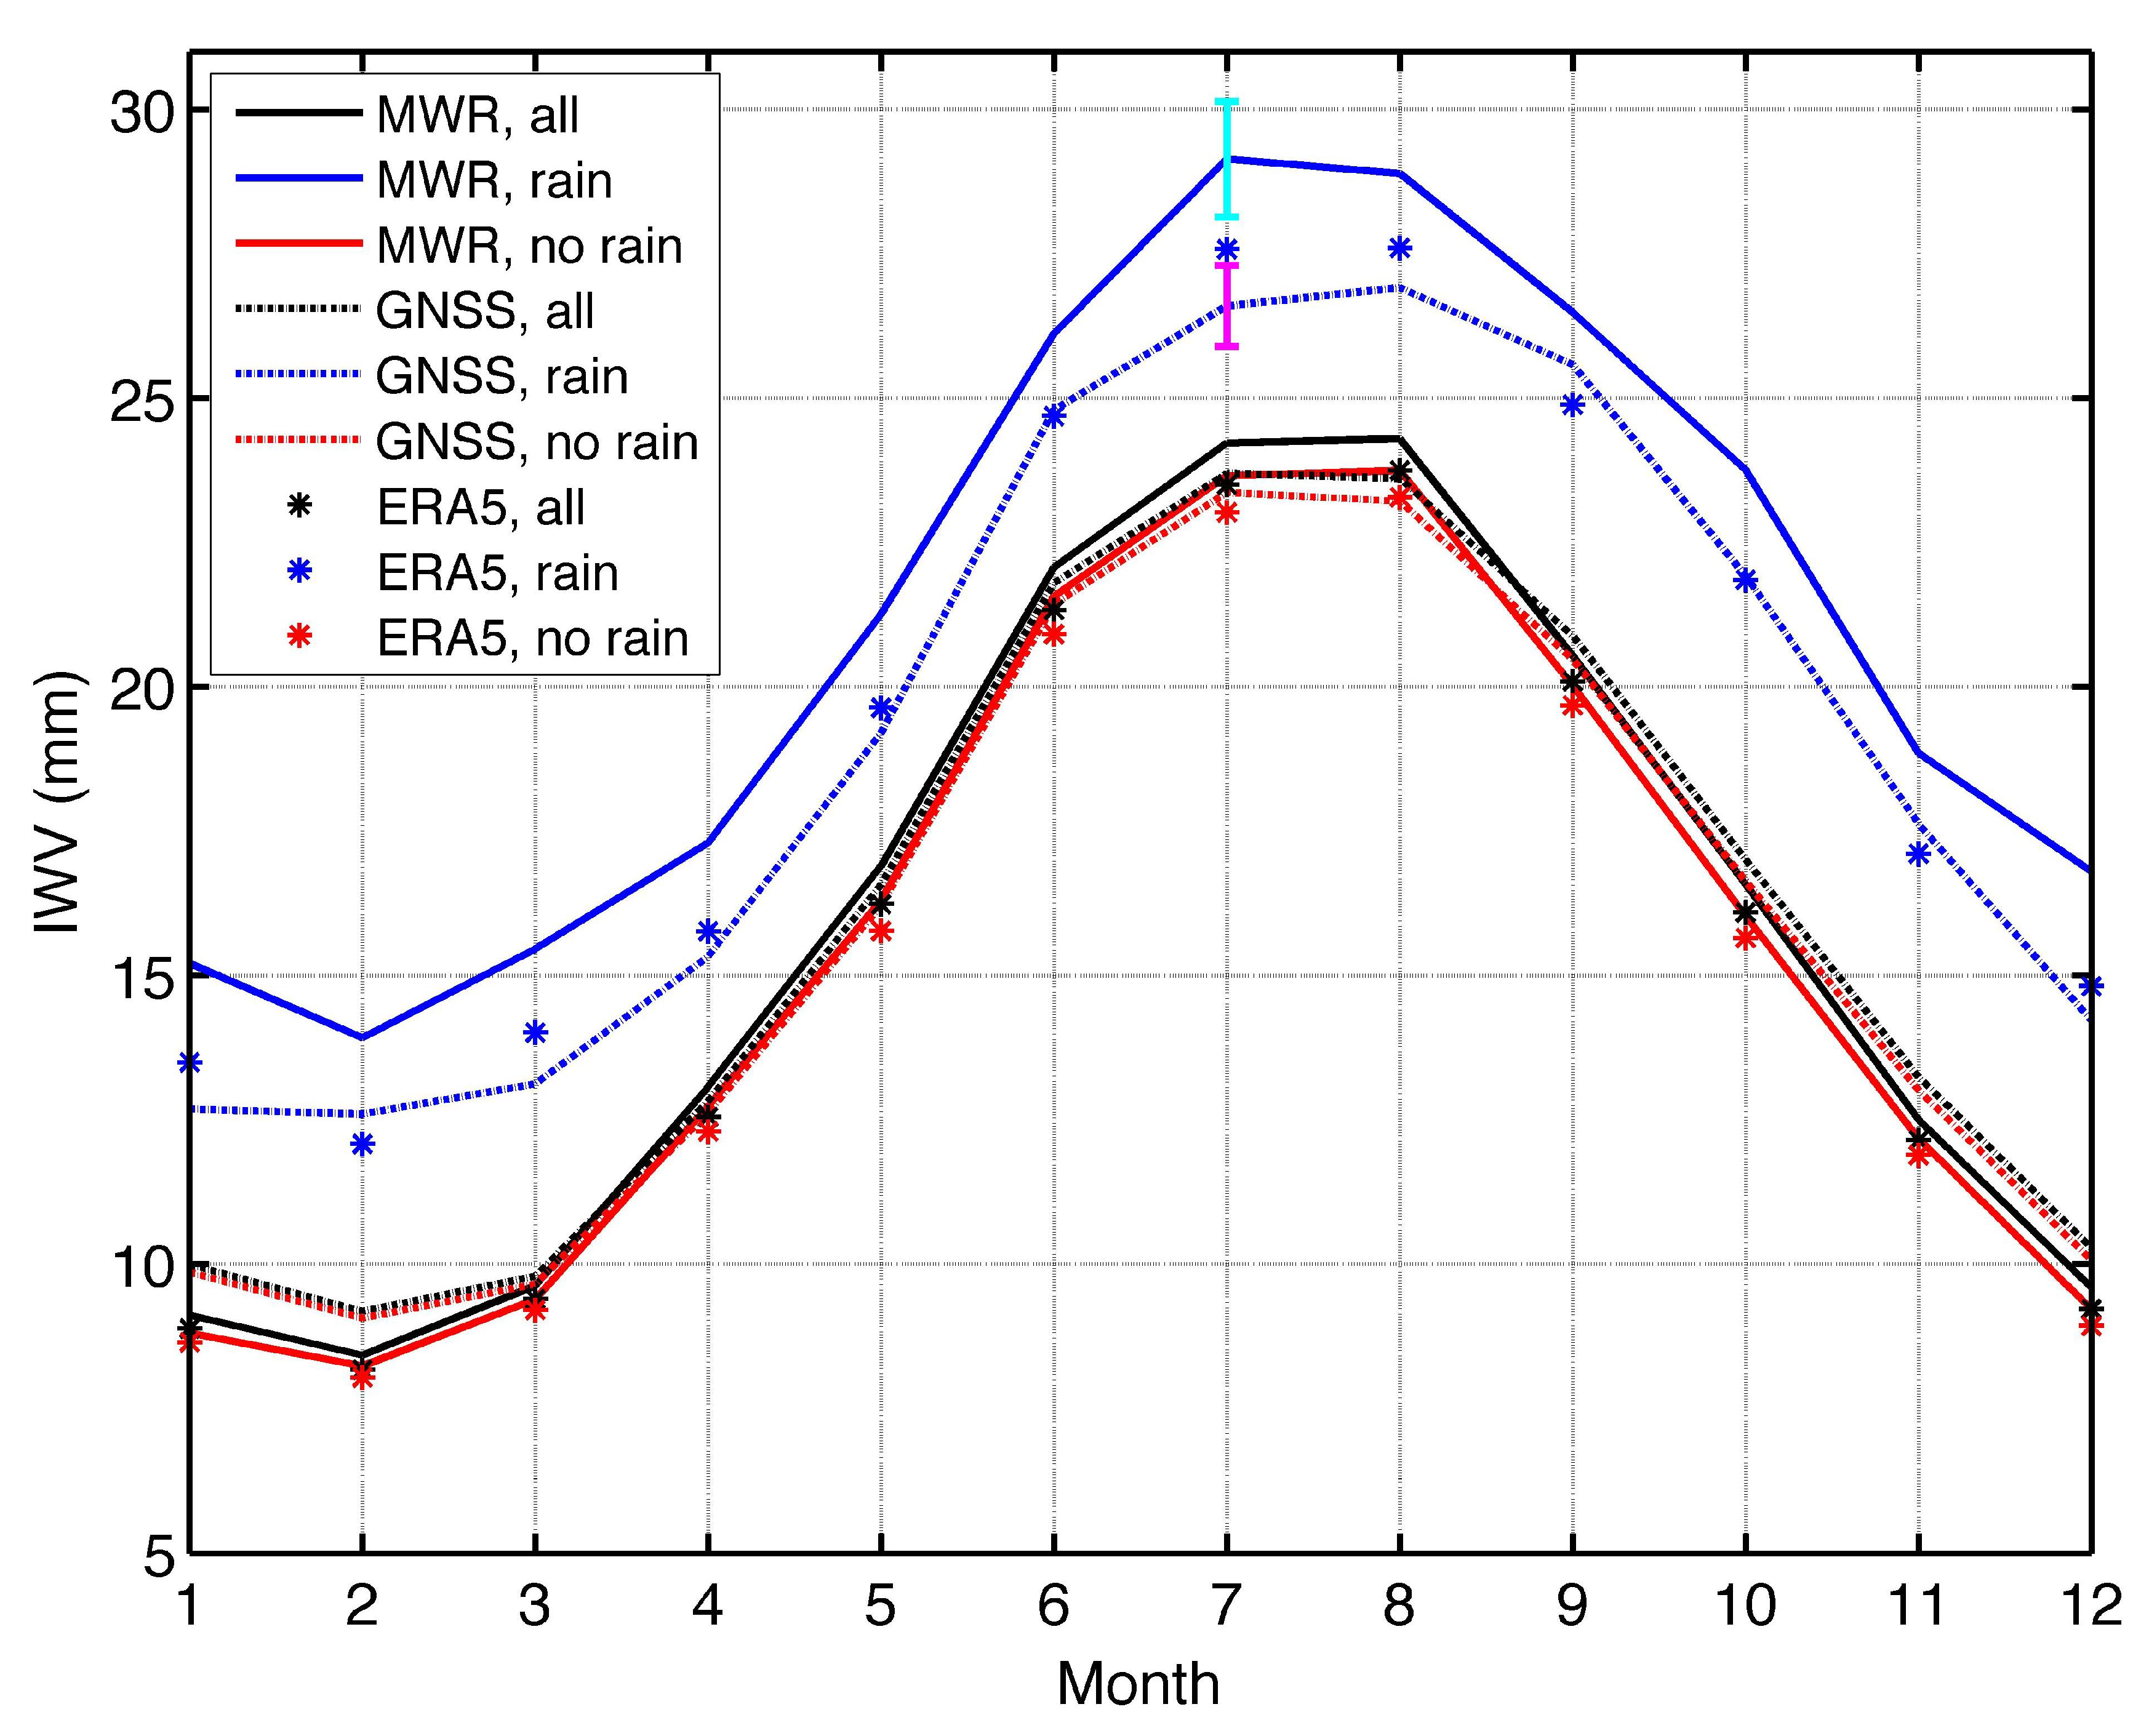
Since we have no radiosonde at Bern, we consider the GNSS station as the reference instrument. Later in the Section Discussion, we add an intercomparison between the Bern datasets and the Payerne radiosonde. The climatology of IWV is shown in Figure 5 for the different datasets at Bern from January 2004 to December 2016. Rain periods are indicated by integrated liquid water (ILW) ≥ 0.4 mm. The microwave radiometer (MWR) TROWARA observes IWV, ILW and rain rate with a temporal resolution of 6–13 s [18,28].
Compared to Payerne, the differences between the datasets (MWR, GNSS, ERA5) are greater at Bern. However, the IWV climatologies at Bern also show increased IWV values when it rains for all months. Thus, it makes sense to derive the annual mean values which are listed in Table 3. The estimated uncertainty of IWV is about ±1 mm for MWR and ±0.7 mm for GNSS according to [11]. The error bars are shown in Figure 5 for IWV(rain) in July.
Compared with GNSS and ERA5, the mean differences of the MWR in Table 3 are in better agreement with those of the radiosonde at Payerne in Table 1 with exception of the difference all–no rain. It seems that GNSS and ERA5 at Bern are underestimating IWV when it rains. A comparison between IWV at Bern and Payerne is appropriate since the horizontal distance is about 40 km and both locations are in the Swiss Plateau. However, the altitude of Payerne is about 84 m lower than Bern. This altitude difference causes an increase of the Payerne IWV values by about 0.8 mm in summer compared to Bern (according to Equation (12)).
Table 4 shows the annual mean differences and the RMSE of MWR and ERA5 with respect to GNSS. IWV of MWR(rain) is 1.88 mm greater than GNSS(rain). We will see later that this could be due to a failure of the GNSS station at Bern.
4. Discussion
We found for all months that IWV(rain) is greater than IWV(no rain) by about 3.75 to 5.94 mm. The rain–no rain differences at Payerne are closer together ranging from 5.60 to 5.78 mm. These results agree well with previous studies of [5,6]. Generally, the IWV increase during rain is due to a convergence of moist air and an uplift. The uplift of moist air causes an increase in the water vapor column density. Further, the associated adiabatic cooling of the moist air generates cloud and rain droplets so that a relationship between increase of IWV and increase of precipitation rate is expected. This relationship is obvious in Figure 3 when a moving average is taken over 250 data pairs of IWV and precipitation rate at Payerne.
Generally, the IWV differences between the datasets are less than 1 mm (Table 2 and Table 4) with exception of one difference value: 1.88 mm for IWV(MWR, rain)–IWV(GNSS, rain) at Bern. Our first idea was that the high temporal resolution of 6 to 13 s for the IWV data of the MWR may lead to higher IWV values. Thus, we averaged the TROWARA IWV and ILW data to hourly averages. The results are given in Table 5. In addition, the rain threshold was reduced from 0.4 mm to 0.2 mm which is more appropriate for the smoothed time series of ILW. IWV(MWR, rain)–IWV(GNSS, rain) changed from 1.88 mm to 1.40 mm which is a bit smaller. We also tried an ILW threshold of 0.3 mm but the results remained quite similar. The choice of the rain threshold has some effect on IWV(rain) but the choice is rather limited. For example, if we only consider precipitation rates greater than 0.3 mm/10 min (instead of 0.1 mm/10 min) then the amount of the rain data is strongly decreased which is also not desirable. However, one can expect that IWV(rain) will increase with a higher threshold of the precipitation rate.
The other idea was already mentioned: the IWV curves of the MWR at Bern seem to be similar to those of the radiosonde at Payerne. Using Equation (12), we can decrease the IWV values of the Payerne radiosonde, so that the height difference between Payerne (491 m) and Bern (575 m) and its influence on IWV are adequately accounted. In addition, we use the same time interval (1 January 2004–31 December 2016) for the datasets of Payerne and Bern. Table 6 shows a nice agreement between the MWR at Bern and the radiosonde at Payerne. The differences MWR–RS were less than 0.41 mm which is an excellent result. On the other hand, GNSS and ERA5 at Bern underestimate IWV when it rains by about 1.23 to 1.47 mm compared to the Payerne radiosonde.
Previous studies of [11,12] also compared IWV at Bern with IWV at Payerne. Both locations are in a 40 km distance within the Swiss Plateau, and IWV does not vary so much as precipitation. Indeed, GNSS IWV at Payerne is closer to TROWARA IWV at Bern than GNSS IWV at Bern. This is due to the limitations of the GNSS station at Bern which is located on the top of a large university building. The building has thermal expansions and contractions during the year, which may have an influence on GNSS IWV.
The ILW threshold is certainly the best way to distinguish between rain and rain-free measurements of TROWARA because of the spatial and temporal coincidence of the ILW and IWV measurements of TROWARA. However, the ILW threshold is not so compatible with the precipitation rate limit of the rain gauge at Payerne. This can be seen if the fraction of rain periods are calculated for the different rain criteria. Using the 0.4 mm ILW threshold, the fraction of rain periods is 7.4% for TROWARA at Bern. Using the 0.1 mm/10 min threshold given by the rain gauges at Bern and Payerne, we only get a fraction of rain periods of 3.6% at Bern and 2.9% at Payerne. Thus, we should derive the mean differences of TROWARA, GNSS and ERA5 at Bern with respect to the radiosonde at Payerne when we use the rain gauge at Bern for the distinction between rain and rain-free periods at Bern. Here, the same precipitation limit (>0.1 mm/10 min) is used by the rain gauge at Payerne.
Table 7 confirms most of the results of Table 6. The only remarkable exception is the mean difference MWR-RS(no rain) which changed from 0.02 mm to 0.44 mm. GNSS and ERA5 at Bern still underestimate IWV(rain) by more than 1 mm compared to the radiosonde in Payerne. The underestimation of IWV(rain) by the GNSS station at Bern cannot be explained by the limited standard retrieval which would rather result in an overestimation of IWV(rain). The GNSS at Bern is not as reliable as the GNSS at Payerne. Different to the Payerne GNSS station, the Bern GNSS station was never a part of the automated GNSS network in Switzerland (AGNES) which is operated by the Swiss Federal Office of Topography. The operation of the Bern GNSS station was stopped in 2017. Bernet et al. [11] reported a bias between GNSS at Bern and TROWARA whereas they found a good agreement between the Payerne GNSS and TROWARA. The underestimation of IWV(rain) at Bern by ERA5 (−1.19 mm compared to the radiosonde) is greater than at Payerne (−0.72 mm in Table 2).
The mean differences of MWR, GNSS and radiosonde of the present study are only a bit different from those of previous studies. Differences can be due to the RMSE of the IWV measurements and to different seasons or years of the analyzed datasets. The determination of in Equation (7) can be slightly different in various studies [21]. Morland [12] obtained rain-free IWV differences of −0.62 to −0.80 mm of TROWARA compared to radiosonde and GNSS respectively. A reason for the negative bias of TROWARA–radiosonde is that [12] did not apply an altitude correction to IWV from the Payerne radiosonde. Since Bern is about 84 m higher than Payerne, the Payerne IWV should be reduced by about 0.67 mm for IWV = 20 mm. Thus, the true bias is closer to 0 mm than reported by [12]. Martin et al. [33] found an agreement between MWR and radiosonde of better than 0.15 mm for rain-free data. In difference to [12], they reported a dry bias of about 0.5 mm for GNSS compared to MWR or radiosonde during rain-free periods. However, in agreement with [33] the present study also found mean IWV differences less than 0.5 mm for rain-free periods. Van Malderen et al. [34] obtained mean IWV differences from −0.3 to 0.5 mm by comparing different measurement techniques with GNSS. Cimini et al. [35] compared IWV measurements from MWR, GNSS and radiosonde during a measurement campaign in Italy and found mean differences between 0.2 and 0.4 mm and RMSE less than 1 mm. Virolainen et al. [36] derived the upper bound of uncertainties for clear-sky measurements of IWV at St. Petersburg and found 0.29 mm for Fourier transform infrared spectrometer, 0.55 mm for GNSS and 0.76 mm for MWR.
5. Conclusions
We intercompared the climatologies of IWV(rain), IWV(no rain), and IWV(all) obtained by radiosonde, ground-based GNSS atmosphere sounding, ground-based MWR, and ECMWF reanalysis (ERA5) at Payerne and Bern in Switzerland. In all seasons, IWV(rain) is 3.75 to 5.94 mm greater than IWV(no rain). The mean IWV differences between GNSS and radiosonde at Payerne are small (less than 0.26 mm). The datasets at Payerne show a better agreement than the datasets at Bern. However, the MWR at Bern agrees with the radiosonde at Payerne within 0.41 mm for IWV(rain) and 0.02 mm for IWV(no rain) (Table 6). We find that IWV(rain) increases with increase of the precipitation rate during summer as well as during winter in Payerne. We showed that the linear interpolation of MWR measurements during rain periods is a good estimate and that GNSS measurements perform well during rain periods. IWV(rain) is quite well-estimated by GNSS and MWR in the Swiss Plateau though the standard retrievals are limited or hampered during rain periods. However, we obtained IWV(rain) for low and moderate precipitation (mostly < 12 mm/h), and measurement of IWV(rain) would be more difficult in regions with heavy rainfall. It would be a challenge to perform a similar IWV study for heavy rainfalls at a tropical observation site equipped with radiosonde, GNSS and MWR.
Author Contributions
Conceptualization, K.H.; methodology, K.H.; software, C.M., L.B., K.H., W.W.; validation, K.H., A.H., M.H.; formal analysis, K.H.; investigation, all; resources, all; data curation, all; writing—original draft preparation, K.H., all; project administration, K.H.; funding acquisition, all. All authors have read and agreed to the published version of the manuscript.
Funding
Financial support by MeteoSwiss in the framework of a rain rate monitoring project of GCOS Switzerland. W.W. is funded by a fellowship of the China Scholarship Council. L.B. has a research fellowship of the Swiss National Science Foundation.
Institutional Review Board Statement
Not applicable.
Informed Consent Statement
Not applicable.
Data Availability Statement
The datasets are in the startwaveh2o database at http://www.iapmw.unibe.ch/research/projects/STARTWAVE/ accessed on 17 May 2021. TROWARA data with high temporal resolution can be provided upon request (K.H.).
Acknowledgments
We thank the technical staff at MeteoSwiss Payerne, IAP Bern and swisstopo Wabern for operation of radiosondes, rain gauge, microwave radiometer and GNSS stations. We thank the reviewers for their comments and improvements.
Conflicts of Interest
The authors declare no conflict of interest.
References
- Kiehl, J.T.; Trenberth, K.E. Earth’s annual global mean energy budget. Bull. Am. Meteorol. Soc. 1997, 78, 197–208. [Google Scholar] [CrossRef] [Green Version]
- Held, I.M.; Soden, B.J. Water vapor feedback and global warming. Annu. Rev. Energy Environ. 2000, 25, 441–475. [Google Scholar] [CrossRef] [Green Version]
- Azad, R.; Sorteberg, A. Extreme daily precipitation in coastal western Norway and the link to atmospheric rivers. J. Geophys. Res. Atmos. 2017, 122, 2080–2095. [Google Scholar] [CrossRef]
- Bretherton, C.S.; Peters, M.E.; Back, L.E. Relationships between water vapor path and precipitation over the tropical oceans. J. Clim. 2004, 17, 1517–1528. [Google Scholar] [CrossRef]
- Zhang, W.; Xu, G.; Xi, B.; Ren, J.; Wan, X.; Zhou, L.; Cui, C.; Wu, D. Comparative study of cloud liquid water and rain liquid water obtained from microwave radiometer and micro rain radar observations over central China during the monsoon. J. Geophys. Res. Atmos. 2020, 125, e2020JD032456. [Google Scholar] [CrossRef]
- Graham, E.; Koffi, E.N.; Mätzler, C. An observational study of air and water vapour convergence over the Bernese Alps, Switzerland, during summertime and the development of isolated thunderstorms. Meteorol. Z. 2012, 21, 561–574. [Google Scholar] [CrossRef]
- Solheim, F.S.; Vivekanandan, J.; Ware, R.H.; Rocken, C. Propagation delays induced in GPS signals by dry air, water vapor, hydrometeors, and other particulates. J. Geophys. Res. Atmos. 1999, 104, 9663–9670. [Google Scholar] [CrossRef]
- Battaglia, A.; Saavedra, P.; Rose, T.; Simmer, C. Characterization of precipitating clouds by ground-based measurements with the triple-frequency polarized microwave radiometer ADMIRARI. J. Appl. Meteorol. Climatol. 2010, 49, 394–414. [Google Scholar] [CrossRef] [Green Version]
- Wentz, F.J.; Spencer, R.W. SSM/I rain retrievals within a unified all-weather ocean algorithm. J. Atmos. Sci. 1998, 55, 1613–1627. [Google Scholar] [CrossRef] [Green Version]
- Morland, J.; Collaud Coen, M.; Hocke, K.; Jeannet, P.; Mätzler, C. Tropospheric water vapour above Switzerland over the last 12 years. Atmos. Chem. Phys. 2009, 9, 5975–5988. [Google Scholar] [CrossRef] [Green Version]
- Bernet, L.; Brockmann, E.; von Clarmann, T.; Kämpfer, N.; Mahieu, E.; Mätzler, C.; Stober, G.; Hocke, K. Trends of atmospheric water vapour in Switzerland from ground-based radiometry, FTIR and GNSS data. Atmos. Chem. Phys. 2020, 20, 11223–11244. [Google Scholar] [CrossRef]
- Morland, J. TROWARA—Rain Flag Development and Stability of Instrument and Calibration; IAP Research Report 2007-14-MW; Institut für Angewandte Physik, Universität Bern: Bern, Switzerland, 2007. [Google Scholar]
- Hicks-Jalali, S.; Sica, R.J.; Martucci, G.; Maillard Barras, E.; Voirin, J.; Haefele, A. A Raman lidar tropospheric water vapour climatology and height-resolved trend analysis over Payerne, Switzerland. Atmos. Chem. Phys. 2020, 20, 9619–9640. [Google Scholar] [CrossRef]
- MeteoLabor. MeteoLabor SRS-C34 Digital Radiosonde. Technical Report. Available online: http://www.meteolabor.ch/fileadmin/user_upload/pdf/meteo/UpperAir/srs-c34_e.pdf (accessed on 1 July 2010).
- Wexler, A. Vapor pressure formulation for water in range 0 to 100 °C. A revision. J. Res. Natl. Bur. Stand. Sect. A Phys. Chem. 1976, 80A, 775–785. [Google Scholar] [CrossRef] [PubMed]
- Cossu, F.; Hocke, K.; Martynov, A.; Martius, O.; Mätzler, C. Atmospheric water parameters measured by a ground-based microwave radiometer and compared with the WRF model. Atmos. Sci. Lett. 2015, 16, 465–472. [Google Scholar] [CrossRef] [Green Version]
- Cossu, F.; Hocke, K.; Mätzler, C. A 10-year cloud fraction climatology of liquid water clouds over Bern observed by a ground-based microwave radiometer. Remote Sens. 2015, 7, 7768–7784. [Google Scholar] [CrossRef] [Green Version]
- Mätzler, C.; Morland, J. Refined physical retrieval of integrated water vapor and cloud liquid for microwave radiometer data. IEEE Trans. Geosci. Remote Sens. 2009, 47, 1585–1594. [Google Scholar] [CrossRef]
- Davis, J.L.; Herring, T.A.; Shapiro, I.I.; Rogers, A.E.E.; Elgered, G. Geodesy by radio interferometry: Effects of atmospheric modeling errors on estimates of baseline length. Radio Sci. 1985, 20, 1593–1607. [Google Scholar] [CrossRef]
- Bevis, M.; Businger, S.; Herring, T.A.; Rocken, C.; Anthes, R.A.; Ware, R.H. GPS meteorology: Remote sensing of atmospheric water vapor using the global positioning system. J. Geophys. Res. Atmos. 1992, 97, 15787–15801. [Google Scholar] [CrossRef]
- Baltink, H.K.; van der Marel, H.; van der Hoeven, A.G.A. Integrated atmospheric water vapor estimates from a regional GPS network. J. Geophys. Res. Atmos. 2002, 107, ACL 3-1–ACL 3-8. [Google Scholar] [CrossRef] [Green Version]
- Priego, E.; Jones, J.; Porres, M.; Seco, A. Monitoring water vapour with GNSS during a heavy rainfall event in the Spanish Mediterranean area. Geomat. Nat. Hazards Risk 2017, 8, 282–294. [Google Scholar] [CrossRef]
- Arief, S.; Heki, K. GNSS meteorology for disastrous rainfalls in 2017–2019 summer in SW Japan: A new approach utilizing atmospheric delay gradients. Front. Earth Sci. 2020, 8, 182. [Google Scholar] [CrossRef]
- Peter, R.; Kämpfer, N. Radiometric determination of water vapor and liquid water and its validation with other techniques. J. Geophys. Res. Atmos. 1992, 97, 18173–18183. [Google Scholar] [CrossRef]
- Morland, J. TROWARA—Tropospheric Water Vapour Radiometer. Radiometer Review and New Calibration Model; IAP Research Report 2002–2015; Institut für Angewandte Physik, Universität Bern: Bern, Switzerland, 2002. [Google Scholar]
- Mätzler, C.; Morland, J. Advances in Surface-Based Radiometry of Atmospheric Water; IAP Research Report 2008-02-MW; Institut für Angewandte Physik, Universität Bern: Bern, Switzerland, 2008. [Google Scholar]
- Hocke, K.; Navas Guzmán, F.; Cossu, F.; Mätzler, C. Cloud fraction of liquid water clouds above Switzerland over the last 12 years. Climate 2016, 4, 48. [Google Scholar] [CrossRef] [Green Version]
- Wang, W.; Hocke, K.; Mätzler, C. Physical retrieval of rain rate from ground-based microwave radiometry. Remote Sens. 2021, 13, 2217. [Google Scholar] [CrossRef]
- Cossu, F. Study of Atmospheric Water over Bern by Means of Ground-Based Observations and Numerical Simulations. Ph.D. Thesis, Philosophisch-Naturwissenschaftliche Fakultät, Universität Bern, Bern, Switzerland, 2015. [Google Scholar]
- Ingold, T.; Peter, R.; Kämpfer, N. Weighted mean tropospheric temperature and transmittance determination at millimeter-wave frequencies for ground-based applications. Radio Sci. 1998, 33, 905–918. [Google Scholar] [CrossRef]
- Hersbach, H.; Bell, B.; Berrisford, P.; Hirahara, S.; Horányi, A.; Muñoz-Sabater, J.; Nicolas, J.; Peubey, C.; Radu, R.; Schepers, D.; et al. The ERA5 global reanalysis. Q. J. R. Meteorol. Soc. 2020, 146, 1999–2049. [Google Scholar] [CrossRef]
- Parracho, A.C.; Bock, O.; Bastin, S. Global IWV trends and variability in atmospheric reanalyses and GPS observations. Atmos. Chem. Phys. 2018, 18, 16213–16237. [Google Scholar] [CrossRef] [Green Version]
- Martin, L.; Mätzler, C.; Hewison, T.J.; Ruffieux, D. Intercomparison of integrated water vapour measurements. Meteorol. Z. 2006, 15, 57–64. [Google Scholar] [CrossRef] [Green Version]
- Van Malderen, R.; Brenot, H.; Pottiaux, E.; Beirle, S.; Hermans, C.; De Mazière, M.; Wagner, T.; De Backer, H.; Bruyninx, C. A multi-site intercomparison of integrated water vapour observations for climate change analysis. Atmos. Meas. Tech. 2014, 7, 2487–2512. [Google Scholar] [CrossRef] [Green Version]
- Cimini, D.; Pierdicca, N.; Pichelli, E.; Ferretti, R.; Mattioli, V.; Bonafoni, S.; Montopoli, M.; Perissin, D. On the accuracy of integrated water vapor observations and the potential for mitigating electromagnetic path delay error in InSAR. Atmos. Meas. Tech. 2012, 5, 1015–1030. [Google Scholar] [CrossRef] [Green Version]
- Virolainen, Y.A.; Timofeyev, Y.M.; Kostsov, V.S.; Ionov, D.V.; Kalinnikov, V.V.; Makarova, M.V.; Poberovsky, A.V.; Zaitsev, N.A.; Imhasin, H.H.; Polyakov, A.V.; et al. Quality assessment of integrated water vapour measurements at the St. Petersburg site, Russia: FTIR vs. MW and GPS techniques. Atmos. Meas. Tech. 2017, 10, 4521–4536. [Google Scholar] [CrossRef] [Green Version]
Figure 1.
Example of a rain day at Bern (5 May 2007). (a) Zenith opacity at 31 GHz (black line) and cumulative rain (blue and red) measured by TROWARA. The solid and dashed green lines are cumulative rain observed by the rain gauge and the optical sensor respectively. (b) ILW observed by TROWARA. The ILW threshold of 0.4 mm separates between rain and rain-free periods. (c) IWV observed by TROWARA. During rain periods (ILW ≥ 0.4 mm), IWV is indicated by the red line. The blue line shows IWV during rain-free periods.

Figure 2.
Climatology of IWV derived from radiosonde (RS), GNSS and ERA5 data at Payerne from 2001 to 2018. Rain periods are indicated by a precipitation rate > 0.1 mm /10 min as measured by the rain gauge at Payerne.
Figure 2.
Climatology of IWV derived from radiosonde (RS), GNSS and ERA5 data at Payerne from 2001 to 2018. Rain periods are indicated by a precipitation rate > 0.1 mm /10 min as measured by the rain gauge at Payerne.

Figure 3.
Relationship between the precipitation rate (rain gauge) and IWV (GNSS) in (a) winter and (b) summer at Payerne from June 2001 to March 2018 (double logarithmic plot). Data pairs are shown for a precipitation rate ≥0.1 mm/10 min. The red curve is the moving average over 250 data pairs.
Figure 3.
Relationship between the precipitation rate (rain gauge) and IWV (GNSS) in (a) winter and (b) summer at Payerne from June 2001 to March 2018 (double logarithmic plot). Data pairs are shown for a precipitation rate ≥0.1 mm/10 min. The red curve is the moving average over 250 data pairs.

Figure 4.
Climatology of monthly accumulated precipitation at Payerne (red) and Bern (blue) derived from rain gauge measurements (January 2007 to December 2016). The thick lines with the stars denote the arithmetic mean, and the thin lines denote the error of the mean.
Figure 4.
Climatology of monthly accumulated precipitation at Payerne (red) and Bern (blue) derived from rain gauge measurements (January 2007 to December 2016). The thick lines with the stars denote the arithmetic mean, and the thin lines denote the error of the mean.

Figure 5.
Climatology of IWV at Bern from 2004 to 2016. Rain periods are indicated by integrated liquid water (ILW) ≥ 0.4 mm as observed by the microwave radiometer (MWR) TROWARA.
Figure 5.
Climatology of IWV at Bern from 2004 to 2016. Rain periods are indicated by integrated liquid water (ILW) ≥ 0.4 mm as observed by the microwave radiometer (MWR) TROWARA.


Table 1.
Mean differences of IWV (mm) and their standard deviations derived for the different atmospheric states at Payerne using the monthly means of Figure 2. Rain periods are indicated by precipitation rates >0.1 mm/10 min.
Table 1.
Mean differences of IWV (mm) and their standard deviations derived for the different atmospheric states at Payerne using the monthly means of Figure 2. Rain periods are indicated by precipitation rates >0.1 mm/10 min.
| IWV(Rain)–IWV (no Rain) | IWV(Rain)–IWV (All) | IWV(All)–IWV (no Rain) | |
|---|---|---|---|
| Radiosonde | 5.60 ± 1.21 | 5.44 ± 1.19 | 0.16 ± 0.04 |
| GNSS | 5.78 ± 0.86 | 5.63 ± 0.84 | 0.16 ± 0.04 |
| ERA5 | 5.25 ± 0.77 | 5.08 ± 0.75 | 0.17 ± 0.04 |
Table 2.
Mean differences of IWV (mm) and root mean square errors (RMSE) of GNSS and ERA5 with respect to the radiosonde. The deviations are listed for the different atmospheric states at Payerne using the monthly means of Figure 2. Rain periods are indicated by precipitation rates >0.1 mm/10 min.
Table 2.
Mean differences of IWV (mm) and root mean square errors (RMSE) of GNSS and ERA5 with respect to the radiosonde. The deviations are listed for the different atmospheric states at Payerne using the monthly means of Figure 2. Rain periods are indicated by precipitation rates >0.1 mm/10 min.
| GNSS–Radiosonde | ERA5–Radiosonde | |
|---|---|---|
| no rain | ||
| rain | ||
| all |
Table 3.
Mean differences of IWV (mm) and their standard deviations derived for the different atmospheric states at Bern using the monthly means of Figure 5. Rain periods are indicated by ILW ≥ 0.4 mm.
Table 3.
Mean differences of IWV (mm) and their standard deviations derived for the different atmospheric states at Bern using the monthly means of Figure 5. Rain periods are indicated by ILW ≥ 0.4 mm.
| IWV (Rain)–IWV (no Rain) | IWV (rain)–IWV (All) | IWV (all)–IWV (no Rain) | |
|---|---|---|---|
| GNSS | |||
| ERA5 | |||
| MWR |
Table 4.
Mean differences of IWV (mm) and RMSE of MWR (microwave radiometer) and ERA5 with respect to GNSS. The deviations are listed for the different atmospheric states at Bern using the monthly means of Figure 5. Rain periods are indicated by ILW ≥ 0.4 mm.
Table 4.
Mean differences of IWV (mm) and RMSE of MWR (microwave radiometer) and ERA5 with respect to GNSS. The deviations are listed for the different atmospheric states at Bern using the monthly means of Figure 5. Rain periods are indicated by ILW ≥ 0.4 mm.
| MWR–GNSS | ERA5–GNSS | |
|---|---|---|
| no rain | (0.60) | (0.79) |
| rain | (1.96) | (0.62) |
| all | (0.55) | (0.74) |
Table 5.
Mean differences of IWV (mm) and RMSE of MWR (microwave radiometer) and ERA5 with respect to GNSS. The deviations are listed for the different atmospheric states at Bern. In difference to Table 4, rain periods are indicated by ILW ≥ 0.2 mm, and hourly averages of the MWR data are used.
Table 5.
Mean differences of IWV (mm) and RMSE of MWR (microwave radiometer) and ERA5 with respect to GNSS. The deviations are listed for the different atmospheric states at Bern. In difference to Table 4, rain periods are indicated by ILW ≥ 0.2 mm, and hourly averages of the MWR data are used.
| MWR–GNSS | ERA5–GNSS | |
|---|---|---|
| no rain | (0.67) | (0.84) |
| rain | (1.48) | (0.54) |
| all | (0.55) | (0.74) |
Table 6.
Mean differences of IWV (mm) and RMSE of MWR (microwave radiometer), GNSS and ERA5 at Bern with respect to the radiosonde at Payerne. The deviations are listed for the different atmospheric states using the monthly means of Figure 5. The IWV data of the Payerne radiosonde are corrected by considering the height difference between Payerne and Bern. All values are calculated for the time interval 1 January 2004 to 31 December 2016.
| Bern–Payerne | |||
|---|---|---|---|
| MWR–RS | GNSS–RS | ERA5–RS | |
| no rain | (0.24) | (0.50) | (0.42) |
| rain | (1.54) | (1.99) | (1.86) |
| all | (0.41) | (0.55) | (0.27) |
Table 7.
Same as Table 6 but using the rain gauge at Bern for distinction between rain (>0.1 mm/10 min) and rain-free (≤0.1 mm/10 min) periods at Bern.
Table 7.
Same as Table 6 but using the rain gauge at Bern for distinction between rain (>0.1 mm/10 min) and rain-free (≤0.1 mm/10 min) periods at Bern.
| Bern–Payerne | |||
|---|---|---|---|
| MWR–RS | GNSS–RS | ERA5–RS | |
| no rain | (0.60) | (0.51) | (0.21) |
| rain | (1.24) | (2.12) | (1.55) |
| all | (0.62) | (0.49) | (0.19) |
Publisher’s Note: MDPI stays neutral with regard to jurisdictional claims in published maps and institutional affiliations. |
© 2021 by the authors. Licensee MDPI, Basel, Switzerland. This article is an open access article distributed under the terms and conditions of the Creative Commons Attribution (CC BY) license (https://creativecommons.org/licenses/by/4.0/).
Share and Cite
MDPI and ACS Style
Hocke, K.; Bernet, L.; Wang, W.; Mätzler, C.; Hervo, M.; Haefele, A. Integrated Water Vapor during Rain and Rain-Free Conditions above the Swiss Plateau. Climate 2021, 9, 105. https://0-doi-org.brum.beds.ac.uk/10.3390/cli9070105
AMA Style
Hocke K, Bernet L, Wang W, Mätzler C, Hervo M, Haefele A. Integrated Water Vapor during Rain and Rain-Free Conditions above the Swiss Plateau. Climate. 2021; 9(7):105. https://0-doi-org.brum.beds.ac.uk/10.3390/cli9070105
Chicago/Turabian StyleHocke, Klemens, Leonie Bernet, Wenyue Wang, Christian Mätzler, Maxime Hervo, and Alexander Haefele. 2021. "Integrated Water Vapor during Rain and Rain-Free Conditions above the Swiss Plateau" Climate 9, no. 7: 105. https://0-doi-org.brum.beds.ac.uk/10.3390/cli9070105
Note that from the first issue of 2016, this journal uses article numbers instead of page numbers. See further details here.