
Hydro-Meteorological Trends in an Austrian Low-Mountain Catchment


1
Institute of Urban Water Management and Landscape Water Engineering, Graz University of Technology, 8010 Graz, Austria
2
Institute of Hydraulic Engineering and Water Resources Management, Graz University of Technology, 8010 Graz, Austria
*
Author to whom correspondence should be addressed.
Climate 2021, 9(8), 122; https://0-doi-org.brum.beds.ac.uk/10.3390/cli9080122
Submission received: 2 June 2021
/
Revised: 24 July 2021
/
Accepted: 26 July 2021
/
Published: 29 July 2021
(This article belongs to the Special Issue Application of Climatic Data in Hydrologic Models)
Abstract
:While ongoing climate change is well documented, the impacts exhibit a substantial variability, both in direction and magnitude, visible even at regional and local scales. However, the knowledge of regional impacts is crucial for the design of mitigation and adaptation measures, particularly when changes in the hydrological cycle are concerned. In this paper, we present hydro-meteorological trends based on observations from a hydrological research basin in Eastern Austria between 1979 and 2019. The analyzed variables include air temperature, precipitation, and catchment runoff. Additionally, the number of wet days, trends for catchment evapotranspiration, and computed potential evapotranspiration were derived. Long-term trends were computed using a non-parametric Mann–Kendall test. The analysis shows that while mean annual temperatures were decreasing and annual temperature minima remained constant, annual maxima were rising. Long-term trends indicate a shift of precipitation to the summer, with minor variations observed for the remaining seasons and at an annual scale. Observed precipitation intensities mainly increased in spring and summer between 1979 and 2019. Catchment actual evapotranspiration, computed based on catchment precipitation and outflow, showed no significant trend for the observed time period, while potential evapotranspiration rates based on remote sensing data increased between 1981 and 2019.
1. Introduction
It is well documented that the climate is changing [1,2,3]. Impacts are seen as globally rising temperatures [2,4] with a reduced number of cold days and nights and an increased number of warm days and nights [4], an altered depth [5,6,7] and duration of snow and ice cover [6,7,8], changing precipitation [4,9,10,11] and river flow regimes [12,13,14], or an increased number of extreme events [2,4,15]. However, the magnitude and impact direction of major climate variables, such as temperature, precipitation, catchment runoff, and evapotranspiration in both climate observations and projections vary significantly at the global and regional scale [16,17].
While there is a consensus on global warming [2] supported by many studies (e.g., [15,18,19]), some areas experienced decreasing mean, maximum, or minimum temperatures 1951-2002 [20]. Precipitation observations indicate minor global changes despite a large, compensating variability with a decrease observed in the subtropics and Southern Europe [21,22], Southern Asia and Africa and increases observed in North America, South America, Eurasia, and North and Central Europe [11,22,23,24]. Furthermore, a seasonal shift of precipitation has been reported (e.g., [19,25]).
With respect to catchment runoff, a decrease was observed for some basins in China [18,26], while an increase in runoff was reported for other Chinese basins [27] or North-Eastern USA [28]. Blaschke et al. [24] report only minor changes in runoff for Austrian catchments in the past 50 years but predict a future runoff reduction for summer and an increase for winter. As for precipitation, a seasonal runoff shift has been reported (e.g., [13]). Furthermore, an increase in flooding events, particularly in Alpine areas, has been observed [14].
Several studies report increasing potential evapotranspiration trends for most of the Northern hemisphere (e.g., [19,29,30,31,32,33]), while China experienced decreasing evapotranspiration rates over the past 50 years [34]. Some of these studies confirm the trend that dry areas become drier and wet areas become wetter, while some contradict [23,35].
The validation of observations is one of the most important tasks during hydrological assessments as faulty data obviously provoke wrong analysis results and conclusions. At the same time, particularly the validation of precipitation measurements is very demanding due to the spatial and temporal variability of rainfall and its stochastic nature. An appropriate validation strategy depends on several factors, such as the spatial distribution of stations, the recording and analysis frequency or the type of measurement device. While there is no standardized procedure that is generally applicable, validation strategies commonly comprise the following steps: (i) identification of documented defects, (ii) device-specific boundaries, (iii) climatological boundaries, (iv) temporal variability, (v) intra-stational validation, and (vi) inter-stational variability [36,37].
The literature shows that the impact of climate change is widely acknowledged. At the same time, it is obvious that the impacts greatly vary at a regional and even local scale. However, this knowledge is crucial to develop measures to mitigate and counteract hydrological climate change impacts at the regional and local scale. Furthermore, we aim to investigate whether large-scale climate observations or projections also hold for smaller catchments where hydro-meteorological conditions may be very site-specific. For this purpose, we analyzed the hydro-meteorological data from a hydrological research catchment in Styria, Eastern Austria, which has been monitored since 1979. Analyzed climate variables include precipitation depth and intensities, number of wet days, air temperature, river flow, and actual and potential evapotranspiration.
2. Materials and Methods
2.1. Hydrological Research Catchment Pöllau
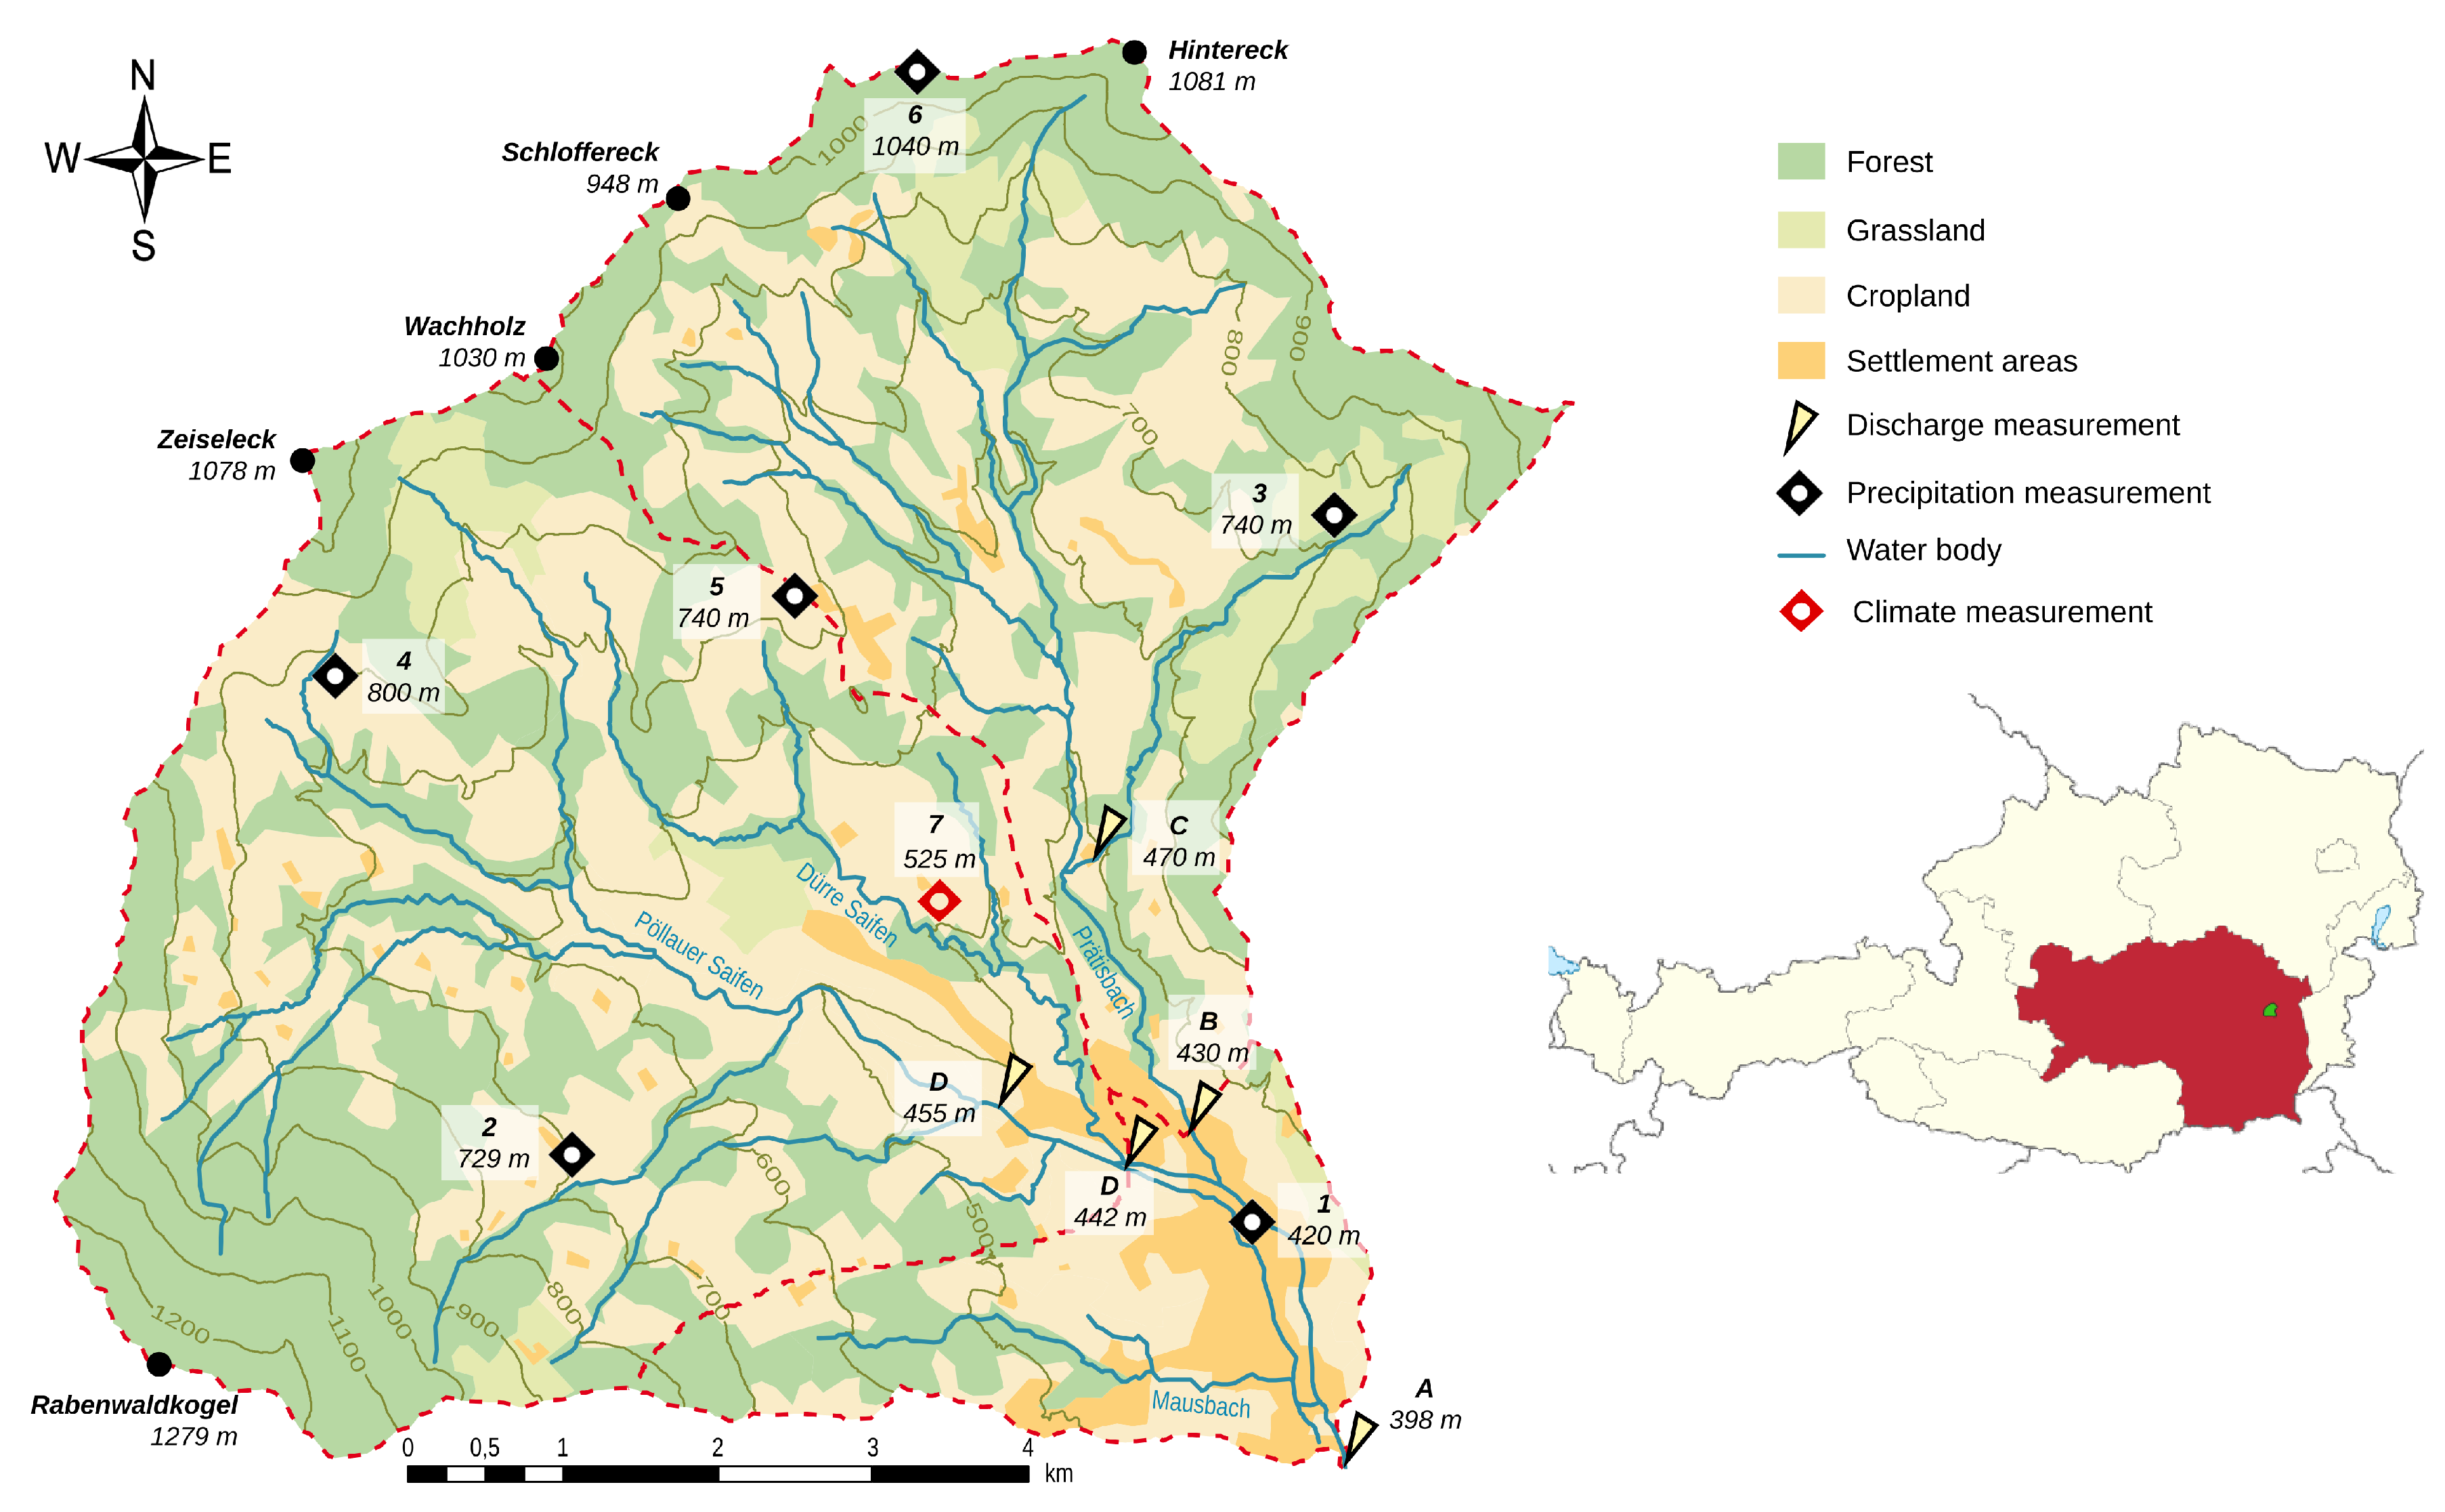
The hydrological research basin (HRB) Pöllau was established in 1978 [38,39] and is currently operated by the Institute of Urban Water Management and Landscape Water Engineering at Graz University of Technology in cooperation with the Department 14 of the Federal State Styria. The decision to establish an HRB in the Pöllau sub-basin was based on a number of reasons: (i) the confining arched mountain ridge allows a clear delineation of the catchment, (ii) the loamy soils are characterized by low storage capacities, minimizing the influence of subsurface flow on catchment hydrology, and (iii) the climate of the catchment with heavy storm events in the summer and relatively dry winters is representative for the Eastern alpine foothills [40]. The catchment covers 58.3 km and is located in Styria, Austria, about 60 km northeast of the city of Graz (Figure 1). The elevation of the catchment ranges from 398 to 1279 m, and the catchment land-cover is dominated by forest (ca. 43.8%) and grass- and cropland (ca. 51.8%) with a low degree of discontinuous urban fabric (ca. 4.4%) [41].
The catchment comprises two main sub-catchments that are monitored: (i) the sub-catchment Saifenbach/Dürre Saifen covering 23 km (monitored 1997–2005 and since 2018) and (ii) the sub-catchment Prätisbach covering 21 km (monitored since 1980). Additionally, the discharge at the joint catchment outlet of both the sub-catchments has been monitored since 1980. Characteristic catchment properties are given in Table 1.
2.2. Data
The first precipitation measurement gauge in the HRB Pöllau was installed in 1979 (1, see Figure 1 and Table 2). During the following year (1980), an additional five precipitation gauges were installed, and two stream gauges (the catchment outlet A and the sub-catchment B) were constructed and taken into operation. The precipitation monitoring at the meteorological station (7) started in 1982, whereas the observation of climate variables started in 1991. The stream gauge C started operation in 1988 but was destroyed during a massive flood in 1997. The gauge was then reconstructed in 2000, but after further flood damage in 2007, the gauge was not put back into operation. The stream gauge D was constructed in 1997, but due to the challenging measurement location, monitoring was abandoned in 2005. The gauge was reconstructed 500 m upstream in 2018 and is, together with the gauges A and B, currently operating.
The currently operated precipitation gauges are rather symmetrically distributed over the catchment area and located at elevations between 420 and 1040 m.a.s.l. Initially, all 7 precipitation gauges were tipping buckets with a resolution of 0.1 mm. Since the year 2011, 6 stations have been equipped with rain scales (type Ott [42]) operated at a 1 min recording interval. The rain scales in the catchment are not equipped with heaters, which hampers the record of snowfall. Due to this shortcoming, only snow that stayed on the gauges and thereafter melted was recorded. The currently operated stream gauges monitor the entire catchment outflow (A) and the two main sub-catchments (Figure 1). The stream gauges are equipped with pressure sensors, calibrated with rating curves, and record at a 10–15 min interval.
Land-cover changes due to urbanization, agriculture or forestation can, along with potential climate change, significantly affect the catchment water balance, hampering the attribution of observed long-term changes to a single driver. Therefore the catchment land-use was analyzed based on the CORINE land-cover datasets available for the years 1990, 2000, 2006, 2012, and 2018 [43]. Between 1990 and 2018, forested areas decreased by 0.27 km and were mostly replaced by settlements growing by 0.3 km, while the fraction of agricultural landuse remained almost constant with a decrease of 0.03 km (Table 3).
2.3. Data Validation
To exclude as much doubtful data as possible from the subsequent analysis, the available measurements were first validated on a daily basis according to the following procedure: (i) identification of documented defects, (ii) device-specific boundaries, (iii) climatological boundaries, (iv) temporal variability, (v) intra-stational validation, and (vi) inter-stational variability [36,37].
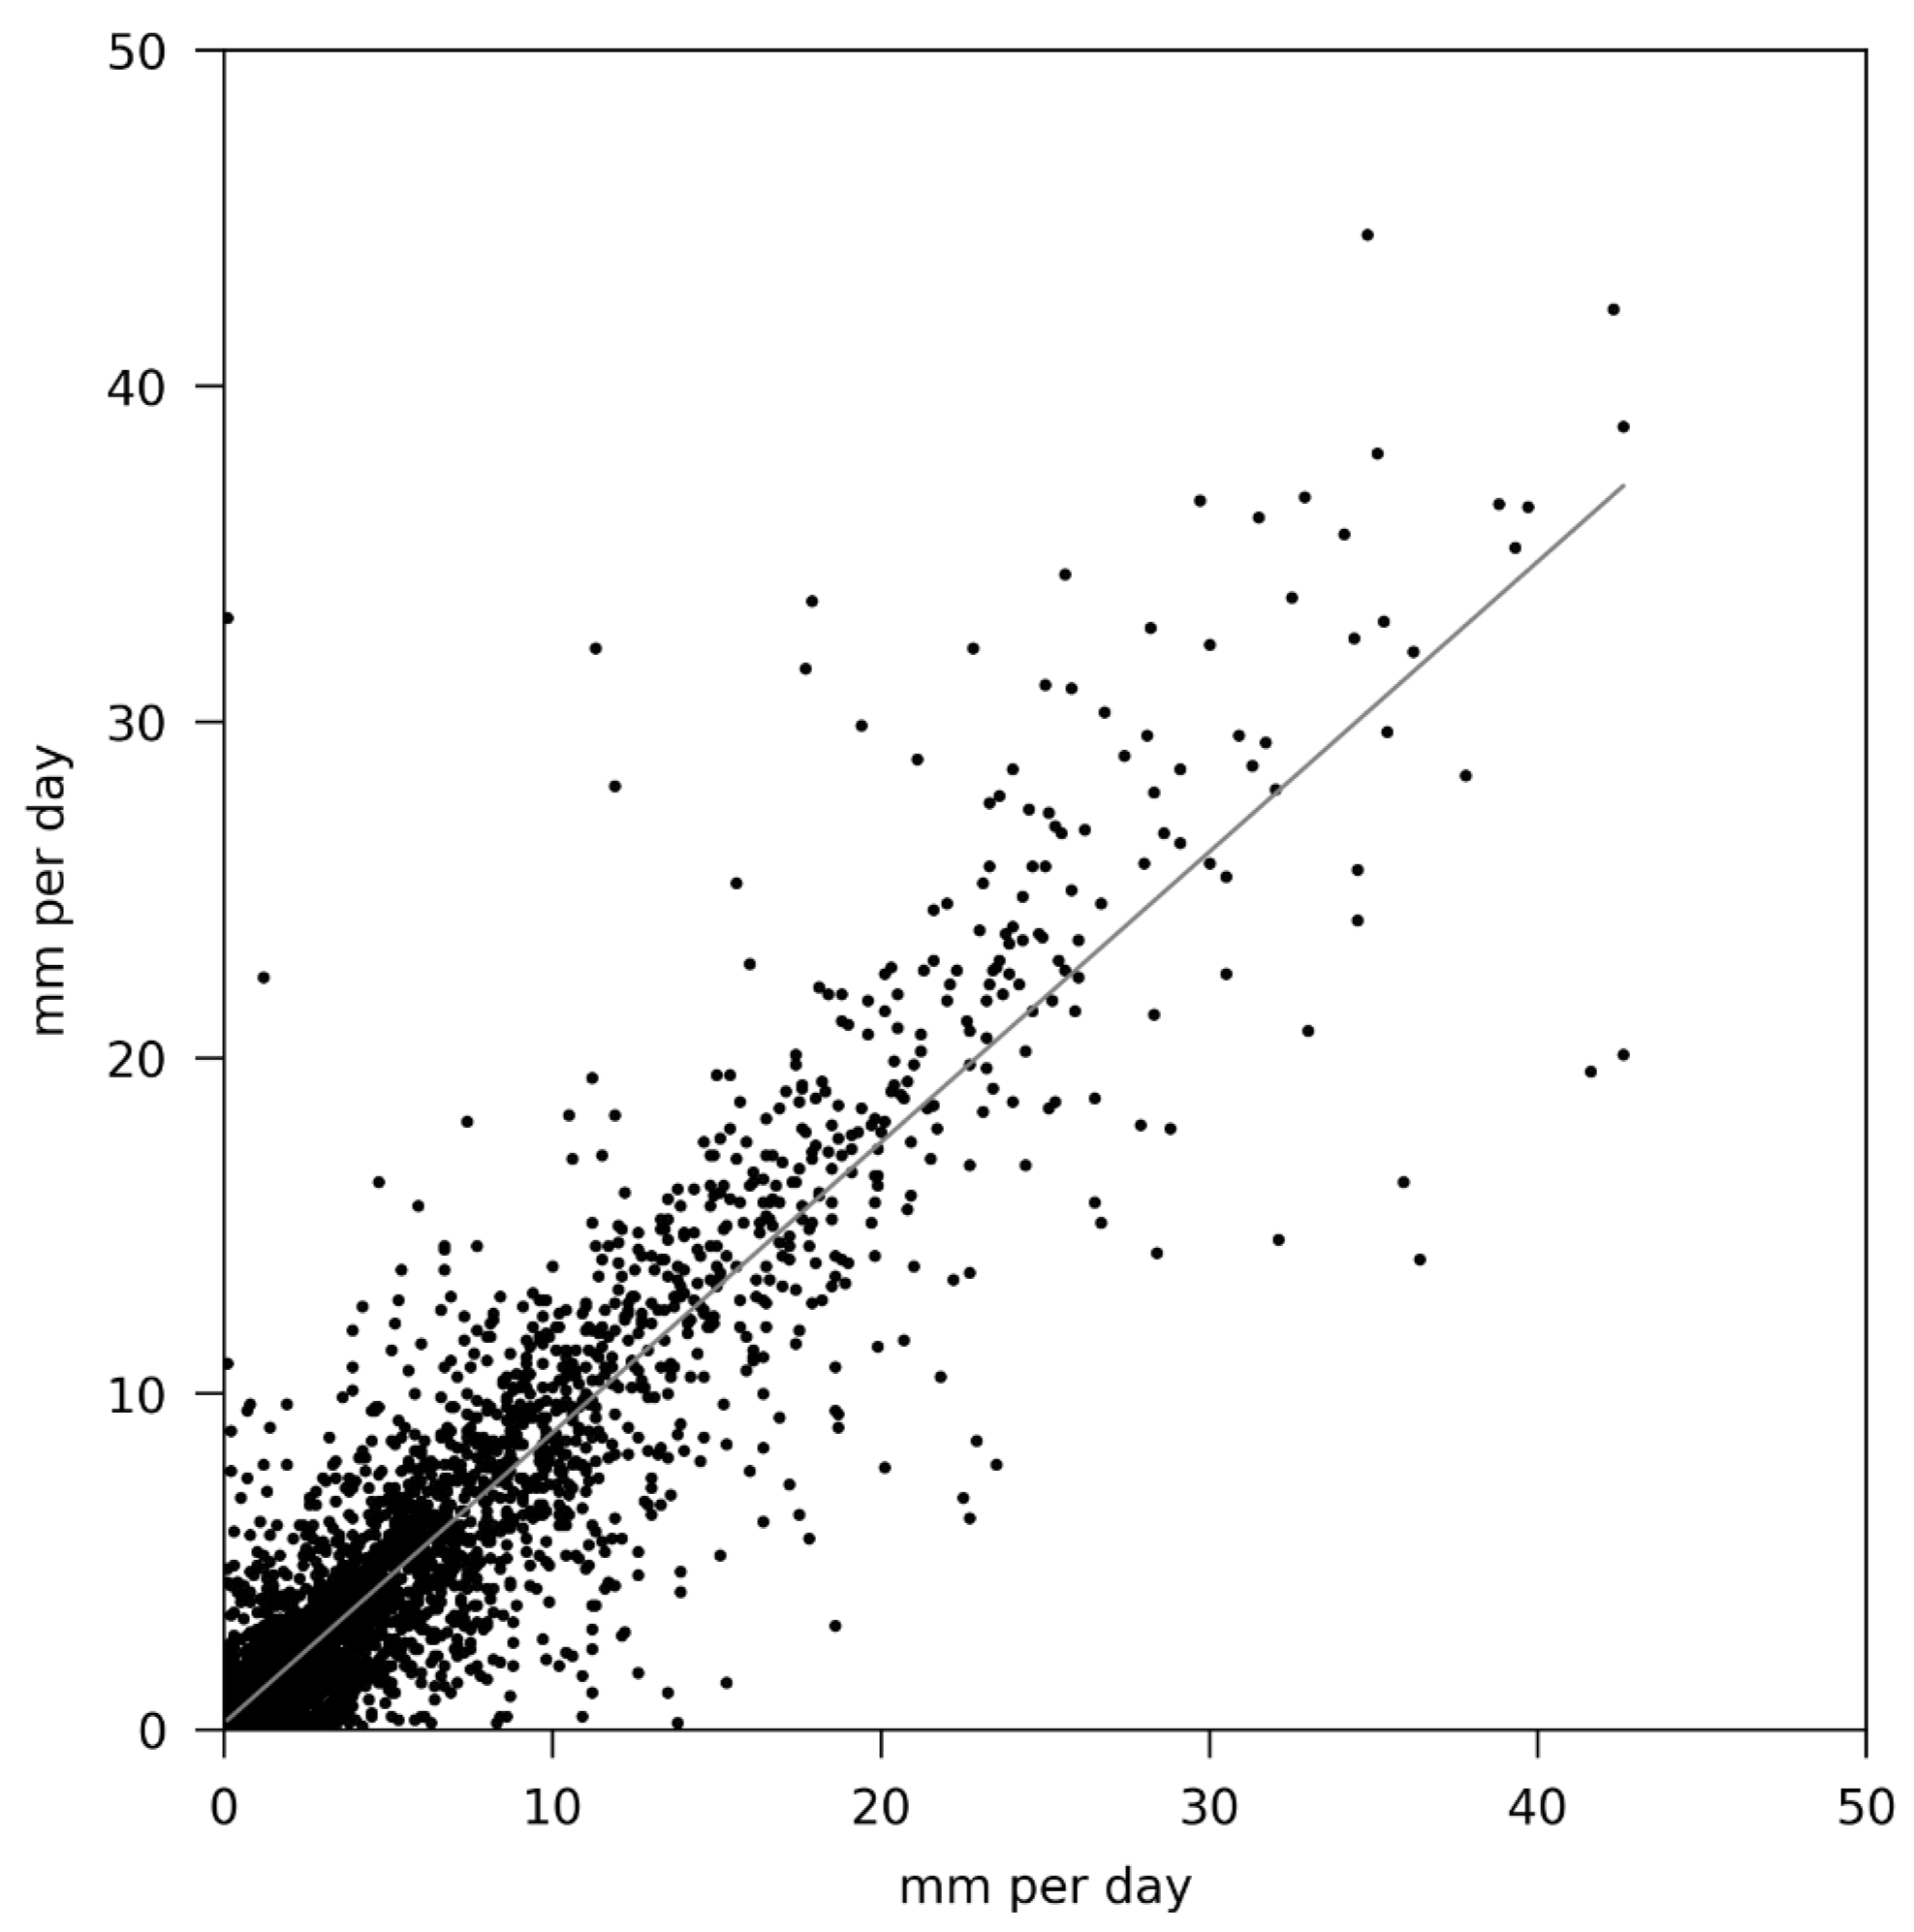
The validation steps (i)–(vi) were applied for rainfall and discharge observations. The comparison of daily precipitation observations after validation shows a good correlation (Pearson correlation 0.91), allowing the conclusion that the seven stations mostly recorded similar values (Figure 2). Discharge measurements were validated using cumulative sums of available gauges. An inter-stational validation for temperature data was not directly possible, as this variable is recorded at only one location within the catchment. However, the general observed pattern was compared with regionally available temperature observations for consistency.
2.4. Data Analysis
Long-term hydrological trends and their significance were computed using the non-parametric modified Mann–Kendall test [44] to reduce the influence of serial correlation. Additionally, the Theil–Sen robust estimate was computed [45,46] to evaluate the magnitude of the trend. This approach has been successfully used to assess climate developments in numerous earlier studies (e.g., [47,48,49,50]) and was therefore applied in the current study.
Long-term trends of air temperatures were analyzed based on mean annual temperatures, on the one hand, and on mean seasonal temperatures recorded at the climate station 7 on the other hand. The seasons were defined as spring (March, April, May), summer (June, July, August), autumn (September, October, November) and winter (December, January, February). Seasonal trends were computed as annual trends that might be balanced by seasonal changes.
The conducted precipitation analyses comprised long-term trends of annual and seasonal (seasons as defined above), precipitation depths, and long-term trends of precipitation intensities for different durations (60, 120, 240 min). Precipitation depth was analyzed as the catchment mean sum (mean of the station recordings that fulfilled the validation criteria). Additionally, the trend of the number of annual wet days in the catchment was analyzed.
Long-term trends for the catchment discharge were analyzed for gauge A, while the remaining gauges were utilized for data validation only.
As for precipitation and temperature, long-term flow trends were also analyzed at a seasonal scale to identify temporal shifts in stream flow behavior.
The catchment water balance was computed based on observed precipitation runoff to assess the long-term development of actual evapotranspiration in the catchment. The computation includes a number of simplifications: (i) groundwater outflow of the catchment is not considered (no data available), (ii) land-cover changes were minor in the catchment during the observation period and therefore not further considered, and (iii) only years are taken into account, where available data allow for computation of annual runoff values. The simplifications yield the following water balance:
where ET is actual evapotranspiration (mm), P is observed catchment precipitation (mm), and R is observed catchment runoff (mm). Additionally, potential catchment evapotranspiration (PET) was computed based on remote sensing data from the Copernicus Climate Data Store [51] as global radiation observations at the catchment climate station were insufficiently complete to allow for PET computation. PET was computed according to de Bruin et al. [52] using temperature, surface solar radiation and top of the atmosphere incident solar radiation. This approach was selected as wind speed data recordings were incomplete at the catchment climate station. Wind speed substantially influences PET, and thus, this simplification may underestimate computed PET rates.
3. Results
3.1. Temperature Trends
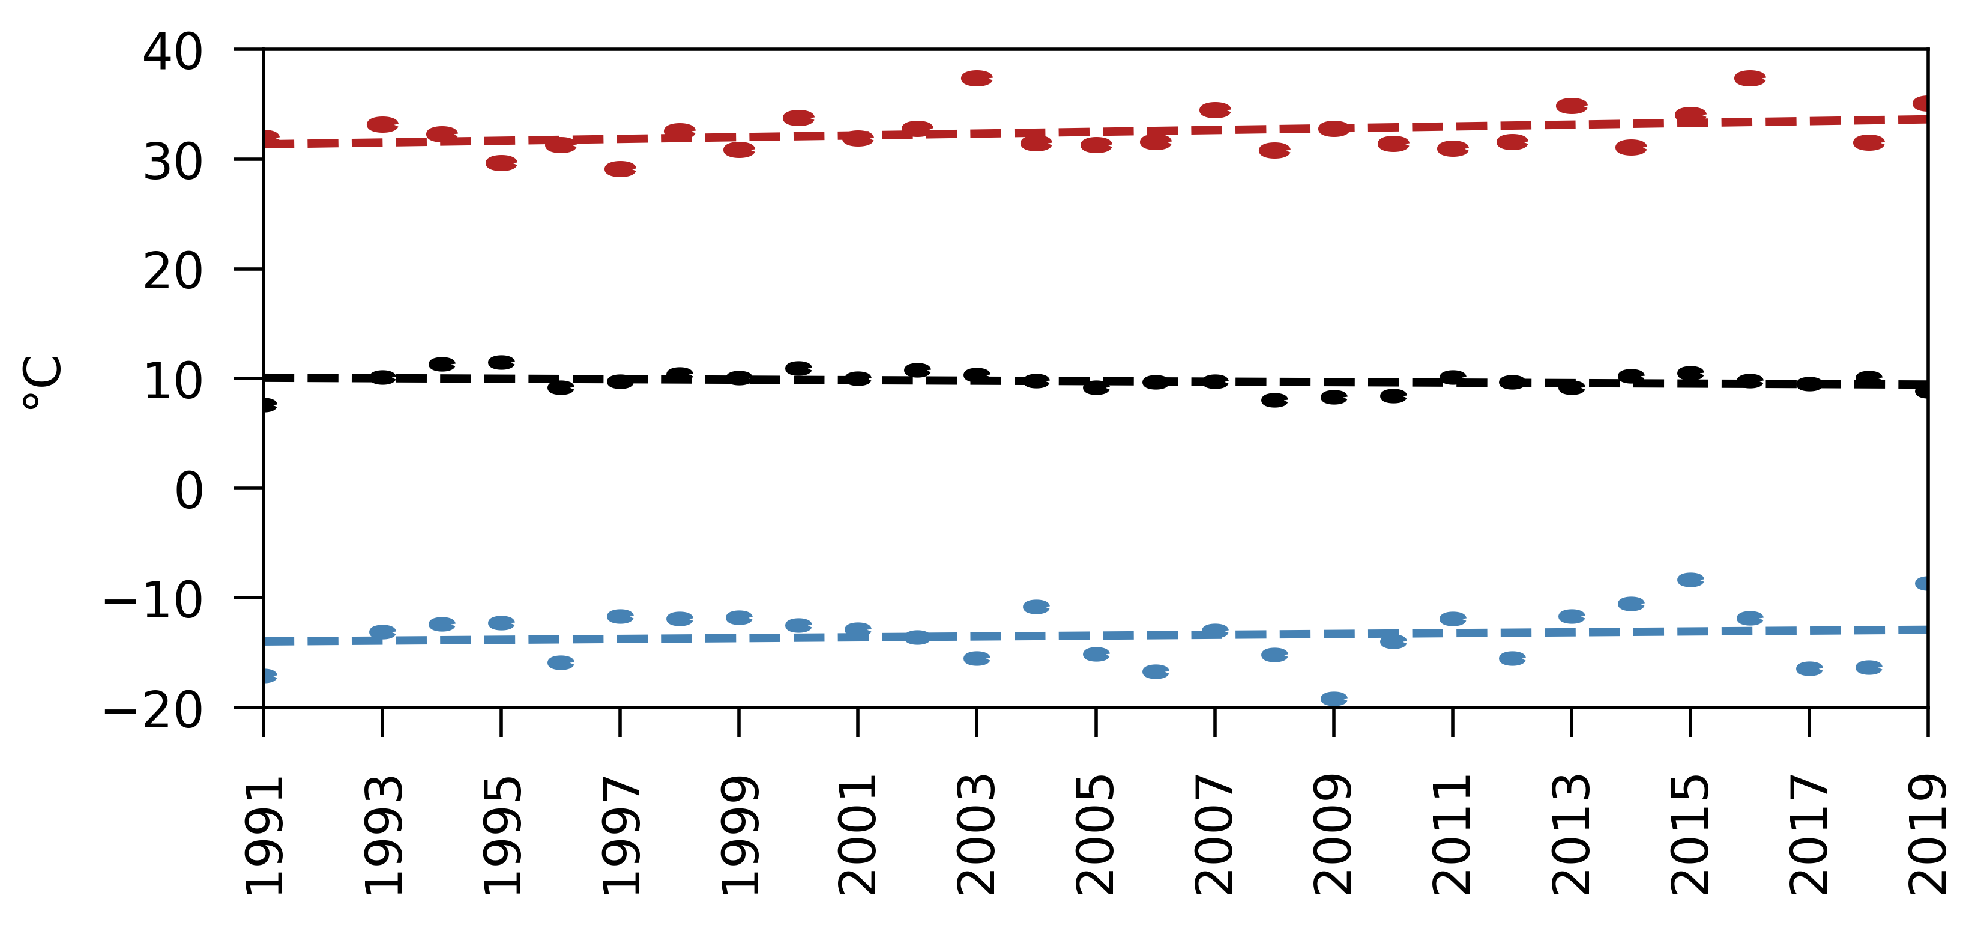
The mean annual air temperature at the climate station 7 between 1991 and 2019 is 9.8 C, with the maximum annual mean recorded in 1995 (11.5 C) and the minimum annual mean recorded in 1991 (7.6 C). The long-term development of the mean annual temperature shows a negative trend with decreasing annual mean air temperature recordings (Figure 3).
While the development of annual minima shows no significant trend, annual temperature maxima were increasing between 1991 and 2019. The mean annual minimum 1991–2019 is −13.4 C, with the lowest recording in 2009 (−19.2 C) and the highest recording in 2015 (−8.3 C). The mean annual maximum 1991–2019 is 32.5 C, with the lowest recording in 1997 (29.1 C) and the highest recording in 2003 and 2016 (37.4 C) (Figure 3).
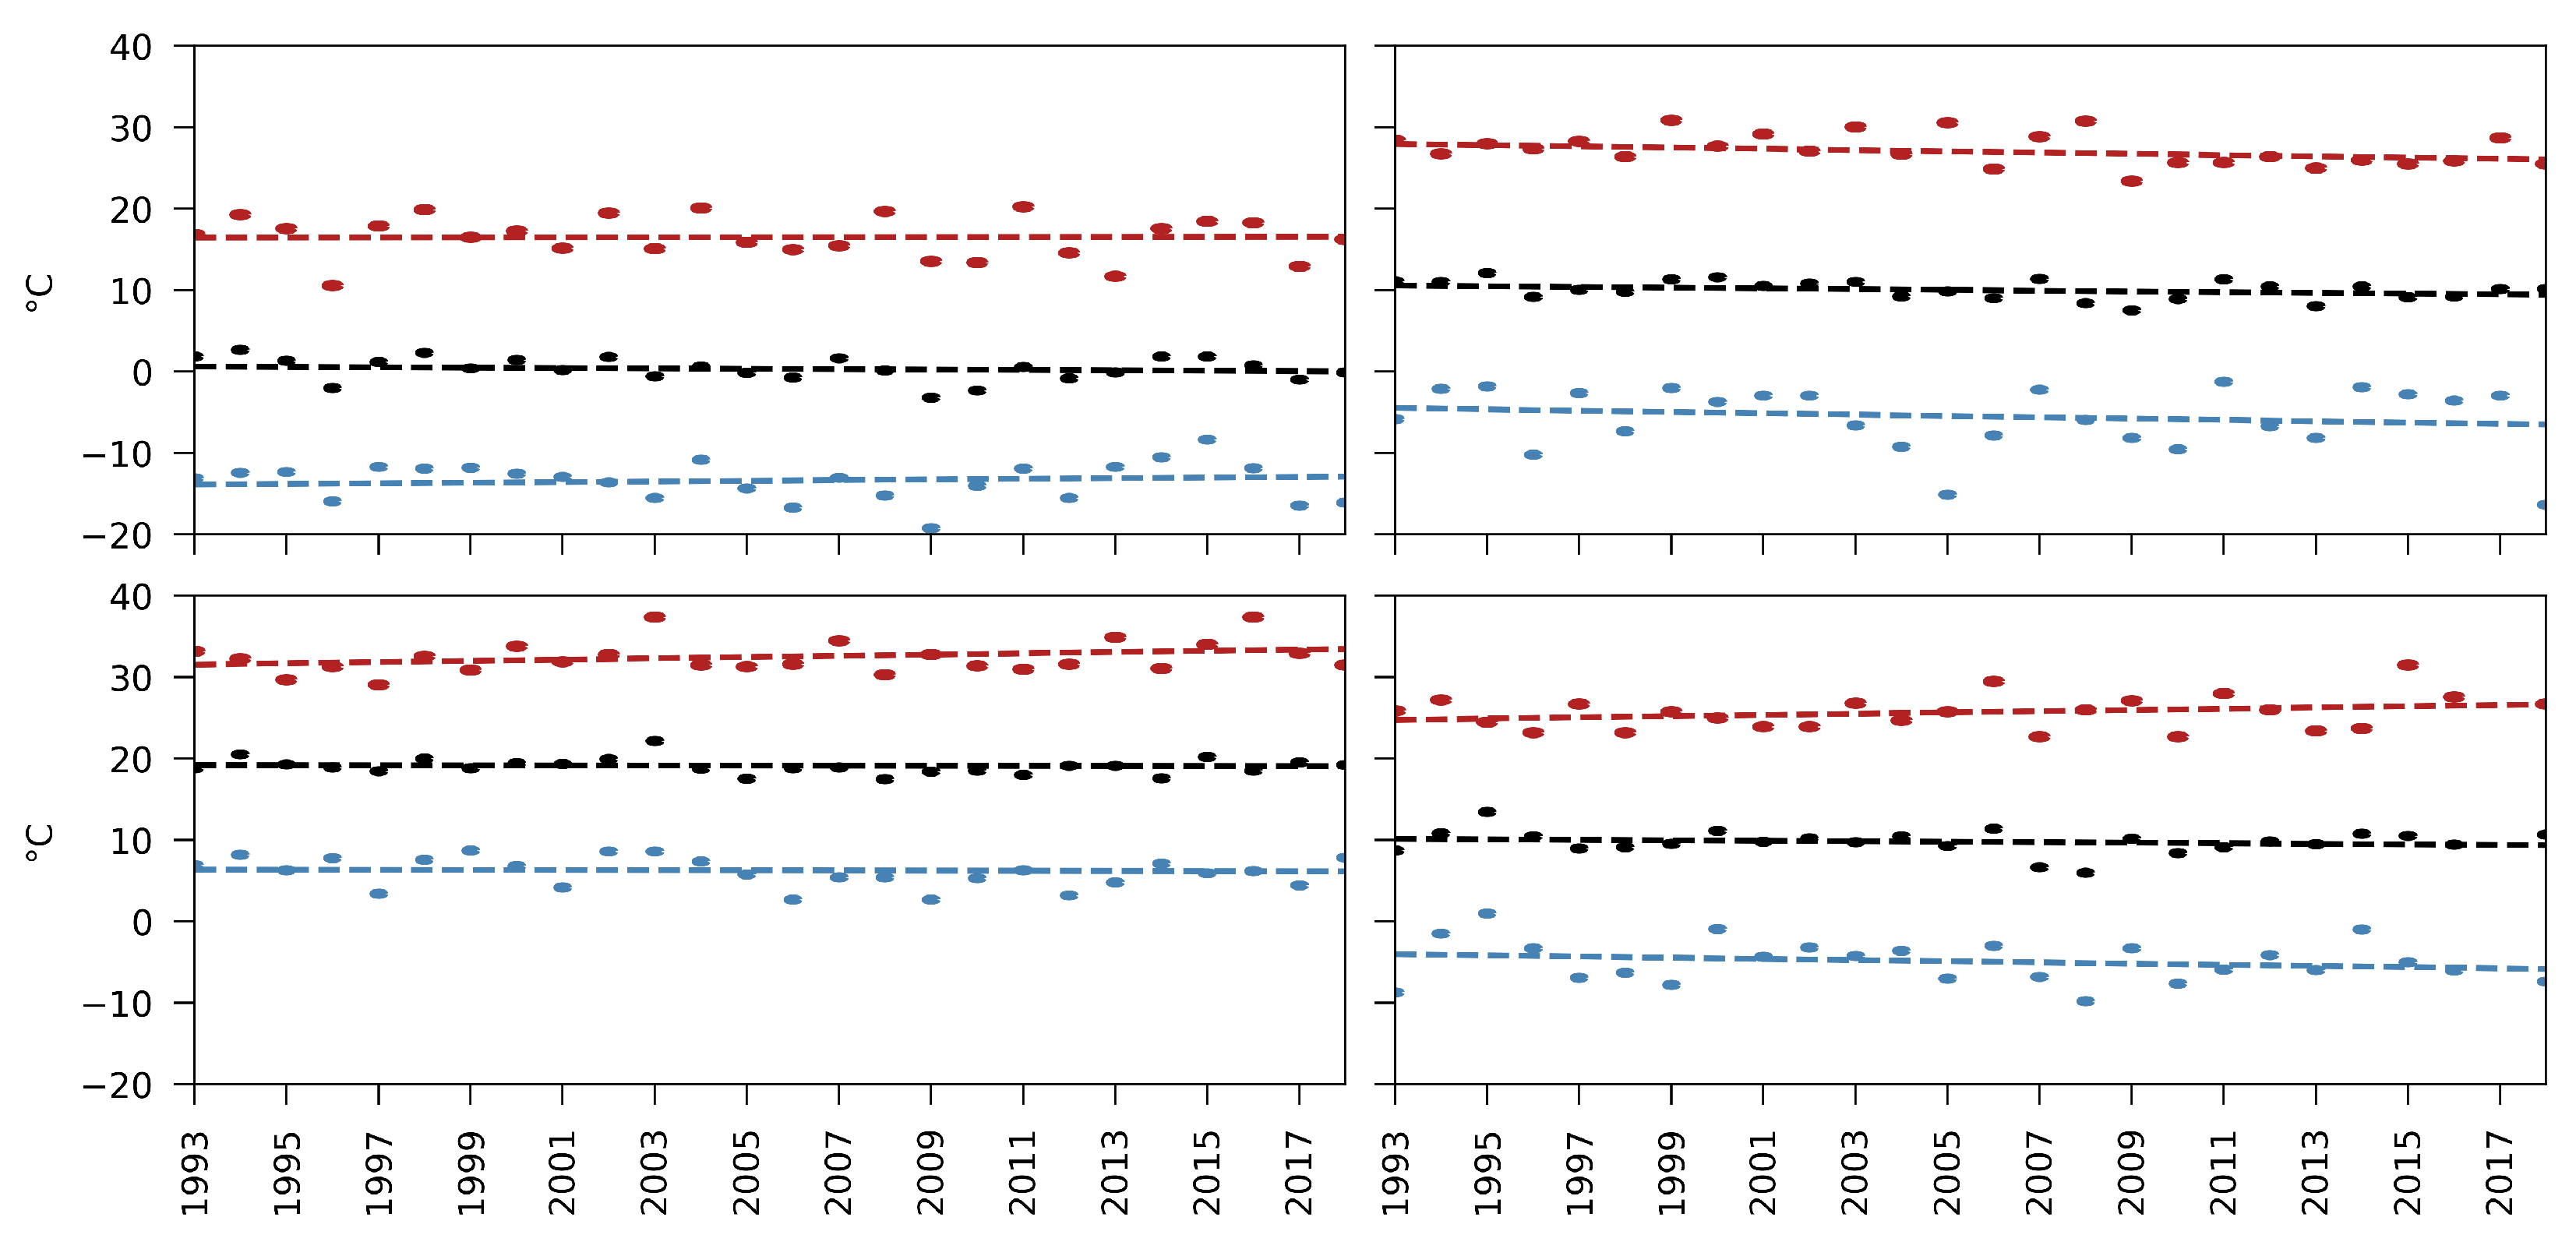
The mean winter temperature between 1991 and 2019 is 0.3 C shows a decreasing trend, with the lowest value recorded in 2009 (−3.2 C) and the highest recording in 1994 (2.7 C). Both winter minima (mean of −13.4 C, with the lowest recording in 2009 (−19.2 C) and the highest recording in 2015 (−8.3 C)) and maxima 1991–2019 (mean of 16.5 C, with the lowest recording in 1996 (10.6 C) and the highest recording in 2011 (20.3 C)) show no significant trend (Figure 4 top left).
The mean spring temperature between 1991 and 2019 is 10.0 C and shows a similarly decreasing trend as observed for winter. The lowest mean was recorded in 2009 (7.6 C) and the highest recording in 1995 (12.1 C). The trend of spring minima is decreasing around a mean minimum of −5.5 C, with the lowest recording in 2018 (−16.3 C) and the highest record observed in 2011 (−1.2 C). The trend of spring maxima 1991–2019 is also decreasing around 27.0 C, with the lowest recording in 1991 (23.1 C) and the highest recording in 1999 (30.9 C) (Figure 4 top right).
The mean temperature during summer between 1991 and 2019 shows no trend staying at 19.9 C, with the lowest recording in 2008 (17.5 C) and the highest recording in 2003 (22.2 C). The trend of summer minima is also not significant at 6.3 C, with the lowest recording in 2006 (2.7 C) and the highest recording in 2019 (12.7 C). The trend of summer maxima 1991–2019 is increasing around 35.5 C, with the lowest recording in 1997 (29.1 C) and the highest recording in 2003 and 2016 (37.4 C) (Figure 4 bottom left).
The trend of the mean autumn temperature 1991–2019 is not significant around 9.8 C, with the lowest recording in 2008 (6.0 C) and the highest recording in 1995 (13.4 C). The trend of autumn minima is decreasing around −4.9 C, with the lowest recording in 2008 (−9.8 C) and the highest recording in 1995 (1.0 C). The trend of autumn maxima 1991–2019 is increasing around 25.7 C, with the lowest recording in 2010 (22.7 C) and the highest recording in 2015 (31.5 C) (Figure 4 bottom right). A comprehensive summary of the observed temperature trends, including statistical trend properties, is given in Table 4.
3.2. Precipitation Trends
3.2.1. Precipitation Depth
The mean annual precipitation shows no significant trend between 1979 and 2019 around 608.9 mm, with the maximum mean recorded in 2014 (807.2 mm) and the minimum recorded in 2001 (364.3 mm). The annual maximum at a single station was recorded in 1996 at 4 (829.2 mm) and the annual minimum in 2001 at 7 (340.4 mm) (Figure 5). It is to be noted that the circumstance in which the rain scales are not equipped with heaters allows for the recording of only melted snowfall. Thus, winter and partly spring precipitation trends depend both on snowfall and melting occurring. The same is true for derived precipitation intensity trends.
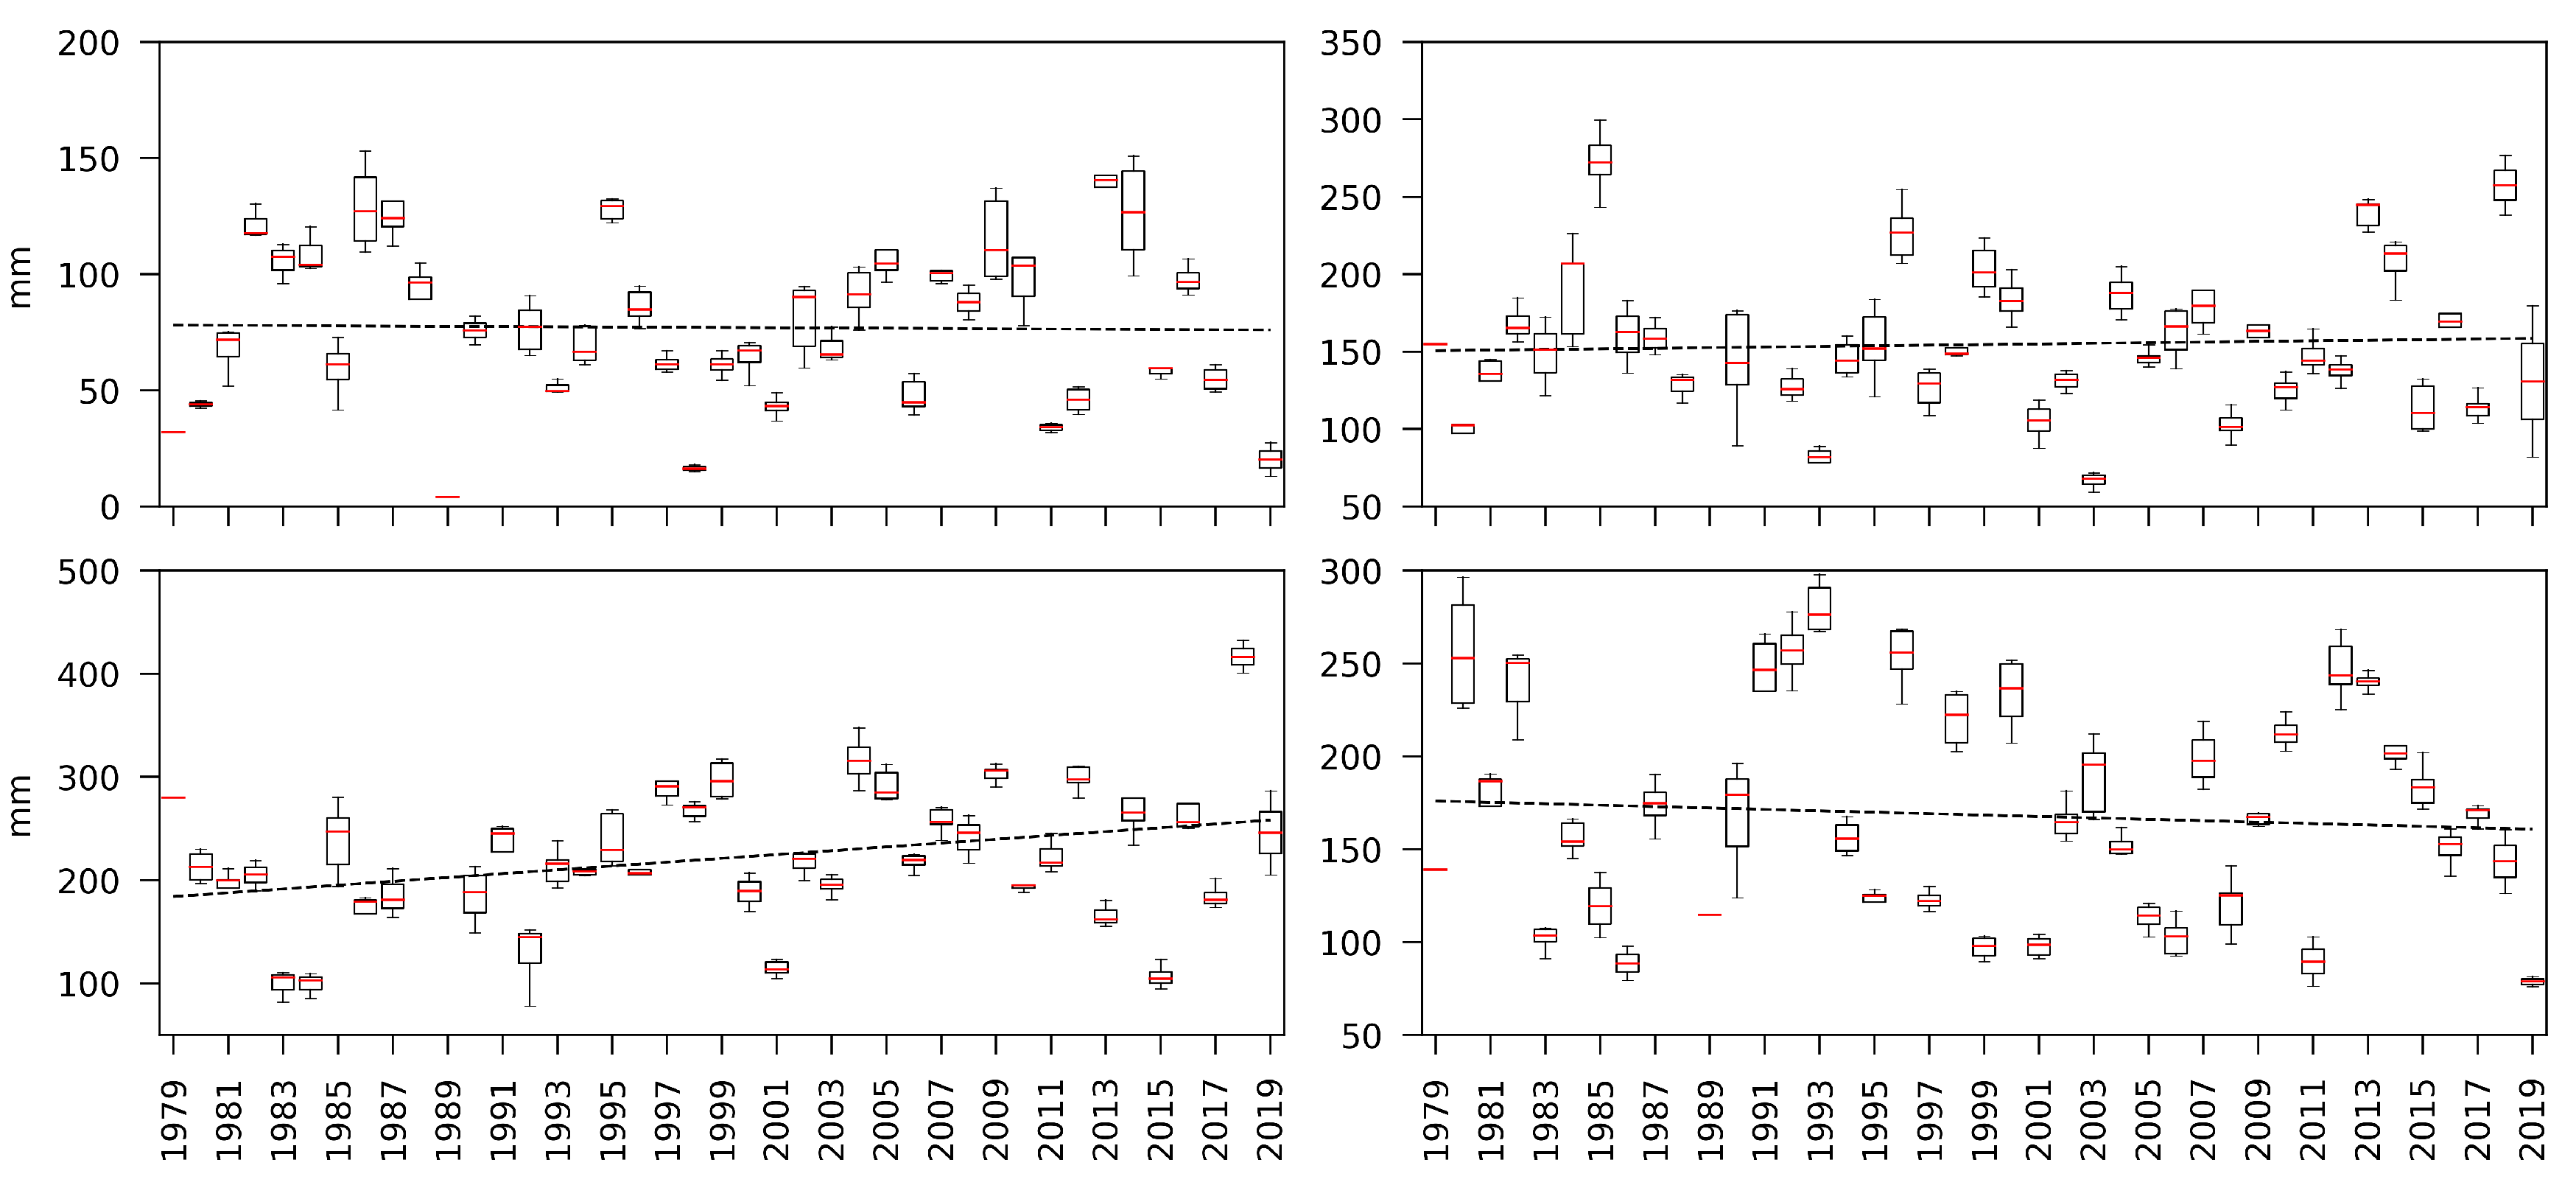
The seasonal precipitation 1979–2019 shows an increasing trend for summer (June, July, August), while no significant trend was detected for spring (March, April, May), autumn (September, October, November), and winter (December, January, February) 1979–2019 (Figure 6).
The mean winter precipitation in the catchment 1979–2019 was 73.3 mm, with the highest recording in 2013 (139.5 mm) and the lowest recording in 1998 (16.3 mm) (Figure 6 top left). The mean precipitation falling in the winter season accounted for 12% of the mean annual precipitation 1979–2019.
The mean spring precipitation accounted for 151.9 mm for 25% of the mean annual precipitation 1979–2019. The largest spring precipitation was recorded in 1985 (272.5 mm) and the smallest in 2003 (66.7 mm) (Figure 6 top right).
The mean summer precipitation shows a clearly increasing trend around 222.0 mm, accounting for 36% of the mean annual precipitation 1979–2019. The largest summer precipitation was recorded in 2018 (416.4 mm), and the smallest value was recorded in 1984 (99.1 mm) (Figure 6 bottom left).
The mean autumn precipitation 1979–2019 was around 168.2 mm, accounting for 27% of the mean annual precipitation. The largest autumn precipitation was recorded in 1993 (273.5 mm) and the smallest precipitation in 2019 (78.7 mm) (Figure 6 bottom right).
3.2.2. Wet Days
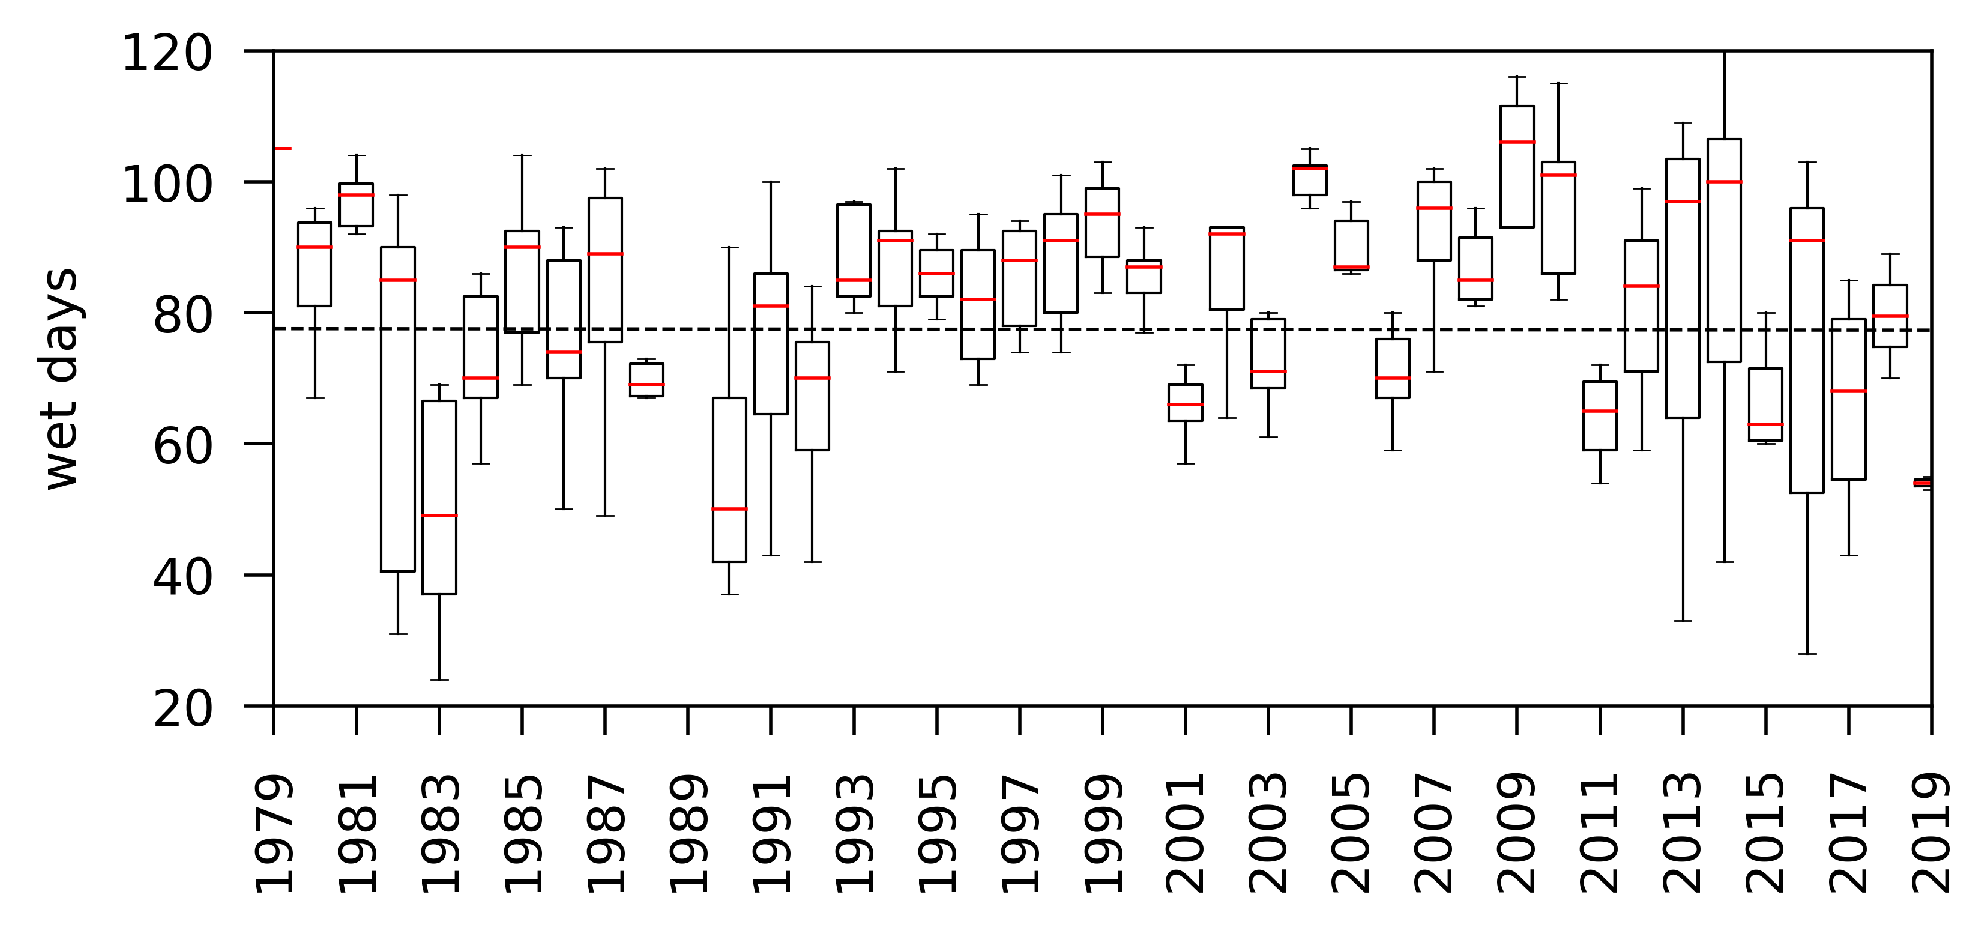
The number of wet days in the catchment remained constant, with a mean of 78 wet days per year (Figure 7). The highest number of wet days was recorded in 1979 with 105, while the smallest number of rainfall days was recorded in 2019 with 54.
3.2.3. Precipitation Intensities
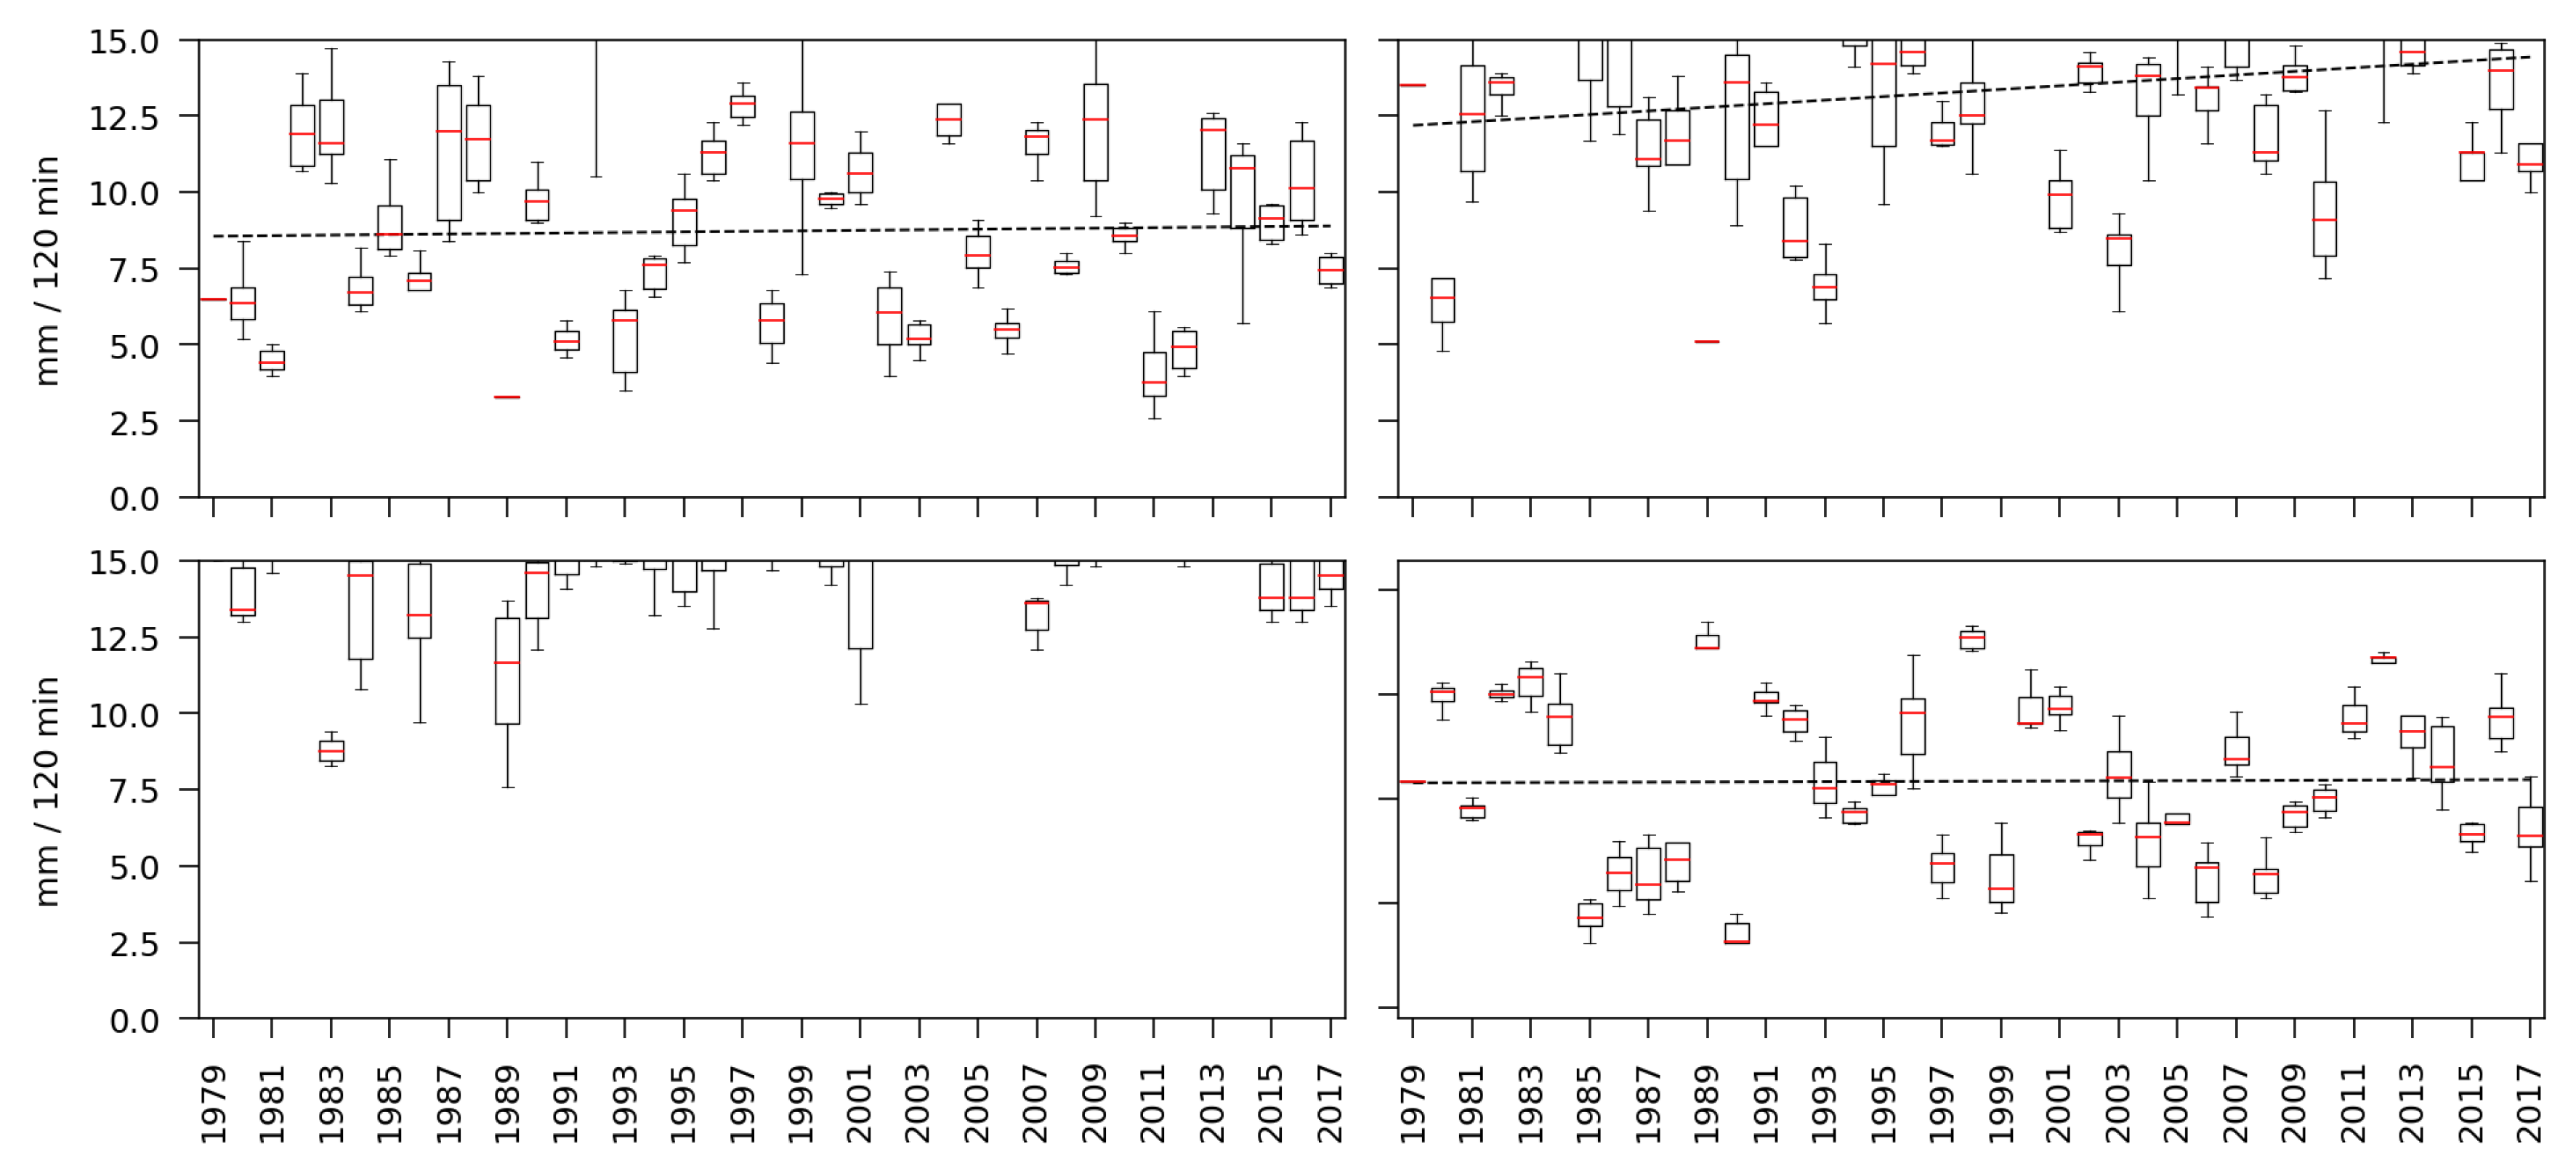
Precipitation intensities for a duration of 60 min showed no significant trend at an annual level as well as for summer and autumn. However, an increasing trend was detected for winter and spring 1979–2019. Annual intensities for a duration of 120 min showed no significant trend as well as for winter and autumn, while spring and summer experienced increasing intensities (Figure 8). The trend for a longer duration of 240 min was not significant for winter and autumn as well as annually. However, as for the duration of 120 min, intensities were increasing for spring and summer. A comprehensive summary of the observed precipitation trends, including statistical trend properties, is given in Table 4.
3.3. River Flow Trends
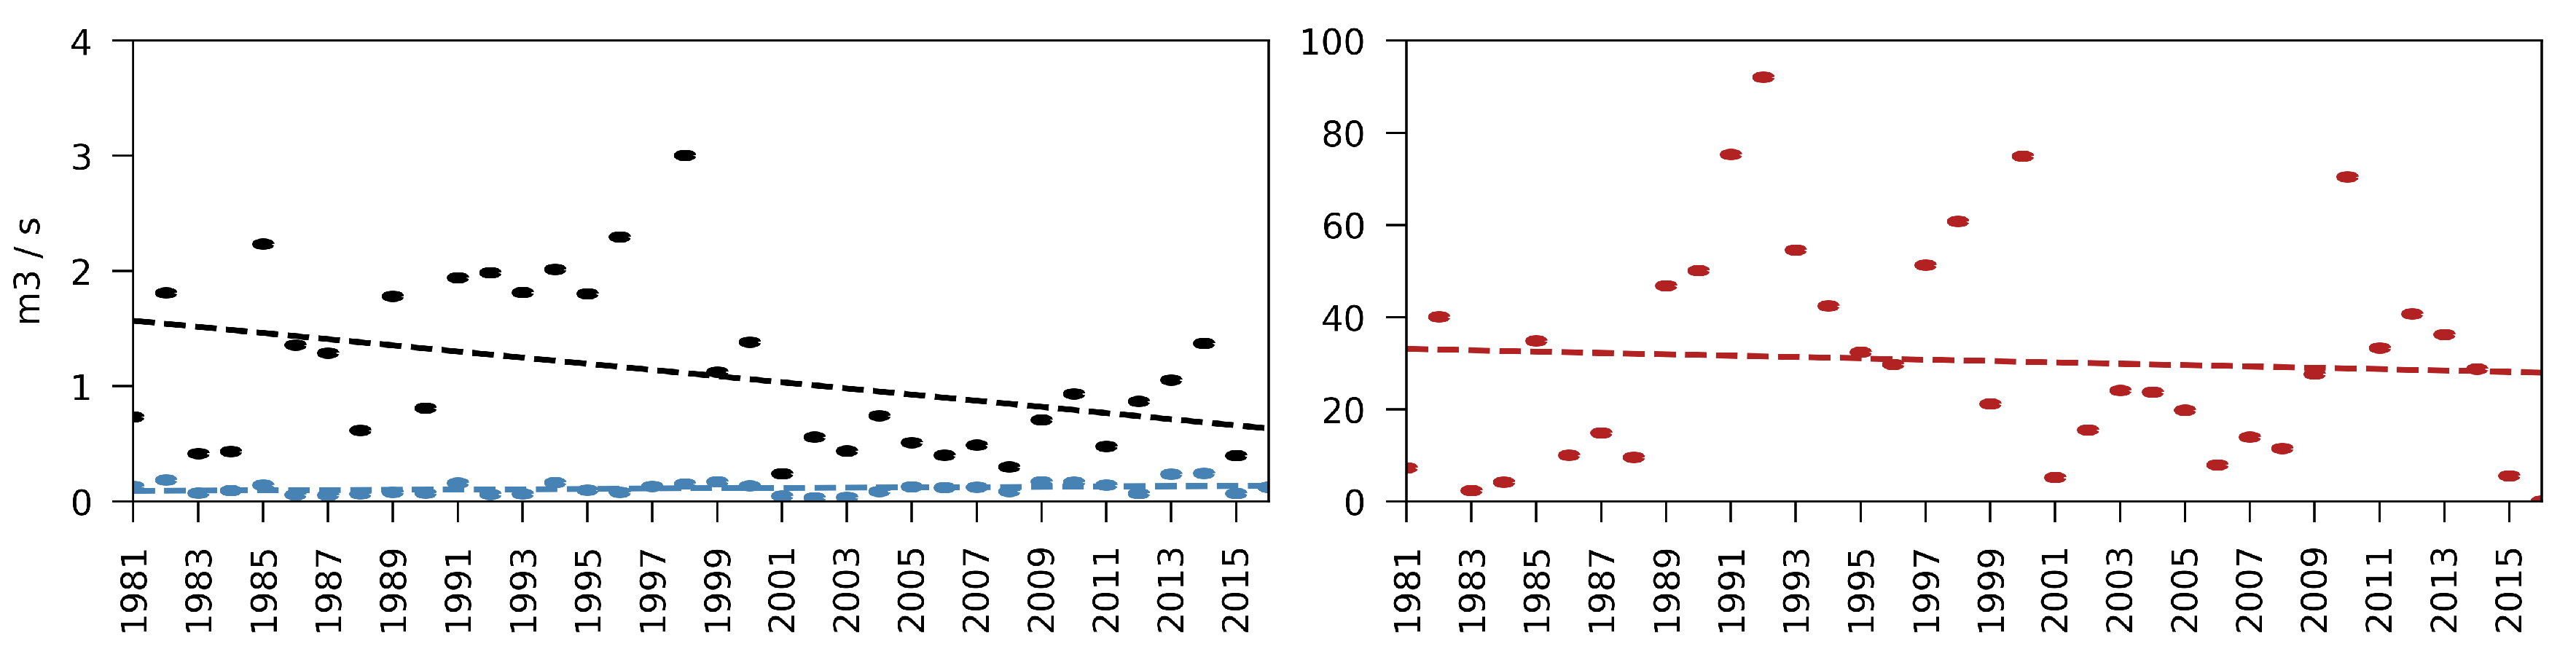
The annual mean flow 1981–2016 at the catchment outlet A shows a decreasing trend around 1.10 ms, with the maximum mean flow observed in 1998 (3.01 ms) and the minimum mean flow observed in 2016 (0.12 ms) (Figure 9 left).
Observed mean annual minimum flows were increasing 1981–2016 around 0.11 ms with the smallest recording in 2002 (0.03 ms) and the largest recording in 2014 (0.24 ms) (Figure 9 left). Observed mean annual maximum flows showed no significant trend 1981–2016 around 31.10 ms, with the largest observation in 1992 (92.14 ms) and the smallest observation in 2015 (5.61 ms) (Figure 9 right).
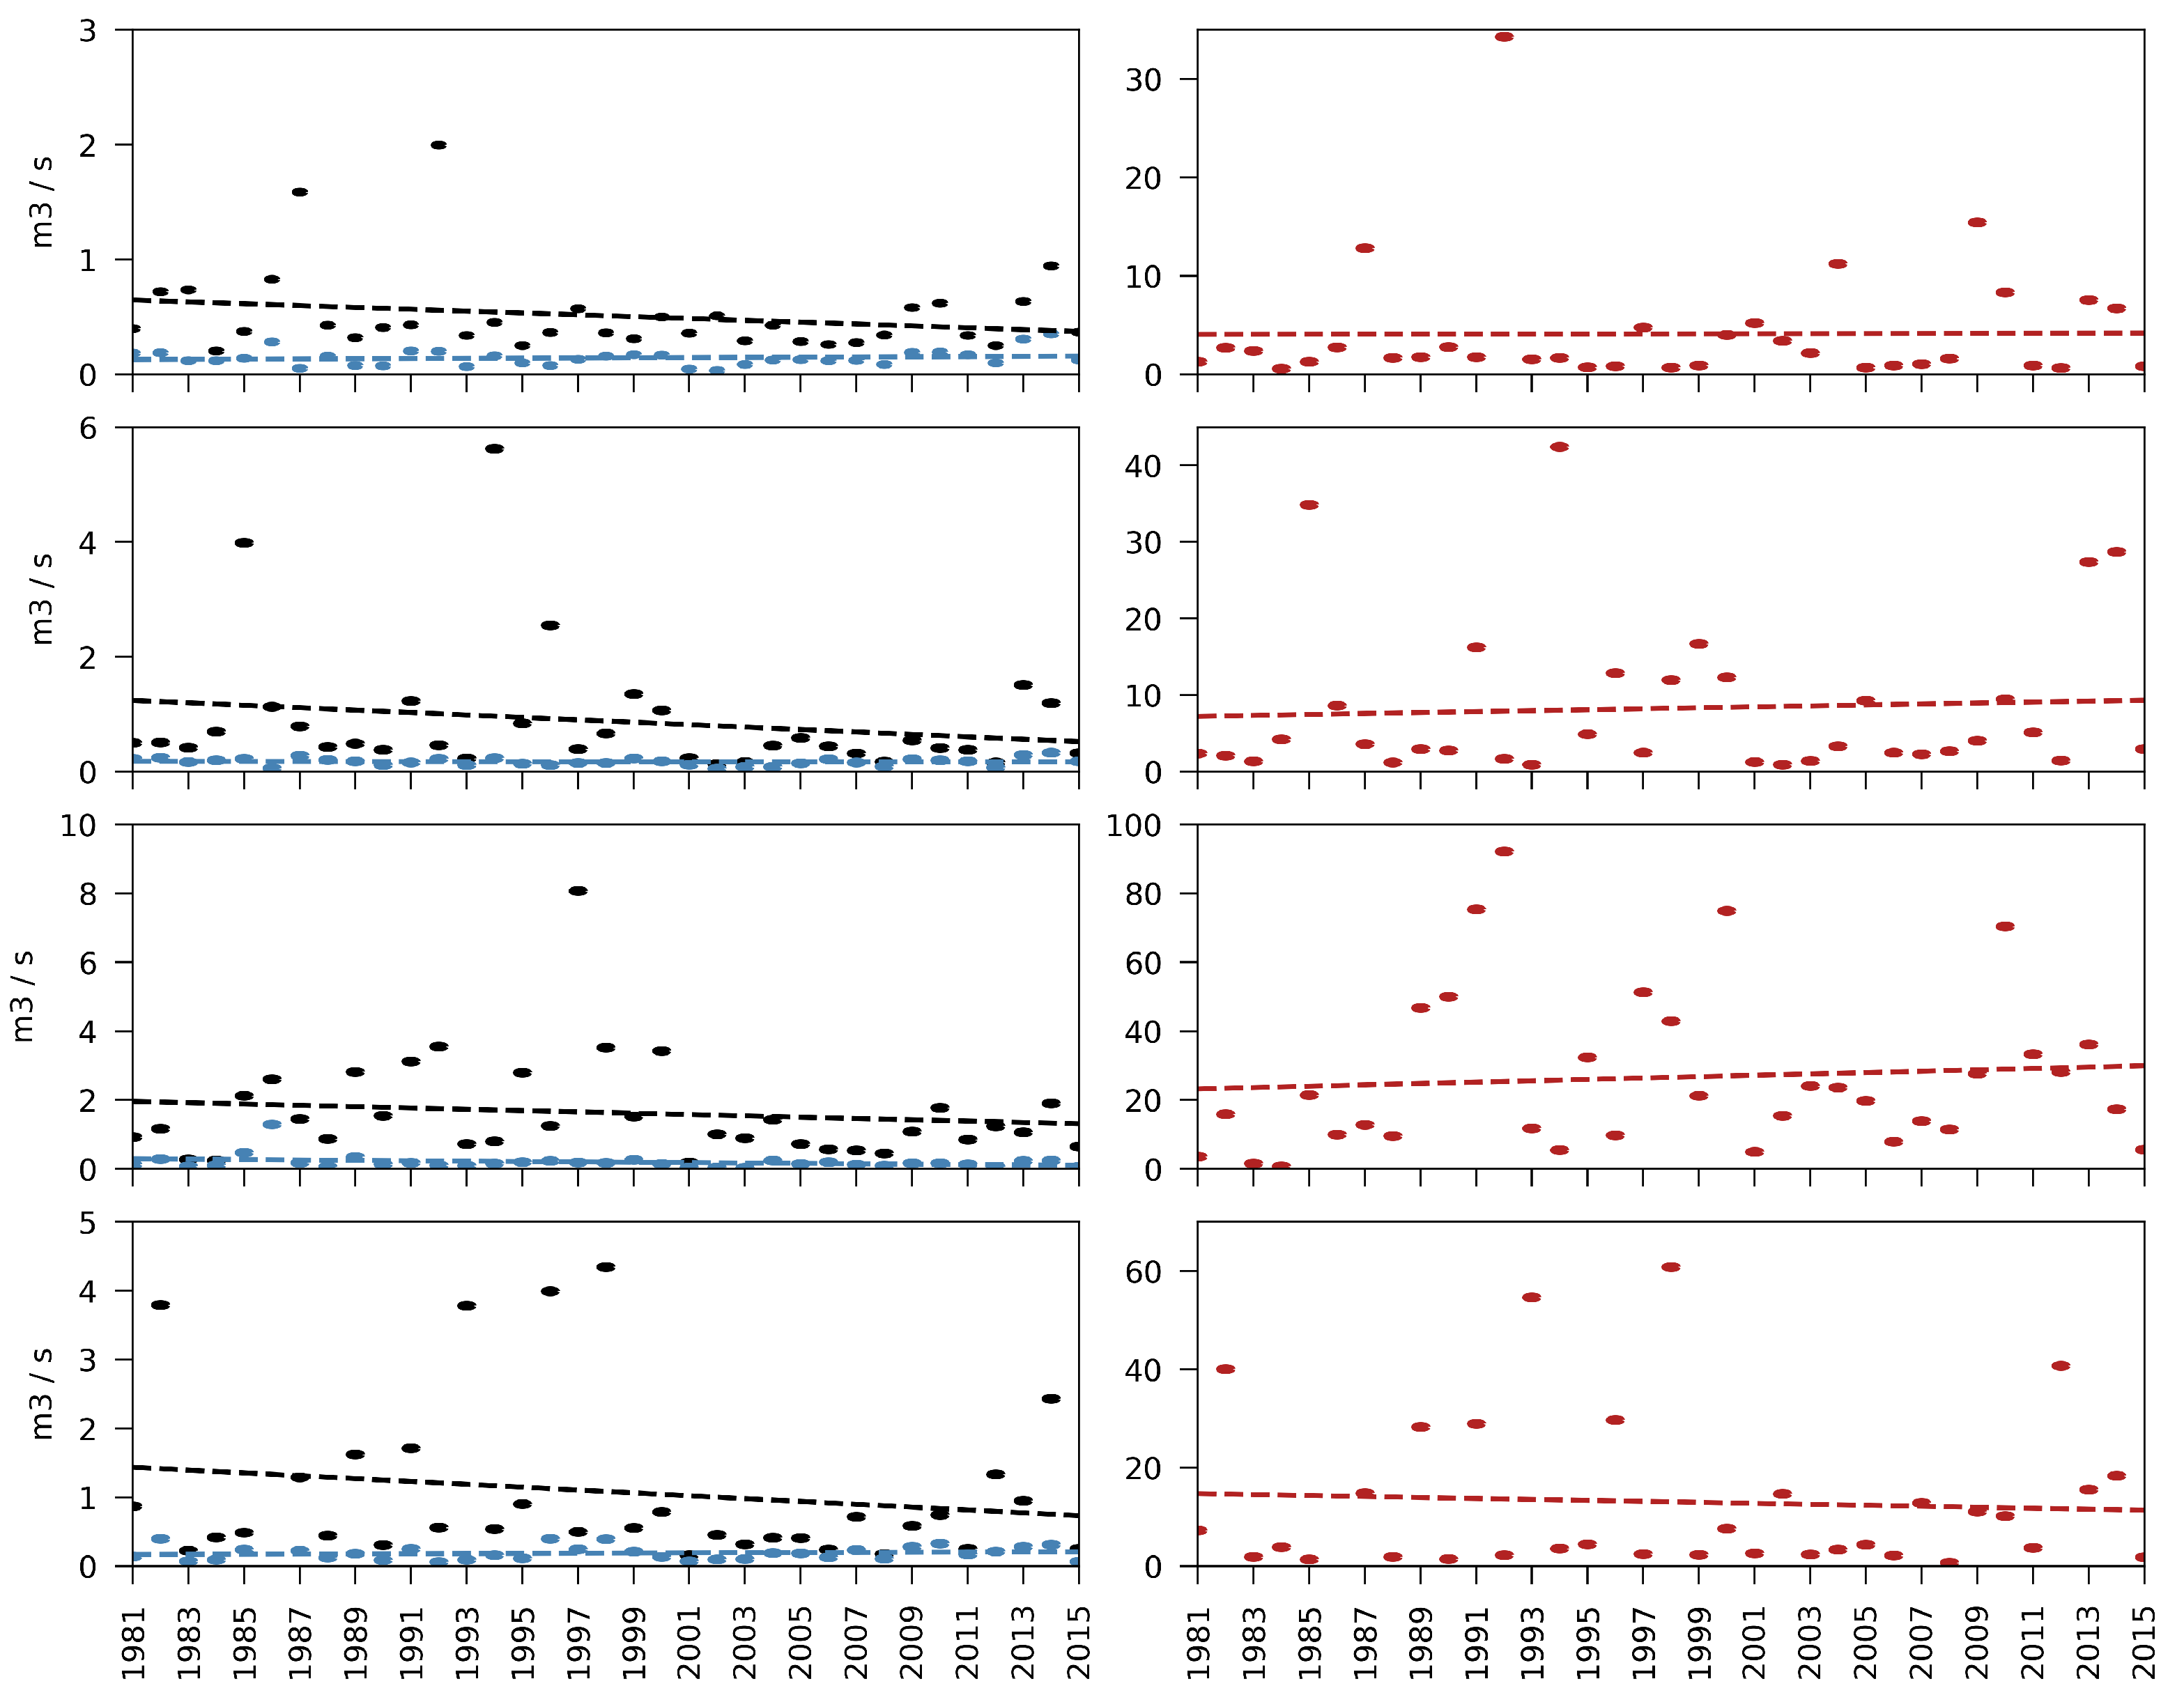
Mean winter flows 1981–2016 show, as already observed for annual flows, a decreasing trend around 0.51 ms, with the lowest observation in the winter 2016 (0.12 ms) and the largest observation in the winter 1992 (1.99 ms). Minimum winter flows showed no significant trend 1981–2016 around 0.14 ms, with the lowest flow in 2002 (0.03 ms) and the largest minimum in 2014 (0.35 ms). Maximum winter flows also remained constant 1981–2016 at 4.11 ms, with the highest flow recorded in 1992 (34.28 ms) and the lowest maximum in 1984 (0.58 ms) (Figure 10 top).
Mean spring flows 1981–2016 were decreasing around 0.88 ms, with the lowest mean in 2002 (0.13 ms) and the largest mean recorded in 1994 (5.62 ms). Mean minimum spring flows show no trend at 0.17 ms, with the lowest flow occurring in 2014 (0.33 ms) and the highest minimum observed in 2002 (0.05 ms). Mean maximum spring flows were increasing 1981–2016 around 8.27 ms, with the largest recording in 1994 (42.42 ms) and the smallest recording in 1993 (0.91 ms) (Figure 10 2nd from top).
Mean summer flows 1981–2016 remained constant around 1.64 ms, with the largest summer mean flow observed in 1997 (8.07 ms) and the lowest mean in the summer 2001 (0.19 ms). Summer minima show no trend 1981–2016 at 0.20 ms, with the lowest observation in 2003 (0.04 ms) and the highest in 1986 (1.30 ms). Summer maxima increased 1981–2016 around 26.57 ms, with the largest summer flow in 1992 (92.14 ms) and the lowest maximum in 1984 (0.76 ms) (Figure 10 3rd from top).
Mean autumn flows showed no trend 1981–2016 around 1.08 ms, with the lowest mean recorded in 2001 (0.16 ms) and the largest mean occurring in 1998 (4.35 ms). Autumn minima decreased around 0.19 ms, with the smallest flow recorded in autumn 1992 (0.06 ms) and the largest minimum in 1982 (0.40 ms). Maximum autumn flows remained constant 1981–2016 around 13.04 ms, with the smallest maximum in autumn 2008 (0.73 ms) and the largest autumn flow in 1998 (60.81 ms) (Figure 10 bottom). A comprehensive summary of the observed runoff trends, including statistical trend properties, is given in Table 4.
3.4. Water Balance and Evapotranspiration
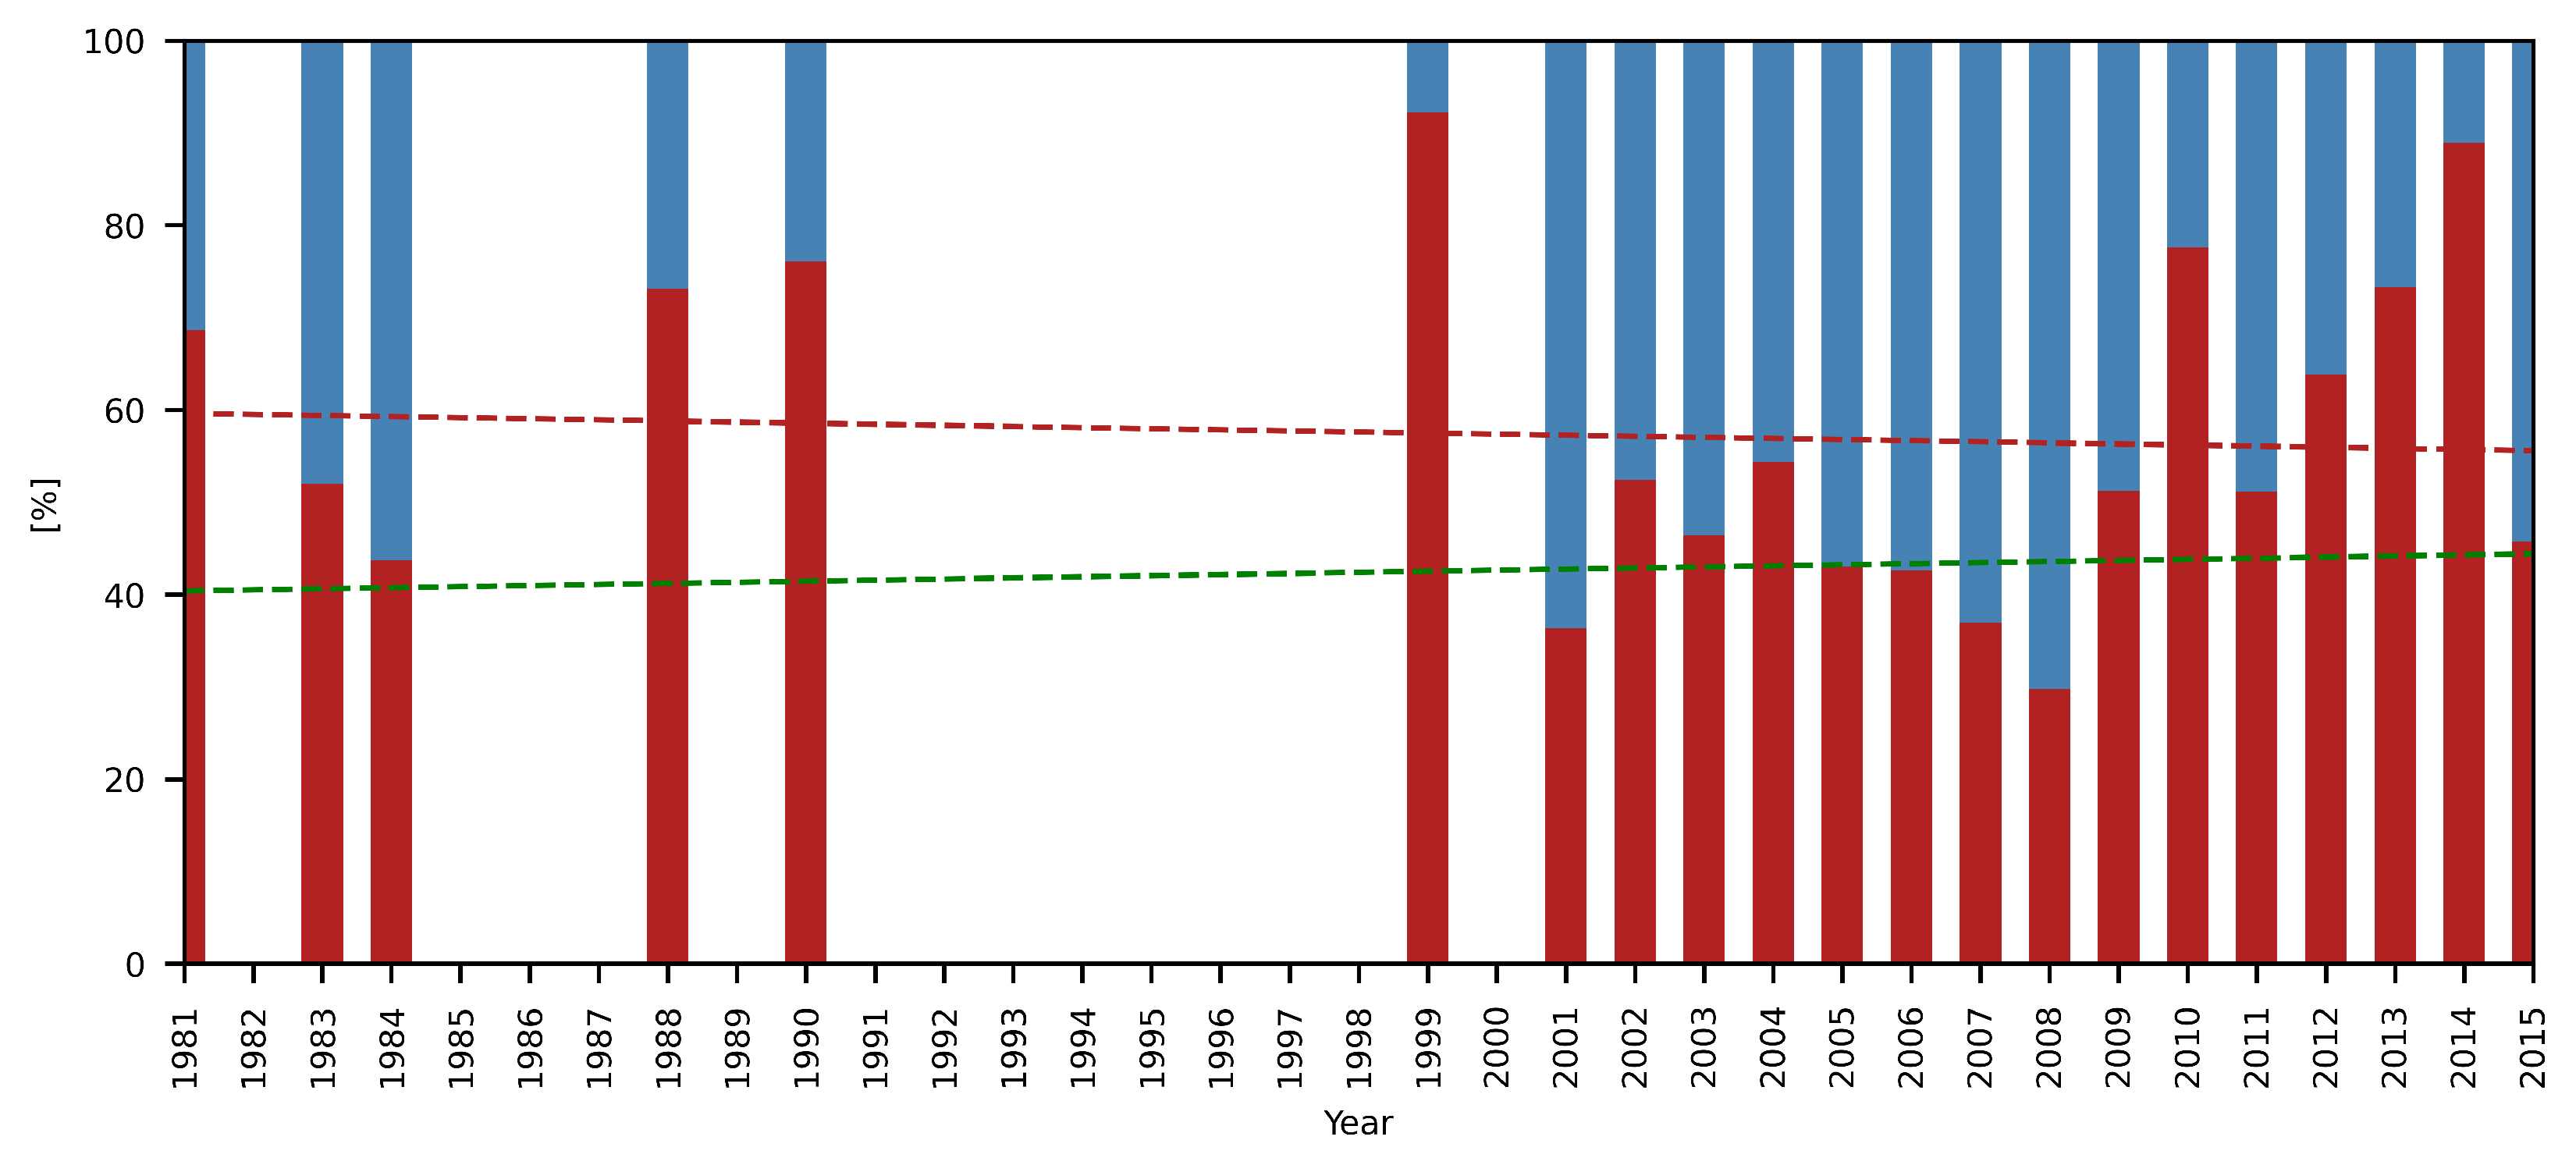
Particularly in the 1990s, flow measurements at A have large gaps preventing the computation of annual flow volumes. Thus, 21 years were available for the assessment of evapotranspiration based on precipitation and catchment runoff (Figure 11). The mean runoff fraction of the water balance 1981–2015 was 55% showing a decreasing trend. It is to be noted though that fewer data were available for the time period 1981–2000 (6 years) than for the period 2001–2015 (15 years). The highest runoff fraction was observed in 2014 with 89%, while the lowest fraction occurred in 2008 with only 30%. In absolute values, the catchment runoff ranged between 131 and 743 mm, with a mean of 338 mm per year.
Based on long-term precipitation and runoff trends, the actual evapotranspiration fraction showed no significant trend 1981–2015, with a mean of 45%, a minimum of 11% in 2014, and a maximum of 70% in 2008. In absolute numbers, actual catchment evapotranspiration 1981–2015 was around 257 mm, with a minimum of 92 mm in 2014 and a maximum of 451 mm in 2008.
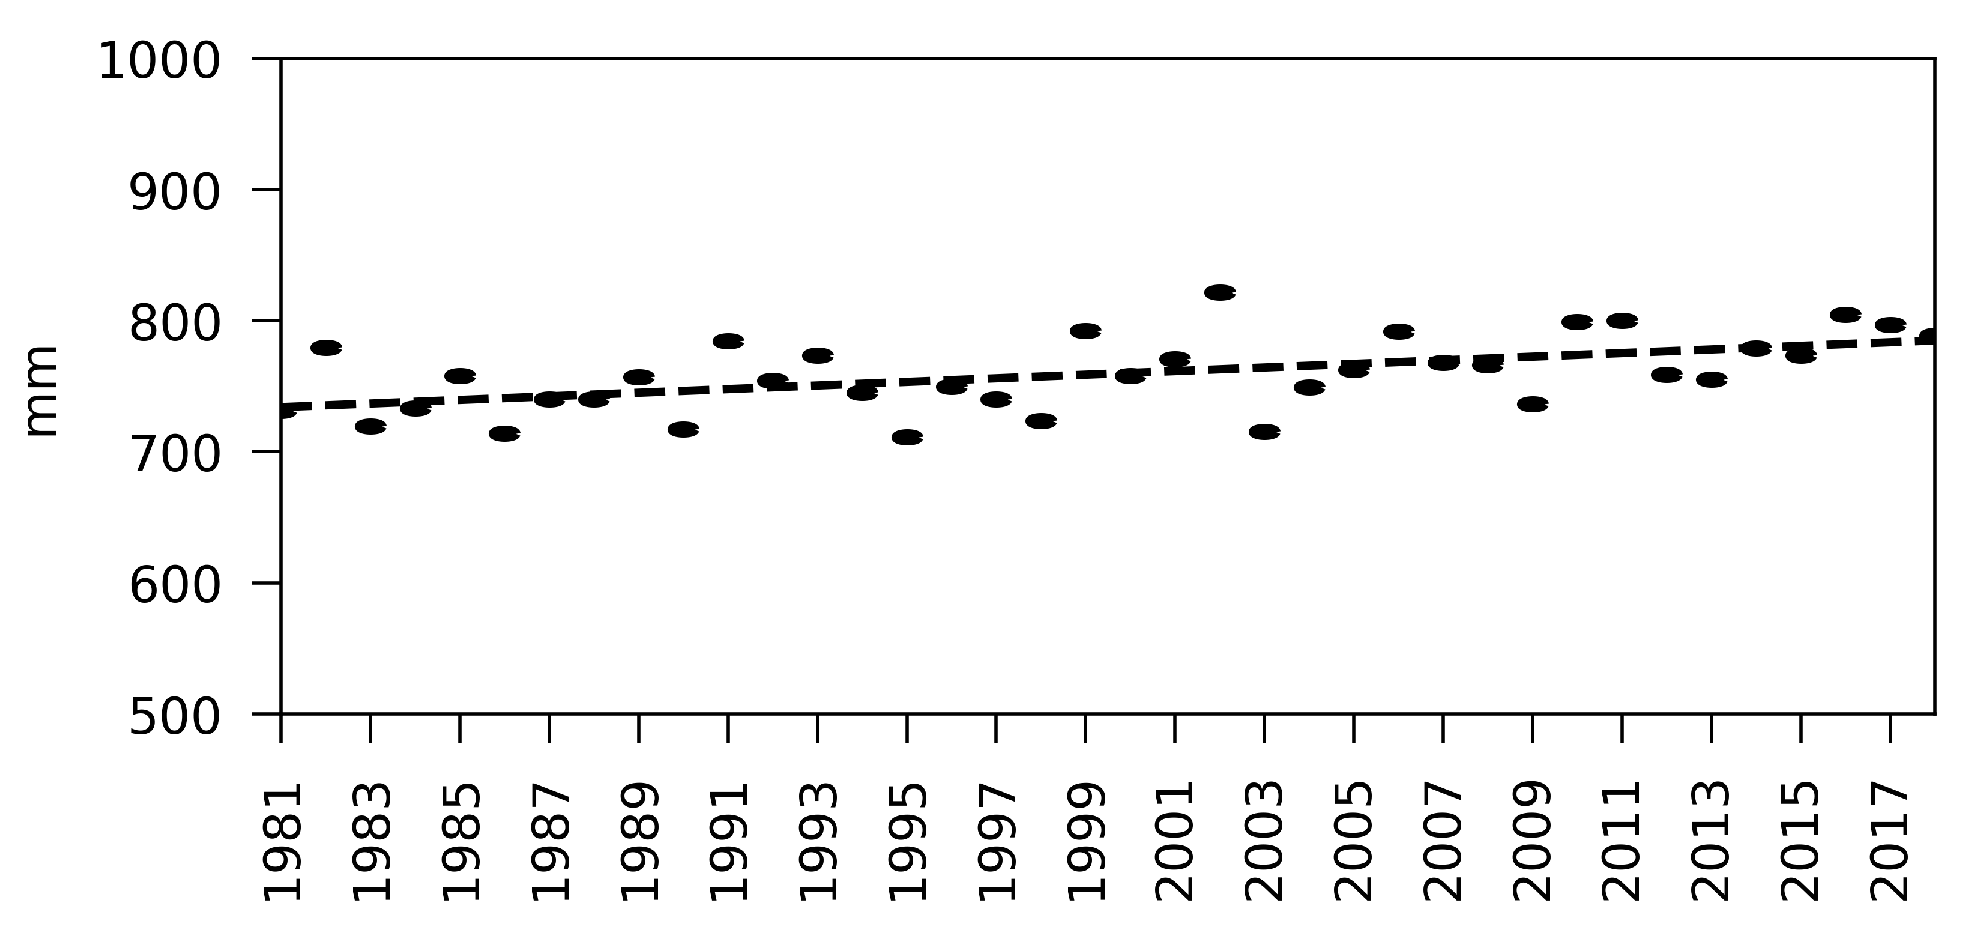
The potential catchment evapotranspiration (PET) was computed using remote sensing data for air temperature, global radiation, and top of the atmosphere solar radiation for the period 1981–2019. Catchment PET rates show an increasing trend 1981–2019 around a mean of 759 mm per year, with a minimum of 711 mm in 1995 and a maximum of 822 mm in 2002 (Figure 12).
4. Discussion
The mean annual air temperature in the catchment Pöllau has been decreasing since 1991, while annual minima remained constant and maxima were increasing. While the development of minima and maxima is a common consequence of ongoing climate change (e.g., [53,54]), the decreasing long-term development of the annual mean temperature in Pöllau is less often confirmed by literature (e.g., [20]) as clearly more often rising temperatures are reported (e.g., [15,18,19,55]). For Austria, rising temperatures have also been reported [56], which confirms that climate change impacts at the local or regional scale differ from large-scale assessments. On the other hand, the rising maximum temperatures in the catchment are in line with the APCC report [56]. It is to be noted that the observed time series in Pöllau covers approximately 30 years and is thus rather short for temperature change detection. It might, therefore, well be that the analyzed time period coincided with a period where warming in the catchment did not occur (see, e.g., [57]). This assumption is also confirmed by reports and studies addressing climate change in Austria (e.g., [56,58,59]).
The reported climate-change-induced perturbations to precipitation patterns are far more diverse than for air temperature. Increasing [11,23] and decreasing precipitation rates [20,21] were reported as well as areas where no change was detected [19,20,60]. Mean annual precipitation in Pöllau remained constant between 1979 and 2019. This observation is confirmed by the Austrian APCC report [56], reporting increased precipitation for the Austrian alpine areas and a decrease for South-East Austria since the beginning of observations. The Pöllau catchment falls in between these two areas in the Eastern alpine foothills. The seasonal precipitation analysis indicates a shift towards the summer season, for which an increasing trend was observed. The remaining seasons (spring, autumn, winter) showed no significant trend concerning the fallen precipitation 1979–2019. It is to be noted that the circumstance in which the rain scales are not equipped with heaters allows for the recording of only melted snowfall. Thus, winter and partly spring precipitation trends depend both on snowfall and melting occurring. Seasonal shifts in precipitation have also been reported by earlier studies (e.g., [9,10]), but it is to be noted that especially the climate change induced impact on precipitation shows obvious regional differences [56]. Precipitation intensities for the analyzed durations were increasing for spring and summer. While summer precipitation depth 1979–2019 was also increasing, it remained constant for spring, allowing the assumption of a reduction of events and at the same time, a higher event precipitation. For winter and autumn, no significant trends were detected, as already observed for the precipitation depth in these seasons. Furthermore, for the precipitation intensity trends, it is to be noted that snowfall was only recorded indirectly via melted snow.
Mean river flows at gauge A decreased annually as well as for spring and summer, while flow minima increased annually and for autumn, and flow maxima increased for spring and summer. These observations are in line with the APCC report [56]. At the same time, the precipitation depth increased only during the summer season and analyzed precipitation intensities during spring and summer. The rather opposite trends for the precipitation depth and mean river flows indicate that more water is evapotranspirated in the catchment during the warm season, and increasing flow maxima during spring and summer could be due to increasing precipitation intensities for the same seasons.
Based on observed catchment precipitation and runoff, the actual annual catchment evapotranspiration showed no significant trend between 1981 and 2015. It is to be noted though that only river flow at the catchment outlet was used for computation as subsurface flow data were not available. PET rates show an increasing trend 1981–2019 for the catchment. It is to be noted though that these rates were computed based on remote sensing data as local ground climate data were insufficiently complete for PET computation. Furthermore, the selected PET computation approach [52] did not account for wind speed, due to missing data, and may therefore underestimate catchment PET. These observations are confirmed by several studies reporting similar evapotranspiration trends for the Northern hemisphere [19,29,30,31,32] as well as by the APCC report [56].
5. Conclusions
The presented analyses of hydro-meteorological variables observed in a hydrological research basin in Eastern Austria mostly confirm the results of earlier studies. At the same time, the results confirm the assumption that climate change impacts vary regionally, and large-scale assessments cannot account for site-specific conditions.
- The decreasing trend of long-term mean annual temperatures in the catchments shows that climate change impacts can vary at the regional scale.
- The observed precipitation trends are in line with large-scale assessments, including the study catchment. However, precipitation recordings during the cold season were hampered by missing rain scale heaters. For a full assessment of precipitation developments and especially seasonal changes, heated rain scales should be used.
- Climate data observations such as global radiation, relative humidity, wind speed or soil moisture are of substantial importance to assess the drivers for the change in climate variables. Thus, a comprehensive monitoring is required to assess not only if but also why climate variables are changing.
- The impact of increasing precipitation intensities is seen in larger river flow maxima during spring and summer.
- Actual catchment evapotranspiration (AET) remained constant, while potential catchment evapotranspiration (PET) increased 1981–2019. It is to be noted that AET was computed based on river runoff that was not fully available for a significant number of years, hampering the assessment.
- The analysis of hydro-meteorological variable trends can be supported by numerical modeling approaches to evaluate the variations in hydrological and meteorological processes in more detail. This numerical assessment is currently conducted for the catchment Pöllau.
Author Contributions
Conceptualization, G.K. and D.M.; data curation, G.K.; formal analysis, G.K.; funding acquisition, D.M.; investigation, G.K.; methodology, G.K. and D.C.; project administration, G.K. and D.M.; supervision, D.M.; validation, G.K., D.C. and D.M.; visualization, G.K.; writing—original draft, G.K.; writing—review and editing, G.K., D.C. and D.M. All authors have read and agreed to the published version of the manuscript.
Funding
This research received no external funding.
Institutional Review Board Statement
Not applicable.
Informed Consent Statement
Not applicable.
Data Availability Statement
Restrictions apply to the availability of these data. Data were obtained from the Institute of Urban Water Management, Graz University of Technology and Department 14, Federal State of Styria, and are available from the authors with the permission of the Institute of Urban Water Management, Graz University of Technology and Department 14, Federal State of Styria.
Acknowledgments
Roland Fuchs and Christian Rath for operation and maintenance of the test catchment; Department 14 Styria (Robert Schatzl and Josef Quinz) for the support for the test catchment operation. Open Access Funding by the Graz University of Technology.
Conflicts of Interest
The authors declare no conflict of interest.
References
- IPCC. Climate Change 2014: Synthesis Report. Contribution of Working Groups I, II and III to the Fifth Assessment Report of the Intergovernmental Panel on Climate Change; Technical Report; IPCC: Geneva, Switzerland, 2014. [Google Scholar]
- IPCC. Global Warming of 1.5 °C. An IPCC Special Report on the Impacts of Global Warming of 1.5 °C above Pre-Industrial Levels and Related Global Greenhouse Gas Emission Pathways, in the Context of Strengthening the Global Response to the Threat of Climate Change, Sustainable Development, and Efforts to Eradicate Poverty; OCLC: 1056192590; Technical Report; IPCC: Geneva, Switzerland, 2018. [Google Scholar]
- IPCC. Climate Change 2013: The Physical Science Basis. Contribution of Working Group I to the Fifth Assessment Report of the Intergovernmental Panel on Climate Change; Reporter: IPCC; Technical Report; Cambridge University Press: Cambridge, UK; New York, NY, USA, 2013. [Google Scholar]
- USGCRP. Climate Science Special Report: Fourth National Climate Assessment, Volume I; Technical Report; U.S. Global Change Research Program: Washington, DC, USA, 2017.
- Steger, C.; Kotlarski, S.; Jonas, T.; Schär, C. Alpine snow cover in a changing climate: A regional climate model perspective. Clim. Dyn. 2013, 41, 735–754. [Google Scholar] [CrossRef] [Green Version]
- Olefs, M.; Koch, R.; Schöner, W.; Marke, T. Changes in Snow Depth, Snow Cover Duration, and Potential Snowmaking Conditions in Austria, 1961–2020—A Model Based Approach. Atmosphere 2020, 11, 1330. [Google Scholar] [CrossRef]
- Bender, E.; Lehning, M.; Fiddes, J. Changes in Climatology, Snow Cover, and Ground Temperatures at High Alpine Locations. Front. Earth Sci. 2020, 8, 100. [Google Scholar] [CrossRef]
- Gardner, A.S.; Moholdt, G.; Cogley, J.G.; Wouters, B.; Arendt, A.A.; Wahr, J.; Berthier, E.; Hock, R.; Pfeffer, W.T.; Kaser, G.; et al. A Reconciled Estimate of Glacier Contributions to Sea Level Rise: 2003 to 2009. Science 2013, 340, 852–857. [Google Scholar] [CrossRef] [PubMed] [Green Version]
- Brugnara, Y.; Brunetti, M.; Maugeri, M.; Nanni, T.; Simolo, C. High-resolution analysis of daily precipitation trends in the central Alps over the last century. Int. J. Climatol. 2012, 32, 1406–1422. [Google Scholar] [CrossRef]
- Brunetti, M.; Maugeri, M.; Nanni, T.; Auer, I.; Böhm, R.; Schöner, W. Precipitation variability and changes in the greater Alpine region over the 1800–2003 period. J. Geophys. Res. Atmos. 2006, 111. [Google Scholar] [CrossRef]
- Trenberth, K. Changes in precipitation with climate change. Clim. Res. 2011, 47, 123–138. [Google Scholar] [CrossRef] [Green Version]
- Arnell, N.W.; Gosling, S.N. The impacts of climate change on river flow regimes at the global scale. J. Hydrol. 2013, 486, 351–364. [Google Scholar] [CrossRef]
- Blöschl, G.; Hall, J.; Parajka, J.; Perdigão, R.A.P.; Merz, B.; Arheimer, B.; Aronica, G.T.; Bilibashi, A.; Bonacci, O.; Borga, M.; et al. Changing climate shifts timing of European floods. Science 2017, 357, 588–590. [Google Scholar] [CrossRef] [Green Version]
- Blöschl, G.; Viglione, A.; Merz, R.; Parajka, J.; Salinas, J.L.; Schöner, W. Auswirkungen des Klimawandels auf Hochwasser und Niederwasser. Österreichische Wasser und Abfallwirtschaft 2011, 63, 21–30. [Google Scholar] [CrossRef]
- Luterbacher, J.; Dietrich, D.; Xoplaki, E.; Grosjean, M.; Wanner, H. European Seasonal and Annual Temperature Variability, Trends, and Extremes Since 1500. Science 2004, 303, 1499–1503. [Google Scholar] [CrossRef] [PubMed] [Green Version]
- Hu, Z.; Chen, X.; Chen, D.; Li, J.; Wang, S.; Zhou, Q.; Yin, G.; Guo, M. “Dry gets drier, wet gets wetter”: A case study over the arid regions of central Asia. Int. J. Climatol. 2019, 39, 1072–1091. [Google Scholar] [CrossRef]
- Latif, M. Uncertainty in climate change projections. J. Geochem. Explor. 2011, 110, 1–7. [Google Scholar] [CrossRef] [Green Version]
- Li, L.J.; Zhang, L.; Wang, H.; Wang, J.; Yang, J.W.; Jiang, D.J.; Li, J.Y.; Qin, D.Y. Assessing the impact of climate variability and human activities on streamflow from the Wuding River basin in China. Hydrol. Process. 2007, 21, 3485–3491. [Google Scholar] [CrossRef]
- Chaouche, K.; Neppel, L.; Dieulin, C.; Pujol, N.; Ladouche, B.; Martin, E.; Salas, D.; Caballero, Y. Analyses of precipitation, temperature and evapotranspiration in a French Mediterranean region in the context of climate change. Comptes Rendus Geosci. 2010, 342, 234–243. [Google Scholar] [CrossRef]
- Girvetz, E.H.; Zganjar, C.; Raber, G.T.; Maurer, E.P.; Kareiva, P.; Lawler, J.J. Applied Climate-Change Analysis: The Climate Wizard Tool. PLoS ONE 2009, 4, e8320. [Google Scholar] [CrossRef] [Green Version]
- Cannarozzo, M.; Noto, L.V.; Viola, F. Spatial distribution of rainfall trends in Sicily (1921–2000). Phys. Chem. Earth Parts A B C 2006, 31, 1201–1211. [Google Scholar] [CrossRef]
- Blöschl, G.; Montanari, A. Climate change impacts—Throwing the dice? Hydrol. Process. 2009. [Google Scholar] [CrossRef]
- Famiglietti, J.S.; Rodell, M. Water in the Balance. Science 2013, 340, 1300–1301. [Google Scholar] [CrossRef]
- Blaschke, A.P.; Merz, R.; Parajka, J.; Salinas, J.; Blöschl, G. Auswirkungen des Klimawandels auf das Wasserdargebot von Grund- und Oberflächenwasser. Österreichische Wasser und Abfallwirtschaft 2011, 63, 31–41. [Google Scholar] [CrossRef]
- Kumar, P. Seasonal rain changes. Nat. Clim. Chang. 2013, 3, 783–784. [Google Scholar] [CrossRef]
- Zhang, S.; Hua, D.; Meng, X.; Zhang, Y. Climate change and its driving effect on the runoff in the “Three-River Headwaters” region. J. Geogr. Sci. 2011, 21, 963. [Google Scholar] [CrossRef]
- Chen, Z.; Chen, Y.; Li, B. Quantifying the effects of climate variability and human activities on runoff for Kaidu River Basin in arid region of northwest China. Theor. Appl. Climatol. 2013, 111, 537–545. [Google Scholar] [CrossRef]
- Wang, H.; Stephenson, S.R. Quantifying the impacts of climate change and land use/cover change on runoff in the lower Connecticut River Basin. Hydrol. Process. 2018, 32, 1301–1312. [Google Scholar] [CrossRef]
- McCabe, G.J.; Wolock, D.M. Temporal and spatial variability of the global water balance. Clim. Chang. 2013, 120, 375–387. [Google Scholar] [CrossRef]
- Vicente-Serrano, S.M.; Azorin-Molina, C.; Sanchez-Lorenzo, A.; Revuelto, J.; López-Moreno, J.I.; González-Hidalgo, J.C.; Moran-Tejeda, E.; Espejo, F. Reference evapotranspiration variability and trends in Spain, 1961–2011. Glob. Planet. Chang. 2014, 121, 26–40. [Google Scholar] [CrossRef] [Green Version]
- Elferchichi, A.; Giorgio, G.A.; Lamaddalena, N.; Ragosta, M.; Telesca, V. Variability of Temperature and Its Impact on Reference Evapotranspiration: The Test Case of the Apulia Region (Southern Italy). Sustainability 2017, 9, 2337. [Google Scholar] [CrossRef] [Green Version]
- Maček, U.; Bezak, N.; Šraj, M. Reference evapotranspiration changes in Slovenia, Europe. Agric. For. Meteorol. 2018, 260–261, 183–192. [Google Scholar] [CrossRef]
- Calanca, P.; Roesch, A.; Jasper, K.; Wild, M. Global Warming and the Summertime Evapotranspiration Regime of the Alpine Region. Clim. Chang. 2006, 79, 65–78. [Google Scholar] [CrossRef]
- McVicar, T.R.; Roderick, M.L.; Donohue, R.J.; Li, L.T.; Van Niel, T.G.; Thomas, A.; Grieser, J.; Jhajharia, D.; Himri, Y.; Mahowald, N.M.; et al. Global review and synthesis of trends in observed terrestrial near-surface wind speeds: Implications for evaporation. J. Hydrol. 2012, 416–417, 182–205. [Google Scholar] [CrossRef]
- Feng, H.; Zhang, M. Global land moisture trends: Drier in dry and wetter in wet over land. Sci. Rep. 2015, 5, 18018. [Google Scholar] [CrossRef]
- Maier, R.; Krebs, G.; Pichler, M.; Muschalla, D.; Gruber, G. Spatial Rainfall Variability in Urban Environments—High-Density Precipitation Measurements on a City-Scale. Water 2020, 12, 1157. [Google Scholar] [CrossRef] [Green Version]
- Kirchengast, G.; Kabas, T.; Leuprecht, A.; Bichler, C.; Truhetz, H. WegenerNet: A Pioneering High-Resolution Network for Monitoring Weather and Climate. Bull. Am. Meteorol. Soc. 2013, 95, 227–242. [Google Scholar] [CrossRef]
- Bergmann, H. Experimentelle Hydrologische Forschung in der Steiermark; Technical Report; Das Hydrologische Versuchsgebiet Pöllau: Graz, Austria, 1981. [Google Scholar]
- Bergmann, H. A Hydrological Research Basin in Austria: Planning and Aims. In Proceedings of the International Symposium On Hydrological Research Basins, Bern, Switzerland, 21–23 September 1982; pp. 23–30. [Google Scholar]
- Ruch, C.; Vasvári, V.; Harum, T. Hydrologisches Versuchsgebiet Pöllau—25 Jahre Beobachtung. Beiträge zur Hydrogeologie 2006, 55, 45–58. [Google Scholar]
- Krebs, G.; Weidemann, S.; Fuchs, R.; Muschalla, D. Hydrologisches Versuchsgebiet Pöllau—Hydrometeorologische Langzeitbetrachtungen. Wasserland Steiermark 2017, 1, 22–26. [Google Scholar]
- OTT Pluvio2—Regenmesser/Niederschlagsmesser—OTT HYDROMET CH. Available online: https://www.ott.com/de-at/produkte/meteorologie-29/ott-pluvio2-l-regenmesser-niederschlagsmesser-1520/ (accessed on 27 July 2021).
- European Environment Agency. © European Union, Copernicus Land Monitoring Service. Page, f.ex. in 2018: “© European Union, Copernicus Land Monitoring Service 2018, European Environment Agency (EEA)”. 2021. Available online: https://cds.climate.copernicus.eu/ (accessed on 27 July 2021).
- Yue, S.; Wang, C. The Mann-Kendall Test Modified by Effective Sample Size to Detect Trend in Serially Correlated Hydrological Series. Water Resour. Manag. 2004, 18, 201–218. [Google Scholar] [CrossRef]
- Theil, H. A Rank-Invariant Method of Linear and Polynomial Regression Analysis. In Henri Theil’s Contributions to Economics and Econometrics: Econometric Theory and Methodology; Advanced Studies in Theoretical and Applied Econometrics; Raj, B., Koerts, J., Eds.; Springer: Dordrecht, The Netherlands, 1992; pp. 345–381. [Google Scholar] [CrossRef]
- Sen, P.K. Estimates of the Regression Coefficient Based on Kendall’s Tau. J. Am. Stat. Assoc. 1968, 63, 1379–1389. [Google Scholar] [CrossRef]
- Alemu, Z.A.; Dioha, M.O. Climate change and trend analysis of temperature: The case of Addis Ababa, Ethiopia. Environ. Syst. Res. 2020, 9, 27. [Google Scholar] [CrossRef]
- Mahmood, R.; Jia, S.; Zhu, W. Analysis of climate variability, trends, and prediction in the most active parts of the Lake Chad basin, Africa. Sci. Rep. 2019, 9, 6317. [Google Scholar] [CrossRef] [PubMed] [Green Version]
- Peng, S.; Gang, C.; Cao, Y.; Chen, Y. Assessment of climate change trends over the Loess Plateau in China from 1901 to 2100. Int. J. Climatol. 2018, 38, 2250–2264. [Google Scholar] [CrossRef]
- Merabtene, T.; Siddique, M.; Shanableh, A. Assessment of Seasonal and Annual Rainfall Trends and Variability in Sharjah City, UAE. Adv. Meteorol. 2016, 2016, e6206238. [Google Scholar] [CrossRef] [Green Version]
- Hersbach, H.; Bell, B.; Berrisford, P.; Biavati, G.; Horányi, A.; Muñoz Sabater, J.; Nicolas, J.; Peubey, C.; Radu, R.; Rozum, I.; et al. ERA5 Hourly Data on Single Levels from 1979 to Present. 2018. Available online: https://cds.climate.copernicus.eu/ (accessed on 27 July 2021).
- De Bruin, H.A.R.; Trigo, I.F.; Bosveld, F.C.; Meirink, J.F. A Thermodynamically Based Model for Actual Evapotranspiration of an Extensive Grass Field Close to FAO Reference, Suitable for Remote Sensing Application. J. Hydrometeorol. 2016, 17, 1373–1382. [Google Scholar] [CrossRef]
- Easterling, D.; Horton, B.; Jones, P.; Peterson, T.; Karl, T.; Parker, D.; Salinger, M.; Razuvayev, V.; Plummer, N.; Jamason, P.; et al. Maximum and Minimum Temperature Trends for the Globe. Science 1997, 277, 364–367. [Google Scholar] [CrossRef] [Green Version]
- Ghasemi, A.R. Changes and trends in maximum, minimum and mean temperature series in Iran. Atmos. Sci. Lett. 2015, 16, 366–372. [Google Scholar] [CrossRef]
- Folland, C.K.; Karl, T.R.; Salinger, M.J. Observed climate variability and change. Weather 2002, 57, 269–278. [Google Scholar] [CrossRef]
- Kromp-Kolb, H.; Nakicenovic, N.; Steininger, K.; Gobiet, A.; Formayer, H.; Köppl, A.; Prettenthaler, F.; Stötter, J.; Schneider, J. Österreichischer Sachstandsbericht Klimawandel 2014; Verlag der Österreichischen Akademie der Wissenschaften: Vienna, Austria, 2014. [Google Scholar]
- Easterling, D.R.; Wehner, M.F. Is the climate warming or cooling? Geophys. Res. Lett. 2009, 36. [Google Scholar] [CrossRef] [Green Version]
- Gobiet, A.; Kotlarski, S.; Beniston, M.; Heinrich, G.; Rajczak, J.; Stoffel, M. 21st century climate change in the European Alps—A review. Sci. Total. Environ. 2014, 493, 1138–1151. [Google Scholar] [CrossRef]
- Brunetti, M.; Lentini, G.; Maugeri, M.; Nanni, T.; Auer, I.; Böhm, R.; Schöner, W. Climate variability and change in the Greater Alpine Region over the last two centuries based on multi-variable analysis. Int. J. Climatol. 2009, 29, 2197–2225. [Google Scholar] [CrossRef]
- Yong, B.; Ren, L.; Hong, Y.; Gourley, J.J.; Chen, X.; Dong, J.; Wang, W.; Shen, Y.; Hardy, J. Spatial–Temporal Changes of Water Resources in a Typical Semiarid Basin of North China over the Past 50 Years and Assessment of Possible Natural and Socioeconomic Causes. J. Hydrometeorol. 2013, 14, 1009–1034. [Google Scholar] [CrossRef] [Green Version]
Figure 1.
Overview of the catchment Pöllau (discharge measurement A) with the sub-catchment Prätisbach (discharge measurement B) in the west and the sub-catchment Dürre Saifen (discharge measurement D) in the east, and the locations of the precipitation measurements.
Figure 1.
Overview of the catchment Pöllau (discharge measurement A) with the sub-catchment Prätisbach (discharge measurement B) in the west and the sub-catchment Dürre Saifen (discharge measurement D) in the east, and the locations of the precipitation measurements.

Figure 2.
Scatter of daily recordings of each station against each station (Pearson correlation 0.91).
Figure 2.
Scatter of daily recordings of each station against each station (Pearson correlation 0.91).

Figure 3.
Annual mean (black), maxima (red) and minima (blue) of the air temperature and their trends 1979–2019.
Figure 3.
Annual mean (black), maxima (red) and minima (blue) of the air temperature and their trends 1979–2019.

Figure 4.
Mean (black), maxima (red) and minima (blue) of the air temperature and the trend 1979–2019 for the winter (top left), spring (top right), summer (bottom left), and autumn (bottom right).
Figure 4.
Mean (black), maxima (red) and minima (blue) of the air temperature and the trend 1979–2019 for the winter (top left), spring (top right), summer (bottom left), and autumn (bottom right).

Figure 5.
Annual precipitation of the 7 stations (25% and 75% percentile, median (red)) and trend 1979–2019 (dashed line).
Figure 5.
Annual precipitation of the 7 stations (25% and 75% percentile, median (red)) and trend 1979–2019 (dashed line).

Figure 6.
Precipitation of the 7 stations (25% and 75% percentile, median (red)) and trend 1979–2019 (dashed line) for winter (top left), spring (top right), summer (bottom left), and autumn (bottom right).
Figure 6.
Precipitation of the 7 stations (25% and 75% percentile, median (red)) and trend 1979–2019 (dashed line) for winter (top left), spring (top right), summer (bottom left), and autumn (bottom right).

Figure 7.
Annual wet days recorded at the 7 stations (25% and 75% percentile, median (red)) and trend 1979–2019 (dashed line).
Figure 7.
Annual wet days recorded at the 7 stations (25% and 75% percentile, median (red)) and trend 1979–2019 (dashed line).

Figure 8.
Seasonal maximum precipitation intensities for 120 minutes of the 7 stations (25% and 75% percentile, median (red)) and the trend 1979–2017 (dashed line).
Figure 8.
Seasonal maximum precipitation intensities for 120 minutes of the 7 stations (25% and 75% percentile, median (red)) and the trend 1979–2017 (dashed line).

Figure 9.
Annual mean (black, left), minimum (blue, left) and maximum (red, right) flow at Saifenbach and linear trends 1981–2016.
Figure 9.
Annual mean (black, left), minimum (blue, left) and maximum (red, right) flow at Saifenbach and linear trends 1981–2016.

Figure 10.
Mean (black), minimum (blue) and maximum (red) flow at Saifenbach and linear trends 1981–2016 for the winter (top), spring (2nd from top), summer (3rd from top), and autumn (bottom).
Figure 10.
Mean (black), minimum (blue) and maximum (red) flow at Saifenbach and linear trends 1981–2016 for the winter (top), spring (2nd from top), summer (3rd from top), and autumn (bottom).

Figure 11.
Annual water balance as fallen precipitation (100%, blue) and runoff fraction (red). The dashed lines mark the long-term trend of the runoff fraction (red) and the actual evapotranspiration fraction (green) 1981–2015. Missing years did not provide sufficient runoff data for a cumulative annual runoff value.

Figure 12.
Annual potential evapotranspiration (PET) based on de Bruin [52] computed with remote sensing data [51] and trend 1981–2019 (dashed line).


Table 1.
Overview of the catchment properties [40].
Table 1.
Overview of the catchment properties [40].
| Area | 58.3 km |
| Land-use | forest 43.8%, grass- and cropland 51.8%, settlement 4.4% |
| Stream density | 1.87 km km or 0.0019 m m |
| Geology | Crystalline basement rock 82.7%, tertiary hill country 12.7%, quaternary deposits 4.3% |
| Elevation range | 398–1279 m.a.s.l |
| Discharge characteristics | Q 0.04 ms; Q 92.14 ms; Q 0.49 ms; Mean runoff coefficient 0.31 (1979–2004) |
Table 2.
Stations, altitude (m.a.s.l), measured variables: WL (water level), WT (water temperature), P (precipitation), T (air temperature), p (air pressure), rH (relative humidity), Ra (solar radiation), ST (soil temperature), SM (soil moisture), WS (wind speed), WD (wind direction), and data availability.
| Station | Altitude | Observed Variables | Data Availability |
|---|---|---|---|
| A | 398 | WL, WT | 1980– |
| B | 415 | WL, WT | 1980– |
| C | 418 | WL, WT | 1988–1997, 2000–2007 |
| D | 455 | WL, WT | 1997–2005, 2018– |
| 1 | 424 | P | 1979– |
| 2 | 729 | P | 1980– |
| 3 | 740 | P | 1980– |
| 4 | 800 | P | 1980– |
| 5 | 740 | P | 1980– |
| 6 | 1040 | P | 1980– |
| 7 | 525 | P, T, p, rH, Ra, ST, SM, WS, WD | 1980– |
Table 3.
Land-cover in the catchment Pöllau in 1990, 2000, 2006, 2012, and 2018 based on the CORINE land-cover datasets [43].
Table 3.
Land-cover in the catchment Pöllau in 1990, 2000, 2006, 2012, and 2018 based on the CORINE land-cover datasets [43].
| Land-Cover | 1990 | 2000 | 2006 | 2012 | 2018 | Δ1990–2018 | |
|---|---|---|---|---|---|---|---|
| Discontinuous urban fabric | (km2) | 2.21 | 2.48 | 2.48 | 2.51 | 2.51 | 0.30 |
| Mixed forest | 9.34 | 9.19 | 9.19 | 9.19 | 9.19 | −0.15 | |
| Coniferous forest | 16.30 | 16.16 | 16.16 | 16.18 | 16.18 | −0.12 | |
| Agricultural areas and pastures | 30.05 | 30.07 | 30.07 | 30.02 | 30.02 | −0.03 | |
| Discontinuous urban fabric | (%) | 3.8 | 4.3 | 4.3 | 4.4 | 4.4 | 0.6 |
| Mixed forest | 16.1 | 15.9 | 15.9 | 15.9 | 15.9 | −0.2 | |
| Coniferous forest | 28.2 | 28.0 | 28.0 | 28.0 | 28.0 | −0.2 | |
| Agricultural areas and pastures | 51.9 | 51.9 | 51.9 | 51.8 | 51.8 | −0.1 |
Table 4.
Summary of the climate variable trends for the catchment Pöllau.
| Assessment Period | Variable | Unit | Y-W Trend | p-Value | T-S Slope |
|---|---|---|---|---|---|
| Annual | mean air temperature | (C) | decrease | 1.4E-03 | −3.1E-02 |
| minimum air temperature | (C) | no trend | 2.3E-01 | 2.7E-02 | |
| maximum air temperature | (C) | increase | 1.2E-03 | 6.3E-02 | |
| precipitation depth | (mm) | no trend | 9.3E-02 | 6.0E-01 | |
| annual wet days | (days) | no trend | 7.1E-01 | −7.7E-02 | |
| precipitation intensity | (mm/60 min) | no trend | 5.7E-01 | 4.0E-04 | |
| precipitation intensity | (mm/120 min) | no trend | 4.3E-01 | 5.0E-03 | |
| precipitation intensity | (mm/240 min) | no trend | 5.9E-01 | 7.0E-03 | |
| mean river flow | (ms) | decrease | 4.2E-03 | −2.4E-02 | |
| minimum river flow | (ms) | increase | 5.2E-03 | 1.0E-03 | |
| maximum river flow | (ms) | no trend | 7.3E-01 | −1.1E-01 | |
| actual evapotranspiration | (mm) | no trend | 7.1E-01 | 1.3E-01 | |
| potential evapotranspiration | (mm) | increase | 0.0E00 | 1.4E00 | |
| Winter | mean air temperature | (C) | decrease | 1.1E-02 | −3.7E-02 |
| minimum air temperature | (C) | no trend | 2.2E-01 | −1.5E-02 | |
| maximum air temperature | (C) | no trend | 6.5E-01 | 2.8E-02 | |
| precipitation depth | (mm) | no trend | 4.5E-01 | −1.5E-01 | |
| precipitation intensity | (mm/60 min) | increase | 5.5E-04 | 1.7E-02 | |
| precipitation intensity | (mm/120 min) | no trend | 5.8E-02 | 9.0E-03 | |
| precipitation intensity | (mm/240 min) | no trend | 1.8E-01 | 1.4E-02 | |
| mean river flow | (ms) | decrease | 3.2E-03 | −5.0E-03 | |
| minimum river flow | (ms) | no trend | 4.6E-01 | 3.0E-04 | |
| maximum river flow | (ms) | no trend | 1.8E-01 | −9.0E-03 | |
| Spring | mean air temperature | (C) | decrease | 2.6E-05 | −4.7E-02 |
| minimum air temperature | (C) | decrease | 1.1E-02 | −4.6E-02 | |
| maximum air temperature | (C) | decrease | 3.0E-04 | −9.9E-02 | |
| precipitation depth | (mm) | no trend | 3.4E-01 | 2.8E-01 | |
| precipitation intensity | (mm/60 min) | increase | 3.1E-04 | 1.1E-02 | |
| precipitation intensity | (mm/120 min) | increase | 7.1E-03 | 2.5E-02 | |
| precipitation intensity | (mm/240 min) | increase | 1.0E-02 | 4.9E-02 | |
| mean river flow | (ms) | decrease | 1.1E-03 | −9.0E-03 | |
| minimum river flow | (ms) | no trend | 2.4E-01 | -9.0E-04 | |
| maximum river flow | (ms) | increase | 3.0E-02 | 3.6E-02 | |
| Summer | mean air temperature | (C) | no trend | 7.9E-01 | −1.0E-03 |
| minimum air temperature | (C) | no trend | 2.3E-01 | −3.4E-02 | |
| maximum air temperature | (C) | increase | 7.5E-05 | 6.3E-02 | |
| precipitation depth | (mm) | increase | 2.5E-06 | 2.1E00 | |
| precipitation intensity | (mm/60 min) | no trend | 1.3E-01 | 3.4E-03 | |
| precipitation intensity | (mm/120 min) | increase | 0.0E00 | 5.2E-02 | |
| precipitation intensity | (mm/240 min) | increase | 1.6E-05 | 5.4E-02 | |
| mean river flow | (ms) | no trend | 2.0E-01 | −1.1E-02 | |
| minimum river flow | (ms) | no trend | 1.5E-01 | −1.5E-03 | |
| maximum river flow | (ms) | increase | 4.4E-02 | 3.6E-01 | |
| Autumn | mean air temperature | (C) | no trend | 8.5E-01 | −5.0E-03 |
| minimum air temperature | (C) | decrease | 6.2E-03 | −6.9E-02 | |
| maximum air temperature | (C) | increase | 1.0E-03 | 6.4E-02 | |
| precipitation depth | (mm) | no trend | 5.0E-01 | −2.8E-01 | |
| precipitation intensity | (mm/60 min) | no trend | 7.9E-01 | −8.1E-17 | |
| precipitation intensity | (mm/120 min) | no trend | 2.1E-01 | −5.0E-03 | |
| precipitation intensity | (mm/240 min) | no trend | 7.8E-01 | −4.2E-04 | |
| mean river flow | (ms) | no trend | 1.6E-01 | 7.3E-03 | |
| minimum river flow | (ms) | increase | 8.0E-03 | 1.7E-03 | |
| maximum river flow | (ms) | no trend | 2.8E-01 | 2.9E-02 |
Publisher’s Note: MDPI stays neutral with regard to jurisdictional claims in published maps and institutional affiliations. |
© 2021 by the authors. Licensee MDPI, Basel, Switzerland. This article is an open access article distributed under the terms and conditions of the Creative Commons Attribution (CC BY) license (https://creativecommons.org/licenses/by/4.0/).
Share and Cite
MDPI and ACS Style
Krebs, G.; Camhy, D.; Muschalla, D. Hydro-Meteorological Trends in an Austrian Low-Mountain Catchment. Climate 2021, 9, 122. https://0-doi-org.brum.beds.ac.uk/10.3390/cli9080122
AMA Style
Krebs G, Camhy D, Muschalla D. Hydro-Meteorological Trends in an Austrian Low-Mountain Catchment. Climate. 2021; 9(8):122. https://0-doi-org.brum.beds.ac.uk/10.3390/cli9080122
Chicago/Turabian StyleKrebs, Gerald, David Camhy, and Dirk Muschalla. 2021. "Hydro-Meteorological Trends in an Austrian Low-Mountain Catchment" Climate 9, no. 8: 122. https://0-doi-org.brum.beds.ac.uk/10.3390/cli9080122
Note that from the first issue of 2016, this journal uses article numbers instead of page numbers. See further details here.