
Identification of Weather Influences on Flight Punctuality Using Machine Learning Approach


Department of Civil Engineering, University of Birmingham, Birmingham B15 2TT, UK
*
Author to whom correspondence should be addressed.
Climate 2021, 9(8), 127; https://0-doi-org.brum.beds.ac.uk/10.3390/cli9080127
Submission received: 21 July 2021
/
Revised: 31 July 2021
/
Accepted: 5 August 2021
/
Published: 6 August 2021
(This article belongs to the Special Issue Climate Change, Sustainable Development and Disaster Risks)
Abstract
:One of the top long-term threats to airport resilience is extreme climate-induced conditions, which negatively affect the airport and flight operations. Recent examples, including hurricanes, storms, extreme temperatures (cold/hot), and heavy rains, have damaged airport facilities, interrupted air traffic, and caused higher operational costs. With the development of civil aviation and the pre-COVID-19 surging demand for flights, the passengers’ complaints of flight delay increased, according to FoxBusiness. This study aims to discover the weather factors affecting flight punctuality and determine a high-dimensional scale of consequences stemming from weather conditions and flight operational aspects. Machine learning has been developed in correlation with the weather and statistical data for operations at Birmingham Airport as a case study. The cross-correlated datasets have been kindly provided by Birmingham Airport and the Meteorological Office. The scope and emphasis of this study is placed on the machine learning application to practical flight punctuality prediction in relation to climate conditions. Random forest, artificial neural network, support vector machine, and linear regression are used to develop predictive models. Grid-search and cross-validation are used to select the best parameters. The model can grasp the trend of flight punctuality rates well where R2 is 0.80 and the root mean square error (RMSE) is less than 15% using the model developed by random forest technique. The insights derived from this study will help Airport Authorities and the Insurance industry in predicting the scale of consequences in order to promptly enact and enable adaptative airport climate resilience plans, including air traffic rescheduling, financial resilience to climate variances and extreme weather conditions.
1. Introduction
The transportation sector is a critical part of the infrastructure that brings convenience to people and significant economic benefits to society. The sustainability of the transportation system also plays an important role in reducing energy use and air emissions [1]. With the development of society and travel demands, more travellers are choosing flights as their preferred mode of international transport due to travel time, convenience, or cost. According to the Civil Aviation Authority [2], comparing 2013 and 2017, the passenger numbers increased from 9.1 million to 13 million at Birmingham Airport in the United Kingdom, with the number of complaints from customers increasing as well. Delays were the main reason for complaints, accounting for over 50% of the total complaints. In summary, improving the reliability of flight services would not only save customers time and improve customer satisfaction, but would also lead to sustainable development and resource conservation.
According to Skiena [3], machine learning is the branch of artificial intelligence that best embodies intelligence as it has a highly developed perceptual ability and strong parallel information processing ability and has been used extensively in prediction and image recognition. The realisation process of machine learning is the prediction of one object variable as a function of different input variables. The object variable is found by machine learning typically such that the lowest errors between the predicted results and real values are realised [4]. Diana [5] indicated that there are many examples of open-source software, partly in Python, that make it easier for analysts to train, test, and validate models. Scikit-learn is a toolkit of Python that can be used to compare the validity and reliability of prediction models and choose the best-performing ones [6]. This study compares the outputs from random forest regression (RF), artificial neural network (ANN), support vector machine (SVM), and linear regression (LR) models, based on the same set of variables. In this study, the punctuality rate is predicted so it can be said that the problem is a regression because the predictive value is continuous. The study is implemented using Python.
This study aims to define the main factors affecting flight punctuality at Birmingham Airport. In this study, flight punctuality is the percentage of flights that can depart or arrive on time according to the flight schedule on that day. Then, selected factors will be used to build and train the models to predict flight punctuality when data related to factors are available. The result of each model will be compared and analysed for accuracy. Compared to the traditional statistical method, the machine learning approach is more efficient when dealing with nonlinear problems or problems which cannot be understood clearly. For example, the traditional statistical method can be used to consider the relationship between parameters and output while machine learning is used to find a pattern of data by machine without the requirement of human knowledge. When the punctuality rate can be predicted accurately, the airport and airlines can better manage resources such as allocating more staff to refuel aeroplanes or to move passengers’ baggage on days that the predicted punctuality rate is low. Therefore, the effect of flight delay can be minimised. The cost of delay is also reduced according to the better punctuality rate. It is believed that the developed models can improve the prediction capability of flight punctuality rate and operators can use the prediction to manage the flight schedule better.
2. Literature Review
Sternberg et al. [7] indicated that flight delay is one of the biggest performance indicators of air transport systems in the commercial aviation industry. Many researchers have investigated flights from different perspectives to identify how to ensure punctuality [8,9,10]. Flight delay can be predicted by using statistical [11], data science methods [12] or data mining techniques [13]. Machine learning has been popularly used in the past few years to predict flight delay and punctuality.
Machine learning is defined as the act of a computer using experience to automatically improve the performance of a system [14]. There are many machine learning methods for developing prediction models, which include the random forest model, the log-linear regression model (can be used for classification as well, e.g., the punctuality rate equal to 0 means the flight is on-time), support vector regression, and the artificial neural network model.
Breiman et al. [15] defined the random forest model as a collection of classification and regression trees, as well as simple models using binary splits on predictor variables to determine outcome predictions. Many decisions are constructed using randomly selected training datasets and random subsets of predictors. According to Fernández-Delgado et al. [16], compared to other models, the random forest model offers the best accuracy in a classification setting. Its advantage is that it can process very high dimensional data without features being selected, and the results can show which features are more important. Its disadvantage is that it may lead to overfitting in the case of regression.
Rebollo and Balakrishnan [8] indicated that random forest classification and regression algorithms can be used to predict the ratio of flight delays and create a new model by the development of novel NAS delay state variables that can classify several levels of delay and provide values of delay, predicting departure delays from 2 to 24 h in the future. Lee et al. [17] have tested and compared five machine learning techniques, and the results showed that the techniques with the best prediction performances were the linear regression and random forest methods, although the prediction accuracy for the taxi time of each flight was not satisfactory. The variables they used to develop models were the characteristics of airports, traffic flow, and weather conditions.
With the development of technology, artificial intelligence techniques are occupying an important place in the 21st century. There are many types of artificial intelligence techniques, one of the most popular being neural networks [18]. Its advantage is that it is well suited for pattern recognition and classification. The purpose of neural networks is to learn and recognise patterns in datasets and then be trained to detect similar patterns in future datasets for forecasting tasks [19]. Manohar et al. [20] have conducted a study to explore the artificial neural network model for forecasting the air traffic of India airline, with the results proving to be very satisfactory. They used 84 observations from the number of passengers for 84 months. The error was about 0.31.
Xu et al. [18] have used multivariate adaptive regression spline models to predict delays at US airports, finding that the models could show the nonlinear relationship between dependent and independent variables. They used data from 84 airports for 3 months to develop predictive models. The mean absolute prediction error was 5.3 min. Diana [5] compared three forecast outputs for the taxi-out time of flights, which were ordinary least squares, penalised learning models, and ensemble learning models, with the results showing that the ordinary least squares method led to an acceptable balance between dependent and independent variance. The data used in the study was from the Aviation Systems Performance Metrics which showed operations and delays. The number of samples was 1380 which were collected from June to August in 2015 and 2016. Operation, delay, and airport characteristics were used as variables to develop the models. From that study, R2 was ranged from 0.37 to 0.99.
Through surveying and reviewing the existing literature, it can be seen that in recent years, more and more studies have used machine learning techniques to estimate the percentage of flight delays, such as neural networks, random forest, and fuzzy logic. The accuracy of the punctuality rate of these techniques is higher than the classic models used for classification and forecasting. Most studies incorporated weather and the number of flights in their flight delay prediction models, but there was no specific model suitable for predicting flight punctuality. The above literature results show that each airport is different in its configuration and operational patterns, which means that the best prediction models depend on specific cases.
There has been no study analysis of which model would be more suitable for predicting flight punctuality at Birmingham Airport which was used as a case study in this study. Therefore, this study uses the RF, ANN, SVM, and LR models to analyse the influence of macro factors, such as weather conditions, time factors and the number of flights, on the prediction of real-time flight delays at Birmingham Airport. The results can be compared and analysed to select the best-performing model.
3. Methodology
3.1. Data Collection
This study analyses the flight punctuality at Birmingham Airport which has 2 terminals used by several airlines. From the number of passengers, this airport is the seventh busiest airport in the United Kingdom in 2017. Flight operation data has been collected from the UK Civil Aviation Authority [2] and VariFlight [21] with the first datasets including the number of departure and arrival flights for each airline. This study also considers the percentage of cancellations and the status of flight punctuality with data shown monthly from January 2017 to December 2019. However, daily historical data is not available online. The total number of samples is 1400 which will be used for further training and testing.
VariFlight Technology company [21] has collected the everyday real flight data since 2018. The flight data includes the punctuality rate, the number of scheduled flights, and the arrival and departure operations for each day from 1 January 2018 to 31 December 2019. The data is classified into two groups related to the punctuality rate. The first group is the flights landing at Birmingham Airport and arriving at the terminal. The second group is the flights that left the terminal and departed from Birmingham Airport. Both groups of data have been assessed for deviations from the initial announcements. The deviations are considered to identify the punctuality.
To investigate the weather-related factors, data on the weather conditions was collected from the Met Office by email and the GuoWaiTianQi websites [22] showed clear and accurate weather data such as meteorology, temperature, wind direction, and wind speed in each day. The description of the variables used in the models is shown in Table 1.
3.2. Data Preparation
First, data cleaning and standardisation needed to be completed. During the data cleaning, the empty values (or empty cells in the dataset) relating to flight data and meteorological data were deleted due to flight data and weather data having different methods of identification that are not linear. Therefore, the nominal variables were coded. For the meteorological data, the method of the one-hot vector was used, as well as the week, month, and day.
For wind power and temperature, the wind force level was extracted and normalised [0,1] according to its level from 0 to 6 based on the Beaufort scale. In terms of temperature, −3 to 28 °C was normalised into [0,1]. Lastly, after cleaning and fusing the data, the variables were analysed using ANOVA with regard to whether they had a relationship with the punctuality rate.
3.3. Feature Selection, Model Development, and Performance Evaluation
Predictive models in this study were developed using 4 machine learning techniques including random forest (RF) which is a method combining multiple decision and applying the voting system to optimise the performance of the model; artificial neural network (ANN) which is based on the brain’s function and constructed as layers and nodes; support vector machine (SVM) in which the machine creates an nD plane to classify samples into defined groups; and linear regression (LR) in which the machine generates the weight of each feature to calculate the classes of samples. The dataset was divided into two parts, which were training and testing with a ratio of 80/20. Note: the data spit ratios have been checked to obtain an optimal ratio that does not yield overfitting. Models were tuned using hyperparameter tuning through grid-search. Examples of hyperparameters which could be tuned are numbers of layers, numbers of nodes, activation function, learning rate, momentum, and optimizer. Overfitting was prevented by using cross-validation and dropout.
In developing predictive models, feature selection is important because features directly affect the performance of models. Inappropriate feature selection can result in poor performance, overfitting, and expensive models. To select features and evaluate the performance of the developed models, the following indicators were used.
• Probability value (p-value)
The p-value from one-way ANOVA can be used to test the strength of the relationship between the dependent variable and an independent variable, with the function imported from NumPy which is a Python library. Note: ANOVA or ‘Analysis of variance’ is a collection of statistical models and their associated estimation procedures used to analyse the differences between means. The p-value reflects the probability of an event happening. NumPy has relevant probability distribution function (i.e., Gaussian’s and Baye’s) to determine p-value. The results of the p-value lower than 0.05 mean there was statistical significance, which means there is a relationship between the independent variable and the object variable. Test results closer to 0 mean that the relationship is stronger.
• Coefficient of determination
The function of this metric is . The function was imported from the Scikit-learn measures and was used to determine the explanatory power of the model. The interval of the results was [0,1]. When the results were closer to 1, this meant that the model had a strong explanatory ability.
• Root mean square error
The function of this metric is 2, where m is the number of samples, Yi is the actual output, is the predicted output. This represents the evaluation criterion between the predicted ratings and the truth. Results closer to 0 mean that the error rate between the predicted and actual values is low.
4. Results and Discussion
4.1. Feature Analysis and Selection
This section analyses the potential relationship between the flight punctuality rate at Birmingham Airport and the hypothetical variables. These variables are the flights scheduled, temperature, wind power, meteorology, month, day of the week, and day of the month. After the discussion below, there are two correlation tests, which are the p-value test and the chart of the relationship between features and flight punctuality rate. After the discussion below, this study considers all of the variables used to predict flight punctuality except for the day of the month.
4.1.1. Month
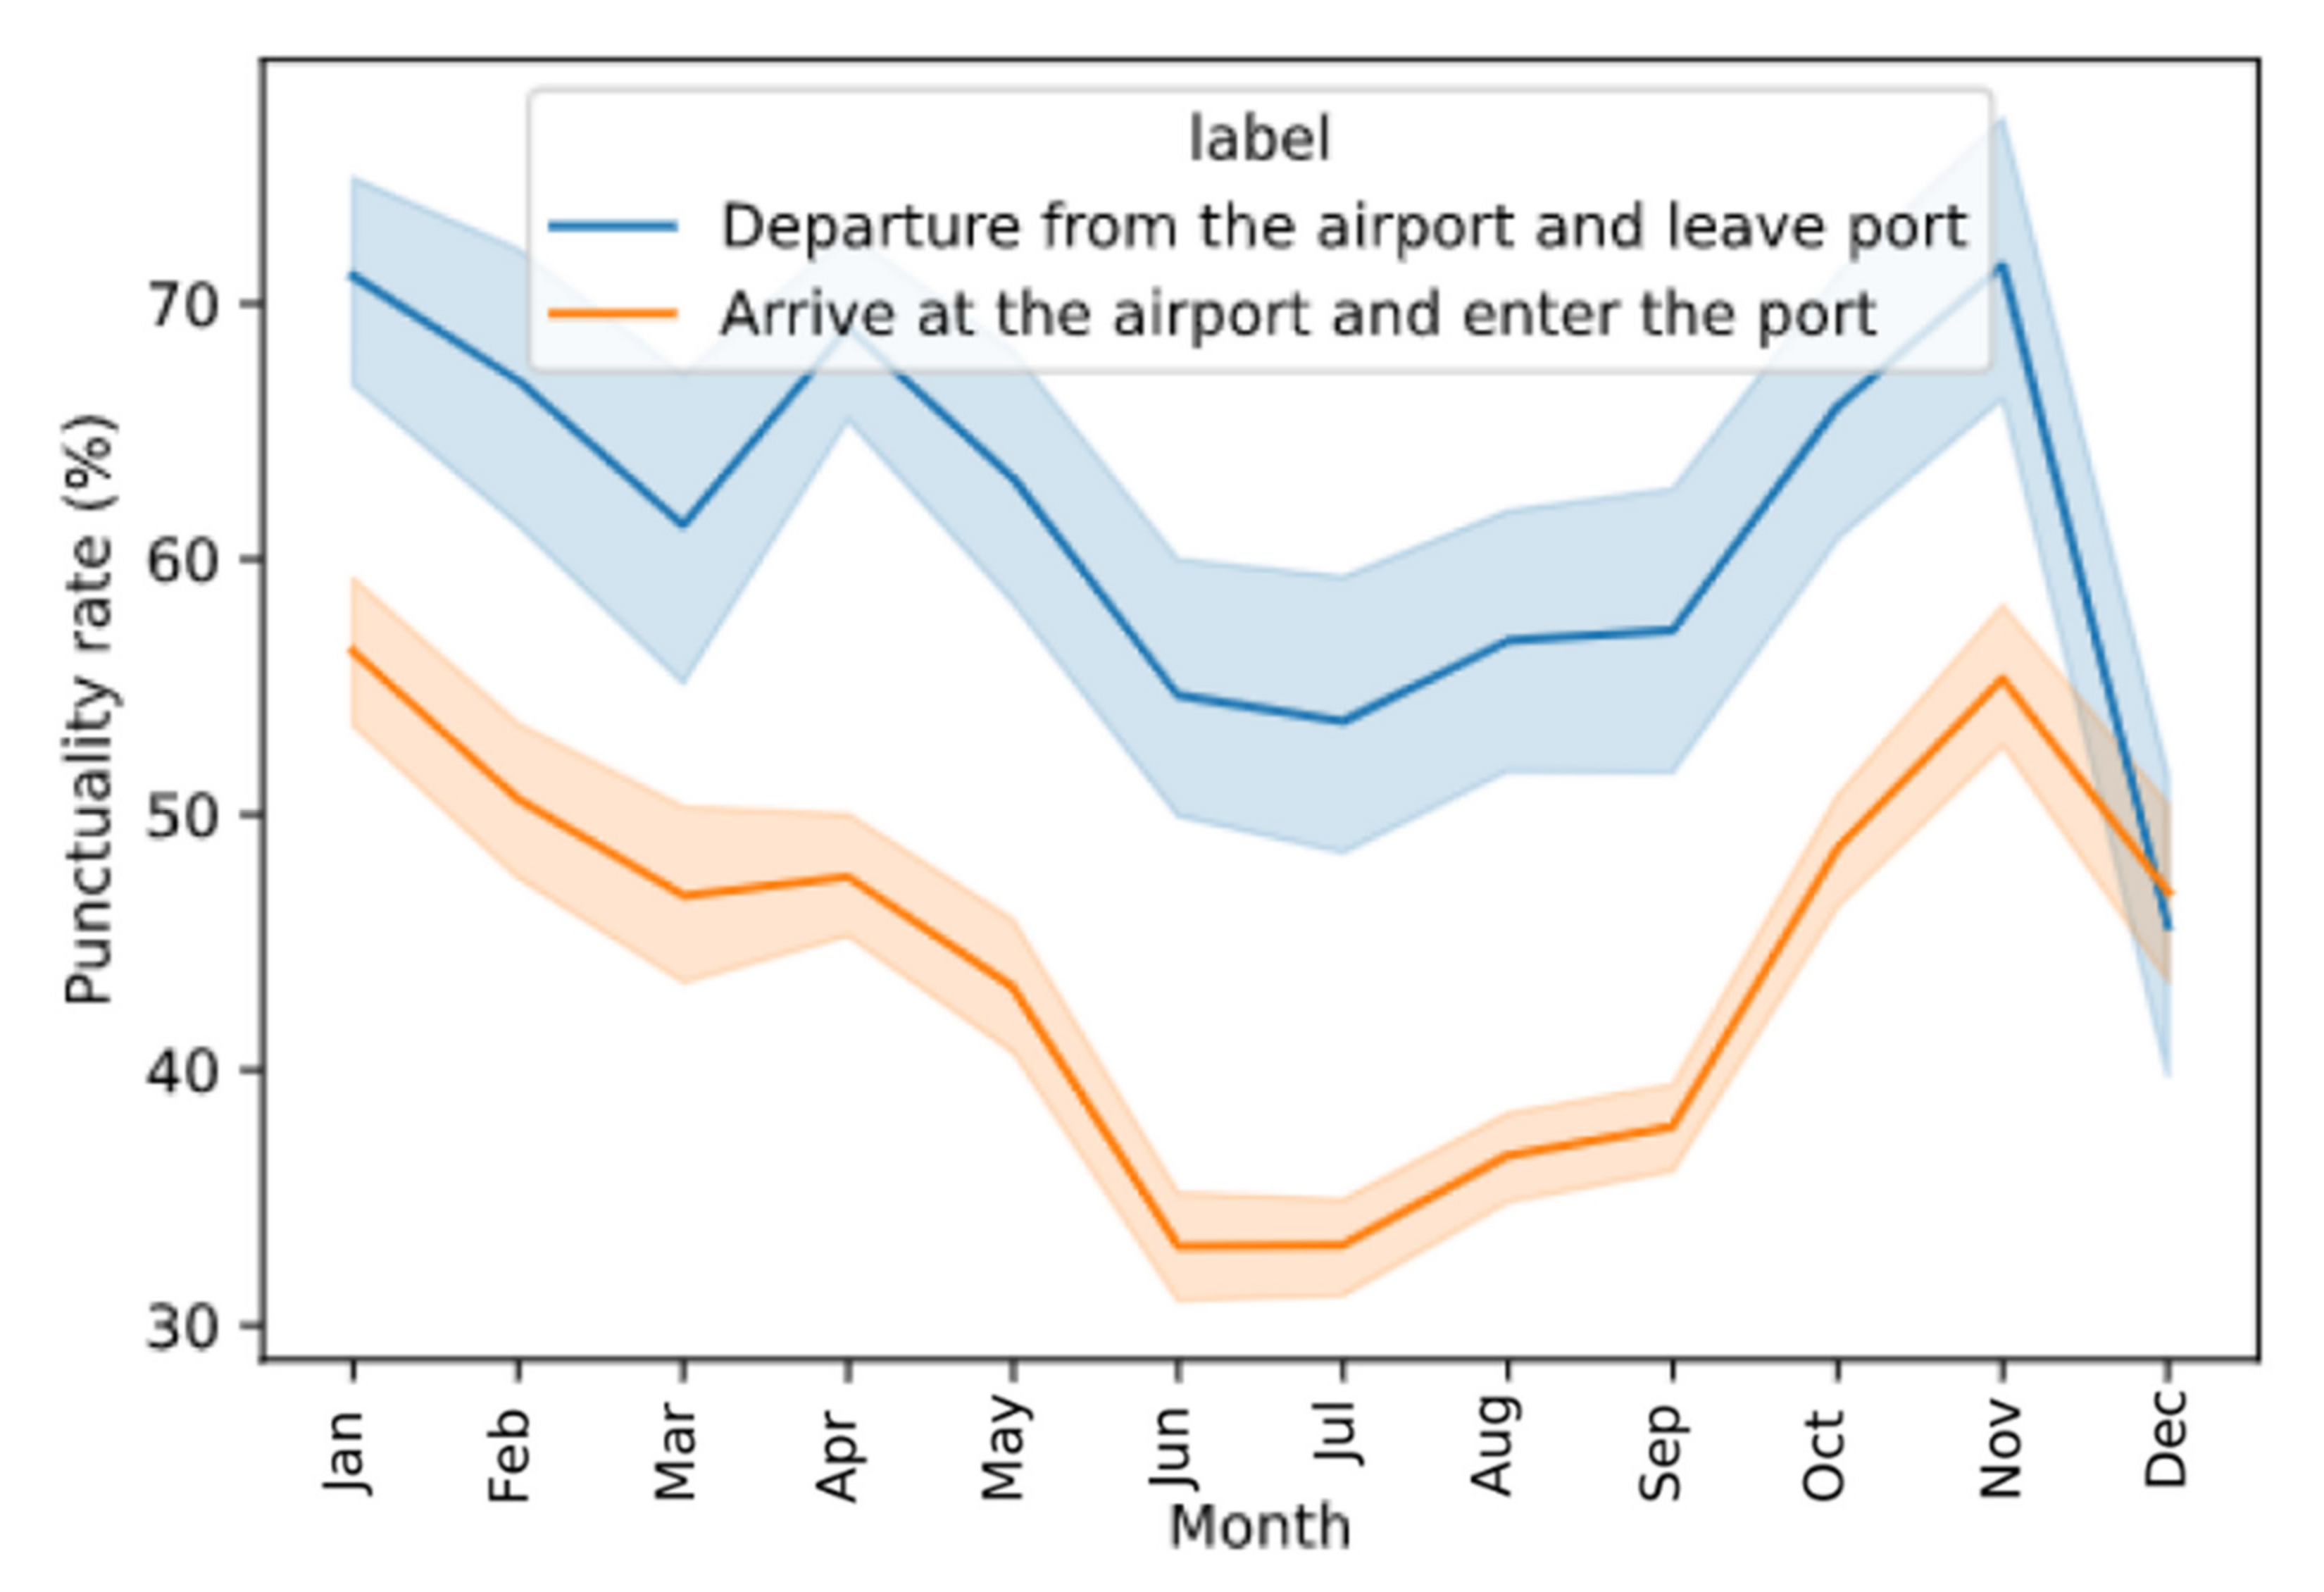
Figure 1 shows that the reason that the month was considered as a variable. In Figure 1, there are two lines for arrival and departure separately while the shading represents the standard deviation of data. It is noteworthy that the two solid bold lines (dark blue and dark orange) represent the average relative punctuality rates (%) in different months, which shows the average punctuality ratio of the flights in each month from 2018 to 2019. The flight punctuality rates in June, July and August appear to be significantly lower than in other months, meaning that there is a high average rate of delayed flights in the three months in which people normally take their summer vacations. This can be assumed that the number of flights during the summer is high so there is less spare time to reduce the effect of delay and one delayed flight can significantly affect other flights. The p-values are 5.14 × 10⁻¹¹ for departures and 8.23 × 10−65 for arrivals, which means that there is a relationship between the month and the flight punctuality rate because p-values are less than 0.05. Therefore, this study considers the month to be a significant variable.
4.1.2. Day of the Month
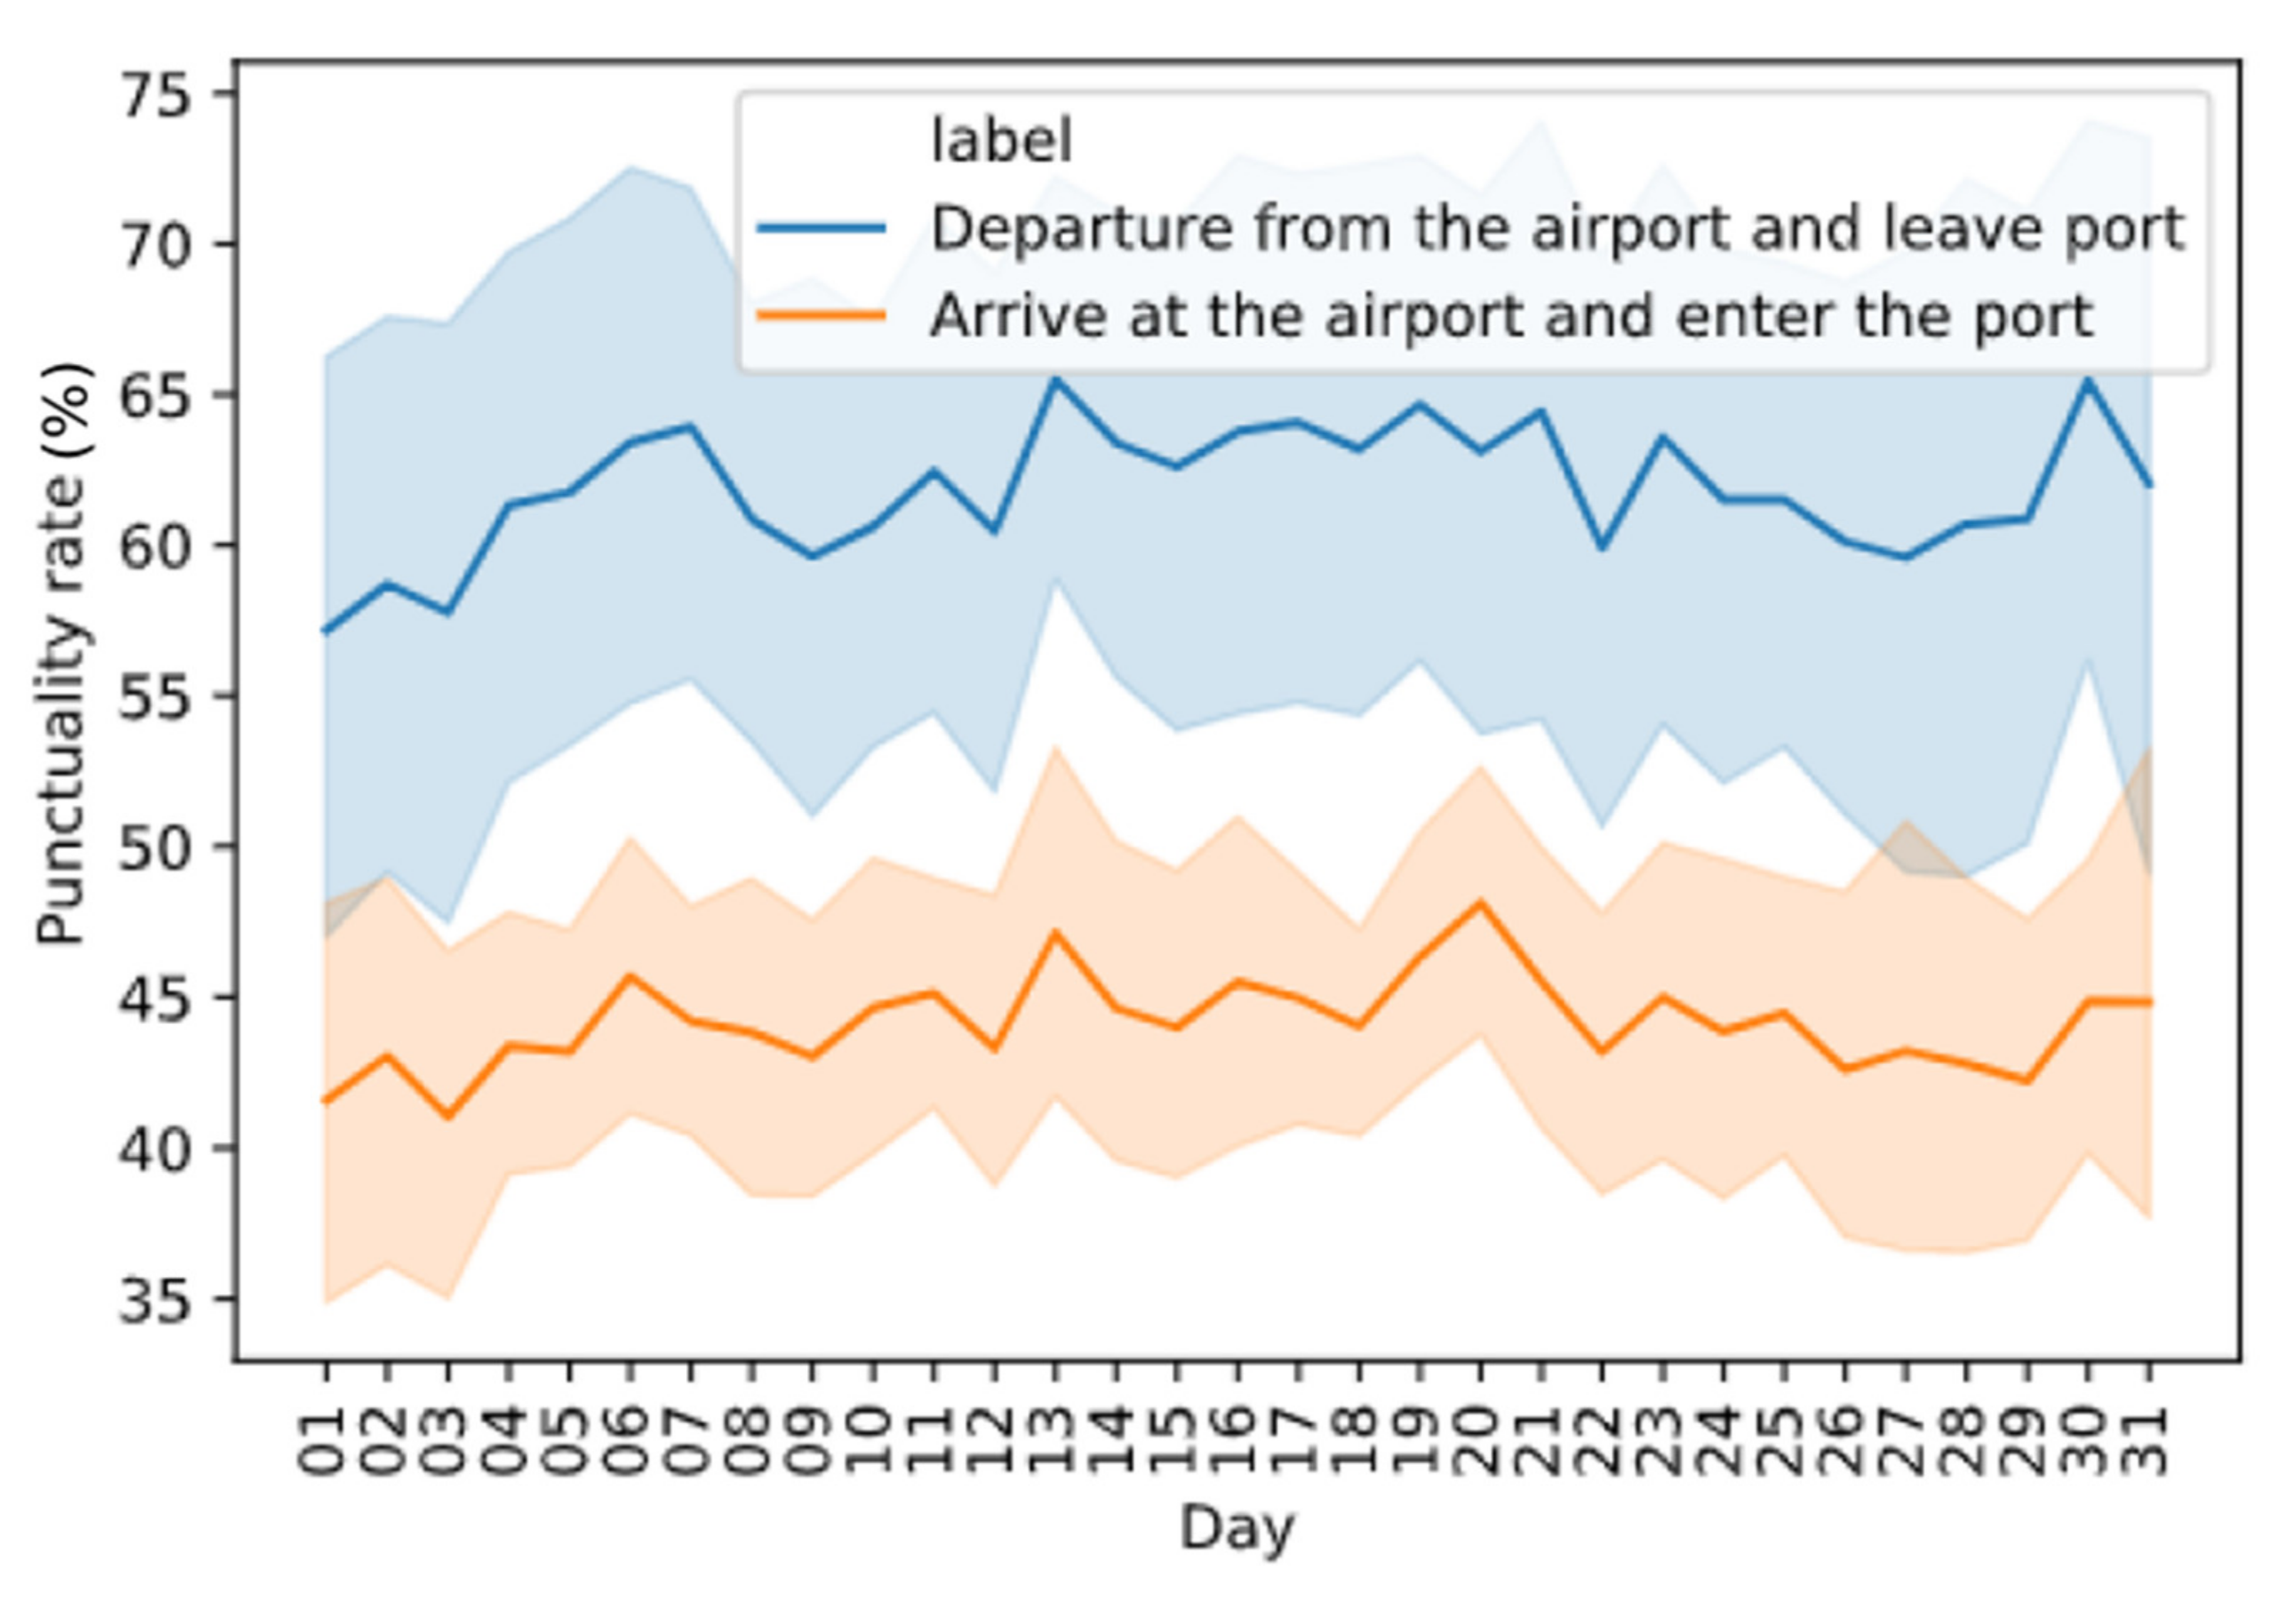
When building the hypotheses, it was predicted that the day of the month would affect the flight punctuality rate. Figure 2 shows the relationship between the day of the month factor and the flight punctuality rate from 2018 to 2019. It can be observed that the day of the month had little effect on flight punctuality, with no peak values shown. Moreover, the p-values of both arrival and departure punctualities were close to 1. There is little relationship between the day of the month variable and the punctuality rate. Therefore, this hypothesis can be rejected and this study does not consider the day of the month to be a significant variable.
4.1.3. Day of the Week
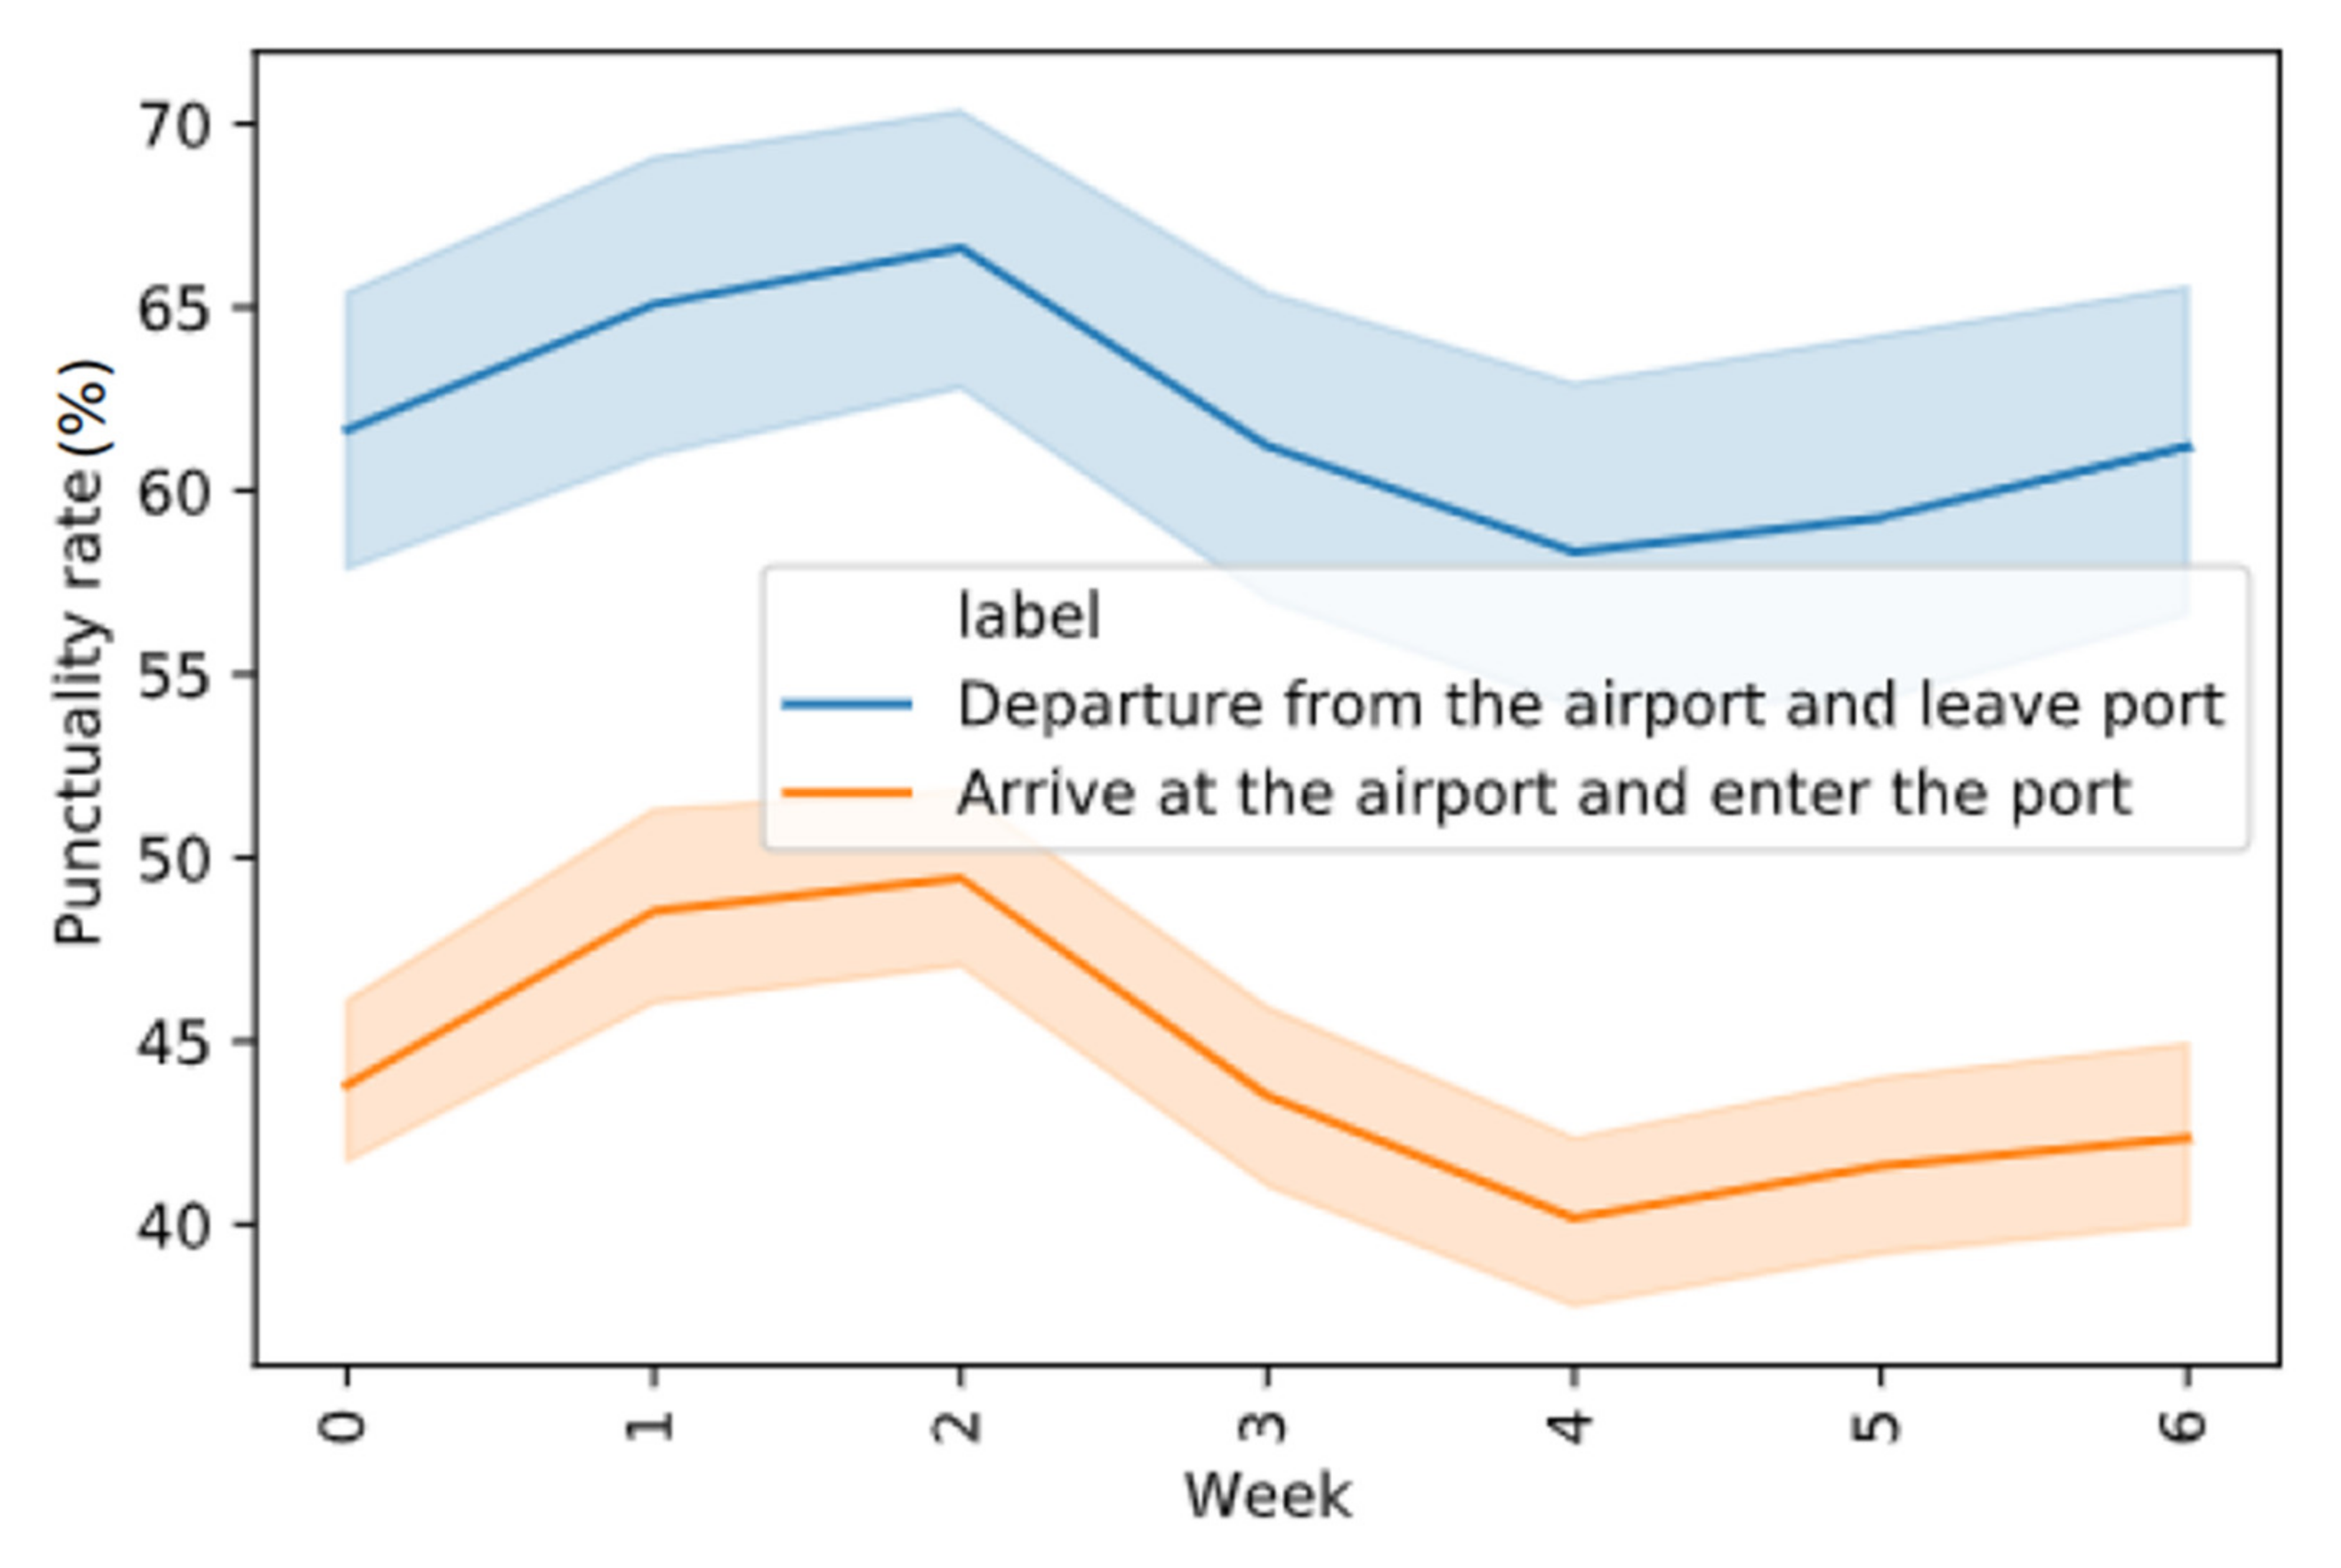
Figure 3 shows the ratio of the number of delayed flights to the number of nondelayed flights for the seven days of the week from 2018 to 2019 when 0 represents Sunday and 6 represents Saturday. It seems that the average delay rate was highest on a Thursday, with the low p-values obtained via ANOVA tests of 5.36 × 10⁻³ for departure and 1.13 × 10⁻⁵ for arrival. These values are lower than 0.05 so this study considers the day of the week to be a significant variable. From this, it can be assumed that Thursday has a peak demand of airport use when people may go on vacation. Therefore, the delay is high when compared to other days.
4.1.4. Number of Scheduled Flights
This study considers the number of scheduled flights to be a factor influencing flight punctuality. For example, the total number of flights, including both arrivals and departures, was 7146 in February 2017 and the number of delayed flights was 1659, so the punctuality rate was 23%. In July 2017, the total number of flights was 11,281 and the punctuality rate was 44%. The main reason for this is that more flights increase the probability that a delay occurs, which also increases the probability of delay propagation. The p-value for this variable is 1.54 × 10⁻⁴, which is lower than 0.05. This is obvious because when the number of flights increases that means the demand to use the airport is high which can create the delay. At the same time, that other flights can be affected by a delayed flight is more significant because there is less backup time to recover the delay.
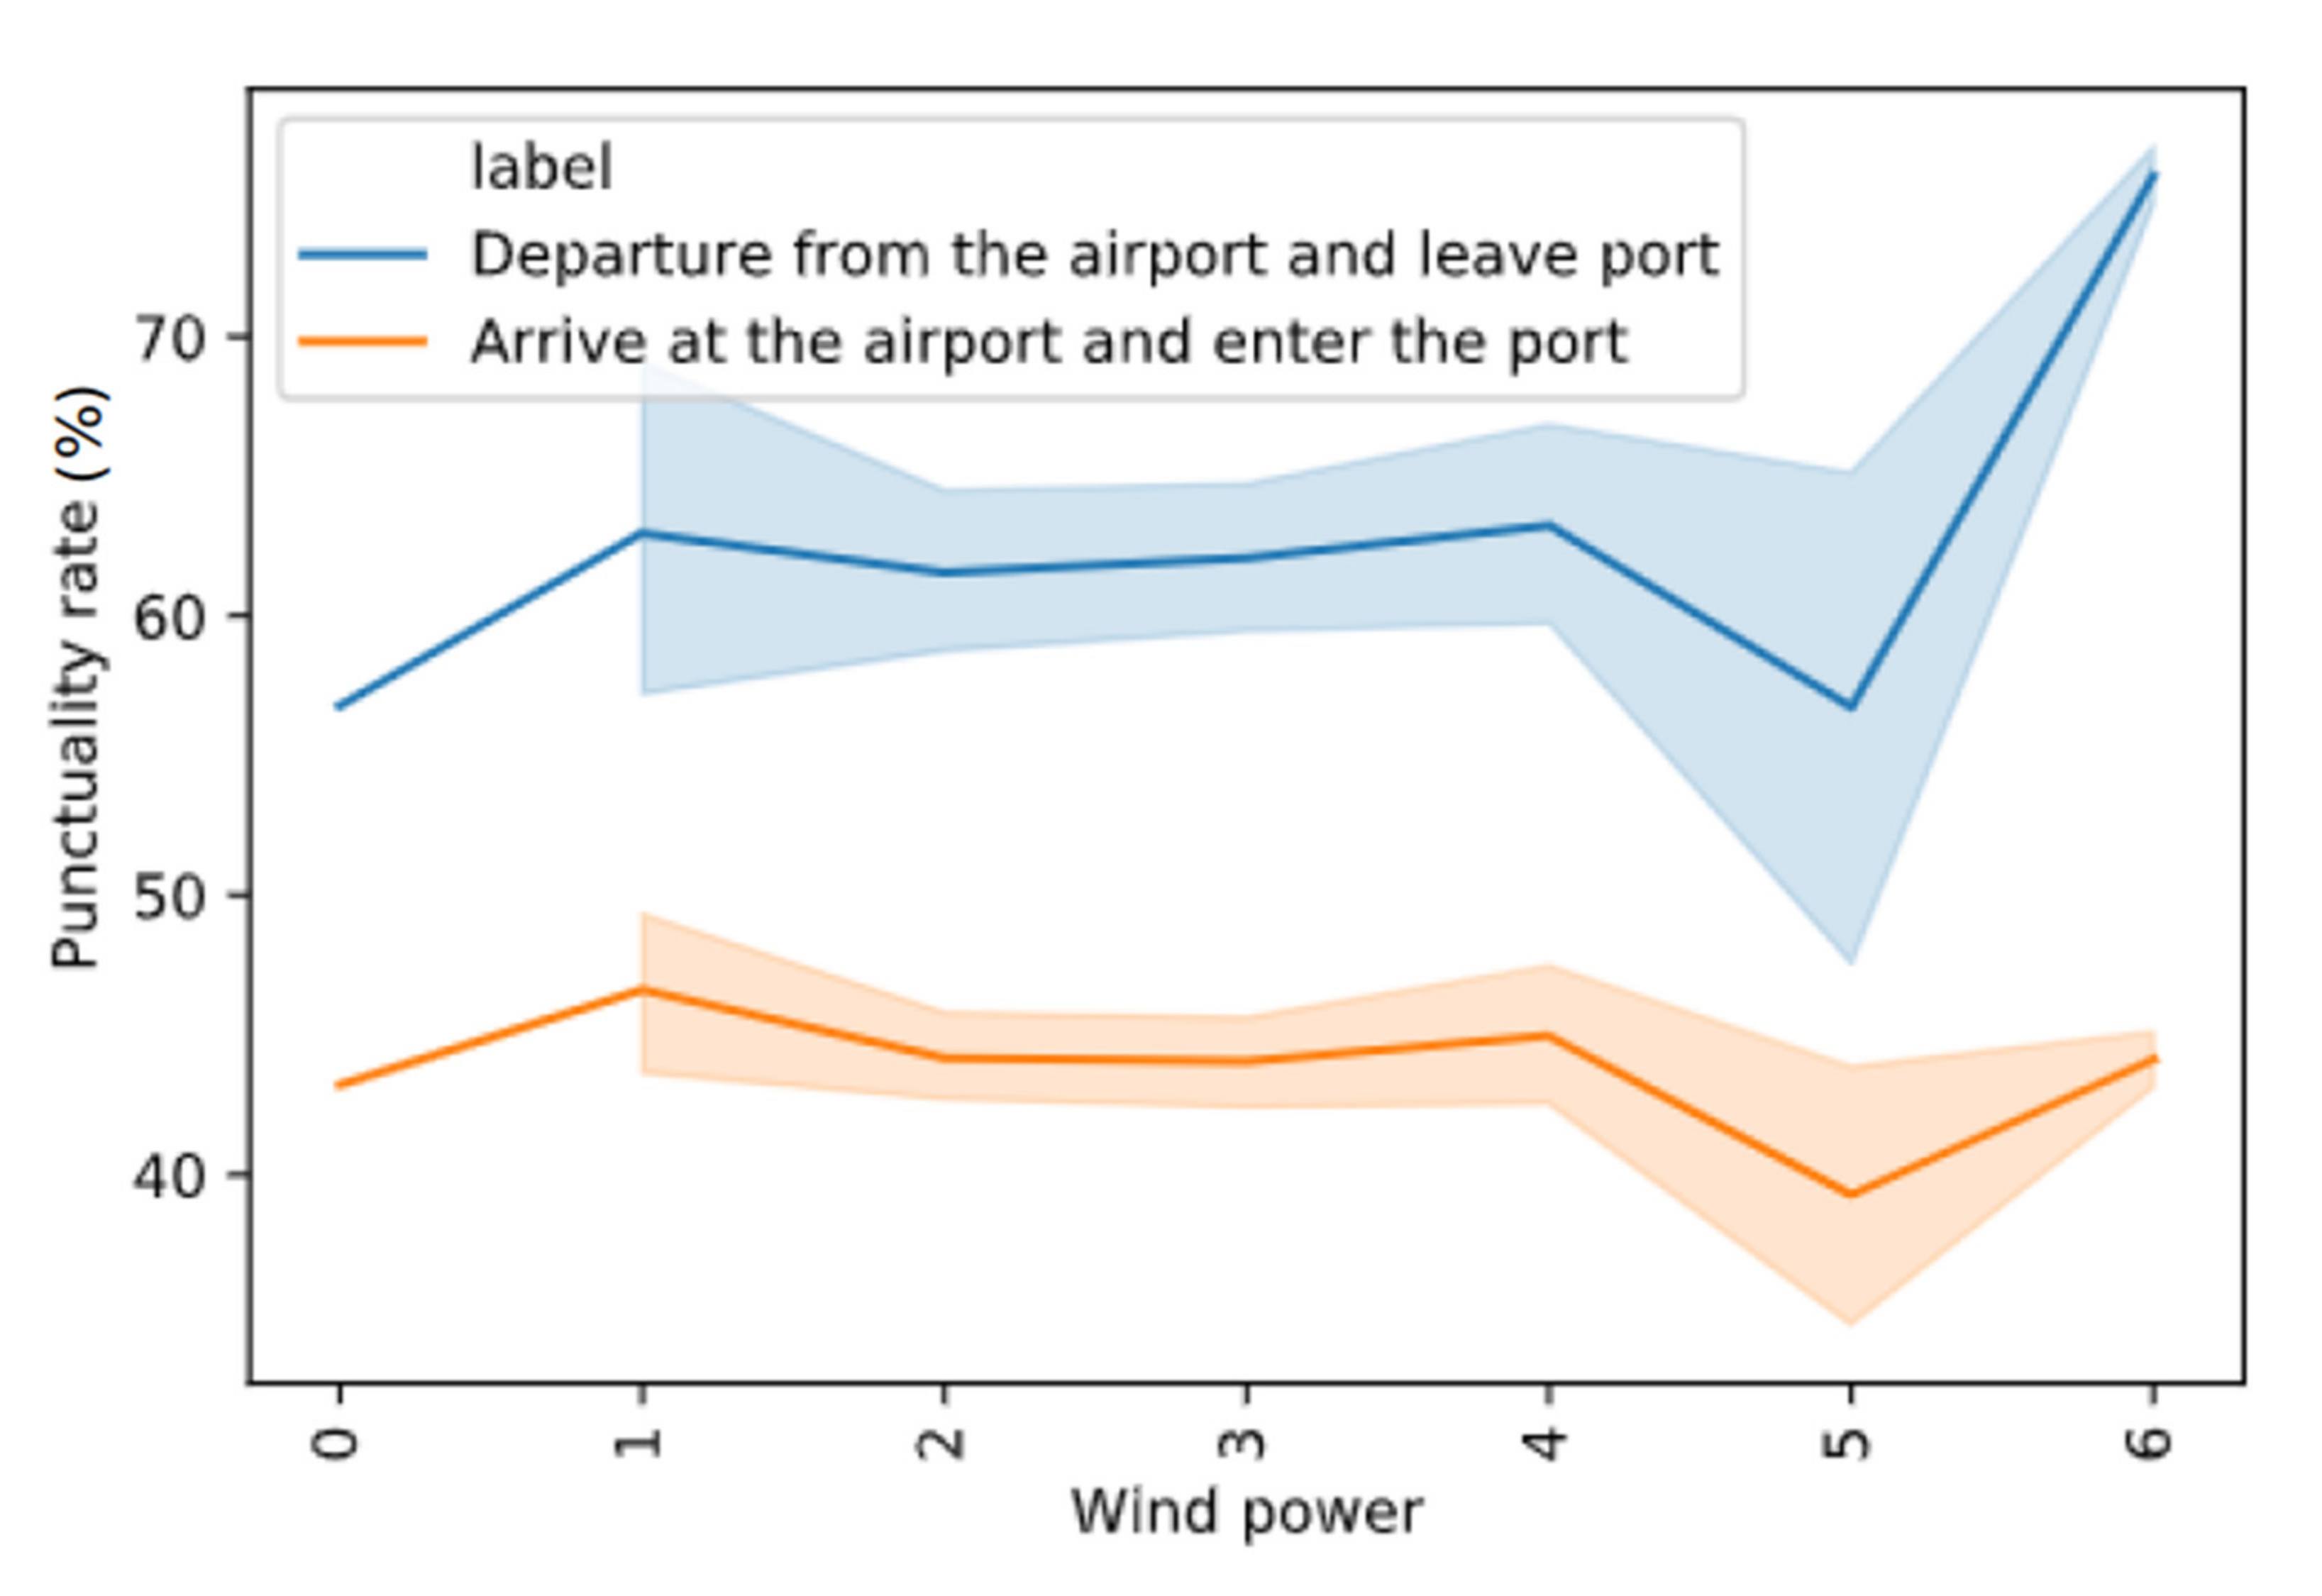
4.1.5. Weather Conditions
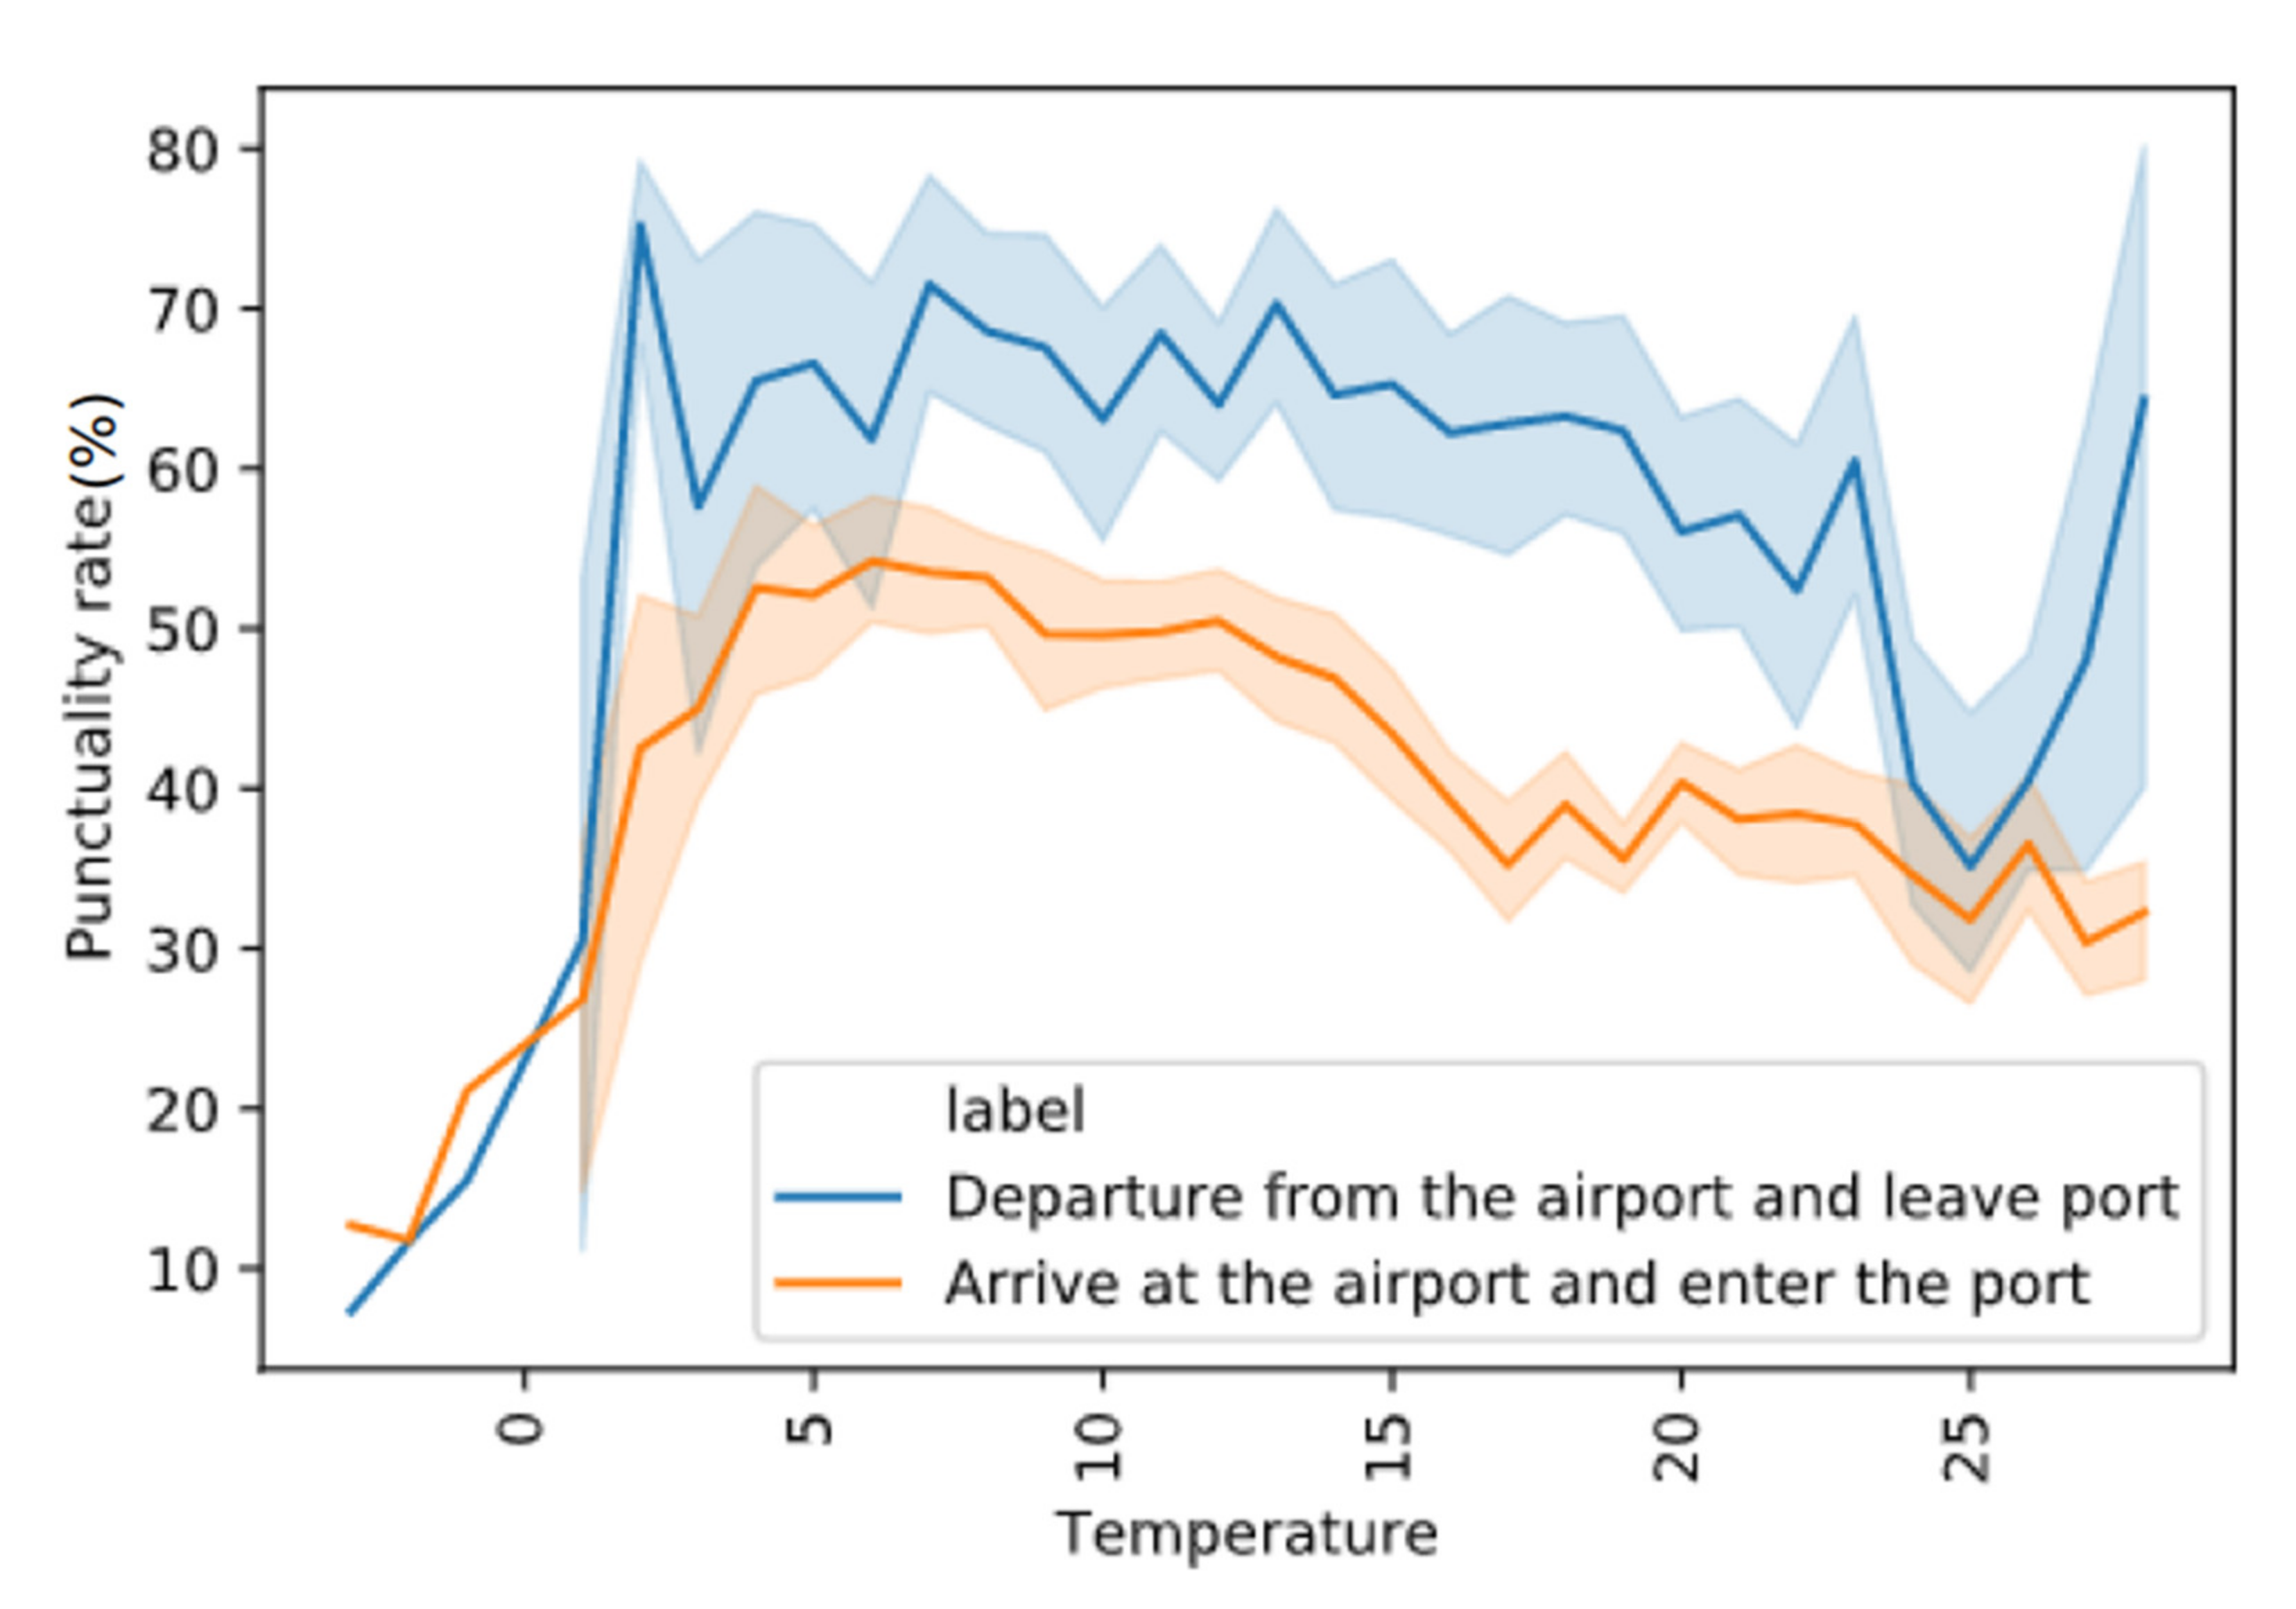
In order to increase the reliability of the forecasting model, this study also considers the weather conditions. After cleaning the data related to weather conditions, it was divided into three factors, which were the atmospheric conditions, temperature, and wind power. Figure 4, Figure 5 and Figure 6 show the relationships between the weather factors and the ratio of delayed flights to nondelayed flights from 2018 to 2019 at Birmingham Airport. Note: current limits (min, max) are based on the data range provided for prediction. From Figure 4, it can be seen that moderate snow shows a better punctuality rate than heavy snow. It can be assumed that the heavy snow can make the runway slippery. Therefore, flights sometimes cannot maintain their schedules due to safety issues. From Figure 5, it is clear that when the temperature is below 0, the punctuality rate significantly drops when compared to a warmer day. As previously, when the temperature is lower than 0, the runway can freeze and be slippery. Therefore, it can delay flights. The regularity between the weather and flight delay can be seen, so this study takes the atmospheric conditions as an investigation variable. The weather influence due to wind power is also relatively similar, as illustrated in Figure 6. The ANOVA results show that all of the p-values for the weather conditions are lower than 0.05 except for the weather for arrival at the airport, which is 1.36 × 10⁻¹, but the p-value for departure is 5.92 × 10⁻⁴. Combining with Figure 1 and Figure 3, this study considers weather conditions to be significant variables.
4.2. Predictive Model and Analysis
In this section, four models were used to predict the flight punctuality rate. The raw data was processed using the above summary, the ‘train_test_split’ function was used to achieve the random segmentation of the training set and the testing set. Of the random data, 80% was chosen as the training set and the remaining 20% of the data as the test set. The number of scheduled flights, temperature, wind power, meteorology, month of the year and day of the week were selected as the features and the punctuality rate as the objective variable. To evaluate the performance of models, the R2 and RMSE were used because the prediction was regression. These two indicators are the best indicators for regression problems. Results from the predictive models are shown in Table 2.
Table 2 shows the performance of the models by using RMSE and R2. The RF model performed well with the R2 of 0.8 and the RMSE was 14.90%. From the table, it can be seen that the RF model was the best model for predicting flight punctuality rate because the model provided the highest R2 and the lowest RMSE. For the ANN model, after model tuning, 1 hidden layer, 50 hidden nodes, and 39 features were used, using the one-hot vector. The dropout layer was used between the hidden layer and output layer with the value of 0.05, which meant that 5% of nodes were randomly deleted, to avoid overfitting. Compared with other models, the ANN model performed worst because the R2 was lowest and RMSE was the highest. The overall prediction performance was minimal. The RMSE was 22.53% and the R2 is 0.40. For the SVM and LR models, they performed slightly better than the ANN model, however, its performance was worse than the RF model and the LR model had a better performance than the SVM model. To evaluate the significances of features, LR was the most appropriate model to use because of its performance and interpretability. From the model development, the most impactful feature was snow. If there was snow on a day, the punctuality of that day tended to be low according to the weight with the highest negative number. Therefore, flight management during the winter needs to be done carefully to minimise the delay.
After comparing the four models, it was found that the RF model performed better than the other developed models. Although there is no absolute best model in every situation, it can be concluded that the RF model is more suitable for flight punctuality prediction. This is because flight punctuality depends on many parameters, such as time-related parameters and weather parameters. The voting system which is the important characteristic of the RF model can significantly improve the accuracy of the prediction in this case. Compared to other studies, Sridhar et al. [23] developed models and could predict flight delay where R equalled to 0.79 or R2 equalled to 0.62. This study can improve the performance of predictive models for flight punctuality which will be beneficial for the air transport industry.
5. Recommendations
The developed model can be used to predict flight punctuality based on the accurate dataset of the above six variables. The reasons for flight delays are complex, so the reliability of the RF model still has room for improvement. In future studies, it is recommended that the researchers increase the number of features, such as aircraft capacity, flight type, traffic control data, and public holidays. They should also enhance the size of the data sample by adding flight data from previous years or data from other airports in order to improve prediction accuracy.
From the above discussion, there is a relationship between flight punctuality and the number of scheduled flights. This study recommends that the Birmingham government should consider increasing investment in the development of the airport and set strategic goals to create a smart airport to support the development of a smart city. Tourism Economics [24] forecasts that the number of trips per person is predicted to increase by 3.6% per year in Europe, and in developing countries such as China and India, the trip frequency is likely to grow much more quickly by about 10–11%. That means that the flight demand will increase every year and airports will have large market potential [25,26,27].
The purpose of building the prediction regression models is to give a reference for flight punctuality to Birmingham Airport. The UK Civil Aviation Authority [2] identifies that the number of complaints related to flight punctuality accounts for over 50% of the total complaints. In order to increase customer satisfaction, airlines need to provide information about delay percentages, adjusting the price accordingly. Passengers could choose a cheaper flight with a higher historical delay ratio or could choose to pay more to fly on a route with a better on-time performance. From an economic point of view, if the profit of airlines increases at a higher rate than increased operational costs then this will enhance the efficiency of the airline. Airlines could also consider cooperating with insurance companies, adding a choice of getting flight delay insurance. If a flight is delayed, customers would get compensation but if the flight departs on time, the airline and the insurance company would get extra profit.
In addition, developing predictive models can be integrated with big data technology. By integrating, more data is collected and used to enhance the performance of predictive models. If the data are big enough, the accuracy of the prediction tends to be increased. The models can be used to do the sensitivity analysis to investigate the effects of each feature on the punctuality rate. Influential features can be detected and used to evaluate the reliability of the service. This can be used to rearrange the flight schedule to optimize the overall flight punctuality and make the airport a data-driven organisation.
6. Conclusions
This study focused on the analysis of flight punctuality and researching how the prediction of flight delays could have great significance in improving the operational efficiency of Birmingham Airport, as well as enhancing the reputation of airlines and decreasing the costs of operation. This research was divided into two parts, as shown below.
Firstly, the correlation between each hypothetical influence factor and flight punctuality was investigated in advance to determine the characteristics. Seven independent variables were evaluated in the hypotheses, with the results based on p-values and the trends of linear graphs. All of the independent variables demonstrate a significant relationship with the flight punctuality rate except the day of the month, meaning that the p-values of the other six variables were lower than 0.05. Therefore, this study took the number of scheduled flights, temperature, wind power, meteorology, month, and day of the week as observation variables and built models to predict flight punctuality.
Secondly, after analysing and processing the datasets, 80% of the original data was selected as the training set, with the remaining 20% of the dataset chosen as the testing set. The six variables discussed above were used as the features and the historical data of flight punctuality was used as the object variable to build the RF, ANN, SVM, and LR models. After comparing the RMSE and R2, it was concluded that the prediction performance of the RF was the best for assessing the punctuality rate of flights at Birmingham Airport.
Author Contributions
Conceptualisation, S.K.; methodology, Y.X.; software, Y.X.; validation, Y.X. and J.S.; formal analysis, Y.X.; investigation, Y.X.; resources, Y.X.; data curation, Y.X.; writing—original draft preparation, J.S.; writing—review and editing, J.S.; visualisation, Y.X.; supervision, S.K.; project administration, S.K.; funding acquisition, S.K. All authors have read and agreed to the published version of the manuscript.
Funding
This research was funded by European Commission, grant number 691135.
Institutional Review Board Statement
Not applicable.
Informed Consent Statement
Not applicable.
Data Availability Statement
The data presented in this study are available on request from the corresponding author. The data are not publicly available due to a research issue.
Acknowledgments
The authors also wish to thank the European Commission for the financial sponsorship of the H2020-RISE Project no.691135 “RISEN: Rail Infrastructure Systems Engineering Network”, which enables a global research network that addresses the grand challenge of railway infrastructure resilience and advanced sensing in extreme environments (www.risen2rail.eu, 22 April 2020).
Conflicts of Interest
The authors declare no conflict of interest.
References
- Meng, F.; Liu, G.; Yang, Z.; Hao, Y.; Ulgiati, S. Assessment of Urban Transportation Metabolism from Life Cycle Perspective: A Multi-method Study. Energy Procedia 2016, 88, 243–249. [Google Scholar] [CrossRef] [Green Version]
- Civil Aviation Authority. Survey Reports; Civil Aviation Authority: London, UK, 2019.
- Skiena, S.S. The Algorithm Design Manual; Springer Science & Business Media: Berlin/Heidelberg, Germany, 1998; Volume 1. [Google Scholar]
- Shalev-Shwartz, S.; Ben-David, S. Understanding Machine Learning: From Theory to Algorithms; Cambridge University Press: Cambridge, UK, 2014. [Google Scholar]
- Diana, T. Can machines learn how to forecast taxi-out time? A comparison of predictive models applied to the case of Seattle/Tacoma International Airport. Transp. Res. E Logist. Transp. Rev. 2018, 119, 149–164. [Google Scholar] [CrossRef]
- Pedregosa, F.; Varoquaux, G.; Gramfort, A.; Michel, V.; Thirion, B.; Grisel, O.; Blondel, M.; Prettenhofer, P.; Weiss, R.; Dubourget, V.; et al. Scikit-learn: Machine Learning in Python. JMLR 2011, 12, 2825–2830. [Google Scholar]
- Sternberg, A.; Soares, J.; Carvalho, D.; Ogasawara, E. A review on flight delay prediction. arXiv preprint 2017, arXiv:1703.06118. [Google Scholar]
- Rebollo, J.J.; Balakrishnan, H. Characterization and prediction of air traffic delays. Transp. Res. Part C Emerg. Technol. 2014, 44, 231–241. [Google Scholar] [CrossRef]
- Thiagarajan, B.; Srinivasan, L.; Sharma, A.V.; Sreekanthan, D.; Vijayaraghavan, V. A machine learning approach for prediction of on-time performance of flights. In Proceedings of the 2017 IEEE/AIAA 36th Digital Avionics Systems Conference (DASC), St. Petersburg, FL, USA, 17–21 September 2017. [Google Scholar]
- Yu, B.; Guo, Z.; Asian, S.; Wang, H.; Chen, G. Flight delay prediction for commercial air transport: A deep learning approach. Transp. Res. E Logist. Transp. Rev. 2019, 125, 203–221. [Google Scholar] [CrossRef]
- Shumsky, R.A. Dynamic Statistical Models for the Prediction of Aircraft Take-Off Times. Ph.D. Thesis, Massachusetts Institute of Technology, Cambridge, MA, USA, 1995. [Google Scholar]
- Kim, Y.J.; Choi, S.; Briceno, S.; Mavris, D. A deep learning approach to flight delay prediction. In Proceedings of the 2016 IEEE/AIAA 35th Digital Avionics Systems Conference (DASC), Sacramento, CA, USA, 25–29 September 2016; pp. 1–6. [Google Scholar]
- Belcastro, L.; Marozzo, F.; Talia, D.; Trunfio, P. Using scalable data mining for predicting flight delays. ACM Trans. Intell. Syst. Technol. 2016, 8, 1–20. [Google Scholar] [CrossRef]
- Canhoto, A.I.; Clear, F. Artificial intelligence and machine learning as business tools: A framework for diagnosing value destruction potential. Bus. Horiz. 2019, 2, 183–193. [Google Scholar] [CrossRef]
- Breiman, L.; Friedman, J.; Olshen, R.; Stone, C. Résumé L’ajustement des différentes mesures électrofaibles dans le cadre du Modele Standard privilégie un boson de Higgs de faible masse égalea Mh. In Classification and Regression Trees; Taylor & Francis: Boca Raton, FL, USA, 1984; Volume 90, pp. 27–36. [Google Scholar]
- Fernández-Delgado, M.; Cernadas, E.; Barro, S.; Amorim, D. Do we need hundreds of classifiers to solve real world classification problems? J. Mach. Learn. Res. 2014, 15, 3133–3181. [Google Scholar]
- Lee, H.; Malik, W.; Jung, Y.C. Taxi-out time prediction for departures at Charlotte airport using machine learning techniques. In Proceedings of the 16th AIAA Aviation Technology, Integration, and Operations Conference, Washington, DC, USA, 13–17 June 2016; p. 3910. [Google Scholar]
- Xu, N.; Sherry, L.; Laskey, K.B. Multifactor model for predicting delays at US airports. Transp. Res. Rec. 2008, 2052, 62–71. [Google Scholar] [CrossRef] [Green Version]
- El-Din, M.; Farag, M.; Abouzeid, A. Airline passenger forecasting in Egypt (domestic and international). Int. J. Comput. Appl 2017, 165, 1–5. [Google Scholar]
- Manohar, D.; Reddy, D.M.; Sumalatha, V. Air Traffic Forecasting Using Artificial Neural Networks. IJSTR 2019, 8, 556–559. [Google Scholar]
- VariFlight. Living on Time. Available online: http://www.variflight.com/en/ (accessed on 1 June 2020).
- Guowaitianqi. Birmingham Historical Weather. Available online: https://www.guowaitianqi.com/h/birmingham.html (accessed on 3 November 2019).
- Sridhar, B.; Wang, Y.; Klein, A.; Jehlen, R. Modeling flight delays and cancellations at the national, regional and airport levels in the United States. In Proceedings of the 8th USA/Europe ATM R&D Seminar, Napa, CA, USA, 29 June–2 July 2009. [Google Scholar]
- Tourism Economics. Air Passenger Forecasts. Available online: https://www.tourismeconomics.com/travel-data-forecasts/air-passenger-forecasts/ (accessed on 1 June 2020).
- Karnauskas, B.; DonnelLy, J.P.; Barkly, H.C.; Martin, J.E. Coupling between air travel and climate. Nat. Clim. Chang. 2015, 5, 1068–1073. [Google Scholar] [CrossRef]
- Zhou, Y.; Zhang, N.; Li, C.; Liu, Y.; Huang, P. Decreased takeoff performance of aircraft due to climate change. Clim. Chang. 2018, 151, 463–472. [Google Scholar] [CrossRef]
- Kaewunruen, S.; Sussman, J.M.; Matsumoto, A. Grand Challenges in Transportation and Transit Systems. Front. Built Environ. 2016, 2, 4. [Google Scholar] [CrossRef] [Green Version]
Figure 1.
The average punctuality rate of every month of year.

Figure 2.
The average punctuality rate of every day of month.

Figure 3.
The average punctuality rate of every day of week.

Figure 4.
The average punctuality rate of different weather conditions.

Figure 5.
The average punctuality rate of different temperature.

Figure 6.
The average punctuality rate of different wind powers.


Table 1.
Description of variables.
| Variable | Description |
|---|---|
| Dependent Variable | |
| Punctuality rate | Actual flight punctuality rate at Birmingham Airport |
| Independent Variables | |
| Number of scheduled flights | The number of scheduled flights to pass through Birmingham Airport every day, including both departures and arrivals. |
| Temperature | The average temperature in the city of Birmingham every day, ranging from −3 to 28 °C. |
| Wind power | The average wind speed in the city of Birmingham every day, with the wind level ranging from 0 to 6. |
| Meteorology | Meteorological conditions in the city of Birmingham, including extraordinary storms, rainstorms, heavy downpours, heavy rain, light snow, moderate rain, moderate snow, overcast and rainy, sunny, cloudy, heavy snow, light rain, and blizzard based on the weather data. |
| Month | The hypothesis is that the month is a factor affecting the flight punctuality rate. |
| Day of the week | The hypothesis is that the day of the week is a factor affecting the flight punctuality rate. |
| Day of the month | The hypothesis is that the day of the month is a factor affecting the flight punctuality rate. |
Table 2.
Performance of each predictive model.
| Models | R2 | RMSE (%) |
|---|---|---|
| Random forest (RF) | 0.80 | 14.90 |
| Artificial neural network (ANN) | 0.40 | 22.53 |
| Support vector machine (SVM) | 0.56 | 16.54 |
| Linear regression (LR) | 0.60 | 15.65 |
Publisher’s Note: MDPI stays neutral with regard to jurisdictional claims in published maps and institutional affiliations. |
© 2021 by the authors. Licensee MDPI, Basel, Switzerland. This article is an open access article distributed under the terms and conditions of the Creative Commons Attribution (CC BY) license (https://creativecommons.org/licenses/by/4.0/).
Share and Cite
MDPI and ACS Style
Kaewunruen, S.; Sresakoolchai, J.; Xiang, Y. Identification of Weather Influences on Flight Punctuality Using Machine Learning Approach. Climate 2021, 9, 127. https://0-doi-org.brum.beds.ac.uk/10.3390/cli9080127
AMA Style
Kaewunruen S, Sresakoolchai J, Xiang Y. Identification of Weather Influences on Flight Punctuality Using Machine Learning Approach. Climate. 2021; 9(8):127. https://0-doi-org.brum.beds.ac.uk/10.3390/cli9080127
Chicago/Turabian StyleKaewunruen, Sakdirat, Jessada Sresakoolchai, and Yue Xiang. 2021. "Identification of Weather Influences on Flight Punctuality Using Machine Learning Approach" Climate 9, no. 8: 127. https://0-doi-org.brum.beds.ac.uk/10.3390/cli9080127
Note that from the first issue of 2016, this journal uses article numbers instead of page numbers. See further details here.