Application of AFM-Based Techniques in Studies of Corrosion and Corrosion Inhibition of Metallic Alloys


Department of Materials and Ceramic Engineering, CICECO—Aveiro Institute of Materials, University of Aveiro, Campus of Santiago, 3810-193 Aveiro, Portugal
Corros. Mater. Degrad. 2020, 1(3), 345-372; https://0-doi-org.brum.beds.ac.uk/10.3390/cmd1030017
Submission received: 7 October 2020
/
Revised: 30 October 2020
/
Accepted: 5 November 2020
/
Published: 7 November 2020
Abstract
:In this review several scanning probe microscopy techniques are briefly discussed as valuable assets for corrosionists to study corrosion susceptibility and inhibition of metals and alloys at sub-micrometer resolution. At the beginning, the review provides the reader with background of atomic force microscopy (AFM) and related techniques such as scanning Kelvin probe force microscopy (SKPFM) and electrochemical AFM (EC-AFM). Afterwards, the review presents the current state of corrosion research and specific applications of the techniques in studying important metallic materials for the aircraft and automotive industries. Different corrosion mechanisms of metallic materials are addressed emphasizing the role of intermetallic inclusions, grain boundaries, and impurities as focal points for corrosion initiation and development. The presented information demonstrates the importance of localized studies using AFM-based techniques in understanding corrosion mechanisms of metallic materials and developing efficient means of corrosion prevention.
1. Introduction
Corrosion of metallic materials and structures is a heavy burden for the economy which costs about 3.4% of the global GDP (2013) according to the Application and Economics of Corrosion Technology (IMPACT) study released by NACE International [1]. The study also acknowledged that corrosion prevention strategies could increase global savings by about 15–35% of the cost of the damage (NACE International, Houston, TX, USA, 2016). Exposure of metallic materials to corrosive environments is the main cause of corrosion. Earth’s natural oceanic waters and atmospheric moisture containing man-generated pollutants such as oxides of carbon, oxides of nitrogen, oxides of sulfur are the most typical corrosive environments [2]. Therefore, metallic structures such as ships, naval platforms, vehicles, airplanes, etc. operated in such environments suffer from corrosion attack. Corrosion monitoring and prevention are especially important for the transportation sector. Vehicles may be operated in a wide variety of environments favoring corrosion development which often leads to failure of critical structural parts. Strong safety concerns arise when corrosion impairs a critical component. Therefore predicting and understanding corrosion and building efficient corrosion protection strategies are extremely important for engineers and scientists.
Corrosion is the destructive attack of a material by reaction with its environment [3]. Electrochemical and chemical reactions contribute to the degradation of metals. The susceptibility of metals to corrosion depends on the nobility of the metals, the environment, the temperature, the pH of the aqueous solution, the presence of passive layers, and the possible electrochemical reactions occurring in the environment [2]. Thermodynamic data allows prediction of the equilibrium state of a system and theoretical corrosion susceptibility of metals which can be easily visualized on Eh-pH diagrams [4]. By following the oxidative–reduction potential and pH on the diagrams one can predict the occurrence of corrosion, passivity, and immunity of metals to corrosion. The kinetic characteristic such as exchange current at equilibrium defines the rate of degradation of a metal in an environment.
There are many forms of corrosion and various factors leading to different forms of corrosion such as the composition of metallic materials, environment, mechanical stress, geometry, temperature, and time [3]. General (uniform) corrosion is the case in which all the metal surface is subjected to corrosion. Galvanic corrosion typically occurs in an aqueous environment when dissimilar metals, having different nobility, are electrically connected. The material with more noble electrode potential becomes the cathode and the material with the less noble potential becomes the anode and is dissolved. Localized corrosion is a collective term of several major corrosion cases. These cases are as follows: pitting corrosion, crevice corrosion, stress corrosion cracking, exfoliation corrosion, filiform corrosion, intergranular corrosion. Localized corrosion is typically concentrated in several spots on the metal surface, unlike the case of general corrosion where the entire surface is active.
Metallic structures are typically made of alloys because pure metals possess poor mechanical properties, an example is a pure aluminum and its alloys [5]. Amongst engineering metallic alloys one can mention ferrous alloys, aluminum alloys, titanium alloys, nickel alloys. However, energy-saving directives [6] are promoting the race for new metallic materials. In this perspective magnesium alloys stand out as lucrative lightweight materials. Light alloys found their application as structural and functional materials in aerospace, automotive industries, and biomedicine [7,8].
Metallic alloys are engineered in such a way as to improve mechanical properties by alloying the main metal with other elements. In some circumstances the alloying improves corrosion susceptibility as well. For example, stainless steel uses the alloying elements of chromium, nickel, and molybdenum which can result in the formation of a stable oxide layer on the top surface, which protects the bottom metal from corrosion and prevents pitting corrosion [9]. In other situations, the alloying may increase the corrosion susceptibility of an alloy. A typical aerospace aluminum alloy such as AA2024 contains copper as the main alloying element. It has a much higher corrosion rate than pure aluminum due to the adverse effects of copper-containing intermetallics which induce high susceptibility to localized corrosion [10,11,12,13].
The automotive and aerospace sectors actively utilize engineered materials such as aluminum alloys, magnesium alloys, and zinc galvanized steel. Intermetallic phases existing in alloys normally have higher corrosion potential when they contain more noble elements compared with the base metal, for instance, Al3Fe, Al2Cu, Al7Cu2Fe in aluminum alloys [14,15,16,17]. A similar observation is made for intermetallics e.g., Mg17Al12, η-Al8Mn5 found in magnesium alloys [18]. Electron microscopy investigations help to elucidate localized corrosion events associated with intermetallics in the depth of the metallic matrix [14,15]. General electrochemical techniques such as electrochemical impedance spectroscopy (EIS) and DC-polarization are commonly employed to reveal interfacial characteristics and corrosion kinetics of different metallic phases and alloys [19,20,21]. However, general electrochemical measurements offer limited information coming only from the macroscopic surface. Although a deeper understanding of the mechanism of corrosion below macro-scale can be obtained using the scanning vibrating electrode technique (SVET), scanning electrochemical microscopy (SECM), the scanning Kelvin probe (SKP), a more local analysis is often needed to investigate at the level comparable with the size of intermetallics. In situ measurements using atomic force microscopy (AFM) and related methods help to elucidate various phenomena at microscale with sufficient resolution to observe surface changes even at the atomic scale. AFM-based methods are complementary to common methods of analysis such as electron microscopy and general corrosion investigation methods [22].
This review aims to provide an overview of the state of the art in applications of atomic force microscopy-based techniques for corrosion investigation of different metals and alloys. The first part of this review briefly addresses the principles of AFM, and AFM-based techniques such as scanning Kelvin probe force microscopy (SKPFM) and electrochemical AFM (EC-AFM). The next sections present relevant knowledge emphasizing how the above techniques are used for studying localized corrosion phenomena, the properties of the interfaces, and the surface evolution of metals and alloys. Various examples and approaches are presented. The review ends with concluding remarks.
2. Principles of Main AFM Based Techniques
2.1. AFM
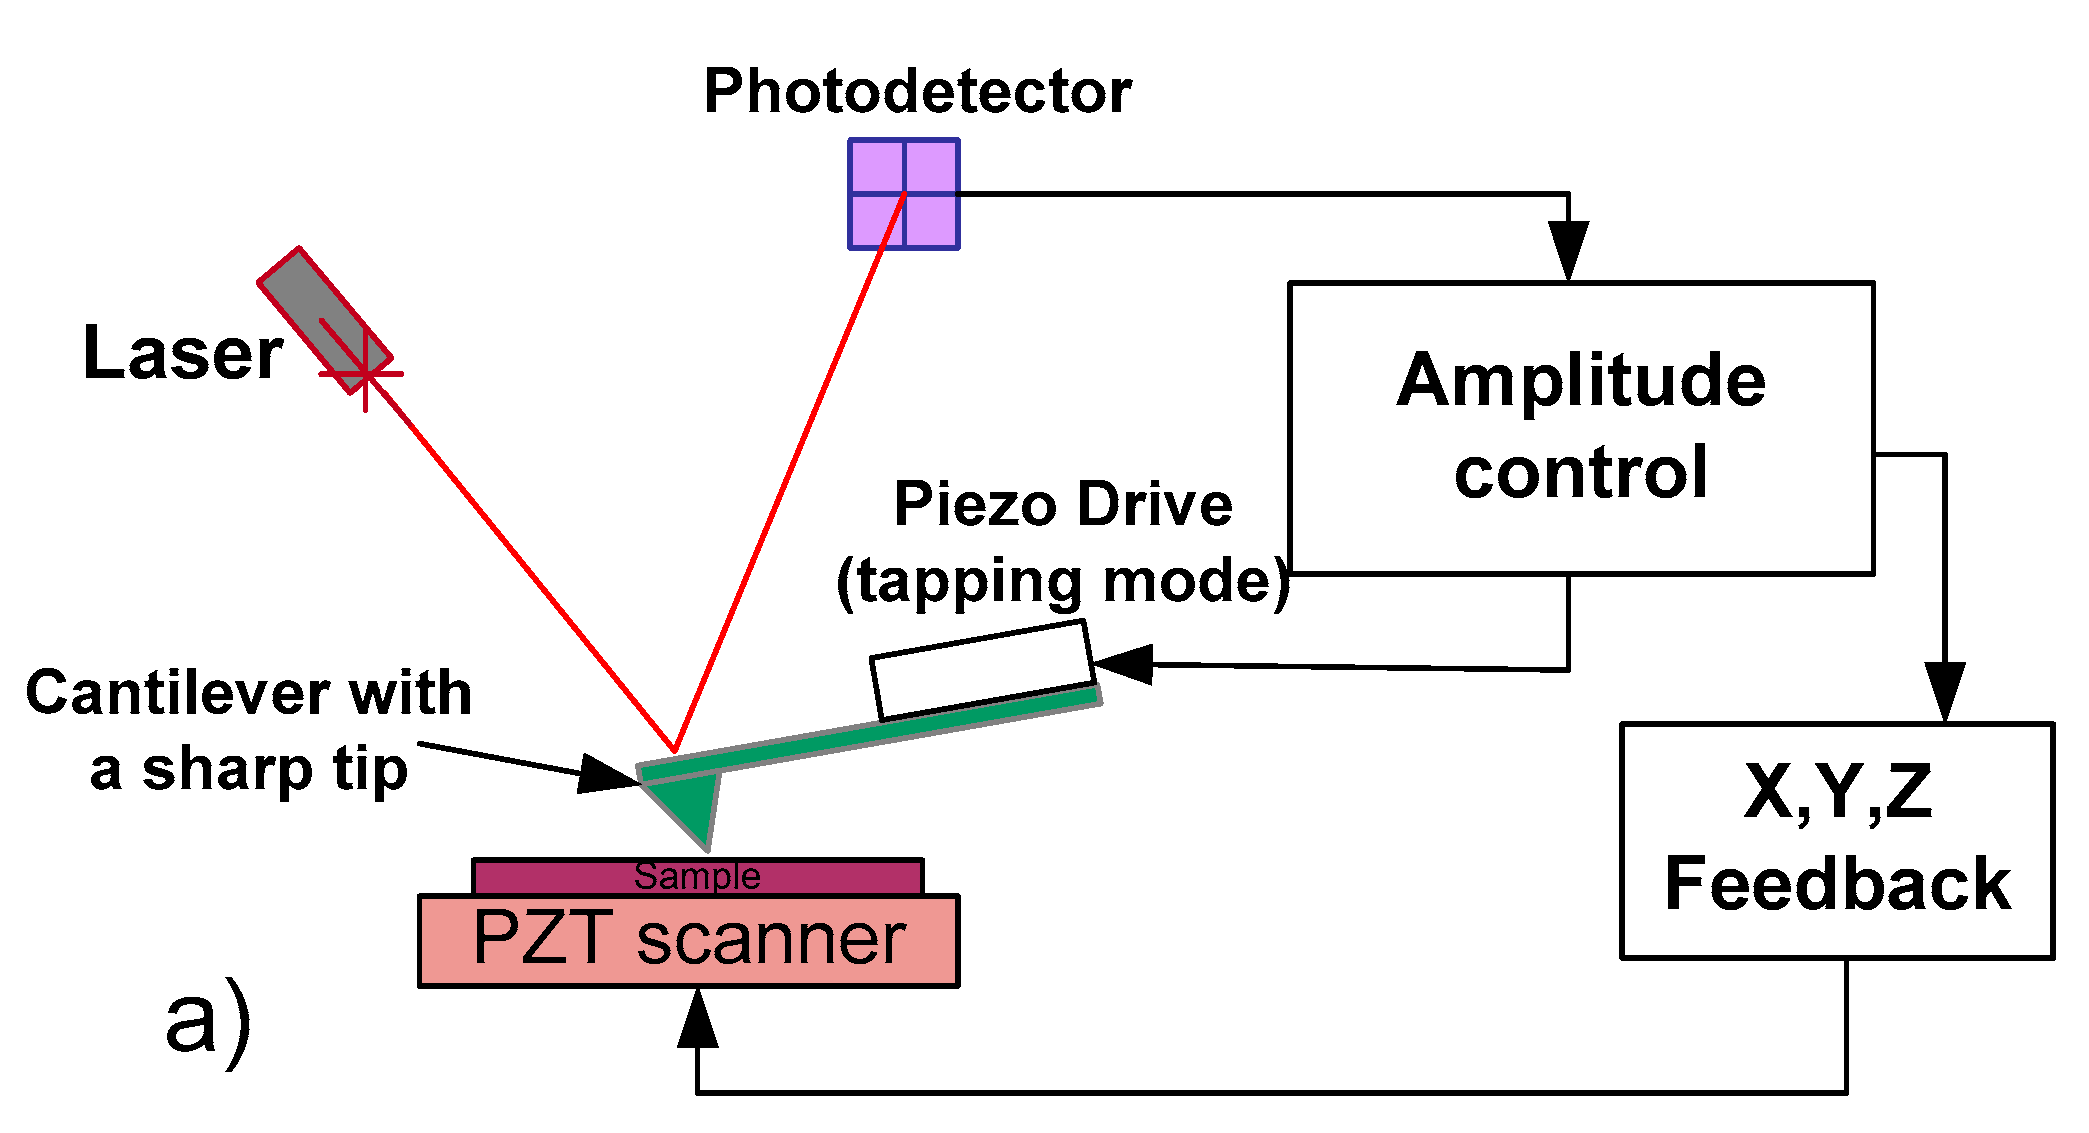
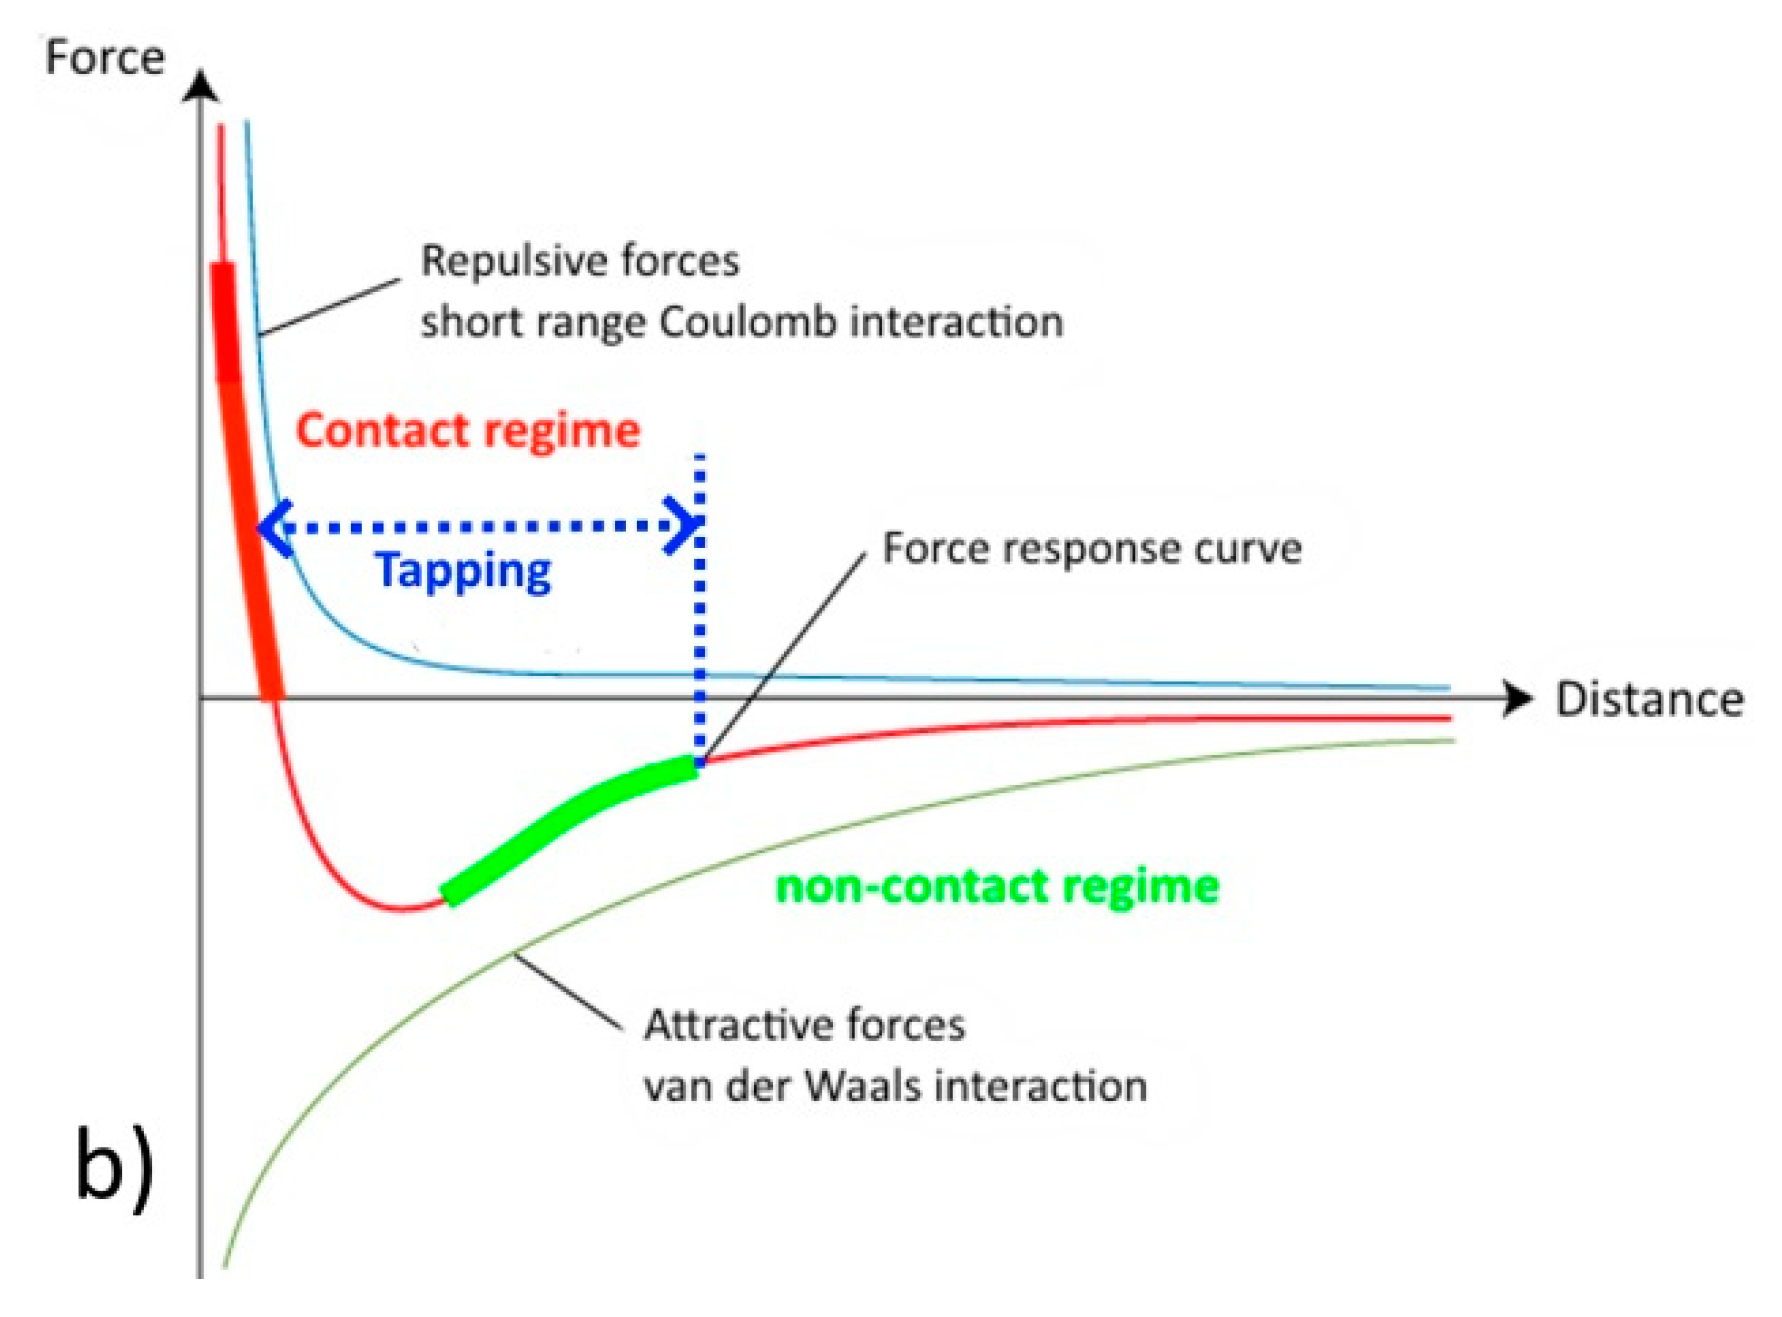
Atomic force microscopy (AFM) was developed in 1986 by Binnig, Quate, and Gerber who demonstrated for the first time the ideas of AFM which is based on a combination of the principles of the Scanning Tunneling Microscope (STM) and the stylus profilometer which used an ultra-small probe tip at the end of a cantilever [23]. Typical commercial AFM systems nowadays use a laser reflection method to detect the displacement of a cantilever. Figure 1a displays a typical scheme of AFM consisting of several essential components: a photodetector, a very sharp tip attached to a cantilever, a piezoelectric tube (PZT) scanner, and control and feedback electronics. AFM operates by maintaining with high precision the force of interaction between the tip and the surface (Figure 1b). When the tip comes close to the surface it experiences van der Waals, electrostatic, and magnetic forces that pull the tip towards the surface. The further the tip approaches the surface the more the repulsive forces start to act upon the tip. The force curve presented in Figure 1b displays the three regions in which AFM is operated. The respective modes of AFM are called non-contact mode, intermittent contact (tapping) mode, and contact mode. In the former two modes, the cantilever is vibrated close to the resonance frequency of a cantilever with the help of a piezo drive and the vibration amplitude/frequency is controlled by the control circuit connected to the photodetector (Figure 1a). In non-contact mode, the tip vibrates close to the surface and experiences attractive forces, so the amplitude of vibration and vibration frequency are lowered. A frequency modulation (FM) technique improves the sensitivity [24]. This method is applied to soft samples to minimize surface damage in imaging of live cells [25], measurements in thin liquid layers [26], and studies of point defects in oxides [27]. In an intermittent contact regime the tip gently taps the surface while experiencing different attractive and repulsive interactions. When the tip comes close to the surface it experiences repulsive forces and the frequency of vibration of the cantilever increases and its amplitude of vibration decreases. Aside from topography images, this method is sensitive to the mechanical properties of the surface such as adhesive forces, stiffness, or softness. The contact mode is much simpler than the previous two modes. In such a mode the tip stays in contact with the surface and the force of interaction is proportional to the deflection of the cantilever monitored via the photodetector. The contact mode allows mechanical properties to be measured such as the frictional force between the tip and the sample thanks to the lateral forces which the tip experiences during movement on the surface [28]. In all the modes the feedback circuit controls the force the tip experiences and adjusts the position of a PZT scanner to maintain the same force. The PZT scanner is composed of a tube made with piezoelectric materials arranged in a specific way which allows the tube to extend/contract and move in different directions depending on the applied voltage. A control scheme makes the scanner move in three dimensions therefore providing a topography image of the scanned surface.
2.2. SKPFM
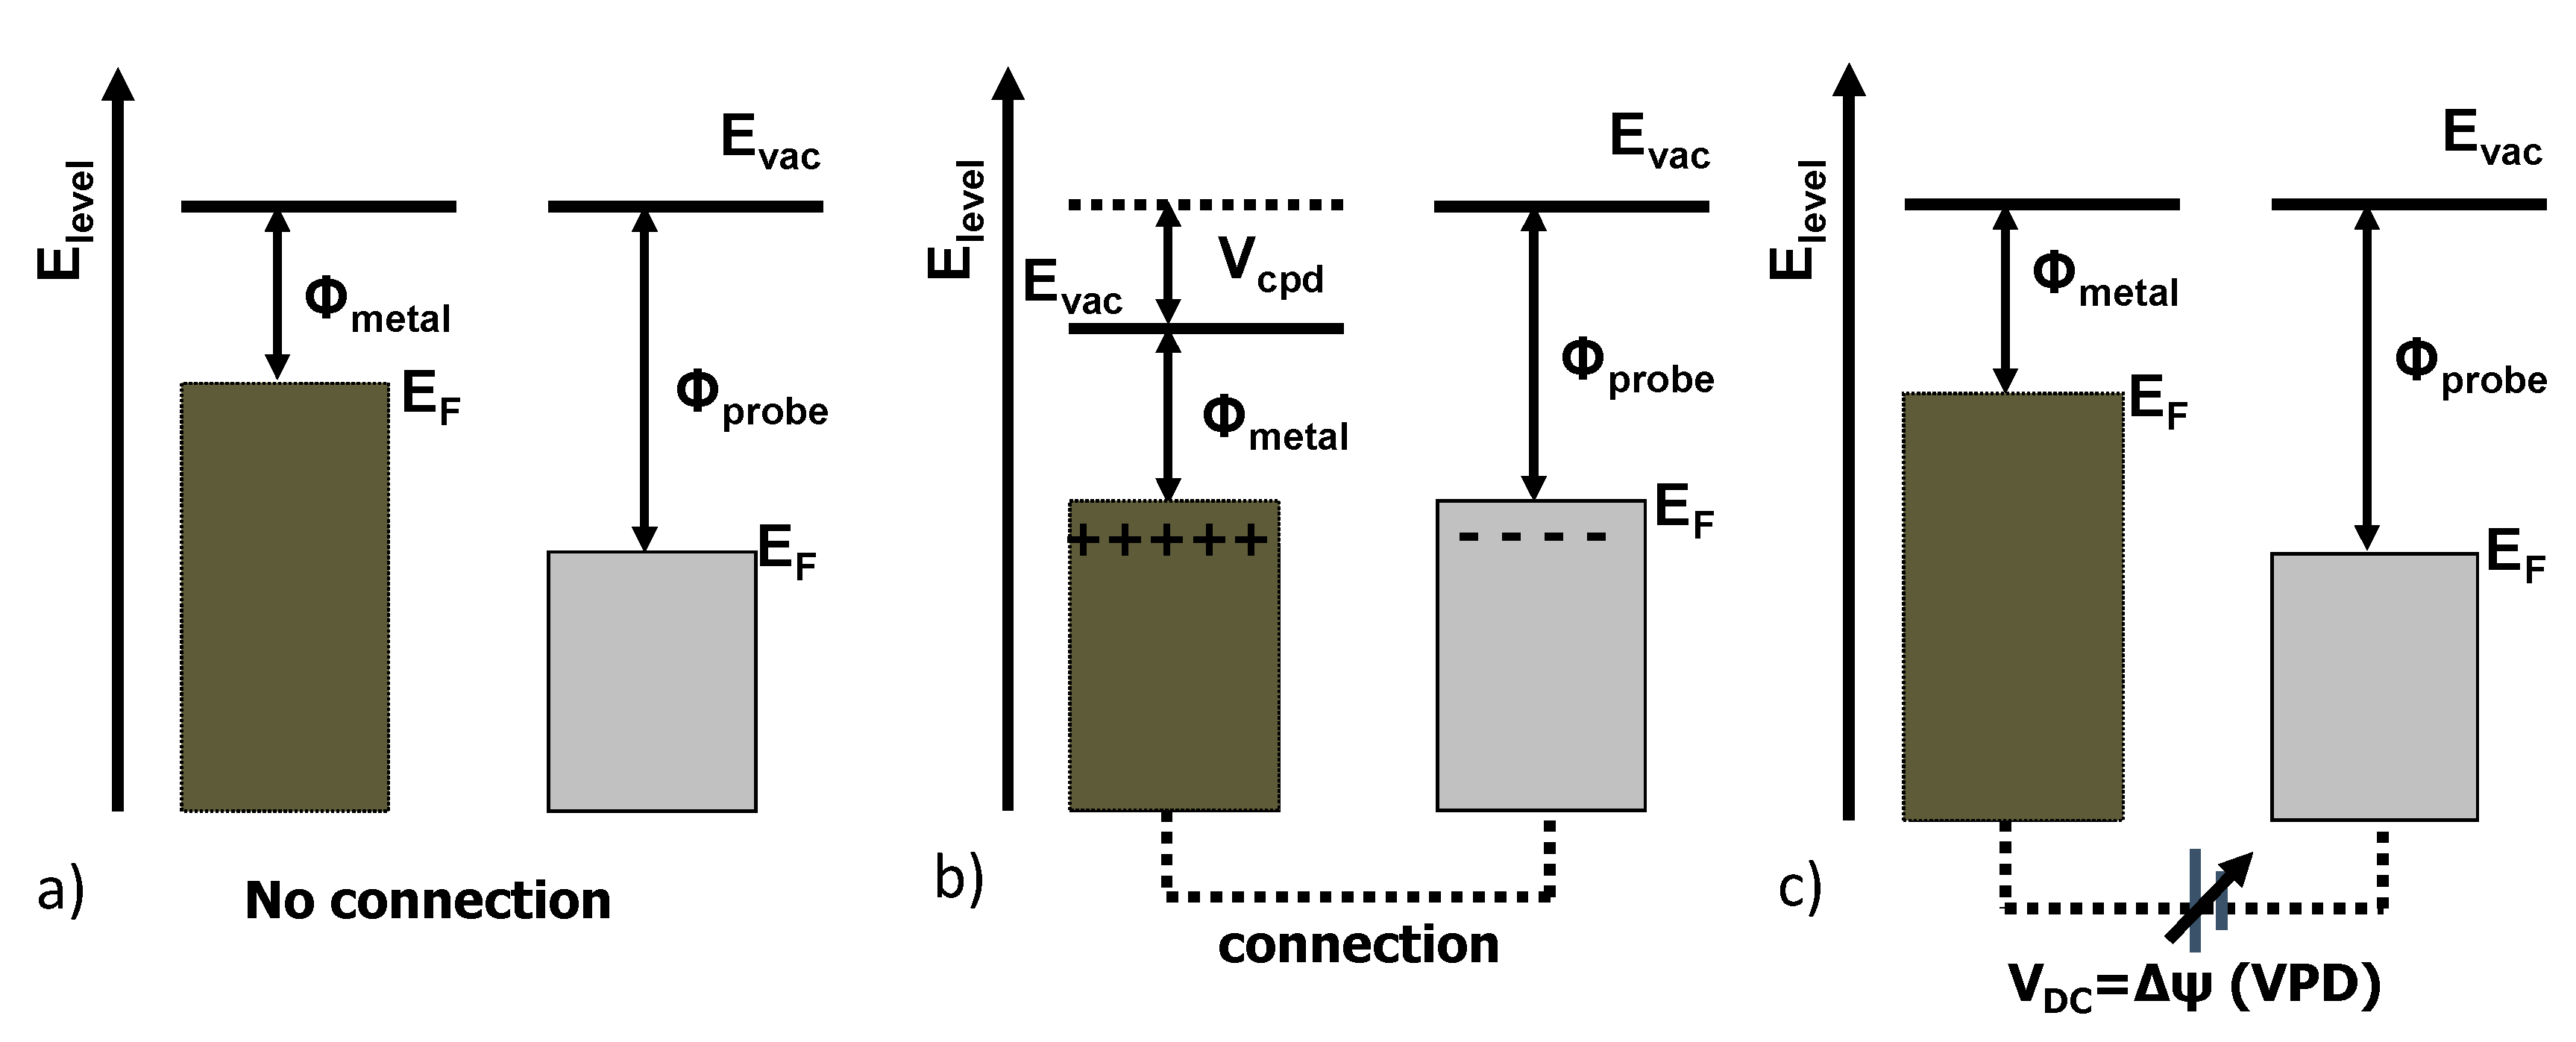
Scanning Kelvin probe force microscopy (SKPFM) is an extension of AFM. This technique was first described by Nonnenmacher and coworkers in 1991 [29]. It is based on a fundamental working principle derived from Lord Kelvin’s experiments. When two metals with different work functions are electrically connected, electrons flow from the higher Fermi level to the lower Fermi level until the Fermi levels equilibrate (Figure 2). As a consequence, a surface charge develops on the probe and the sample, with a related potential difference is known as the contact potential difference (CPD) or Volta potential difference (VPD) (Figure 2). VPD is related to the work function difference as described in Equation (1). If the work function of the tip is known then it is easy to calculate the work function of the sample.
In SKPFM measurements the Volta potential difference measured at each point on the surface contains information on the local work function difference between the tip and the sample. The SKPFM technique includes the same components as in the standard AFM, operated in the tapping mode (Figure 1). A two-pass scan technique is commonly applied in SKPFM measurements. The first scan acquires a surface topography using the standard tapping mode operation mode. During the second scan the cantilever is lifted off the surface at a certain distance and is no longer piezoelectrically driven at its mechanical resonance frequency. An alternating current (AC) voltage, at the resonance frequency (ω) of the cantilever, induces the oscillating electric force (Fe) (Equation (2)) between the AFM tip and the sample surface. The oscillating force is nullified by applying a direct current offset voltage VDC which equals the Volta potential difference established between the sample and the tip (Figure 3). The total voltage applied (ΔV) is a sum of the applied (DC) voltage and the VPD of the sample. Equation (3) is the expression of the total electrostatic force applied to the AFM tip. A lock-in amplifier is used to measure the VVPD at the frequency Fω (Equation (4)). More details on the principle of SKPFM can be found in [30,31,32].
The above discussion applies to metals. However, when the studied surface has semiconducting properties the space charge layer on the surface must be considered in SKPFM measurements [33]. Moreover, the bias applied in SKPFM measurements affects the measured signal [34] and a proper model has to be devised to correlate the measured signal with the dopant density in semiconductors.
Several limitations of the SKPFM technique should be mentioned. The most important ones are resolution, speed, and environment in which SKPFM operates. The resolution of SKPFM depends on many factors, in amplitude modulation (AM) mode, features as small as a few ten nanometers in size can be detected [35]. By decreasing the height in the lift scan it is possible to achieve much better resolution and contrast in SKPFM, as has been demonstrated by Jacobs et al. [32]. The geometry of the AFM probe plays a significant role since both the tip and the cantilever have capacitive coupling with the sample surface. The measured VPD is a convoluted value which depends on the surrounding of the tip. When the surface is composed of different metallic phases the measured VPD becomes a weighted average over all potentials, derivatives of capacitance on the surface [32,35,36]. It has been so devised that the cantilever significantly contributes to the capacitive coupling with the substrate along with the tip, and its geometry and size influence the resolution and numerical VPD values [37,38,39]. The contribution to the electrostatic force due to the cantilever has been reported to be as high as 50% [38] or, as has been demonstrated by scientists from Bruker, the contribution from the cone of the tip can be as low as about 10% [40]. In this context, the frequency modulation (FM) SKPFM technique is an improvement on the standard amplitude modulation detection technique, which has a much better resolution and is faster than the two-pass scan technique [30]. The FM mode provides a sub-nanometer spatial resolution when the proper tip and environmental conditions are selected [30]. FM SKPFM works with the same speed as a standard AFM and is twice as fast compared with AM SKPFM working in a two-pass scan mode. However, the surface properties of the AFM tip play a very important contribution to the signal measured in FM mode. Even the slightest contamination of the tip can drastically affect the measured VPD signal. On the contrary, AM SKPFM is less sensitive to changes of the tip. However, artifacts commonly appear in VPD measurements due to degradation of the tip and the presence of high topographic features. Ideally, the studied surface should be flat. SKPFM measurements are normally done in air at low relative humidity to prevent the reaction of a metal surface with moisture. SKPFM cannot be performed in conductive solutions since uncontrollable electrochemical processes will hamper the measurements because of the high bias voltage applied between the tip and the sample.
2.3. EC-AFM
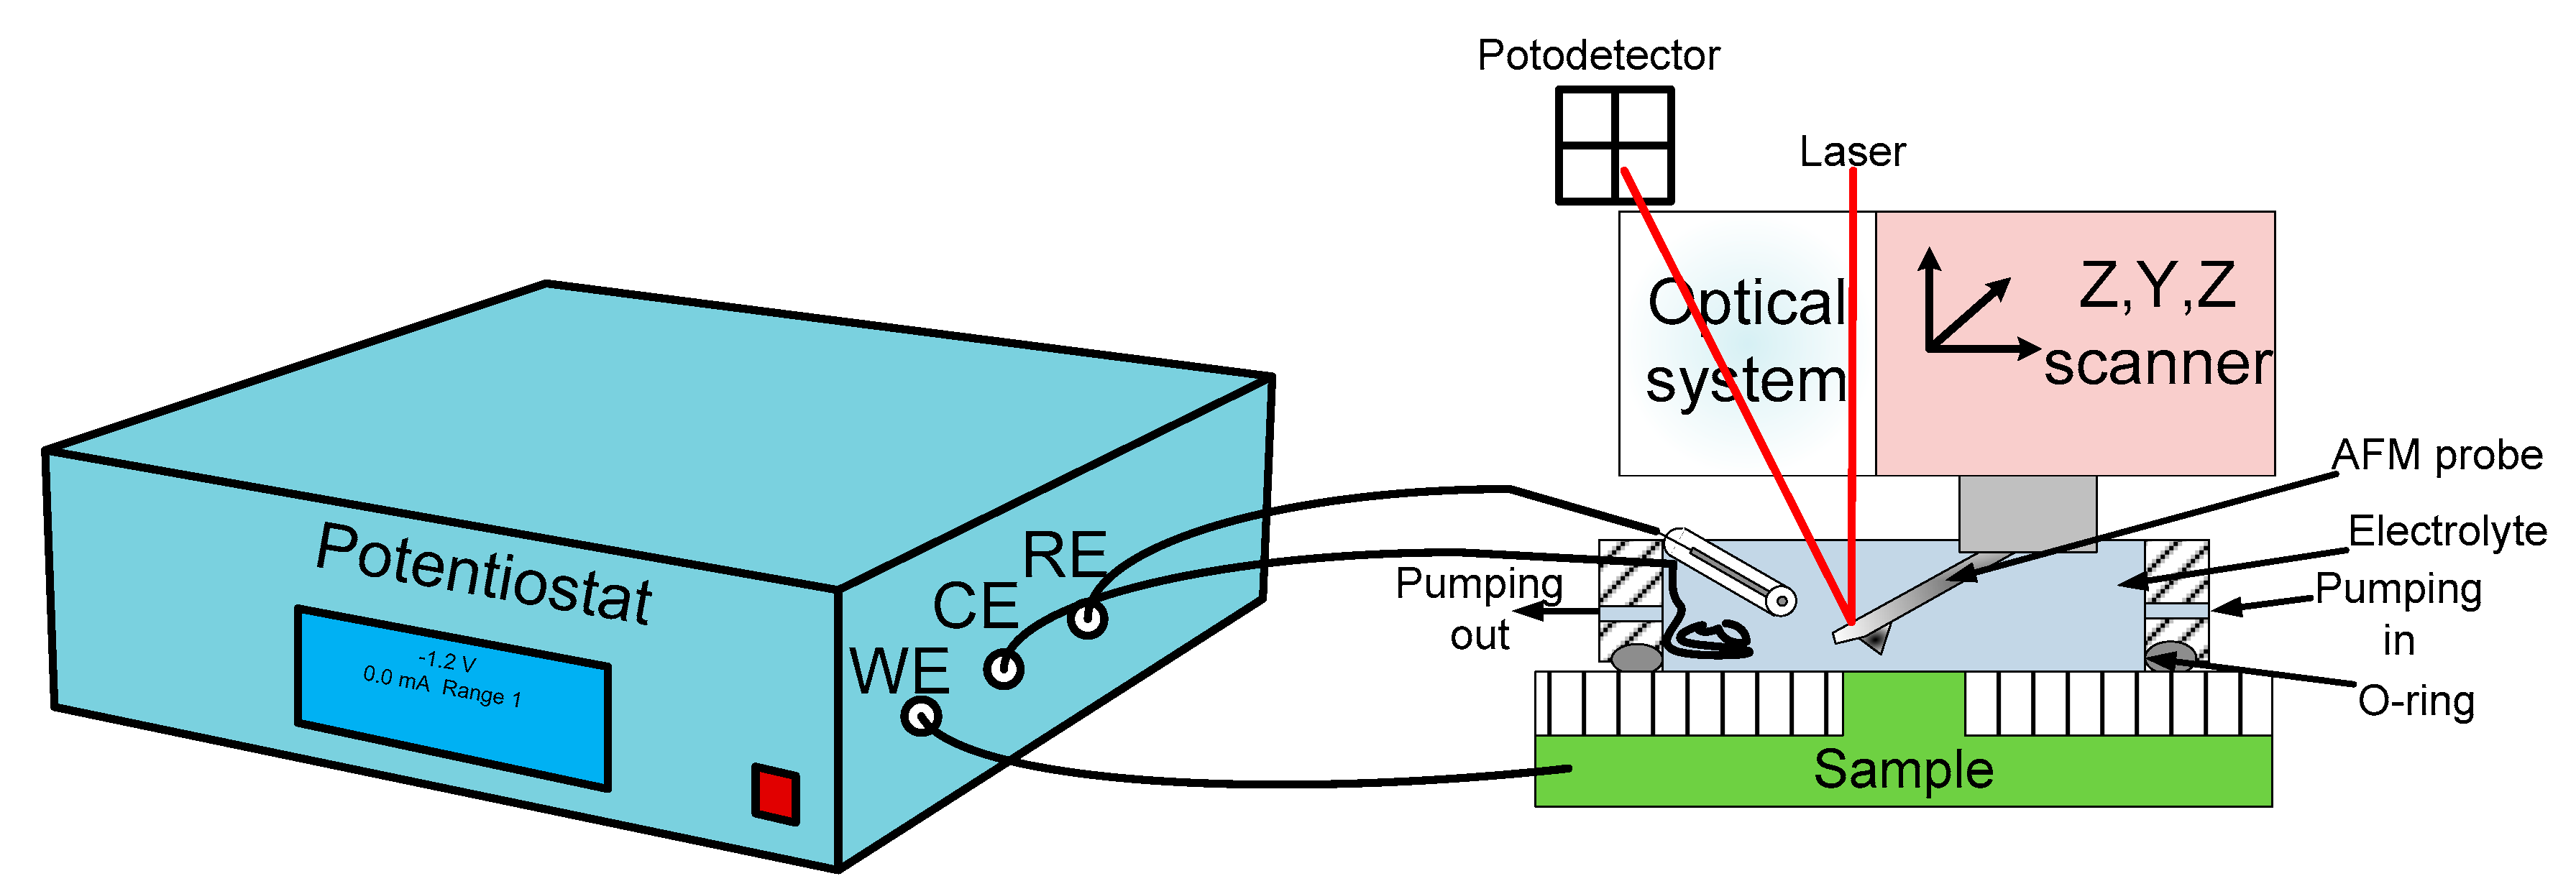
In 1991 electrochemical AFM (EC-AFM) measurements of a gold surface in perchloric acid electrolyte and under potential control were reported [41]. Surface topography of the metal surface under the action of electrochemical polarization is the main characteristic studied by this technique. EC-AFM is routinely employed to understand the properties of passive films and various localized corrosion phenomena on metallic substrates in liquid [42]. Figure 4 presents a typical setup of the EC-AFM system. It includes several parts, the AFM part is represented by several components: a scanner, an AFM probe, an optical system, a laser, and a photodetector. An AFM may be operated in the three modes described earlier, both advantages and drawbacks of these modes are described in [42]. The contact and tapping modes are successfully used for imaging the metallic surfaces [41]. The peak force tapping mode is used when extremely low forces between the tip and the sample are required for measurements. The mode has been successfully applied in measuring topography changes at surfaces under electrochemical polarization [43,44].
The electrochemical part is comprised of an electrochemical cell that includes a reference electrode (RE), a counter electrode (CE), and a sample surface (working electrode WE) which are connected to the outlets of a potentiostat. The cell is attached to the sample holder and it is typically filled with an electrolyte which is refreshed with a pumping system. In EC-AFM measurements the current or potential are not applied between the tip and the sample as it is conducted in EC-STM [45], but between the counter electrode and the sample. It is important to pay attention to the fact that at high current densities the voltage drop (IR drop) between the sample and the RE starts to matter especially when the concentration of an electrolyte is small. Thus the reference electrode should be placed close to the sample surface. It is advisable to compare electrochemical measurements taken from the sample placed inside the EC-cell with the measurements done in a macro scale electrochemical cell. Another limitation of EC-AFM is the rate of corrosion. The speed at which a topography map is acquired should be comparable with the rate of localized corrosion attack on the surface or the rate at which the surface changes. If the corrosion rate is higher, AFM will not be able to effectively track surface changes.
3. In Situ AFM Investigation of Metallic Surfaces
In situ AFM has become an indispensable tool for the characterization of localized corrosion activity of metals and alloys during immersion in electrolyte solutions. The principles of EC-AFM operation are similar to AFM measurements in air. However, in liquid electrolytes active corrosion processes occurring on metallic surfaces significantly contribute to noise and hamper the measurements. For example, when a contact mode in in situ AFM is applied to study a metal corroding in a water solution the corrosion products, which are produced by the metal, may attach to the AFM tip and be dragged along the scan. This can greatly affect the measurements to the extent that the AFM maps become completely unreadable and all the features of the surface become obstructed by the noise. In circumstances where a heavy contact with the surface is needed, as was presented by Schmutz and Frankel [46], the contact of the AFM tip with the AA2024 surface has been used to observe localized corrosion development near intermetallic particles. The scratching with the AFM tip was used to stimulate local depassivation events near different intermetallic particles. It was found that the dissolution increases on a pure aluminum with a higher applied setpoint (higher force) to the AFM tip. Among the two types of inclusions such as Al-Cu-Mg and Al-Cu-(Fe, Mn) the former were easily depassivated and dissolved in the NaCl solution, while the latter showed etching and trenching due to dissolution of the aluminum matrix [46].
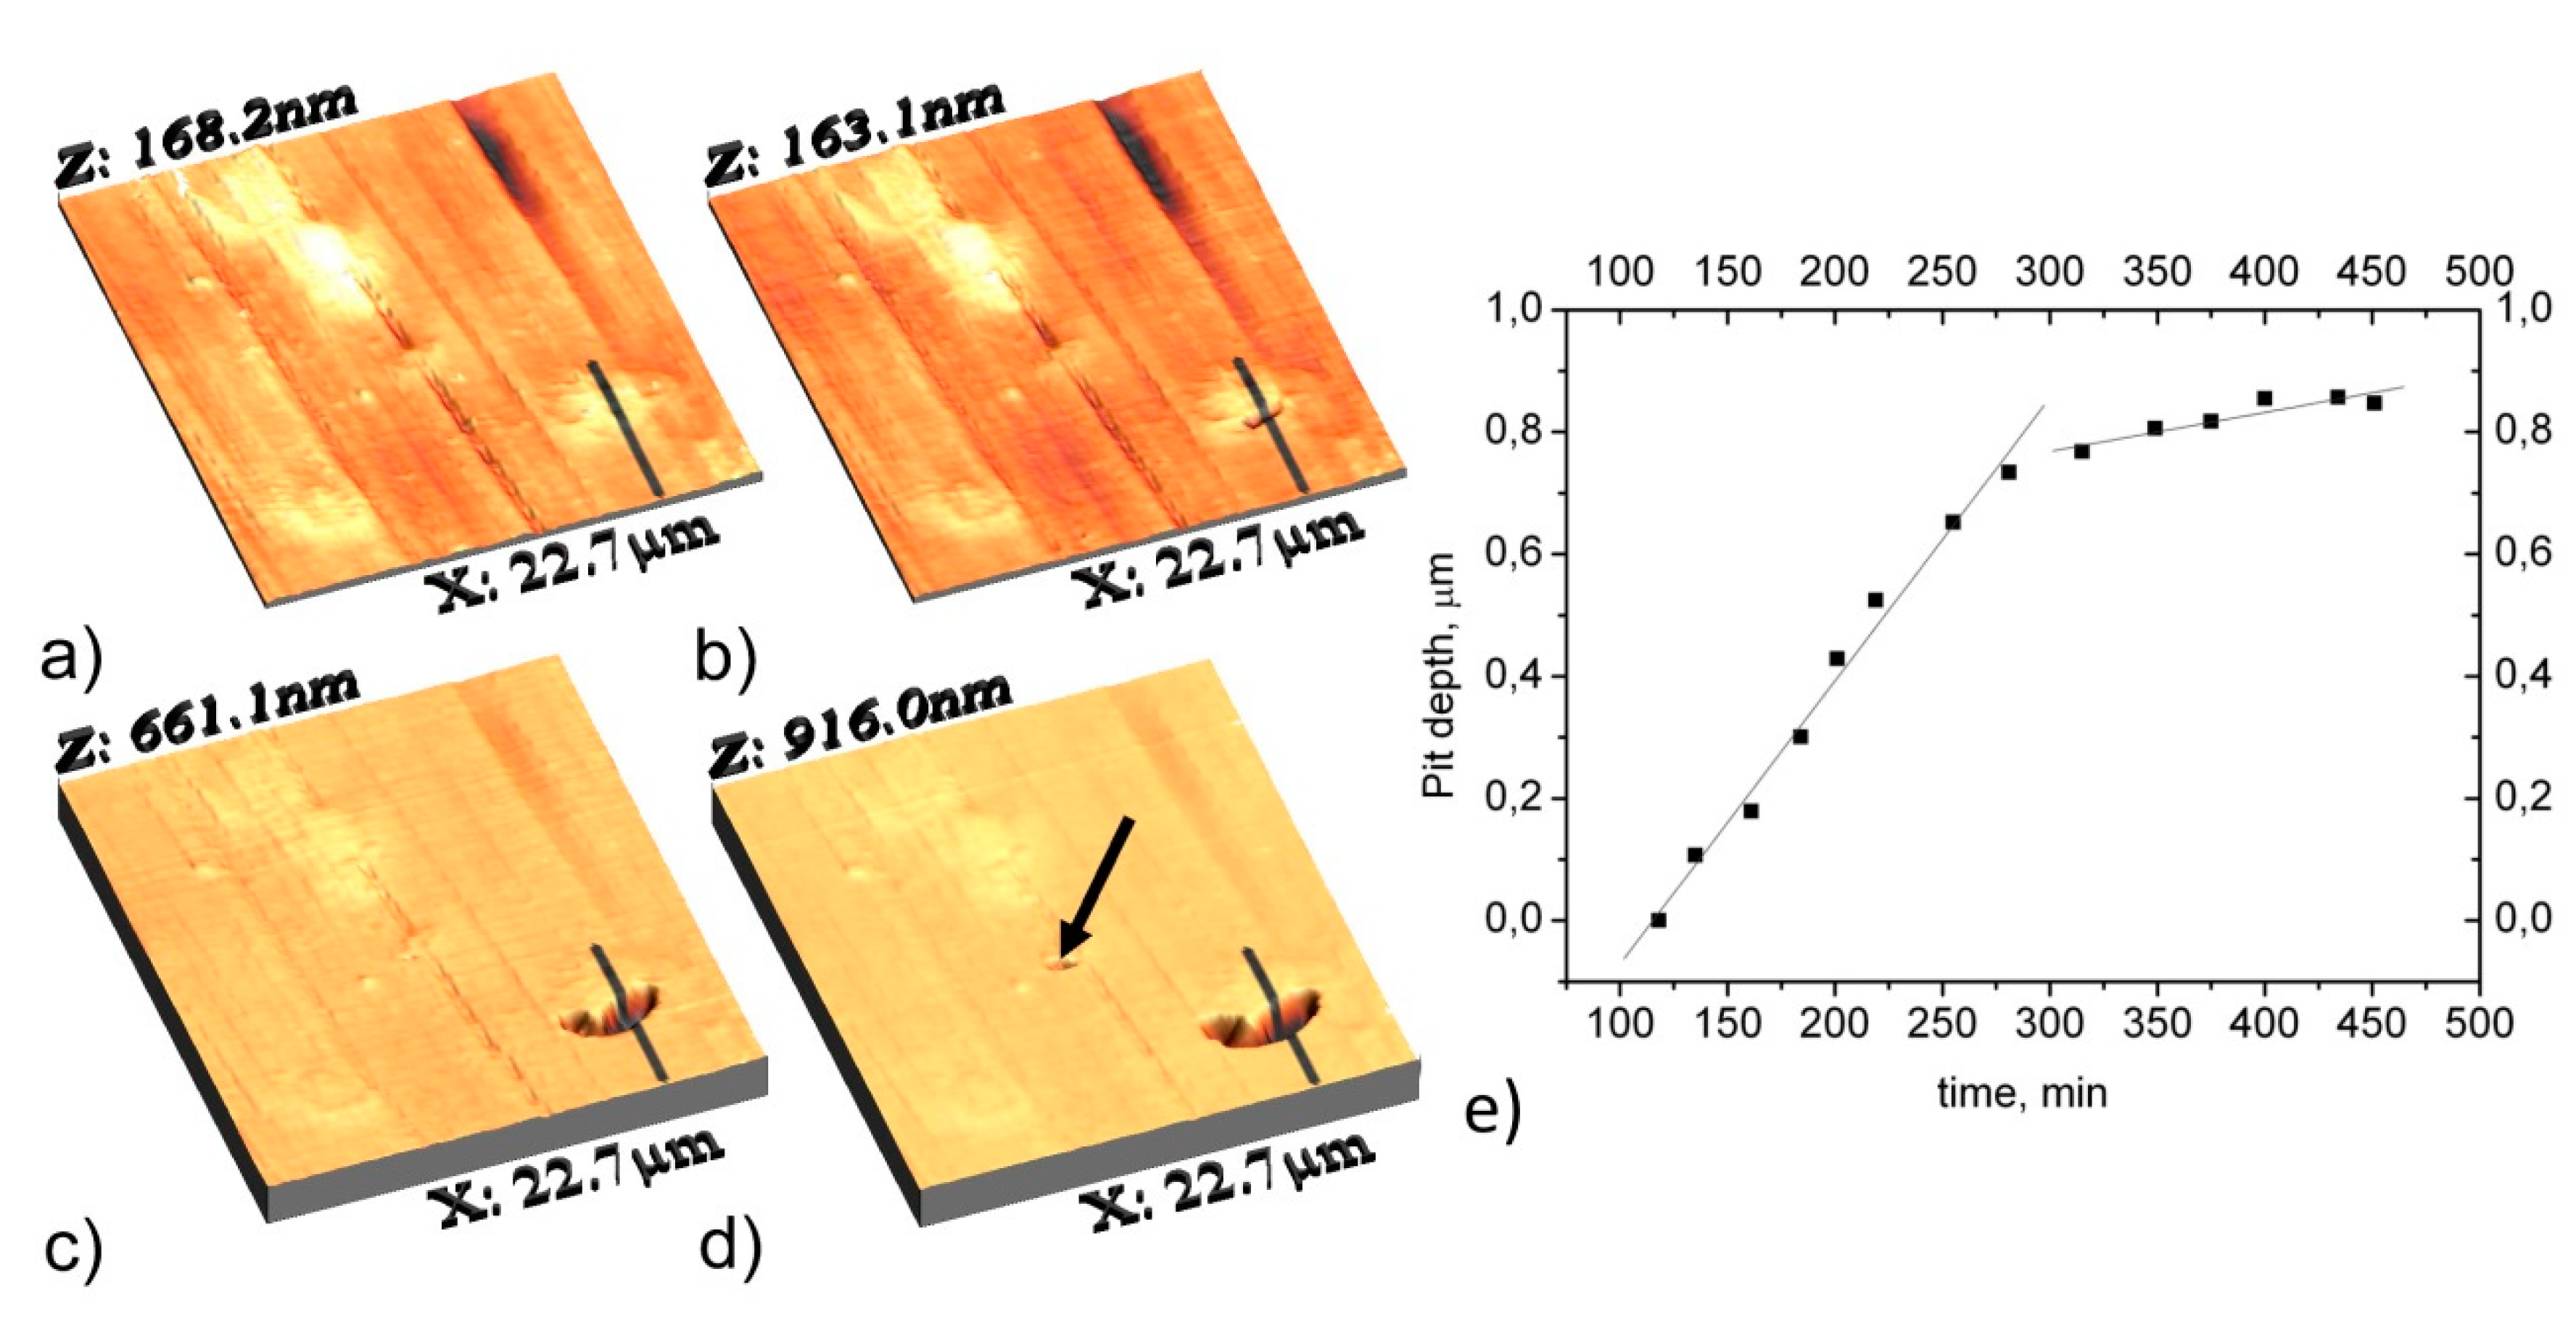
Similar trenching was observed on the AA5083 surface containing (Fe, Mn) intermetallics during immersion in NaCl solutions [47]. Polished metallic samples were studied by contact mode AFM in 0.005 M and 0.5 M NaCl solutions in a fluid cell. The surface was continuously scanned during the corrosion test and every 10 min a surface topography image was recorded. During the first 180 min of immersion in 0.005 M NaCl local corrosion attack was revealed on the tested zone (Figure 5a). It appeared that the setpoint force might not have been sufficient to cause local corrosion attack on (Fe, Mn) containing intermetallics as was shown in Ref. [46]. To accelerate the corrosion process 0.5 M NaCl solution was pumped into the liquid cell. Evident trenching started to appear close to intermetallic particles after 130 min of exposure (Figure 5b). A high concentration of chloride ions depassivated the surface oxide film which led to the dissolution of the matrix. During the following immersion, the pit expanded laterally and vertically (Figure 5c,d). The evolution of the depth of the pit is shown in Figure 5e. Two stages can be noticed; the first one being linear which may signify an active growth stage while the second one with the lower slope may be attributed to passivation of the pit [47].
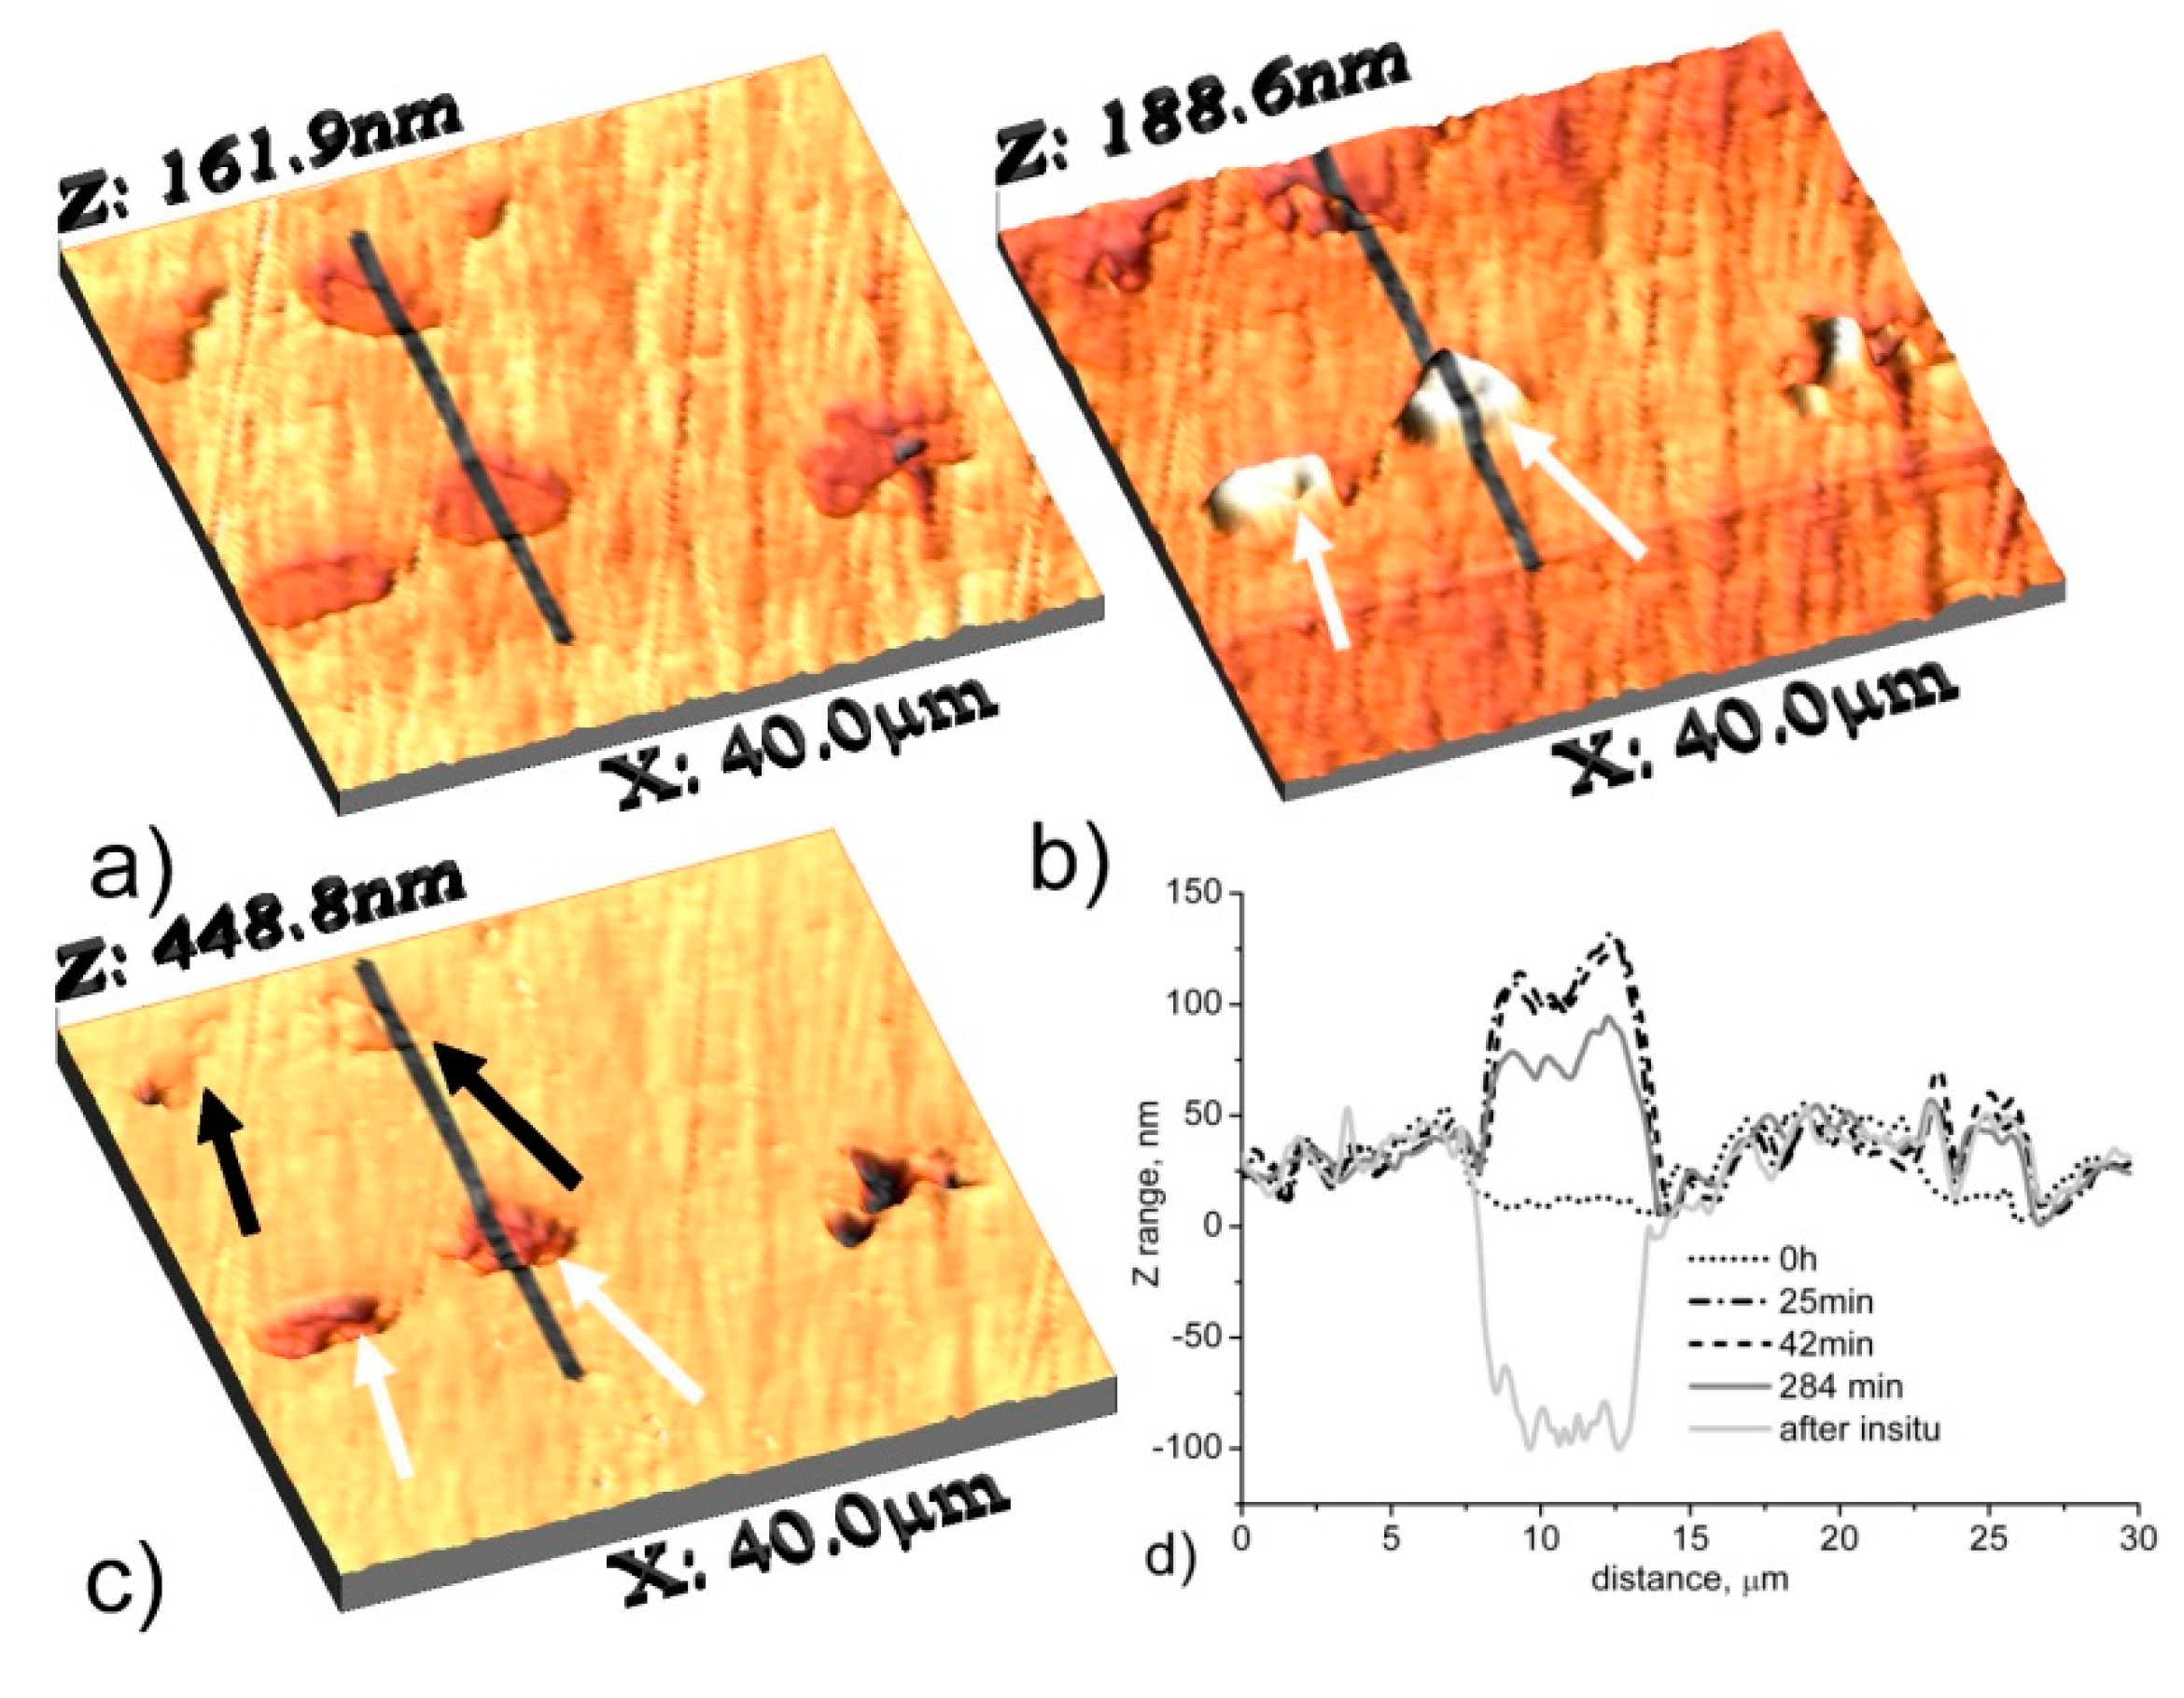
Various intermetallics have different electrochemical properties. In the same work the corrosion susceptibility of another type of intermetallics i.e., Mg2Si was studied and the corrosion mechanism of the intermetallics was proposed based on in situ measurements of localized corrosion activity and microstructural analysis [47]. Such intermetallics were found to be anodic to the aluminum matrix [17] and were dissolving in a corrosive environment. Figure 6 displays AFM images obtained from the polished surface containing Mg2Si intermetallics before and during in situ immersion in 0.005 M NaCl. The uncorroded surface (Figure 6a) displays anodic intermetallics having shallow cavities of about 30 nm in depth which were formed during the polishing process. During immersion some sort of precipitates were formed above these intermetallics as can be observed on AFM maps and topography profiles (Figure 6b,d). After immersion a larger dissolution was noticed at the intermetallics (Figure 6c,d). Surface changes of Mg2Si intermetallics have been ascribed to the different processes including chemical and electrochemical steps [47]. At the initial stage Mg2Si can be hydrolyzed by water with the formation of different types of silanes, in particular mono-silane (reaction 5), which then hydrolyze forming SiO2 (reaction 6).
Mg2Si + 4H2O → 2Mg(OH)2 + SiH4
SiH4 + mH2O → SiO2·nH2O + 4H2↑
Simultaneously the electrochemical dissolution of magnesium from the Mg2Si intermetallics occurs enriching the latter in SiO2 (reaction 7).
Mg2Si + 2H2O → 2Mg2+ + SiO2 + 4H+ + 8e−
The in situ AFM experiments were in good agreement with the proposed behavior of the Mg-Si phase. During the first stage of immersion a thin layer of deposits (SiO2·nH2O or Mg(OH)2) impaired further dissolution at the sites of magnesium-rich intermetallics (Figure 6b). After immersion a layer enriched in Si and O was observed on the surface of the intermetallics [47]. Although AFM has high capabilities in studying localized corrosion processes in aqueous solutions, other surface analysis methods are necessary to understand chemical changes of intermetallics and metallic phases after corrosion.
AFM measurements can help to visualize the corrosion inhibiting action of different compounds on metallic alloys. Iannuzzi and Frankel studied corrosion inhibition of aluminum alloy 2024-T3 by vanadates in situ using a contact mode AFM [48]. The samples exposed to 0.1 M NaCl with no inhibitor developed a trench-like attack at the periphery of large Al-Cu-Fe-Mn-(Si) intermetallic phases. The addition of dilute metavanadate solution markedly reduced the kinetics of the corrosion attack. Besides, most of the S-phase (Al2CuMg) intermetallics remained free of attack. The higher concentrations of metavanadate enhanced corrosion protection of the substrate to the extent that only at high forces (high setpoint) could pitting corrosion be induced. Vanadate species seem to act as an adsorption inhibitor and to not form precipitates on the surface of AA2024. Decavanadate species were proven to be poor corrosion inhibitors. The surface of AA2024 quickly developed significant localized corrosion attack in the solution containing decavanadate species which obstructed long term AFM measurements.
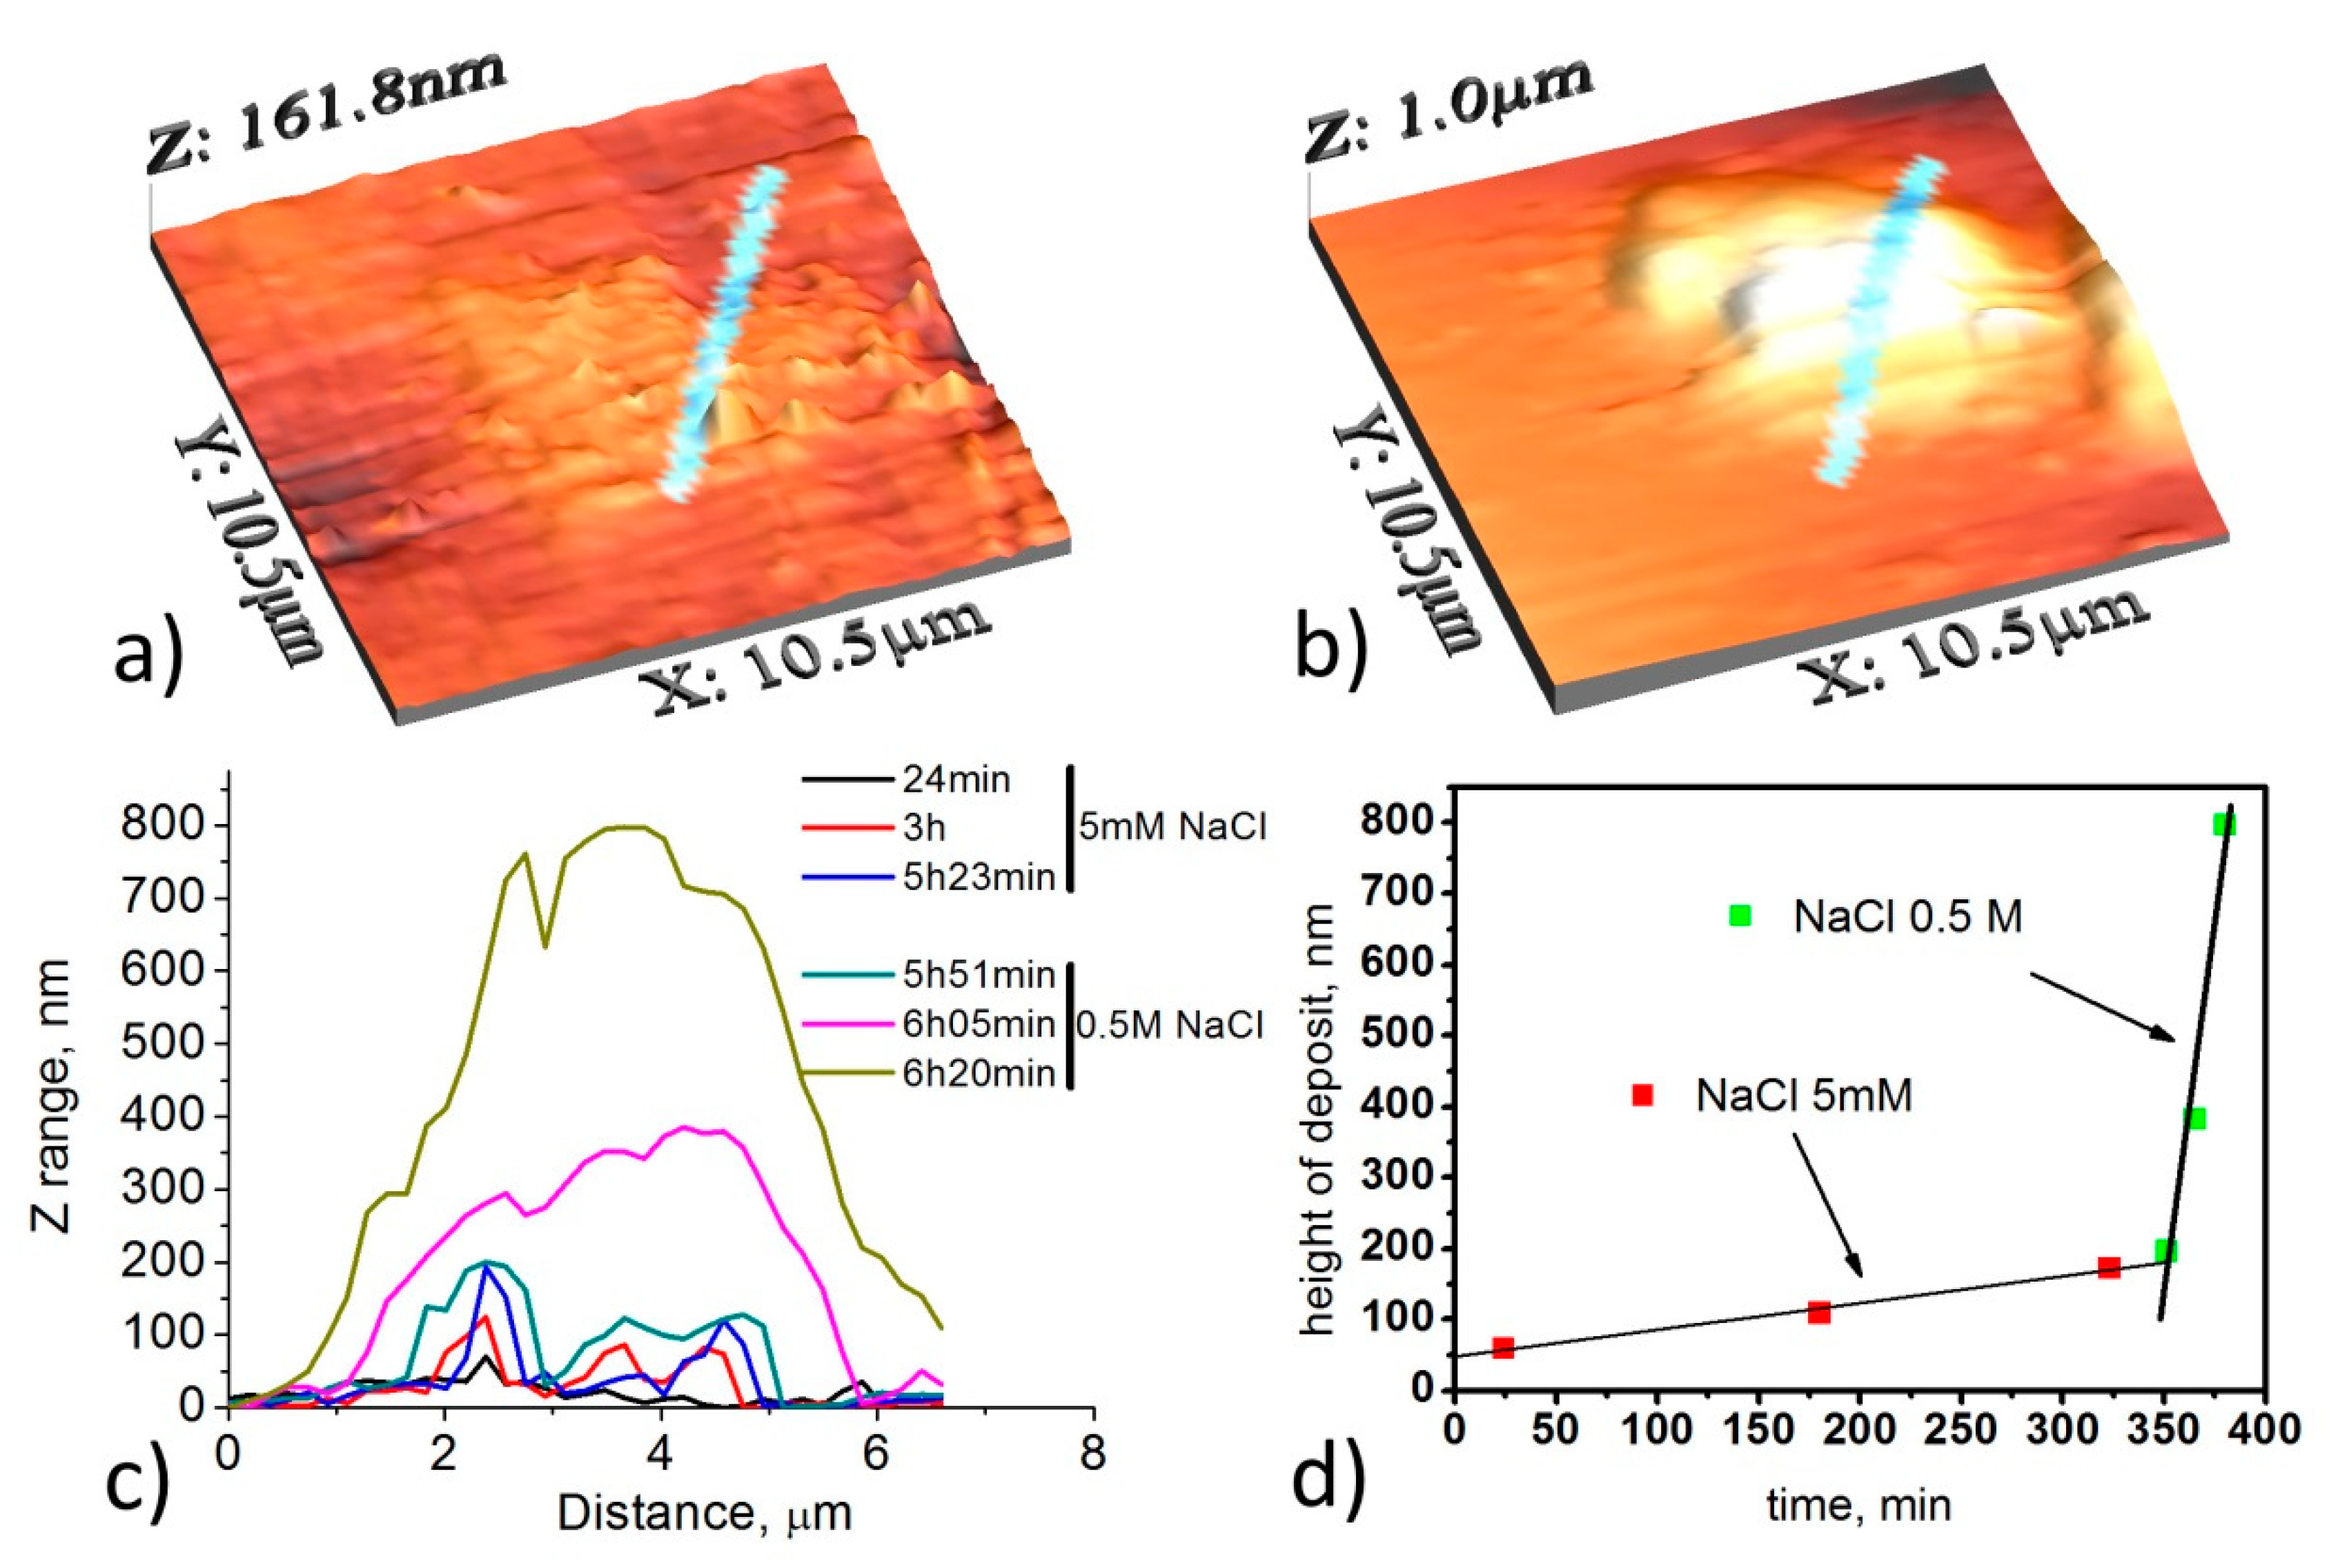
Corrosion inhibitors that form precipitates, such as lanthanides, were studied in [11]. It is well known that the S-phase, which is the intermetallic phase typically present in Al-Cu-Mg alloys such as AA2024, has very strong localized corrosion [10,11,12,13,46]. The localized corrosion develops into pitting corrosion and is a major concern for the aerospace industry utilizing such types of alloys. Figure 7 displays the kinetics of topography changes of an S-phase intermetallic during corrosion in the presence of an inhibitive additive such as the soluble salts of lanthanides, i.e., La(NO3)3. At the beginning the substrate was immersed for 5 h and 23 min in the electrolyte containing 0.005 M NaCl and 0.5% of La(NO3)3 (Figure 7a,c). Localized corrosion was very weak at that point. Afterward, the electrolyte with a higher concentration of chlorides (0.5 M) and the same concentration of the inhibitor was introduced into the liquid cell. Two orders of magnitude increase in chloride concentration led to a higher speed of lanthanum hydroxide deposition (Figure 7b,c). The cathodic process of oxygen reduction (reaction 8) produces hydroxyls ions that react with lanthanum cations forming an insoluble hydroxide precipitate (reaction 9) [11]. Figure 7d shows the kinetics of La(OH)3 precipitate formation across the profile images. A linear kinetic law describes the rate of the deposit formation. The estimated rate of the deposit growth is about 0.4 nm/min in the weak chloride-based electrolyte. However, the rate is increased by almost 50 times reaching 20 nm/min in the concentrated solution (Figure 7d). AFM provides a valuable means for studying the kinetics of processes occurring at metal/electrolyte interfaces and is routinely used for corrosion studies.
O2 + 2H2O + 4e− → 4OH−
La3+ + 3OH− → La(OH)3 ↓
Corrosion of steel has been an active subject of research. Various publications show the performance of different inhibitors in corrosion protection of steel substrates using AFM. For example, chromeno pyrimidine compounds were tested as potential corrosion inhibitors for N80 steel in 15% hydrochloric acid solution [49], and thiazolyl imines were investigated in acidic corrosion of mild steel [50]. Corrosion inhibition of steel in NaCl solutions at pH 4 using salicylaldehyde–Chitosan Schiff Base was studied in [51]. X-ray photoelectron spectroscopy revealed adsorption of the inhibitors on the surface of the steel. The presence of these inhibitors in the corrosive medium resulted in a decrease of the corrosive attack and roughness of the surface measured by AFM. Corrosion inhibiting and passivation processes in alkali media have been studied on carbon steel and AISI 304 steel using AFM, electron and optical microscopy, and electrochemical methods [52,53]. In the former work Quaternium-green ionic liquid was used for corrosion inhibition of carbon steel in a simulated concrete pore solution. In the latter work AFM was used to study the formation of the surface passive film after immersion in NaOH solution at pH 13. It was demonstrated that the roughness of the surface significantly decreases either due to the presence of the inhibitor or due to the growth of the passive film in the alkali solutions.
Changing the composition of steel is an alternative way to improve the corrosion performance of ferrous materials in comparison with the corrosion inhibition strategy discussed above. Handoko et al. investigated the effects of small additions of Cr to a high carbon low alloy steel with the dual-phase structure of martensite and austenite [54]. In situ AFM images were recorded from different samples containing 0.10–0.18% Cr; 0.60–0.80% Cr; and 1.80–2.50% Cr during immersion in 0.1 M NaCl solution (Figure 8). The observed preferential attack on the austenite microstructure was related to the different Cr content that affected the shape, size, and distribution of each grain boundary interface. It appeared that the addition of a low quantity of Cr increased the stabilization of the retained austenite, improving corrosion resistance. In this work an assumption was made that the modifications of surface roughness could be related to the dissolution and preferential attack of the austenitic microstructure. Thus the weight loss was obtained and the results were fitted with a polynomial function [54]. It was demonstrated that the corrosion rate of the steel was reduced when the stability of austenite was enhanced by alloying the steel with Cr.
In all the cases surface topography was used as the principal parameter in determining localized corrosion activity and the kinetics of the corrosion of metallic materials. However, by itself, the AFM method is not able to predict the corrosion susceptibility of the metallic phases in the alloy matrix at the micro-level without damaging the surface. Below, the application of SKPFM relevant to corrosion research is discussed. Various examples are given where SKPFM measurements offer important information regarding the corrosion susceptibility of metallic and coated substrates at micrometer resolution.
4. Application of SKPFM for Studying Localized Corrosion Susceptibility
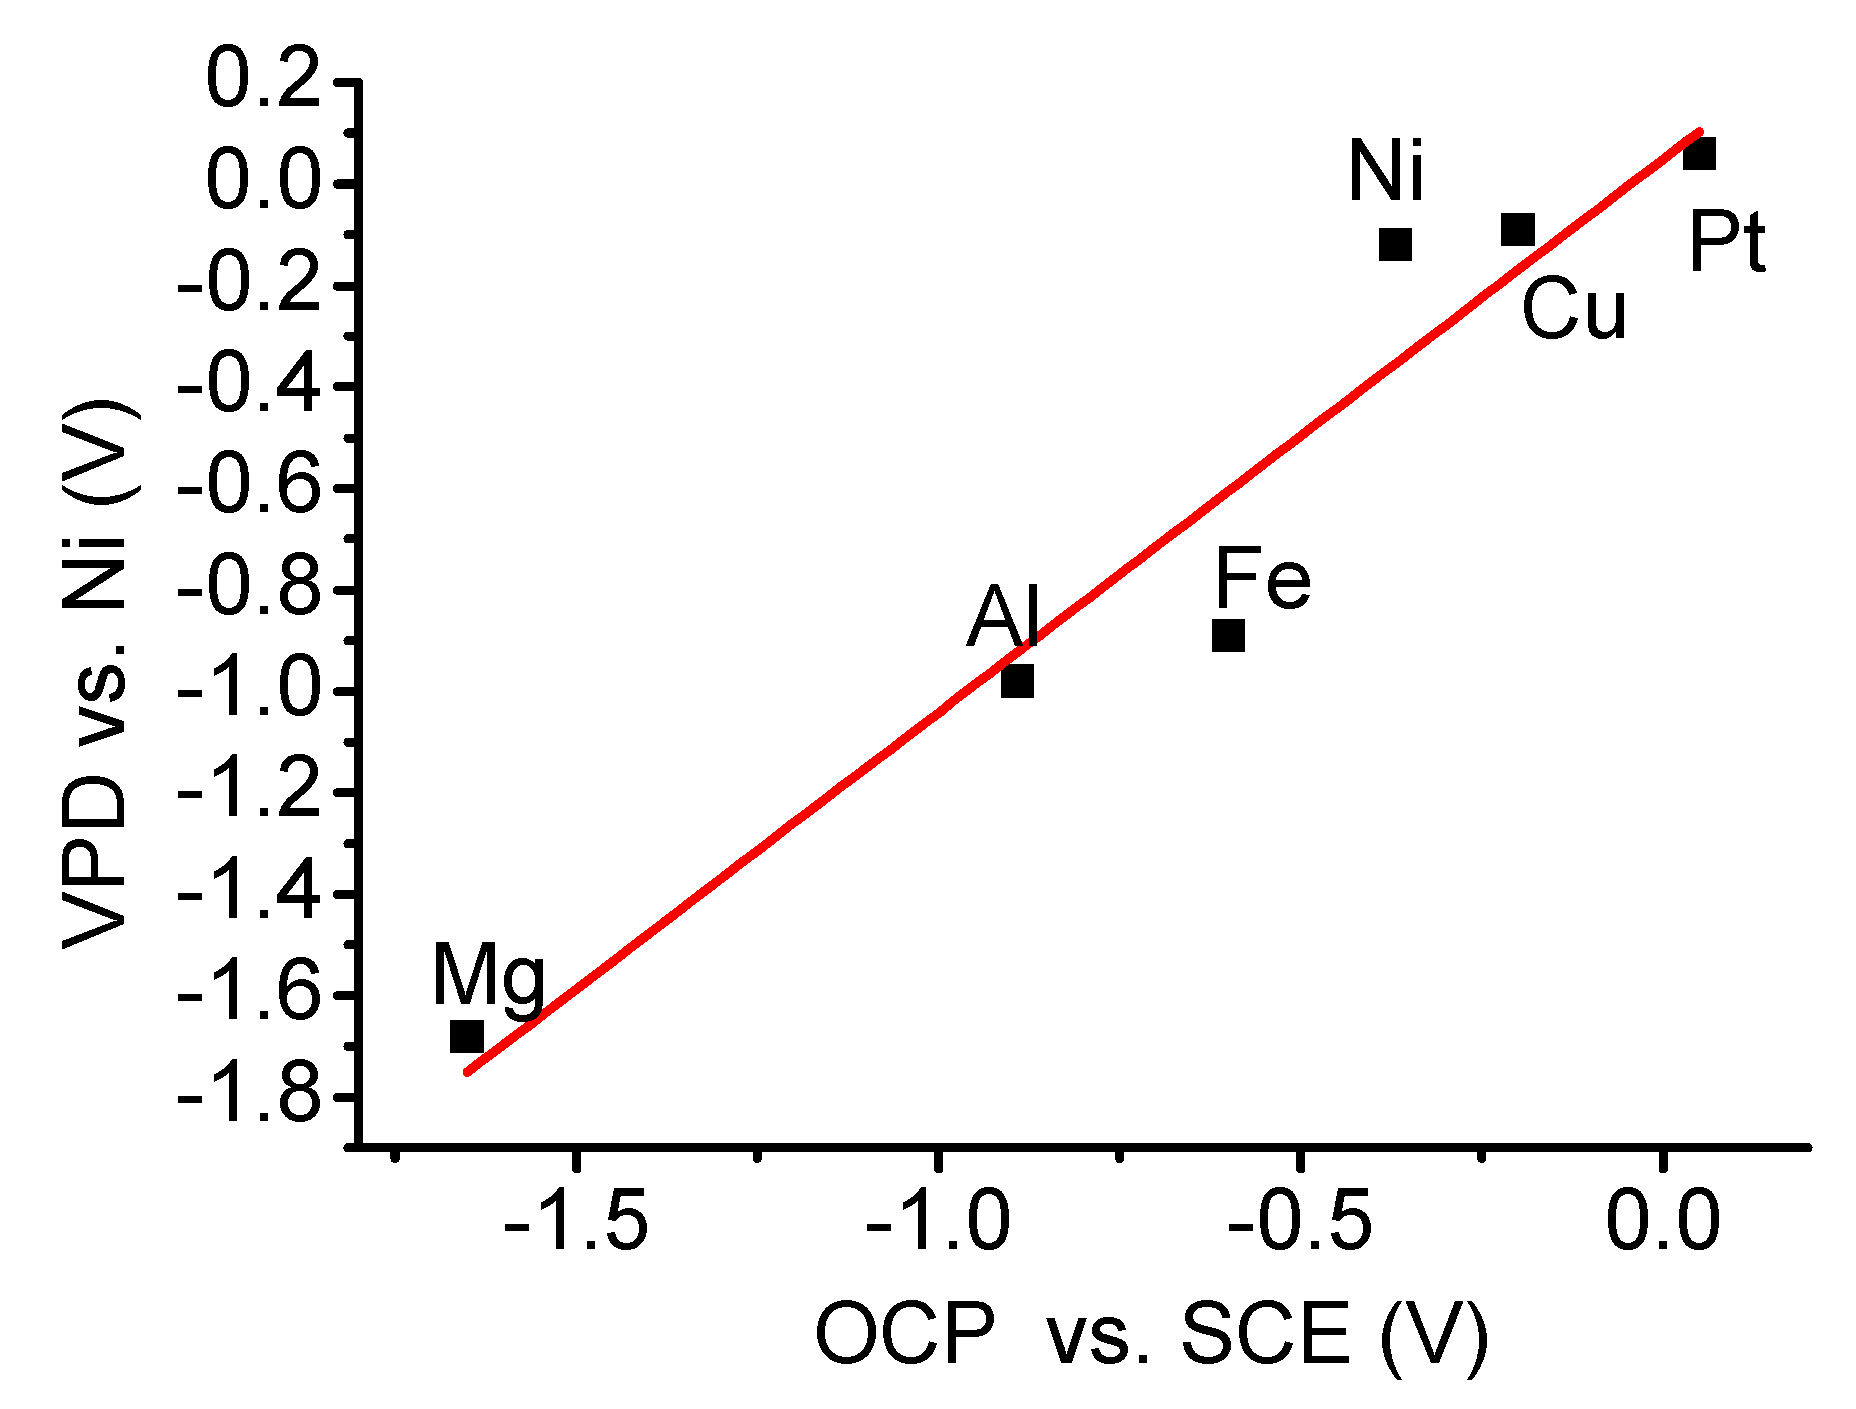
SKPFM became a useful technique in corrosion research of metallic materials due to higher resolution compared with the standard scanning Kelvin probe (SKP) technique and powerful capabilities in studies of local corrosion susceptibility of metallic materials, distribution of charge in semiconductors, and properties of organic and inorganic thin films [31]. However, in electrochemistry the corrosion potential is the relevant parameter for determining the electrochemical nobility of metals in aqueous solutions. The pioneering work of Schmutz and Frankel [55] addressed the question of how to make a correlation between the work function and the corrosion potential of a metal. They performed measurements of open circuit potential (OCP) of various metals in 0.5 NaCl solution and compared them with VPD measurements in air on the surface of the immersed metals (Figure 9). A correlation was found between VPD and OCP measurements. This result is crucial and demonstrates the powerful capabilities of SKPFM in the characterization of the susceptibility of metals and alloys to corrosion. The measured VPD values were inverted to compare the output VPD signal with the electrochemical nobility of metals which is the necessary procedure due to the specifics of the nulling technique in which the voltage is applied to the AFM tip in SKPFM measurements. The discussion concerning the polarity in SKPFM measurements can be found in [55,56]. Cook et al. employed electrolyte dosing experiments to compare SKPFM results with corrosion potential and SKP measurements [57]. They obtained a linear relationship between Volta potential measured by SKPFM and corrosion potential and Volta potential measured by SKP. Having said that, the resolution and artifacts discussed in Section 2.2 must be kept in mind when making a quantitative comparison between different small intermetallics/phases and properties of bulk macro surfaces.
In quantitative measurements of VPD it is important to employ a reference material to ensure reproducibility of results. The use of standard reference materials permits the comparison of materials with others in the scientific literature [58]. The nickel surface has been proposed as a stable and reproducible substrate to be used as a reference for calibration of the AFM tip work function [46,55]. Highly oriented pyrolytic graphite (HOPG) substrate also is a stable and reproducible reference material [59].
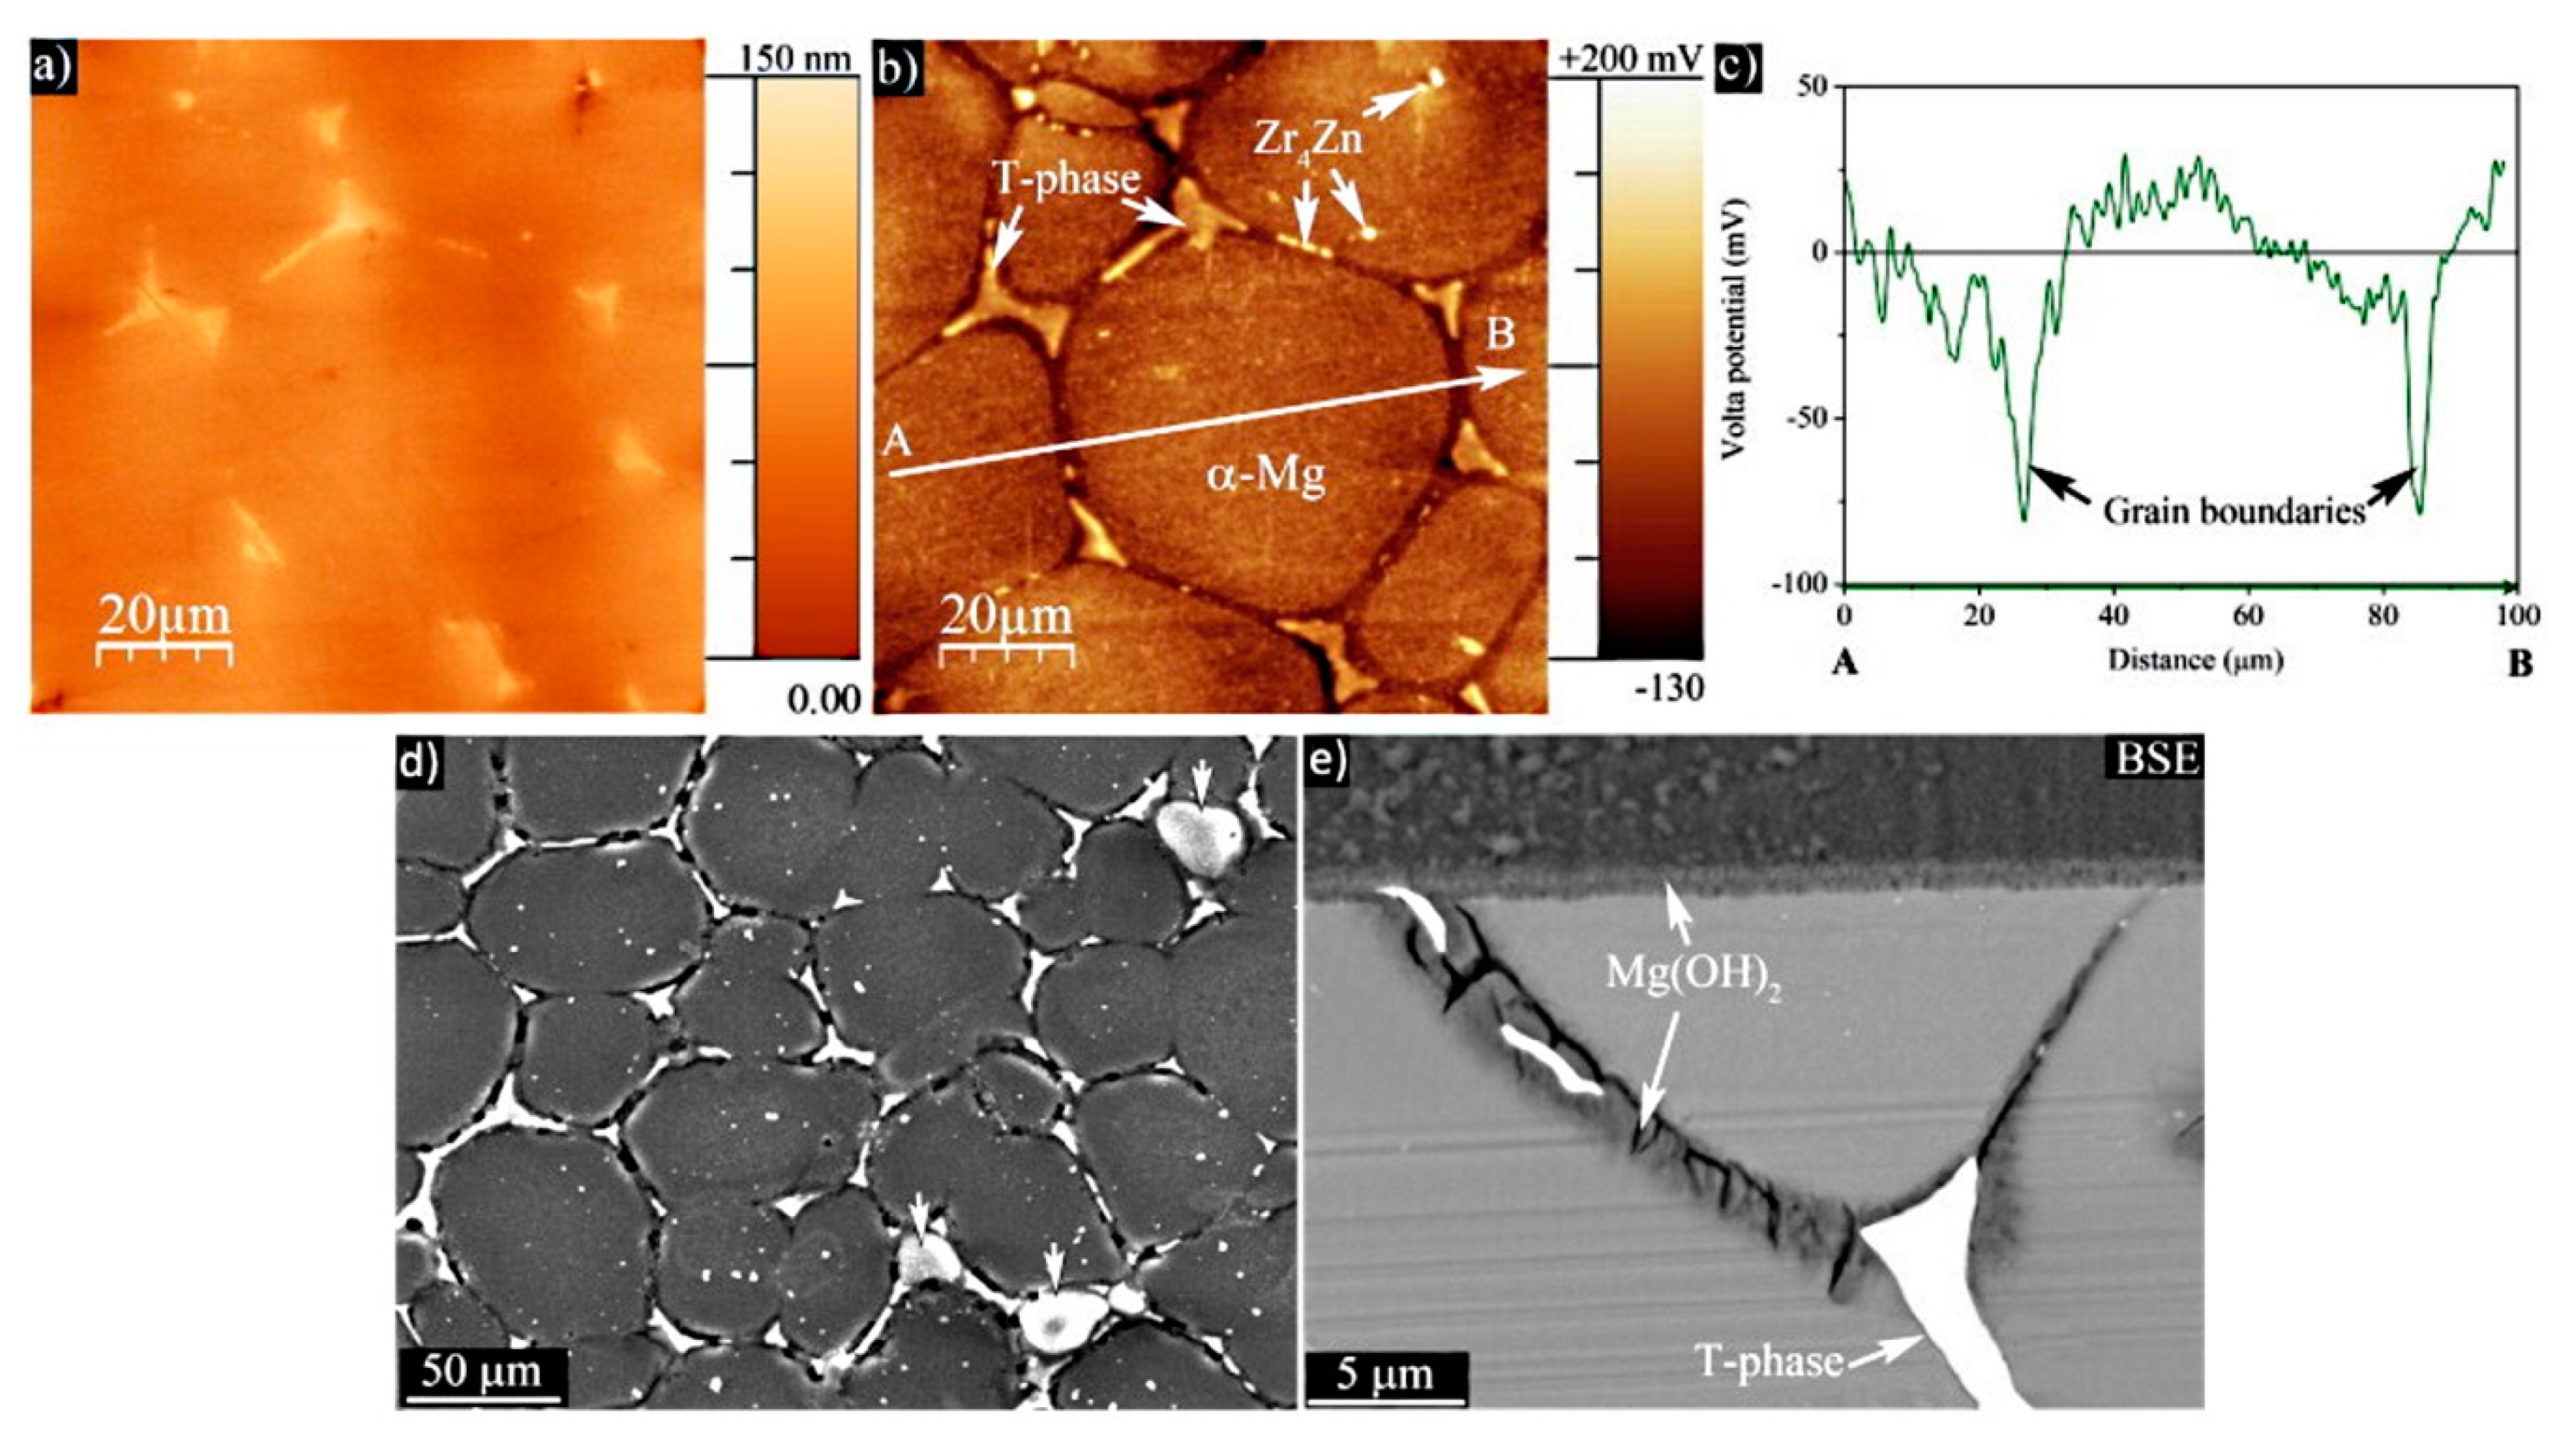
Metallic alloys contain different intermetallics and heterogeneous phases. In corrosion research the SKPFM technique has become the state of the art method for studies of microgalvanic corrosion susceptibility of intermetallics. Microgalvanic corrosion in magnesium alloys has been the subject of many research works [36,60,61,62,63,64,65,66,67]. A clear relationship was observed between the precipitation of Al-rich phases and the Volta potential. The Volta potential increased with the aluminum content in the phase. The β-Mg17Al12 phase and the Al8Mn5 phase both work as local cathodes when coupled to the magnesium phase under atmospheric weathering conditions [18]. Coy et al. made systematic measurements of VPD on the surface of four different Mg alloys such as ZE41 as-cast, WE43-T6 sand-cast, WE43-T6 wrought, and WE54-T6 wrought [62]. This work provided important insights into the relationship between the VPD measured on top of different intermetallics and the localized corrosion activity of intermetallics. Immersion tests were done in 3.5 wt% NaCl for different times from 5 to 60 min. Those micro-constituents which possess high VPD vs. the Mg matrix usually demonstrate significant microgalvanic activity. Figure 10 presents the AFM and VPD maps taken from the ZE41 sample. The largest VPD was attributed to Zr-rich (Zr4Zn) phases and T-phase (Mg7Zn3RE) which had VPD of about +180 ± 10 mV and +100 ± 5 mV respectively vs. Mg matrix (Figure 10a,b) [62]. On the contrary, grain boundaries had a lower VPD of about −80 ± 5 mV vs. Mg matrix (Figure 10c). Microstructural observations after corrosion revealed a significant localized dissolution at the grain boundaries which was intensified by T-phase (Figure 10d,e). Zr-rich phases revealed a tendency to localize pitting corrosion and more severe corrosion. WEXX alloys revealed significant cathodic activity of the Zr-rich phases with VPD reaching +250 ± 10 mV vs. Mg matrix [62]. Although Y-rich intermetallics like Mg(RE,Y) showed relatively high VPD contrast, about 50 ± 5 mV vs. Mg matrix, they did not promote galvanic corrosion during 60 min immersion in the corrosive solution [62]. This work revealed that despite relatively high VPD, some intermetallic phases do not reveal localized corrosion attack during immersion. Therefore, care must be taken when correlating the VPD level and corrosion activity of metallic phases. Studies of the localized corrosion susceptibility of alloys using SKPFM should be accompanied by an extensive microstructural analysis of the surface after corrosion.
Aluminum alloys have been one of the most studied materials by the SKPFM technique due to the diverse microstructure and high activity of the intermetallic phases in local corrosion initiation [22,46,55,68,69,70,71,72]. For example, in the work of Zhu et al. Volta potentials were measured on many different independent intermetallics in as-polished Al-Cu-Li alloy AA2070-T8 [22]. The electrochemical nobility and activity of intermetallics were assessed by DC-polarization and OCP measurements and correlated with the changes of Volta potential before and after immersion. Amongst many intermetallics, Al65Cu20Fe15 and Al37Cu2Fe12 compositions were found to be the noblest based on OCP and SKPFM measurements. The tendency to trenching between the intermetallics and the Al matrix was characterized by the higher content of copper and aluminum elements in the compositions of the intermetallics. It should be noted that the direct comparison between the OCP and electrochemical activity of intermetallics is not entirely correct, because some intermetallics (e.g., Al2Cu) may supply higher currents even though the OCP is lower than that of others [17]. However, the report by Mallinson et al. on the localized corrosion susceptibility in aluminum alloy AA7075-T6 pointed out a different trend [71]. The intermetallics such as Al12Fe3Si, (Al,Cu)6(Fe,Cu) and Al7Cu2Fe, had a similar VPD measured in air after polishing. However they revealed different localized corrosion susceptibility and corrosion current densities which increased in the range: Al12Fe3Si > (Al,Cu)6(Fe,Cu) > Al7Cu2Fe. The particle (Al,Cu)6(Fe,Cu) displayed significant sub-surface intergranular corrosion at the particle/matrix interface as well as signs of the onset of trenching.
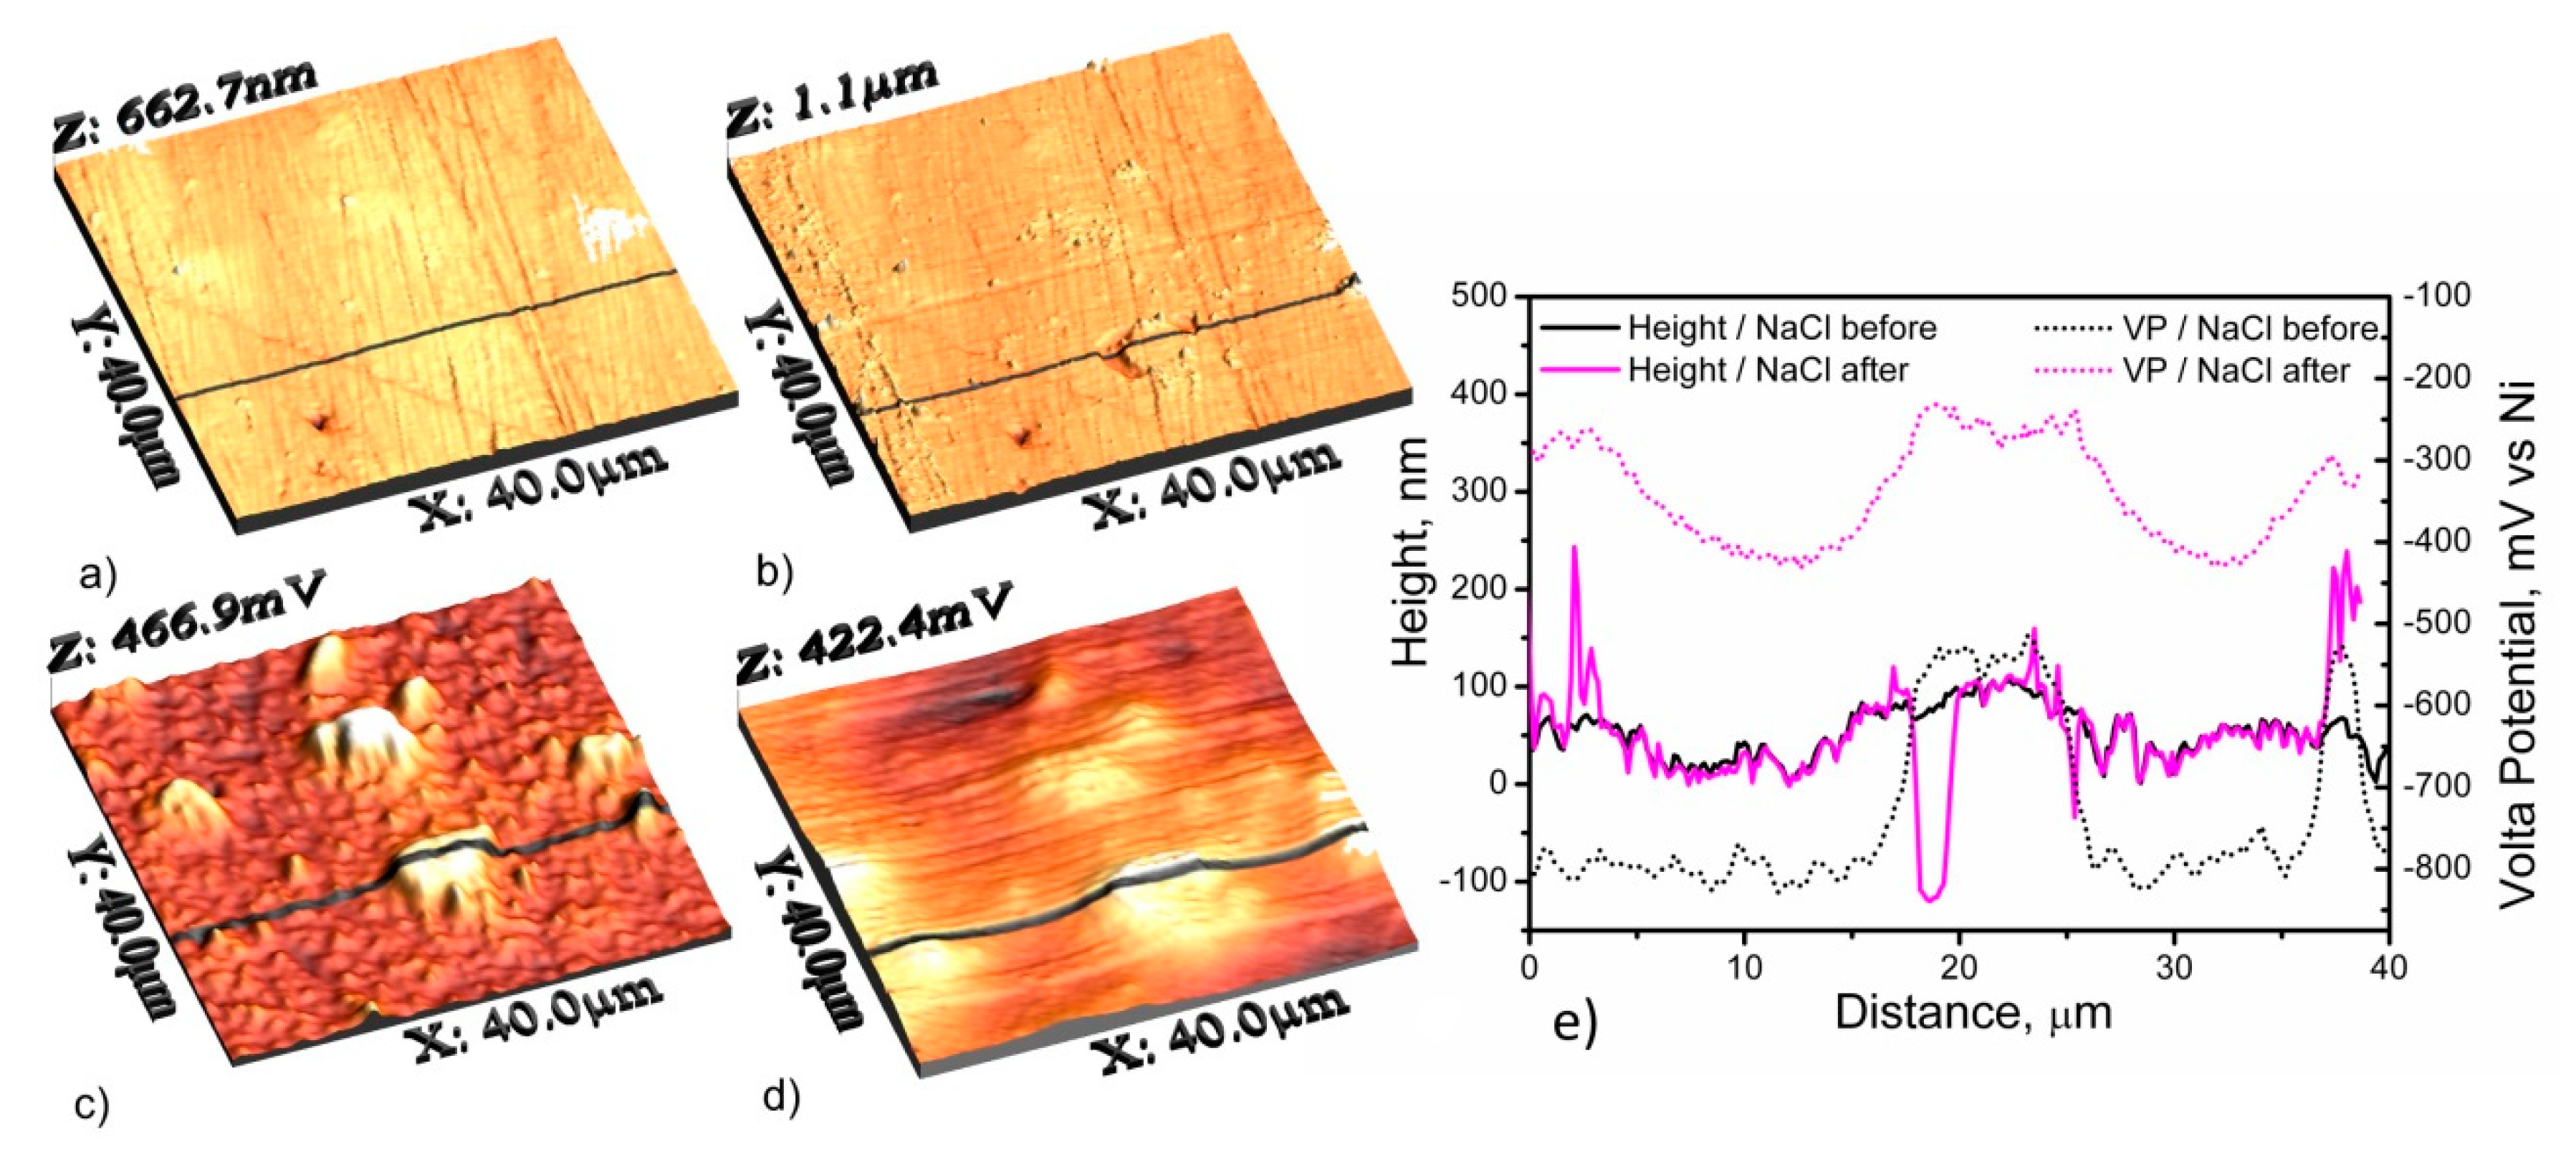
AA2024 is an aluminum alloy with copper as the main alloying element. It is considered a good model system for the investigation of localized corrosion processes and inhibition [73]. Typical abundant intermetallic particles have the following composition Al2CuMg. Such intermetallics are very susceptible to localized corrosion attack in aqueous NaCl solutions which makes them common model objects for studying corrosion susceptibility and corrosion inhibition at the micro-scale. Initially AFM images of topography and VPD show well-defined independent intermetallics that have high Volta potential vs. the Al matrix (Figure 11a,b,e). After 5 h of immersion in 0.05 M NaCl solution, trenching was evident next to the intermetallic inclusion marked with the profile (Figure 11b,e). The intermetallics displayed on the Volta potential map became less resolved with unclear borders between the intermetallics and the matrix (Figure 11c–e). The Volta potential level increased towards −200 mV vs. Ni (Figure 11e) which is a consequence of the copper redeposition process which is well-known [10,11,46,74].
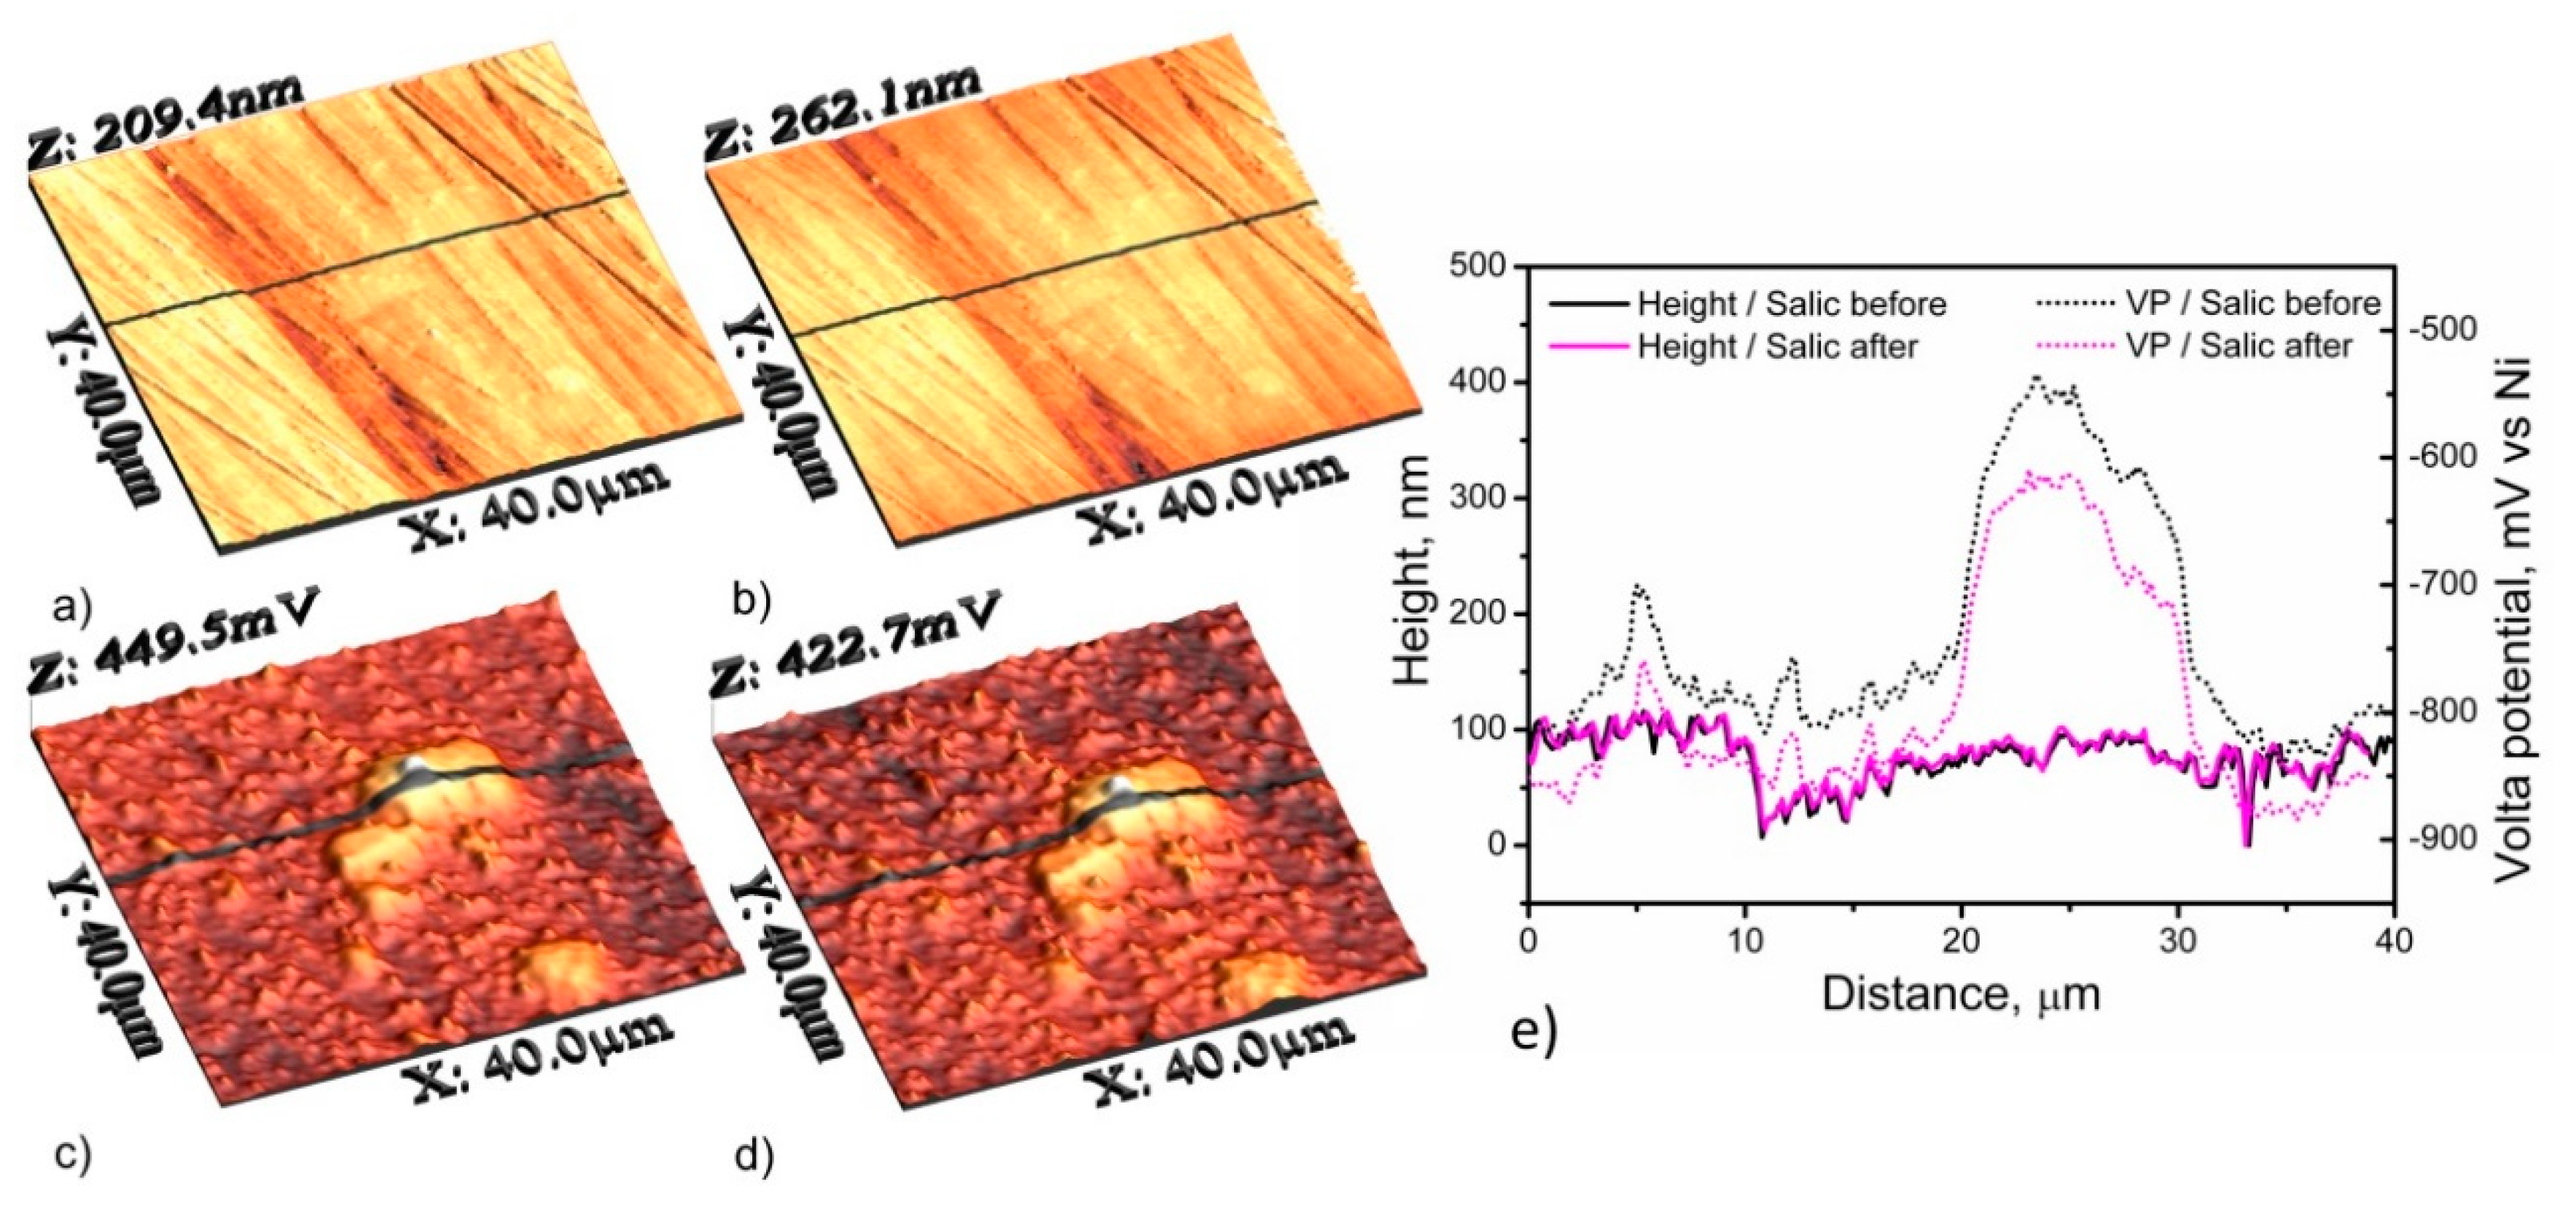
The surface of AA2024 had a completely different appearance after immersion in NaCl solution containing corrosion inhibitor. Figure 12a,b displays the initially polished surface with clearly visible intermetallics on the VPD map. The uncorroded intermetallics reveal a notably similar Volta potential (about −550 mV) compared with the previous case (Figure 11e and Figure 12e). After 5 h of immersion in a solution containing 0.5 g/L of salicylaldoxime in 0.05 M NaCl there were no substantial changes to the topography and VPD on the surface (Figure 12b,d,e). Only the VPD profile displayed an offset to lower potential values which may suggest adsorption of the inhibitor on the metallic surface (Figure 12e). The above results demonstrate a typical approach for studying the efficiency of corrosion inhibition at a local scale before and after treatment in different solutions. The depletion of the more active elements due to dealloying can be effectively measured by comparing the Volta potential difference before and after immersion.
SKPFM is capable of resolving the electrochemical activity of independent phases at the microscale and to follow the delamination processes of organic layers from metals. Rohwerder et al. applied SKPFM to study the delamination of synthetic organic layers on model gold surfaces [75]. In this paper SKPFM was proven to probe Volta potentials at the metal/coating interfaces with submicron resolution and follow the kinetics of delamination. However, such a study requires the preparation of special model samples coated with ultrathin polymer coatings, since on thick coatings it was not possible to achieve submicron resolution with SKPFM [75]. The plasma polymer was synthesized from hexamethyldisilane (HMDS) in an argon carrier gas in a microwave plasma reactor and deposited on the gold surface with a final thickness of about 100 nm. The ultrathin plasma polymer coating was proven to delaminate according to a purely cathodic delamination behavior by SKPFM and time of flight secondary mass spectrometry.
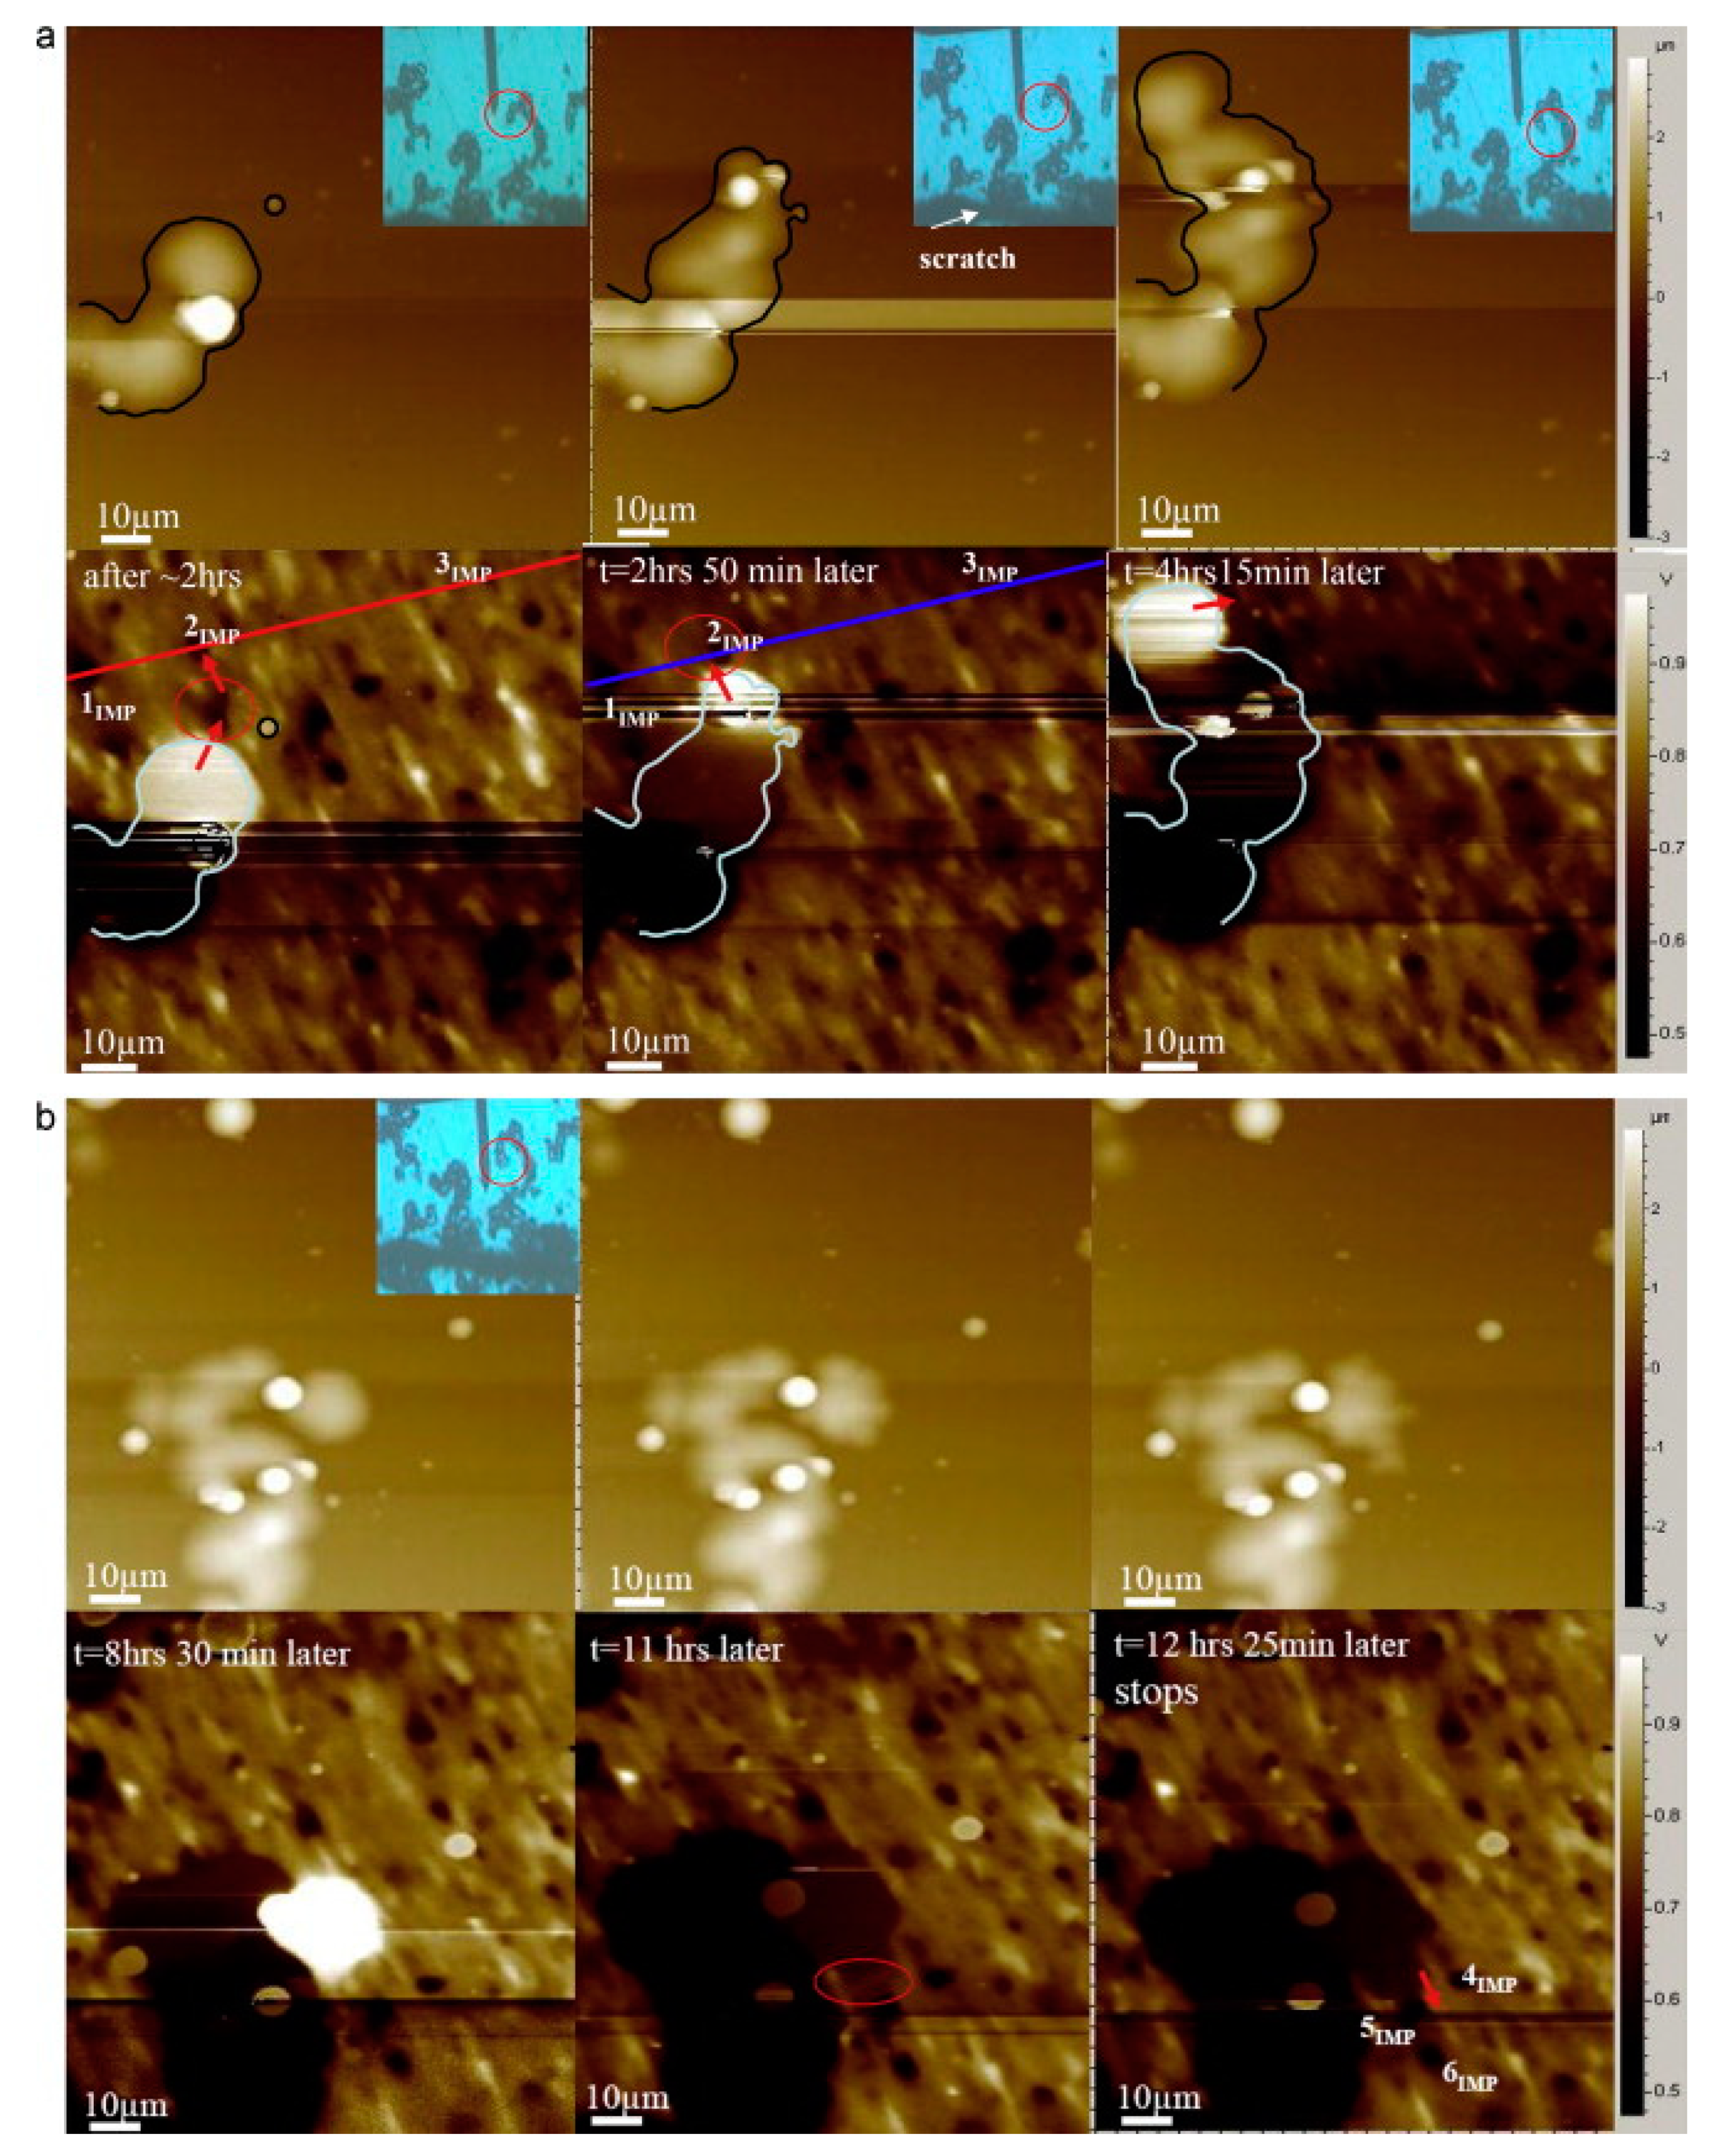
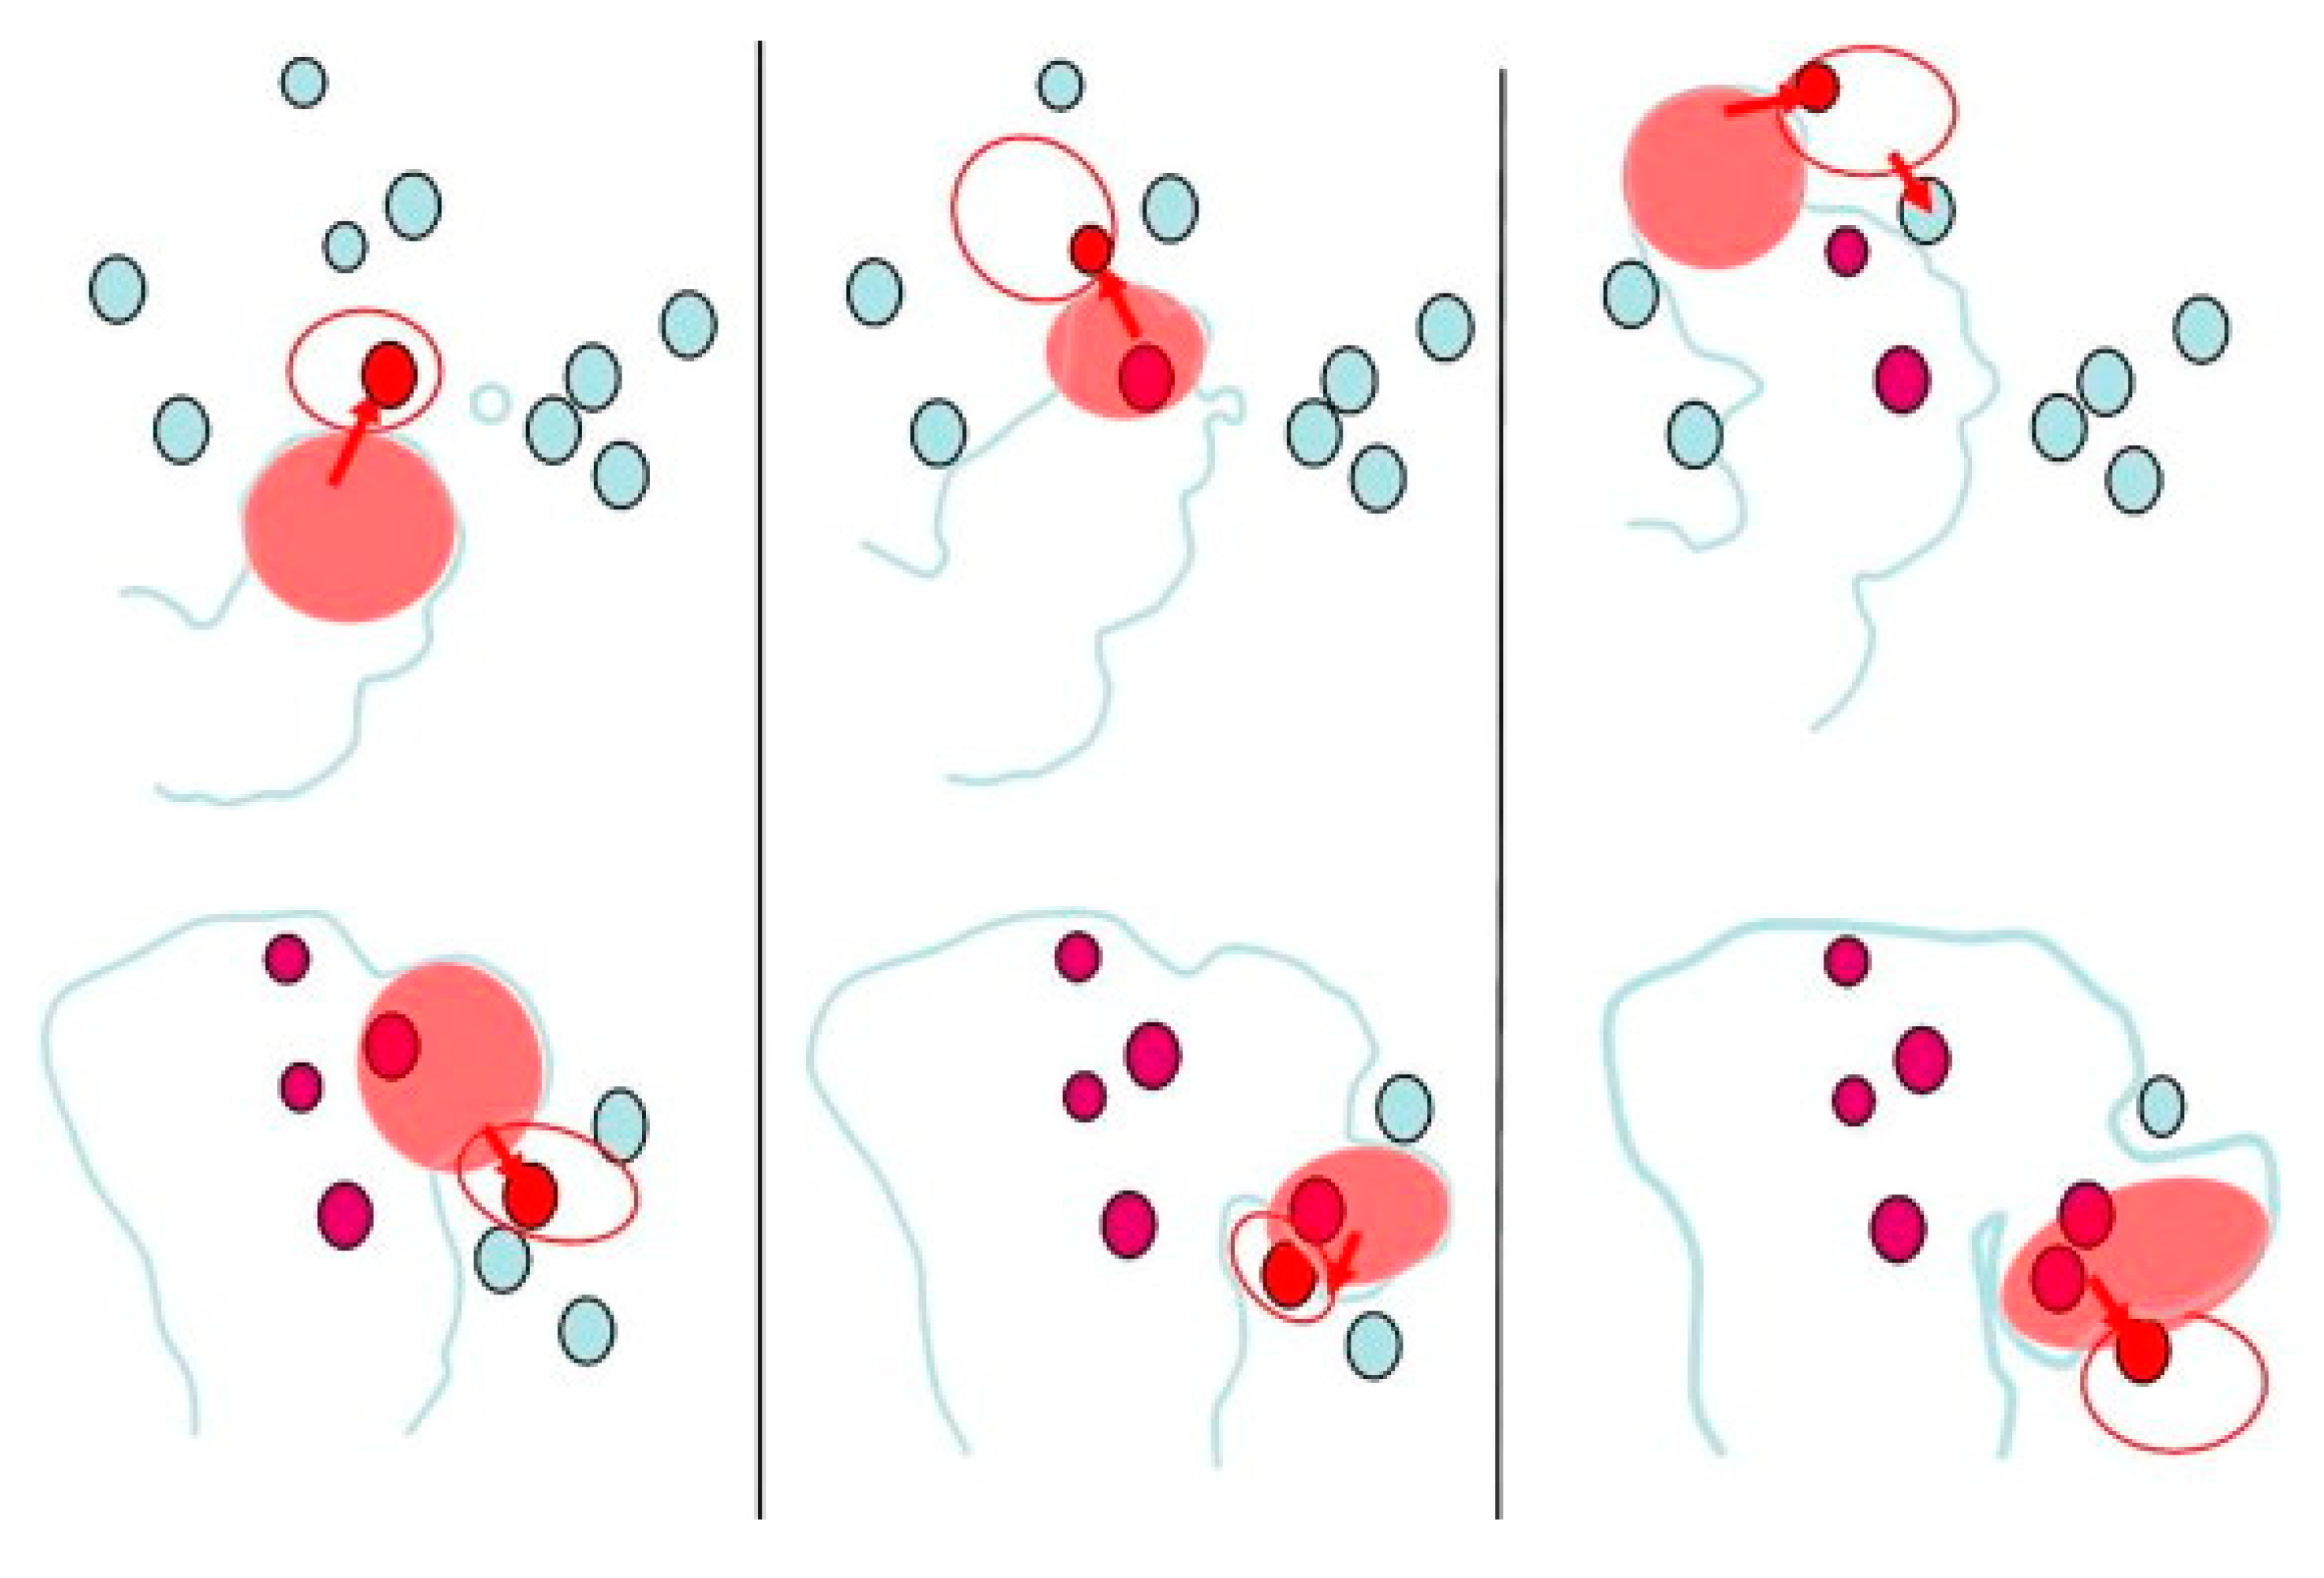
The application of the SKPFM technique to study filiform corrosion (FFC) on industrially relevant aluminum alloy AA2017-T4 was reported by Senöz and Rohwerder [69]. The aluminum alloy was artificially aged at different temperatures to study the effects of the distribution of intermetallic particles in the matrix on the development of filiform corrosion. For the deposition of organic coatings a hexamethyldisiloxane (HMDSO)–argon (80:20) precursor mixture was used. FFC was initiated by dispensing a few droplets of 1.0 M aqueous HCl along the scratch made on the coated samples. To make certain that the excess water had evaporated, the sample was held at ambient conditions for about 60 min and then was positioned in the environment chamber of SKPFM, where the relative humidity was held at ca. 85%. The as-received alloy, without any heat treatment, did not show well-defined FFC and constant propagation of localized corrosion during testing. The authors proposed that the density of intermetallics was insufficient to cause severe FFC corrosion. The alloy which was aged at 450 °C for 45 min contained the highest density of intermetallics with compositions of Al6(Si, Mn, Fe, Cu) and Al2Cu in the matrix. Figure 13 shows AFM images and SKPFM maps of the Volta potential acquired from the coated sample in places of filiform corrosion attack. Intermetallics appear as darker spots on the VPD images. Similarly, the filaments display cathodic dark parts and anodic bright parts as is clearly shown on images at 2 h and 4 h 15 min (Figure 13). Part (a) of the Figure shows that the filament proceeds in jumps towards the cathodic intermetallics indicated on the images. In part (b) the activity of the filament seems to decrease but the head seems to continue, slowly creeping towards the intermetallic marked with red circles (Figure 13b). Figure 14 displays the mechanism of filiform corrosion development. The active head “jumps” towards the cathodically active intermetallics. The authors suggested that the cathodic activity at the intermetallics weakens the bonds between the coating and the metal, thus letting the anodic head easily propagate along with the weakened interface.
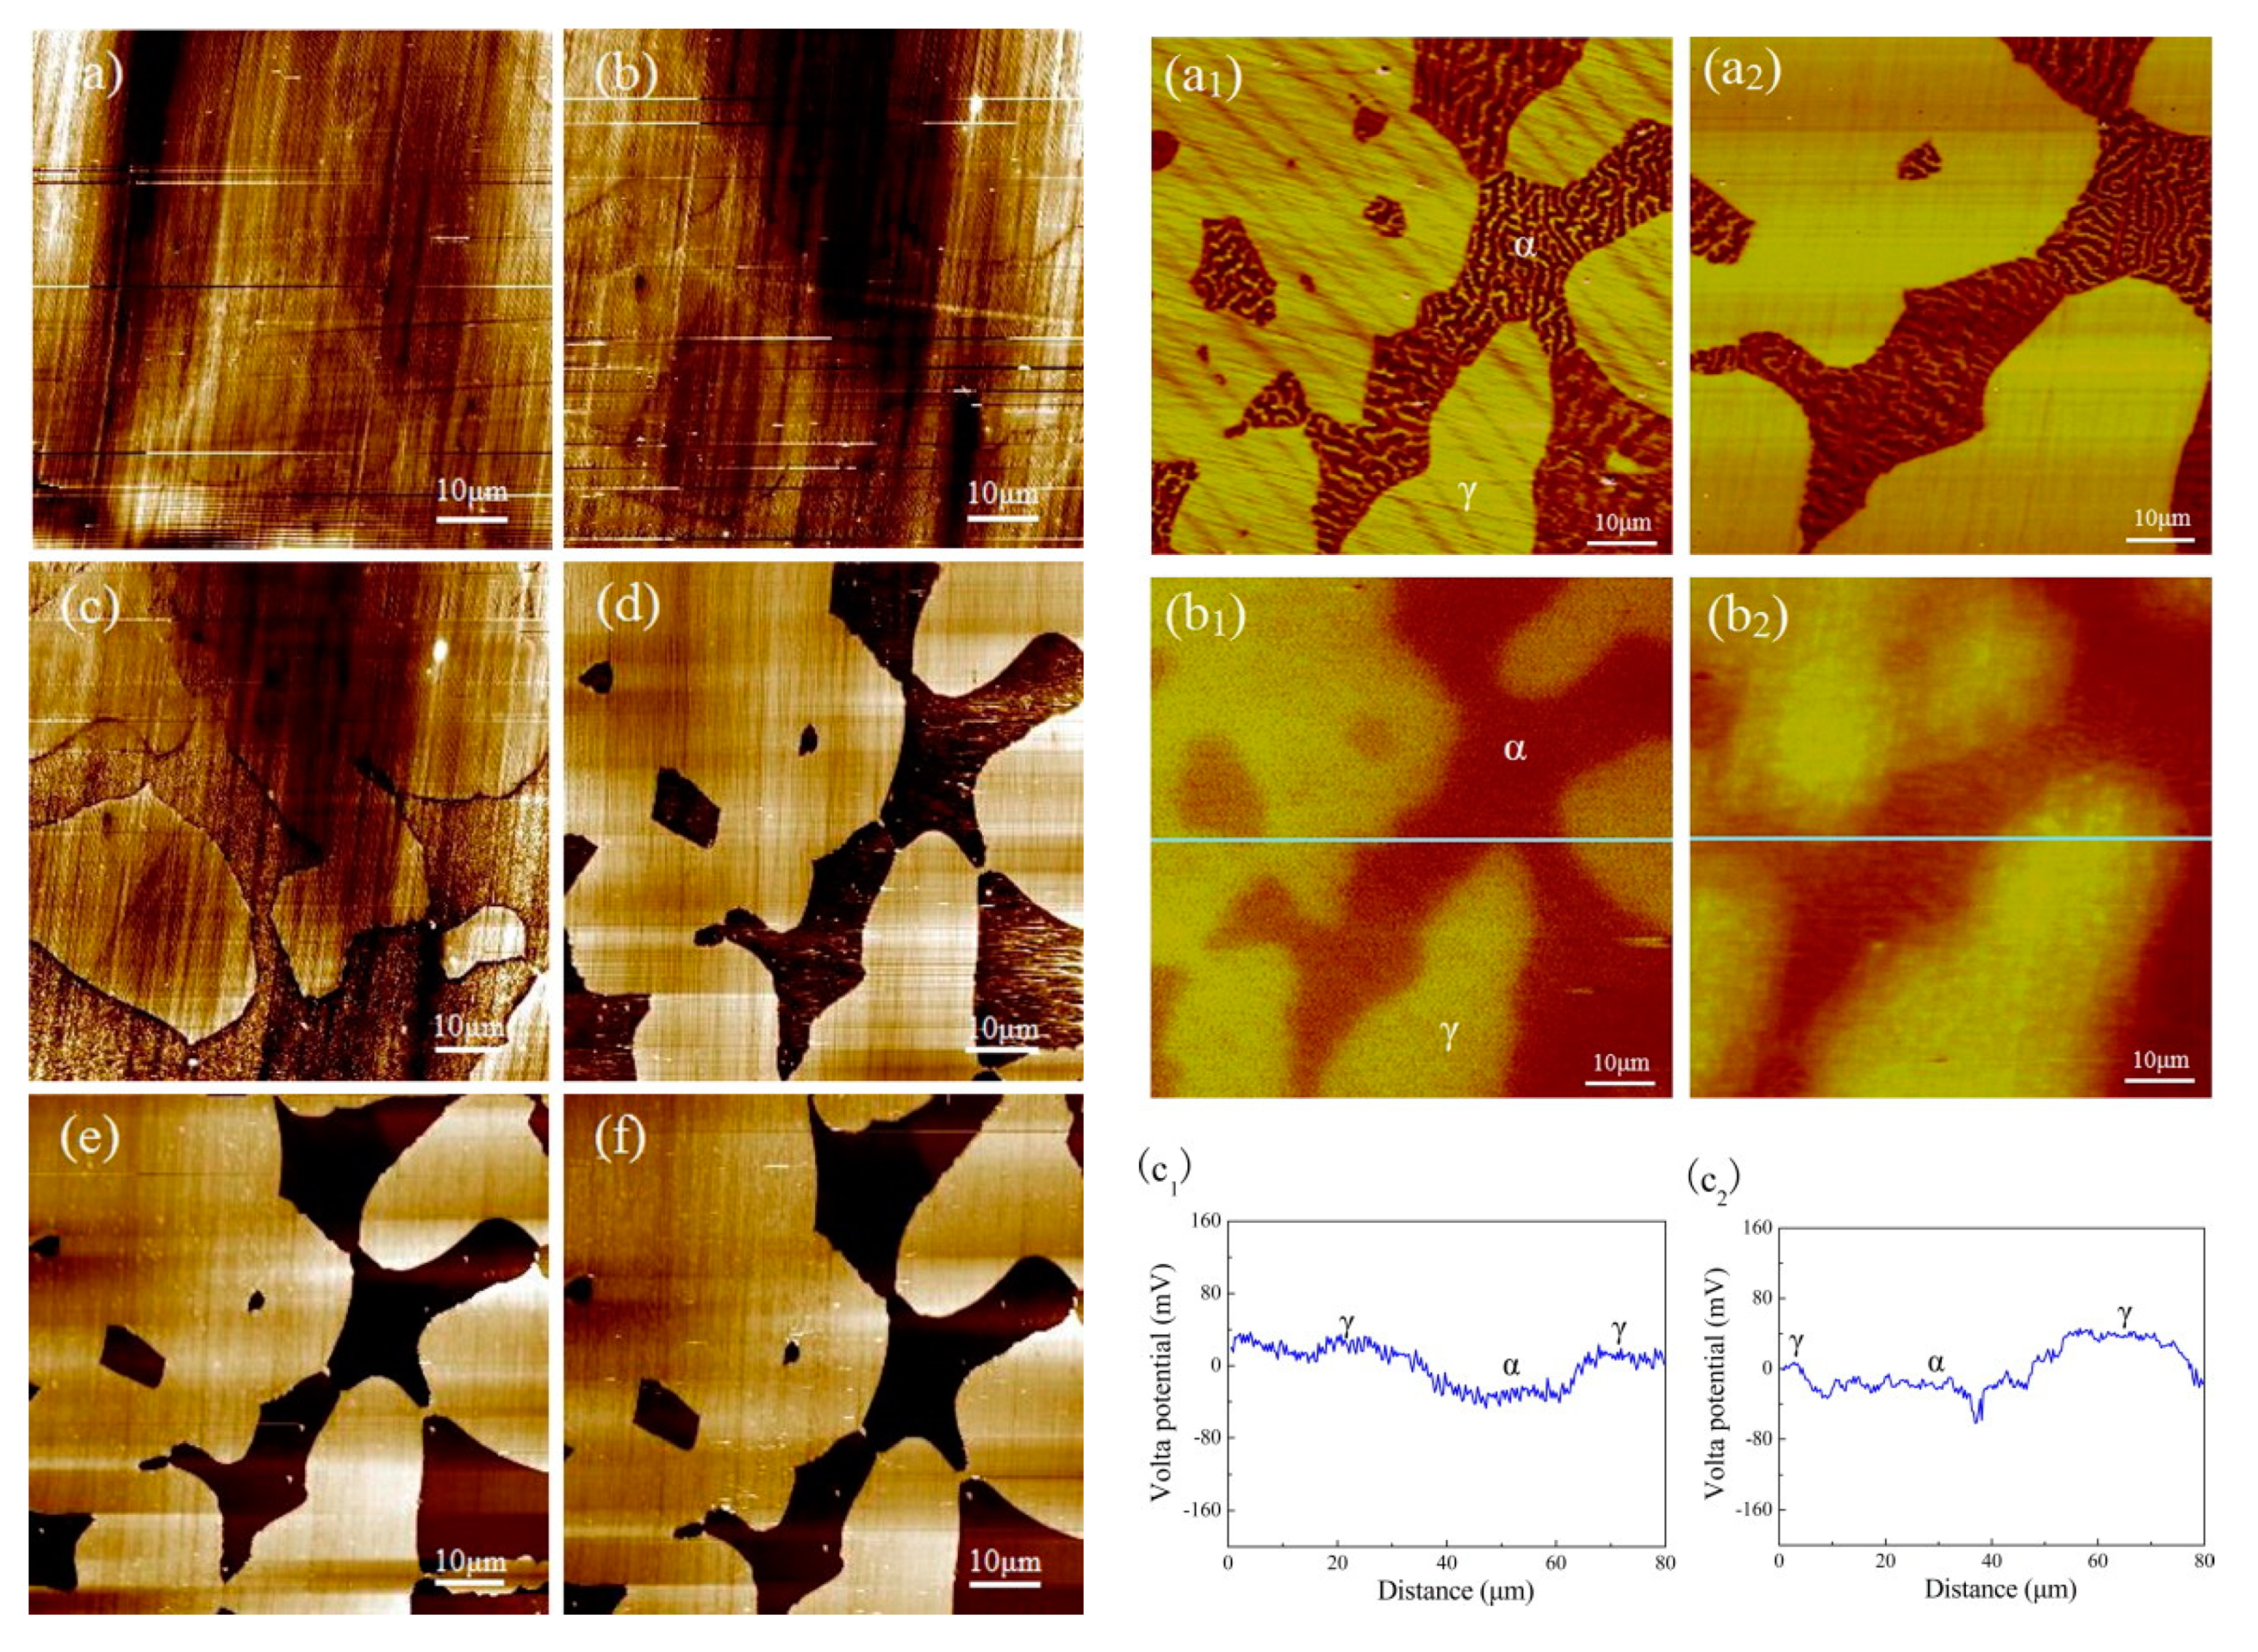
In another example the effects of annealing temperature on the microstructure and corrosion behavior of duplex stainless steel 2507 were investigated employing various techniques including AFM, magnetic force microscopy (MFM), and SKPFM [76]. The as-polished steel exhibited ferrite phase (α) and austenite phase (γ) which is seen in Figure 15(a1). With the rise of the annealing temperature the volume fraction of the austenite phase decreased and that of the ferrite phase increased (Figure 15(a2)). Before the annealing treatment, the average Volta potential difference was 65 mV between the austenite–ferrite phases. After the annealing treatment VPD between the ferrite and austenite phases increased and then decreased with temperature: 1050 °C 110 mV (Figure 15(b1,b2)), 1100 °C 210 mV, 1150 °C 80 mV. Figure 15a–f shows the in situ AFM images of the surface topography for the steel samples annealed at 1050 °C during immersion in 0.3 M hydrochloric acid solution. Unlike the case of the austenite phase, the ferrite was susceptible to dissolution. The corrosion rate measurements revealed that the sample annealed at 1100 °C had the highest corrosion depth and the greatest weight loss in the ferrite phase, which means that it had the highest corrosion rate. On the contrary, the sample annealed at 1150 °C had the lowest corrosion rate. The greatest VPD difference between the ferrite and austenite phases was observed in the sample annealed at 1100 °C due to the highest difference in nickel content in the two phases. This observation was supported by the highest susceptibility to corrosion of the ferrite phase according to in situ AFM experiments and the highest corrosion rate determined by weight loss analysis.
5. In Situ Corrosion Investigation by EC-AFM
Electrochemical Atomic Force Microscopy (EC-AFM) has the capabilities to study electrode–electrolyte interfaces at equilibrium and non-equilibrium electrode potential conditions. The method has found wide applications in material science [77], biological science [78], physical [79], and chemistry [80]. In corrosion research EC-AFM is mainly applied to metallic electrodes and conductive coatings [42]. Essentially EC-AFM operates following the principles of AFM described in Section 2.1. All operating modes such as contact, semi-contact, and non-contact modes can be used in EC-AFM measurements. However, it is important to assess whether the selected mode is acceptable to study the metallic surface at the selected electrochemical conditions in a corrosive electrolyte.
For example, polyaniline (PANI) coatings have been the subject of research in studies of corrosion protection of different metallic materials [81,82]. Electrochemical mechanisms of solvent-borne alkyd composite coating containing 1.0 wt% polyaniline (PANI) and 1.0 wt% CeO2 nanoparticles (NPs) were studied for carbon steel in 3.0 wt% NaCl solution [81]. The results of EC-AFM combined with cyclic voltammetry (CV) demonstrated a volume change of the PANI NPs upon reduction and oxidation at applied potentials on the coating. Alkyd coatings with 1 wt% p-toluene sulfonic acid (PTSA) doped PANI were prepared and the mechanisms of electrochemical activity and self-healing properties of the composite coating were investigated by EC-AFM [82]. The results revealed high electrochemical activity of the doped PANI in the composite coating as well as reversible redox reactions between the emeraldine salt (ES) and leuco emeraldine base (LB) forms.
Metallic electrodes undergo surface changes during electrochemical polarization in different electrolytes and are typical subjects of EC-AFM research. For instance, a platinum catalyst undergoes a complex deterioration process during its operation as a cathode in a proton exchange membrane fuel cell [83]. By using in situ electrochemical atomic force microscopy (EC-AFM) with super-sharp probes, Khalakhan et al. quantitatively described the roughening of platinum thin films by analyzing the height–height correlation functions (HHCFs) computed from AFM images during electrochemical cycling voltammetry (CV) to different upper potentials (EU). The results showed that at a critical upper potential EU = 1.0 V the surface of the Pt film did not change significantly. When EU increased to 1.3 V and 1.5 V the Pt morphology evolved significantly with the number of cycles [83]. The corrosion processes of AA2024 were analyzed via the combined approach employing Raman spectroscopy and EC-AFM [84]. To get a deeper insight into the morphology changes, a three-electrode in situ electrochemical AFM cell was constructed and chronocoulometric charging of AA2024 was performed in time steps of 10 s. The impact of this charging was reflected in AFM topography images and extracted parameters such as surface roughness Sq and kurtosis Sku. The results of in situ measurements revealed a gradual increase in the surface roughness and dynamics of the formation of the passivation layer [84]. In this example the researchers paid attention to the fact that the tapping mode was more beneficial since it did not disturb the formed corrosion product film on the surface. Shi et al. employed in situ EC-AFM to investigate the localized corrosion of the AlxCoCrFeNi high-entropy alloys (HEAs) [85]. Surface topography changes on the micro/sub-micron scale were monitored at different applied anodizing potentials in 3.5 wt% NaCl solution. Due to the microstructural variations in the AlxCoCrFeNi HEAs, localized corrosion processes started after the breakdown of the passive film and changed from pitting to phase boundary corrosion at higher content of Al in the alloys [85].
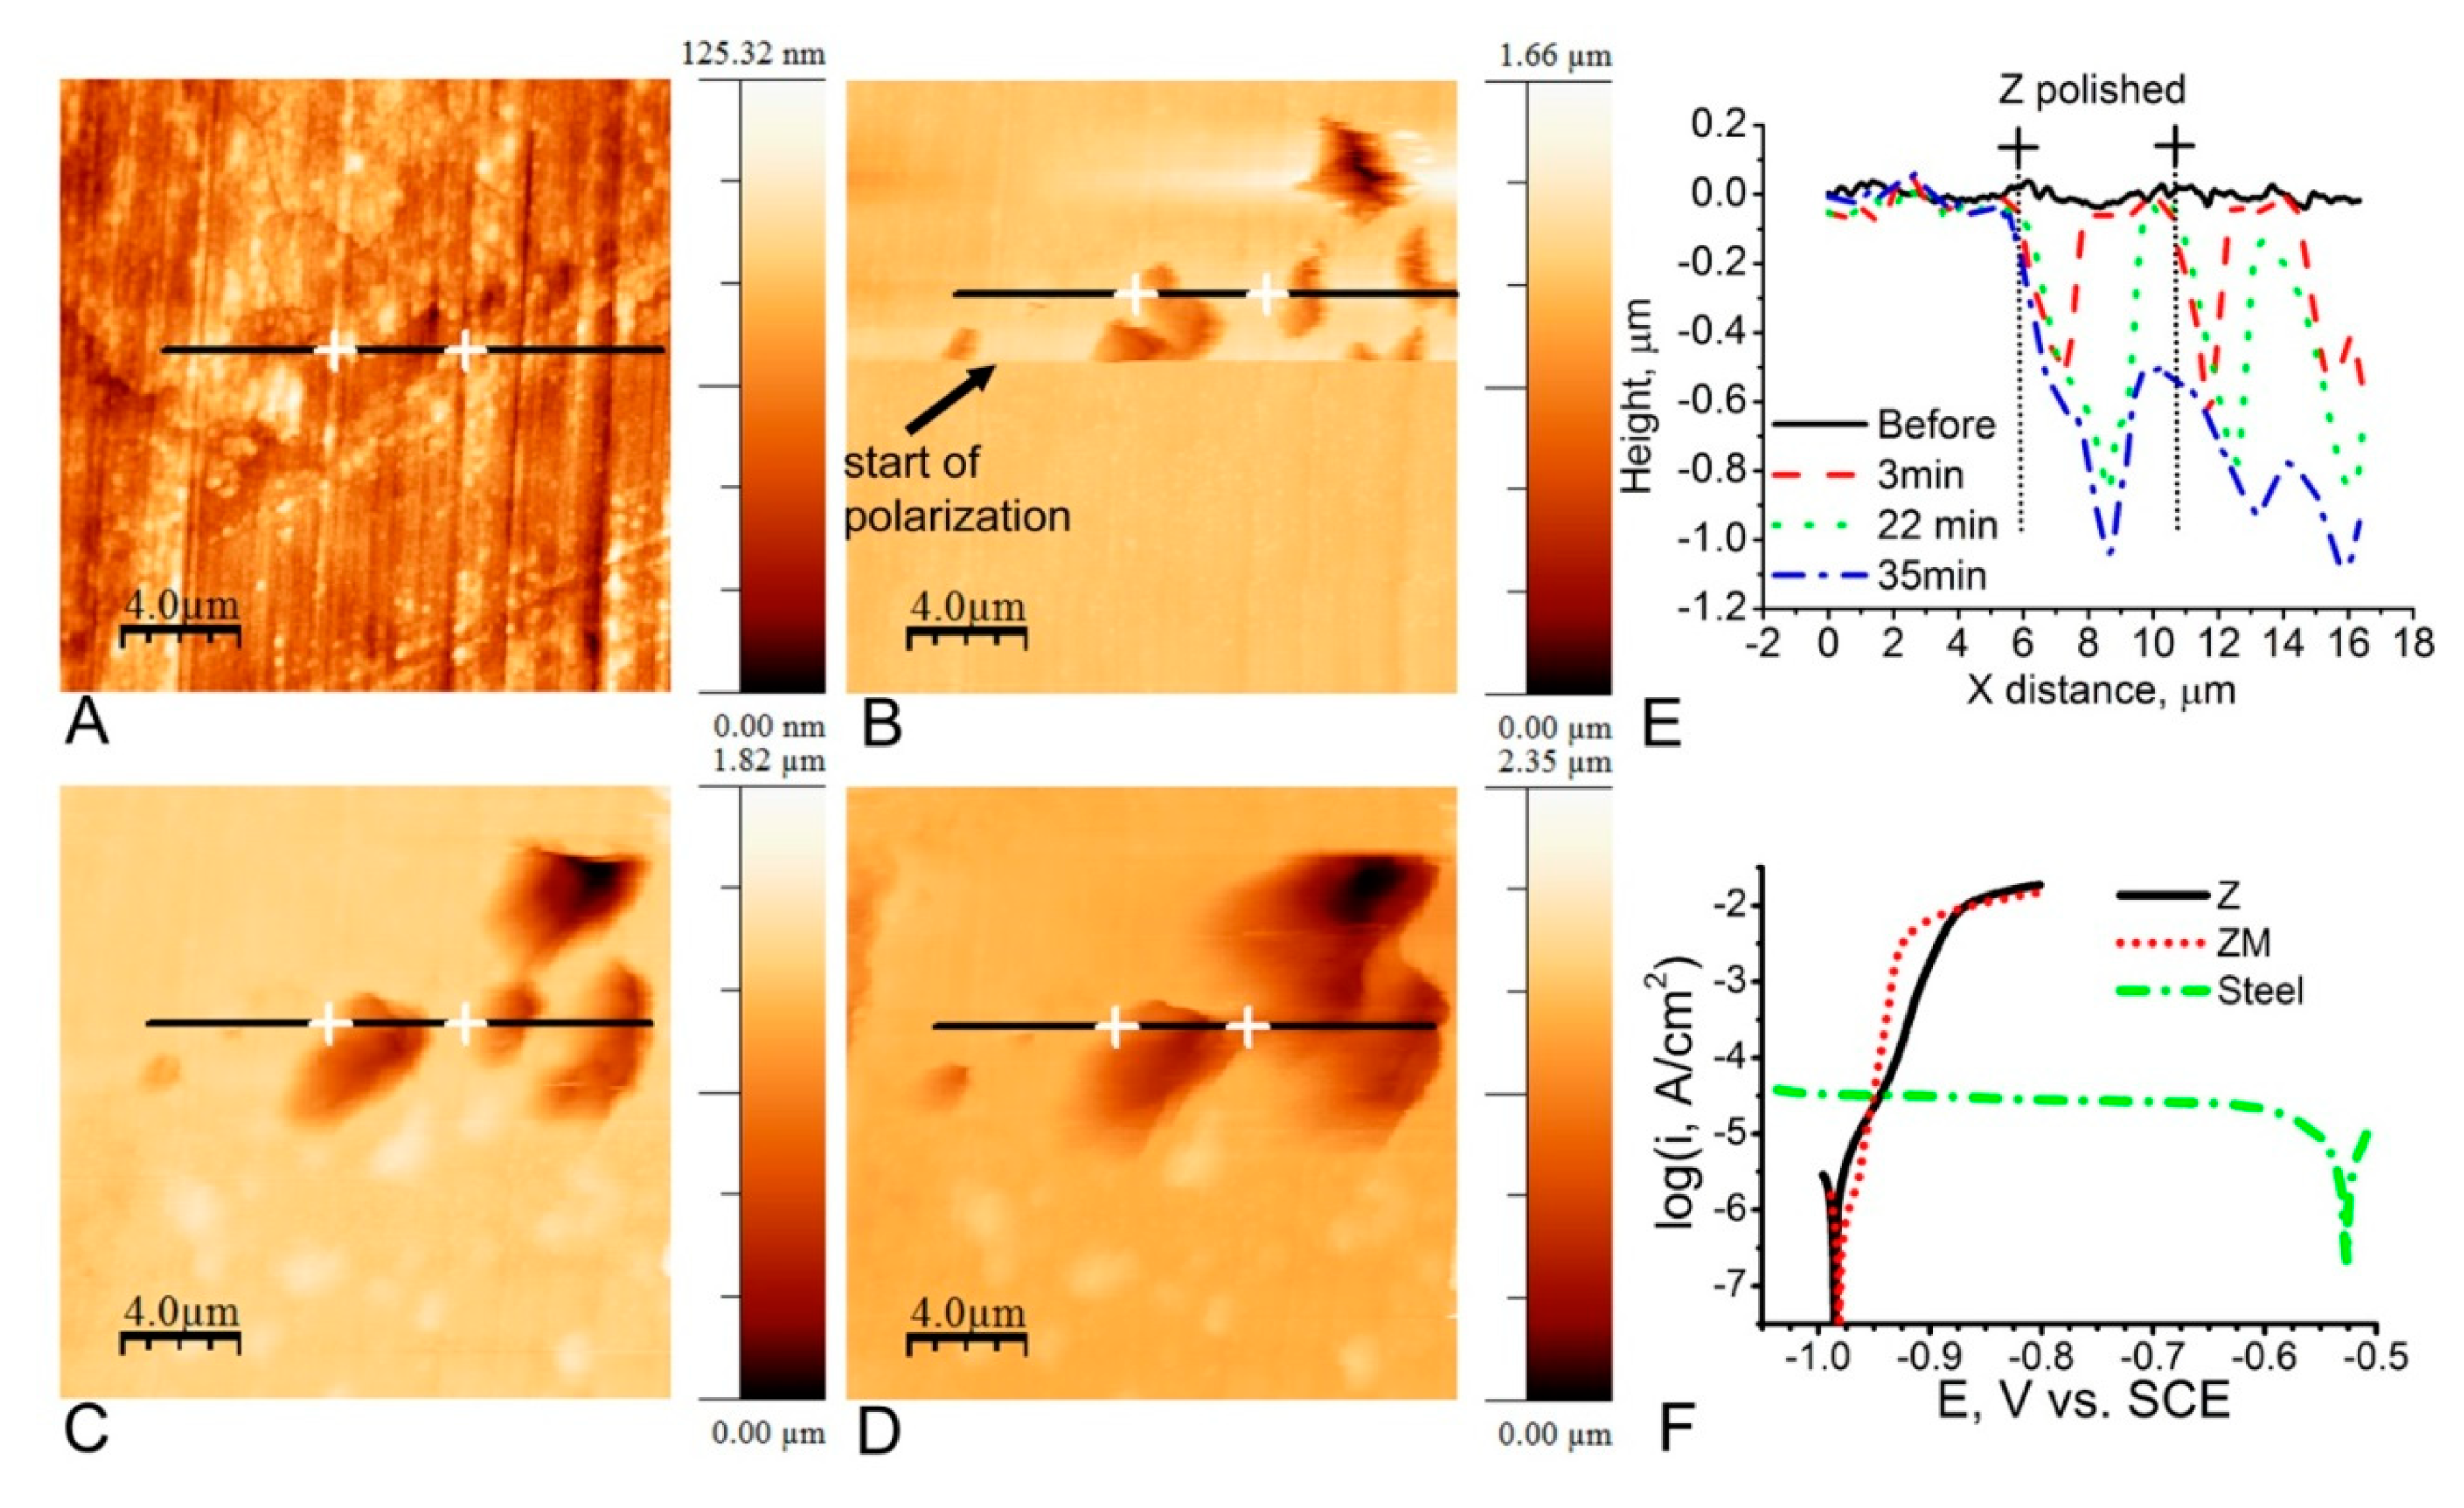
Pitting and general corrosion are typical corrosion attacks found on many metallic materials. Initial stages of localized corrosion of model Zn (Z) and Zn-Al-Mg (ZM) galvanized coatings have been studied in 0.005 M NaCl to get a better insight into the mechanisms of localized corrosion at galvanized steel cut-edges [86]. To promote anodic dissolution of the galvanized coatings, a potential of +40 mV vs. the corrosion potential of the sample was applied. This potential difference was similar to the polarization of zinc coatings by steel as follows from the polarization measurements presented in (Figure 16F). Figure 16 shows the topography of the Z sample before (Figure 16B) and during the polarization (Figure 16B–D). The black line profiles are drawn across the same place. The arrow indicated in Figure 16B shows the moment during the scan, going from the bottom to the top, when the polarization started. The upper AFM image reveals immediate localized pitting corrosion of the Z surface. During immersion, the local pits grow deeper into the zinc surface (Figure 16E).
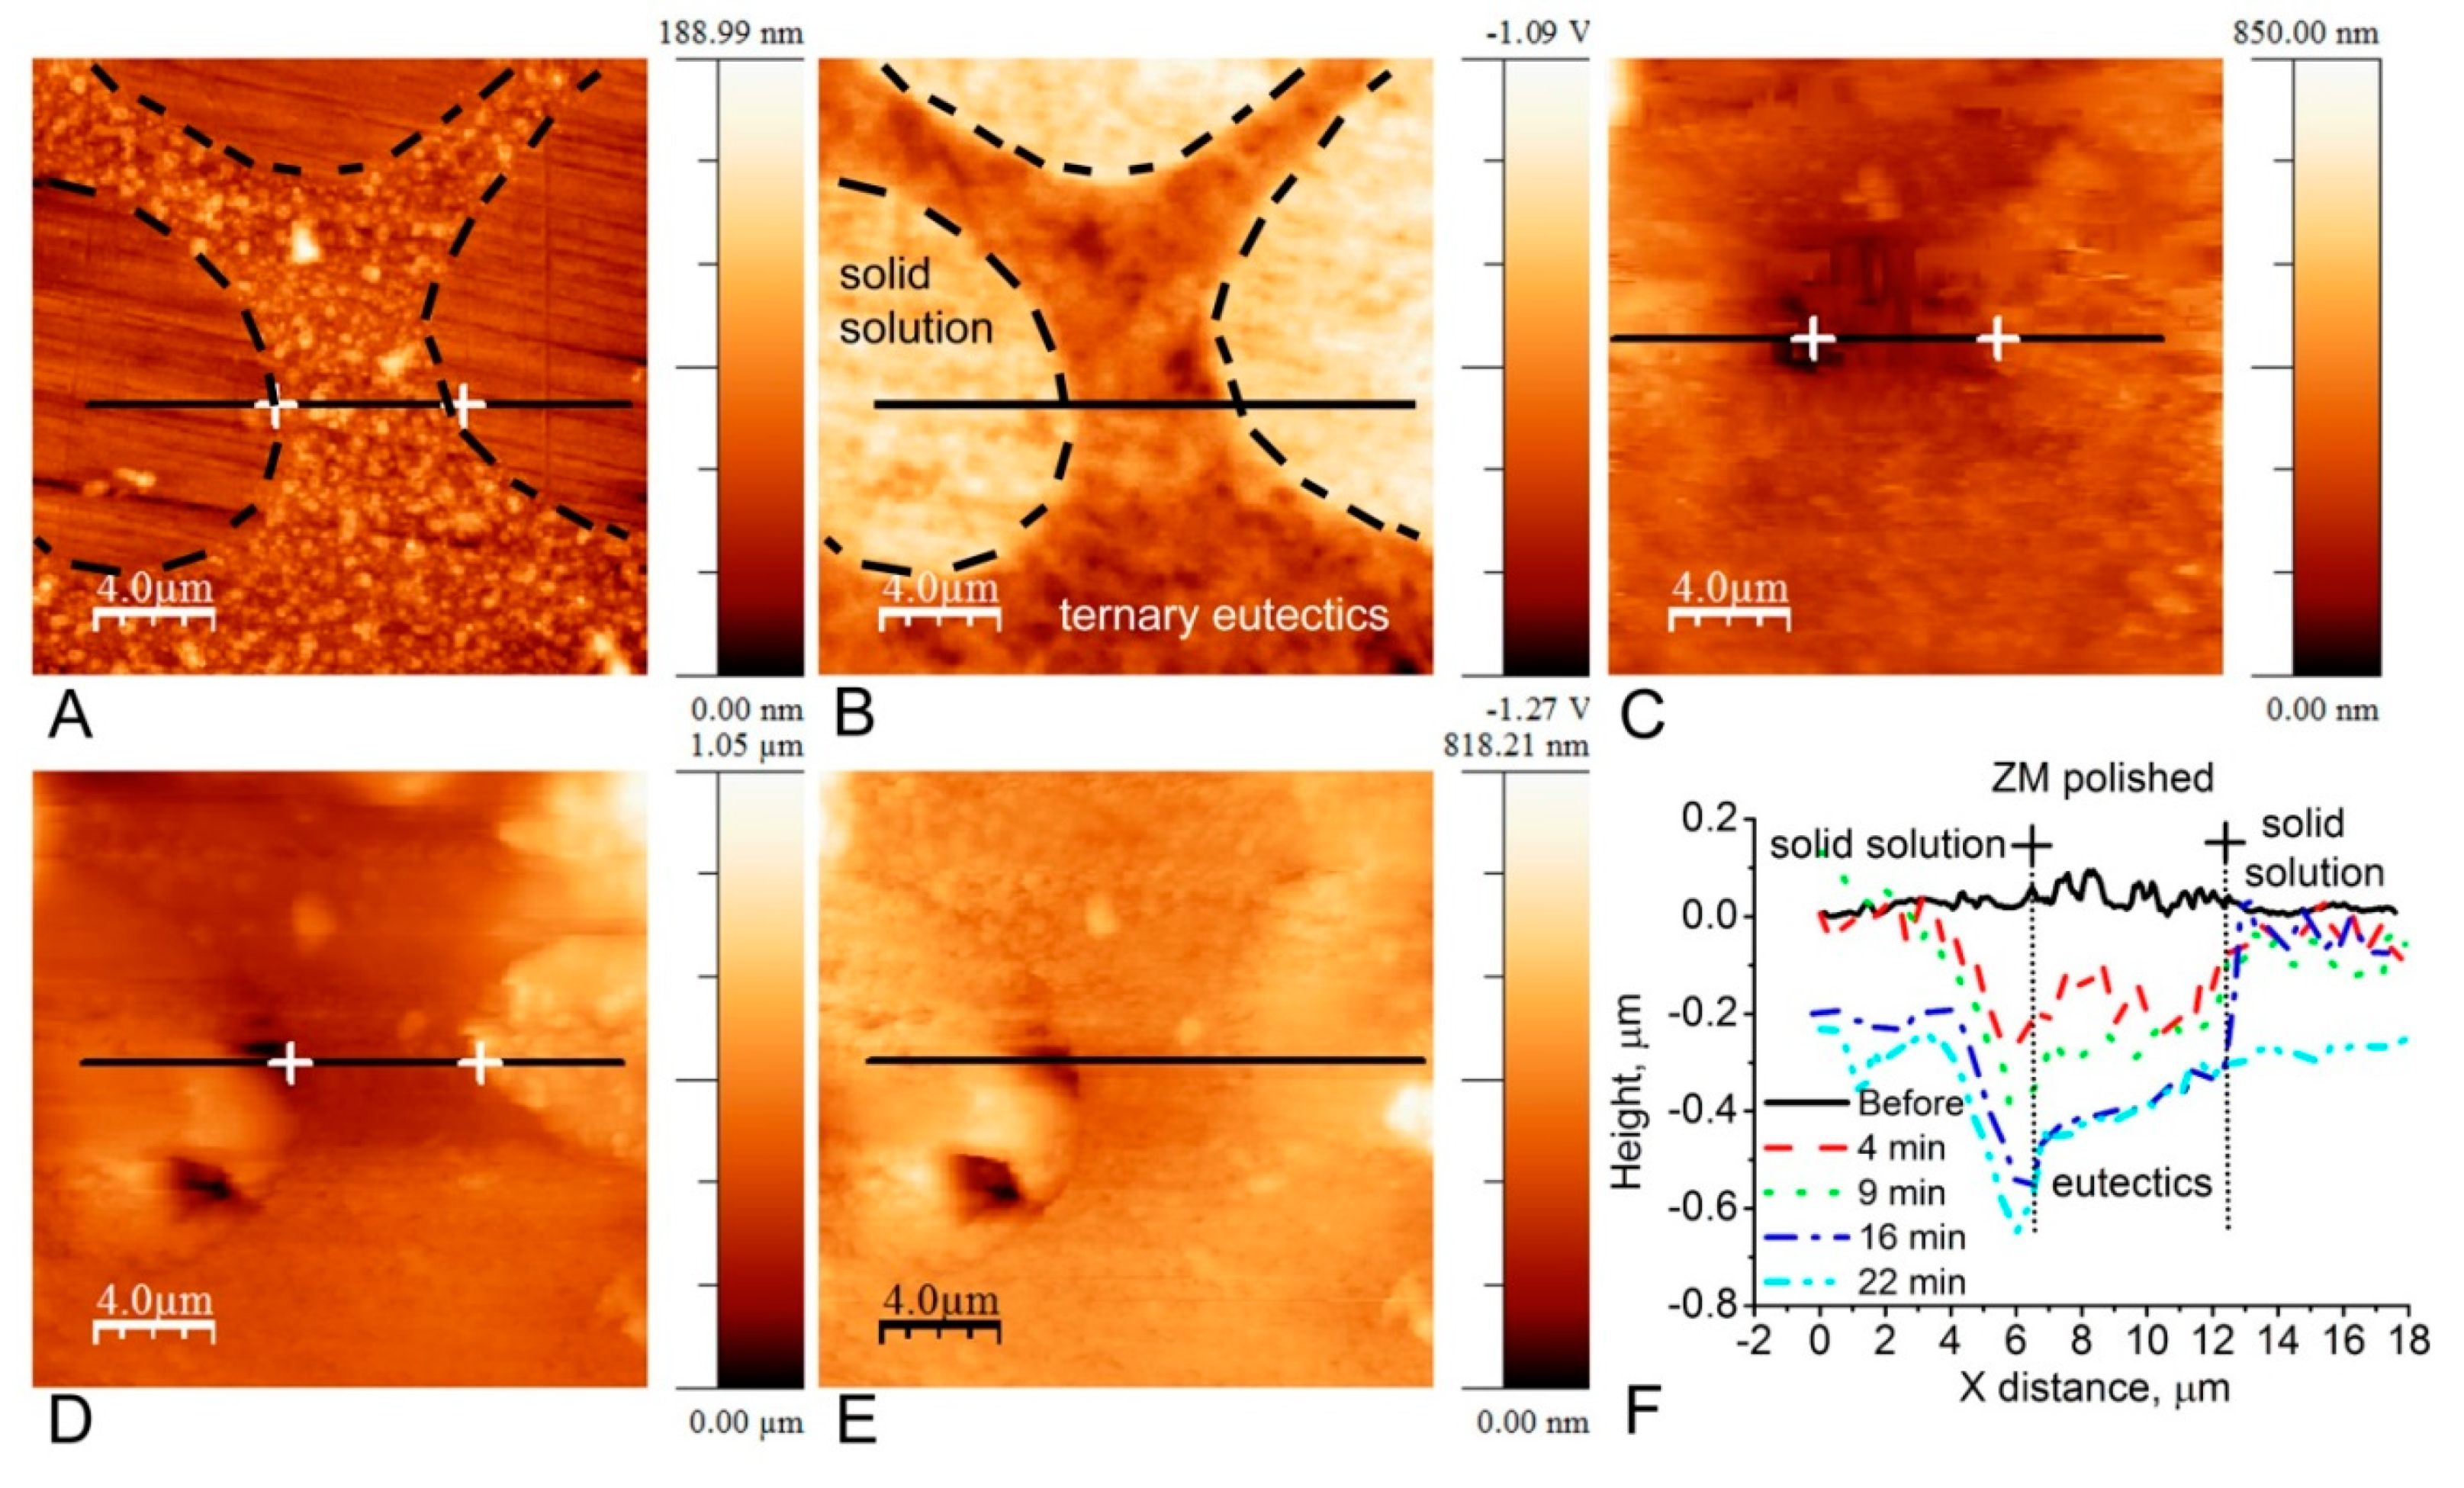
The localized corrosion activity of the ZM sample on a selected zone is presented in Figure 17. Different metallic phases appear at the ZM sample surface such as zinc solid solution, binary or ternary eutectic solution of zinc, aluminum, and MgZn2. The ZM surface before immersion was analyzed by AFM and SKPFM methods to distinguish the properties of different phases (Figure 17A,B). The area in the middle of the images belongs to a ternary eutectics region. This place has a lower Volta potential level (dark area) compared to the surrounding zone of zinc solid solution separated by contour profiles (light area) (Figure 17B). The AFM map after 4 min of immersion at polarization reveals the evident dissolution of the metal matrix (Figure 17C). The AFM topography profiles before and during the immersion were leveled relative to the zero level located on the uncorroded zinc surface (Figure 17F). These profiles show the visible dissolution of eutectic phases and also local corrosion attack at the zone of zinc solid solution (Figure 17F). The topography maps (c,d,e) clearly show corrosion attacks at both the eutectic and the solid solution zones. However, the dissolution process did not progress uniformly on the zinc solid solution zones. After 16 min of immersion the dissolution of zinc solid solution became visible on the left side of the image (Figure 17C–F). With longer immersion (22 min) the AFM profile shows evidence of zinc solid solution dissolution on the right side (Figure 17F).
These experiments confirmed the localized nature of corrosion attack on Z and ZM samples. The corrosion process develops similarly as it was determined in the cut-edges [86]. More specifically, the corrosion locus can be located at the zinc solid solution (Z sample) and both the eutectic phases and zinc solid solution in the case of the ZM sample.
It is important to emphasize that the above AFM measurements revealed surface changes with 5–7 min of delay. There is a gap between what can be seen in the picture and the real state of the surface. It essentially limits the applicability of in situ AFM measurements for studies of metallic systems that rapidly evolve. The study made by Moore and co-workers highlights the application of high-speed AFM (HS-AFM) for the study of localized corrosion events occurring on thermally sensitized AISI 304 stainless steel in an aqueous solution of 1% sodium chloride [87]. The AFM measurements were made along the grain boundaries which contained chromium carbides. Figure 18 shows before and after topographic images of an intergranular pit forming at a grain boundary (GB) during a galvanostatic scan at a current of 0.05 mA and a sample surface area of 0.13 cm2. The timeframe at which the pit was formed is less than 0.5 s and this is less than the rate at which HS-AFM was acquiring topographic images. Electron microscopy observations revealed a much more detailed picture of localized corrosion. The intergranular pits appeared to be openings for a larger network of voids underneath the surface [87]. These results suggest that standalone AFM observations are not capable of resolving the full picture of localized corrosion.
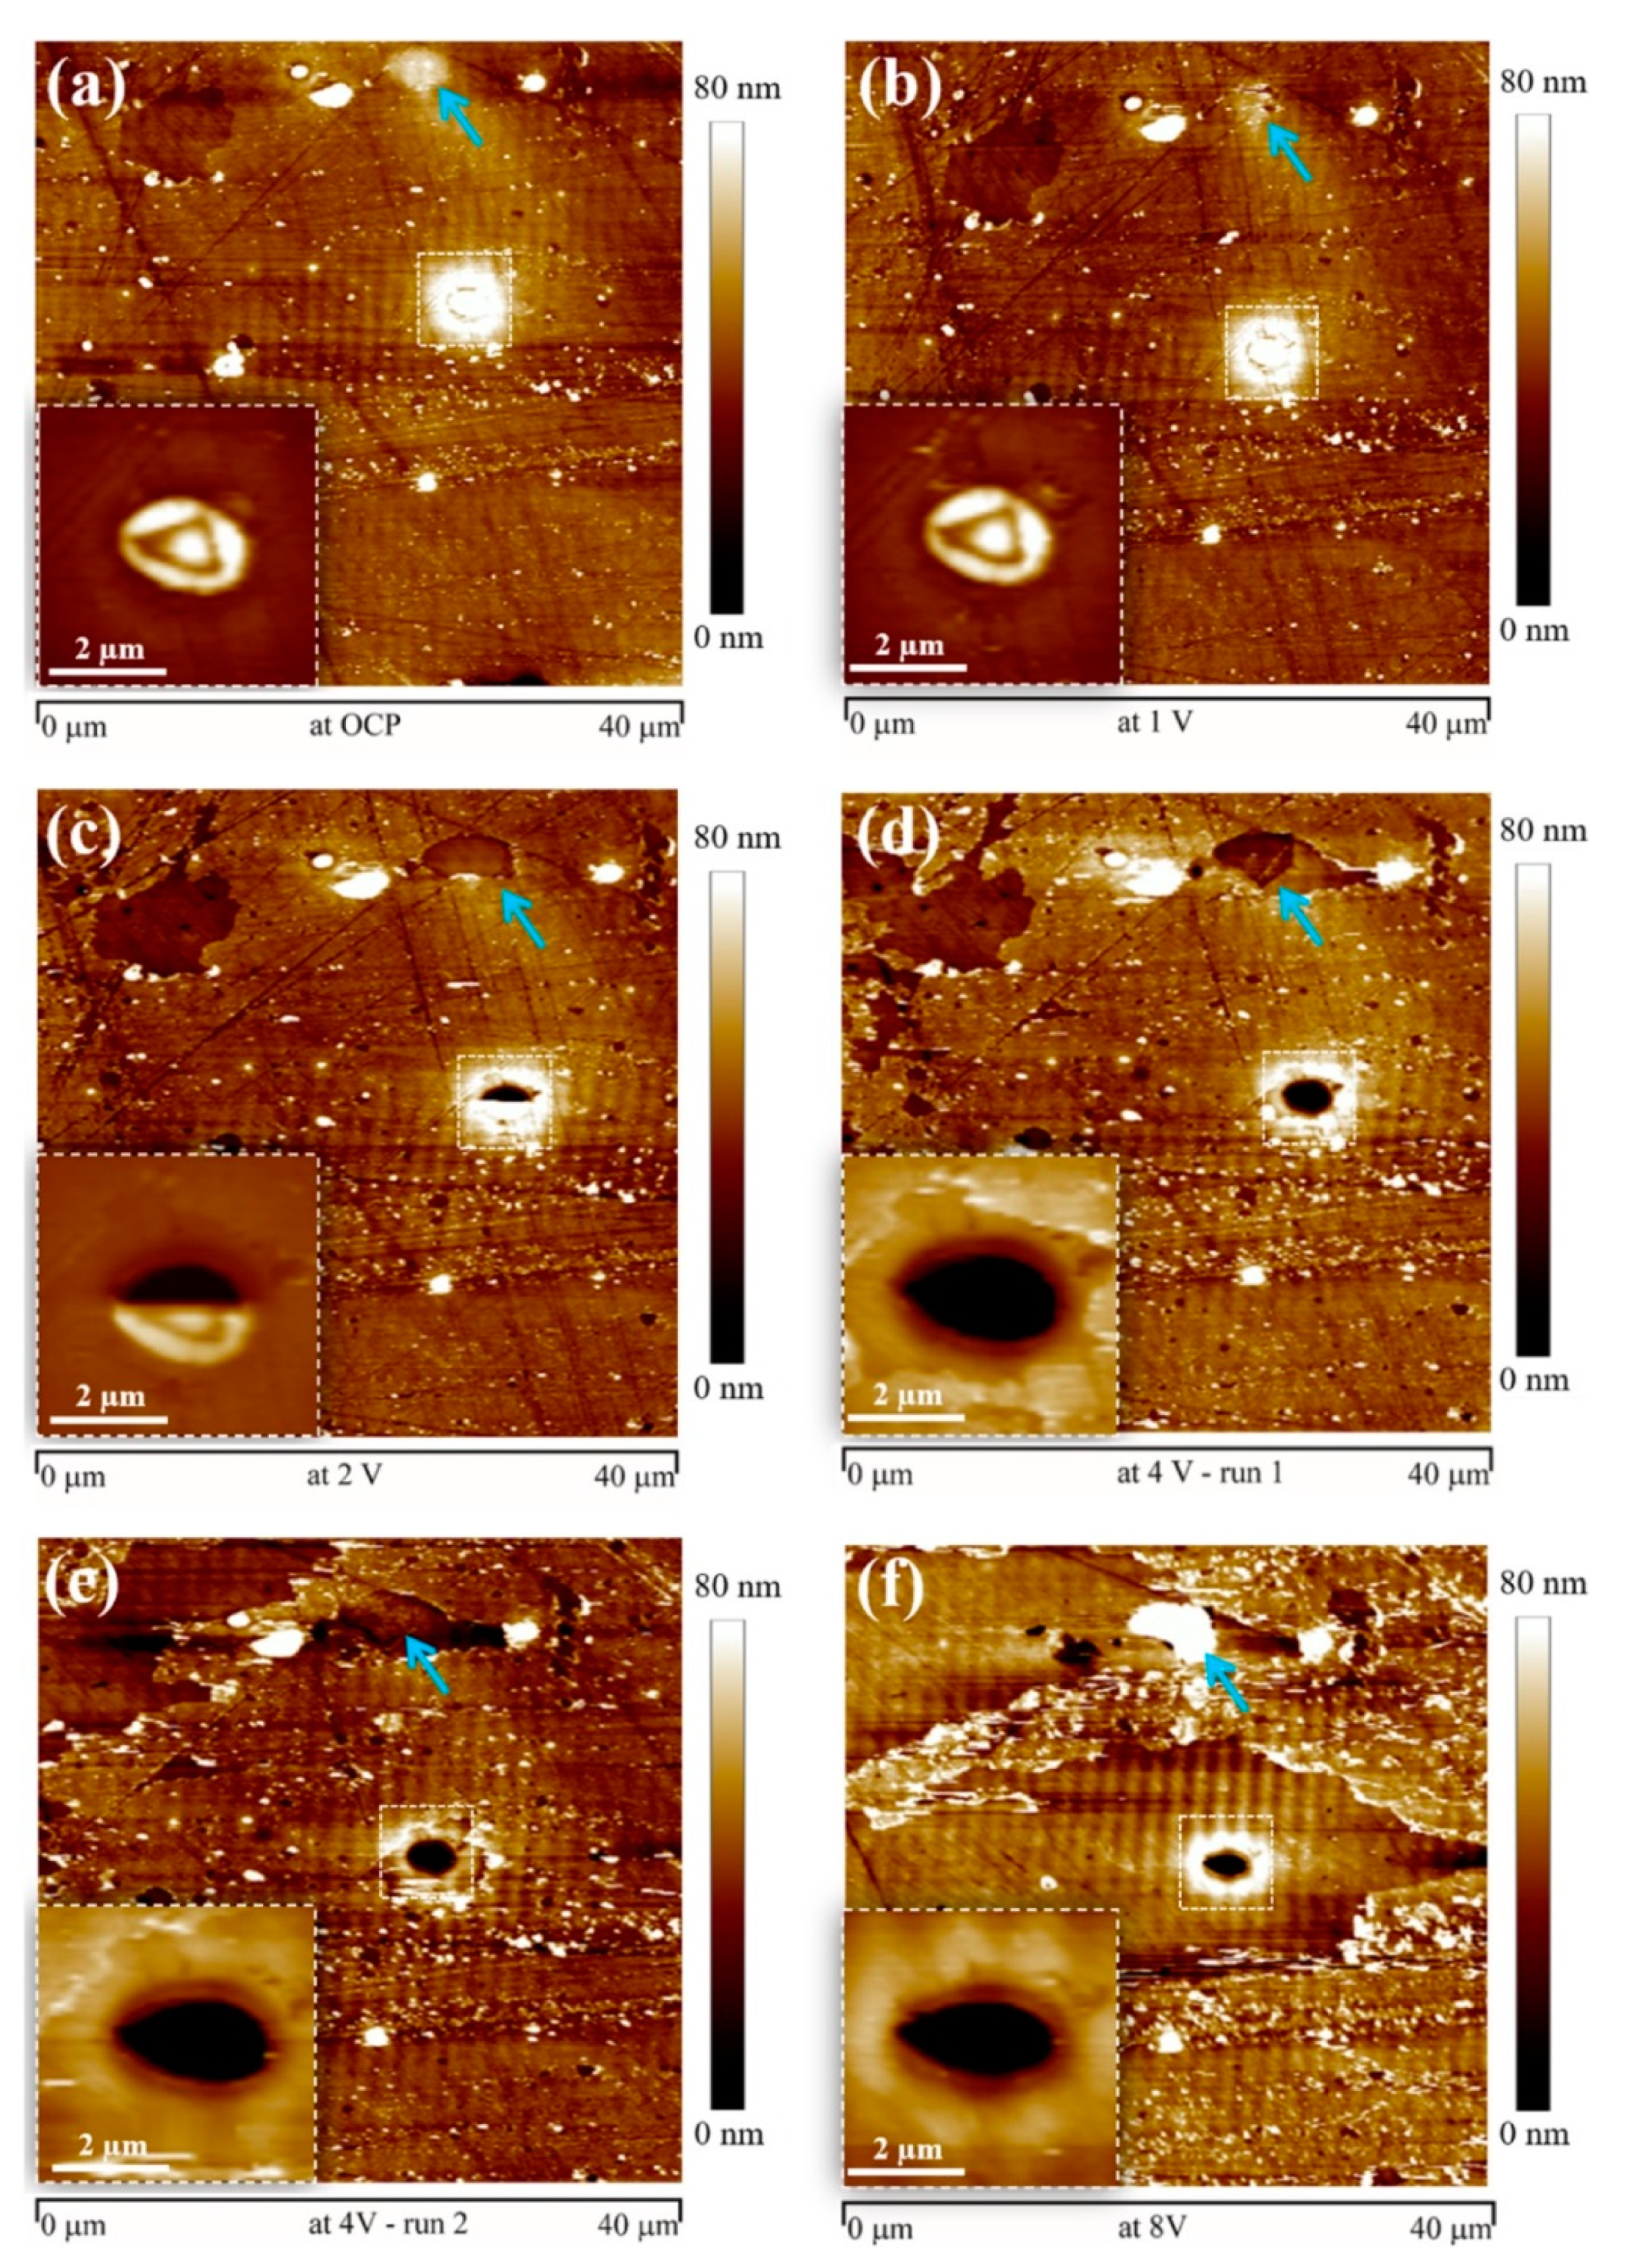
A quite interesting approach has been recently presented by Zhang et al. [88,89]. The researchers studied anodizing processes on AA6060 and AA7075-T5 alloys by in situ electrochemical atomic force microscopy combined with electrochemical impedance spectroscopy. The EC-AFM revealed detailed morphological changes at the intermetallics during the anodizing of AA6060 alloy in 0.2 M Na2SO4 solution [88]. AlFeSi particles remained stable during the anodizing up to 8 V. However, particular localized dissolution was observed on Mg2Si particles during the anodizing step in parallel to anodic Al oxide (AAO) formation. The Mg2Si particles may transform into Si-enriched particles due to the preferential anodic dissolution of Mg. On the other hand, AA7075-T5 alloy contains different intermetallics such as Al7Cu2Fe, S-phase Al2CuMg, Mg2Si, and MgZn2 [89]. Figure 19 displays in situ AFM topography images taken from the surface at OCP and during anodizing at different voltages in 0.2 M Na2SO4 solution. Figure 19a shows a typical surface containing intermetallic particles such as Mg2Si selected by a blue arrow and Al2CuMg encased in a square. During anodizing at low potential (Figure 19b–f) a crater was formed in place of the Al2CuMg particle. This evidences dissolution of the S-phase type intermetallics during anodizing. Dissolution was reported also for MgZn2 particles which had anodic potential compared to the Al matrix. The particle on the top part of the image, Mg2Si, had a top layer of corrosion products which dissolved at 2 V and 4 V (Figure 19c–e). At higher voltages some deposits e.g., Al(OH)3 formed on the top of the arrow marked particle (Figure 19f). During anodizing, Al7Cu2Fe remained stable but showed peripheral dissolution around the boundary. The presented works highlighted important localized corrosion mechanisms during anodic film growth on aluminum alloys.
The applications of EC-AFM extend to studies of lithium-ion batteries (LIBs) which were explicitly discussed in the review of Zhao et al. [90] and others [91,92]. A proper study of LIBs requires the use of a glove box because of the high reactivity of lithium towards oxygen [93]. Various reports provide in situ observation of surface transformations of electrode materials and solid electrolyte interface (SEI) employed in LIBs [94,95,96,97,98]. Among the exotic application of EC-AFM one can mention a technique which combines scanning electrochemical microscopy (SECM) and AFM (AFM-SECM) which utilizes the microelectrode built in the AFM tip [99]. AFM-SECM can sense ionic species such as Cu2+ ions by electrochemically reducing them at the AFM tip-integrated electrode followed by subsequent re-dissolution of Cu into the bulk solution by anodic stripping voltammetry [100,101]. This technique is highly specialized and is applied only by a small research community due to several issues such as cost, reliability, and durability of the combined AFM-SECM probes.
6. Conclusions
This review has provided information on the main principles of AFM, SKPFM, and EC-AFM. Various cases have been discussed emphasizing several specific applications of the techniques in corrosion research of metallic materials. AFM methods are capable of providing important information at the resolution levels not achievable by general methods of analysis. However, to properly interpret information obtained from AFM, SKPFM, and EC-AFM measurements the preliminary knowledge of the surface microstructure, the chemistry/composition, and the general electrochemical behavior of metals and alloys are required. Other methods of research such as electron microscopy, surface analysis methods, and electrochemical methods are essential to obtain a complete picture and gain a solid understanding of corrosion processes at metal/aqueous interfaces. Many examples can be given where several AFM based methods have been used in sequence to characterize metallic materials. This happens because the techniques are complementary. For example, the topography and Volta potential maps can locate different phases on the metallic surface and reveal their susceptibility to corrosion while in situ analysis further clarifies the kinetics of corrosion processes at the intermetallics. This of course can be achieved by performing careful calibration, especially in the case of the SKPFM technique, and paying attention to various artifacts and limitations of the techniques. Future perspectives are encouraging especially in light of the appearance of the more advanced AFM-based methods having a higher resolution than the older techniques and offering more diverse information.
Funding
K.A. Yasakau thanks the Portuguese Foundation for Science and Technology for the Researcher grant (IF/01284/2015). A part of this work was developed within the scope of the project CICECO-Aveiro Institute of Materials, UIDB/50011/2020 & UIDP/50011/2020, financed by national funds through the Portuguese Foundation for Science and Technology/MCTES. Project FUNCOAT: “Development and design of novel multiFUNctional PEO COATings” Grant Agreement 82394, H2020-MSCA-RISE-2018 is acknowledged.
Conflicts of Interest
The author declares no conflict of interest.
References
- The NACE International IMPACT Study. Available online: http://impact.nace.org/economic-impact.aspx (accessed on 27 September 2020).
- Shreir, L.L.; Burstein, G.T.; Jarman, R.A. Corrosion, 3rd ed.; Volume 1 Metal/Environment Reactions; Butterworth-Heinemann: Linacn House, Jordan Hill, Oxford, UK, 1994; pp. 2:3–2:163. [Google Scholar]
- Roberge, P.R. Handbook of Corrosion Engineering; McGraw-Hill: New York, NY, USA, 2000. [Google Scholar]
- Pourbaix, M. Atlas of Electrochemical Equilibria in Aqueous Solutions; National Association of Corrosion Engineers: Houston, TX, USA, 1974. [Google Scholar]
- Totten, G.E.; MacKenzie, D.S. Handbook of Aluminum: Volume 1: Physical Metallurgy and Processes; Marcel Dekker, Inc.: Basel, Switzerland, 2003. [Google Scholar]
- EU. The Energy Efficiency Directive 2012/27/EU. Off. J. Eur. Union 2012, L 315/1. [Google Scholar]
- Lightweight alloys for aerospace application. In Proceedings of the Symposium Sponsored by the Non-Ferrous Metals Committee of the Structural Materials Division (SMD) of TMS (The Minerals, Metals & Materials Society), the TMS Annual Meeting, New Orleans, LA, USA, 12–14 February 2001; TMS: Warrendale, PA, USA, 2001.
- Kainer, K.U.; Kaiser, F.; Materialkunde, D.G.f. Magnesium Alloys and Technology; DGM Wiley-VCH: Weinheim, Germany, 2003. [Google Scholar]
- Uijl, N.J.D.; Carless, L.J. 3—Advanced metal-forming technologies for automotive applications. In Advanced Materials in Automotive Engineering; Rowe, J., Ed.; Woodhead Publishing: Cambridge, UK, 2012; pp. 28–56. [Google Scholar]
- Boag, A.; Hughes, A.E.; Glenn, A.M.; Muster, T.H.; McCulloch, D. Corrosion of AA2024-T3 Part I: Localised corrosion of isolated IM particles. Corros. Sci. 2011, 53, 17–26. [Google Scholar] [CrossRef]
- Yasakau, K.A.; Zheludkevich, M.L.; Lamaka, S.V.; Ferreira, M.G.S. Mechanism of Corrosion Inhibition of AA2024 by Rare-Earth Compounds. J. Phys. Chem. B 2006, 110, 5515–5528. [Google Scholar] [CrossRef] [PubMed]
- Boag, A.; Taylor, R.J.; Muster, T.H.; Goodman, N.; McCulloch, D.; Ryan, C.; Rout, B.; Jamieson, D.; Hughes, A.E. Stable pit formation on AA2024-T3 in a NaCl environment. Corros. Sci. 2010, 52, 90–103. [Google Scholar] [CrossRef]
- Hughes, A.; Muster, T.H.; Boag, A.; Glenn, A.M.; Luo, C.; Zhou, X. Thompson, G.E.; McCulloch, D. Co-operative corrosion phenomena. Corros. Sci. 2010, 52, 665–668. [Google Scholar] [CrossRef]
- Birbilis, N.; Cavanaugh, M.K.; Buchheit, R.G. Electrochemical behavior and localized corrosion associated with Al7Cu2Fe particles in aluminum alloy 7075-T651. Corros. Sci. 2006, 48, 4202–4215. [Google Scholar] [CrossRef]
- Meng, Q.; Frankel, G.S. Effect of Cu Content on Corrosion Behavior of 7xxx Series Aluminum Alloys. J. Electrochem. Soc. 2004, 151, B271. [Google Scholar] [CrossRef]
- Buchheit, R.G. A Compilation of Corrosion Potentials Reported for Intermetallic Phases in Aluminum Alloys. J. Electrochem. Soc. 1995, 142, 3994–3996. [Google Scholar] [CrossRef]
- Birbilis, N.; Buchheit, R.G. Electrochemical Characteristics of Intermetallic Phases in Aluminum Alloys. J. Electrochem. Soc. 2005, 152, B140. [Google Scholar] [CrossRef] [Green Version]
- Jönsson, M.; Thierry, D.; LeBozec, N. The influence of microstructure on the corrosion behaviour of AZ91D studied by scanning Kelvin probe force microscopy and scanning Kelvin probe. Corros. Sci. 2006, 48, 1193–1208. [Google Scholar] [CrossRef]
- Uan, J.-Y.; Li, C.-F.; Yu, B.-L. Characterization and Improvement in the Corrosion Performance of a Hot-Chamber Diecast Mg Alloy Thin Plate by the Removal of Interdendritic Phases at the Die Chill Layer. Metall. Mater. Trans. A 2008, 39, 703–715. [Google Scholar] [CrossRef]
- Wang, H.; Song, Y.; Yu, J.; Shan, D.; Han, H. Characterization of Filiform Corrosion of Mg–3Zn Mg Alloy. J. Electrochem. Soc. 2017, 164, C574–C580. [Google Scholar] [CrossRef]
- Li, J.; Birbilis, N.; Buchheit, R.G. Electrochemical assessment of interfacial characteristics of intermetallic phases present in aluminium alloy 2024-T3. Corros. Sci. 2015, 101, 155–164. [Google Scholar] [CrossRef]
- Zhu, Y.; Sun, K.; Garves, J.; Bland, L.G.; Locke, J.; Allison, J.; Frankel, G.S. Micro- and nano-scale intermetallic phases in AA2070-T8 and their corrosion behavior. Electrochim. Acta 2019, 319, 634–648. [Google Scholar] [CrossRef]
- Binnig, G.; Quate, C.F.; Gerber, C. Atomic Force Microscope. Phys. Rev. Lett. 1986, 56, 930–933. [Google Scholar] [CrossRef] [PubMed] [Green Version]
- Albrecht, T.R.; Grütter, P.; Horne, D.; Rugar, D. Frequency modulation detection using high-Q cantilevers for enhanced force microscope sensitivity. J. Appl. Phys. 1991, 69, 668–673. [Google Scholar] [CrossRef] [Green Version]
- Seifert, J.; Rheinlaender, J.; Novak, P.; Korchev, Y.E.; Schäffer, T.E. Comparison of Atomic Force Microscopy and Scanning Ion Conductance Microscopy for Live Cell Imaging. Langmuir 2015, 31, 6807–6813. [Google Scholar] [CrossRef]
- Checco, A.; Cai, Y.; Gang, O.; Ocko, B.M. High resolution non-contact AFM imaging of liquids condensed onto chemically nanopatterned surfaces. Ultramicroscopy 2006, 106, 703–708. [Google Scholar] [CrossRef]
- Setvín, M.; Wagner, M.; Schmid, M.; Parkinson, G.S.; Diebold, U. Surface point defects on bulk oxides: Atomically-resolved scanning probe microscopy. Chem. Soc. Rev. 2017, 46, 1772–1784. [Google Scholar] [CrossRef] [Green Version]
- Breakspear, S.; Smith, J.R.; Campbell, S.A. AFM in Surface Finishing: Part III. Lateral Force Microscopy and Friction Measurements. Trans. IMF 2003, 81, B68–B70. [Google Scholar] [CrossRef]
- Nonnenmacher, M.; O’Boyle, M.P.; Wickramasinghe, H.K. Kelvin probe force microscopy. Appl. Phys. Lett. 1991, 58, 2921–2923. [Google Scholar] [CrossRef] [Green Version]
- Melitz, W.; Shen, J.; Kummel, A.C.; Lee, S. Kelvin probe force microscopy and its application. Surf. Sci. Rep. 2011, 66, 1–27. [Google Scholar] [CrossRef]
- Rohwerder, M.; Turcu, F. High-resolution Kelvin probe microscopy in corrosion science: Scanning Kelvin probe force microscopy (SKPFM) versus classical scanning Kelvin probe (SKP). Electrochim. Acta 2007, 53, 290–299. [Google Scholar] [CrossRef]
- Jacobs, H.O.; Leuchtmann, P.; Homan, O.J.; Stemmer, A. Resolution and contrast in Kelvin probe force microscopy. J. Appl. Phys. 1998, 84, 1168–1173. [Google Scholar] [CrossRef] [Green Version]
- Hudlet, S.; Jean, M.S.; Roulet, B.; Berger, J.; Guthmann, C. Electrostatic forces between metallic tip and semiconductor surfaces. J. Appl. Phys. 1995, 77, 3308–3314. [Google Scholar] [CrossRef] [Green Version]
- Baumgart, C.; Helm, M.; Schmidt, H. Quantitative dopant profiling in semiconductors: A Kelvin probe force microscopy model. Phys. Rev. B 2009, 80, 085305. [Google Scholar] [CrossRef]
- Jacobs, H.O.; Knapp, H.F.; Müller, S.; Stemmer, A. Surface potential mapping: A qualitative material contrast in SPM. Ultramicroscopy 1997, 69, 39–49. [Google Scholar] [CrossRef]
- Yasakau, K.A.; Höche, D.; Lamaka, S.L.; Ferreira, M.G.S.; Zheludkevich, M.L. Kelvin microprobe analytics on iron-enriched corroded magnesium surface. Corrosion 2017, 73, 583–595. [Google Scholar] [CrossRef]
- Koley, G.; Spencer, M.G.; Bhangale, H.R. Cantilever effects on the measurement of electrostatic potentials by scanning Kelvin probe microscopy. Appl. Phys. Lett. 2001, 79, 545–547. [Google Scholar] [CrossRef]
- Elias, G.; Glatzel, T.; Meyer, E.; Schwarzman, A.; Boag, A.; Rosenwaks, Y. The role of the cantilever in Kelvin probe force microscopy measurements. Beilstein J. Nanotechnol. 2011, 2, 252–260. [Google Scholar] [CrossRef] [Green Version]
- Cherniavskaya, O.; Chen, L.; Weng, V.; Yuditsky, L.; Brus, L.E. Quantitative Noncontact Electrostatic Force Imaging of Nanocrystal Polarizability. J. Phys. Chem. B 2003, 107, 1525–1531. [Google Scholar] [CrossRef] [Green Version]
- Bruker Application Note #140: PeakForce Kelvin Probe Force Microscopy. Available online: https://www.bruker.com/fileadmin/user_upload/8-PDF-Docs/SurfaceAnalysis/AFM/ApplicationNotes/AN140-RevA1-PeakForce_KPFM-AppNote.pdf (accessed on 25 September 2020).
- Manne, S.; Massie, J.; Elings, V.B.; Hansma, P.K.; Gewirth, A.A. Electrochemistry on a gold surface observed with the atomic force microscope. J. Vac. Sci. Technol. B Microelectron. Nanometer Struct. Process. Meas. Phenom. 1991, 9, 950–954. [Google Scholar] [CrossRef]
- Chen, H.; Qin, Z.; He, M.; Liu, Y.; Wu, Z. Application of Electrochemical Atomic Force Microscopy (EC-AFM) in the Corrosion Study of Metallic Materials. Materials 2020, 13, 668. [Google Scholar] [CrossRef] [Green Version]
- Wu, H.; Feng, X.; Kieviet, B.D.; Zhang, K.; Zandvliet, H.J.W.; Canters, G.W.; Schön, P.M.; Vancso, G.J. Electrochemical atomic force microscopy reveals potential stimulated height changes of redox responsive Cu-azurin on gold. Eur. Polym. J. 2016, 83, 529–537. [Google Scholar] [CrossRef]
- Xu, K.; Sun, W.; Shao, Y.; Wei, F.; Zhang, X.; Wang, W.; Li, P. Recent development of PeakForce Tapping mode atomic force microscopy and its applications on nanoscience. Nanotechnol. Rev. 2018, 7, 605. [Google Scholar] [CrossRef]
- Mudali, U.K.; Padhy, N. Electrochemical scanning probe microscope (EC-SPM) for the in situ corrosion study of materials: An overview with examples. Corros. Rev. 2011, 29, 73. [Google Scholar] [CrossRef]
- Schmutz, P.; Frankel, G.S. Corrosion Study of AA2024-T3 by Scanning Kelvin Probe Force Microscopy and In Situ Atomic Force Microscopy Scratching. J. Electrochem. Soc. 1998, 145, 2295–2306. [Google Scholar] [CrossRef] [Green Version]
- Yasakau, K.A.; Zheludkevich, M.L.; Lamaka, S.V.; Ferreira, M.G.S. Role of intermetallic phases in localized corrosion of AA5083. Electrochim. Acta 2007, 52, 7651–7659. [Google Scholar] [CrossRef]
- Iannuzzi, M.; Frankel, G.S. Inhibition of Aluminum Alloy 2024 Corrosion by Vanadates: An In Situ Atomic Force Microscopy Scratching Investigation. Corrosion 2007, 63, 672–688. [Google Scholar] [CrossRef]
- Singh, A.; Ansari, K.R.; Chauhan, D.S.; Quraishi, M.A.; Kaya, S. Anti-corrosion investigation of pyrimidine derivatives as green and sustainable corrosion inhibitor for N80 steel in highly corrosive environment: Experimental and AFM/XPS study. Sustain. Chem. Pharm. 2020, 16, 100257. [Google Scholar] [CrossRef]
- Singh, A.K.; Chugh, B.; Thakur, S.; Pani, B.; Lgaz, H.; Chung, I.-M.; Pal, S.; Prakash, R. Green approach of synthesis of thiazolyl imines and their impeding behavior against corrosion of mild steel in acid medium. Colloids Surf. A Physicochem. Eng. Asp. 2020, 599, 124824. [Google Scholar] [CrossRef]
- Ansari, K.R.; Chauhan, D.S.; Quraishi, M.A.; Mazumder, M.A.J.; Singh, A. Chitosan Schiff base: An environmentally benign biological macromolecule as a new corrosion inhibitor for oil & gas industries. Int. J. Biol. Macromol. 2020, 144, 305–315. [Google Scholar] [CrossRef]
- Sliem, M.H.; Radwan, A.B.; Mohamed, F.S.; Alnuaimi, N.A.; Abdullah, A.M. An efficient green ionic liquid for the corrosion inhibition of reinforcement steel in neutral and alkaline highly saline simulated concrete pore solutions. Sci. Rep. 2020, 10, 14565. [Google Scholar] [CrossRef]
- Benaioun, N.E.; Maafa, I.; Florentin, A.; Denys, E.; Hakiki, N.E.; Moulayat, N.; Bubendorff, J.L. Time dependence of the natural passivation process on AISI 304 in an alkaline medium: Atomic force microscopy and scanning Kelvin probe force microscopy as additional tools to electrochemical impedance spectroscopy. Appl. Surf. Sci. 2018, 436, 646–652. [Google Scholar] [CrossRef]
- Handoko, W.; Pahlevani, F.; Sahajwalla, V. The Effect of Low-Quantity Cr Addition on the Corrosion Behaviour of Dual-Phase High Carbon Steel. Metals 2018, 8, 199. [Google Scholar] [CrossRef] [Green Version]
- Schmutz, P.; Frankel, G.S. Characterization of AA2024-T3 by Scanning Kelvin Probe Force Microscopy. J. Electrochem. Soc. 1998, 145, 2285–2295. [Google Scholar] [CrossRef] [Green Version]
- Örnek, C.; Leygraf, C.; Pan, J. On the Volta potential measured by SKPFM–fundamental and practical aspects with relevance to corrosion science. Corros. Eng. Sci. Technol. 2019, 54, 185–198. [Google Scholar] [CrossRef] [Green Version]
- Cook, A.B.; Barrett, Z.; Lyon, S.B.; McMurray, H.N.; Walton, J.; Williams, G. Calibration of the scanning Kelvin probe force microscope under controlled environmental conditions. Electrochim. Acta 2012, 66, 100–105. [Google Scholar] [CrossRef]
- Efaw, C.; da Silva, T.; Davis, P.; Li, L.; Graugnard, E.; Hurley, M. Improving the Relative Calculations of Volta Potential Differences Acquired from Scanning Kelvin Probe Force Microscopy (SKPFM) from Comparing an Inert Material to First-Principle Calculations. ECS Trans. 2018, 85, 701–713. [Google Scholar] [CrossRef] [Green Version]
- Beerbom, M.M.; Lägel, B.; Cascio, A.J.; Doran, B.V.; Schlaf, R. Direct comparison of photoemission spectroscopy and in situ Kelvin probe work function measurements on indium tin oxide films. J. Electron. Spectrosc. Relat. Phenom. 2006, 152, 12–17. [Google Scholar] [CrossRef]
- Kalb, H.; Rzany, A.; Hensel, B. Impact of microgalvanic corrosion on the degradation morphology of WE43 and pure magnesium under exposure to simulated body fluid. Corros. Sci. 2012, 57, 122–130. [Google Scholar] [CrossRef]
- Ascencio, M.; Pekguleryuz, M.; Omanovic, S. An investigation of the corrosion mechanisms of WE43 Mg alloy in a modified simulated body fluid solution: The influence of immersion time. Corros. Sci. 2014, 87, 489–503. [Google Scholar] [CrossRef]
- Coy, A.E.; Viejo, F.; Skeldon, P.; Thompson, G.E. Susceptibility of rare-earth-magnesium alloys to micro-galvanic corrosion. Corros. Sci. 2010, 52, 3896–3906. [Google Scholar] [CrossRef]
- Kirkland, N.T.; Birbilis, N.; Staiger, M.P. Assessing the corrosion of biodegradable magnesium implants: A critical review of current methodologies and their limitations. Acta Biomater. 2012, 8, 925–936. [Google Scholar] [CrossRef]
- Mohedano, M.; Blawert, C.; Yasakau, K.A.; Arrabal, R.; Matykina, E.; Mingo, B.; Scharnagl, N.; Ferreira, M.G.S.; Zheludkevich, M.L. Characterization and corrosion behavior of binary Mg-Ga alloys. Mater. Charact. 2017, 128, 85–99. [Google Scholar] [CrossRef]
- Woo, S.K.; Blawert, C.; Yasakau, K.A.; Yi, S.; Scharnagl, N.; Suh, B.-C.; Kim, Y.M.; Sun You, B.; Dong Yim, C. Effects of combined addition of Ca and Y on the corrosion behaviours of die-cast AZ91D magnesium alloy. Corros. Sci. 2020, 166, 108451. [Google Scholar] [CrossRef]
- Yang, J.; Blawert, C.; Lamaka, S.V.; Yasakau, K.A.; Wang, L.; Laipple, D.; Schieda, M.; Di, S.; Zheludkevich, M.L. Corrosion inhibition of pure Mg containing a high level of iron impurity in pH neutral NaCl solution. Corros. Sci. 2018, 142, 222–237. [Google Scholar] [CrossRef]
- Hurley, M.F.; Efaw, C.M.; Davis, P.H.; Croteau, J.R.; Graugnard, E.; Birbilis, N. Volta potentials measured by scanning kelvin probe force microscopy as relevant to corrosion of magnesium alloys. Corrosion 2015, 71, 160–170. [Google Scholar] [CrossRef]
- de Wit, J.H.W. Local potential measurements with the SKPFM on aluminium alloys. Electrochim. Acta 2004, 49, 2841–2850. [Google Scholar] [CrossRef]
- Senöz, C.; Rohwerder, M. Scanning Kelvin probe force microscopy for the in situ observation of the direct interaction between active head and intermetallic particles in filiform corrosion on aluminium alloy. Electrochim. Acta 2011, 56, 9588–9595. [Google Scholar] [CrossRef]
- Lafouresse, M.C.; Charvillat, C.; Blanc, C.; de Bonfils-Lahovary, M.-L.; Laffont, L. Role of hydrogen in intergranular corrosion of 2024 aluminum alloy: An SKPFM Study. In CORROSION 2017; NACE International: New Orleans, LA, USA, 2017; p. 11. [Google Scholar]
- Mallinson, C.F.; Yates, P.M.; Baker, M.A.; Castle, J.E.; Harvey, A.; Watts, J.F. The localised corrosion associated with individual second phase particles in AA7075-T6: A study by SEM, EDX, AES, SKPFM and FIB-SEM. Mater. Corros. 2017, 68, 748–763. [Google Scholar] [CrossRef]
- Esfahani, Z.; Rahimi, E.; Sarvghad, M.; Rafsanjani-Abbasi, A.; Davoodi, A. Correlation between the histogram and power spectral density analysis of AFM and SKPFM images in an AA7023/AA5083 FSW joint. J. Alloy. Compd. 2018, 744, 174–181. [Google Scholar] [CrossRef]
- Lamaka, S.V.; Zheludkevich, M.L.; Yasakau, K.A.; Montemor, M.F.; Ferreira, M.G.S. High effective organic corrosion inhibitors for 2024 aluminium alloy. Electrochim. Acta 2007, 52, 7231–7247. [Google Scholar] [CrossRef]
- Buchheit, R.G.; Martinez, M.A.; Montes, L.P. Evidence for Cu Ion Formation by Dissolution and Dealloying the Al2CuMg Intermetallic Compound in Rotating Ring-Disk Collection Experiments. J. Electrochem. Soc. 2000, 147, 119. [Google Scholar] [CrossRef]
- Rohwerder, M.; Hornung, E.; Stratmann, M. Microscopic aspects of electrochemical delamination: An SKPFM study. Electrochim. Acta 2003, 48, 1235–1243. [Google Scholar] [CrossRef]
- Guo, L.Q.; Li, M.; Shi, X.L.; Yan, Y.; Li, X.Y.; Qiao, L.J. Effect of annealing temperature on the corrosion behavior of duplex stainless steel studied by in situ techniques. Corros. Sci. 2011, 53, 3733–3741. [Google Scholar] [CrossRef]
- Maurice, V.; Marcus, P. Application of Surface Science to Corrosion. Surf. Interface Sci. 2020, 799–825. [Google Scholar] [CrossRef]
- Eliaz, N. Corrosion of Metallic Biomaterials: A Review. Materials 2019, 12, 407. [Google Scholar] [CrossRef] [Green Version]
- Yang, X.; Chen, Z.; Zhou, D.; Zhao, W.; Qian, X.; Yang, Q.; Sun, T.; Shen, C. Ultra-low Au–Pt Co-decorated TiO2 nanotube arrays: Construction and its improved visible-light-induced photocatalytic properties. Sol. Energy Mater. Sol. Cells 2019, 201, 110065. [Google Scholar] [CrossRef]
- Brummel, O.; Waidhas, F.; Khalakhan, I.; Vorokhta, M.; Dubau, M.; Kovács, G.; Aleksandrov, H.A.; Neyman, K.M.; Matolín, V.; Libuda, J. Structural transformations and adsorption properties of PtNi nanoalloy thin film electrocatalysts prepared by magnetron co-sputtering. Electrochim. Acta 2017, 251, 427–441. [Google Scholar] [CrossRef] [Green Version]
- Li, J.; Ecco, L.; Ahniyaz, A.; Pan, J. Probing electrochemical mechanism of polyaniline and CeO2 nanoparticles in alkyd coating with in-situ electrochemical-AFM and IRAS. Prog. Org. Coat. 2019, 132, 399–408. [Google Scholar] [CrossRef]
- Li, J.; Huang, H.; Fielden, M.; Pan, J.; Ecco, L.; Schellbach, C.; Delmas, G.; Claesson, P.M. Towards the mechanism of electrochemical activity and self-healing of 1 wt% PTSA doped polyaniline in alkyd composite polymer coating: Combined AFM-based studies. RSC Adv. 2016, 6, 19111–19127. [Google Scholar] [CrossRef]
- Khalakhan, I.; Choukourov, A.; Vorokhta, M.; Kúš, P.; Matolínová, I.; Matolín, V. In situ electrochemical AFM monitoring of the potential-dependent deterioration of platinum catalyst during potentiodynamic cycling. Ultramicroscopy 2018, 187, 64–70. [Google Scholar] [CrossRef]
- Kreta, A.; Rodošek, M.; Slemenik Perše, L.; Orel, B.; Gaberšček, M.; Šurca Vuk, A. In situ electrochemical AFM, ex situ IR reflection–absorption and confocal Raman studies of corrosion processes of AA 2024-T3. Corros. Sci. 2016, 104, 290–309. [Google Scholar] [CrossRef]
- Shi, Y.; Collins, L.; Balke, N.; Liaw, P.K.; Yang, B. In-situ electrochemical-AFM study of localized corrosion of AlxCoCrFeNi high-entropy alloys in chloride solution. Appl. Surf. Sci. 2018, 439, 533–544. [Google Scholar] [CrossRef]
- Yasakau, K.A.; Kallip, S.; Lisenkov, A.; Ferreira, M.G.S.; Zheludkevich, M.L. Initial stages of localized corrosion at cut-edges of adhesively bonded Zn and Zn-Al-Mg galvanized steel. Electrochim. Acta 2016, 211, 126–141. [Google Scholar] [CrossRef]
- Moore, S.; Burrows, R.; Picco, L.; Martin, T.L.; Greenwell, S.J.; Scott, T.B.; Payton, O.D. A study of dynamic nanoscale corrosion initiation events using HS-AFM. Faraday Discuss. 2018, 210, 409–428. [Google Scholar] [CrossRef] [PubMed] [Green Version]
- Zhang, F.; Nilsson, J.-O.; Pan, J. In Situ and Operando AFM and EIS Studies of Anodization of Al 6060: Influence of Intermetallic Particles. J. Electrochem. Soc. 2016, 163, C609–C618. [Google Scholar] [CrossRef]
- Zhang, F.; Örnek, C.; Nilsson, J.-O.; Pan, J. Anodisation of aluminium alloy AA7075—Influence of intermetallic particles on anodic oxide growth. Corros. Sci. 2020, 164, 108319. [Google Scholar] [CrossRef]
- Zhao, W.; Song, W.; Cheong, L.-Z.; Wang, D.; Li, H.; Besenbacher, F.; Huang, F.; Shen, C. Beyond imaging: Applications of atomic force microscopy for the study of Lithium-ion batteries. Ultramicroscopy 2019, 204, 34–48. [Google Scholar] [CrossRef]
- Zhu, J.; Zeng, K. Studying the Localized Electrochemical Phenomena in Rechargeable Li-Ion Batteries by Scanning Probe Microscopy Techniques. In Nanotechnology for Sustainable Energy; Hu, Y.H., Burghaus, U., Eds.; American Chemical Society: Washington, DC, USA, 2013; Volume 1140, pp. 23–53. [Google Scholar]
- Tripathi, A.M.; Su, W.-N.; Hwang, B.J. In situ analytical techniques for battery interface analysis. Chem. Soc. Rev. 2018, 47, 736–851. [Google Scholar] [CrossRef]
- Aurbach, D.; Cohen, Y. The Application of Atomic Force Microscopy for the Study of Li Deposition Processes. J. Electrochem. Soc. 1996, 143, 3525–3532. [Google Scholar] [CrossRef]
- Vidu, R.; Quinlan, F.T.; Stroeve, P. Use of in Situ Electrochemical Atomic Force Microscopy (EC-AFM) to Monitor Cathode Surface Reaction in Organic Electrolyte. Ind. Eng. Chem. Res. 2002, 41, 6546–6554. [Google Scholar] [CrossRef]
- Shen, C.; Hu, G.; Cheong, L.-Z.; Huang, S.; Zhang, J.-G.; Wang, D. Direct Observation of the Growth of Lithium Dendrites on Graphite Anodes by Operando EC-AFM. Small Methods 2018, 2, 1700298. [Google Scholar] [CrossRef]
- Alliata, D.; Kötz, R.; Novák, P.; Siegenthaler, H. Electrochemical SPM investigation of the solid electrolyte interphase film formed on HOPG electrodes. Electrochem. Commun. 2000, 2, 436–440. [Google Scholar] [CrossRef]
- Ramdon, S.; Bhushan, B.; Nagpure, S.C. In situ electrochemical studies of lithium-ion battery cathodes using atomic force microscopy. J. Power Sources 2014, 249, 373–384. [Google Scholar] [CrossRef]
- Liu, X.; Wang, D.; Wan, L. Progress of electrode/electrolyte interfacial investigation of Li-ion batteries via in situ scanning probe microscopy. Sci. Bull. 2015, 60, 839–849. [Google Scholar] [CrossRef] [Green Version]
- Shi, X.; Qing, W.; Marhaba, T.; Zhang, W. Atomic force microscopy—Scanning electrochemical microscopy (AFM-SECM) for nanoscale topographical and electrochemical characterization: Principles, applications and perspectives. Electrochim. Acta 2020, 332, 135472. [Google Scholar] [CrossRef]
- Izquierdo, J.; Fernández-Pérez, B.M.; Eifert, A.; Souto, R.M.; Kranz, C. Simultaneous atomic force—scanning electrochemical microscopy (AFM-SECM) imaging of copper dissolution. Electrochim. Acta 2016, 201, 320–332. [Google Scholar] [CrossRef]
- Izquierdo, J.; Eifert, A.; Kranz, C.; Souto, R.M. In situ investigation of copper corrosion in acidic chloride solution using atomic force—Scanning electrochemical microscopy. Electrochim. Acta 2017, 247, 588–599. [Google Scholar] [CrossRef]
Figure 1.
A scheme of tapping mode atomic force microscopy (AFM) (a) and force-distance curve between the AFM tip and sample (b).
Figure 1.
A scheme of tapping mode atomic force microscopy (AFM) (a) and force-distance curve between the AFM tip and sample (b).


Figure 2.
Electronic states of a probe and a sample metals before connection (a), after electric connection (b), and after applying a DC bias VDC = VVPD (c).
Figure 2.
Electronic states of a probe and a sample metals before connection (a), after electric connection (b), and after applying a DC bias VDC = VVPD (c).

Figure 3.
A scheme of amplitude modulation mode scanning Kelvin probe force microscopy (SKPFM).

Figure 4.
A scheme of electrochemical AFM (EC-AFM) liquid cell containing main parts such as counter electrode (CE), working electrode (WE), and reference electrode (RE); AFM scanning system containing an AFM probe, a scanner, an optical system, a laser, and a photodetector; the external potentiostat controls the applied voltage between a counter and a working electrode.

Figure 5.
Topography evolution of AA5083 surface during in situ AFM measurements showing pit initiation and growth: (a) topography after 180 min of immersion in 0.005 M NaCl, (b) pit initiation after 130 min of immersion in 0.5 M NaCl, (c) pit growth after 220 min in 0.5 M NaCl and (d) image after immersion for 450 min in 0.5 M NaCl; the kinetics of the pit depth propagation (e). Reprinted from [47] Copyright (2020), with permission from Elsevier.

Figure 6.
AFM images of the alloy surface: (a) before in situ immersion, (b) after 25 min of in situ immersion and (c) after the in situ experiment followed by the removal of the corrosion deposits (performed in air); (d) comparison of the topography profiles across the black line on the AFM images. Reprinted from [47] Copyright (2020), with permission from Elsevier.

Figure 7.
AFM images of the alloy surface (a) at the beginning of immersion in 0.5% La(NO3)3 + 0.005 M NaCl, (b) at the end of immersion in 0.5% La(NO3)3 + 0.5 M NaCl; (c) Evolution of topography across the profiles depicted in (a,b) in 0.5% La(NO3)3 solution with 0.005 M or 0.5 M NaCl; (d) Rate of the lanthanum hydroxide precipitation. Reprinted with permission from [11] Copyright (2020) American Chemical Society.

Figure 8.
In situ AFM three-dimensional topography images of high carbon martensitic steel surface at (i) 0 min; (ii) 60 min; and (iii) 105 min, the exposure to 0.1 M NaCl solution. Sample A (0.10–0.18 wt% Cr), Sample B (0.60–0.80 wt% Cr), Sample C (0.10–0.18 wt% Cr). Reprinted from [54].
Figure 8.
In situ AFM three-dimensional topography images of high carbon martensitic steel surface at (i) 0 min; (ii) 60 min; and (iii) 105 min, the exposure to 0.1 M NaCl solution. Sample A (0.10–0.18 wt% Cr), Sample B (0.60–0.80 wt% Cr), Sample C (0.10–0.18 wt% Cr). Reprinted from [54].

Figure 9.
VPD after immersion in 0.5 M NaCl solution vs. corrosion potentials measured in 0.5 M NaCl solution (a), the Figure was adapted from [55].
Figure 9.
VPD after immersion in 0.5 M NaCl solution vs. corrosion potentials measured in 0.5 M NaCl solution (a), the Figure was adapted from [55].

Figure 10.
SKPFM study of the as-cast ZE41 alloy: (a) topography map, (b) surface potential map, and (c) line-profile analysis of relative Volta potential through an α-Mg dendrite; SEM study of the as-cast ZE41 after immersion in 3.5 wt% NaCl solution: (d) 60 min (surface) and (e) 60 min (cross-section). Reprinted from [62] Copyright (2020), with permission from Elsevier.

Figure 11.
Topography (a), (b) and Volta potential maps (c), (d) obtained at the same places of 2024 aluminum alloy before (a), (c) and after (b), (d) 5 h of immersion in 0.05 M NaCl solution; topography and VPD profiles (e) taken from maps a,b,c,d. Reprinted from [73] Copyright (2020), with permission from Elsevier.

Figure 12.
Topography (a), (b) and Volta potential maps (c), (d) obtained at the same places of 2024 aluminum alloy before (a), (c) and after (b), (d) 5 h of immersion in 0.5 g/L solution of salicylaldoxime with 0.05 M NaCl; topography and VPD profiles (e) taken from maps a,b,c,d. Reprinted from [73] Copyright (2020), with permission from Elsevier.

Figure 13.
Example of filament propagation (100 μm × 100 μm) observed on sample coated with 344 nm hexamethyldisiloxane (HMDSO) film at relative humidity around 85%. Part (a) presents observations of the surface from 2 hrs until 4 hrs 15 min, part (b) presents observations of the surface from 8 hrs 30 min until 12 hrs 25 min. Note that the topographic images on the top have a full scale range of 6 μm and the surface potential (SP) maps at the bottom have a full scale of 1.3 V. The contour lines are positioned to show the slight expansion in the borders of the filament when surface potential and topography images are compared. Reprinted from [69] Copyright (2020), with permission from Elsevier.

Figure 14.
Schematic illustration of the “jumps” during the propagation of the active head. Note that the nearest intermetallic particles are shown in red. After incorporation into the filament they are shown in ruby. The top sequence shows the propagation of the filigree in the first 4.5 h and the bottom sequence shows the further propagation imaged in the following 17.5 h. Reprinted from [69] Copyright (2020), with permission from Elsevier.

Figure 15.
In situ AFM images of corrosion behavior of the sample annealed at 1050 °C in 0.3 M hydrochloric acid solution: (a) t = 0, (b) t = 20 min, (c) t = 50 min, (d) t = 80 min, (e) t = 100 min, (f) t = 120 min; Magnetic (a1,a2) and VPD (b1,b2,c1,c2) measurements and profiles across different ferrite and austenite zones. Reprinted from [76] Copyright (2020), with permission from Elsevier.

Figure 16.
AFM topography maps of polished Z galvanized coating before immersion (A) and during immersion in 0.005 M NaCl: 3 min (B), 22 min (C), 35 min (D); Figure (E) presents the evolution of topography across the black lines profiles; Figure (F) presents the cathodic polarization curve on steel and the anodic polarization curves on Zn (Z) and Zn-Al-Mg (ZM) samples. Reprinted from [86] Copyright (2020), with permission from Elsevier.

Figure 17.
AFM topography (A) and SKPFM (B) maps of polished ZM galvanized coating before immersion and during immersion in 0.005 M NaCl: 4 min (C), 9 min (D), 22 min (E); Figure (F) presents the evolution of topography across the black lines profiles. Reprinted from [86] Copyright (2020), with permission from Elsevier.

Figure 18.
Topographic maps showing a grain boundary (GB) in sensitized AISI 304 stainless steel within 1% aqueous NaCl: (a) before the formation of the intergranular pit, (b) after the formation of the intergranular pit, and (c) the full intergranular pit formed. Reprinted from [87]—Published by The Royal Society of Chemistry.

Figure 19.
In-situ EC-AFM topography images of an actively dissolving region of the AA7075 in 0.2 M Na2SO4 solution at (a) open circuit potential (OCP), (b) 1 V, (c) 2 V, (d) 4 V fist scan, (e) 4 V second scan, and (f) 8 V vs. Ag/AgCl, respectively. The inset of each image is the enlargement of the area marked with a square. Reprinted from [89] Copyright (2020), with permission from Elsevier.

Publisher’s Note: MDPI stays neutral with regard to jurisdictional claims in published maps and institutional affiliations. |
© 2020 by the author. Licensee MDPI, Basel, Switzerland. This article is an open access article distributed under the terms and conditions of the Creative Commons Attribution (CC BY) license (http://creativecommons.org/licenses/by/4.0/).
Share and Cite
MDPI and ACS Style
Yasakau, K. Application of AFM-Based Techniques in Studies of Corrosion and Corrosion Inhibition of Metallic Alloys. Corros. Mater. Degrad. 2020, 1, 345-372. https://0-doi-org.brum.beds.ac.uk/10.3390/cmd1030017
AMA Style
Yasakau K. Application of AFM-Based Techniques in Studies of Corrosion and Corrosion Inhibition of Metallic Alloys. Corrosion and Materials Degradation. 2020; 1(3):345-372. https://0-doi-org.brum.beds.ac.uk/10.3390/cmd1030017
Chicago/Turabian StyleYasakau, Kiryl. 2020. "Application of AFM-Based Techniques in Studies of Corrosion and Corrosion Inhibition of Metallic Alloys" Corrosion and Materials Degradation 1, no. 3: 345-372. https://0-doi-org.brum.beds.ac.uk/10.3390/cmd1030017