Article

Electrospun Bilayer PAN/Chitosan Nanofiber Membranes Incorporated with Metal Oxide Nanoparticles for Heavy Metal Ion Adsorption

by
Hamad F. Alharbi
1,*,
Mustafa Y. Haddad
1,2,
Muhammed Omer Aijaz
3,
Abdulaziz K. Assaifan
1 and
Mohammed R. Karim
3
1
Mechanical Engineering Department, King Saud University, P.O. Box 800, Riyadh 11421, Saudi Arabia
2
National Center for Advanced Materials Technology, King Abdulaziz City for Science and Technology (KACST), P.O. Box 6086, Riyadh 11442, Saudi Arabia
3
Center of Excellence for Research in Engineering Materials, King Saud University, Riyadh 11421, Saudi Arabia
*
Author to whom correspondence should be addressed.
Submission received: 22 December 2019 / Revised: 4 March 2020 / Accepted: 17 March 2020 / Published: 19 March 2020

Abstract

:
Bilayer nanofiber membranes with enhanced adsorption and mechanical properties were produced by combining a layer of polyacrylonitrile (PAN) functionalized with metal oxides (MO) of ZnO or TiO2 with a layer of chitosan (CS) via consecutive electrospinning. The adsorption properties of the bilayer PAN/MO–CS nanofiber membranes against lead (Pb(II)) and cadmium (Cd(II)) ions were investigated, including the effects of the solution pH, initial ion concentrations, and interaction time. The integration of a CS layer into PAN/MO nanofibers increased the adsorption capacity of lead by 102% and cadmium by 405%, compared to PAN/MO single layer. The nonlinear optimization method showed that the pseudo-second-order kinetic model and Langmuir isotherm equation better described the adsorption results. More importantly, the incorporation of a supportive CS nanofiber layer enhanced the tensile strength of PAN/MO–CS bilayer by approximately 68% compared to the PAN/MO single layer, owing to the strong interaction between the fibers at the interface of the two layers.

1. Introduction

The rapid development of industrialization has led to more pollutants such as toxic heavy metal ions in surface and ground waters [1,2]. The presence of these contaminants requires further treatment to reduce their concentrations in water, as they are a serious concern to the environment and human well-being [3,4]. Different approaches have been utilized for toxic metal ion removal from wastewaters—such as adsorption, ion exchange, membrane separation, and solvent extraction [5,6,7,8]. Among these techniques, adsorption is more popular because of its cost effectiveness, high performance, and ease of application [9]. Polymeric nanofiber membranes can significantly improve the adsorption performance due to their high porosity, small pore sizes, and large surface area, which provide a large number of potential active adsorption sites [10,11].
Polyacrylonitrile (PAN) is a common and low-cost product that has been investigated for facile polymeric nanofiber production via electrospinning techniques [12,13,14]. PAN possess a good thermal stability, wettability, and high chemical resistance [15,16]. However, pure PAN nanofibers are not good enough for heavy metal ion adsorption applications [17,18]. Therefore, surface functionalization or the incorporation of other polymers and/or metal oxide nanoparticles into PAN nanofibers are required to improve the ion adsorption of PAN adsorbents. Kampalanonwat et al. [19] demonstrated the enhancement of the ion adsorption capacity onto PAN nanofibers by attaching amidino diethylenediamine chelating groups on PAN nanofibers surfaces. Previously, adsorption of toxic metal ions was improved by many researchers by incorporating metal oxides such as ZnO and TiO2 into the nanofiber membranes [20,21,22]. Parlayici et al. [23] reported the improvement of the chromium ion removal efficiency by incorporating TiO2 into PAN nanofiber membranes. The enhancement was attributed to the TiO2 electrostatic attraction nature. In another approach, Makaremi et al. [24] conducted a study in which chromium ions were removed using PAN mixed with ZnO nanoparticles. The removal percentage was increased by 30% with the addition of ZnO nanoparticles. Similar improvements were observed in our previous work, where lead and cadmium ions were adsorbed onto PAN functionalized with ZnO and TiO2. The adsorption performance was significantly improved to 260%, in comparison to pristine PAN nanofibers [9,25].
Chitosan (CS), a natural biopolymer with antibacterial and antifungal properties, has attracted significant interest due to its unique advantages, such as its abundancy in nature, nontoxicity, biodegradability, and heavy metal ion adsorption properties [26]. Biopolymers are well-known as low cost and easy to use materials for different environmental applications [27]. In adsorption studies, chitosan has received much attention due to its hydroxyl and amine groups, which are very efficient in toxic metal ion adsorption by electrostatic interactions [28]. Makaremi et al. [24] combined an electrospun chitosan layer with nanofibrous PAN membranes for chromium removal from aqueous solutions. The results showed an increase in the adsorption efficiency from 4% to 43%. In another study, Haider et al. [29] used electrospun chitosan membranes to adsorb lead and copper from aqueous solutions. The membranes showed an improved adsorption affinity towards lead and copper ions due to the larger surface area. Aliabadi et al. [30] mixed a chitosan solution with a polyethylene oxide (PEO) solution and electrospun the mixture to form a nanofibrous membrane. He used the membrane to adsorb cadmium, lead, nickel, and copper. The heavy metal ions attachment onto the membrane was endothermic, feasible and spontaneous. Furthermore, He et al. electrospun an environmentally-friendly and non-toxic composite membrane of titanium dioxide/chitosan/poly(lactide-co-caprolactone) and used it for Cu(II) adsorption. The results have shown a good adsorption capability towards copper ions in aqueous solution [31].
Building on our recent results in this emerging field, we demonstrate in this paper for the first time significant enhancements in both the adsorption and mechanical properties of electrospun PAN/ZnO and PAN/TiO2 nanofiber mats coated with a nanofiber layer of electrospun chitosan. The fabricated bilayer PAN/ZnO–CS and PAN/TiO2–CS (hereinafter, unless otherwise specified, both are referred to as PAN/MO–CS) nanofiber mats were used to adsorb lead and cadmium ions in water by adsorption. The bilayer PAN/MO–CS nanofiber mats were characterized using SEM, XRD, and FTIR to examine the morphology, metal oxide availability, and chemical structures of the PAN/MO–CS nanofiber mats. The adsorption performance was thoroughly investigated experimentally and numerically and compared to a PAN/MO single layer and PAN–CS bilayer. Likewise, mechanical properties, such as the tensile strength of the bilayer, was investigated in this study. In addition, elongation at break of the bilayer mats was analyzed under uniaxial tension.

2. Materials and Methods

2.1. Materials

The polymers used in the synthesis of the nanofibers were polyacrylonitrile (Mw = 150,000), chitosan (Mw = 50,000) and poly(vinyl alcohol) (PVA, Mw = 150,000). N,N-dimethylformamide (DMF) was used as the electrospinning solvent. All these materials were supplied by Sigma Aldrich (Hamburg, Germany). Titanium dioxide (TiO2) and zinc oxide (ZnO) nanoparticles, supplied by Sigma Aldrich, had average sizes of 50 and 80 nm, respectively. For the adsorption experiments, lead and cadmium standard solutions having a mass per volume of 1000 g/L for both solutions were purchased from Panreac (Barcelona, Spain).

2.2. Preparation of Electrospun Bilayer Nanofiber Mats

The bilayer nanofiber mats composed of PAN/MO (PAN/ZnO and PAN/TiO2) and CS were fabricated using electrospinning. The first layer of electrospun PAN mixed with 2.0 wt % ZnO or PAN mixed with 2.0 wt % and 5.0 wt % TiO2 were prepared following our previously published procedure [9,25]. It was found that as the concentration increases to more than these percentages, the adsorption decreases. This could be attributed to the excessive aggregation of metal oxides which would lead to steric hindrance and hence reduced adsorption performance [31]. The other CS layer was prepared from a CS/PVA solution. First, a 2 wt % acetic acid in water was introduced to a 2 wt % CS solution and mixed for 24 h to produce a homogenous solution. Afterward, another 10 wt % PVA in water was prepared by dissolving the PVA in water and stirring for 1 h at 90 °C. These two solutions were mixed at room temperature with a CS/PVA ratio of 30:70 and stirred for 1 h until the solution became homogenous. The prepared CS/PVA solution was directly electrospun on top of the first PAN/MO nanofiber layer, immediately after the completion of the first run, by injecting the CS/PVA solution with a flow rate of 0.2 mL/h and an applied potential of 25 kV, the needle tip was placed 10 cm from the collector. The fabrication process was running for two days to achieve a thick CS layer.
For the purpose of comparison, an additional electrospun nanofiber mat of a PAN–CS bilayer (with no metal oxide nanoparticles) was also fabricated using the same solutions described above. In summary, three different electrospun nanofiber mats were prepared in this study including: (1) a bilayer of PAN–CS, (2) a bilayer of PAN/TiO2–CS, and (3) a bilayer of PAN/ZnO–CS. 2.0 wt % of ZnO nanoparticles was used for lead and cadmium adsorption experiments, 2.0 and 5.0 wt % of TiO2 nanoparticles were used for lead and cadmium adsorption experiments, respectively. These amounts were selected based on our previous study, as they provided the most favorable removal percentages against the metal ions [9,25]. For the purpose of simplicity and clarity, the weight percentages of ZnO and TiO2 will not be written explicitly in the labels of the bilayer mats (e.g., PAN/TiO2(2 wt %)–CS will be referred to as PAN/TiO2–CS only).

2.3. Characterization

The polymeric nanofibers morphological structure was studied using a field-emission scanning electron microscopy (JSM-7600 JEOL, Tokyo, Japan) after sputter coating the samples with platinum to minimize electrostatic charging. At least four samples of PAN–CS, PAN/TiO2–CS and PAN/ZnO–CS mats were imaged. The accelerating voltages used in these characterization studies were between 5 and 15 kV. The presence of metal oxide nanoparticles within the composite nanofibers was observed using X-ray diffraction (XRD, D8 Bruker, Karlsruhe, Germany) with Cu-Kα radiation and a 2θ scanning range from 10° to 80° at a rate of 5° per minute. Fourier transform infrared spectroscopy (Bruker, Billerica, USA) was utilized to study the chemical structure of the mats.

2.4. Adsorption Studies

The toxic metal ion adsorption onto the surface of the bilayer nanofibers was studied in distilled water at room temperature. The effects of solution pH, incubation times, and concentrations of ion on adsorption performances were investigated. The adsorption results were compared with those obtained from the bilayer PAN–CS nanofibers without metal oxide nanoparticles. In this work, a fixed amount of approximately 18 mg of the fabricated nanofibers was agitated into 15 mL water having certain lead and cadmium ions concentrations. The effects of incubation times on the toxic metal ion adsorption were observed where the concentrations of the ions were measured using atomic adsorption spectroscopy (AA-7000 Shimadzu, Tokyo, Japan). The removal percentage of ions (% removal) or the amount of adsorbed ions at equilibrium (qe; mg/g) can be used to express the adsorption performance as
%   removal = C o C e C o × 100 ,
q e = C o C e × V M ,
where Co (mg/L) is the initial concentration of ions adsorbed in solution and Ce (mg/L) is the equilibrium concentration of adsorbed ions in solution, V (L) is the total solution volume, and M (g) denotes the dry mat mass.
To confirm reproducibility of the adsorption data, all adsorption experiments reported in this paper were performed at least three times for each nanofiber mats. A standard statistical analysis based on the mean and standard deviation was used to report the sample measurements. The Student’s t-test was considered to assess any significant difference in the mean adsorption values between nanofiber mats with a 95% confidence level.

2.5. Mechanical Testing

A micro-tensile machine (MTD-500 PLUS, Instron, Norwood, MA, USA) was used to identify the tensile properties of all the fabricated nanofiber mats at ambient temperature. dog bone shaped samples strips were prepared according to ASTM D 638-10 standard type-5 with a gauge length, width, and thickness of approximately 10, 5, and 0.2 mm, respectively. Every strip was stretched to the breaking point while recording the force and elongation under the influence of 0.5 mm/min cross-head speed. Five nanofiber samples from each material were tested to ensure the reproducibility of the data.

3. Results and Discussion

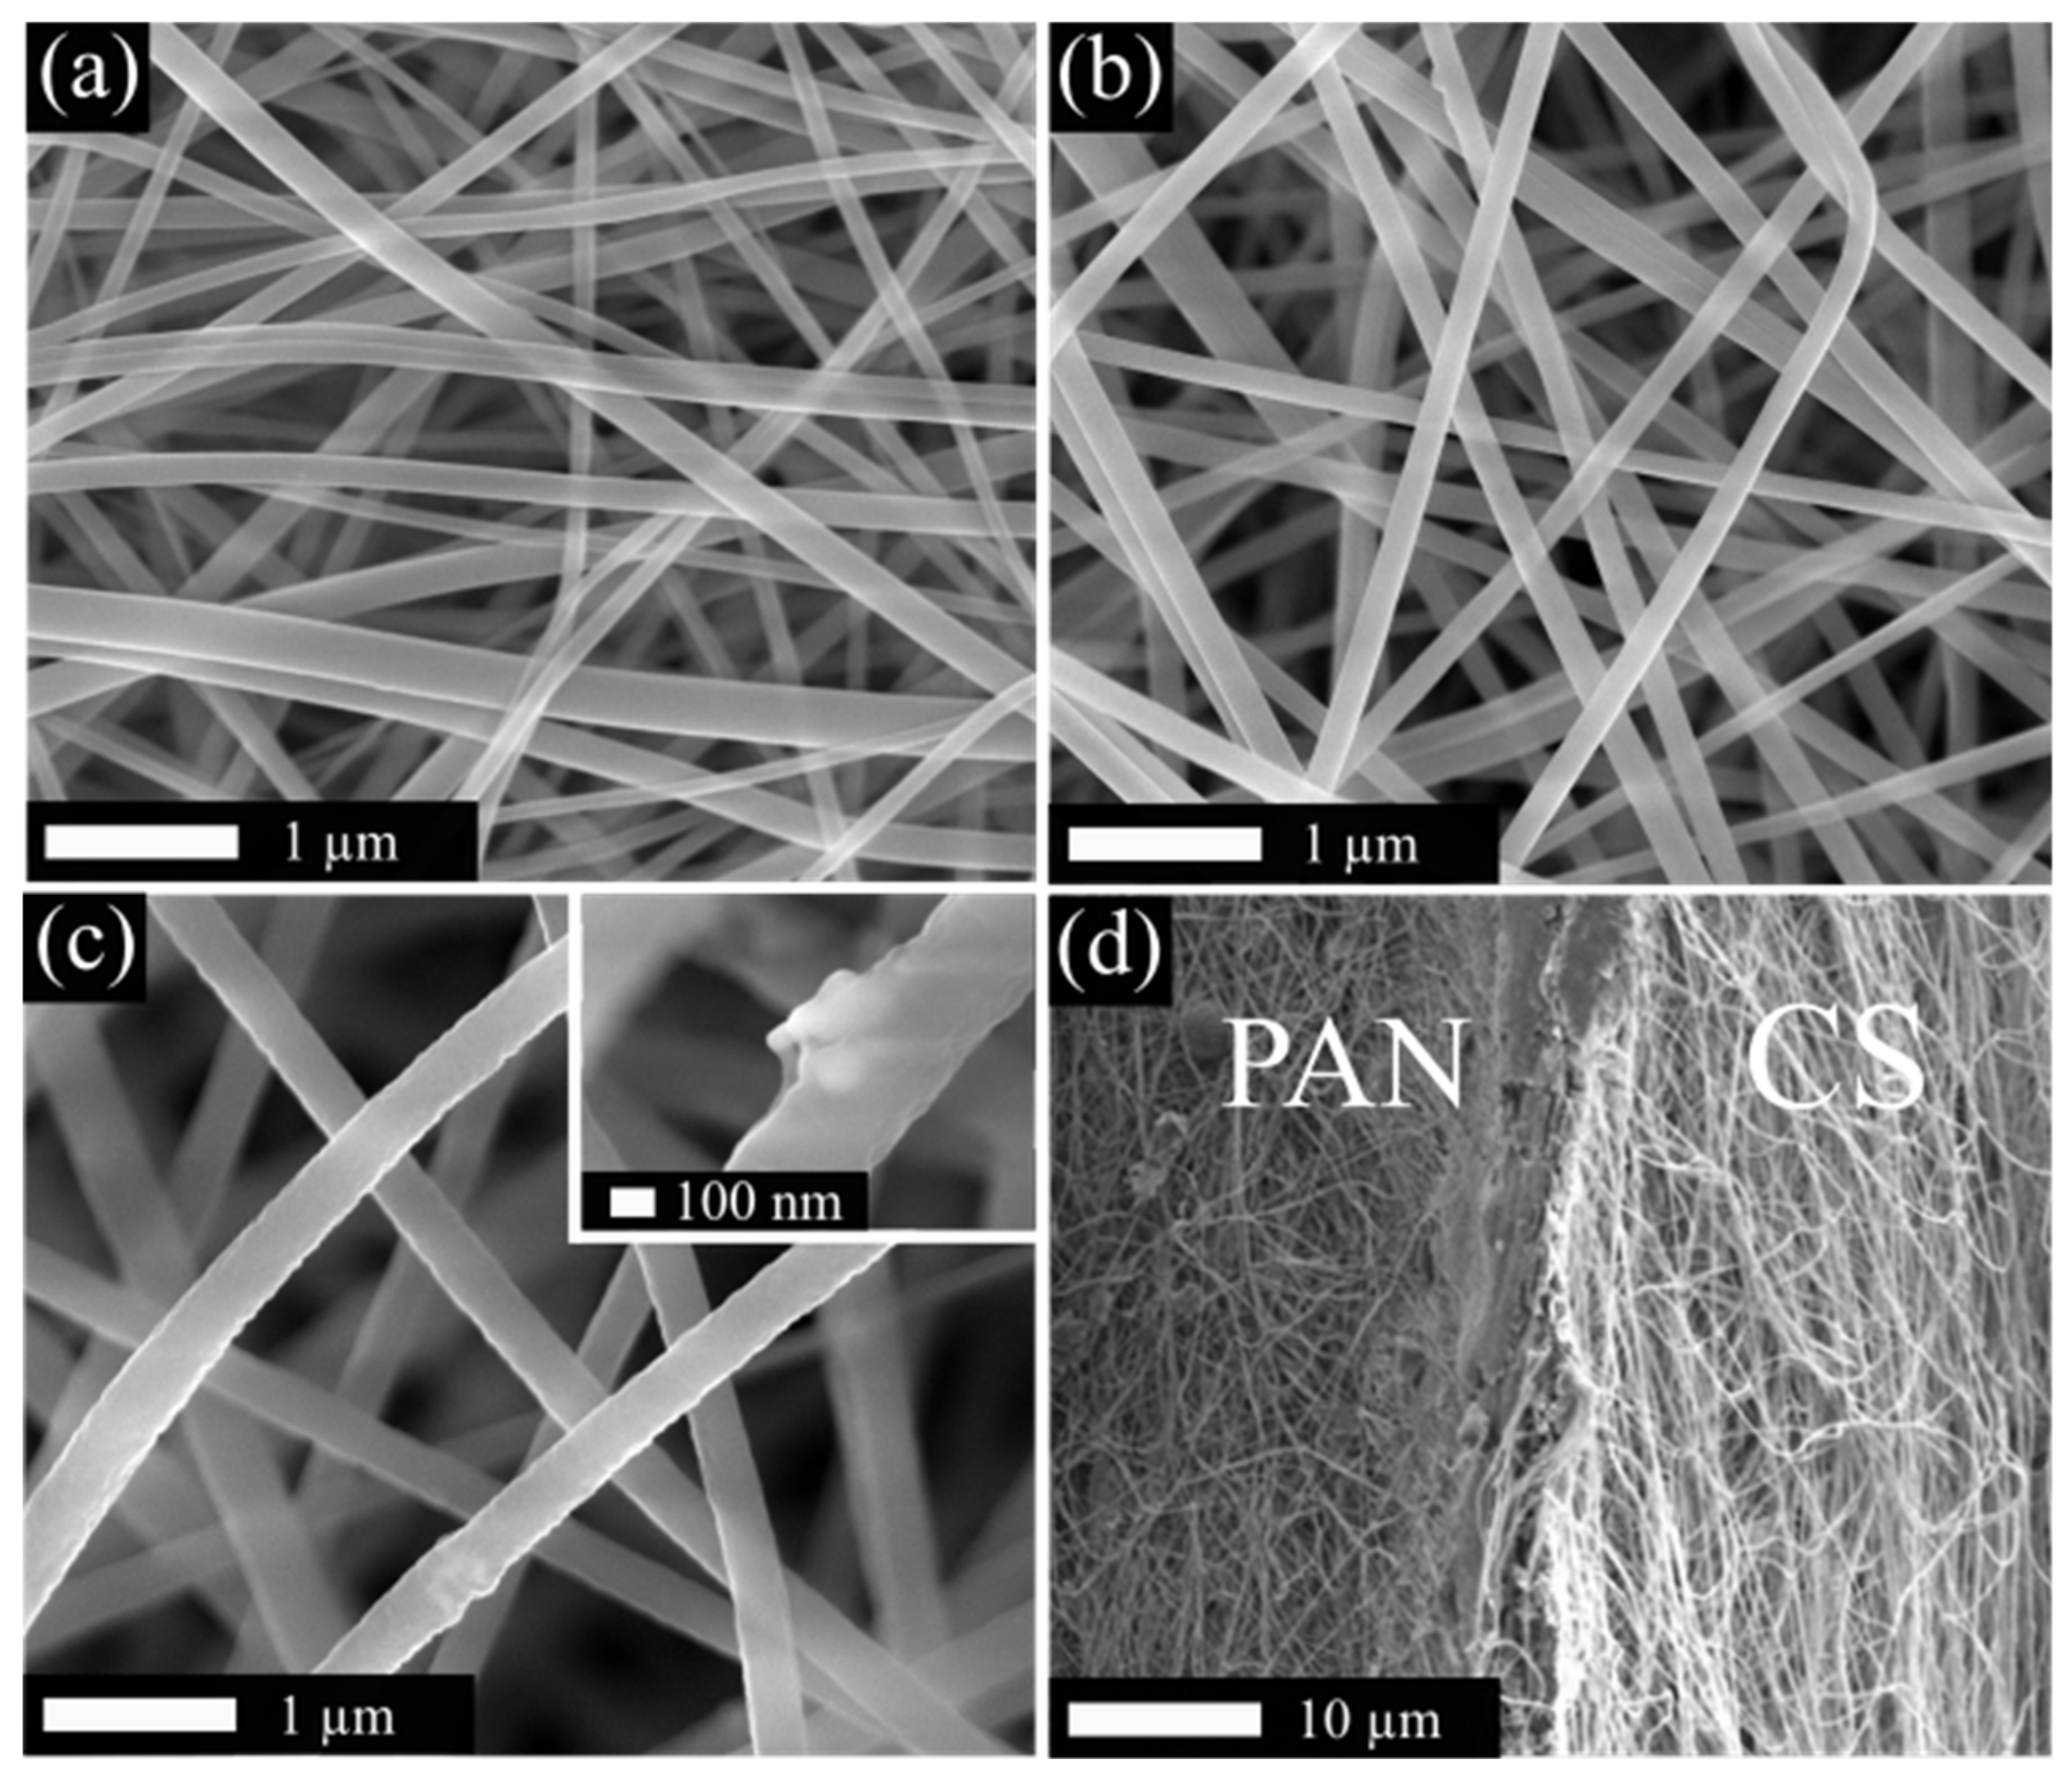
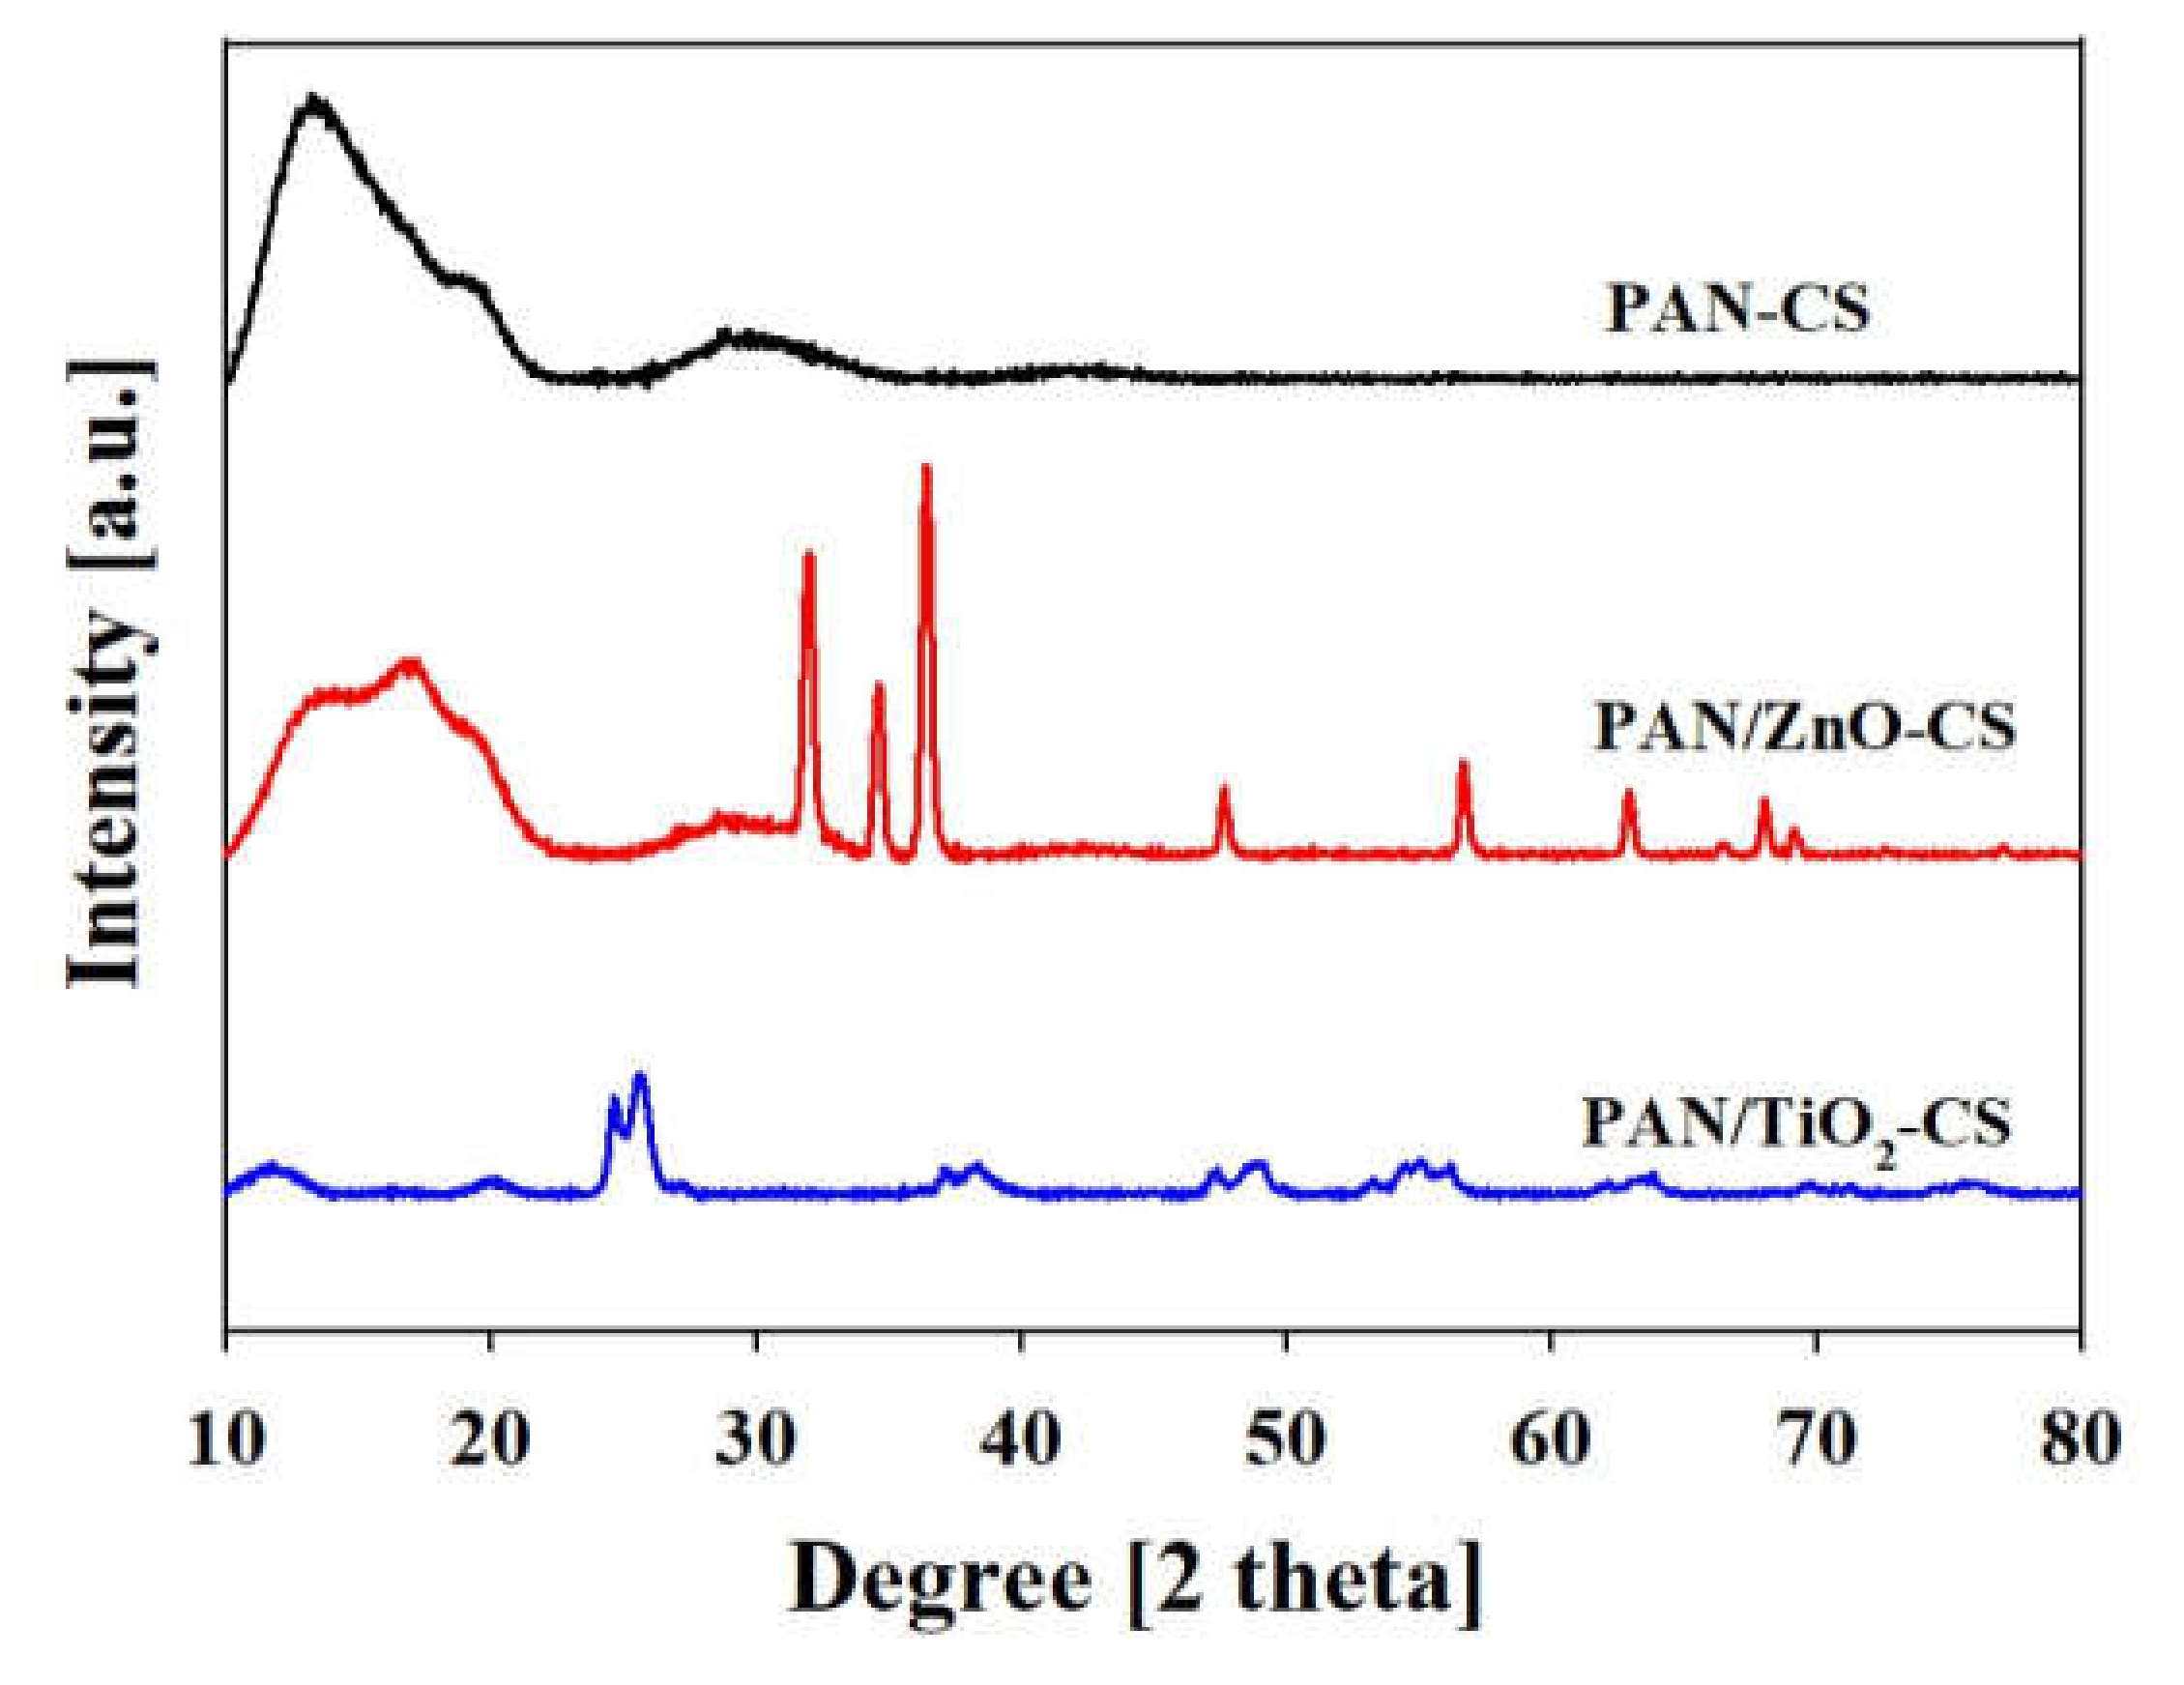
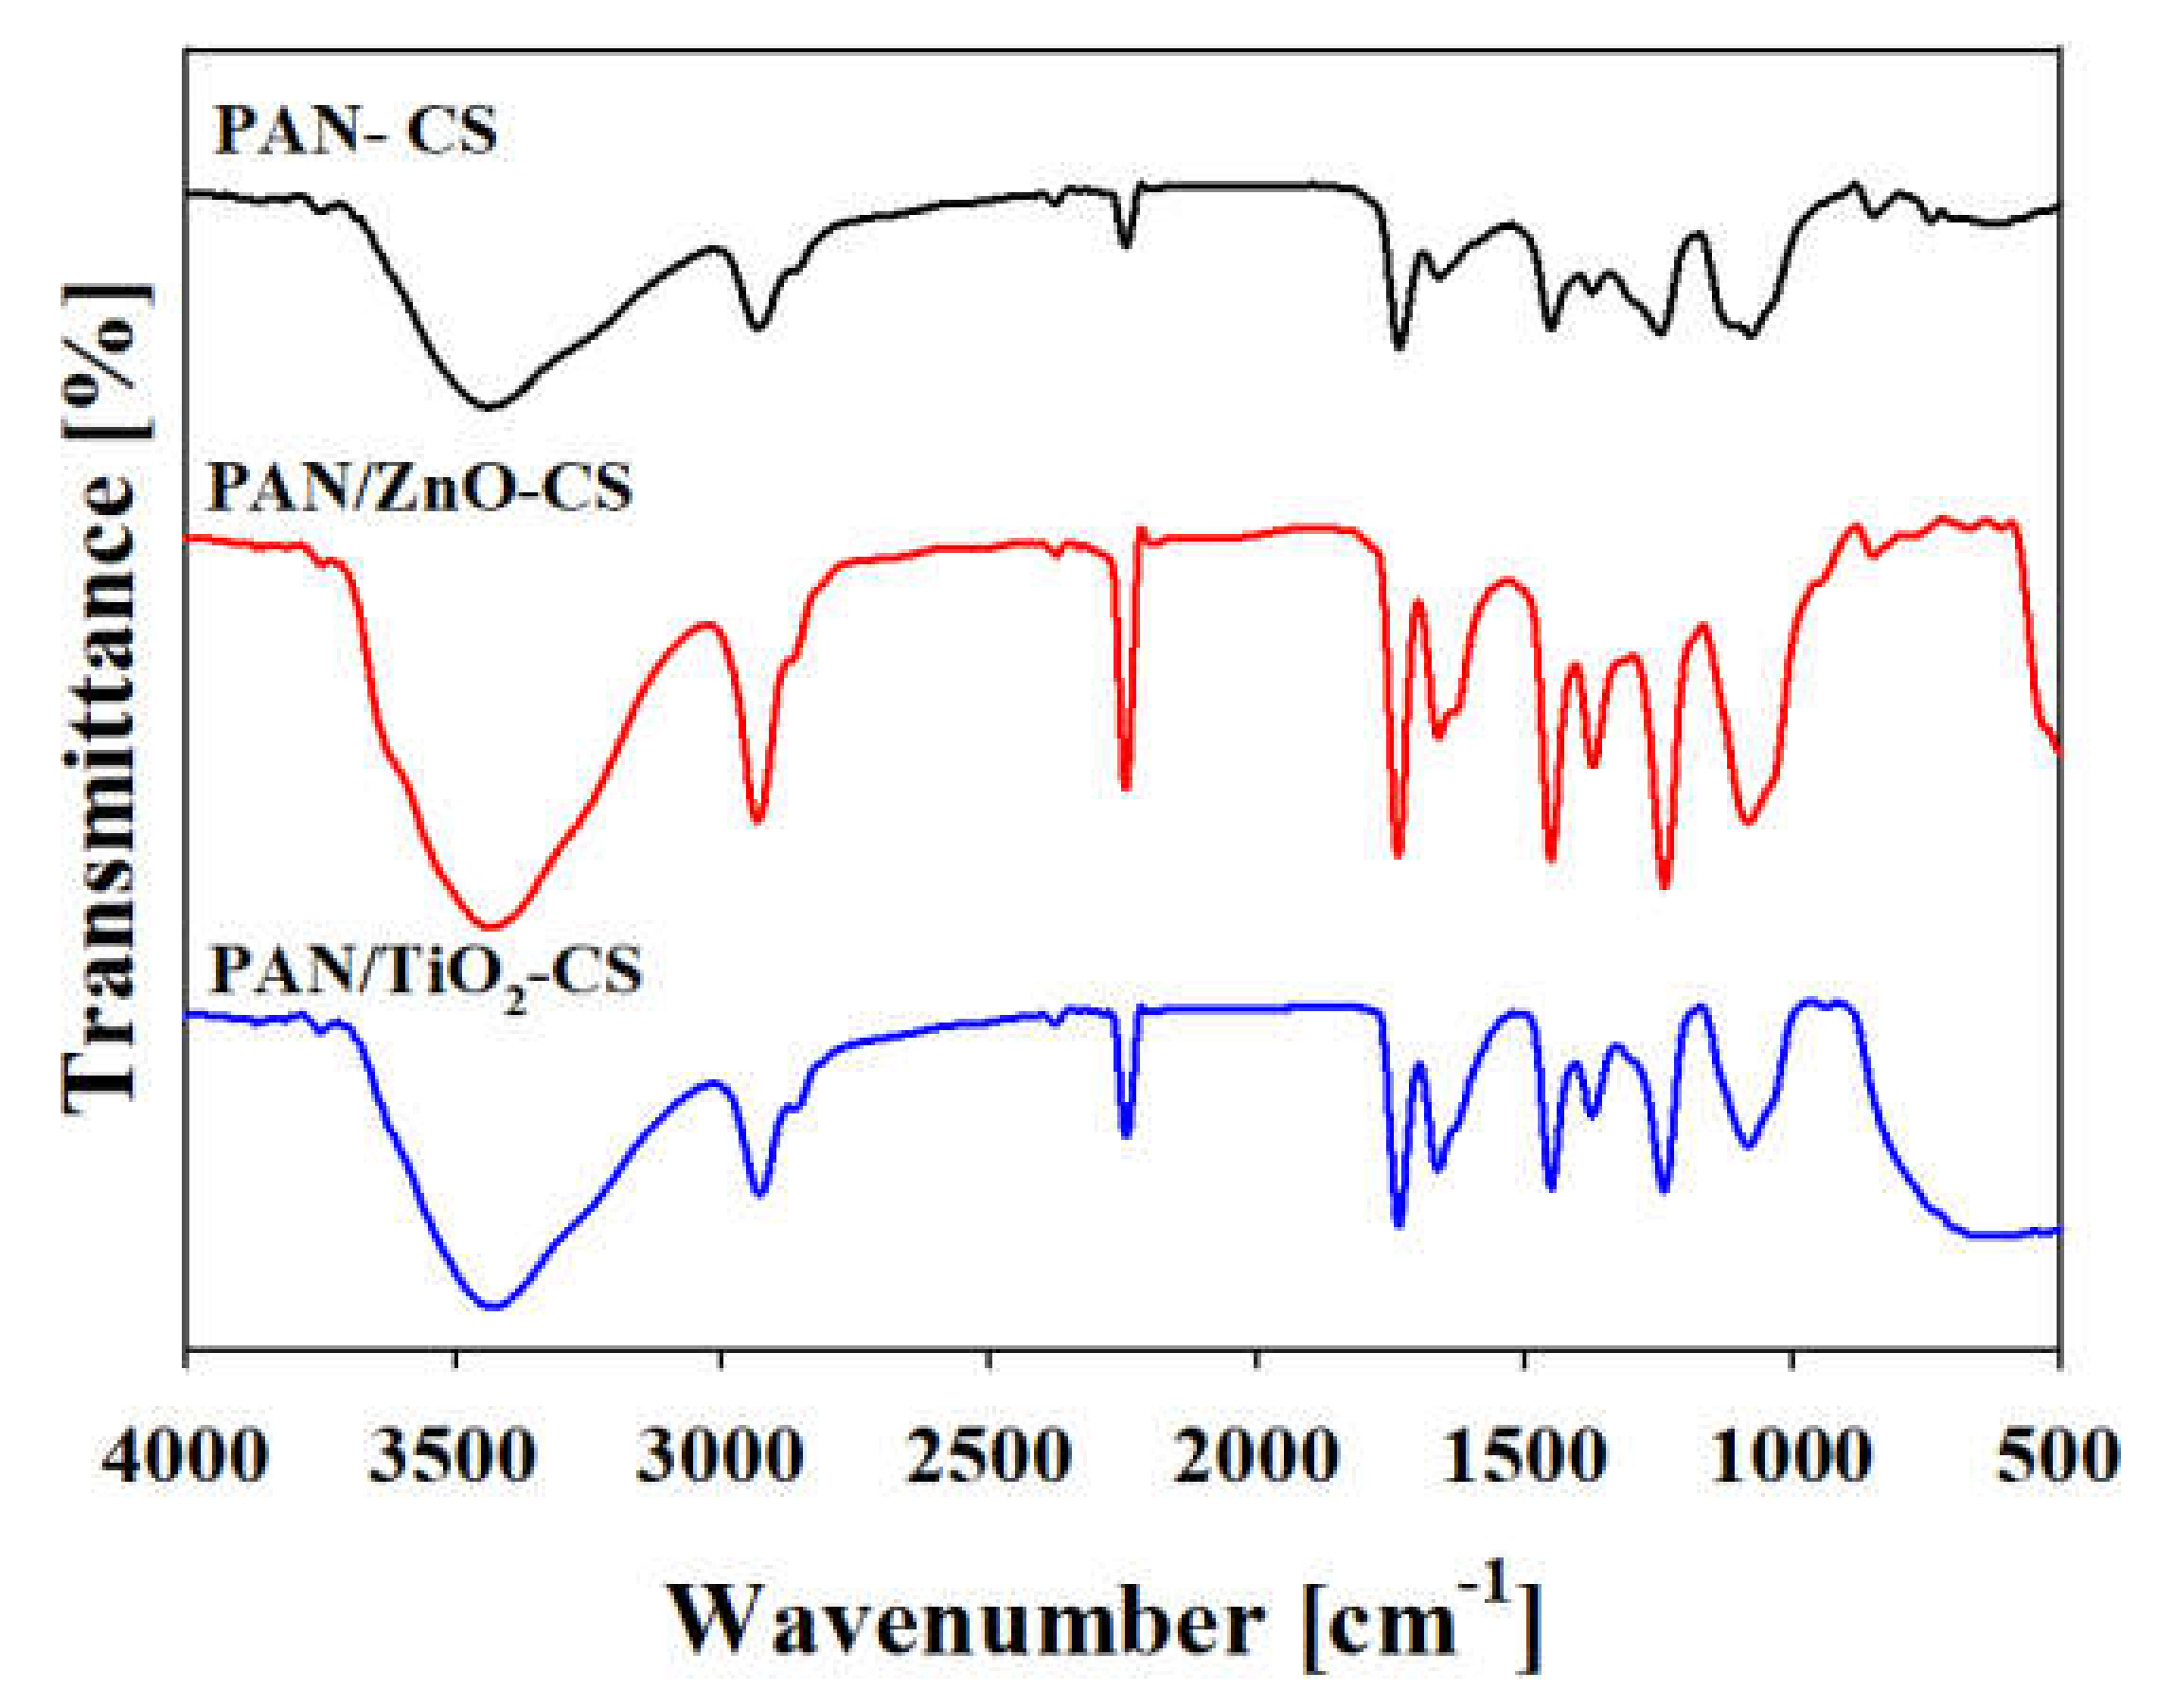
3.1. Characterization of the Bilayer Nanofiber Mat

In Figure 1, SEM images of the bilayer PAN–CS mat from the sides of the PAN (Figure 1a) and CS (Figure 1b) layers are shown. Both the PAN and CS layers have bead-free nanofibers with average diameters of 122 ± 52 and 147 ± 22 nm, respectively. The image of PAN/MO–CS from the side of PAN/MO is shown in Figure 1c where ZnO nanoparticles are used in this case. The agglomeration of MO (for both ZnO and TiO2) nanoparticles and the PAN/MO nanofibers surface roughness increase were observed in our electrospun mats. After incorporating MO nanoparticles into the electrospinning solution, the solution becomes more viscous, resulting in an increase in surface roughness as discussed in previous reports [32,33]. Moreover, the presence of MO agglomerates in the nanofiber structure can largely influence the mechanical properties of the bilayers. This matter will be discussed in a later section of this study. Figure 1d shows the cross-section of the PAN–CS bilayer at the interface. It can be seen that the PAN mat is uniformly covered with a thin layer of CS. The CS layer was neither detachable nor distinguishable from the PAN layer with the naked eye, indicating an excellent interaction between the nanofibers of both layers. These linkages between the nanofibers can facilitate the load transfer between the two layers and can enhance the mechanical properties of the bilayer PAN/MO–CS mats, as explained later in the mechanical discussion. The average thicknesses of the PAN and CS layers were approximately 255 and 275 µm, respectively.
Metal oxide nanoparticles presence in the bilayer mats was verified using XRD (Figure 2). The ZnO diffraction peaks were observed at 31°, 34°, 36°, 48°, 57°, 63°, and 67° 2θ angles, which correspond to the (100), (002), (101), (102), (110), (103), and (201) crystallographic planes, respectively [34]. For TiO2, the strong anatase diffraction peak observed at a 2θ of 25° is the (101) crystallographic plane. Moreover, the small peaks at 2θ of 37°, 49°, 54°, and 63° are the (103), (200), (211), and (204) planes of TiO2, respectively [32].
The FTIR spectra of the electrospun bilayers is shown in Figure 3. The peaks observed at 2244, 1736, and 1450 cm−1 in the FTIR spectrum are attributed to the presence of PAN. Furthermore, these peaks correspond to the C≡N, C=O, and C—O groups stretching vibrations, respectively [35]. The peaks of CS were observed in the range of 3500–2900 cm−1 and correspond to the –NH2 and hydroxyl groups stretching vibrations. The peak at 1424 cm−1 can be attributed to the amide I of the remaining acetamide group [36]. The spectrum illustrates that the bilayer nanofiber mats incorporating metal oxide nanoparticles show no extra peaks compared to the PAN–CS nanofiber mats, indicating only physical interactions between the layers [24,32].

3.2. Adsorption Study

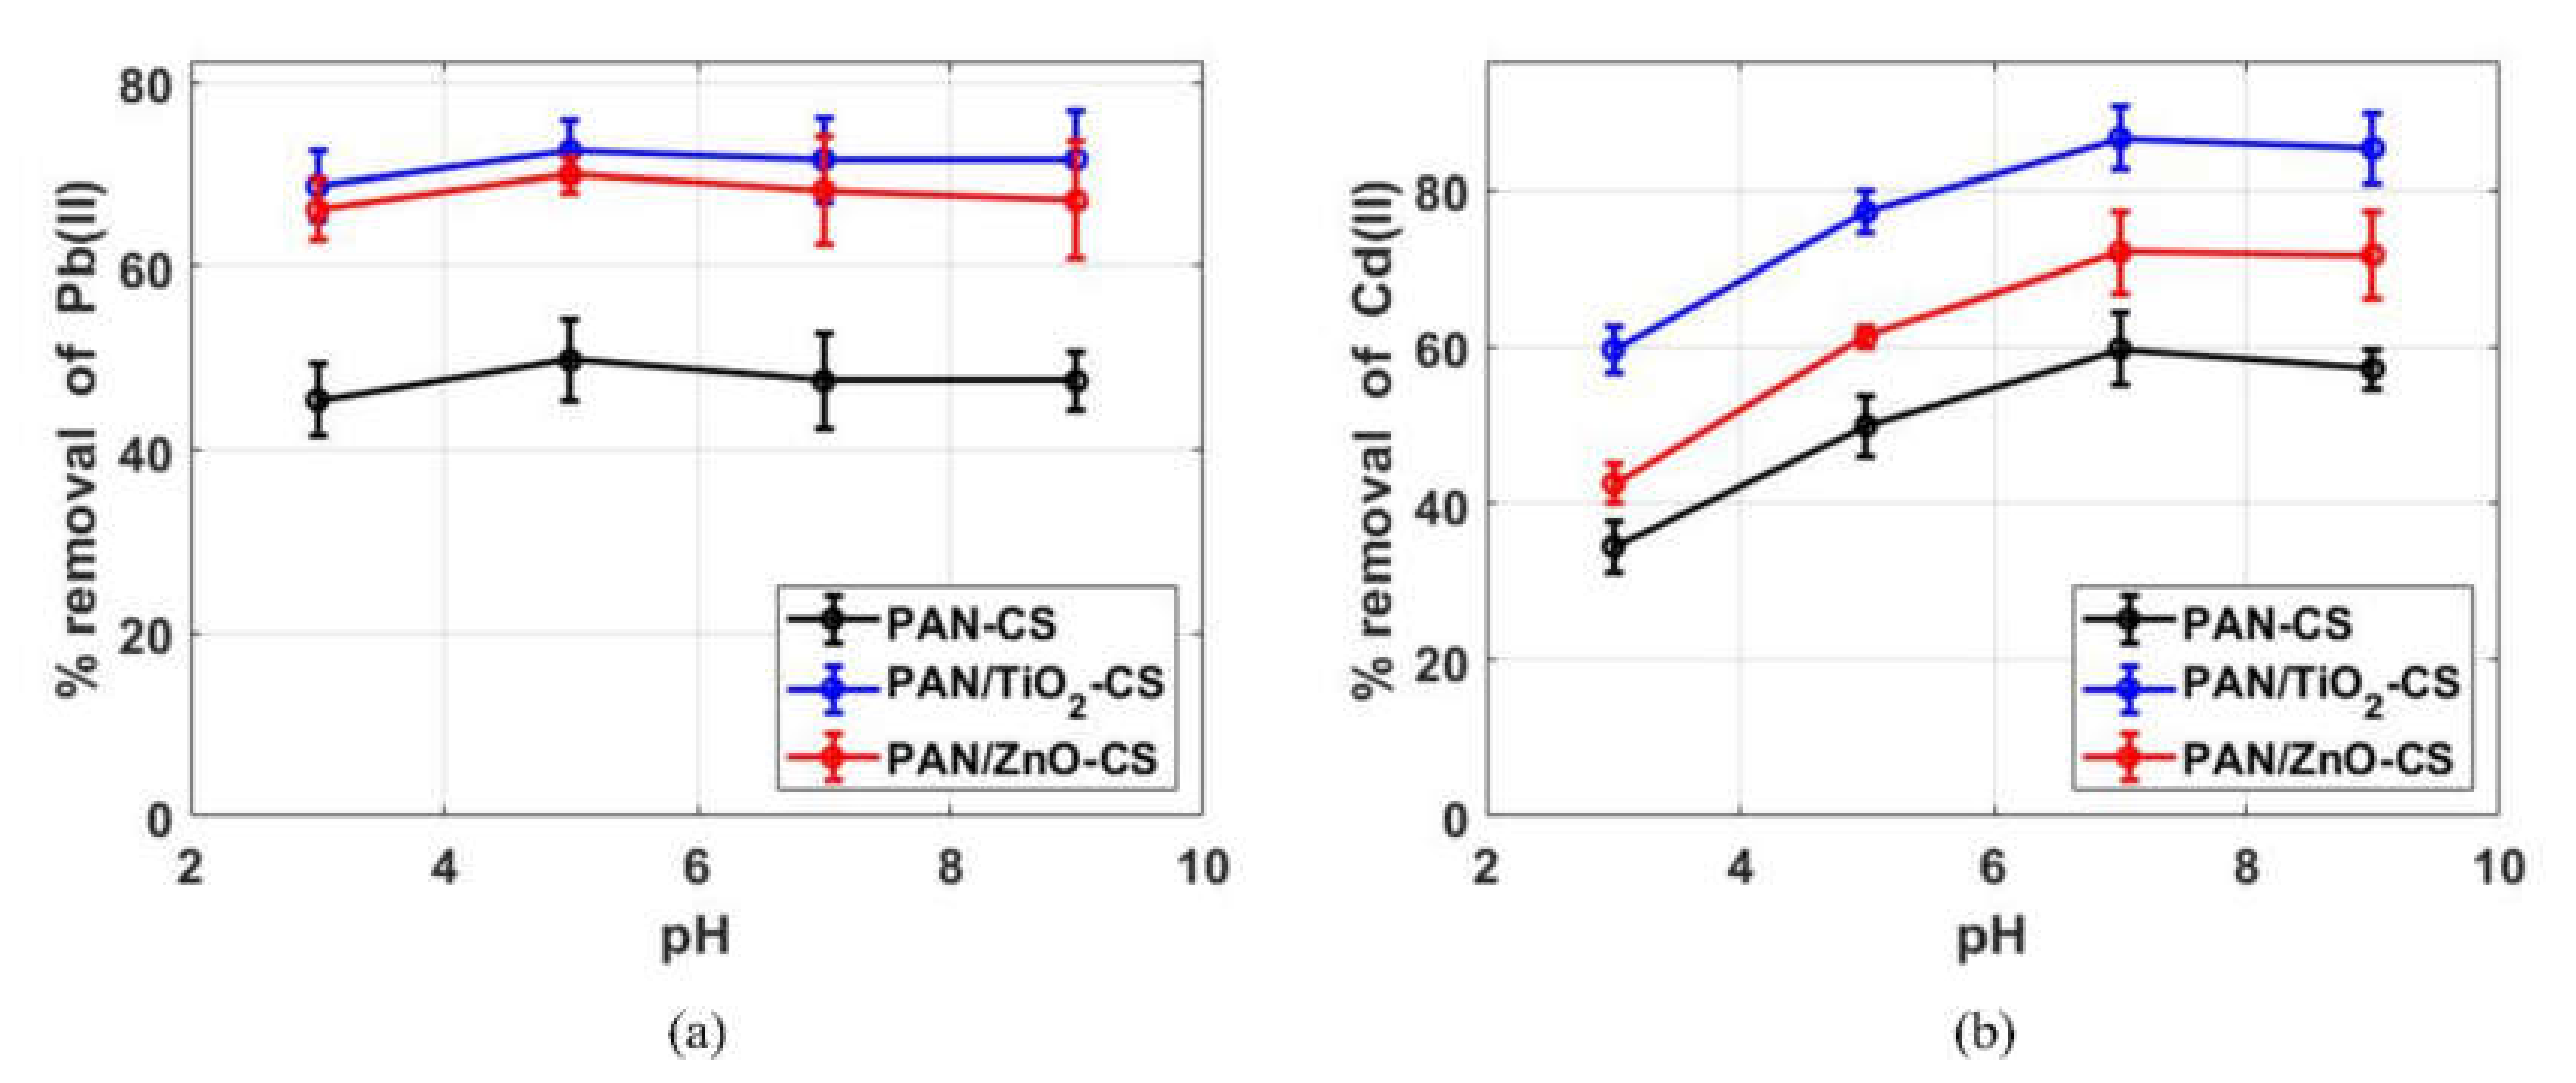
3.2.1. pH Effect on Metal Ion Adsorption

The metal ion adsorption properties can be largely affected by the solution pH. In this work, lead and cadmium removal percentages were investigated in solutions of 3.0, 5.0, 7.0, and 9.0 pH. The acidic and basic solutions were prepared by adding acetic acid and sodium hydroxide to water. An 18 mg piece of the nanofiber mat was immersed in 15 mL of 200 mg/L lead or cadmium solution at room temperature for 5 min. Figure 4 shows the pH influence on the metal ions removal percentage by the bilayer mats. Cadmium ions removal percentage for all the nanofiber mats clearly increased as the pH increased and reached a saturation level at 7.0 pH. For lead ions removal percentage, the increase in pH did not have a significant effect on the removal percentage. 5 pH was chosen for the removal of lead ions since maximum adsorption occurs at this pH level. At low pH values, the surface hydroxyl group protonation could result in repulsive electrostatic interaction between the lead and cadmium ions and the positively charged surface sites, resulting in unfavorable adsorption [37,38]. The deprotonation that occurs with increasing the pH value leads to an enhancement in the attachment of toxic metal ions onto the surface [39,40].
The adsorbent’s point of zero charge (pHpzc) in solution, a point where the adsorbent surface charge density is equal to zero, could better explain how adsorption properties are affected by the pH [41,42]. The surface charge of the nanofiber surface is negative at a pH value above the pHpzc, a condition under which adsorption is usually favorable because of the attractive electrostatic interactions between heavy metal cations and negatively charged surface sites. The pHpzc can be obtained by determining the point of intersection of the pHinitial vs. pHfinal curve and the pHinitial = pHfinal line. The pHpzc for our bilayer PAN/MO–CS (for both ZnO and TiO2) nanofibers in the absence of lead and cadmium ions was very close to 7.1 (see Figure S1 in the Supplementary Information). Therefore, a pH value of 7.0 was used for the metal ion adsorption in all the subsequent studies.

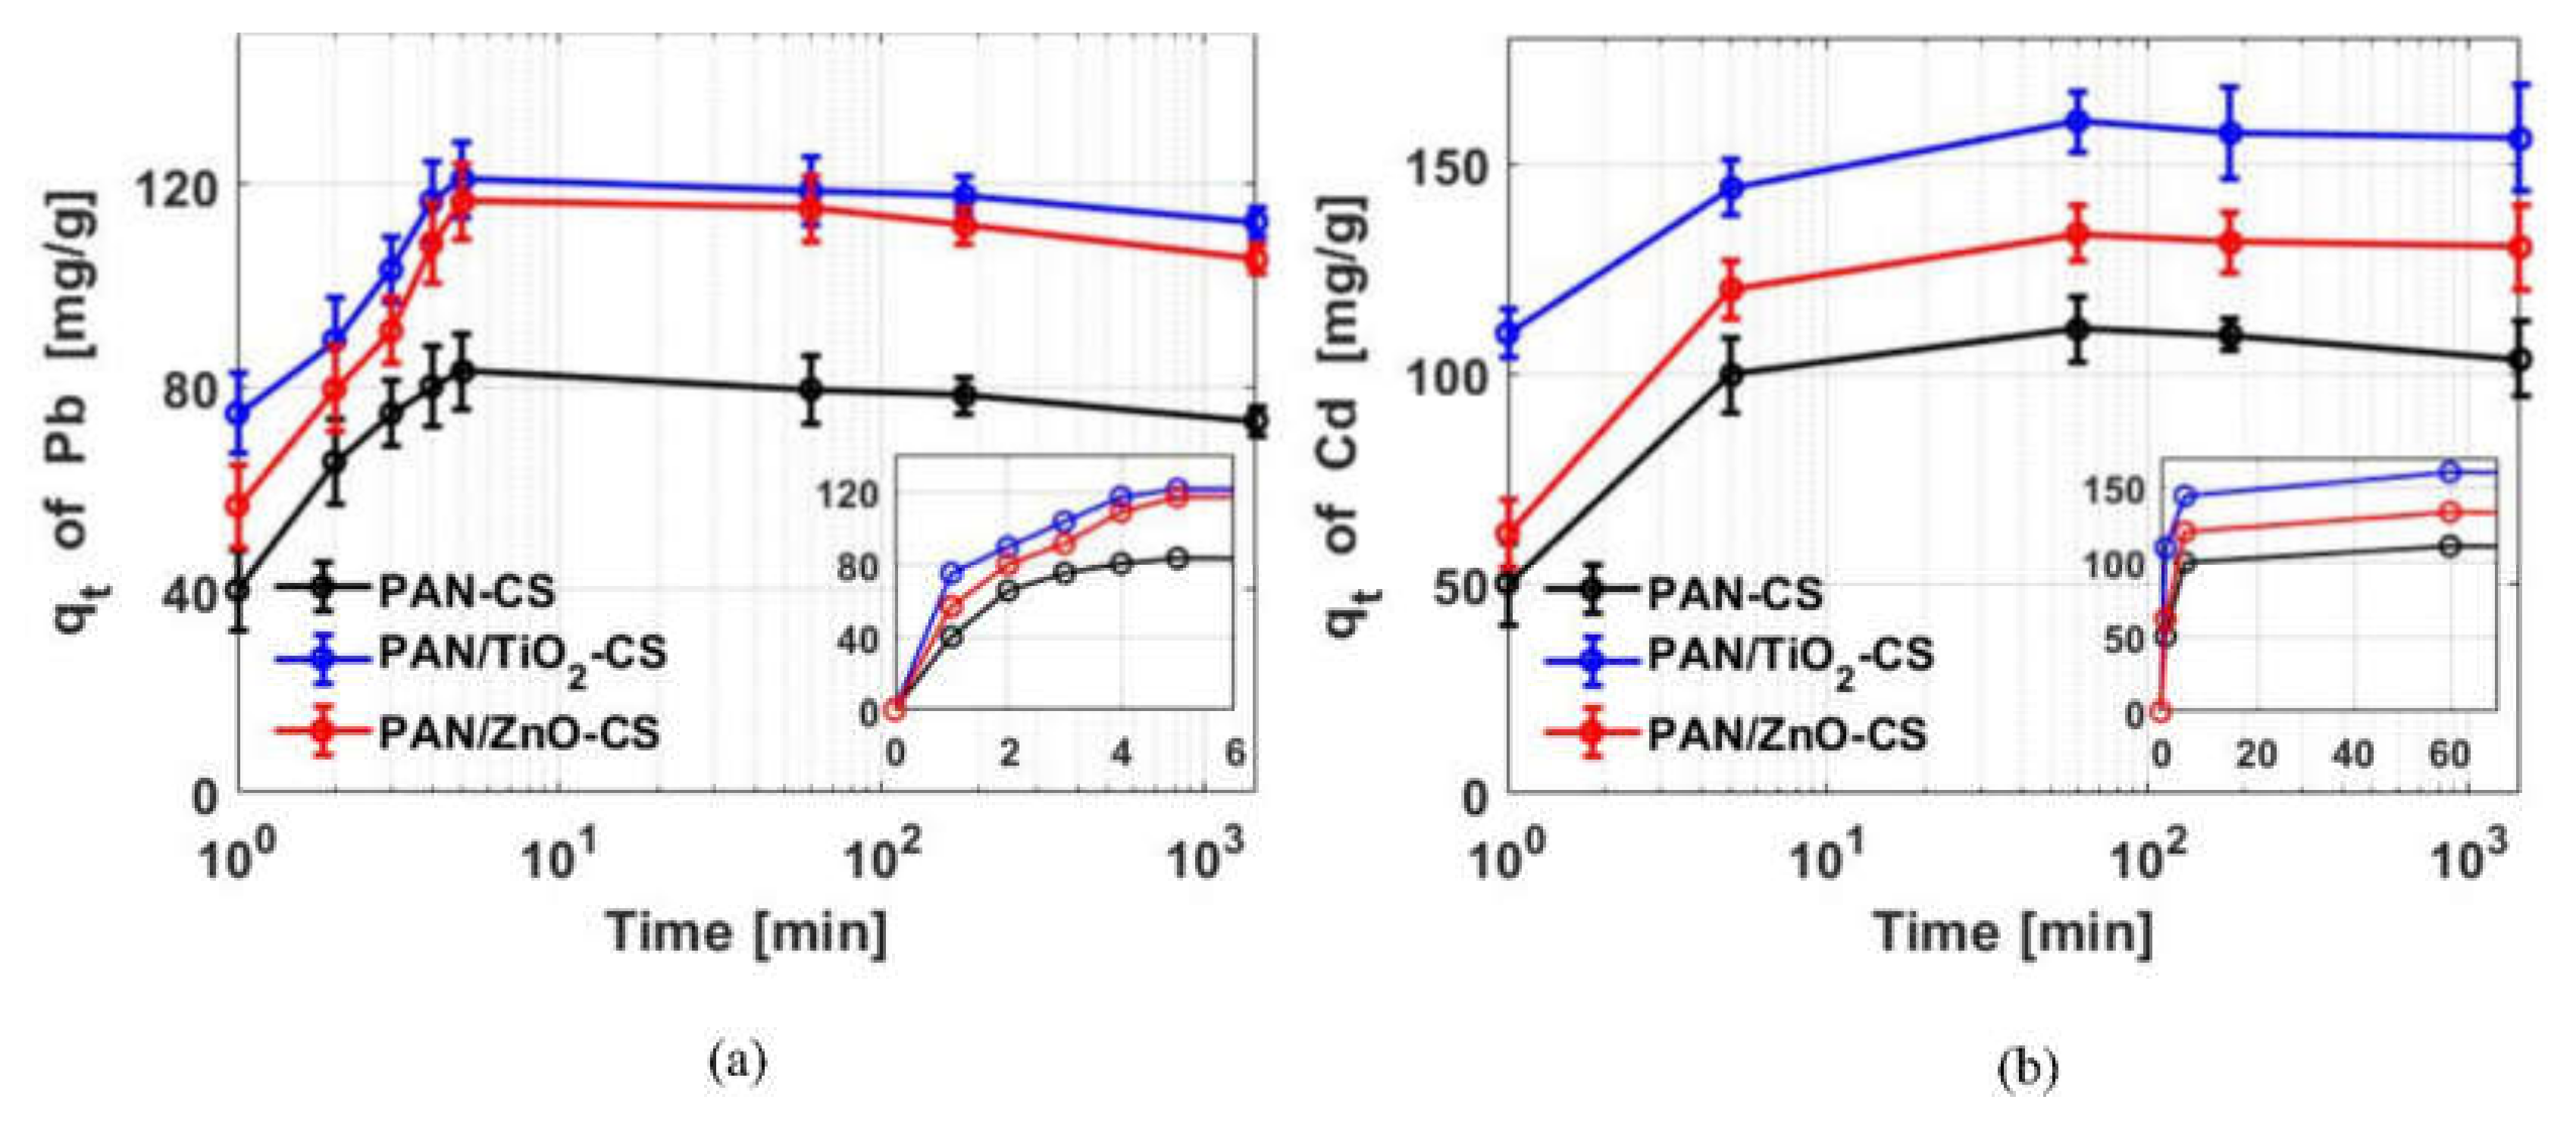
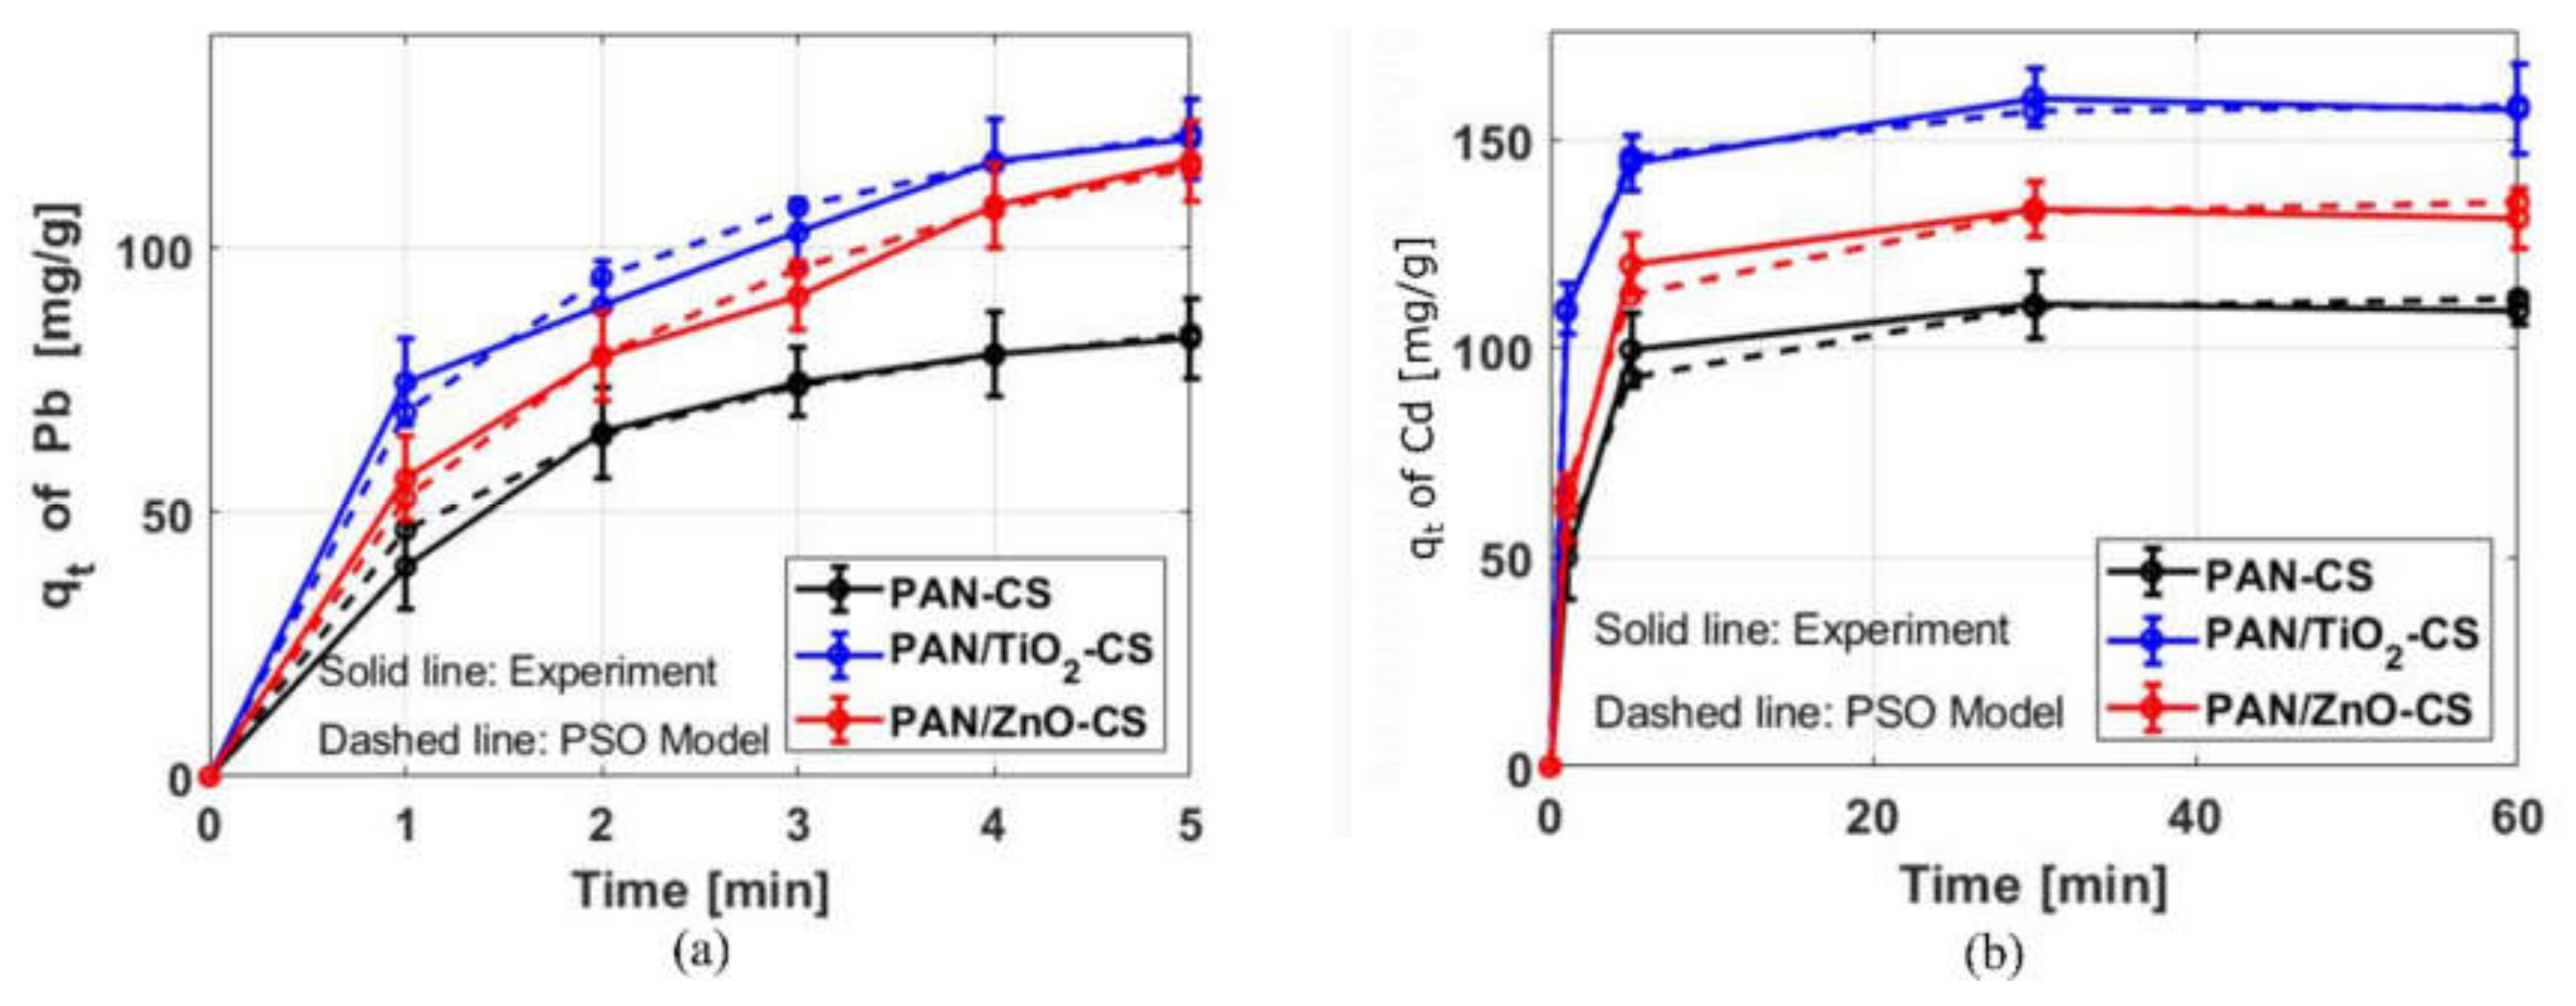
3.2.2. Adsorption Kinetics

In the kinetics experiment, the contact time effect is observed by recording the amounts of adsorbate (heavy metal ions) uptake per mass of adsorbent at different times t (qt). Figure 5 shows the influence of different contact times on the toxic metal ion adsorption onto the bilayer mats. The insets in the figure illustrate the adsorption capacity until equilibrium over a regular (linear) time scale. Equilibrium of adsorption capacity of both lead and cadmium ions was reached within 5 and 60 min, respectively, for all the nanofibers. At equilibrium, the adsorption capacity of the heavy metal ions by the bilayer with metal oxide nanoparticles is higher than the adsorption capacity obtained by the bilayer with no metal oxide nanoparticles by approximately 50%. At equilibrium, the best metal ion adsorption was exhibited by the bilayer incorporating TiO2 with capacities of 127 and 160 mg/g for lead and cadmium, respectively, while the bilayer PAN–CS mats exhibited adsorption capacities of lead and cadmium of 83 and 110 mg/g, respectively. The enhanced PAN/MO–CS adsorption performance is due to the increased surface area associated with the introduction of two nanofibrous layers and MO nanoparticles. This is also evident based on the fast-reached equilibrium adsorption and the low mean adsorption energy (see the adsorption isotherm section) [43]. To study the stability of the adsorption or the desorption of the heavy metal ions from the bilayer mats surface after reaching adsorption equilibrium, the adsorption data were recorded for a long time after equilibrium was reached. In our kinetics experiments, the desorption of cadmium from the bilayer nanofiber mat was found to be negligible (less than 5%) after 24 h, while the decrease in the adsorption of lead was approximately 10%.
The adsorption performance of the bilayer PAN/MO–CS nanofiber mats is significantly higher than that obtained by the pristine PAN and PAN/MO single layer that were reported in our previous work [9,25]. For example, the adsorption of cadmium by the PAN/TiO2–CS bilayer developed in this study increased by 472% and 191% in comparison to pure PAN and the PAN/TiO2 single layer (160 mg/g vs. 28 and 55 mg/g), respectively. The improvement of the adsorption of lead is less significant than that of the adsorption of cadmium; the adsorption of lead by the PAN/TiO2–CS bilayer increased by approximately 140% and 16% in comparison to pure PAN and the PAN/TiO2 single layer, respectively. Figure 6 compares the adsorption equilibrium capacity (qe) of lead and cadmium using single PAN layer, PAN/MO layer, PAN–CS bilayer, and PAN/MO–CS bilayer. Once again, this remarkable improvement in the adsorption performance is due to the enlarged surface area because of the addition of the CS nanofiber layer and MO nanoparticles into the PAN nanofiber mat.
Usually, two kinetic models are used to analyze the kinetics of adsorption namely, pseudo-first-order (PFO) and pseudo-second-order (PSO) equations [44,45]. The first and second order models can be written, respectively, as
d q t dt = k 1 q e q t ,
d q t dt = k 2 q e q t 2 .
where k 1 and k 2 (min−1) are the rate constants of the PFO and PSO reactions, respectively, and t (min) is the time of adsorption. After integrating the abovementioned differential forms and imposing appropriate boundary conditions, the adsorption capacity at time t can be expressed for the PFO (Equation (5)) and PSO (Equation (6)) models as
q t = q e 1 e k 1   t ,
q t = q e 2   k 2   t 1 + k 2   q e   t .
The kinetic parameters (i.e., k 1 , k 2 , and q e ) in the PFO and PSO models are usually obtained by fitting the linear forms of these equations. Here, we instead employed the nonlinear optimization technique to calculate these parameters, as nonlinear optimization was previously shown to provide better predictions of the kinetic data [46,47]. The comparison of the linear least square method and nonlinear optimization method used to estimate the kinetic parameters is presented in the Supplementary Information (see Table S1). The model’s ability to adequately analyze the adsorption kinetic data was evaluated by determining the mean absolute adsorption error (MAAE), which is defined as
MAAE = 1 N i = 1 N q t i exp q t i model q e exp   ×   100 % .
where q e exp denotes the experimental equilibrium adsorption capacity, and q t i exp and q t i model denote the values of the adsorption capacity at time t using the experimental and kinetic model, respectively. In this work, the PSO model predictions were found to be in closer agreement with the experiments than the PFO model. Figure 7 shows the measured and PSO model predictions of the adsorption capacity of lead and cadmium ions by the bilayer with and without MO nanoparticles nanofibers using the nonlinear optimization method. The mean errors and model parameters for each adsorbent material are summarized in Table 1. It can be seen that the mean errors are very small (maximum error ~ 2.8%), and the calculated equilibrium adsorption capacities achieved from the PSO model are similar to those achieved with experiments. Figure S2 shows the Linear fitting of the PFO and PSO models for the adsorption of cadmium onto PAN–CS and PAN/MO–CS nanofiber mats.

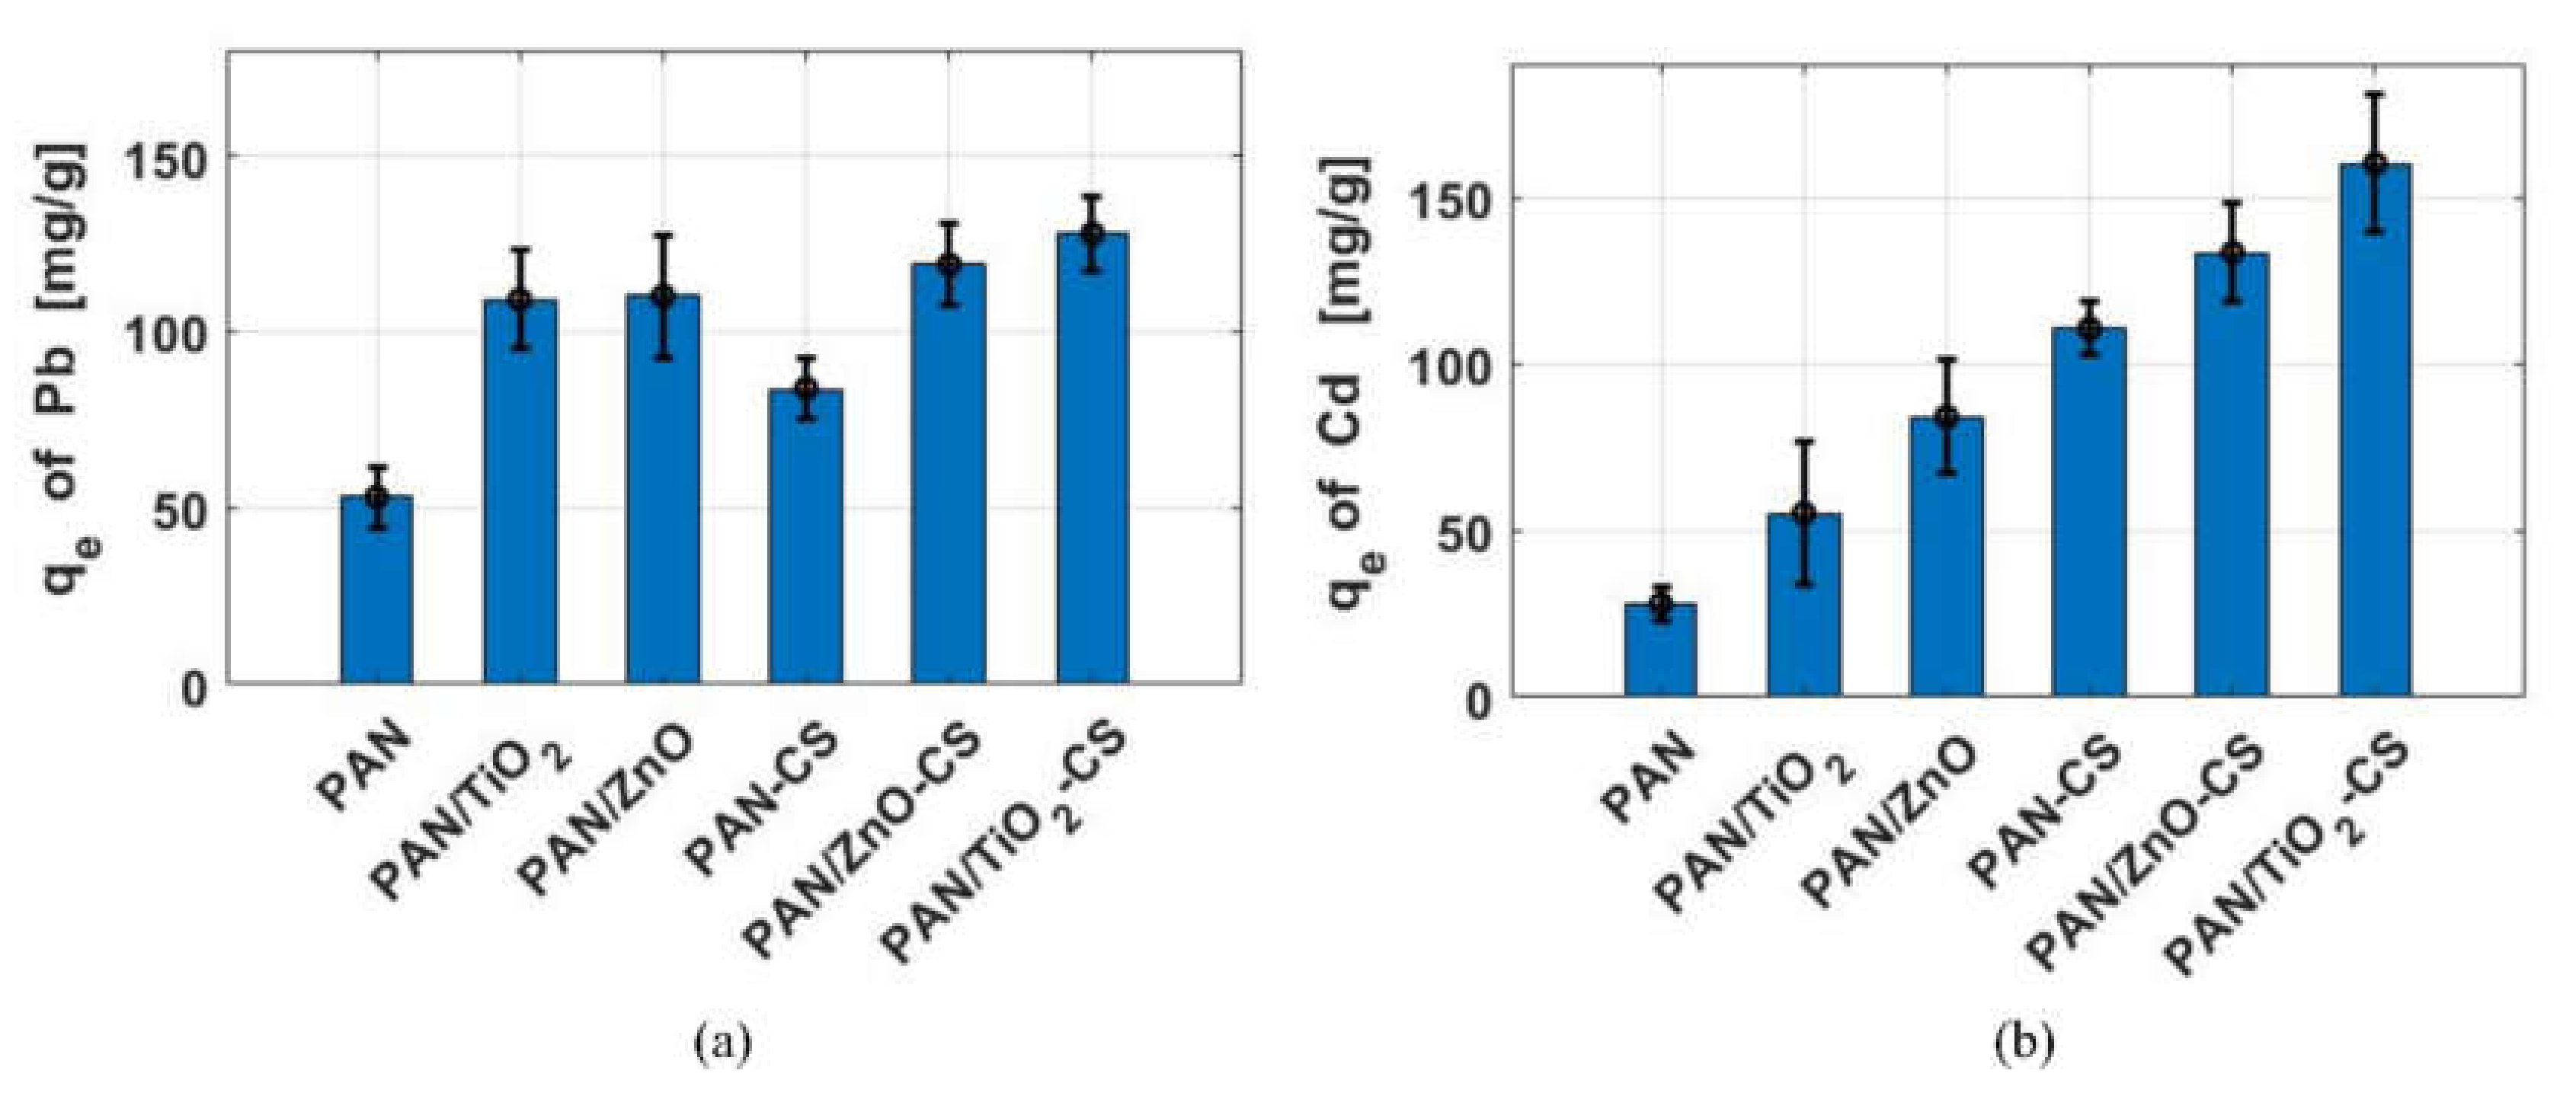
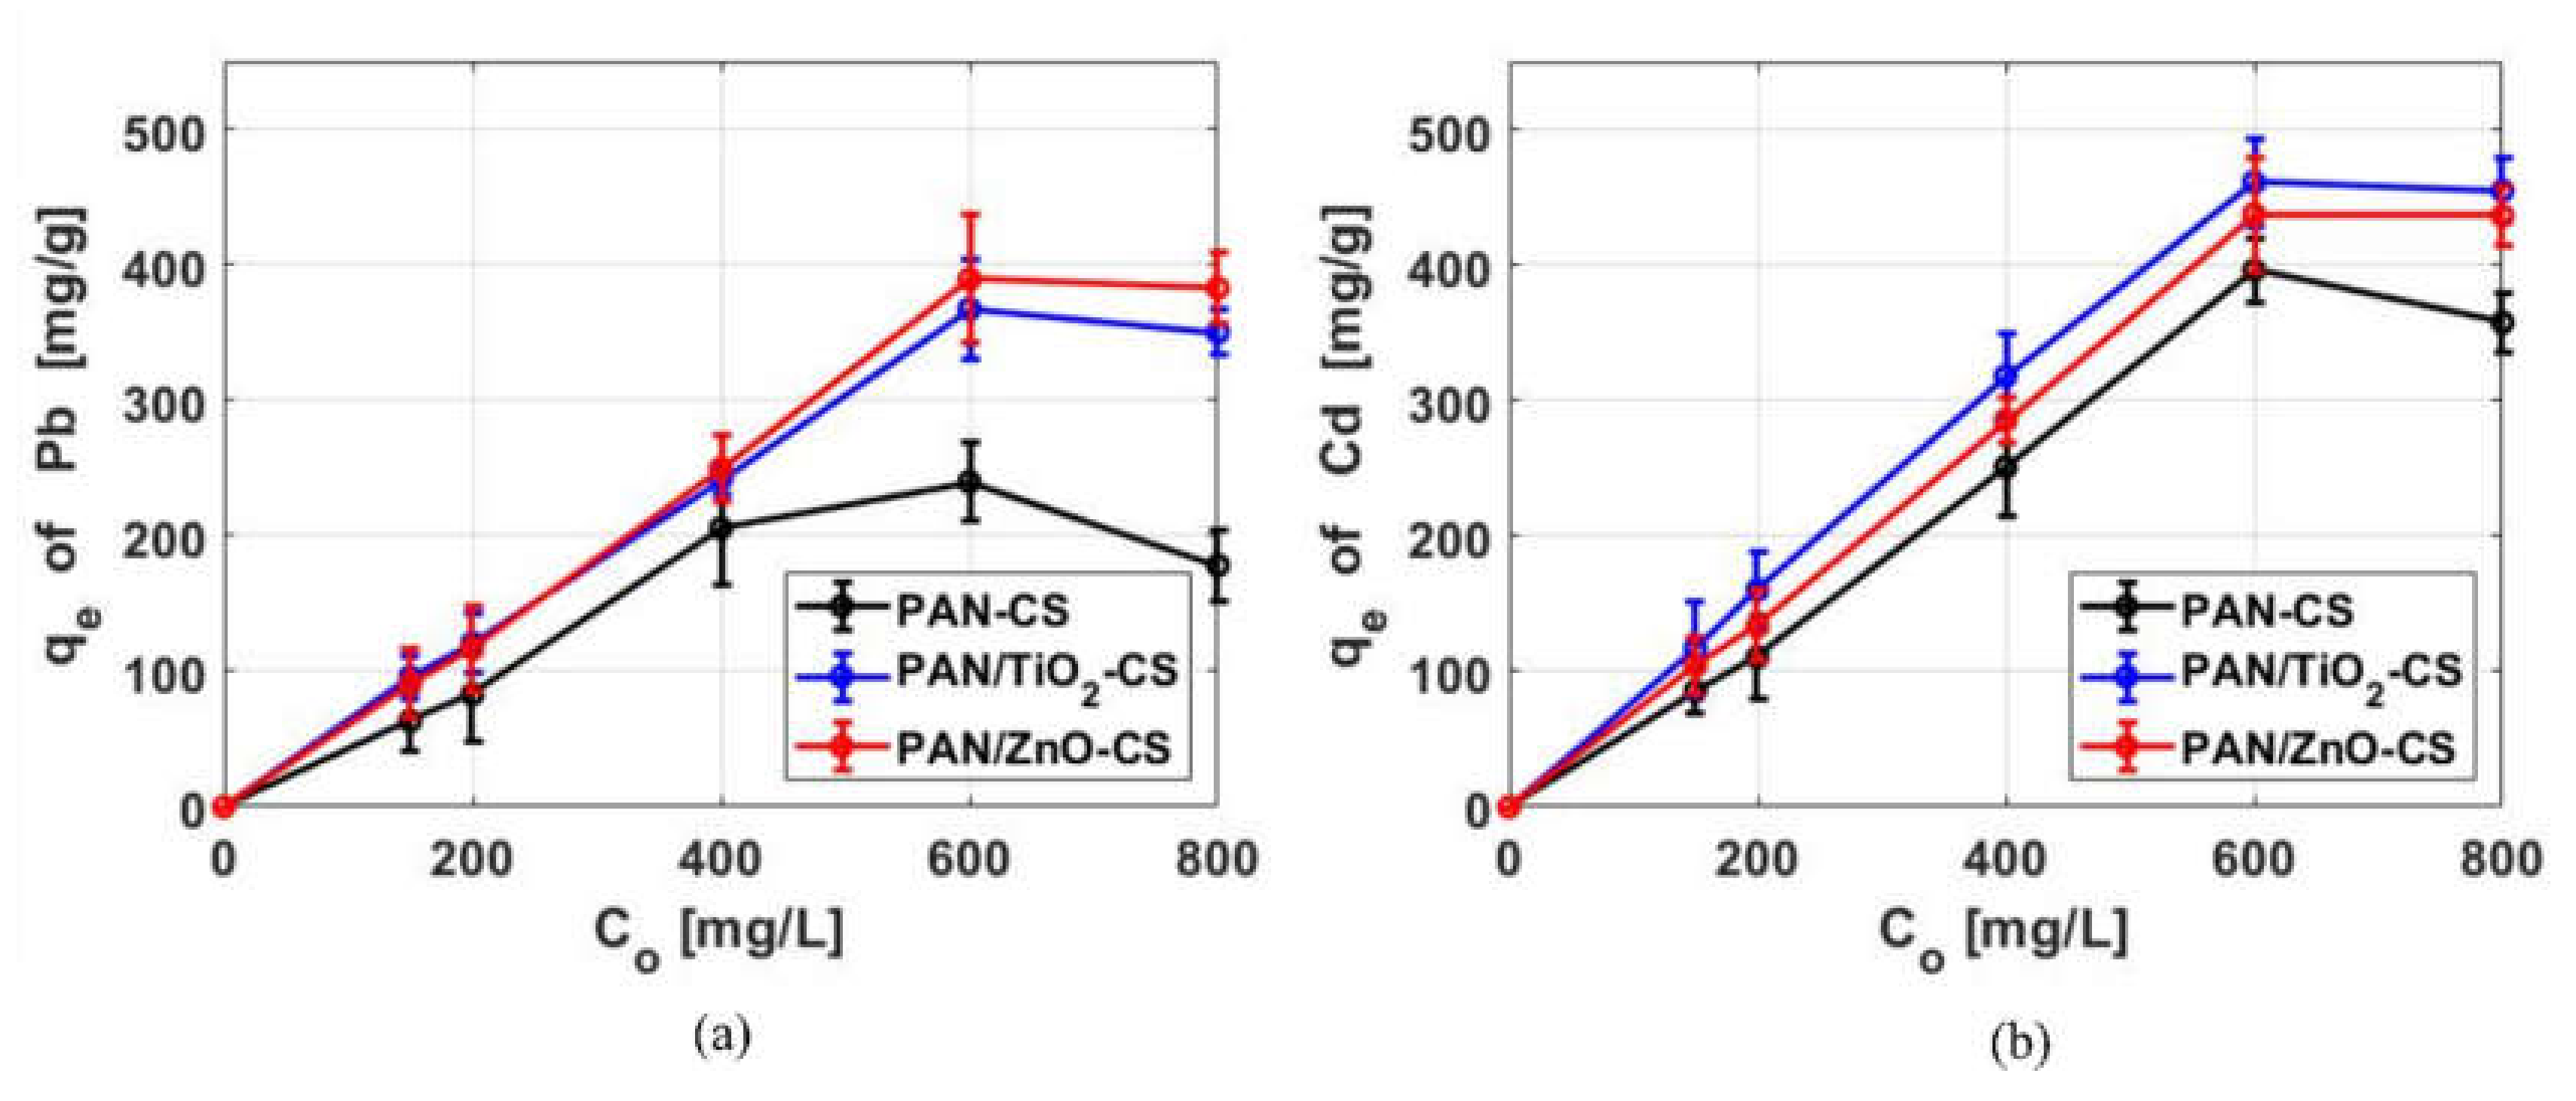
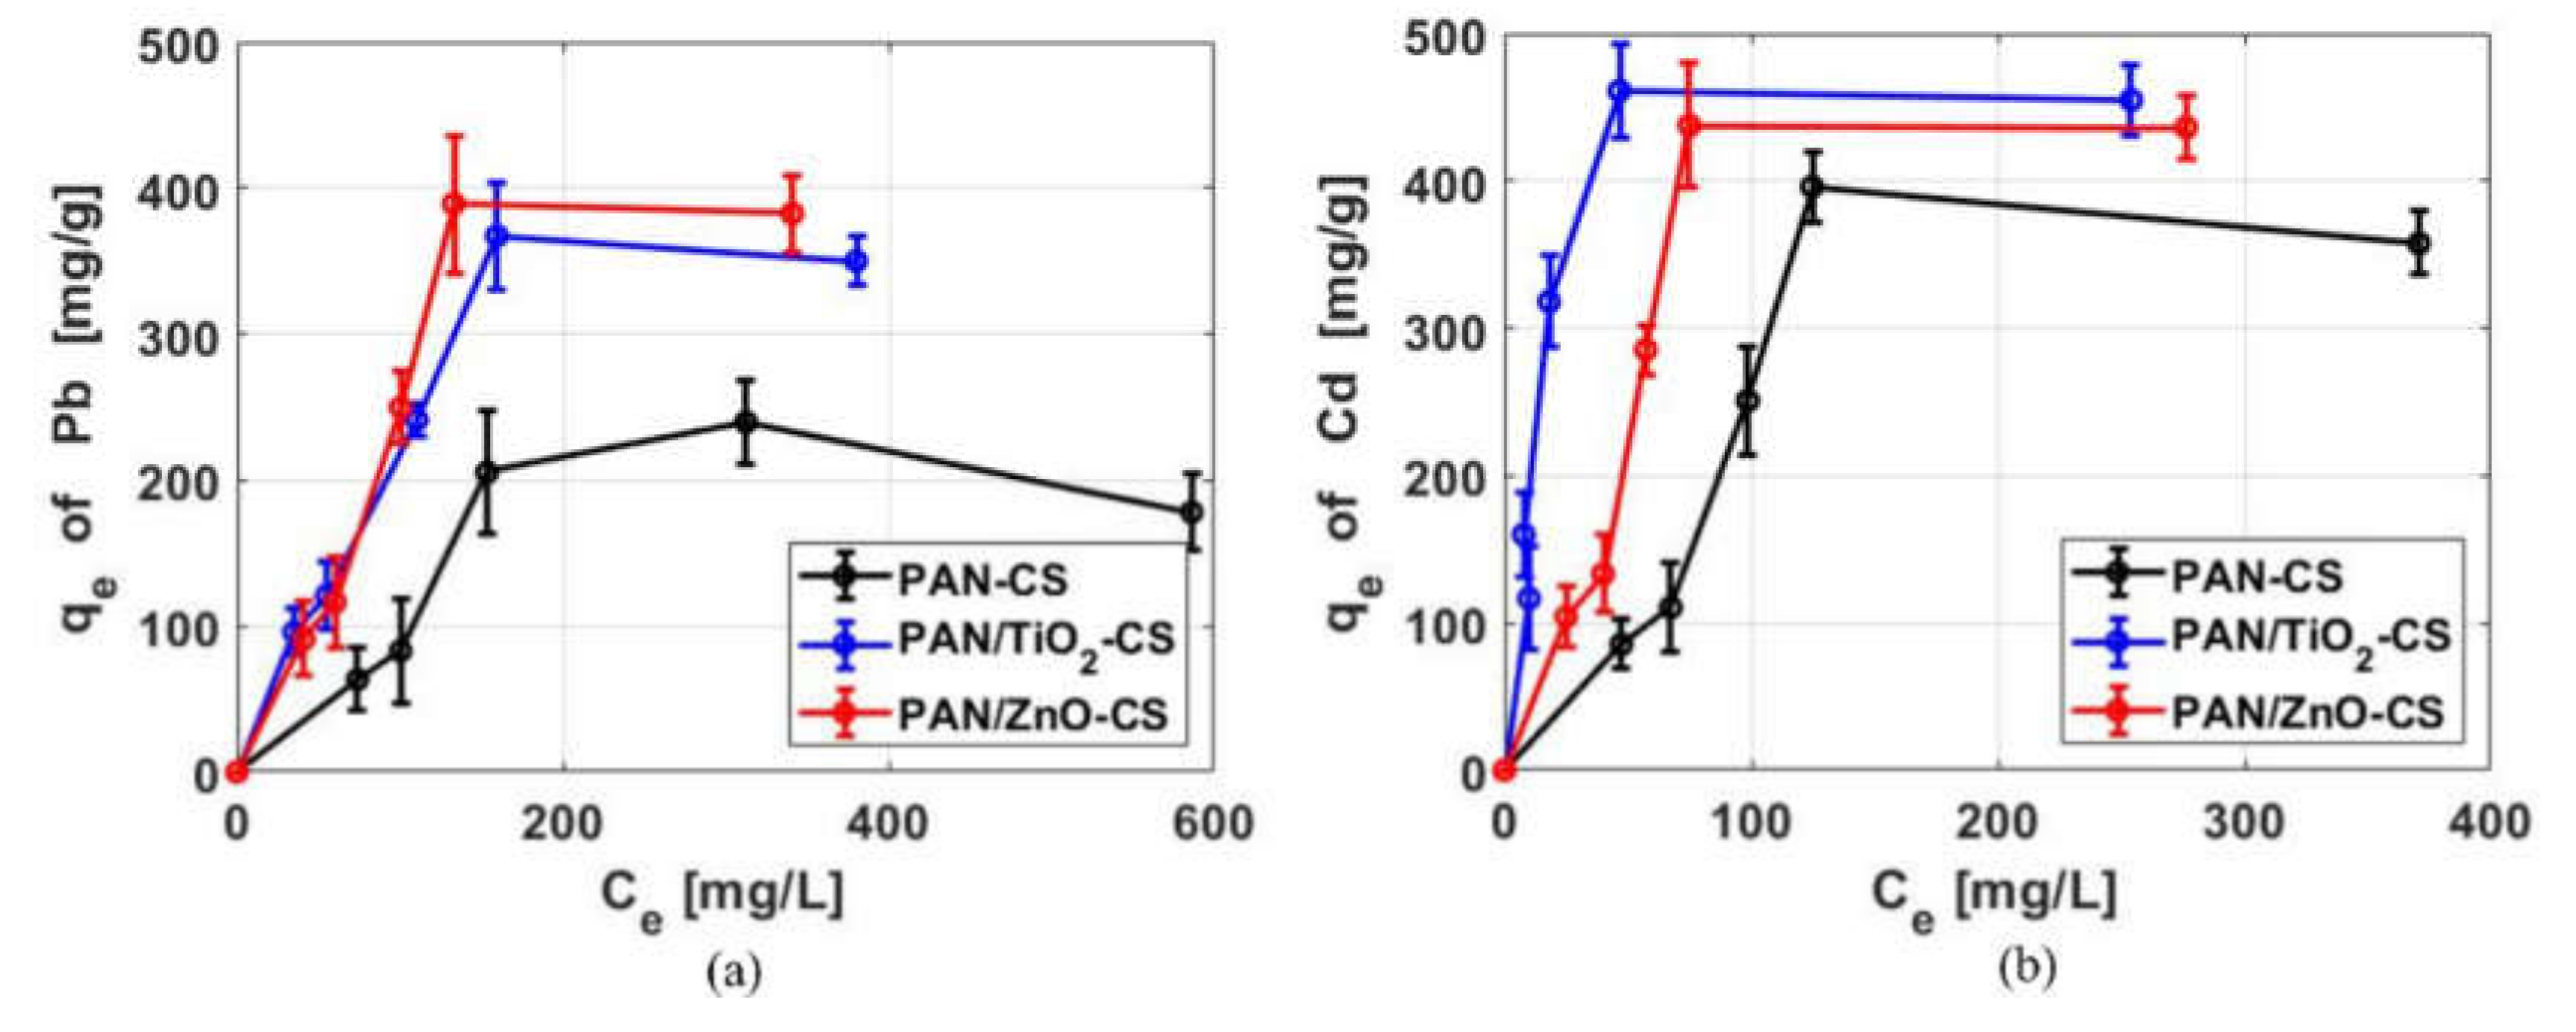
3.2.3. Metal Ions Concentration Effect on Adsorption Properties

Figure 8 shows the initial ion concentrations effect on the adsorption of the metal ions using the bilayer nanofiber mats. The study was carried out at room temperature for different lead and cadmium initial concentrations ranging from 150 to 800 mg/L. The pH of the solutions was initially adjusted to 7.0 for both metal ions. At equilibrium, the metal ions uptake amounts increased with the increased concentrations of metal ions until a plateau was reached at 600 mg/L ion concentration. The adsorption capacities of the metal ions by PAN/TiO2–CS and PAN/ZnO–CS bilayers are very close to each other but are higher than those of metal ions by PAN–CS bilayer by approximately 53% and 16%, respectively, at 600 mg/L initial ion concentrations. The values of the equilibrium adsorption capacity (qe) of lead and cadmium by PAN/MO–CS were 390 and 461 mg/g, respectively, while those of lead and cadmium ions by the bilayer without metal oxide nanoparticles were only 240 and 385 mg/g, respectively. Once again, the current adsorption results are significantly higher than those obtained by the single nanofiber layer of pure PAN or PAN/MO at each of the initial concentrations reported in our previous work [9,25]. For example, at 600 mg/L initial ion concentrations, the adsorption of lead and cadmium ions by the PAN/MO–CS bilayer increased by 320% and 640%, respectively, compared to pure PAN, and by 102% and 405%, respectively, compared to the PAN/MO single nanofiber layer. The possible mechanism of adsorption is discussed next.

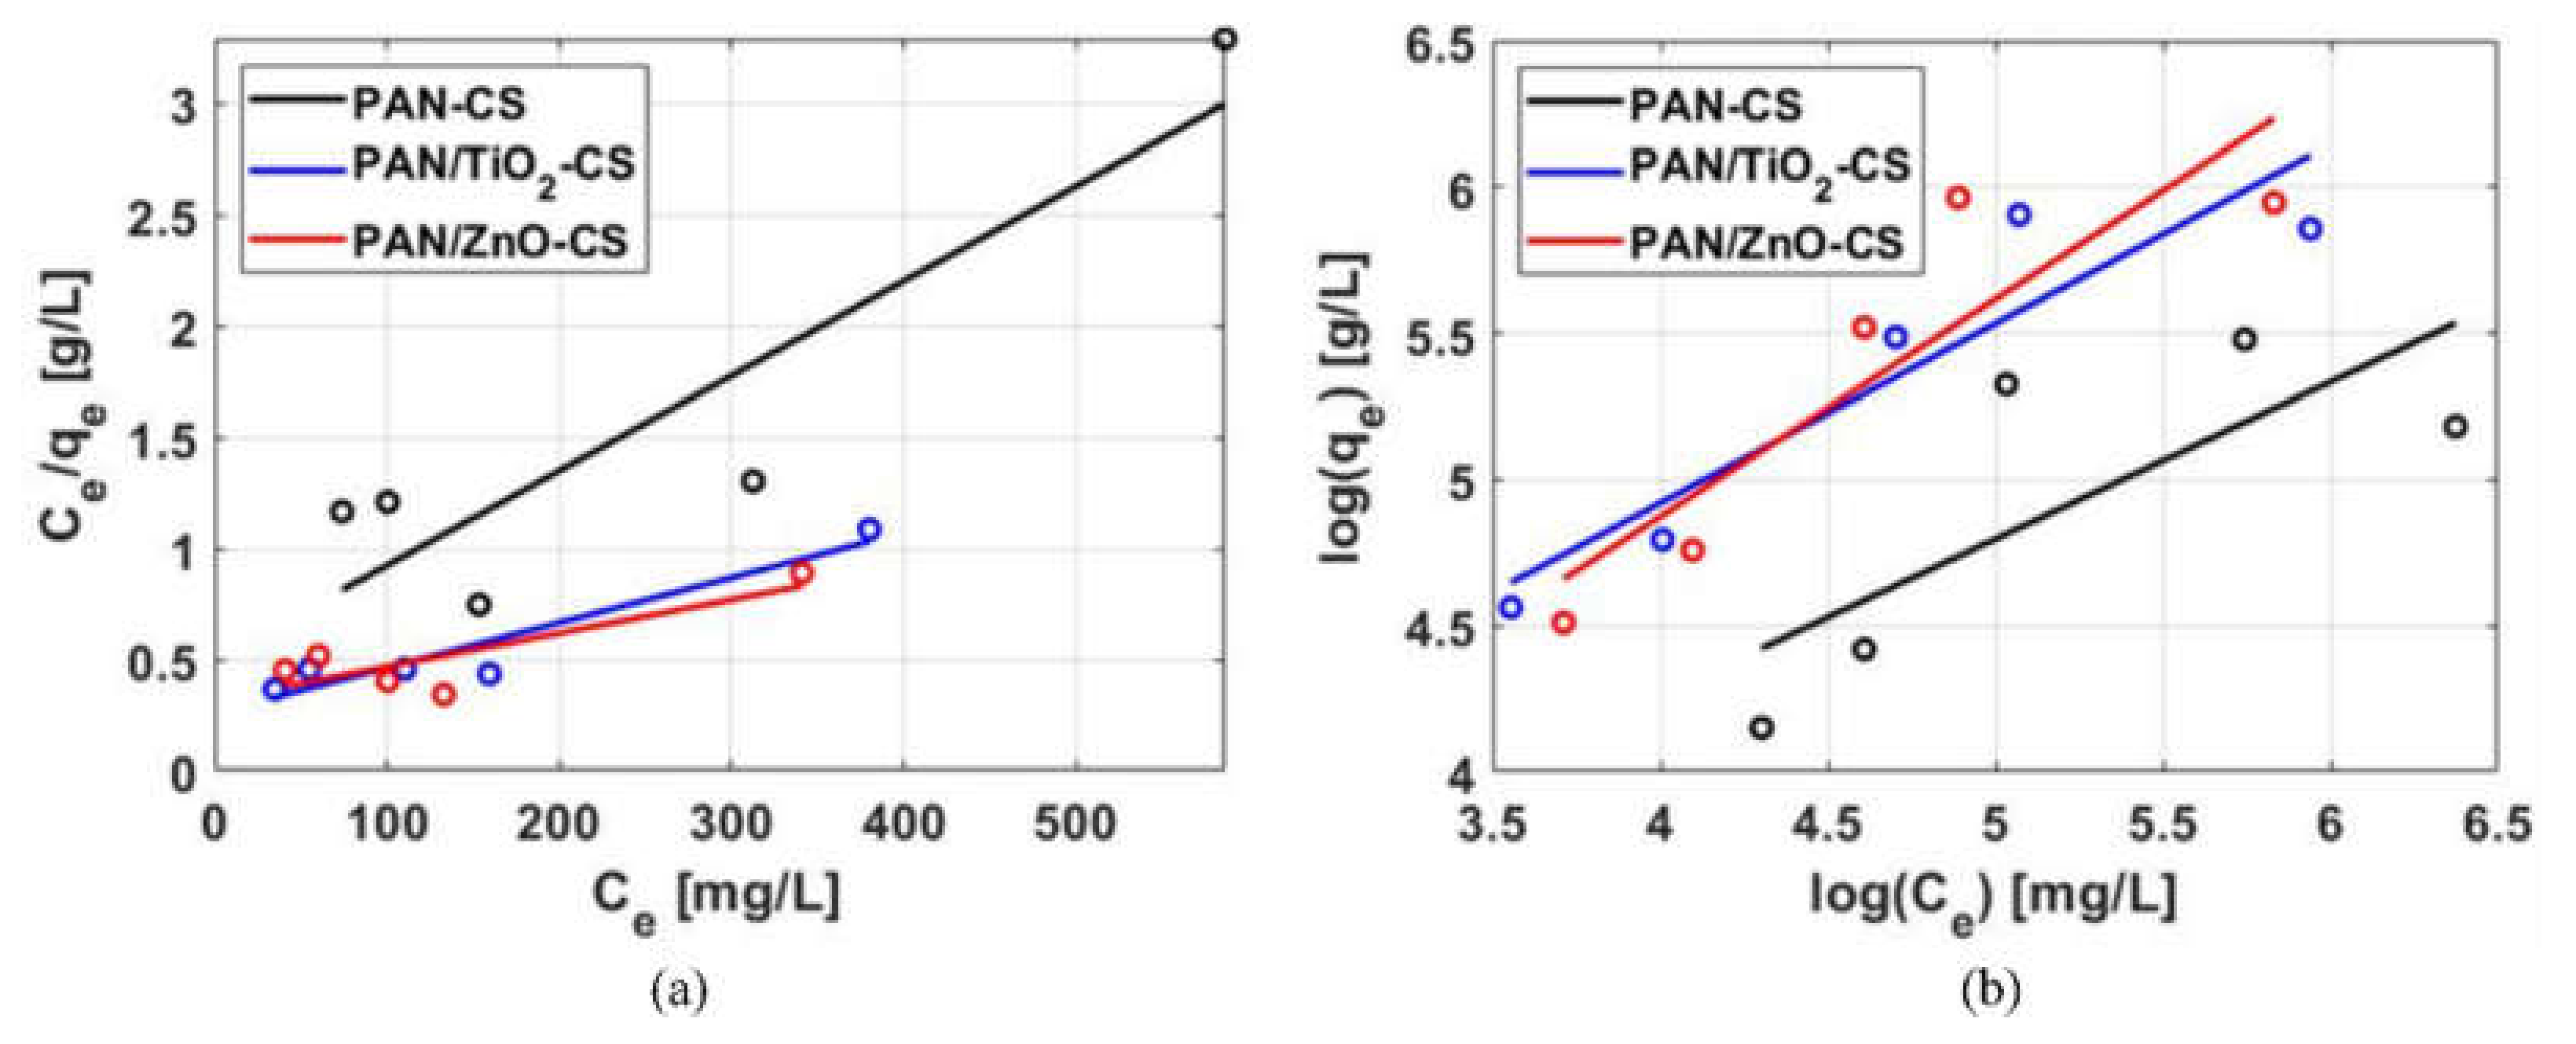
3.2.4. Adsorption Isotherm

The adsorption isotherm study is useful for describing the equilibrium concentration Ce of heavy metal ions in solution and the equilibrium adsorbed amounts qe at a given solution pH and temperature. Figure 9 shows a plot of qe versus Ce for the lead and cadmium adsorption using the bilayer nanofiber mats at room temperature. Here, the pH values were adjusted to 7.0, and the final pH values were measured and found to be close (within ~10%) to the initial values. Clearly, PAN/MO–CS have a better affinity than PAN–CS at all the tested equilibrium adsorbate concentrations.
In literature, different adsorption isotherm models have been applied, including the Henry, Langmuir, Freundlich, Dubinin–Radushkevich, Temkin, Flory–Huggins, Hill, and Redlich–Peterson models. In our study, the equilibrium data were fitted by the most commonly used models, namely, the Freundlich and Langmuir isotherms. The Langmuir model assumes monolayer surface sorption with negligible interactions between the adjoining species and that all available sites for adsorption are equivalent in terms of energy [48]. The Langmuir model can be expressed using the following nonlinear or linear forms
q e = q max   K L   C e 1 + K L   C e ,
C e q e = 1 q max   K L   + 1 q max   C e .
The Freundlich model assumes non ideal adsorption on heterogeneous surfaces and is expressed by either of the following nonlinear or linear forms [49]
q e = K F   C e 1 n   ,
log q e = log K F + 1 n log C e .
where KL (L/mg) and KF ((mg/g)/(mg/L)n) are the Langmuir and Freundlich constants, respectively, and n is the intensity exponent of Freundlich adsorption related to the heterogeneity of the adsorption.
The values of the model parameters ( q max , K L , K F , and n) are commonly extracted using a linear regression based on the appropriate linear plot for each isotherm model. Figure 10 and Figure 11 elucidate the linear plots of Langmuir model as well as Freundlich model for the metal ion adsorption, respectively, by all the fabricated bilayer adsorbates. Table 2 and Table 3 list the regression values of the model parameters. In the regression method, the best-fit model is selected based on the value of the coefficient of determination, R2. Here, we also calculate the mean absolute adsorption error MAAE% (see Equation (7)) to determine the fitting accuracy of the models. The model parameters were also calculated using the nonlinear optimization method, as shown between the parentheses in Table 2 and Table 3. Based on the values of R2 and MAAE%, the present system follows the Langmuir isotherm equation compared to the Freundlich isotherm. Note that the model parameters and errors obtained from the linear regression and nonlinear optimization methods are very close for the Langmuir model. However, the differences between the model parameters obtained by the linear regression and nonlinear optimization methods for the Freundlich model are very large. The values of the errors obtained from the nonlinear optimization method suggested that the Langmuir model equation better described the measured adsorption equilibrium data. Hence, it is possible that the monolayer surface adsorptive sites exhibit a homogeneous distribution. It should be admitted that more experimental equilibrium data points in the complete isotherm may affect the quality of the fit and the corresponding values of the model parameters [50].
Since the Langmuir model can describe the adsorption isotherm, the separation factor or equilibrium parameter RL is calculated for different ranges of initial ion concentrations Co using the relation [51]
R L = 1 1 + K L   C o ,
The values of the calculated separation factor vary between 0.1 and 0.5, classifying the present adsorption system as favorable (0 < RL < 1) [52]. Additionally, it is noticed that as the initial adsorbate concentrations decreased, the values of RL increased. This shows that the lead and cadmium ions’ adsorption onto the bilayer nanofiber mats is more favorable at lower ion concentrations. This could be due to the increased occupation of easily accessible external surface sorption sites of the nanofiber mats. The subsequent slow adsorption phase could be due to the saturation of the adsorption sites.
In addition to the Langmuir and Freundlich isotherms, the Dubinin–Radushkevich equation [53] was used to obtain insight about the adsorption process type (whether it is physical or chemical) by evaluating the magnitude of the mean adsorption energy E (kJ/mol), which is defined as follows.
E = 1 2   k DR   ,
where k D R (mol2/kJ2) is a constant related to the sorption energy obtained from the Dubinin–Radushkevich equation
q e = q DR   e k DR ϵ 2 ,
ϵ = R   T   ln 1 + 1 C e ,
where q DR (mg/g) is the adsorption capacity, ϵ is the Polanyi potential, R is the gas constant, and T is the temperature in Kelvin. Some authors reported that the adsorption mechanism could be controlled by a physical process ( E < 8 kJ/mol), ion exchange (8 < E < 16 kJ/mol), or a chemical process ( E > 16 kJ/mol) [43,54,55]. In this study, the calculated value of E varies from 4.65 to 14.72 kJ/mol, indicating a possible combination of a physical process and ion exchange adsorption. The fitting plots and model parameters of the Dubinin–Radushkevich equation are described in the Supplementary Information (see Figure S3 and Table S2). In summary, the enhancement in the physical adsorption performance of the bilayer PAN/MO–CS nanofiber mats could be attributed to the enlarged surface area of the composite nanofibers. Moreover, the addition of a CS nanofiber layer and MO nanoparticles into the nanofibers improved the adsorption as the metal ions adsorb to the hydroxyl groups on the surface of CS and the MO nanoparticles [28,56,57,58]. In our work, the NH2 groups and –OH of CS were participated in the heavy metal ion adsorption via chelation. Metal oxide nanoparticles were involved in the lead and cadmium adsorption process by the exchange reaction between the heavy metal ions and protons [31].

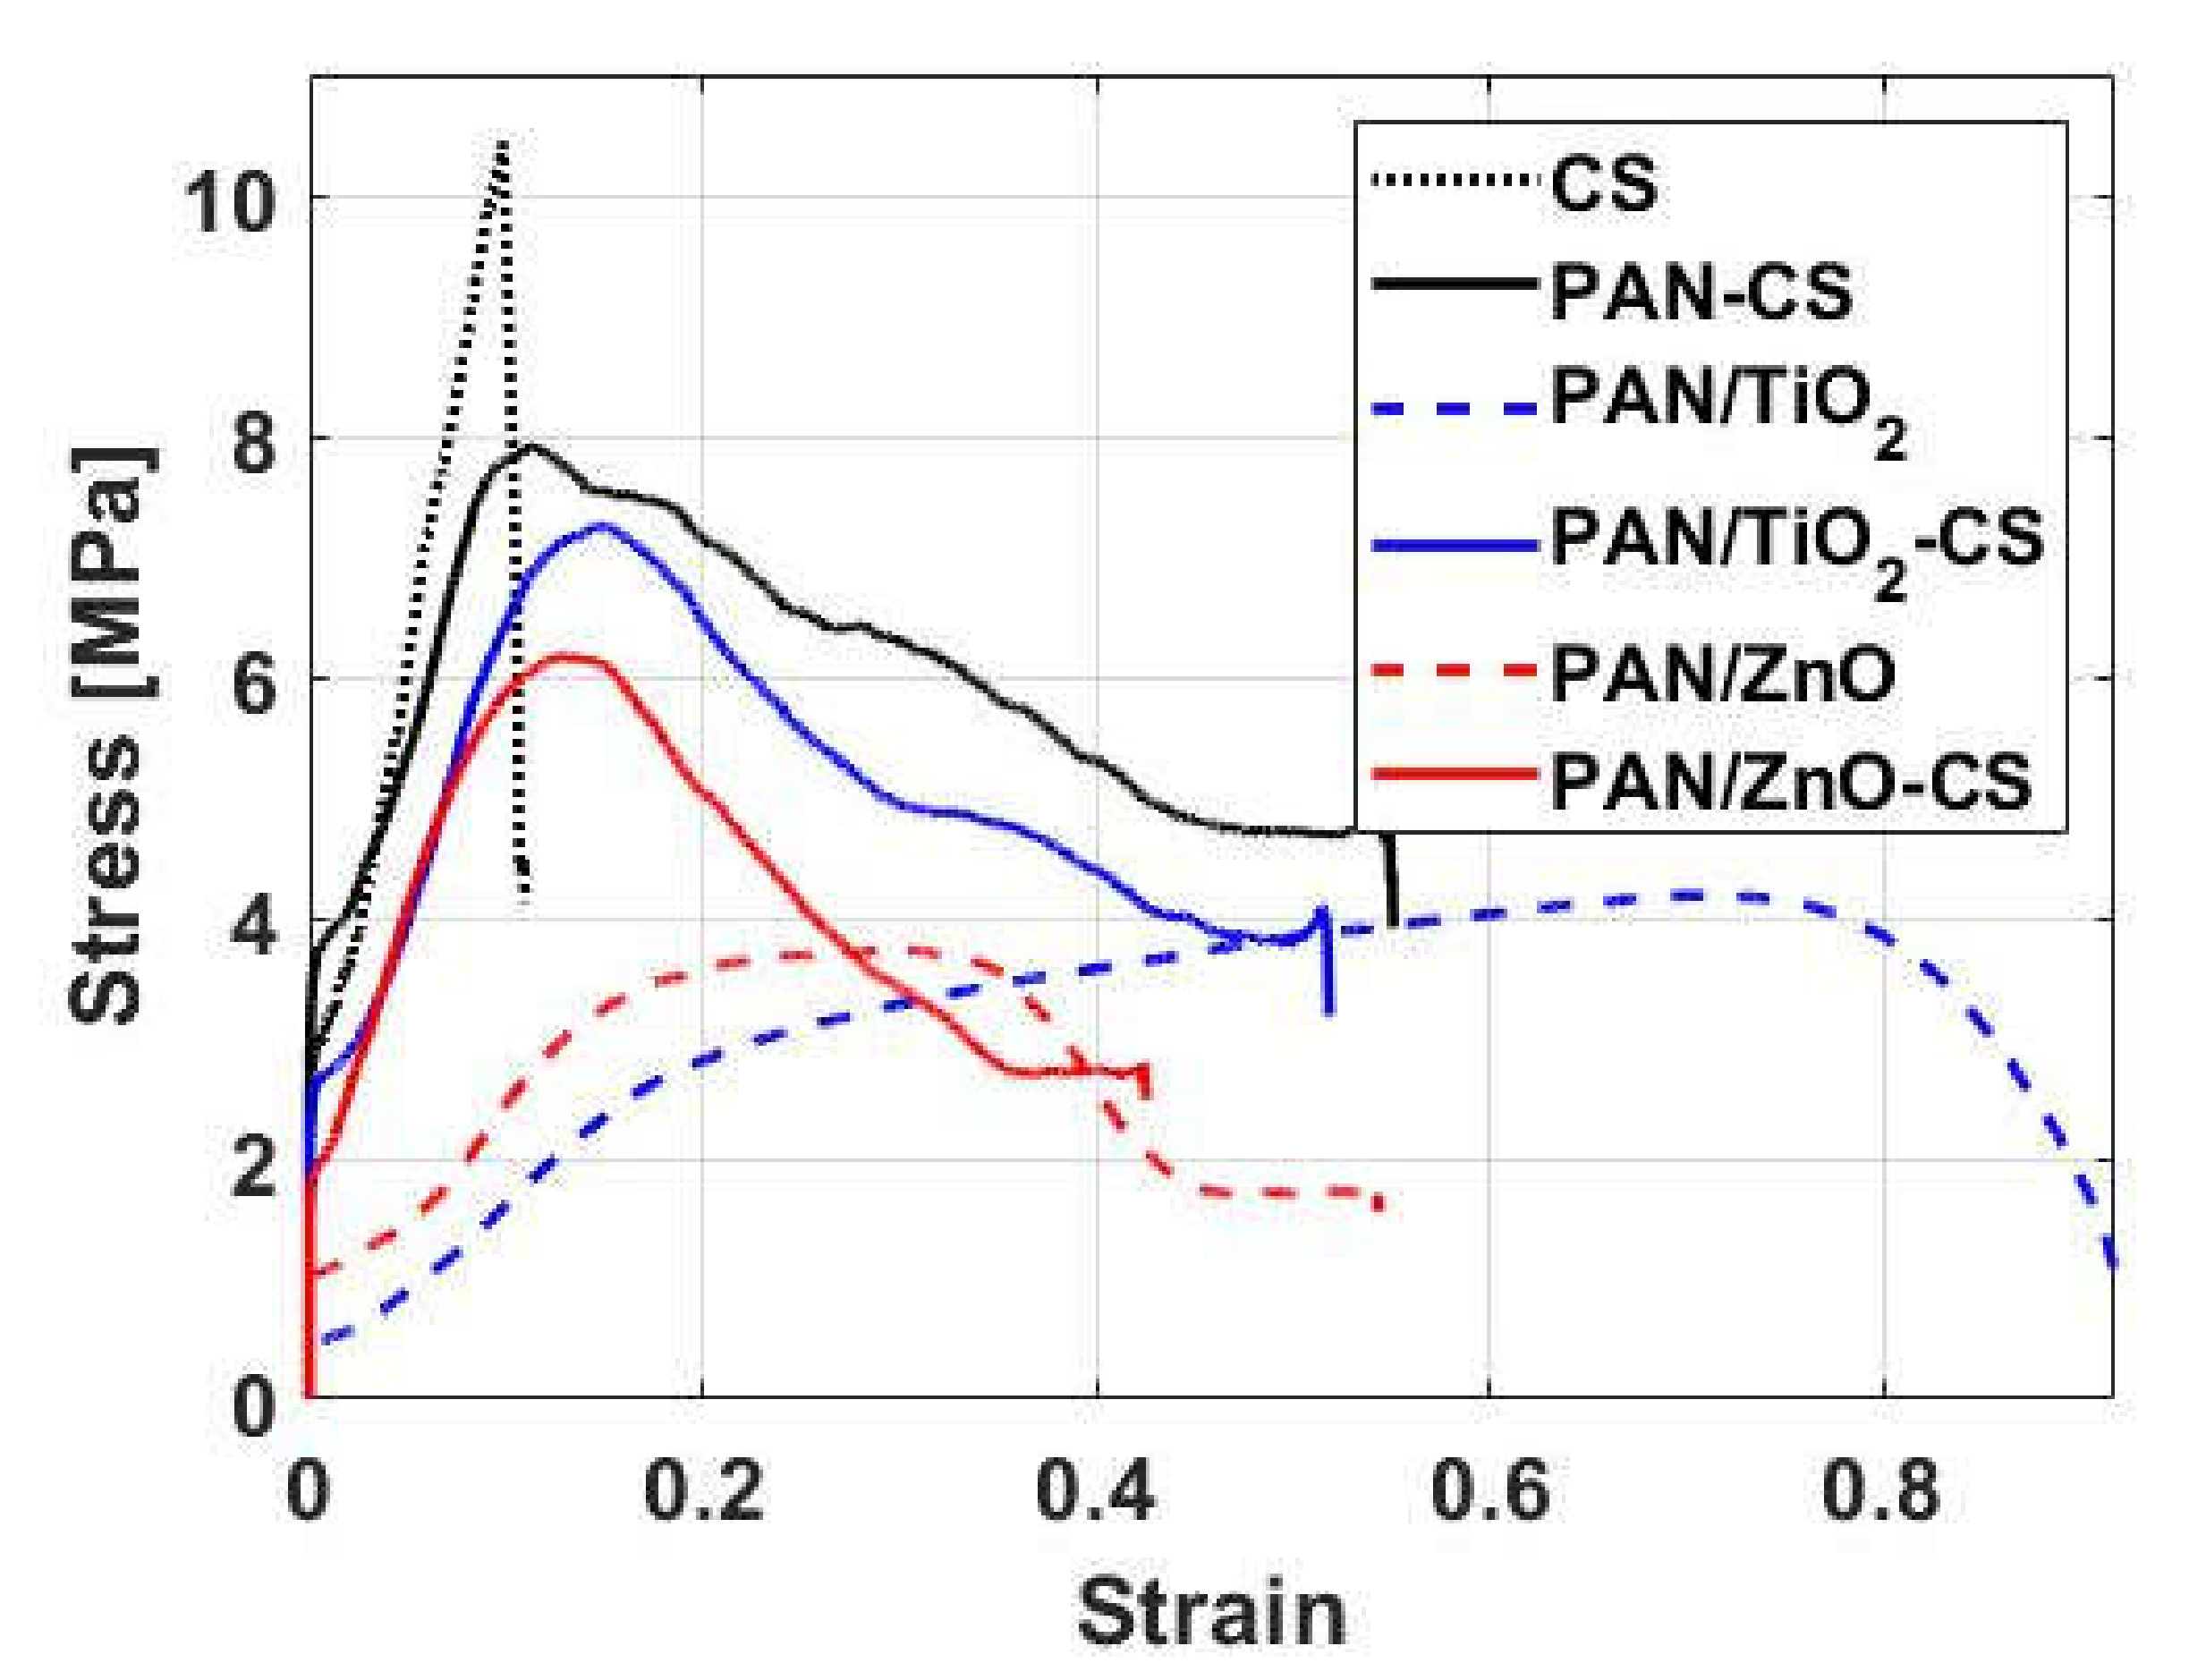
3.3. Tensile Properties

For practical adsorption applications, the adsorbent materials should exhibit adequate mechanical properties to withstand stresses under various loading conditions. In general, nanofiber adsorbents have a reasonably good adsorption performance. However, their mechanical strength remains weak. In our study, the objective was to improve the mechanical strength of the nanofiber adsorbents based on PAN through the addition of an extra strong nanofiber layer of CS to the PAN or PAN/MO nanofiber mats. The CS nanofiber mat was particularly selected because of its high mechanically stronger than the PAN nanofiber mat. Figure 12 illustrates a typical stress–strain curves of our bilayer nanofiber mats under uniaxial tension. The maximum tensile stress and elongation at break extracted from the curves are listed in Table 4. For comparison, the tensile stress–strain curves of single layers of CS and the PAN/MO nanofiber mats are also shown in Figure 12.
As shown in Figure 12, the electrospun CS single nanofiber layer tensile strength is much higher than that of the electrospun PAN/MO single layer by approximately 160% (10.43 MPa for CS vs. 3.73 for PAN/ZnO and 4.18 for PAN/TiO2). Thus, the addition of a CS nanofiber layer to the PAN/MO nanofiber mat enhanced the maximum tensile strength of the bilayer PAN/MO–CS mats by approximately 73.4% for PAN/TiO2–CS compared to PAN/TiO2 and by 65.7% for PAN/ZnO–CS compared to PAN/ZnO. This increase is due to the strong physical interaction between the nanofibers of these two layers (see Figure 1d), which facilitates stress transfer at the interface and enhances the rigidity of the membranes. However, the incorporation of metal oxides (ZnO and TiO2) slightly decreased the tensile strength of the bilayer mats by approximately 8.3% for PAN/TiO2–CS compared to PAN–CS and by 21.8% for PAN/ZnO–CS compared to PAN–CS. This decrease could be due to the metal oxide nanoparticles’ agglomeration within the structure of nanofibers (see Figure 1c), which in turn hindered the amount of ions transferred between the nanoparticles and the polymer due to the weak interface interaction and may have also served as the stress concentration sites [24,59]. Moreover, the agglomeration of metal oxide nanoparticles may also disrupt the PAN polymeric chains, reducing the rigidity of the nanofibers. The mechanical response of the nanofiber membrane is strongly dependent on the intrinsic physical properties of the individual constituent fiber and the morphology of the membrane microstructure (e.g., distributions of the fiber diameter, fiber orientation, and porosity). Without exploring the effect of the various microstructural morphology on the mechanical response, the current mechanical results just offer present useful information about the expected enhancement in the tensile mechanical properties after the addition of a CS layer to the PAN/MO nanofiber mats.

4. Conclusions

In this paper, we produced bilayer nanofiber adsorbents with significantly enhanced adsorption and mechanical properties via the subsequent electrospinning of the PAN/MO (PAN/ZnO or PAN/TiO2) and CS nanofiber mats. The SEM cross-section images at the interface between PAN/MO and CS showed a good interaction between the nanofibers of the two electrospun polymers. The metal ion adsorption onto the bilayers incorporating metal oxide nanoparticles was studied systematically and accounted for the effects of the solution pH, initial ion concentrations, and contact time. The maximum equilibrium adsorption capacities of lead and cadmium by bilayer with metal oxide nanoparticles were around 102% and 405% higher than those obtained by the PAN/MO single layer, respectively (389 vs. 193 mg/g for Pb(II) and 461 vs. 91 mg/g for Cd(II)). Moreover, the incorporation of MO nanoparticles into PAN enhanced the lead and cadmium ions adsorption onto PAN/MO–CS by 63% and 20%, respectively, compared to the bilayer PAN–CS nanofibers. Furthermore, the nonlinear optimization method showed that the pseudo-second-order kinetic model and Langmuir isotherm equation can better describe the adsorption results. The improvement of the adsorption performance was mainly due to physical processes and the possible increase in the surface area of the composite nanofibers. In terms mechanical behavior, the addition of the supportive CS layer improved the tensile strength of the PAN/MO–CS nanofiber mats by approximately 68% compared to the PAN/MO single layer, while the incorporation of MO nanoparticles slightly decreased the tensile strength of the bilayer mats by approximately 8.3% for TiO2 and 21.8% for ZnO. In brief, the excellent adsorption and mechanical properties obtained in this study clearly demonstrate the potential applications of the synthetic bilayer PAN/MO–CS nanofibers in the adsorption of heavy metal ions from wastewaters.

Supplementary Materials

The following are available online at https://0-www-mdpi-com.brum.beds.ac.uk/2079-6412/10/3/285/s1, Figure S1: Point of zero charge (pHpzc) of the bilayer PAN/MO–CS nanofiber mat; Figure S2: Linear fitting of the PFO and PSO models for the adsorption of cadmium onto PAN–CS and PAN/MO–CS nanofiber mats; Figure S3: Fitting of the Dubinin–Radushkevich model for the adsorption of lead and cadmium onto PAN–CS and PAN/MO–CS nanofiber mats; Table S1: Comparison of kinetics parameters of the PSO model for the adsorption of cadmium obtained by linear fitting and nonlinear optimization methods; Table S2: Parameters of the Dubinin–Radushkevich equation and the mean adsorption energy E for the adsorption of lead and cadmium by PAN–CS and PAN/MO–CS nanofibers.

Author Contributions

Conceptualization, H.F.A., M.Y.H., and M.R.K.; Methodology, H.F.A., M.Y.H., and M.O.A.; Validation, H.F.A., A.K.A., and M.Y.H.; Formal analysis, H.F.A., M.Y.H., and M.O.A.; Investigation, H.F.A., M.Y.H., and M.O.A.; Writing—original draft preparation, H.F.A., A.K.A., and M.Y.H.; Writing—review and editing, H.F.A., A.K.A., M.Y.H., M.O.A., and M.R.K.; Visualization, H.F.A. and M.Y.H.; Supervision, H.F.A. and M.R.K.; Project administration, H.F.A. and M.R.K.; Funding acquisition, H.F.A. All authors have read and agreed to the published version of the manuscript.

Funding

This work was funded by the Deanship of Scientific Research at King Saud University through Research Group no. RGP-1440-101

Acknowledgments

We would like to thank the Deanship of Scientific Research at King Saud University for funding this work through Research Group no. RGP-1440-101.

Conflicts of Interest

The authors declare no conflict of interest.

References

  1. Johnson, D.M.; Hokanson, D.R.; Zhang, Q.; Czupinski, K.D.; Tang, J.X. Feasibility of water purification technology in rural areas of developing countries. J. Environ. Manag. 2008, 88, 416–427. [Google Scholar] [CrossRef]
  2. Mara, D.D. Water, sanitation and hygiene for the health of developing nations. Public Health 2003, 117, 452–456. [Google Scholar] [CrossRef]
  3. Jarup, L. Hazards of heavy metal contamination. Br. Med. Bull. 2003, 68, 167–182. [Google Scholar] [CrossRef] [PubMed] [Green Version]
  4. Duruibe, J.O.; Ogwuegbu, M.O.C.; Egwurugwu, J.N. Heavy metal pollution and human biotoxic effects. Int. J. Phys. Sci. 2007, 2, 112–118. [Google Scholar]
  5. Miretzky, P.; Saralegui, A.; Cirelli, A.F. Simultaneous heavy metal removal mechanism by dead macrophytes. Chemosphere 2006, 62, 247–254. [Google Scholar] [CrossRef]
  6. Shoushtari, A.M.; Zargaran, M.; Abdouss, M. Preparation and characterization of high efficiency ion-exchange crosslinked acrylic fibers. J. Appl. Polym. Sci. 2006, 101, 2202–2209. [Google Scholar] [CrossRef]
  7. Shin, D.H.; Ko, Y.G.; Choi, U.S.; Kim, W.N. Design of high efficiency chelate fibers with an amine group to remove heavy metal ions and pH-related FT-IR analysis. Ind. Eng. Chem. Res. 2004, 43, 2060–2066. [Google Scholar] [CrossRef]
  8. Tahaei, P.; Abdouss, M.; Edrissi, M.; Shoushtari, A.M.; Zargaran, M. Preparation of chelating fibrous polymer by different diamines and study on their physical and chemical properties. Mater. Und Werkst. 2008, 39, 839–844. [Google Scholar] [CrossRef]
  9. Haddad, M.Y.; Alharbi, H.F.; Karim, M.R.; Aijaz, M.O.; Alharthi, N.H. Preparation of TiO2 incorporated polyacrylonitrile electrospun nanofibers for adsorption of heavy metal ions. J. Polym. Res. 2018, 25, 218. [Google Scholar] [CrossRef]
  10. Ma, Z.W.; Kotaki, M.; Ramakrishna, S. Electrospun cellulose nanofiber as affinity membrane. J. Membr. Sci. 2005, 265, 115–123. [Google Scholar] [CrossRef]
  11. Neghlani, P.K.; Rafizadeh, M.; Taromi, F.A. Preparation of aminated-polyacrylonitrile nanofiber membranes for the adsorption of metal ions: Comparison with microfibers. J. Hazard. Mater. 2011, 186, 182–189. [Google Scholar] [CrossRef] [PubMed]
  12. Bazilevsky, A.V.; Yarin, A.L.; Megaridis, C.M. Co-electrospinning of core− shell fibers using a single-nozzle technique. Langmuir 2007, 23, 2311–2314. [Google Scholar] [CrossRef] [PubMed]
  13. Almasian, A.; Jalali, M.; Fard, G.C.; Maleknia, L. Surfactant grafted PDA-PAN nanofiber: Optimization of synthesis, characterization and oil absorption property. Chem. Eng. J. 2017, 326, 1232–1241. [Google Scholar] [CrossRef]
  14. Nataraj, S.; Yang, K.; Aminabhavi, T. Polyacrylonitrile-based nanofibers—A state-of-the-art review. Prog. Polym. Sci. 2012, 37, 487–513. [Google Scholar] [CrossRef]
  15. Botes, M.; Cloete, T.E. The potential of nanofibers and nanobiocides in water purification. Crit. Rev. Microbiol. 2010, 36, 68–81. [Google Scholar] [CrossRef]
  16. Nataraj, S.K.; Yang, K.S.; Aminabhavi, T.M. Polyacrylonitrile-based nanofibers A state-of-the-art review. Prog. Polym. Sci. 2012, 37, 487–513. [Google Scholar] [CrossRef]
  17. Abedi, M.; Chenar, M.P.; Sadeghi, M. Surface modification of PAN hollow fiber membrane by chemical reaction. Fibers Polym. 2015, 16, 788–793. [Google Scholar] [CrossRef]
  18. Almasian, A.; Giahi, M.; Fard, G.C.; Dehdast, S.; Maleknia, L. Removal of heavy metal ions by modified PAN/PANI-nylon core-shell nanofibers membrane: Filtration performance, antifouling and regeneration behavior. Chem. Eng. J. 2018, 351, 1166–1178. [Google Scholar] [CrossRef]
  19. Kampalanonwat, P.; Supaphol, P. Preparation and Adsorption Behavior of Aminated Electrospun Polyacrylonitrile Nanofiber Mats for Heavy Metal Ion Removal. Acs Appl. Mater. Interfaces 2010, 2, 3619–3627. [Google Scholar] [CrossRef]
  20. Abbasizadeh, S.; Keshtkar, A.R.; Mousavian, M.A. Preparation of a novel electrospun polyvinyl alcohol/titanium oxide nanofiber adsorbent modified with mercapto groups for uranium (VI) and thorium (IV) removal from aqueous solution. Chem. Eng. J. 2013, 220, 161–171. [Google Scholar] [CrossRef]
  21. Dastbaz, A.; Keshtkar, A.R. Adsorption of Th4+, U6+, Cd2+, and Ni2+ from aqueous solution by a novel modified polyacrylonitrile composite nanofiber adsorbent prepared by electrospinning. Appl. Surf. Sci. 2014, 293, 336–344. [Google Scholar] [CrossRef]
  22. Augustine, R.; Malik, H.N.; Singhal, D.K.; Mukherjee, A.; Malakar, D.; Kalarikkal, N.; Thomas, S. Electrospun polycaprolactone/ZnO nanocomposite membranes as biomaterials with antibacterial and cell adhesion properties. J. Polym. Res. 2014, 21, 347. [Google Scholar] [CrossRef]
  23. Parlayıcı, Ş.; Yar, A.; Avcı, A.; Pehlivan, E. Removal of hexavalent chromium using polyacrylonitrile/titanium dioxide nanofiber membrane. Desalin. Water Treat. 2016, 57, 16177–16183. [Google Scholar] [CrossRef]
  24. Makaremi, M.; Lim, C.X.; Pasbakhsh, P.; Lee, S.M.; Goh, K.L.; Chang, H.; Chan, E.S. Electrospun functionalized polyacrylonitrile–chitosan Bi-layer membranes for water filtration applications. RSC Adv. 2016, 6, 53882–53893. [Google Scholar] [CrossRef] [Green Version]
  25. Haddad, M.Y.; Alharbi, H.F. Enhancement of heavy metal ion adsorption using electrospun polyacrylonitrile nanofibers loaded with ZnO nanoparticles. J. Appl. Polym. Sci. 2019, 136, 47209. [Google Scholar] [CrossRef]
  26. Prashanth, K.V.H.; Tharanathan, R.N. Chitin/chitosan: Modifications and their unlimited application potential—An overview. Trends Food Sci. Technol. 2007, 18, 117–131. [Google Scholar] [CrossRef]
  27. Zhang, G.; Wang, P.; Zhang, X.; Xiang, C.; Li, L. Preparation of hierarchically structured PCL superhydrophobic membrane via alternate electrospinning/electrospraying techniques. J. Polym. Sci. Part B Polym. Phys. 2019, 57, 421–430. [Google Scholar] [CrossRef]
  28. Li, C.J.; Zhang, S.S.; Wang, J.N.; Liu, T.Y. Preparation of polyamides 6 (PA6)/Chitosan@FexOy composite nanofibers by electrospinning and pyrolysis and their Cr(VI)-removal performance. Catal. Today 2014, 224, 94–103. [Google Scholar] [CrossRef]
  29. Haider, S.; Park, S.Y. Preparation of the electrospun chitosan nanofibers and their applications to the adsorption of Cu(II) and Pb(II) ions from an aqueous solution. J. Membr. Sci. 2009, 328, 90–96. [Google Scholar] [CrossRef]
  30. Aliabadi, M.; Irani, M.; Ismaeili, J.; Piri, H.; Parnian, M.J. Electrospun nanofiber membrane of PEO/Chitosan for the adsorption of nickel, cadmium, lead and copper ions from aqueous solution. Chem. Eng. J. 2013, 220, 237–243. [Google Scholar] [CrossRef]
  31. He, N.; Li, L.; Wang, P.; Zhang, J.; Chen, J.; Zhao, J. Dioxide/Chitosan/poly(lactide-co-caprolactone) composite membrane with efficient Cu(II) adsorption. Colloids Surf. A Physicochem. Eng. Asp. 2019, 580, 123687. [Google Scholar] [CrossRef]
  32. Yar, A.; Haspulat, B.; Üstün, T.; Eskizeybek, V.; Avcı, A.; Kamış, H.; Achour, S. Electrospun TiO 2/ZnO/PAN hybrid nanofiber membranes with efficient photocatalytic activity. RSC Adv. 2017, 7, 29806–29814. [Google Scholar] [CrossRef] [Green Version]
  33. Fang, S.; Wang, W.; Yu, X.; Xu, H.; Zhong, Y.; Sui, X.; Zhang, L.; Mao, Z. Preparation of ZnO:(Al, La)/polyacrylonitrile (PAN) nonwovens with low infrared emissivity via electrospinning. Mater. Lett. 2015, 143, 120–123. [Google Scholar] [CrossRef]
  34. Zhou, J.; Zhao, F.; Wang, Y.; Zhang, Y.; Yang, L. Size-controlled synthesis of ZnO nanoparticles and their photoluminescence properties. J. Lumin. 2007, 122, 195–197. [Google Scholar] [CrossRef]
  35. Moradi, G.; Zinadini, S.; Rajabi, L.; Dadari, S. Fabrication of high flux and antifouling mixed matrix fumarate-alumoxane/PAN membranes via electrospinning for application in membrane bioreactors. Appl. Surf. Sci. 2018, 427, 830–842. [Google Scholar] [CrossRef]
  36. Kim, S.J.; Shin, S.R.; Lee, Y.M.; Kim, S.I. Swelling characterizations of chitosan and polyacrylonitrile semi-interpenetrating polymer network hydrogels. J. Appl. Polym. Sci. 2003, 87, 2011–2015. [Google Scholar] [CrossRef]
  37. Malik, H.; Qureshi, U.A.; Muqeet, M.; Mahar, R.B.; Ahmed, F.; Khatri, Z. Removal of lead from aqueous solution using polyacrylonitrile/magnetite nanofibers. Environ. Sci. Pollut. Res. 2017, 25, 3557–3564. [Google Scholar] [CrossRef]
  38. Patel, S.; Hota, G. Iron oxide nanoparticle-immobilized PAN nanofibers: Synthesis and adsorption studies. Rsc Adv. 2016, 6, 15402–15414. [Google Scholar] [CrossRef]
  39. Low, K.S.; Lee, C.K.; Lee, K.P. Sorption of copper by dye-treated oil-palm fibres. Bioresour. Technol. 1993, 44, 109–112. [Google Scholar] [CrossRef]
  40. Lalhmunsiama; Lee, S.M.; Tiwari, D. Manganese oxide immobilized activated carbons in the remediation of aqueous wastes contaminated with copper(II) and lead(II). Chem. Eng. J. 2013, 225, 128–137. [Google Scholar] [CrossRef]
  41. Somasundaran, P. Zeta potential of apatite in aqueous solutions and its change during equilibration. J. Colloid Interface Sci. 1968, 27, 659–666. [Google Scholar] [CrossRef]
  42. Kosmulski, M. Surface Charging and Points of Zero Charge, 1st ed.; CRC Press: Boca Raton, FL, USA, 2009. [Google Scholar]
  43. Tran, H.N.; You, S.-J.; Chao, H.-P. Thermodynamic parameters of cadmium adsorption onto orange peel calculated from various methods: A comparison study. J. Environ. Chem. Eng. 2016, 4, 2671–2682. [Google Scholar] [CrossRef]
  44. Ho, Y.S.; McKay, G. Sorption of dye from aqueous solution by peat. Chem. Eng. J. 1998, 70, 115–124. [Google Scholar] [CrossRef]
  45. Blanchard, G.; Maunaye, M.; Martin, G. Removal of heavy metals from waters by means of natural zeolites. Water Res. 1984, 18, 1501–1507. [Google Scholar] [CrossRef]
  46. Tran, H.N.; You, S.-J.; Hosseini-Bandegharaei, A.; Chao, H.-P. Mistakes and inconsistencies regarding adsorption of contaminants from aqueous solutions: A critical review. Water Res. 2017, 120, 88–116. [Google Scholar] [CrossRef] [PubMed]
  47. Han, R.; Wang, Y.; Zou, W.; Wang, Y.; Shi, J. Comparison of linear and nonlinear analysis in estimating the Thomas model parameters for methylene blue adsorption onto natural zeolite in fixed-bed column. J. Hazard. Mater. 2007, 145, 331–335. [Google Scholar] [CrossRef]
  48. Helfferich, F.G. Principles of adsorption & adsorption processes, by D.M. Ruthven, John Wiley & Sons, 1984, xxiv + 433 pp. Aiche J. 1985, 31, 523–524. [Google Scholar] [CrossRef]
  49. Freundlich, H. The Adsorption in Physical Chemistry; Wilhelm Engelmann: Leipzig, Germany, 1906. [Google Scholar]
  50. Vasanth Kumar, K.; Sivanesan, S. Equilibrium data, isotherm parameters and process design for partial and complete isotherm of methylene blue onto activated carbon. J. Hazard. Mater. 2006, 134, 237–244. [Google Scholar] [CrossRef]
  51. Hall, K.R.; Eagleton, L.C.; Acrivos, A.; Vermeulen, T. Pore- and Solid-Diffusion Kinetics in Fixed-Bed Adsorption under Constant-Pattern Conditions. Ind. Eng. Chem. Fundam. 1966, 5, 212–223. [Google Scholar] [CrossRef]
  52. Kumar, K.V. Comments on “Equilibrium studies for the adsorption of Acid dye onto modified hectorite”. J. Hazard. Mater. 2006, 137, 1252–1253. [Google Scholar] [CrossRef]
  53. Dubinin, M.M. The Equation of the Characteristic Curve of Activated Charcoal. Dokl. Akad. Nauk. SSSR 1947, 55, 327–329. [Google Scholar]
  54. Hobson, J.P. Physical adsorption isotherms extending from ultrahigh vacuum to vapor pressure. J. Phys. Chem. 1969, 73, 2720–2727. [Google Scholar] [CrossRef]
  55. Ben-Ali, S.; Jaouali, I.; Souissi-Najar, S.; Ouederni, A. Characterization and adsorption capacity of raw pomegranate peel biosorbent for copper removal. J. Clean. Prod. 2017, 142, 3809–3821. [Google Scholar] [CrossRef]
  56. Noei, H.; Qiu, H.; Wang, Y.; Löffler, E.; Wöll, C.; Muhler, M. The identification of hydroxyl groups on ZnO nanoparticles by infrared spectroscopy. Phys. Chem. Chem. Phys. 2008, 10, 7092–7097. [Google Scholar] [CrossRef] [PubMed]
  57. Mahdavi, S.; Jalali, M.; Afkhami, A. Removal of heavy metals from aqueous solutions using Fe3O4, ZnO, and CuO nanoparticles. J. Nanoparticle Res. 2012, 14, 1–18. [Google Scholar] [CrossRef]
  58. Kikuchi, Y.; Qian, Q.; Machida, M.; Tatsumoto, H. Effect of ZnO loading to activated carbon on Pb(II) adsorption from aqueous solution. Carbon 2006, 44, 195–202. [Google Scholar] [CrossRef]
  59. Chae, D.W.; Kim, B.C. Effects of zinc oxide nanoparticles on the physical properties of polyacrylonitrile. J. Appl. Polym. Sci. 2006, 99, 1854–1858. [Google Scholar] [CrossRef]
Figure 1. SEM images of the bilayer PAN–CS mat from the side of (a) PAN and (b) CS. The image of PAN/ZnO–CS from the side of PAN/ZnO is shown in (c). The cross-section of the PAN–CS bilayer at the interface is depicted in (d).
Coatings 10 00285 g001
Figure 2. XRD analysis of the bilayer nanofibers.
Coatings 10 00285 g002
Figure 3. FTIR analysis of the bilayer nanofibers.
Coatings 10 00285 g003
Figure 4. Removal percentage of (a) lead and (b) cadmium ions with different pH values using the bilayer nanofiber mats.
Coatings 10 00285 g004
Figure 5. Contact time effect on the capacity of adsorption of (a) lead and (b) cadmium ions using the bilayer mats. The insets illustrate the adsorption up to the point of equilibrium over a regular (linear) time scale.
Coatings 10 00285 g005
Figure 6. Equilibrium of adsorption (qe) comparison of (a) lead and (b) cadmium ions using pristine PAN, the PAN/MO single layer [9,25], the PAN–CS bilayer, and the PAN/MO–CS bilayer.
Coatings 10 00285 g006
Figure 7. Comparison of the predicted adsorption capacity of (a) lead and (b) cadmium ions obtained by the PSO model against the corresponding experimental results for the bilayer PAN–CS and PAN/MO–CS nanofibers.
Coatings 10 00285 g007
Figure 8. Equilibrium adsorption of (a) lead and (b) cadmium ions at different initial concentrations using the bilayer mats at room temperature.
Coatings 10 00285 g008
Figure 9. Adsorption isotherms of (a) lead and (b) cadmium ions by the bilayer PAN–CS and PAN/MO–CS nanofiber mats at room temperature.
Coatings 10 00285 g009
Figure 10. Isotherm models of (a) Langmuir and (b) Freundlich for lead ion adsorption using the bilayer nanofibers.
Coatings 10 00285 g010
Figure 11. Isotherm models of (a) Langmuir and (b) Freundlich for cadmium ion adsorption using the bilayer nanofibers.
Coatings 10 00285 g011
Figure 12. Bilayer nanofiber mats tensile stress–strain curves. For comparison, the stress–strain curves of single layers of CS and the PAN/MO nanofiber mats are also shown by the dotted and dashed lines, respectively.
Coatings 10 00285 g012
Table 1. Kinetic parameters used by the PSO model to determine the adsorption of lead and cadmium by the bilayer nanofibers. The mean errors between the model and the experiment are listed.
AdsorbentsAdsorption of LeadAdsorption of Cadmium
k 2
(1/min)
q e exp
(mg/g)
q e model  
(mg/g)
MAAE
%
k 2  
(1/min)
q e exp
(mg/g)
q e model  
(mg/g)
MAAE
%
PAN–CS0.007783.888.50.60.0078110.5114.02.5
PAN/TiO2–CS0.0056127.9131.22.80.0136160.1159.20.7
PAN/ZnO–CS0.0029119.0126.41.60.0067133.3137.42.3
Table 2. Parameters of Langmuir and Freundlich isotherms for the adsorption of lead by the bilayer nanofiber mats. The values between the parentheses represent the results obtained by the nonlinear optimization method.
AdsorbentsLangmuir ModelFreundlich Model
qmax
(mg/g)
KL
(L/mg)
R2MAAE
%
nKF
(mg/g)/(mg/L)n
R2MAAE
%
PAN–CS234.45
(268.5)
0.0086
(0.008)
0.8214.7
(15.4)
1.86
(2.92)
8.25
(25.2)
0.5917.5
(103.4)
PAN/TiO2–CS491.74
(502.9)
0.0079
(0.008)
0.907.4
(7.8)
1.63
(2.23)
11.82
(27.69)
0.8511.7
(70.6)
PAN/ZnO–CS662.56
(592.7)
0.0048
(0.007)
0.7110.4
(10.5)
1.34
(1.99)
6.68
(22.7)
0.8014.8
(124.4)
Table 3. Parameters of Langmuir and Freundlich isotherms for the adsorption of cadmium by the bilayer nanofiber mats. The values between the parentheses represent the results obtained by the nonlinear optimization method.
AdsorbentsLangmuir ModelFreundlich Model
qmax
(mg/g)
KL
(L/mg)
R2MAAE
%
nKF
(mg/g)/ (mg/L)n
R2MAAE
%
PAN–CS588.4
(530.3)
0.005
(0.008)
0.6313.3
(13.6)
1.38
(2.23)
6.80
(28.4)
0.6618.0
(154)
PAN/TiO2–CS486.5
(529.3)
0.064
(0.06)
0.988.4
(8.9)
2.77
(3.98)
78.95
(125.2)
0.6715.8
(29.7)
PAN/ZnO–CS600.6
(588.7)
0.011
(0.014)
0.8411.8
(12.2)
1.63
(49.7)
18.26
(2.48)
0.6917.3
(46.1)
Table 4. Maximum tensile stress values and elongation at break for different mats
Nanofiber MatMaximum Tensile Strength (MPa)Elongation at Break
CS11.72 ± 0.960.11 ± 0.09
PAN–CS7.91 ± 0.740.55 ± 0.06
PAN/TiO24.18 ± 0.530.92 ± 0.07
PAN/TiO2–CS7.25 ± 0.650.52 ± 0.05
PAN/ZnO3.73 ± 0.350.54 ± 0.05
PAN/ZnO–CS6.18 ± 0.710.43 ± 0.03

