Article

Controllable Fabrication of Large-Size Defect-Free Domains of 2D Colloidal Crystal Masks Guided by Statistical Experimental Design

1
School of Materials Science and Engineering, Hubei University of Automotive Technology, Shiyan 442002, China
2
School of Engineering, Huzhou University, Huzhou 313000, China
3
Department of research and development, Dalian Chivy Biotechnology Co., LTD, Dalian 116011, China
4
Key Laboratory of Organic Synthesis of Jiangsu Province and the State and Local Joint Engineering Laboratory for Novel Functional Polymeric Materials, College of Chemistry, Chemical Engineering and Materials Science, Soochow University, Suzhou 215123, China
5
Department of Materials Science and Engineering, KTH Royal Institute of Technology, SE-100 44 Stockholm, Sweden
6
Department of Materials Science and Engineering, Shanghai Institute of Technology, Shanghai 201418, China
*
Authors to whom correspondence should be addressed.
Submission received: 25 November 2020 / Revised: 6 January 2021 / Accepted: 11 January 2021 / Published: 13 January 2021

Abstract

:
Large defect-free domains of a hexagonal packed monolayer of silica spheres with the size of 4000 µm2 were successfully prepared by dual-speed spin coating. Experimental design and statistical analysis instead of the traditional ‘changing one separate factor at a time’ (COST) approach were employed to guide the implementation of the experiments. With its assistance, the hexagonal-close-packed (HCP) percentage was elevated to 84% in this study. Furthermore, almost all the samples with parameters in the selected ranges possessed more than a 60% HCP percentage. In addition, the optimal values for parameters of the suspension concentration, the first rotation speed, and the spinning time to obtain well-ordered silica spheres arrays were also identified as 30 wt.%, 1000 rpm and 20 s, respectively.

1. Introduction

Due to their applications as effective and versatile templates in surface patterning in functional two-dimensional (2D) patterned nanostructures, 2D colloidal crystals, also known as monolayer colloidal crystals (MCC), are attracting increased research interest [1,2,3,4]. Various MCC templates have been studied and reported extensively, such as hexagonal-close-packed (HCP) MCCs [5,6], non-close-packed (NCP) and patterned MCCs [7,8], and binary colloidal crystals (BCCs) [9,10]. Among the various MCCs, HCP monolayer arrays of colloidal spheres are the most frequently employed and the most easily self-assembled. This is due to their thermodynamic stability. The HCP structure can be arranged automatically by monodisperse colloidal spheres.
Many methods for patterning surfaces have been developed to prepare large-area monolayer colloidal crystals, such as photolithography [11,12], X-ray lithography [13], electron beam lithography [14,15] and nano-imprint lithography [16]. However, these methods either demand expensive equipment, require a relatively long time for the fabrication, or give a low throughput, which limits their application. By contrast, spin coating is fast, low-cost, easily manipulated, and compatible with wafer-scale processes [17,18]. These features fulfill the industry requirements, which gives spin coating the potential to fabricate large area of uniform monolayers with high surface coverage industrially.
Many parameters involved in the spin coating process, like spin speed, spin time, slurry concentration, relative humidity, acceleration rate, impose an influence on the structure of the thin films obtained. If a traditional ‘change one factor at a time’ strategy is employed to investigate the involved factors and to explore the potential influential ones, a large number of experiments need to be carried out. This is, of course, exhaustive and time-consuming. An alternative method, experimental design, can be applied to solve this problem. It is a method which enables that fewer experiments are conducted to obtain a maximum amount of information from the collected data. By this method, only a few experiments should be performed and the impact of the involved factors can be identified efficiently.
Many studies have been reported to synthesize large-area monolayers successfully [5,19,20]. However, it is still a challenge to enlarge the domain size and especially the defect-free domain size. In our previous work [21], the impact of the factors involved, including relative humidity, the spinning speed and time of the first stage, the spinning speed and time of the second stage, and accelerating rate were studied. It was found that the relative humidity, the spinning speed and time of the first stage are the crucial factors to obtain large defect-free domain size. With optimal parameters, large consistent defect-free domains of sizes greater than 3000 µm2 were prepared successfully using ø1.5 µm silica spheres through spin coating. Although the diameter of the silica spheres we used is larger, the ratio of the defect-free monolayer area to the square of sphere diameter is nearly two times the previously reported maximum values [22,23]. To further increase the defect-free domain size of the obtained masks, a new series of experiments based on the previous results were performed and progress is reported in this study.

2. Materials and Methods

2.1. Materials and Substrates

Monodisperse silica spheres with diameters of 1.5 μm were supplied as dry powder by Nippon Shokubai Co. Ltd (Osaka, Japan). The silica spheres were dispersed in ultrapure deionized water (18.2 MΩ, Milli-Q, Billerica, MA, USA) by an ultra-sonicating treatment to ensure that the suspension was aggregate-free before use.
Glass microscope slides (26 mm × 76 mm, Solveco AB, Rosersberg, Sweden) were cut into small pieces with dimensions of 18 mm × 18 mm. The glass substrates were pre-treated prior to deposition of the colloidal suspension, according to the cleaning sequence developed by Kern et al. [24]. This aimed to ensure that a clean and completely hydrophilic surface could be produced. The overall sequences were typically as follows and intermediate rinsing steps were performed between these chemical steps. Firstly, the substrates were treated in an ultrasonic bath in ethanol for 3 min. Subsequently, the substrates were heated in a piranha solution (1:3, 30% H2O2/H2SO4, Sigma Aldrich, Darmstadt, Germany) at 120 °C for 0.5 h to remove relatively heavy organic contaminations. Thirdly, the substrates were heated in a SC-1 solution (1:1:5, 25% NH4OH/30% H2O2/Milli-Q H2O, Sigma Aldrich) at 75 °C for 15 min. This step was to ensure that particles and metals were removed. Finally, the substrates were immersed in a SC-2 solution (1:1:6, 35% HCl, VWR/30% H2O2/Milli-Q H2O) at 75 °C for 15 min to remove residual metal including metals that may have been deposited in the SC-1 solution. The substrates were blown dry at room temperature before deposition of the spheres.

2.2. Coating Procedures

A SiO2 particle suspension was spin-coated on treated glass slides with a modified spin coater (TA-280, Shenyang Sile Co. Ltd., Shenyang, China) under controlled relative humidity conditions. A dual-spinning speed technique was used, where the suspension was spread on the substrate at a low spin speed and then accelerated to a second higher spin speed to remove any excessive suspension. The relative humidity was fixed at a value of 23% and the volume of the droplet was set to 50 μL for all coating experiments. The acceleration rate, the rotation speed and spinning time for the second step of spin coating process were fixed at 600 rpm/s, 3000 rpm and 20 s, respectively.

2.3. Characterization Methods

The quality of the colloidal mask structure was determined by a hexagonal close-packed (HCP) arrangement percentage. A Leica microsystems optical microscope (Leica DM RM, series 189870, Weztlar, Germany) was employed to analyze the samples obtained in order to determine the HCP percentage. Twenty-one images were taken on each sample at a 500× magnification, starting from the center and moving towards the edge of the substrate in four directions. For each direction, five pictures were taken at intervals of 1 mm.
A Matlab toolkit based on Delaunay triangulation was designed and applied to analyze the ordering degree of the colloidal masks. The percentage of spheres in contact with six neighboring spheres was qualified as the value of order in a hexagonal close-packed arrangement. The final HCP percentage of the specified sample was calculated as an average value of 21 obtained images examined by using optical microscopy. To confirm the repeatability of our method, we repeated some samples 3 times with the same parameters in the preliminary study. The results showed that the error of the obtained coverage and HCP percentage is within 5%, which is within the allowed error range. Therefore, only one sample was prepared for each condition in this work to save time and energy.
The morphologies of the silica sphere colloidal masks were analyzed by using scanning electron microscopy (JEOL JSM-7000F, Tokyo, Japan). In addition, an image analysis software (image J) was applied to calculate the coverage area and the domain size of the monolayers obtained [25].

2.4. Statistical Design of Experiments

Due to its efficiency and excellent ability to evaluate complicated systems, factorial design was selected to explore the optimal conditions for obtaining a higher HCP percentage. In the present study, the influence of different factors, such as (i) concentration of the silica sphere solution, (ii) rotation speed (va) and (iii) spinning time (ta) during the first stage of spin coating procedure, on the HCP percentage of the obtained masks were studied with the assistance of factorial design.

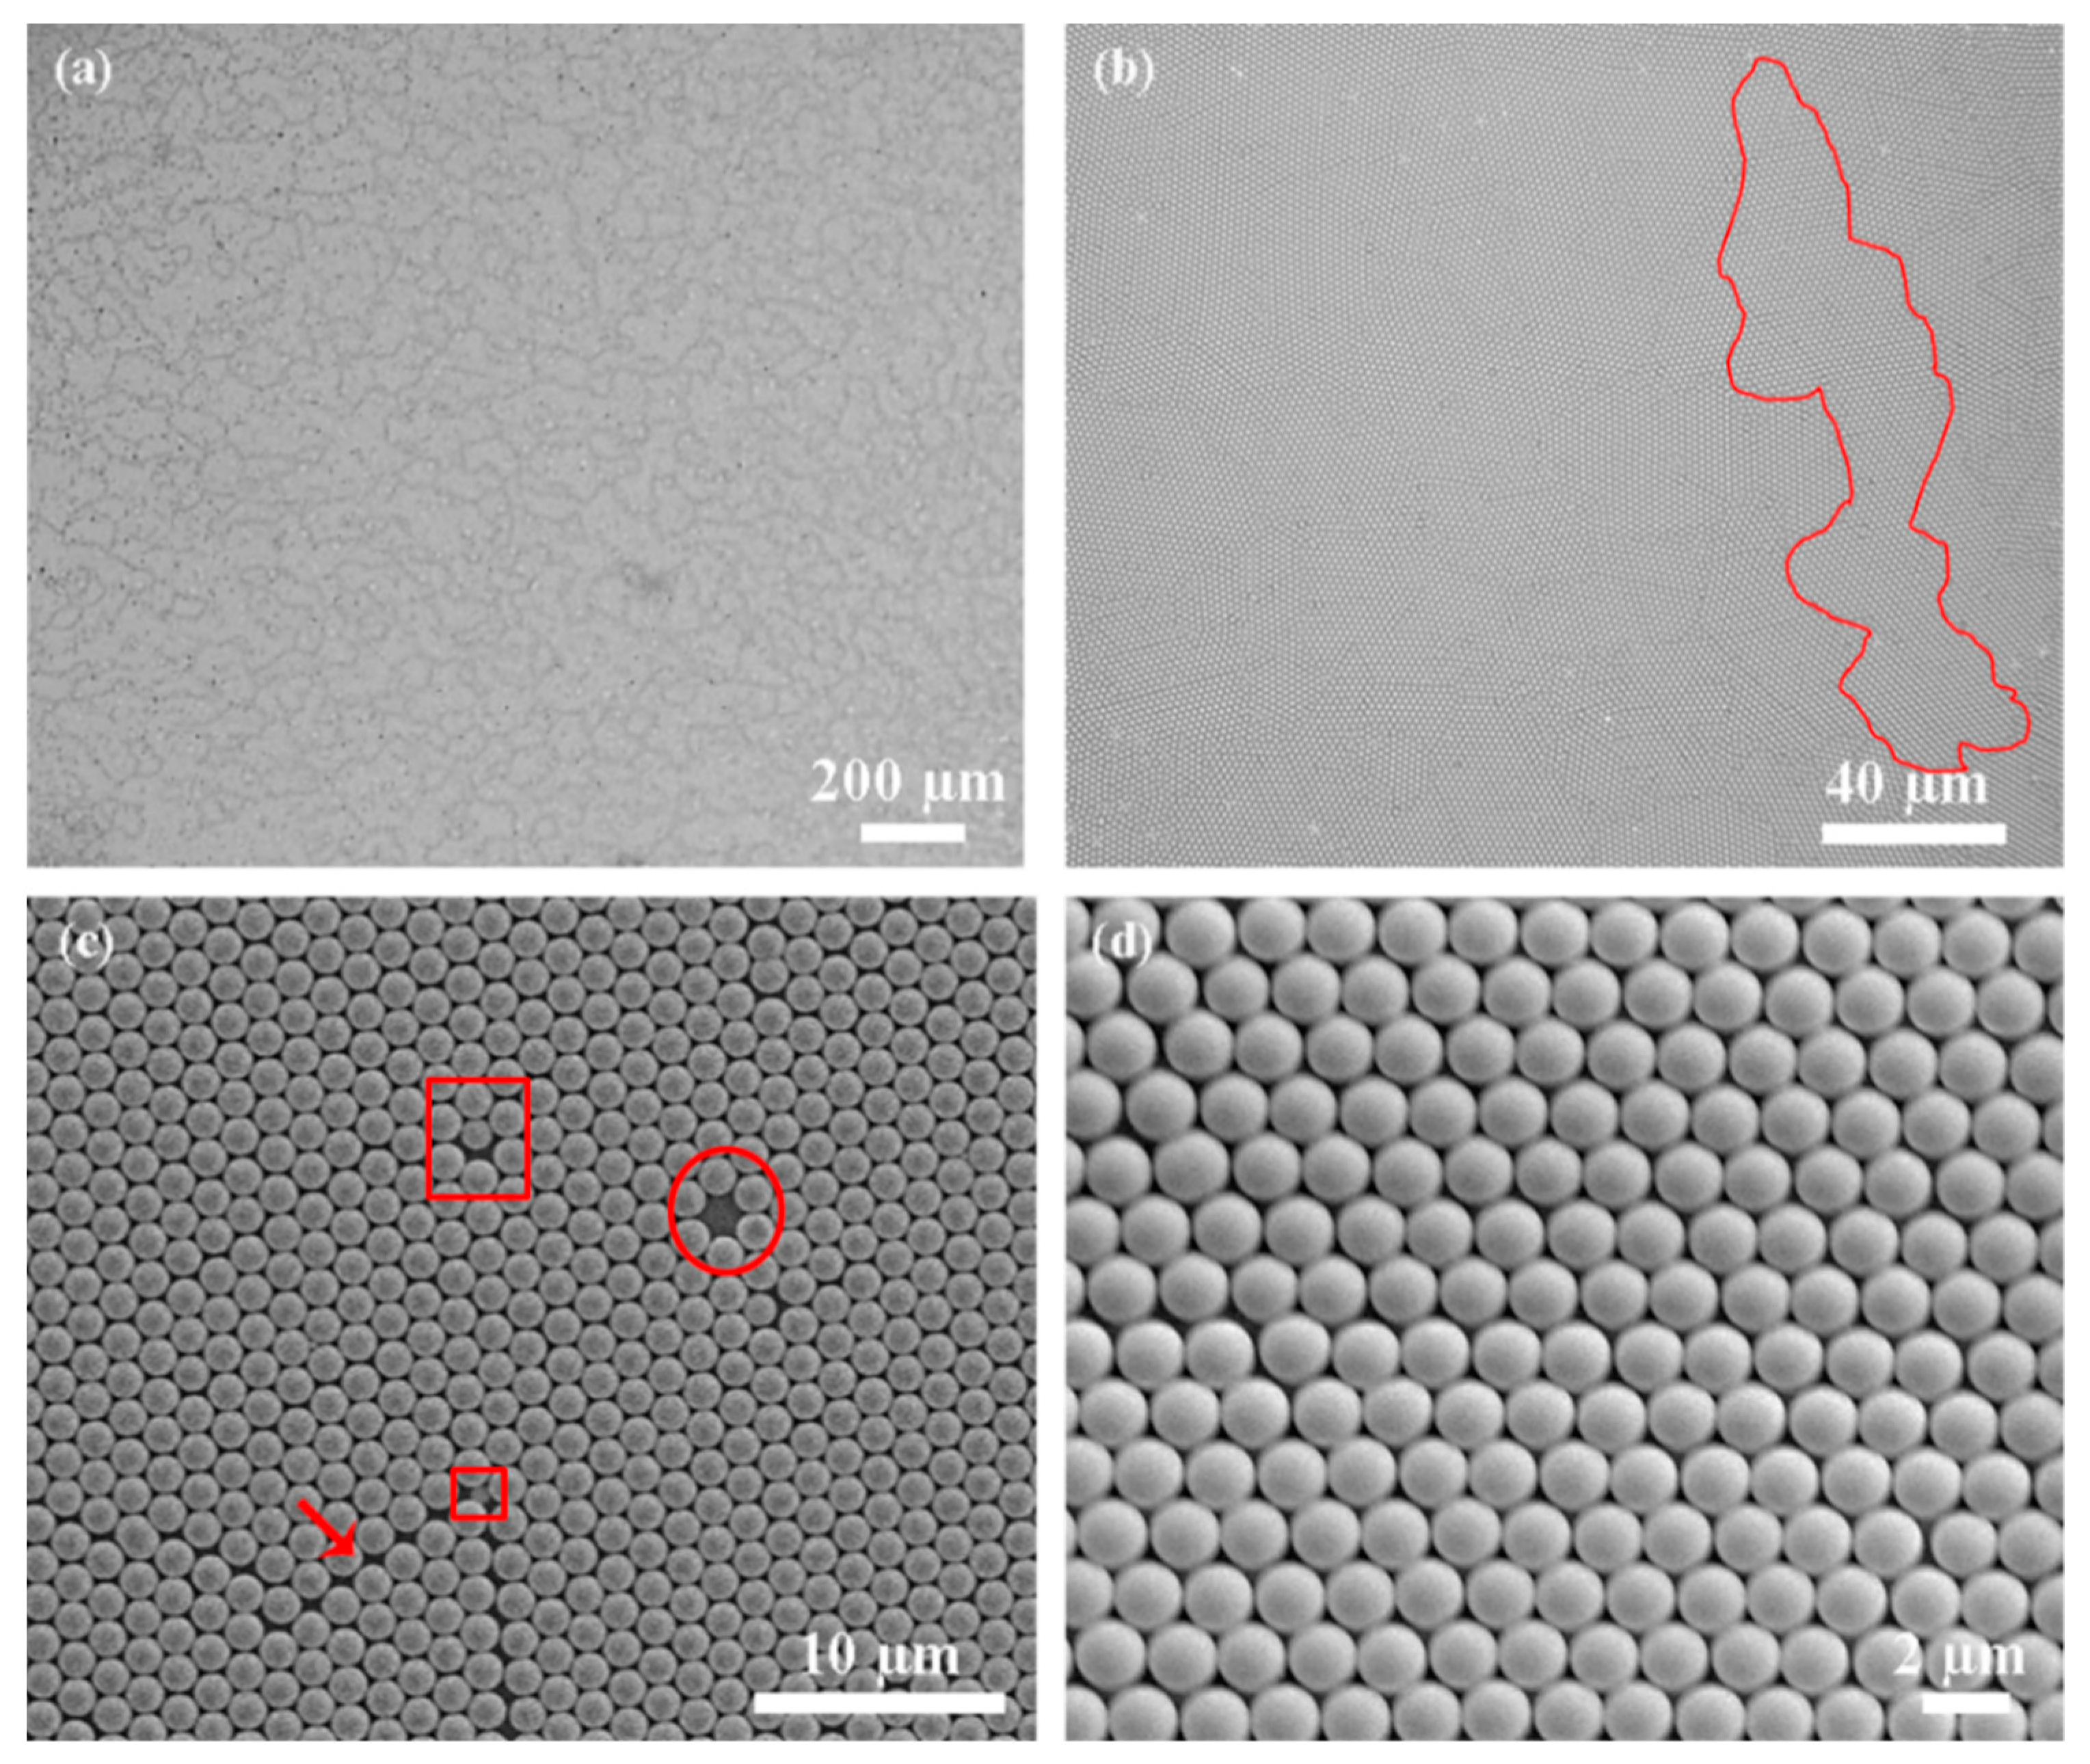
2.5. Verification of the Monolayer

In this work, it was essential to determine whether the obtained film was a monolayer. All of the samples were examined by optical microscopy with small magnification like 20 times. Figure 1 is a typical image of the edge of the samples. The vacancy, monolayer and multilayer of silica spheres can be easily distinguished from the contrast. In the circled area, multilayer of silica spheres can be easily determined. Missing silica spheres can be observed in the square zone. Then the lens will focus on the square zone and higher magnification will be employed. By higher magnification, the monolayer can be observed in the square area. Then the lens will move to other parts with the same contrast to certify the existence of a monolayer.

3. Results and Discussion

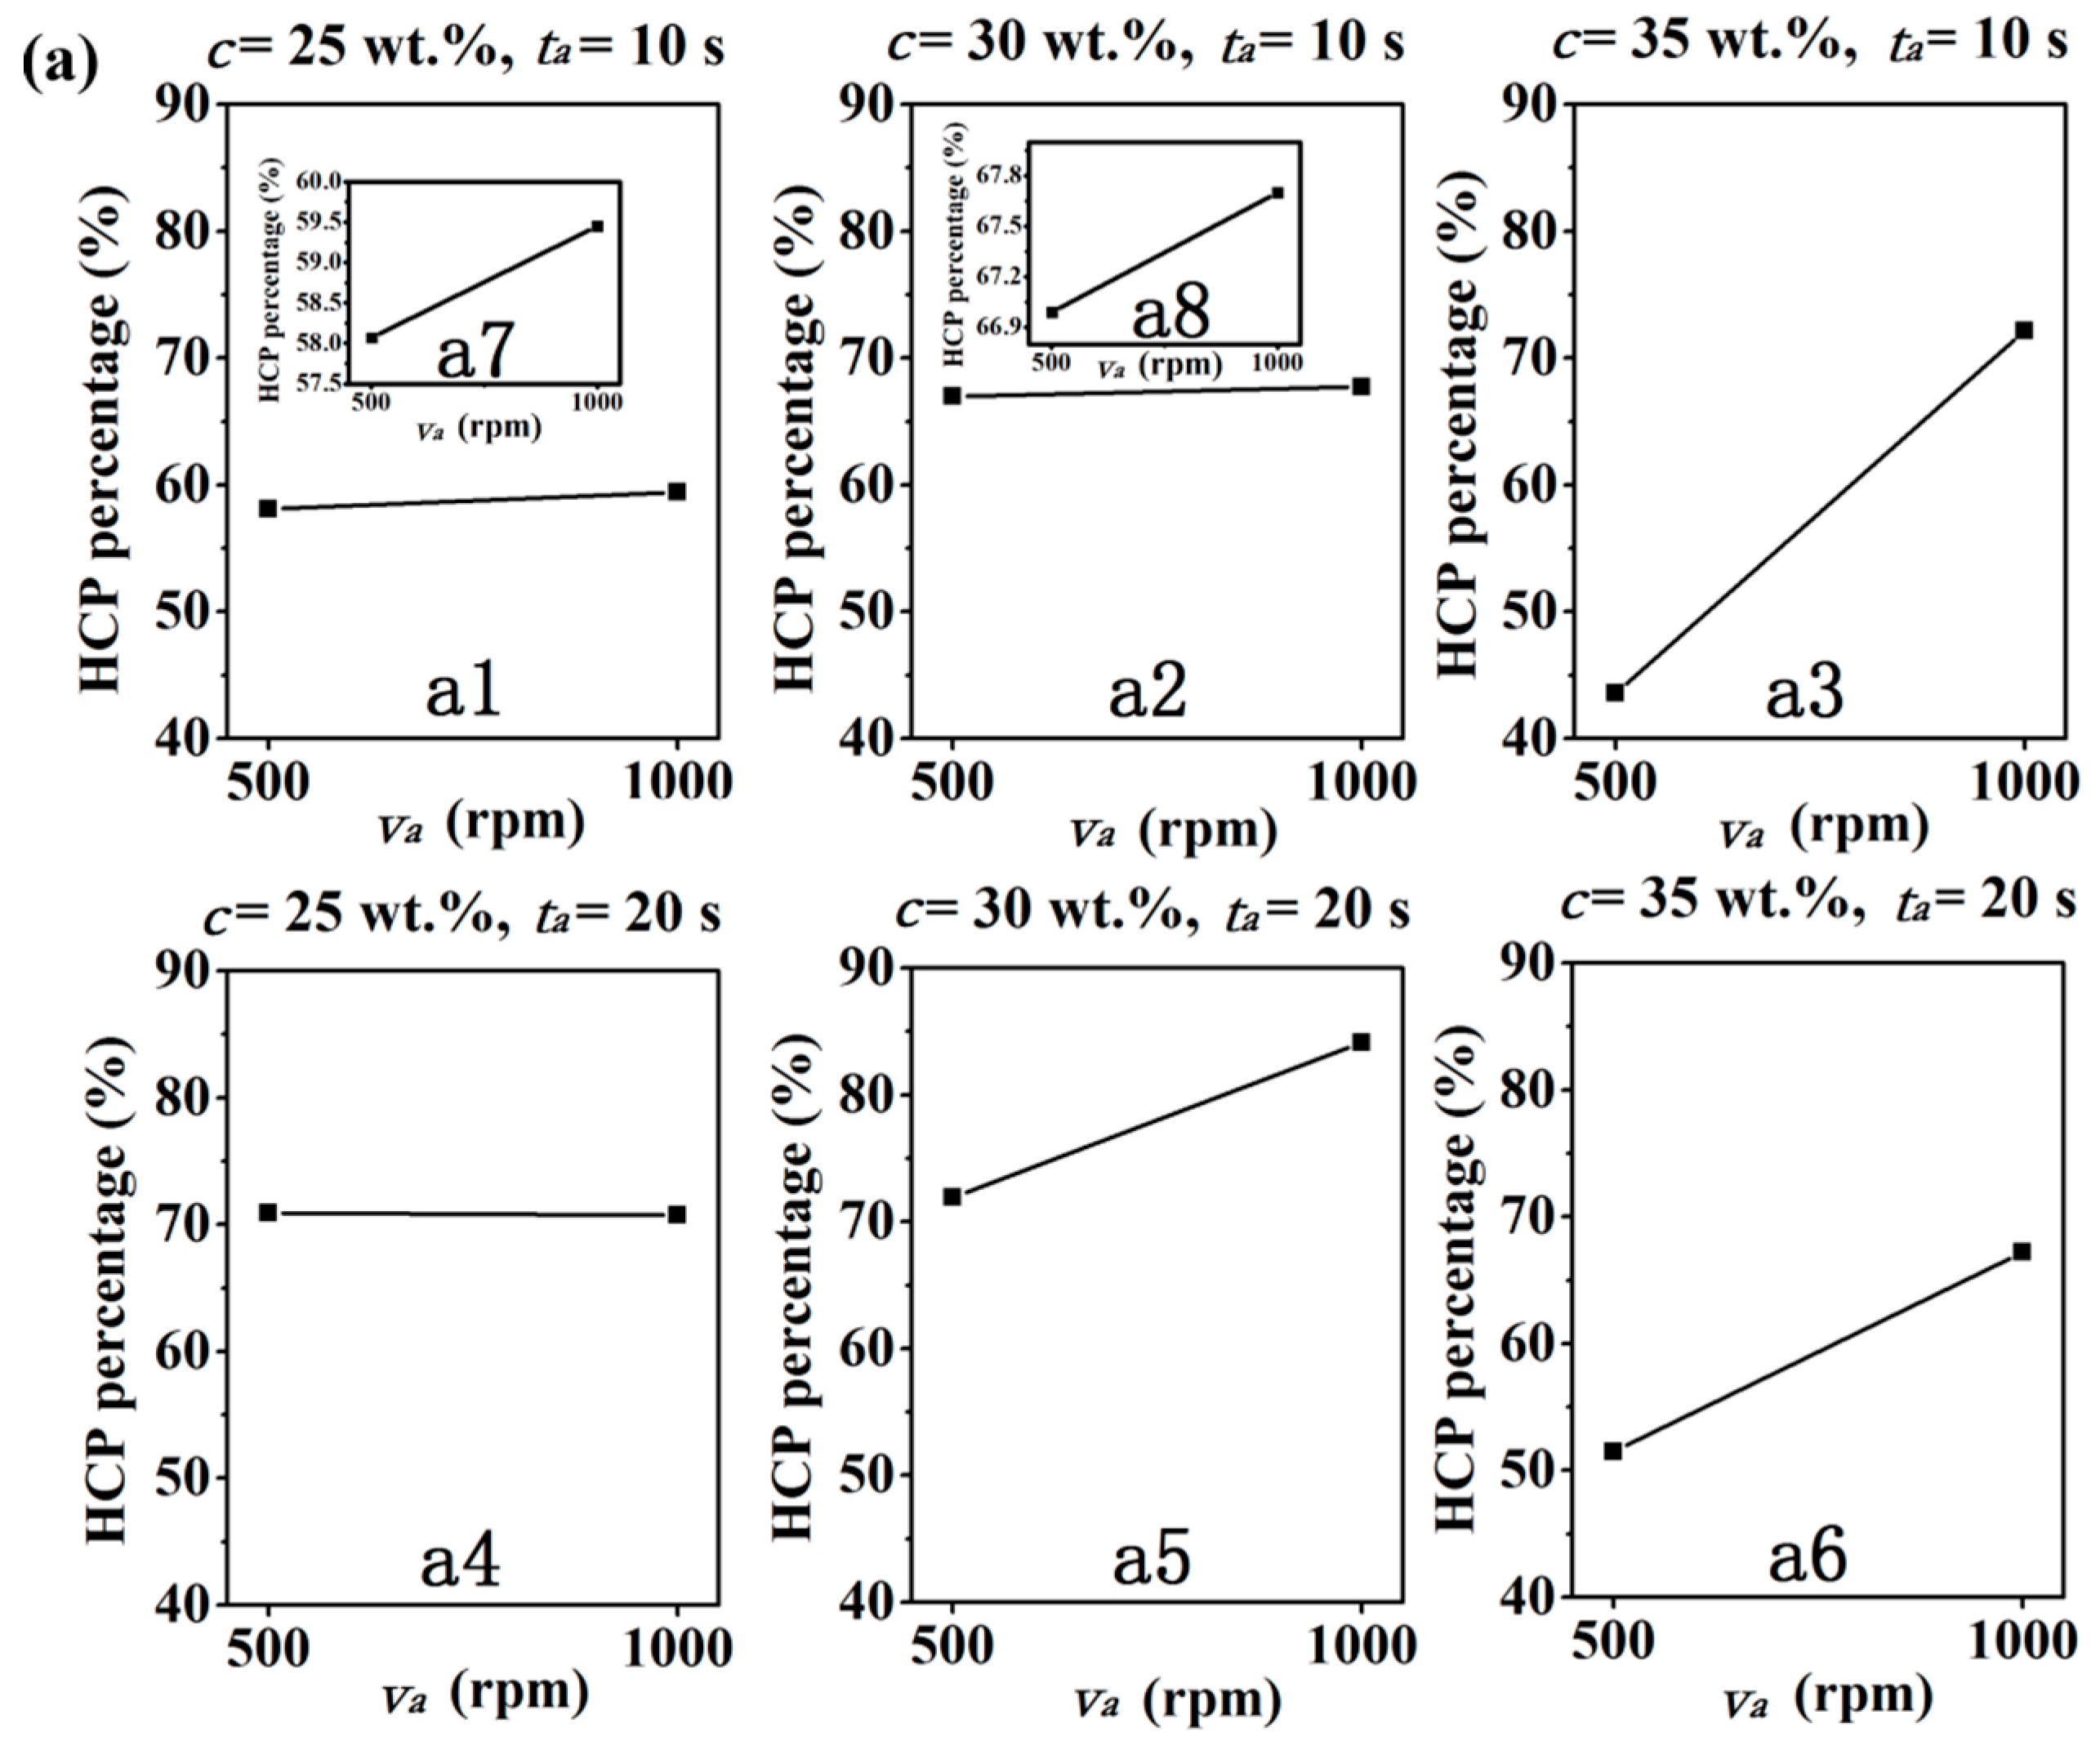
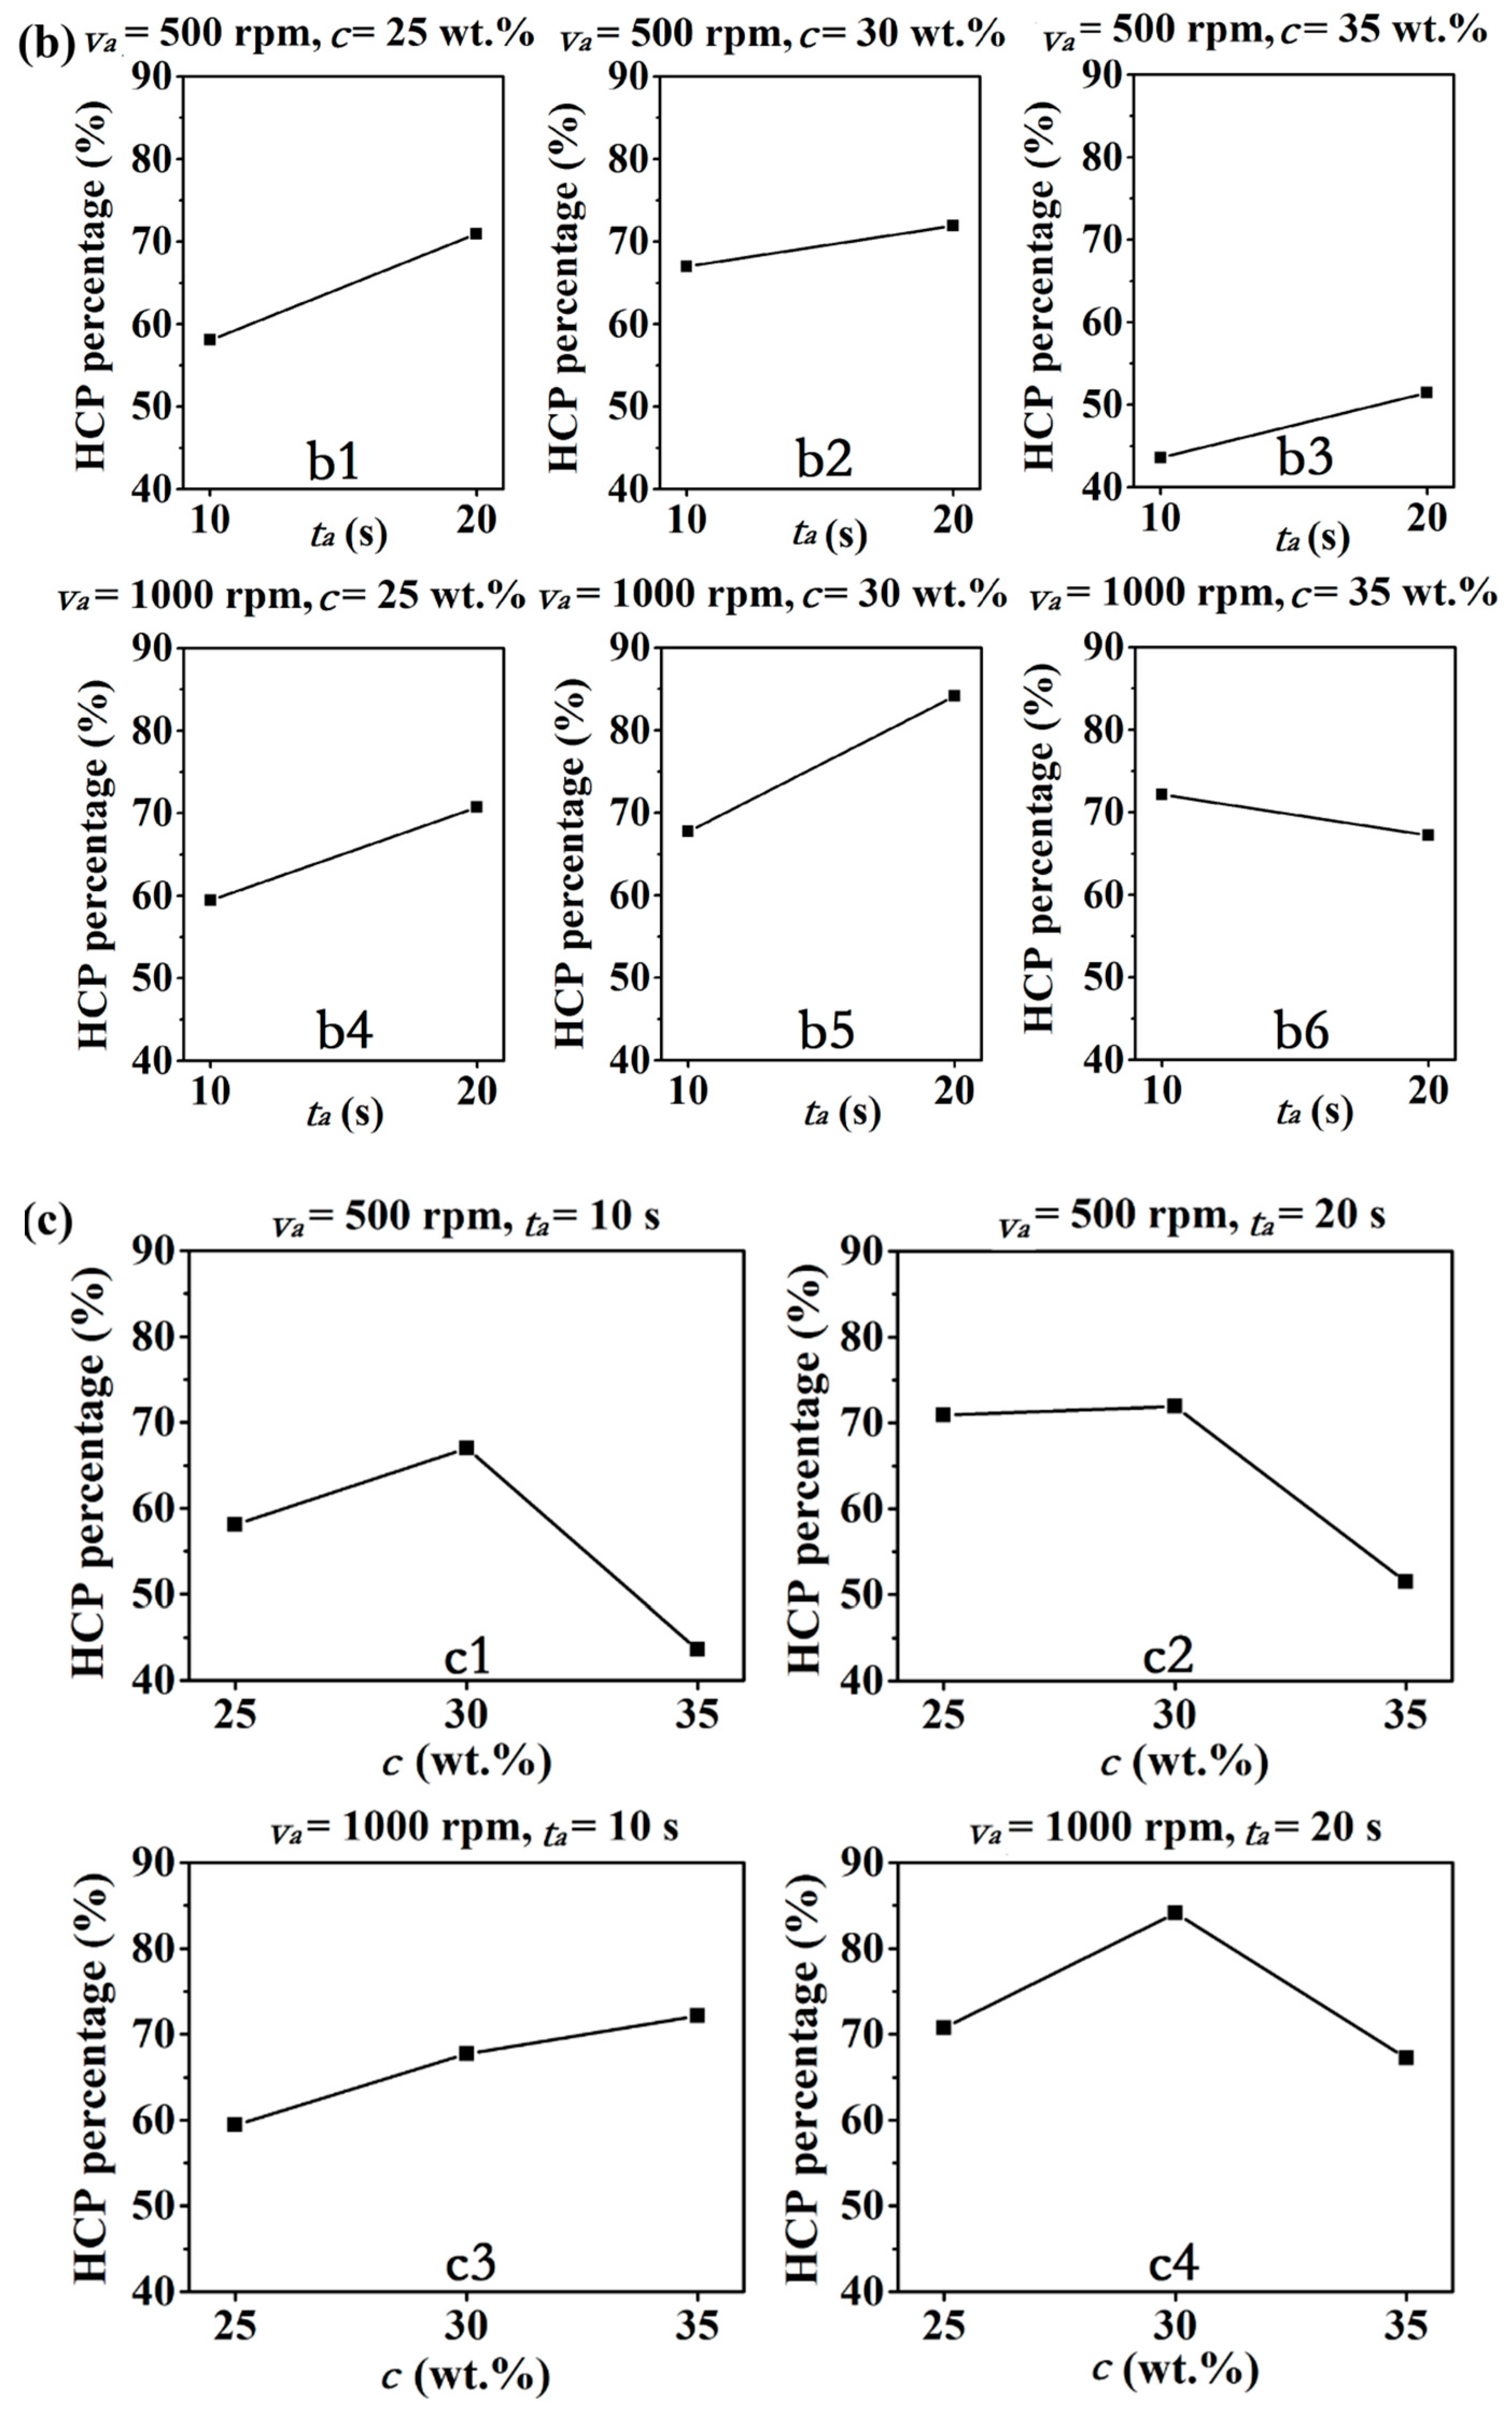
3.1. The Selection of the Selected Range of the Parameters

In our previous report [21], the relative humidity, first rotation speed and spinning time were found to be the crucial parameters for the synthesis of large-area silica sphere monolayers. Since it was confirmed that the HCP percentage of the obtained masks was decreased with an increased relative humidity, the relative humidity in this study was fixed at a low level of 23%. The slurry concentration was not considered as one parameter of the spin-coating system to ease the practical operation in the previous paper [21]. However, according to Ogi [20], a higher solution concentration was advantageous to achieve a higher surface coverage. We suppose solution concentration may also impose an important effect on the defect-free domain size. Therefore, the impact of the suspension concentration on the ordering structure of the monolayer obtained was investigated in this paper and three levels were selected for it. The first rotation speed and the spinning time during the spin coating period were still selected as influential factors and two levels were chosen for each of them. In the previous study [21], the first rotation speed was first studied from 300 to 1000 rpm and it was found that the HCP percentage increased with increased spin speed in this range. Then the spin speed was expanded from 1000 to 4000 rpm. After three series of detailed studies, the optimal spin speed was determined as 1000 rpm. However, the spin speed was studied roughly in the range of 300 to 1000 rpm. The optimized value may have fallen in this range, so the two levels of the first spin speed in this study were set as 500 and 1000 rpm. Therefore, the set of the experiments contained 12 runs and represented a 2231 full factorial design, as shown in Table 1.
According to the results obtained, most of the obtained HCP percentage values were above or around 60%. This indicates that a good ordering of the monolayer can be obtained within the selected ranges of the parameters and that the selected ranges were appropriate. In most cases, a large area of a well-ordered monolayer could be achieved if the parameters were located in the aforementioned ranges. This made the practical work substantially more efficient.

3.2. The Main Effect Analysis of Each Parameter

One-group-at-a-time main effect analysis was employed to evaluate the effect of each factor on the HCP percentage of the obtained monolayers. In this method, the responses are grouped, wherein the level of only one factor is changed. This is an easy and effective method for the analysis of the main effect of each factor on the results. Figure 2 was employed to illustrate this method. The three groups of plots in Figure 2a–c were used to compare the chosen levels for the first rotation speed, the first spinning time and the suspension concentration respectively. In each plot, the points connected by one line have the same settings for the other two parameters. Thus, they are different only with respect to the level of factor which is compared in the figure. From the three groups of plots in Figure 2, all the main effects of the three factors can be interpreted easily.
The effect of the first rotation speed on the HCP percentage of the monolayer obtained is investigated in Figure 2a. It can be observed that the ordering of the obtained arrays of silica spheres was improved with an increased rotation speed. Only one exception in the plot a4 can be found, where the HCP percentage is slightly (but within the allowed error range, only 0.15%) decreased. This is because a higher first rotation speed helps to spread the solution on the whole substrate homogenously. As a result, multilayers can be avoided to some extent. Therefore, it can be determined that the first rotation speed at 1000 rpm always resulted in a higher HCP percentage value than at the lower speed of 500 rpm, when the other factors are set as the same levels.
Figure 2b is employed to illustrate the impact of the first spinning time on the obtained HCP percentage. It is evident that the HCP percentage is increased with the prolongation of the first spinning time in most cases. This is because the prolongation of the spinning time favors a spread of the suspension onto the whole substrate in a homogenous manner. An exception can be found in plot b6 where a reduction of the HCP percentage can be observed. However, it is very small, namely only 5%. This value is within the range of measurement error and can be neglected. Moreover, it should be noted that both the samples with a concentration of 35 wt.% and a rotation speed of 500 rpm (in the plot b3) have a bad ordering degree (less than 55%), irrespective of the spinning time. This happens because the suspension with high concentration is readily accumulated when a low speed is employed, which promotes the formation of multilayers.
Figure 2c shows an investigation of the impact of the suspension concentration on the final HCP percentage value. Obviously, the HCP percentage is first increased and then reduced with the increase of the suspension concentration in most cases. The highest HCP percentage value could be obtained when the concentration was set as 30 wt.%. This was in good accordance with the results of the central columns in Figure 2a,b, where the HCP percentage obtained was always higher than 65% when the solution was set as 30 wt.%, irrespective of the level of the rotation speed and spinning time. Therefore, the optimal concentration to obtain ordered arrays of silica spheres can be determined to be 30 wt.%. As for the small increase of the HCP percentage value when the concentration is increased from 30 wt.% to 35 wt.% in the plot c3 in Figure 2c, it can be explained as follows. The suspension with a concentration of 35 wt.% contains excessive particles. When the rotation speed is as low as 500 rpm, the centrifugal force is not enough to spread the suspension homogenously. Therefore, islands of multilayers will be obtained and will destroy the obtained structures and reduce the HCP percentage. A rotation speed of 1000 rpm can be considered as the optimal speed, where the centrifugal force and the sphere–sphere interaction force are better balanced. At this condition, a first spinning time that is too long would cause more water evaporation. Once the dispersion medium (water) evaporates too much, the capillary force will not take effect any more during the high-speed spinning period. In this case, the high solid load might induce the formation of multilayers. However, a short spinning time of 10 s for the first step can get appropriate water evaporation, and the excessive solution can thus peel off the substrate; so not too much excessive silica spheres left during the following high-speed spinning. In this case, we can see that the capillary force dominates the growth of the colloidal crystals and a better-ordered monolayer can be obtained if the capillary force can be manipulated carefully by changing spin-coating parameters.
According to the above discussions, the HCP percentage is always increased with an increased rotation speed within the selected ranges. Also, a rotation speed of 1000 rpm can be identified as the optimal value of the first rotation speed, which is consistent with the conclusion of our previous work [21]. Moreover, the prolongation of the spinning time also favors production of well-ordered arrays of silica spheres. As for the slurry concentration, the optimal value can be determined as 30 wt.% to obtain a higher HCP percentage. Furthermore, the HCP percentage obtained can always reach a value of 65% or even higher when the concentration is set as 30 wt.%. In addition, the HCP percentage obtains the highest value of 84.12% when the suspension concentration, rotation speed and time were set as 30 wt.%, 1000 rpm and 20 s, respectively. Thus, the optimal parameters to obtain well-ordered silica sphere arrays have also been identified.

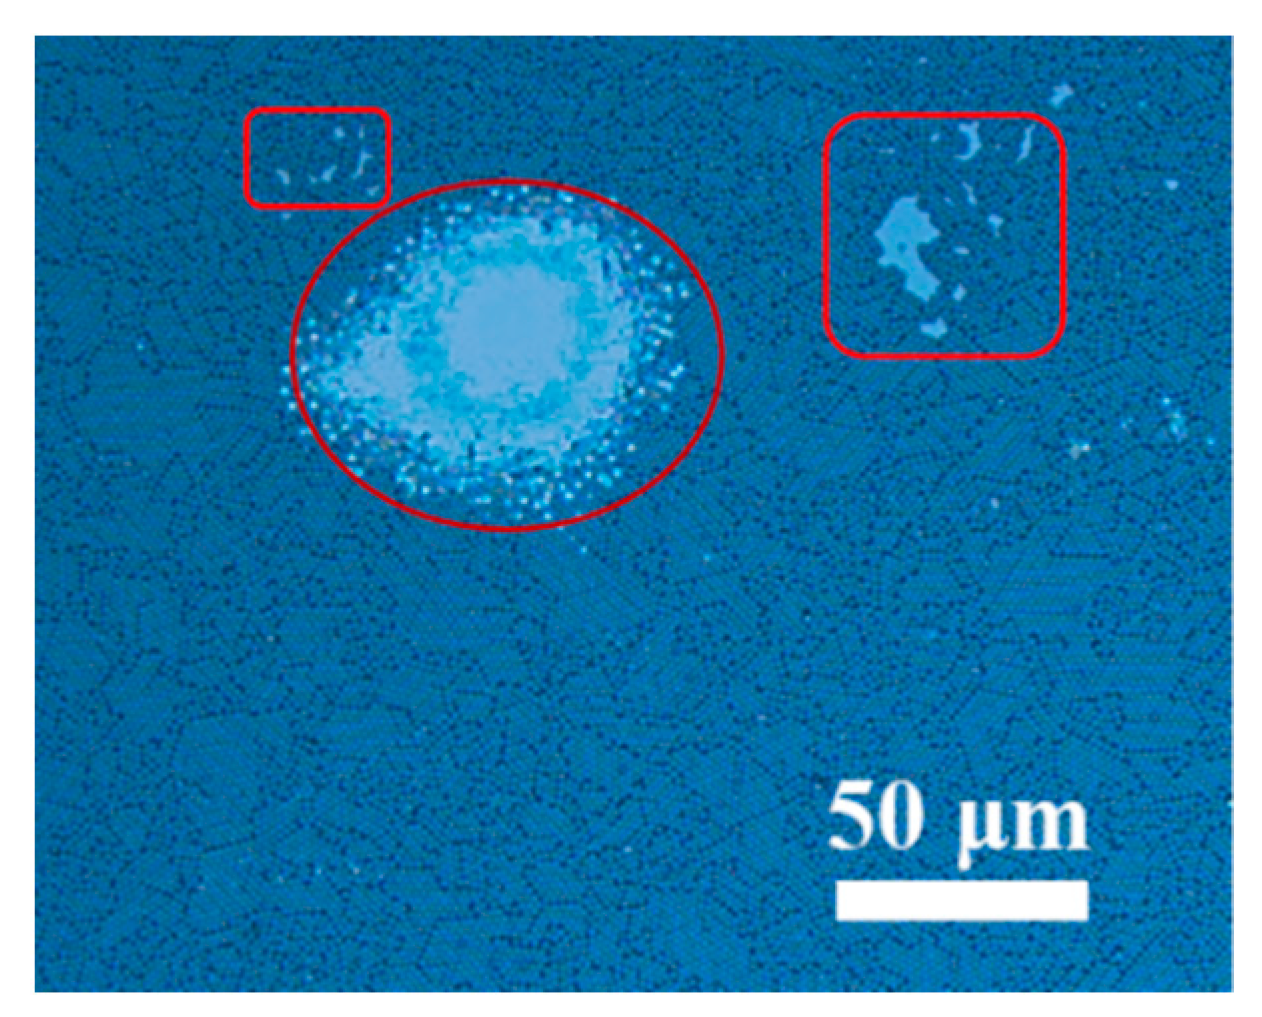
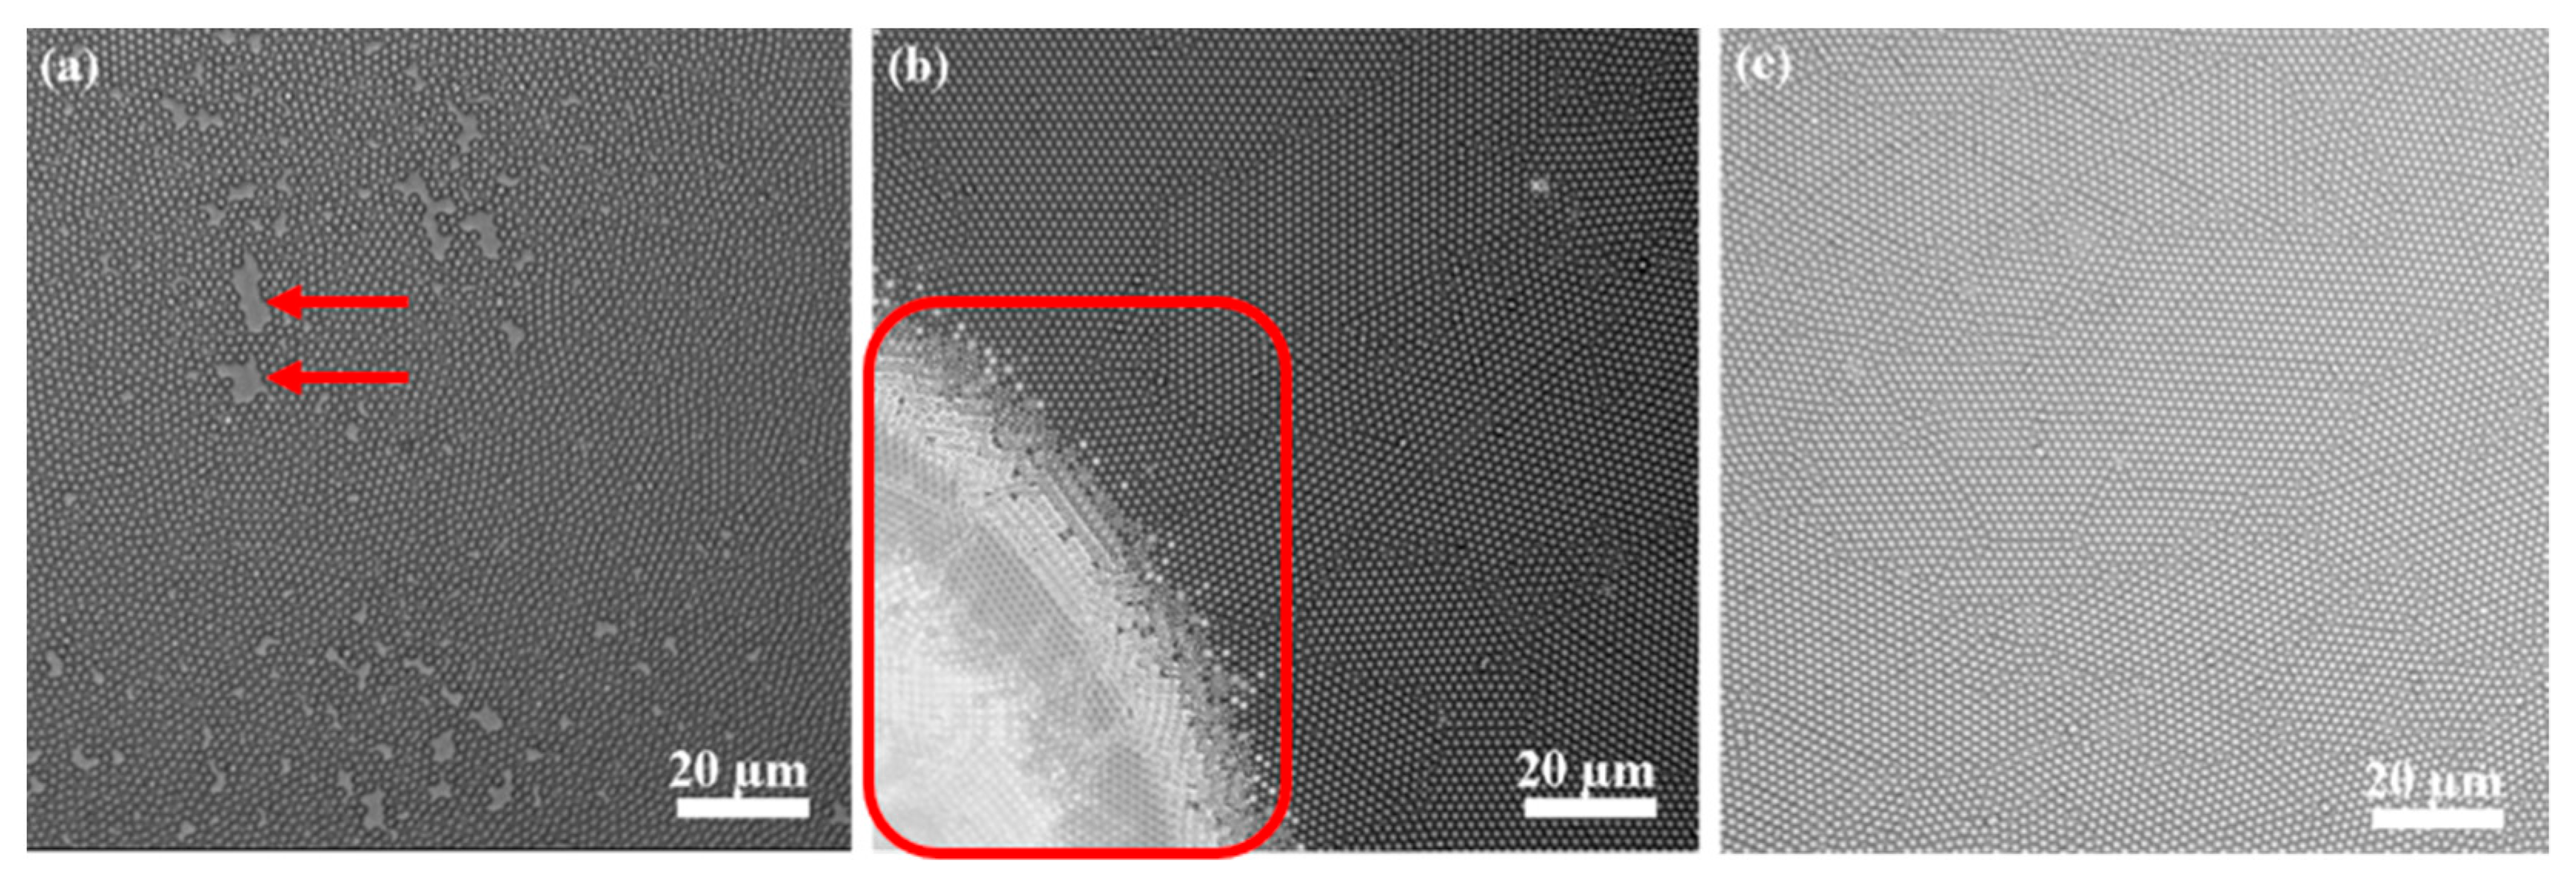
3.3. The Morphologies of the Obtained Masks

Figure 3 shows the typical optical microscopes images of various morphologies obtained with different parameters. Figure 3a reflects the typical morphologies obtained for samples No. 1 and No. 7, where large amounts of defects (indicated by red arrows) were obtained when using the parameters c = 25 wt.% and ta = 10 s. This is because when the concentration is low and the first spinning time is short, an insufficient amount of silica spheres can be left after the second high-speed spinning. Therefore, when the suspension concentration is low, the first spinning time should be prolonged to reduce the defects of the obtained structures. The typical morphologies of the structures obtained for the samples with a slurry concentration of 35 wt.% under a low rotation speed (No. 3 and No. 6) are shown in Figure 3b. It is evident that islands of multilayers are formed (indicated by the red square) when these conditions are used, which destroys the desired structures and reduces the HCP percentage. Therefore, when the concentration is 35 wt.%, a high rotation speed should be applied to obtain a large area of monolayers. Figure 3c presents the morphologies obtained when the suspension concentration is 30 wt.%. Obviously, large-area monolayers with large domain size were obtained. Therefore, it was proved again that a value of 30 wt.% can be determined as the optimal value of the suspension concentration to obtain large-area monolayers.
The typical optical microscope images and scanning electron microscope (SEM) images of the obtained monolayer with a HCP percentage over 65% are shown in Figure 4. Figure 4a,b is optical microscope images with magnifications of 50× and 500×, respectively. Apparently, a large coverage and a uniform monolayer of silica spheres could be obtained. The area can reach a value of more than 1 cm2, as shown in Figure 4a. Figure 4b indicates that the domain size of the monolayer obtained is also large. The largest defect-free domain is indicated by red lines in Figure 4b. The area is calculated to be even larger than 4000 µm2. This value is much larger than that obtained in our previous work (3000 µm2) [21]. Strictly speaking, the monolayer obtained is not absolutely perfect. Besides the defect-free domains, there are still some defects, such as missing particles (indicated by a circle) and small area of squared ordered spheres (indicated by an arrow), as shown in Figure 4c. In addition, a fraction of spheres with smaller diameter also cause defects in the structures, as indicated by the squares. However, these small area defects would not limit their applications in many fields. Moreover, the blank area where the spheres are missing confirms that the thin films obtained consist of monolayers rather than by multilayers. The SEM image with a higher magnification in Figure 4d clearly indicates that the monolayer obtained consists of a close-packed hexagonal ordered arrangement of silica spheres.

4. Conclusions

With the guidance of experimental design and statistical analysis, large areas of hexagonally close packed monolayers of silica spheres were successfully prepared on glass substrate using dual-speed spin coating. The results show that the HCP percentage of the masks obtained increases with an increased first rotation speed and a prolonged spinning time during the spin-coating procedure. The influence of the suspension concentration was also investigated and its optimal value was identified. Based on the optimized parameters, a large area of over 1 cm2 of silica spheres monolayer was successfully prepared by spin coating. Furthermore, the area of the defect-free domain of a silica sphere monolayer was enlarged to a size of up to 4000 µm2, which is much larger than the largest previously reported values of 3000 µm2. The large area defect-free hexagonally close packed monolayer obtained in our work could be used as a template in the surface patterning field, where functional 2D patterned nanostructures could be obtained with assistance of the hexagonally close packed monolayer.

Author Contributions

Conceptualization, Y.C. and Z.Z.; Data curation, X.S. and Y.C.; Formal analysis, X.S., J.W., and Y.C.; Funding acquisition, X.S. and Y.C.; Investigation, Y.C. and Z.Z.; Methodology, X.S., J.W., Y.C., and Z.Z.; Resources, Z.Z.; Writing—original draft, X.S.; Writing—review and editing, Y.C. All authors have read and agreed to the published version of the manuscript.

Funding

This research was funded by the China Postdoctoral Science Foundation (Grant No. 2019M651945); Research Project of Hubei Provincial Education Department (Q20191802); Doctoral Research Startup Fund in Hubei University of Automotive Technology (K201802); Hubei Provincial Natural Science Foundation of China (2020CFB366); General projects of natural fund of Liaoning Province (2019-MS-103).

Institutional Review Board Statement

Not applicable.

Informed Consent Statement

Not applicable.

Data Availability Statement

Data is contained within the article.

Conflicts of Interest

The authors declare no conflict of interest.

References

  1. Ye, X.; Qi, L. Two-dimensionally patterned nanostructures based on monolayer colloidal crystals: Controllable fabrication, assembly, and applications. Nano Today 2011, 6, 608–631. [Google Scholar] [CrossRef]
  2. Wang, H.; Chen, W.; Chen, B.; Jiao, Y.; Wang, Y.; Wang, X.; Du, X.; Hu, Y.; Lv, X.; Zeng, Y.; et al. Interfacial capillary-force-driven self-assembly of monolayer colloidal crystals for supersensitive plasmonic sensors. Small 2020, 16, 1905480. [Google Scholar] [CrossRef]
  3. Zhou, Y.; Xiong, S.; Zhang, X.; Volz, S.; Hu, M. Thermal transport crossover from crystalline to partial-crystalline partial-liquid state. Nat. Commun. 2018, 9, 4712. [Google Scholar] [CrossRef] [PubMed] [Green Version]
  4. Xiong, S.; Latour, B.; Ni, Y.; Volz, S.; Chalopin, Y. Efficient phonon blocking in SiC antiphase superlattice nanowires. Phys. Rev. B 2015, 91, 224307. [Google Scholar] [CrossRef]
  5. Jiang, P.; McFarland, M.J. Large-scale fabrication of wafer-size colloidal crystals, macroporous polymers and nanocomposites by spin-coating. J. Am. Chem. Soc. 2004, 126, 13778–13786. [Google Scholar] [CrossRef] [PubMed]
  6. Noppakuadrittidej, P.; Tonsomboon, K.; Ummartyotin, S. Importance of solvent singularity on the formation of highly uniform hexagonal close packed (HCP) colloidal monolayers during spin coating. Colloid Interface Sci. Commun. 2019, 30, 100177. [Google Scholar] [CrossRef]
  7. Jiang, P.; Prasad, T.; McFarland, M.J.; Colvin, V.L. Two-dimensional nonclose-packed colloidal crystals formed by spincoating. Appl. Phys. Lett. 2006, 89, 011908. [Google Scholar] [CrossRef]
  8. Aoyama, Y.; Toyotama, A.; Okuzono, T.; Yamanaka, J. Two-dimensional nonclose-packed colloidal crystals by the electrostatic adsorption of three-dimensional charged colloidal crystals. Langmuir 2019, 35, 9194–9201. [Google Scholar] [CrossRef] [PubMed]
  9. Wang, D.; Möhwald, H. Rapid fabrication of binary colloidal crystals by stepwise spin-coating. Adv. Mater. 2004, 16, 244–247. [Google Scholar] [CrossRef]
  10. LaCour, R.A.; Adorf, C.S.; Dshemuchadse, J.; Glotzer, S.C. Influence of softness on the stability of binary colloidal crystals. ACS Nano 2019, 13, 13829–13842. [Google Scholar] [CrossRef] [PubMed]
  11. Herzer, N.; Hoeppener, S.; Schubert, U.S. Fabrication of patterned silane based self-assembled monolayers by photolithography and surface reactions on silicon-oxide substrates. Chem. Commun. 2010, 46, 5634–5652. [Google Scholar] [CrossRef] [PubMed]
  12. Han, X.; Sun, S.; He, T. Preparation and photolithography of self-assembled monolayers of 10-mercaptodecanylphosphonic acid on glass mediated by zirconium for protein patterning. Colloids Surf. B Biointerfaces 2013, 108, 66–71. [Google Scholar] [CrossRef] [PubMed]
  13. Yang, X.M.; Peters, R.D.; Kim, T.K.; Nealey, P.F.; Brandow, S.L.; Chen, M.-S.; Shirey, L.M.; Dressick, W.J. Proximity X-ray lithography using self-assembled alkylsiloxane films: Resolution and pattern transfer. Langmuir 2000, 17, 228–233. [Google Scholar] [CrossRef]
  14. Leigh, S.J.; Prieto, J.L.; Bowen, J.; Lewis, S.; Robinson, A.P.G.; Iqbal, P.; Preece, J.A. Controlling gold nanoparticle assembly on electron beam-reduced nitrophenyl self-assembled monolayers via electron dose. Colloids Surf. A Physicochem. Eng. Asp. 2013, 433, 181–190. [Google Scholar] [CrossRef]
  15. Lercel, M.J.; Redinbo, G.F.; Pardo, F.D.; Rooks, M.; Tiberio, R.C.; Simpson, P.; Craighead, H.G.; Sheen, C.W.; Parikh, A.N.; Allara, D.L. Electron beam lithography with monolayers of alkylthiols and alkylsiloxanes. J. Vac. Sci. Technol. B Microelectron. Nanometer Struct. Process. Meas. Phenom. 1994, 12, 3663–3667. [Google Scholar] [CrossRef]
  16. Guo, L.J. Nanoimprint lithography: Methods and material requirements. Adv. Mater. 2007, 19, 495–513. [Google Scholar] [CrossRef] [Green Version]
  17. Li, C.; Hong, G.; Wang, P.; Yu, D.; Qi, L. Wet chemical approaches to patterned arrays of well-aligned ZnO nanopillars assisted by monolayer colloidal crystals. Chem. Mater. 2009, 21, 891–897. [Google Scholar] [CrossRef]
  18. Utsav; Khanna, S.; Paneliya, S.; Ray, A.; Mukhopadhyay, I.; Banerjee, R. Controlled etching of silica nanospheres monolayer for template application: A systematic study. Appl. Surf. Sci. 2020, 500, 144050. [Google Scholar] [CrossRef]
  19. Chen, J.; Dong, P.; Di, D.; Wang, C.; Wang, H.; Wang, J.; Wu, X. Controllable fabrication of 2D colloidal-crystal films with polystyrene nanospheres of various diameters by spin-coating. Appl. Surf. Sci. 2013, 270, 6–15. [Google Scholar] [CrossRef]
  20. Ogi, T.; Modesto-Lopez, L.B.; Iskandar, F.; Okuyama, K. Fabrication of a large area monolayer of silica particles on a sapphire substrate by a spin coating method. Colloids Surf. A Physicochem. Eng. Asp. 2007, 297, 71–78. [Google Scholar] [CrossRef]
  21. Cheng, Y.; Jönsson, P.G.; Zhao, Z. Controllable fabrication of large-area 2D colloidal crystal masks with large size defect-free domains based on statistical experimental design. Appl. Surf. Sci. 2014, 313, 144–151. [Google Scholar] [CrossRef]
  22. Colson, P.; Cloots, R.; Henrist, C. Experimental design applied to spin coating of 2D colloidal crystal masks: A relevant method? Langmuir 2011, 27, 12800–12806. [Google Scholar] [CrossRef] [PubMed]
  23. Cagnani, G.R.; Spada, E.R.; Cagnani, L.D.; Torres, B.B.M.; Balogh, D.T.; Bardosova, M.; Faria, R.M. Large-area flexible 2D-colloidal crystals produced directly using roll-to-roll processing. Colloids Surf. A Physicochem. Eng. Asp. 2020, 588, 124389. [Google Scholar] [CrossRef]
  24. Reinhardt, K.; Kern, W. Handbook of Silicon Wafer Cleaning Technology, 2nd ed.; William Andrew: Norwich, CT, USA, 2008. [Google Scholar]
  25. Image Processing Analysis in Java. Available online: http://rsbweb.nih.gov/ij (accessed on 15 September 2020).
Figure 1. Typical image of the edge of the samples, where vacancy of the silica spheres in the square part, multilayer in the circle zone and monolayer in the other area can be easily distinguished.
Coatings 11 00082 g001
Figure 2. (a): The effect of the first rotation speed on the HCP percentage of the obtained monolayer (a1a6); (b): the impact of the first spinning time on the obtained HCP percentage (b1b6); (c): the influence of the suspension concentration on the final HCP percentage value (c1c4); (a7,a8): plots with narrow HCP percentage range to illustrate the impact of the first rotation speed more clearly.
Coatings 11 00082 g002aCoatings 11 00082 g002b
Figure 3. Optical microscope images of various morphologies obtained using different parameters: (a) structures with lots of defects (e.g., the area where the red arrows point at), c = 25 wt.% and ta = 10 s; (b) the existence of multilayers (the zone indicated by the red square), c = 35 wt.% and va = 500 rpm; (c) large area of perfect HCP structures, c = 30 wt.%.
Coatings 11 00082 g003
Figure 4. Typical optical microscope images with magnifications 50× (a) and 500× (b) (where the largest defect-free domain is circled by red lines) as well as scanning electron microscope (SEM) images with magnifications 2000× (c) (where missing particles are indicated by a circle, small area of squared ordered spheres is indicated by an arrow, and defect generated by silica spheres with smaller diameter is indicated by a square) and 5000× (d) of obtained monolayers with a HCP percentage over 65%.
Coatings 11 00082 g004
Table 1. Optimization factorial design including details of each parameter and the obtained hexagonal-close-packed (HCP) percentage values.
Exp. No.Experimental FactorsHCP Percentage (%)
va (rpm)ta (s)c (wt.%)
1500102558.07
2500103066.99
3500103543.60
4500202570.91
5500203071.90
6500203551.47
71000102559.45
81000103067.70
91000103572.12
101000202570.76
111000203084.12
121000203567.19
c: solution concentration.
Publisher’s Note: MDPI stays neutral with regard to jurisdictional claims in published maps and institutional affiliations.

