Interactions of Coating and Wood Flooring Surface System Properties


Department of Wood Science and Technology, Biotechnical Faculty, University of Ljubljana, Jamnikarjeva ulica 101, 1000 Ljubljana, Slovenia
*
Author to whom correspondence should be addressed.
Coatings 2021, 11(1), 91; https://0-doi-org.brum.beds.ac.uk/10.3390/coatings11010091
Submission received: 22 December 2020
/
Revised: 8 January 2021
/
Accepted: 12 January 2021
/
Published: 15 January 2021
(This article belongs to the Special Issue Surface Properties and Surface Treatments of Wood and Wood-Based Composites)
Abstract
:Parquet flooring is one of the most common types of flooring, the surface of which can be covered with various coatings. To avoid possible damage to the parquet during use, it is necessary to test the surfaces before installation according to various non-standard and standard protocols. The present study provides an overview of the interactions between the properties of selected waterborne coatings (solids content, hardness, resistance to cracking, tensile strength) and the properties of oak wood flooring surfaces (dry film thickness, coating adhesion, resistance to scratching, impact, abrasion and cold liquids). The tests conducted showed that the performance of the surface systems was highly dependent on the coating formulations, as they were either one- or two-component systems. Although no major differences in surface resistance to cold liquids were found, there was a correlation between coating thickness, hardness and tensile strength. The harder coatings had higher tensile strengths and lower elongations. The coatings with higher tensile strength and better hardness achieved better adhesion properties. The coatings that exhibited ductile behavior showed the worst scratch resistance. A statistically significant relationship was found between the higher resistance of the flooring systems to impact stress and the improved abrasion resistance. The obtained results provide potential end users of surface coatings with valuable information on the quality that can be expected in wood flooring.
Keywords:
coating; wood; flooring; abrasion; scratching; adhesion; cold liquids; hardness; impact; cracking1. Introduction
Wood parquets of different types, structure and appearance are among the most common flooring elements in residential buildings, municipal buildings, public buildings and sports halls. Frequent exposure of floor surfaces to various influences (exposure to various liquids, detergents and other various staining or aggressive agents, scratching of the film or even greater loads leading to deeper plastic deformations, various impacts, abrasion of the coating film due to higher exposure of a particular place, etc.) in our daily life makes the flooring one of the most exposed elements in the interior. In order to maintain the functionality and appearance of wooden floorings, different types of surface finishes based on natural substances (oils and waxes) have been used throughout history [1]. The development of synthetic polymers based on phenolic, alkyd, epoxy or polyurethane resins in the last century has promoted the use of different film-forming coatings (lacquers or varnishes), mainly because of their better durability compared to natural-based finishes such as oils and waxes [2].
Nowadays, the parquet in the form of engineered wood is one of the most common type of flooring. Engineered wood flooring (EWF) consists of the so-called core layer, which is usually made of softwood species or low-density hardwood species, and the top layer. The wood species used for the top layer must meet various technical criteria, such as esthetics, sustainable harvesting, mechanical properties of the species and/or availability [3]. In recent years, oak (Quercus petraea (Matt.) Liebl. and Quercus robur L.) is the most popular wood species used for the top layer in European parquet manufacturing [4,5]. Both layers together influence the performance of EWF. However, besides the influence of the physical composition (panel dimensions, the number of layers, their orientation and thickness, wood species used) on the mechanical properties of EWF, the layer of the coating system also has a great influence on the distortion reduction in EWF parquet, as well as on the other crucial properties of the parquet flooring, such as thickness and width swelling, water absorption, dimensional changes, sound absorption, surface durability and color changes [5,6,7]. Nevertheless, the finishing of a wood floor is perhaps one of the most critical but rewarding steps [8]. Surface finishes are applied to wood for two main reasons: to protect the wood surface during the use of a product and to achieve a specific visual appearance, including color and gloss [9]. The overall performance of the surface system depends on the quality and preparation of the wood substrate, the type of coating material, and good compatibility between the substrate and the coating [10,11,12,13,14]. However, the final quality of wood flooring surfaces is closely related to the finishing process, including the application of the coating and the curing process [15]. Only when all three criteria are met, the surface system helps the flooring to withstand the various influences and damages [16,17]. These properties, which are of paramount importance for interior wood flooring, include, for example, deformability, resistance to impact, various liquids, friction, scratching and abrasion [18,19], all of which can be determined according to various international standards [20].
The properties of coating materials of any kind depend, among other things, particularly on the chemical composition and thickness of the coating film. The type of binder, solvent, and other substances such as pigments and fillers included in the coating formulation determine both the mechanical and physical properties of the coating and its interactions with a particular type of wood substrate [13,21]. Some of the most popular surface coatings for wood floors are acrylates and polyurethanes. Nowadays, many different coating manufacturers offer a variety of acrylate resins- and polyurethane resin-based waterborne coatings for different applications in the market. Generally, these coatings have a lower volatile organic compound content, while their films have excellent properties such as adhesion to substrates, flexibility, durability, compressive and tensile strength, scratch and abrasion resistance, and stability during weathering [22]. In recent years, various nanomaterials have been widely used to improve the properties of waterborne polyurethane coating formulations because they have a large effect despite their small size [23]. The nanoadditives in wood flooring coatings improve their resistance properties [24,25], but they can also strongly influence other physical and mechanical properties of free films [26,27].
All these presented facts lead to the general conclusion and hypothesis that the properties of coated EWF parquet strongly depend on the interactions in the so-called surface system formed by the chosen coating system and the wood substrate. The motivation for the present study was to investigate the properties of selected EWFs coated with different commercial coating systems. These coating systems differed in terms of coating formulation (i.e., binder types) and in the number of coatings layers applied. The performance of the created surface systems of the parquet was evaluated using various non-standard methods and methods, described in international standards. The investigation of the interactions between the properties of the coatings and wood flooring surface systems was additionally supported by statistical analyses.
2. Materials and Methods
2.1. Preparation of Wood Floring Surface Systems
As a substrate 3-layer Engineered Wood Flooring with a 3 mm thick top layer of European oak (Quercus sp.). The middle (profiling) and bottom layers were made of spruce (Picea abies (L.) Karst.). Five boards measuring 180 mm × 2200 mm × 12 mm (w × l × t), with an oak top layer without visual defects and similar texture appearance were taken from the stock. After conditioning for three weeks at (23 ± 2) °C and a RH of (50 ± 5) %, all top surfaces of the boards were sanded with sandpaper (120 g). After sanding, each board was sawn into six pieces with a length of (360 ± 5) mm. In this way, five sets of six consecutive samples were prepared, one for each finish.
Six commercial waterborne coating systems were selected for the finish (Table 1): two one-component, acrylate-polyurethane-based systems (System 1: 1C-1 and System 2: 1C-2) and four two-component, polyurethane-based systems (System 3: 2C-1, System 4: 2C-1+, System 5: 2C-2, and System 6: 2C-3). Systems 3 and 4 were from the same manufacturer. The difference was in the number of final coatings, System 4 had one more. System 6 was the only system that used a polyurethane-based primer. The coating systems were formed according to the instructions of the coating manufacturers (primer with an application rate of 120 g/m2, the first layers of topcoat with an application rate of 120 g/m2 and all others with an application rate of 100 g/m2). The intermediate drying time between each coating was 24 h. All coatings were applied with a hand roller. After the application of the first layer of the topcoat, all surfaces were sanded again with sandpaper (150 g). For reasons of trademark protection, the trade names of the systems are not mentioned.
All properties of finished floorings were determined after drying and conditioning at (23 ± 2) °C and a RH of (50 ± 5) % for 21 days after application of the last coat.
The coating properties (solids content, hardness, resistance to cracking, tensile strength and attenuated total reflection Fourier transform infrared (ATR-FTIR) spectroscopy) were determined only for the top coats used, which accounted for the majority of the dry film thickness in the present study of wood flooring surface systems.
2.2. Determination of Solids Content
The solids content was determined following EN ISO 3251:2019 [28]. A total of (1 ± 0.1 g) of the coating was applied in a specified Petri dish and dried at a temperature of 125 °C for 60 min. The solids content was calculated from the initial coating mass and the mass after drying (SC in %). The result represents an average value from three measurements.
2.3. Determination of Coating Hardness
The pendulum-damped method using the König pendulum tester (EN ISO 1522:2007 [29], Pendulum Damping Tester Model 299/300, ERICHSEN GmbH & Co. KG, Hemer, Germany) was used to determine coating hardness. The coatings were applied to a glass plate using a manual quadruple film applicator at an application gap height of 360 µm and a speed of (3 ± 0.5) cm/s. After drying and conditioning at (23 ± 2) °C and a relative air humidity (RH) of (50 ± 5) % for 21 days, the coating hardness was measured (three samples per coating, five measurements per sample). The hardness value corresponded to the damping time of the pendulum swinging on the coating surface from 6° to 3°, with respect to the normal axis, measured with an electronic counter. The longer the damping time, the harder the coating.
2.4. Determination of Coating Resistance to Cracking
The resistance of the coating to cracking was determined using a bending test (EN ISO 1519:2012 [30]). The coatings were applied to a glossy photographic paper (grammage 200 g/m2) using a manual quadruple film applicator (application gap height 360 µm, speed (3 ± 0.5) cm/s, Model 360, ERICHSEN GmbH & Co. KG, Hemer, Germany ). After drying and conditioning at (23 ± 2) °C and an RH of (50 ± 5) % for 21 days, three coated paper strips of 30 mm width were prepared for each coating. These paper strips were then clamped in the mandrel tester (Erichsen 266, Erichsen GmbH, Hemer, Germany) with the coated side facing away from the mandrel. The bending process was performed over a period of from 1 to 2 s, bending the coated paper strip for 180°. By changing the mandrel with a smaller diameter, the process was repeated on a new part of the strip. The result was the average maximum diameter at which the coating cracked.
2.5. Tensile Strength Test
Prepared free dry coating films, as described in Section 2.4., were cut into tensile strength specimens of size 100 mm × 20 mm (eight replicates per coating type). The length of the specimens was parallel to the direction in which the coating films were applied. The film thickness and width were then measured and the specimens were then mounted in gauges of the Zwick Z005 universal testing machine (Zwick/Roell, Ulm, Germany), separated by 50 mm. The tensile strength and elongation of the coating free films were measured at the actuator speed of 25 mm/min. From the detected strength–elongation curves, the mean values were reported.
2.6. Attenuated Total Reflection Fourier Transform Infrared (ATR-FTIR) Spectroscopy
The ATR-FTIR spectrometer Perkin Elmer Spectrum Two (PerkinElmer Inc., Waltham, MA, USA), with an LiTaO3 detector type, was used to determine the chemical bonds in the used top coatings. Spectra were recorded at three spots (16 scans per spot) of the surface of each coated flooring type, in a wavelength range from 600 to 4000 cm−1 at a resolution of 0.5 cm−1. Relevant absorption bands were then interpreted using the corresponding software (Spectrum V.10.5.3, PerkinElmer Inc.).
2.7. Determination of the Dry Film Thickness
Dry film thicknesses were measured using the microscopic method according to EN ISO 2808:2007 [31]. Cross-sections of the finished floorings were made and viewed under the Olympus SZH stereo microscope (Olympus, Tokyo, Japan) at 120× magnification. The result was the representative (average) value of the dry film thickness measured at 10 points.
2.8. Determination of the Coating Adhesion
Coating adhesion was determined using a pull-off test described in EN ISO 4624:2016 [32]. Ten dollies were bonded to each coated surface using an epoxy adhesive (UHU plus endfest 300, UHU, Bühl, Germany). After 24 h, the cured epoxy adhesive and coating were cut to the substrate around the perimeter of each dolly and the testing was performed using a PosiTest AT adhesion tester (DeFelsco Corporation, Ogdensburg, NY, USA). A tensile stress was applied at an increasing rate of no more then 1 MPa/s until the dolly was pulled off. The breaking strength (in MPa) and the visually perceptible nature of the fracture were recorded.
2.9. Assessment of the Surface Resistance to Scratching
The scratch resistance of the surfaces was evaluated following to the standard EN 15186:2012 [33] using a circular method. The sample was clamped in the fixture and a diamond tip (radius of 90 μm) was applied to the specimen surface with a fixed force. During the single rotation of the sample, the tip caused a scratch on the sample surface. As a result, the minimum force (average of three measurements) that caused a visible scratch or mark on the sample surface in at least six of the eight observed areas in the enclosed template was recorded.
In addition, by applying a force of 1 N at the tip a circular mark with diameter of 50 mm) was induced on the sample surface of each surface system. Analysis of the deformation response with morphological examinations of the residual patterns was performed using the LEXT OLS5000 confocal laser scanning microscope (CLSM) (Olympus, Tokyo, Japan). Four different spots of 640 µm2 were selected on each sample, where 5-line cross-sectional profiles perpendicular to the scratch were obtained. The measured average surface area of the scratch and the average depth of the scratch allowed the calculation of the volume of the scratch mark caused, as follows
where V is the volume of the scratch (µm3), A is the measured surface area of the scratch (µm2), l is the length of the analyzed scratch (640 µm), and d is the average depth of the scratch (µm).
2.10. Assessment of Surface Resistance to Impact
A modified approach from the standard ISO 4211-4:1988 [34] was used to assess the impact resistance. A cylindrical steel weight with a mass of 500 g was dropped from a given height through a vertically mounted guide onto a 14 mm diameter steel ball positioned on the test surface. Six impacts were made on each flooring surface from each of the following drop heights: 10, 25, 50, and 100 mm. After the impacts, the surfaces were carefully examined with a magnifying glass (10× magnification) under direct light. For easier identification of surface cracks, we stained the impact sites with a whiteboard marker and wiped them off after a few seconds. The impact marks were then evaluated according to the descriptive numerical evaluation code from 5 to 1. If there were no changes after the impact, the assigned rating was 5. If there were no cracks in the coating film but the impact mark was visible, rating was 4. The rating of 3 showed cracks in the coating film. If more cracks were present, the rating was lower. As a result, the minimum height at which the coating film cracked was recorded (rating 3).
2.11. Assessment of the Surface Resistance to Abrasion
The abrasion resistance was determined according to the standard method EN 15185:2012 [35]. From the coated EWF boards, three samples of 100 mm × 100 mm were sawn, diagonally divided into four quadrants and individually placed in the Taber® rotary platform abrasion tester (Taber Industries, North Tonawanda, NY, USA). A rubber wheel with Taber® S-42 abrasive paper was placed on the surface of the sample. The load on each wheel was 500 g and the specimen started to rotate. The freely rotating grinding wheels caused a mark in the form of a circle on the surface of sample. As a result, the number of revolutions (average of the three measurements) required to abrade the coating film onto the substrate in all four quadrants was determined, which is called the Initial Point of wear (IP).
2.12. Assessment of Surface Resistance to Cold Liquids
The resistance of the surface to cold liquids was determined according to the method EN 12720:2009+A1:2014 [36]. Soft filter paper disks with a diameter of 25 mm (grammage 450 g/m2) were immersed for 30 s in the selected liquids (CEN/TS 16209:2012 [37]): acetic acid (10%), acetone, ammonia (10%), citric acid (10%), cleaning agent, coffee, ethanol (48%), mustard, oil (paraffin), red wine (Merlot, 13%), water and sweat (alkaline solution). After the immersion time, each soaked disk was placed on the surface of the sample. The disk was immediately covered with a Petri dish with a straight glass rim (40 mm diameter, 25 mm high). The surfaces were than subjected to the liquids for a period of 10 s, 2 min, 10 min, 1 h, 6 h, 16 h, and 24 h, respectively. After the exposure period, the Petri dishes and paper disks were removed and the remainder of the liquids was carefully wiped off with a soft paper towel. After from 16 to 24 h, the test surfaces were cleaned, examined for damage and rated according to a numerical evaluation code from 5 to 1 (5—no change, 4—minor change, visible only when the light source was reflected, and so on to 1—severe change). The evaluation was performed in the laboratory light environment and in a standardized viewing cabinet. As a result, the minimum exposure time was recorded for each liquid, at which point the exposed surface was given a grade 4 or 5.
2.13. Statistical Analysis
The correlation between the properties was determined by calculating the Pearson correlation coefficient rxy, which is the magnitude of the linear relationship between the variables x and y, measured on the same test item. It is defined as the sum of all the products of the standard deviations of both values with respect to the degrees of freedom or as the ratio between the covariance and the product of both standard deviations. In this way, the computer software STATGRAPHICS Plus for Windows 4.0 (Statgraphics Technologies, Inc., The Plains, VA, USA) was used. To find correlations between several properties, a correlation matrix was created in which the relationship between two properties is indicated by three values: the Pearson correlation coefficient, the number of values examined, and the p-value. In order to be sure that there is a statistically significant correlation at a 95% confidence level, the p-value must be less than 0.05. The values of the correlation coefficients range from −1 to +1. The higher the absolute value of the correlation coefficient, the greater the linear relationship between the two properties under study. If the value of the correlation coefficient is 0, it means that there is no relationship between the properties.
3. Results and Discussion
3.1. ATR-FTIR Spectra
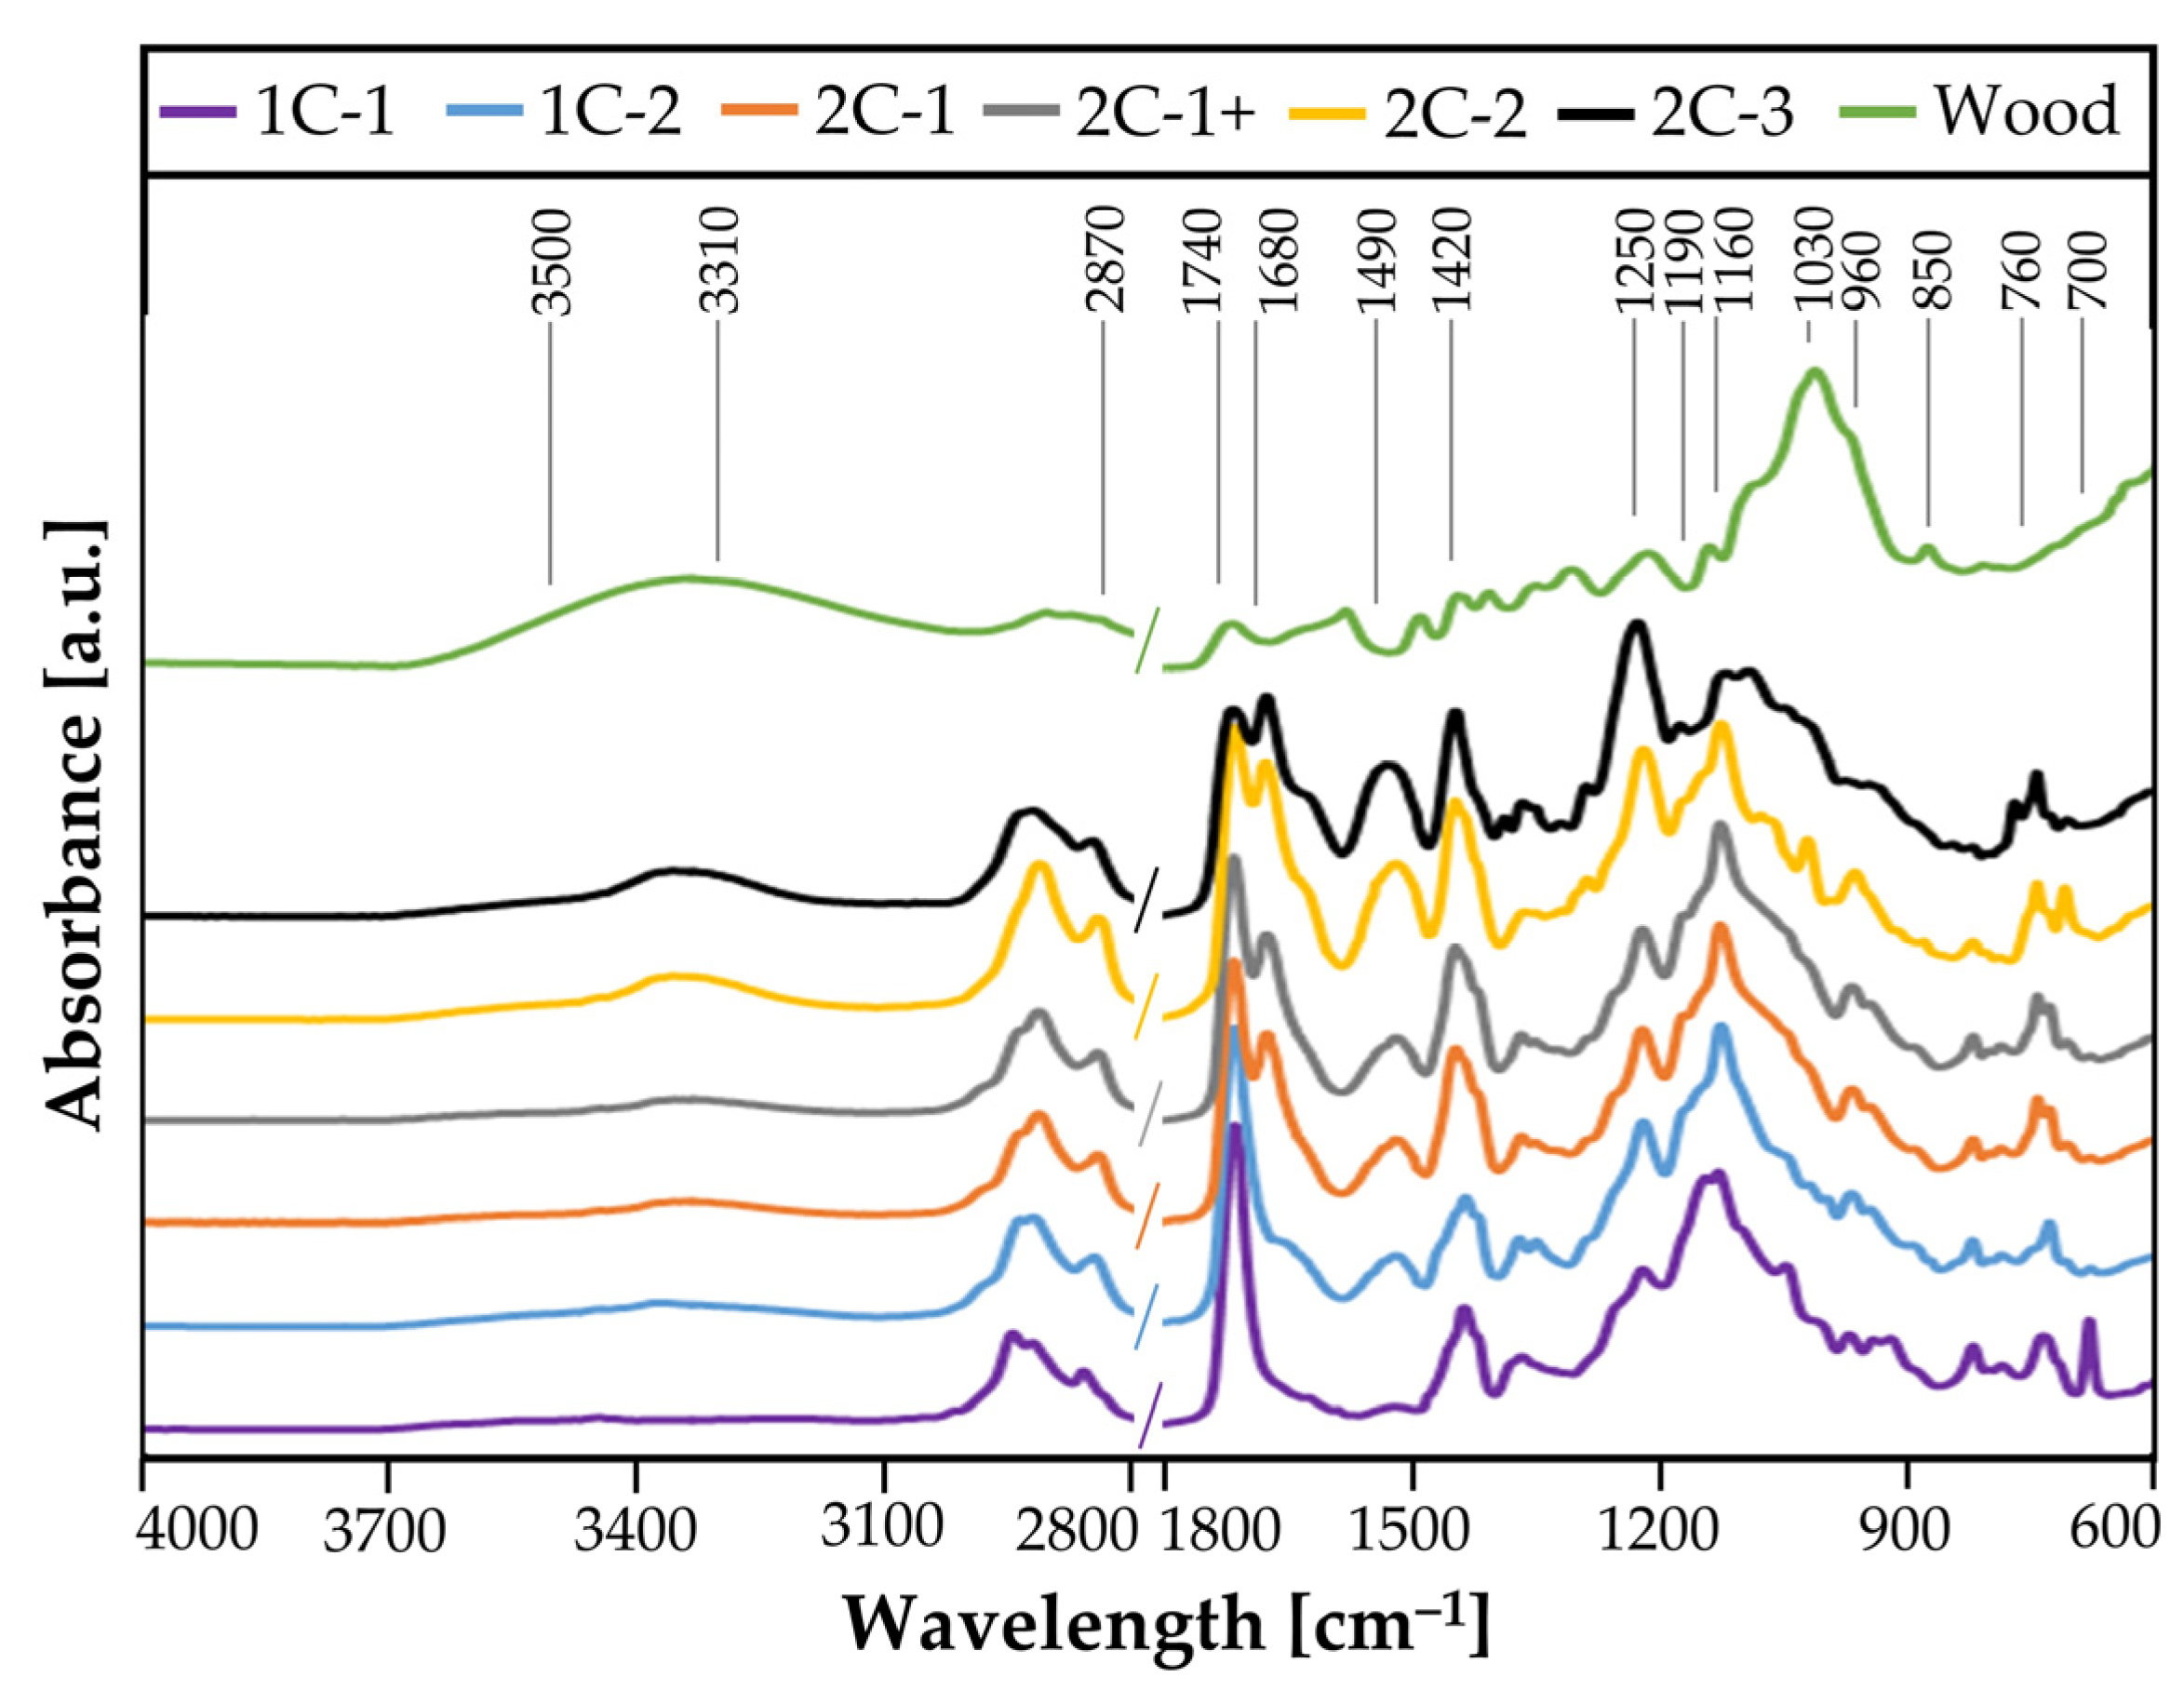
The characteristic peaks in the recorded ATR-FTIR spectra (Figure 1) are associated with the chemical properties of the applied topcoat on the particular surface system [38]. Polyurethane typically consists of isocyanate-capped macromolecular chains containing urethane groups in their backbones, usually with a 1–15 wt.% free isocyanate concentration [39]. All the analyzed coatings exhibited some common peaks, typical of urethane-based polymers, but also some differences in the recorded spectra. Only 1C-1 showed a high peak at 700 cm−1, which is related to the C–H bending of the styrene [40]. The sharp peak at 760 cm−1 is due to the C–N bond vibration, indicating the presence of urethane bonds. The peaks at 960 and 1160 cm−1 are attributed to the C–N–C stretch vibration in the isocyanurate ring [22]. The stretching vibration at 1190 cm−1 for C–O shows the reaction of hydroxyl (OH) groups present in wood and atmospheric humidity with the coating by hydrogen bonds or by ester formation [15]. The peaks at 1250, 1420 and 1490 cm−1 indicate the stretching of C–O–C, C–H and C–O, and –NH2 vibrations in C–NH and (CO)–NH urethane groups in the polymer chains [26,41,42]. The lower intensity of the band at 1420 cm−1 of 1C-1 and 1C-2 indicates the polymerization of acrylate double bonds (CH2=CH twisting vibration) [41]. The band at 1680 cm−1 shows the C=O stretching vibrations in unsaturated acids [22] and NH–(C=O)–NH of polyurea. This band was not detected in the spectra of 1C-1 and 1C-2. The sharp stretching region around 1740 cm−1 signalizes the free C=O stretching vibration of urethane [41,42] and shows the presence of an acrylate group in all types of coatings [22]. The same peak also clearly indicates the formation of urethane in cured coatings [26]. The NCO absorption band at 2275 cm−1 is not seen, indicating that the –NCO group has reacted completely with OH of water solvent [26,41,42]. The band at 2870 cm−1 is attributed to C–H2 stretching [41,42]. All spectra show C=C–O, −NH, −OH and C=O functional groups, and a broad absorption band corresponding to the hydrogen bond between the −NH group and the C=O group can be observed at 3310–3500 cm−1 [22,26,41]. The intensity of this absorption band is particularly pronounced for 2C-2 and 2C-3.
3.2. Solids Content and Coating Hardness
The SC and coating hardness were the properties of the wet and dry topcoats that showed the least variation within the measurements (Table 2). Moreover, the difference between the coatings at SC was not so large, but it seems that two-component coatings (2C-1, 2C-2, 2C-3) tended to have higher values. On the other hand, the hardness of the two-component coatings (except) 2C-3 was significantly higher than the hardness of the one-component coatings.
3.3. Coating Resistance to Cracking and Tensile Strength
After performing the bending test on coated paper strips, we found that all the top coatings tested were highly resistant to cracking, as no cracks were found even at the smallest diameter (2 mm). This means that the coatings still showed elastic behavior 21 days after application and no difference could be found between them using this method. The situation was quite different when the tensile properties were determined in the tensile strength test (Table 3).
The relation between standard force and elongation defines the ductile or brittle behavior of the coating films. The coating type 2C-1 exhibited the highest tensile strength (30.0 ± 6.6 MPa), but the same coating showed the lowest elongation (5.2 ± 1.3 mm), which together indicate the brittleness of the coating. The reason for this behavior could be the presence of strong C=O bonds in two-component coatings. On the other hand, the largest elongation (58.6 ± 16.2 mm) was observed for coating type 1C-1, but the maximum tensile strength was the lowest (12.4 ± 1.7 MPa), which emphasizes the ductility of the material.
3.4. Dry Film Thickness and Coating Adhesion
Table 4 shows the determined dry film thicknesses and measured coating films’ adhesion strengths. The film thickness is mainly related to the amount of coating applied, SC in the coating and the porosity of the substrates [44]. On the other hand, the amount of coating applied can significantly affect the adhesion of coating films and the hardness of surface systems [15]. Indeed, the thinnest films were found on samples coated with one-component coatings, while the thickest films were found on samples coated with two-component coatings. The variability in film thickness is mostly related to the porosity of the wood.
In all cases of adhesion measurements, an adhesive type of failure was found, signaling that the adhesion strength of the coating film to the wood was higher than the cohesion strength of the wood substrate. The highest adhesion was found for 2C-1 and 2C-1+ surface systems, which reached values of about 4.5 MPa. In addition to the systems coated with one-component acrylate-polyurethane-based systems, which had adhesion strengths of 3.51 MPa (1C-1) and 3.80 MPa (1C-2), systems 2C-2 (3.24 MPa) and 2C-3 (3.80 MPa) also achieved strength values below 4 MPa, despite the two-component formulation. In general, the adhesion of the coating system to wood substrates is mainly conditioned by the adhesion between the primer and the substrate. Therefore, the determined adhesion strengths could not only be correlated with the chemical properties of the topcoats determined by ATR-FTIR spectroscopy, but these correlations seemed to be more complex and were probably related to the chemical properties of the whole coating system.
3.5. Surface Resistance to Scratching
The resistance of the surface systems to scratching was evaluated by the minimum force that caused a visible scratch (standard method) and by measuring the volume of the scratch mark caused by the applied force on the diamond tip of 1 N (non-standard method). The results of the first method were obtained visually, while the results of the other method were gained volumetrically (Table 5). According to the first method, there were no major differences in scratch resistance between the surface systems. In contrast, the volumes of scratches caused by the same force on the tip (1 N) differed more significantly. By far the largest scratch volume was measured on surface system 1C-1, followed by the scratch volume on 2C-3, which was 73% smaller than on 1C-1. Correlating this result with the chemical composition results, the reason for the significantly larger scratch volume on surface system 1C-1 is the absence of NH2 and C=O groups in the polymer chains. The smallest scratch volume was measured on the 2C-1+ surface system, which is probably the consequence of the additional application of the topcoat. Considering the variability of the measured scratch volumes, the volumes of the scratches measured on all other surface systems were quite similar.
3.6. Surface Resistance to Impact and Abrasion
Surface system 1C-1 had both the worst impact resistance and the worst abrasion resistance. Here, the lowest height at which the coating film cracked was determined to be only 10 mm, while the IP was reached after 110 revolutions (Table 6). Surface systems coated with a two-component coating system exhibited better impact resistance and better resistance to abrasion. The samples coated with 2C-3 showed the best impact and abrasion resistance (drop height of 200 mm, IP reached after 263 revolutions). It is worth showing the comparison of the abrasion resistance of the 2C-1 and 2C-1+ systems, where the additional topcoat on 2C-1+ contributed to the 28% higher number of revolutions required to reach the IP. The better impact and abrasion resistance of the two-component coating systems was associated with the presence of C–O–C, C=O and C–NH bonds in the coating polymers.
3.7. Surface Resistance to Cold Liquids
Table 7 expresses the surface resistance to cold liquids and indicates the exposure time at which grade 4 or 5 was reached. In addition, the cells that have a grade worse than the maximum among all the surfaces tested are shaded in gray. From this, it can be seen that there is not much difference in surface resistance between one- and two-component surface systems. Among the one-component systems system 1C-1 (3 gray shaded cells) can be considered slightly less resistant to cold liquids. Among the two-component systems, system 2C-2 (also 3 gray shaded cells) was found to be slightly less resistant to cold liquids. Systems 2C-1 and 2C-1+ have the same classification, as expected, since the surface resistance to cold liquids depends mainly on the properties of the topcoat used, which was the same for these two systems. The resistance of the surface systems to cold liquids did not seem to be related to their chemical properties.
3.8. Statistical Analysis
In order to find the correlation between the numerically evaluated properties of the coatings (SC, coating hardness, tensile strength and elongation) and the flooring surface systems (dry film thickness, coating adhesion, surface resistance to scratching—scratch force and volume at 1 N, surface resistance to impact and abrasion), a correlation matrix was constructed (Table 8), as described in Section 2.13. The correlation matrix was used as the basis for analyzing the data from Table 2, Table 3, Table 4, Table 5 and Table 6. This matrix shows the interconnectedness of the properties under consideration. The cross boxes of statistically significantly related variables (p-value less than 0.05) are shaded in green. It must be emphasized again that, in this analysis, only a linear relationship was found between the properties, based on the studied values of the results of coatings and flooring surface systems together.
The correlation matrix (Table 8) confirms some already suspected relationships. As expected, SC has no influence on the properties of the surface system; on the other hand, there is a correlation between SC and the dry film thickness. Even though the correlation is not statistically significant, it shows that a higher SC leads to a higher dry film thickness. However, as expected, the hardness of the coating, tensile strength and elongation are highly correlated. The harder the coating, the higher the tensile strengths achieved and the shorter the elongation before breaking. Of course, these three properties are also related to coating adhesion. A higher coating adhesion of flooring surface systems was achieved when coatings with higher tensile strength and hardness and lower flexibility (shorter elongation before breaking) were used. Surprisingly, a statistically significant relationship between coating hardness, tensile strength and dry film thickness can also be observed. Another expected relationship also proves to be statistically significant. The scratch volume at 1 N was higher for surface systems with more flexible (shorter elongation before breaking) coatings. The last statistically significant relationship in the matrix shows that flooring systems that are more resistant to impact stress are also more resistant to abrasion.
4. Conclusions
Studies on EWF parquet coated with different coating systems showed that the chemical formulation of the coatings and the number of layers applied have a great influence on the performance of the flooring surfaces. The ATR-FTIR spectra revealed the differences in the chemical composition of the coating systems, including the presence of certain chemical bonds and functional groups. The largest difference was found in the presence of the C=O group, which was only present in the two-component systems. The two-component coatings had a higher SC and greater hardness than one-component coatings. The tensile properties of the coating films differed between formulations; the films exhibited either brittle or ductile behavior. Three of the four two-component coating systems formed thicker films on wood than one-component systems. In addition, only two of the two-component systems achieved an adhesion strength greater than 4 MPa. By far the worst scratch, impact, and abrasion resistance was found for coating system 1C-1. Resistance to cold liquids showed no major differences between the resistance of the one- and two-component surface systems. In conclusion, the statistical analysis showed some correlations between the properties of the coating systems and the properties of the coated flooring surfaces. The presented results give a good overview of the interactions between the properties of the chosen coating type and the expected quality of wood flooring surfaces.
Author Contributions
Conceptualization, M.P. (Matjaž Pavlič) and J.Ž.; methodology, M.P. (Matjaž Pavlič) and J.Ž.; formal analysis, M.P. (Matjaž Pavlič) and J.Ž.; investigation, M.P. (Matjaž Pavlič) and J.Ž.; resources, M.P. (Matjaž Pavlič) and J.Ž.; data curation, M.P. (Matjaž Pavlič) and J.Ž.; writing—original draft preparation, M.P. (Matjaž Pavlič) and J.Ž.; writing—review and editing, M.P. (Matjaž Pavlič), J.Ž., and M.P.(Marko Petrič); visualization, M.P. (Matjaž Pavlič) and J.Ž.; supervision, M.P. (Matjaž Pavlič), J.Ž., and M.P. (Marko Petrič). All authors have read and agreed to the published version of the manuscript.
Funding
The authors acknowledge the financial support of the Slovenian Research Agency (research core funding No. P4-0015).
Data Availability Statement
Data is contained within the article or available on reasonable request.
Conflicts of Interest
The authors declare no conflict of interest.
References
- Williams, R.S. Finishing of Wood. In Wood Handbook—Wood as an Engineering Material; General technical report FPL–GTR–113; U.S. Department of Agriculture, Forest Service, Forest Products Laboratory: Madison, WI, USA, 1999; 463p. [Google Scholar] [CrossRef]
- Arminger, B.; Jaxel, J.; Bacher, M.; Gindl-Altmutter, W.; Hansmann, C. On the drying behavior of natural oils used for solid wood finishing. Prog. Org. Coat. 2020, 148, 105831. [Google Scholar] [CrossRef]
- Grubïi, V.; Johansson, J. Performance of multi-layered wood flooring elements produced with sliced and sawn lamellas. Pro Ligno 2019, 15, 166–172. [Google Scholar]
- FEP, European Federation of the Parquet Industry. The European Parquet Industries in 2008. A Challenging Year for the European Parquet Sector; European Federation of the Parquet Industry: Brussels, Belgium, 2009; pp. 1–5. [Google Scholar]
- Németh, R.; Molnárné Posch, P.; Molnár, S.; Bak, M. Performance evaluation of strip parquet flooring panels after long-term, in-service exposure. Drewno 2014, 57, 119–134. [Google Scholar] [CrossRef]
- Belleville, B.; Blanchet, P.; Cloutier, A.; Deteix, J. Wood–adhesive interface characterization and modeling in engineered wood flooring. Wood Fiber Sci. 2008, 40, 484–494. [Google Scholar]
- Blanchet, P.; Beauregard, R.; Cloutier, A.; Gendron, G.; Lefebvre, M. Evaluation of various engineered wood flooring constructions. For. Prod. J. 2003, 53, 30–37. [Google Scholar]
- Cassens, D.L.; Feist, W.C. Finishing and Maintaining Wood Floors; North Central Regional Extension Publication-Michigan State University, Cooperative Extension Service: Lansing, MI, USA, 1989. [Google Scholar]
- Jafarian, H.; Demers, C.M.H.; Blanchet, P.; Laundry, V. Effects of interior wood finishes on the lighting ambiance and materiality of architectural spaces. Indoor Built Environ. 2018, 27, 786–804. [Google Scholar] [CrossRef]
- Nemli, G.; Örs, Y.; Kalaycıoğlu, H. The choosing of suitable decorative surface coating material types for interior end use applications of particleboard. Constr. Build. Mater. 2005, 19, 307–312. [Google Scholar] [CrossRef]
- Rolleri, A.; Roffael, E. Influence of the surface roughness of particleboards and their performance towards coating. Maderas-Cienc. Tecnol. 2011, 12, 143–148. [Google Scholar] [CrossRef]
- Bardak, S.; Sarı, B.; Nemli, G.; Kırcı, H.; Baharoğlu, M. The effect of décor paper properties and adhesive type on some properties of particleboard. Int. J. Adhes. Adhes. 2011, 31, 412–415. [Google Scholar] [CrossRef]
- Keskin, H.; Tekin, A. Abrasion resistances of cellulosic, synthetic, polyurethane, waterborne and acid-hardening varnishes used woods. Constr. Build. Mater. 2011, 25, 638–643. [Google Scholar] [CrossRef]
- Veigel, S.; Grüll, G.; Pinkl, S.; Obersriebnig, M.; Müller, U.; Gindl-Altmutter, W. Improving the mechanical resistance of waterborne wood coatings by adding cellulose nanofibers. React. Funct. Polym. 2014, 85, 214–220. [Google Scholar] [CrossRef]
- Wang, J.; Wu, H.; Liu, R.; Long, L.; Xu, J.; Chen, M.; Qiu, H. Preparation of a fast water-based UV cured polyurethane-acrylate wood coating and the effect of coating amount on the surface properties of oak (Quercus alba L.). Polymers 2019, 11, 1414. [Google Scholar] [CrossRef] [Green Version]
- Scrinzi, E.; Rossi, S.; Deflorian, F.; Zanella, C. Evaluation of aesthetic durability of waterborne polyurethane coatings applied on wood for interior applications. Prog. Org. Coat. 2011, 72, 81–87. [Google Scholar] [CrossRef]
- Sell, J.; Feist, W.C. Role of density in the erosion of wood during weathering. For. Prod. J. 1986, 36, 57–60. [Google Scholar]
- Gurleyen, L.; Ayata, U.; Esteves, B.; Cakicier, N. Effects of heat treatment on the adhesion strength, pendulum hardness, surface roughness, color and glossiness of scots pine laminated parquet with two different types of UV varnish application. Maderas-Cienc Tecnol. 2017, 19, 213–224. [Google Scholar] [CrossRef] [Green Version]
- Brischke, C.; Ziegeler, N.; Bollmus, S. Abrasion resistance of thermally and chemically modified timber. Drv. Ind. 2019, 70, 71–76. [Google Scholar] [CrossRef]
- International Organization for Standardization. ISO 17959:2014 General Requirements for Solid Wood Flooring; International Organization for Standardization: Geneva, Switzerland, 2014. [Google Scholar]
- Podgorski, L.; De Meijer, M.; Lanvin, J.-D. Influence of coating formulation on its mechanical properties and cracking resistance. Coatings 2017, 7, 163. [Google Scholar] [CrossRef] [Green Version]
- Xu, J.; Jiang, Y.; Zhang, T.; Dai, Y.; Yang, D.; Qiu, F.; Yu, Z.; Yang, P. Synthesis of UV-curing waterborne polyurethane-acrylate coating and its photopolymerization kinetics using FT-IR and photo-DSC methods. Prog. Org. Coat. 2018, 122, 10–18. [Google Scholar] [CrossRef]
- Kong, L.; Xu, D.; He, Z.; Wang, F.; Gui, S.; Fan, J.; Pan, X.; Dai, X.; Dong, X.; Liu, B.; et al. Nanocellulose-Reinforced polyurethane for waterborne wood coating. Molecules 2019, 24, 3151. [Google Scholar] [CrossRef] [Green Version]
- Utgof, S.S.; Ignatovich, L.V.; Romanova, A.M. Application of nanoadditives for wear resistance improvement of parquet protective and decorative coatings. In Proceedings of BSTU, Chemistry, Organic Substances Technology and Biotechnology; BSTU: Minsk, Belarus, 2012; Volume 4, pp. 100–102. [Google Scholar]
- Sow, C.; Riedl, B.; Blanchet, P. UV-waterborne polyurethane-acrylate nanocomposite coatings containing alumina and silica nanoparticles for wood: Mechanical, optical, and thermal properties assessment. J. Coat. Technol. Res. 2011, 8, 211–221. [Google Scholar] [CrossRef]
- Landry, V.; Blanchet, P.; Riedl, B. Mechanical and optical properties of clay-based nanocomposites coatings for wood flooring. Prog. Org. Coat. 2010, 67, 381–388. [Google Scholar] [CrossRef]
- Roessler, A.; Schottenberger, H. Antistatic coatings for wood-floorings by imidazolium salt-basedionic liquids. Prog. Org. Coat. 2014, 77, 579–582. [Google Scholar] [CrossRef]
- European Committee for Standardization. EN ISO 3251:2019 Paints, Varnishes and Plastics—Determination of Non-Volatile-Matter Content (ISO 3251:2019); European Committee for Standardization: Brussels, Belgium, 2019. [Google Scholar]
- European Committee for Standardization. EN ISO 1522:2007 Paints and Varnishes—Pendulum Damping Test (ISO 1522:2007); European Committee for Standardization: Brussels, Belgium, 2007. [Google Scholar]
- European Committee for Standardization. EN ISO 1519:2012 Paints and Varnishes—Bend Test (Cylindrical Mandrel) (ISO 1519:2011); European Committee for Standardization: Brussels, Belgium, 2012. [Google Scholar]
- European Committee for Standardization. EN ISO 2808:2007 Paints and Varnishes—Determination of Film Thickness (ISO 2808:2007); European Committee for Standardization: Brussels, Belgium, 2007. [Google Scholar]
- European Committee for Standardization. EN ISO 4624:2016 Paints and Varnishes—Pull-Off Test for Adhesion (ISO 4624:2016); European Committee for Standardization: Brussels, Belgium, 2016. [Google Scholar]
- European Committee for Standardization. EN 15186:2012 Furniture—Assessment of the Surface Resistance to Scratching; European Committee for Standardization: Brussels, Belgium, 2012. [Google Scholar]
- International Organization for Standardization. ISO 4211-4:1988 Furniture—Tests for Surfaces—Part 4: Assessment of Resistance to Impact; International Organization for Standardization: Geneva, Switzerland, 1988. [Google Scholar]
- European Committee for Standardization. EN 15185:2012 Furniture—Assessment of the Surface Resistance to Abrasion; European Committee for Standardization: Brussels, Belgium, 2012. [Google Scholar]
- European Committee for Standardization. EN 12720:2009+A1:2014 Furniture—Assessment of Surface Resistance to Cold Liquids; European Committee for Standardization: Brussels, Belgium, 2014. [Google Scholar]
- European Committee for Standardization. CEN/TS 16209:2012 Furniture—Classification for Properties for Furniture Surfaces; European Committee for Standardization: Brussels, Belgium, 2012. [Google Scholar]
- Beveridge, A.; Fung, T.; Macdougall, D. Use of infrared spectroscopy for the characterization of paint fragments. In Forensic Examination of Glass and Paint: Analysis and Interpretation; Caddy, B., Ed.; CRC Press: Boca Raton, FL, USA, 2001. [Google Scholar]
- Lu, R.; Wan, Y.-Y.; Honda, T.; Ishimura, T.; Kamiya, Y.; Miyakoshi, T. Design and characterization of modified urethane lacquer coating. Prog. Org. Coat. 2006, 57, 215–222. [Google Scholar] [CrossRef]
- Defeyt, C.; Langenbacher, J.; Rivenc, R. Polyurethane coatings used in twentieth century outdoor painted sculptures. Part I: Comparative study of various systems by means of ATR-FTIR spectroscopy. Herit. Sci. 2017, 5, 11. [Google Scholar] [CrossRef] [Green Version]
- Masson, F.; Decker, C.; Jaworek, T.; Schwalm, R. UV-radiation curing of waterbased urethane–acrylate coatings. Prog. Org. Coat. 2000, 39, 115–126. [Google Scholar] [CrossRef]
- Huang, S.; Xiao, J.; Zhu, Y.; Qu, J. Synthesis and properties of spray-applied high solid content two component polyurethane coatings based on polycaprolactone polyols. Prog. Org. Coat. 2017, 106, 60–68. [Google Scholar] [CrossRef]
- Kaboorani, A.; Auclair, N.; Riedl, B.; Landry, V. Mechanical properties of UV-cured cellulose nanocrystal (CNC) nanocomposite coating for wood furniture. Prog. Org. Coat. 2017, 104, 91–96. [Google Scholar] [CrossRef]
- Bessières, J.; Maurin, V.; George, B.; Molina, S.; Masson, E.; Merlin, A. Wood-coating layer studies by X-ray imaging. Wood Sci. Technol. 2013, 47, 853–867. [Google Scholar] [CrossRef]
Figure 1.
ATR-FTIR spectra in the wavelength regions from 4000 to 2800 cm−1 and from 1800 to 600 cm−1.
Figure 1.
ATR-FTIR spectra in the wavelength regions from 4000 to 2800 cm−1 and from 1800 to 600 cm−1.


Table 1.
Structure of the used waterborne coating systems.
| System Label | Used Coatings |
|---|---|
| 1C-1 | One-component acrylate-based primer First coat of a one-component acrylate-polyurethane-based finish Second coat of a one-component acrylate-polyurethane-based finish |
| 1C-2 | One-component acrylate-based primer First coat of a one-component acrylate-polyurethane-based finish Second coat of a one-component acrylate-polyurethane-based finish |
| 2C-1 | One-component acrylate-based primer First coat of a two-component polyurethane-based finish Second coat of a two-component polyurethane-based finish |
| 2C-1+ | One-component acrylate-based primer First coat of a two-component polyurethane-based finish Second coat of a two-component polyurethane-based finish Third coat of a two-component polyurethane-based finish |
| 2C-2 | One-component acrylate-based primer First coat of a two-component polyurethane-based finish Second coat of a two-component polyurethane-based finish |
| 2C-3 | One-component polyurethane-based primer First coat of a two-component polyurethane-based finish Second coat of a two-component polyurethane-based finish |
Table 2.
Solids content (SC) content and coating hardness.
| Property | Coating (Average Values and STD) | ||||
|---|---|---|---|---|---|
| 1C-1 | 1C-2 | 2C-1 | 2C-2 | 2C-3 | |
| SC (%) | 30.2 ± 0.6 | 30.2 ± 1.6 | 35.1 ± 0.8 | 38.2 ± 0.4 | 31.6 ± 0.6 |
| Hardness (s) | 43.0 ± 0.6 | 53.0 ± 1.0 | 80.0 ± 1.2 | 58.6 ± 0.1 | 47.1 ± 1.8 |
Table 3.
Tensile strength and elongation of coating films.
| Maximum Value | Coating (Average Values and STD) | ||||
|---|---|---|---|---|---|
| 1C-1 | 1C-2 | 2C-1 | 2C-2 | 2C-3 | |
| Tensile strength (MPa) | 12.4 ± 1.7 | 14.3 ± 2.0 | 30.0 ± 6.6 | 20.0 ± 3.7 | 17.0 ± 2.7 |
| Elongation (mm) | 58.6 ± 16.2 | 20.4 ± 7.3 | 5.2 ± 1.3 | 38.6 ± 15.8 | 32.3 ± 13.8 |
Table 4.
Dry film thickness and coating adhesion.
| Property | Flooring Surface System (Average Values and STD) | |||||
|---|---|---|---|---|---|---|
| 1C-1 | 1C-2 | 2C-1 | 2C-1+ | 2C-2 | 2C-3 | |
| Dry film thick. (µm) | 79 ± 1.9 | 80 ± 1.8 | 108 ± 2.1 | 131 ± 2.9 | 110 ± 2.2 | 82 ± 1.9 |
| Adhesion (MPa) | 3.51 ± 0.40 | 3.80 ± 0.26 | 4.53 ± 0.37 | 4.51 ± 0.81 | 3.24 ± 0.51 | 3.80 ± 0.53 |
Table 5.
Surface resistance to scratching.
| Scratching | Flooring Surface System | |||||
|---|---|---|---|---|---|---|
| 1C-1 | 1C-2 | 2C-1 | 2C-1+ | 2C-2 | 2C-3 | |
| Scratch force (N) | 0.6 | 0.8 | 0.7 | 0.7 | 0.7 | 0.6 |
| Scratch volume at 1 N (µm3) | 253,000 ± 53,120 | 39,000 ± 11,456 | 34,000 ± 9625 | 22,000 ± 5148 | 41,000 ± 15,742 | 68,000 ± 12,756 |
Table 6.
Surface resistance to impact and abrasion.
| Resistance Property | Flooring Surface System | |||||
|---|---|---|---|---|---|---|
| 1C-1 | 1C-2 | 2C-1 | 2C-1+ | 2C-2 | 2C-3 | |
| Impact (height in mm) | 10 | 50 | 50 | 100 | 100 | 200 |
| Abrasion (IP revolution) | 110 | 117 | 177 | 227 | 170 | 263 |
Table 7.
Surface resistance to cold liquids.
| Liquid | Resistance to Cold Liquids (Exposure Time at Which Grade 4 or 5 was Achieved) | |||||
|---|---|---|---|---|---|---|
| 1C-1 | 1C-2 | 2C-1 | 2C-1+ | 2C-2 | 2C-3 | |
| Acetic acid (10%) * | 1 h | 1 h | 1 h | 1 h | 1 h | 1 h |
| Acetone | 10 s | 10 min | 10 min | 10 min | 10 min | 10 s |
| Ammonia (10%) * | 2 min | 2 min | 2 min | 2 min | 2 min | 2 min |
| Citric acid (10%) * | 16 h | 16 h | 16 h | 16 h | 16 h | 16 h |
| Cleansing agent | 16 h | 16 h | 16 h | 16 h | 16 h | 16 h |
| Coffee | 1 h | 1 h | 6 h | 6 h | 1 h | 6 h |
| Ethanol (48%) * | 6 h | 6 h | 1 h | 1 h | 6 h | 1 h |
| Mustard | 16 h | 16 h | 16 h | 16 h | 6 h | 16 h |
| Paraffin oil | 24 h | 24 h | 24 h | 24 h | 24 h | 24 h |
| Red wine (merlot, 13%) | 10 min | 10 min | 10 min | 10 min | 10 min | 16 h |
| Water | 24 h | 24 h | 24 h | 24 h | 24 h | 24 h |
| Perspiration, basic | 1 h | 1 h | 1 h | 1 h | 1 h | 1 h |
* (m/m) aqueous solution.
Table 8.
Correlation matrix of coatings and flooring surface systems properties.
| Properties | SC | Hardness | Tensile Strength | Elong. | Dry Film Thick | Adhesion | Scratch Force | Scratch Volume | Impact | Abrasion |
|---|---|---|---|---|---|---|---|---|---|---|
| SC | – | 0.6158 * (6) ** 0.1931 *** | 0.6561 (6) 0.1570 | −0.3209 (6) 0.5351 | 0.8041 (6) 0.0538 | 0.0809 (6) 0.8789 | 0.1475 (6) 0.7803 | −0.5366 (6) 0.2724 | 0.1712 (6) 0.7457 | 0.3113 (6) 0.5482 |
| Hardness | 0.6158 (6) 0.1931 | – | 0.9743 (6) 0.0010 | −0.8627 (6) 0.0270 | 0.8694 (6) 0.0245 | 0.8101 (6) 0.0507 | 0.3811 (6) 0.4560 | −0.6358 (6) 0.1748 | −0.0721 (6) 0.8920 | 0.3006 (6) 0.5627 |
| Tensile strength | 0.6561 (6) 0.1570 | 0.9743 (6) 0.0010 | – | −0.8168 (6) 0.0473 | 0.8809 (6) 0.0204 | 0.8032 (6) 0.0543 | 0.1902 (6) 0.7182 | −0.6111 (6) 0.1974 | 0.0883 (6) 0.8678 | 0.4719 (6) 0.3447 |
| Elong. | −0.3209 (6) 0.5351 | −0.8627 (6) 0.0270 | −0.8168 (6) 0.0473 | – | −0.6163 (6) 0.1926 | −0.8608 (6) 0.0277 | −0.5604 (6) 0.2474 | 0.8197 (6) 0.0458 | −0.1343 (6) 0.7997 | −0.3908 (6) 0.4437 |
| Dry film thickness | 0.8041 (6) 0.0538 | 0.8694 (6) 0.0245 | 0.8809 (6) 0.0204 | −0.6163 (6) 0.1926 | – | 0.5242 (6) 0.2858 | 0.2160 (6) 0.6811 | −0.5537 (6) 0.2543 | 0.0768 (6) 0.8850 | 0.3971 (6) 0.4357 |
| Adhesion | 0.0809 (6) 0.8789 | 0.8101 (6) 0.0507 | 0.8032 (6) 0.0543 | −0.8608 (6) 0.0277 | 0.5242 (6) 0.2858 | – | 0.1966 (6) 0.7089 | −0.4370 (6) 0.3862 | −0.0090 (6) 0.9866 | 0.3723 (6) 0.4674 |
| Scratch force | 0.1475 (6) 0.7803 | 0.3811 (6) 0.4560 | 0.1902 (6) 0.7182 | −0.5604 (6) 0.2474 | 0.2160 (6) 0.6811 | 0.1966 (6) 0.7089 | – | −0.6219 (6) 0.1874 | −0.3021 (6) 0.5606 | −0.3480 (6) 0.4990 |
| Scratch volume | −0.5366 (6) 0.2724 | −0.6358 (6) 0.1748 | −0.6111 (6) 0.1974 | 0.8197 (6) 0.0458 | −0.5537 (6) 0.2543 | −0.4370 (6) 0.3862 | −0.6219 (6) 0.1874 | – | −0.4402 (6) 0.3824 | −0.4841 (6) 0.3306 |
| Impact | 0.1712 (6) 0.7457 | −0.0721 (6) 0.8920 | 0.0883 (6) 0.8678 | −0.1343 (6) 0.7997 | 0.0768 (6) 0.8850 | −0.0090 (6) 0.9866 | −0.3021 (6) 0.5606 | −0.4402 (6) 0.3824 | – | 0.8917 (6) 0.0170 |
| Abrasion | 0.3113 (6) 0.5482 | 0.3006 (6) 0.5627 | 0.4719 (6) 0.3447 | −0.3908 (6) 0.4437 | 0.3971 (6) 0.4357 | 0.3723 (6) 0.4674 | −0.3480 (6) 0.4990 | −0.4841 (6) 0.3306 | 0.8917 (6) 0.0170 | – |
* correlation coefficient. ** number of samples. *** p-value (value below 0.05 shows a statistically significant correlation at 95% confidence level, cross box shaded with green).
Publisher’s Note: MDPI stays neutral with regard to jurisdictional claims in published maps and institutional affiliations. |
© 2021 by the authors. Licensee MDPI, Basel, Switzerland. This article is an open access article distributed under the terms and conditions of the Creative Commons Attribution (CC BY) license (http://creativecommons.org/licenses/by/4.0/).
Share and Cite
MDPI and ACS Style
Pavlič, M.; Petrič, M.; Žigon, J. Interactions of Coating and Wood Flooring Surface System Properties. Coatings 2021, 11, 91. https://0-doi-org.brum.beds.ac.uk/10.3390/coatings11010091
AMA Style
Pavlič M, Petrič M, Žigon J. Interactions of Coating and Wood Flooring Surface System Properties. Coatings. 2021; 11(1):91. https://0-doi-org.brum.beds.ac.uk/10.3390/coatings11010091
Chicago/Turabian StylePavlič, Matjaž, Marko Petrič, and Jure Žigon. 2021. "Interactions of Coating and Wood Flooring Surface System Properties" Coatings 11, no. 1: 91. https://0-doi-org.brum.beds.ac.uk/10.3390/coatings11010091
Note that from the first issue of 2016, this journal uses article numbers instead of page numbers. See further details here.