1. Introduction
Inert surfaces, i.e., surfaces that do not expose any surface functional groups to the surrounding electrolyte solution, develop a pH-dependent charge, the origin of which has been at the center of some fierce debates [
1,
2]. The issue is also related to the inert gas/electrolyte aqueous solution interfaces (Ray–Jones effect [
3]), i.e., the observation of a minimum of the surface tension at millimolar concentration (in terms of both salt and acid-concentration), which has been debated since almost a century [
4]. On the inert surfaces, the actual charge, its pH-dependence, and the occurrence of isoelectric points in the pH range 2–4 are hardly contested [
5], but amongst potential others the following explanations for the origin of these observations have been put forward:
Preferential adsorption of hydroxide ions with respect to protons [
6];
Charge transfer in interfacial water [
7];
Dissolved inorganic carbon as a source of contamination [
8];
Dissolved charged surface-active contaminants [
9].
Unfortunately, the various features (and in recent years in particular the question of contaminant being present or not) have been debated in similar ways as the origin of the Ray–Jones effect. Thus, the roles of organic contaminations [
10] or inorganic ions [
11] have been refuted. Yet, the surface-active contaminations, when considered as a mixture of molecules with low and high pK
a values at sub-micromolar concentrations, appear to be able to explain the charging of inert surfaces [
11]. However, from our point of view, many of the attempts to explain the unexpected observations address selected aspects, such as zeta-potential measurements, but will probably be unable to yield a comprehensive explanation including other observations. For example, the trace concentrations of surface-active agents would not be able to explain the buffering effect of polytetrafluorethylene (PTFE), as well as other inert surfaces, at pH values as low as 3. A simple experiment involving the addition of powders of hydrophobic material into MilliQ water under inert gas atmosphere lowers the pH to values down to pH 3 if sufficient material is added. In the absence of a better explanation, we believe that currently this buffering can only be explained by involving the adsorption of the water ions (i.e., in particular the hydroxide ions, which lowers the pH). Overall, this explanation still appears to be able to phenomenologically account for all observations. As another example, the charge separation of ultrapure water droplets on cleaned PTFE surfaces in the absence of carbon dioxide, resulting in charged water droplets and charged PTFE surfaces, requires charge carriers [
12]. The purest water used in the cited study still had a higher conductivity than ideal water, but the purer the water, the higher the charge on the water droplet [
12]. Such charge separation has been related to electrets and the water ions again have been a preferred interpretation of charge separation on all kinds of surfaces that we experience in dry environments sometimes [
13].
Yet the dilemma remains that even for the idea of preferential adsorption or excess accumulation of hydroxide ions at inert surfaces—which in our opinion explains both the buffering and the charge separation—an excessive affinity of named solute must be accepted. This strong affinity is in contradiction with many advanced molecular simulations [
14,
15], some of which suggest that the proton is favored at the interfaces of interest. In view of the contradictory conclusions, it is not unlikely that the four above-mentioned causes (and maybe others) are all simultaneously at play. The literature on the various topics is exhaustive and extending year by year [
16,
17,
18], and it would be futile to even try and discuss all the information that is being accumulated.
Instead, we focus in the next section of this introduction on how Emil Chibowski has been contributing to this field. His interest in contact angles [
19,
20,
21], surface energies [
22,
23,
24], and electrokinetics [
25,
26,
27] brought him into contact with discussions about the origin of the charge that was also measured in electrolyte solutions on, for example, oil droplets [
26,
27,
28], paraffin [
25], or ice [
29,
30]. One conclusion from many of the published papers was that protons and hydroxide ions are charge-creating solutes, while hydroxide ions determine the zeta-potential. However, due to the small charge observed in many cases, this also opened the discussion about oriented water dipoles being responsible for the determined zeta-potentials [
25]. More precisely, Chibowski with his coworkers showed that near hydrophobic surface potential may be created by immobilized and oriented water dipoles. Indeed, dipoles are mentioned in Hunter’s book on electrokinetics at a very early point [
31] but are ignored subsequently because they cannot outcompete charged surfaces. In the present work, we report experimental work based on traditional colloid-chemical techniques. We investigated various inert surfaces in monovalent electrolyte (NaCl) solutions. The purpose was to contribute additional information to the discussion about the origin of the charge of inert surfaces. Such results need to be considered for a comprehensive understanding of the charging of surfaces that do not have intrinsic functional groups that could generate charge in the classical sense.
More specifically, we present data obtained with different techniques (electrokinetics as well as potentiometric acid–base and mass titrations) and from different laboratories on different inert surfaces (PTFE, graphite, graphene, and hydrophobic silica) that all confirm previous findings with respect to low isoelectric points of inert materials. We took great care to exclude carbon dioxide, which particularly for the potentiometric titration part is crucial. Moreover, mass titrations with powder with increasing mass content (γ) expose increasingly high surface area, which should make the experiment less prone to contamination effects (unless the powder has these contaminations adsorbed when immersed). To test the role of such contaminants, we carried out XPS measurements on the bare powder and after contact with defined solutions. With the results obtained in this study on different solids and involving several laboratories, we continue to prioritize the interpretation of hydroxide ion adsorption with potential contributions from water dipoles that could even be the reason for the hydroxide ion affinity. The main reason for this interpretation is that it explains the pH dependence, the buffering, and the low IEP (isoelectric point)at the same time. We doubt that on the basis of our results with high concentrations of powder, which we show is not contaminated before and after experiments (within what is detectable by XPS), that contaminants at low concentrations can cause pH values as low as 3, which we observed in suspensions of inert particles.
2. Materials and Methods
2.1. Materials and Methods at KIT
Various inert materials were used.
Hydrophobic silica was obtained from Wacker. The brand HDK H20 (courtesy Wacker, referred to as HDK-H20 in this article) has a specific surface area of 127 m2/g (measured as all the other samples used at KIT (Karlsruhe Institute of Technology) by BET N2 (Brunauer, Emmett, and Teller (BET) method, Micromeritics, Gemini, employing liquid nitrogen after outgassing at 120 °C for several hours) and was used as a powder (HDK-H20P) or prepared as an aqueous suspension that was continuously stirred (HDK-H20S).
A sample of Hypersep/Hpercarb (Hypersep PGC, referred to as H-PGC in this article) was obtained from Thermo Scientific and had a specific surface area of 121 m2/g. According to the manufacturer, this material consists of 30 μm spherical particles of 100% porous (with no micropores) graphitic carbon, composed of flat sheets of hexagonally arranged carbon atoms with a fully satisfied valence.
The PTFE samples used were the same as in a previous paper [
32]. PTFE Beads Microdispers-200 powder (referred to as PTFE-B-200 in the following) was obtained from Polysciences Inc. and its specific surface area was measured to be
s ≈ 6 m
2/g, i.e., a value slightly different from what was previously obtained with another charge of the product [
32]. Flat plates were cut from a conventional PTFE sample to fit the measurement cell for streaming current/potential (20 × 10 mm).
The NaCl solutions were prepared from dried salt. Solutions containing HCl and NaOH were used to adjust the pH. All experiments were performed at room temperature using MilliQ-water (18.2 µOhm/cm) to prepare the solutions under Ar atmosphere.
Continuous potentiometric titrations were carried out using a Metrohm Titrando 907 controlled by the Tiamo software. A known mass of powder or volume of stock suspension was inserted into a titration vessel. The final known total liquid volume (50 mL) contained known amounts of background electrolyte salt. The pH was initially increased by adding a known volume of standardized NaOH. The acid-titration was started after 10 h stirring of the suspension under purified argon atmosphere. Known volumes of the HCl titrant of known concentration were added to the suspension under continuous stirring and in argon atmosphere, and the pH electrode readings were recorded as a function of titrant addition. Small volumes and waiting times between additions were applied. The surface area exposed in the titrations was at least 10 m2. The set-up was calibrated before each titration using an electrolyte solution of the same electrolyte medium and titrating with the same titrant solution. The relative surface charge density due to proton reactions was then calculated from the raw data. With the PTFE powder an alternative method was used, which consisted of preparing separate batches of known amount of powder in known volumes of solutions with constant background electrolyte and known amounts of acid (or in some few cases base) added. All manipulations were carried out under purified argon and the closed tubes were then put on a shaker. After 2 days, the pH of the suspension was measured under Ar atmosphere and the surface charge calculated. The pH electrode was calibrated on a daily basis using at least 4 buffer solutions.
Zeta-potential measurements were done using a Brookhaven Zeta-PALS set-up. The pH was measured as described in the PTFE batch titration procedure.
Streaming potential/current measurements on PTFE flat surfaces were performed using the adjustable gap cell of the Anton Paar SurPass apparatus. The measurements were conducted with a maximum pressure of 300 mbar and a gap height of approximately 100 µm. The pH electrode and conductivity meter were calibrated using the SurPass software.
2.2. Materials and Methods at the University of Zagreb
Measurements at the Zagreb laboratory were conducted on flat surfaces (PTFE, graphite, and graphene) and colloidal particles (graphite and carbon nanotubes (CNTs)).
Graphite: Graphite flat surfaces were prepared from a graphite rod (d = 6.15 mm, 99.9995%) and polished before measurements while synthetic graphite powder (99% purity, Alfa Aesar, Haverhill, MA, USA) was used as colloidal graphite particles.
Graphene: Substrates exposing monolayer graphene on quartz supports were bought from Graphenea (Dimensions: 10 mm × 10 mm, Coverage: 97%).
Carbon nanotubes (CNT): MWCNT (d = 8–15 nm, l = 10–50 μm, Timesnano, Chengdu, China) were used.
The specific surface area of the colloidal particles was determined by the Brunauer, Emmett, and Teller (BET) method (Micromeritics, Gemini) using liquid nitrogen. Prior to the determination of surface area, powders were outgassed at 150 °C for 2 h. The specific surface areas were determined to be s = 18.7 ± 0.1 m2g−1 for graphite particles and s = 163.2 ± 0.7 m2g−1 for CNT particles.
All experiments were performed at 25 °C in inert atmosphere (argon). The pH of the solutions was monitored, in all experiments, by a combined glass electrode with Ag/AgCl reference electrode. The combined glass electrode was calibrated at 25 °C using standard buffer solutions (pHbuff = 3, 7, 10) before each experiment.
The point of zero charge (pH
pzc) of the colloidal particles was determined by potentiometric mass titration. Dry colloidal particles (graphite or CNT) were added into aqueous solution containing 2 mmol dm
−3 of NaCl. Between each addition, ultrasound was used to break aggregates and pH was measured. The colloidal particles were added into the solution until constant pH
∞ = pH
pzc was obtained [
33].
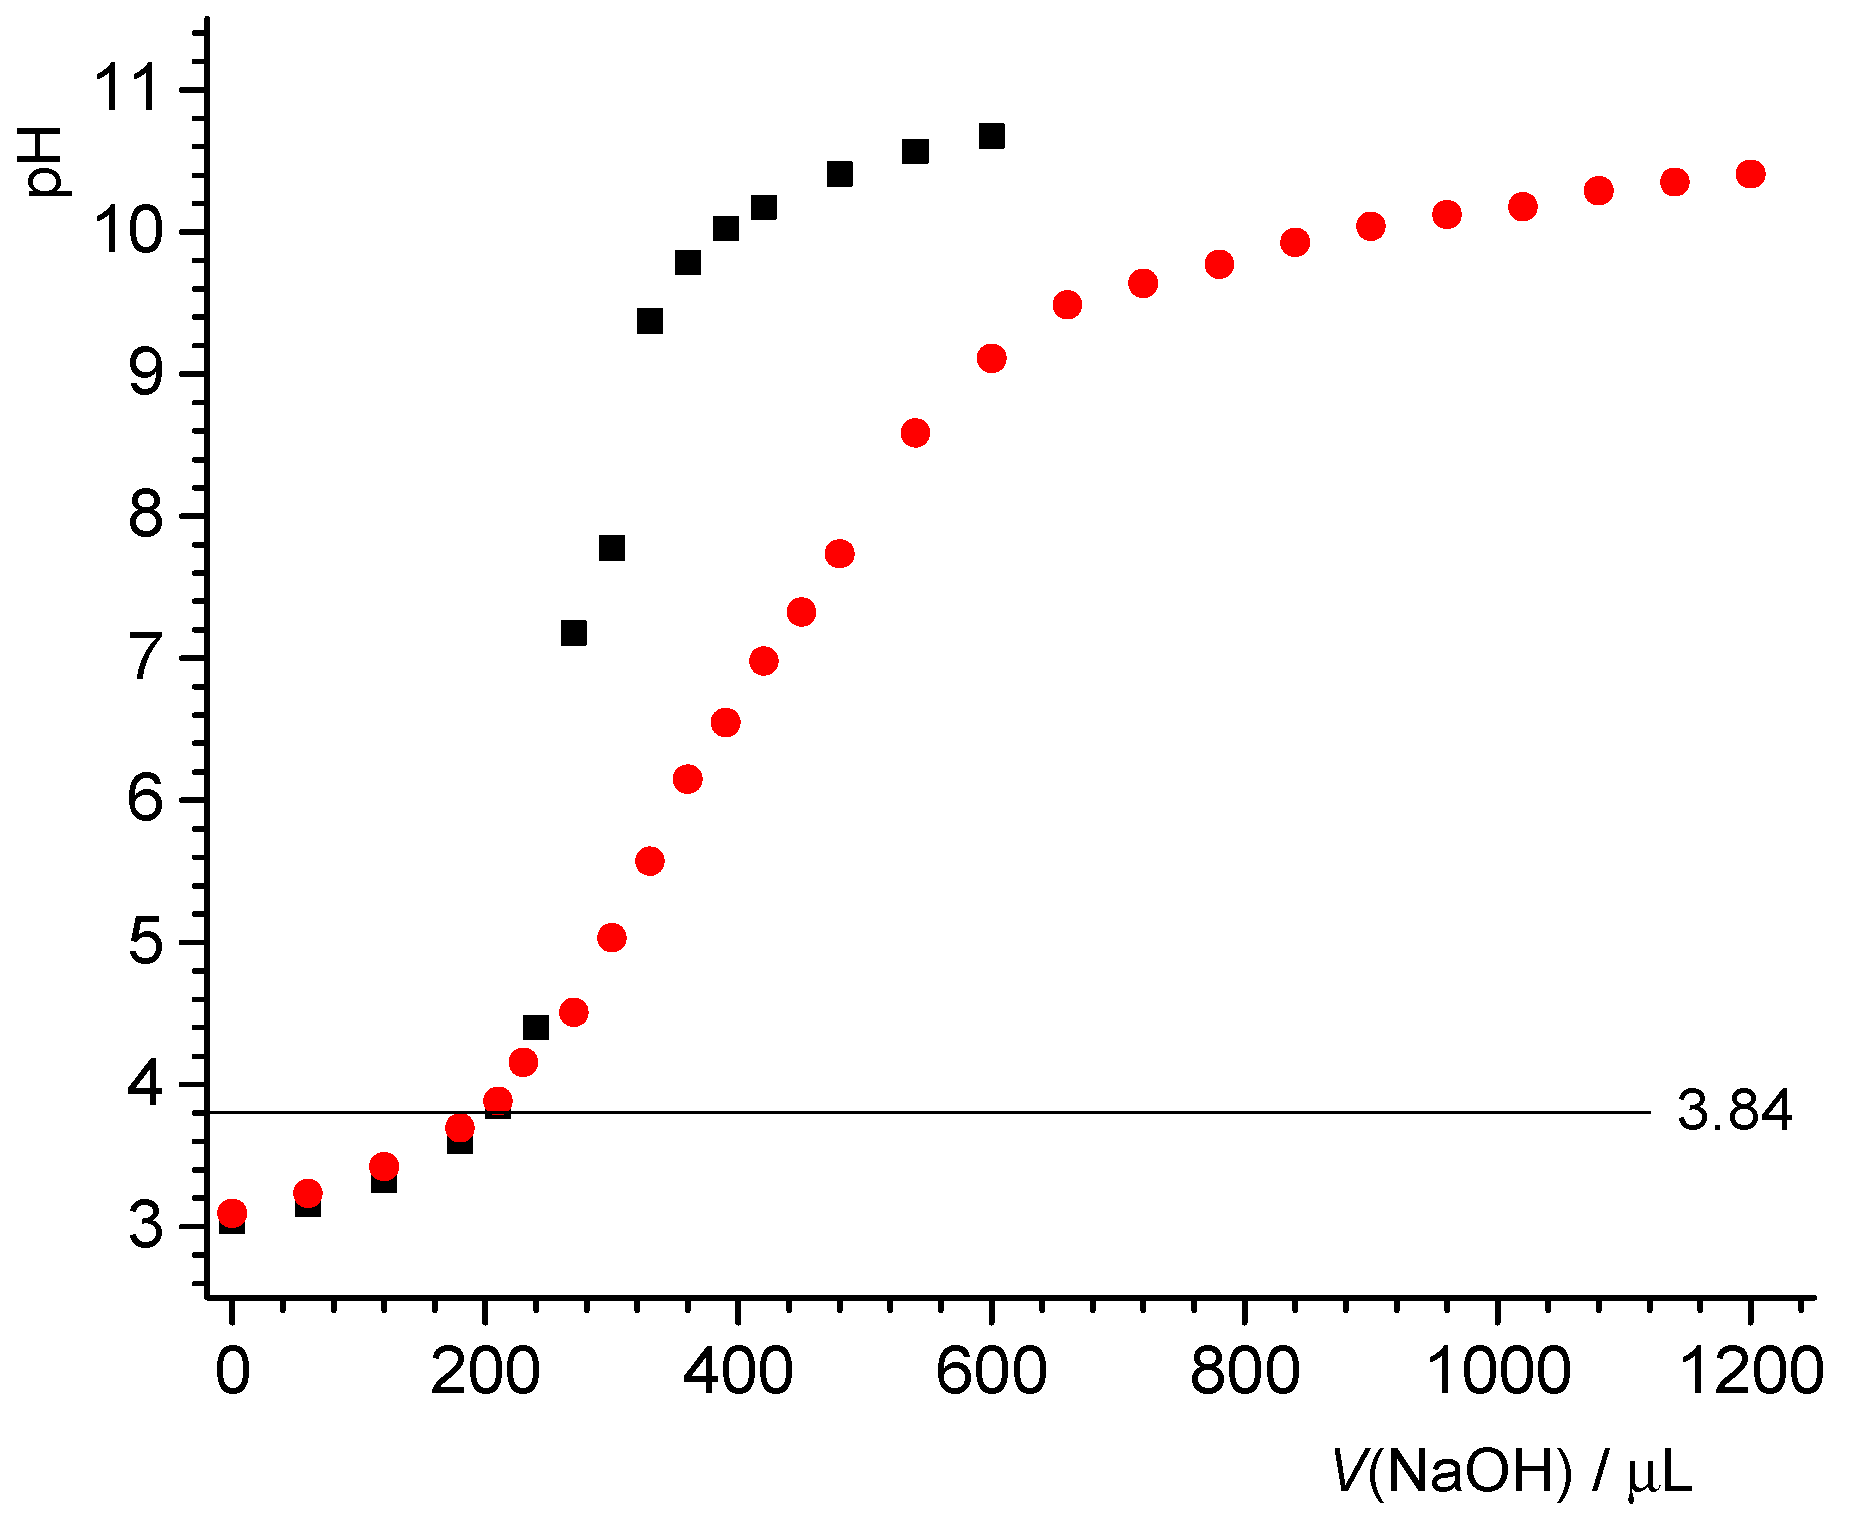
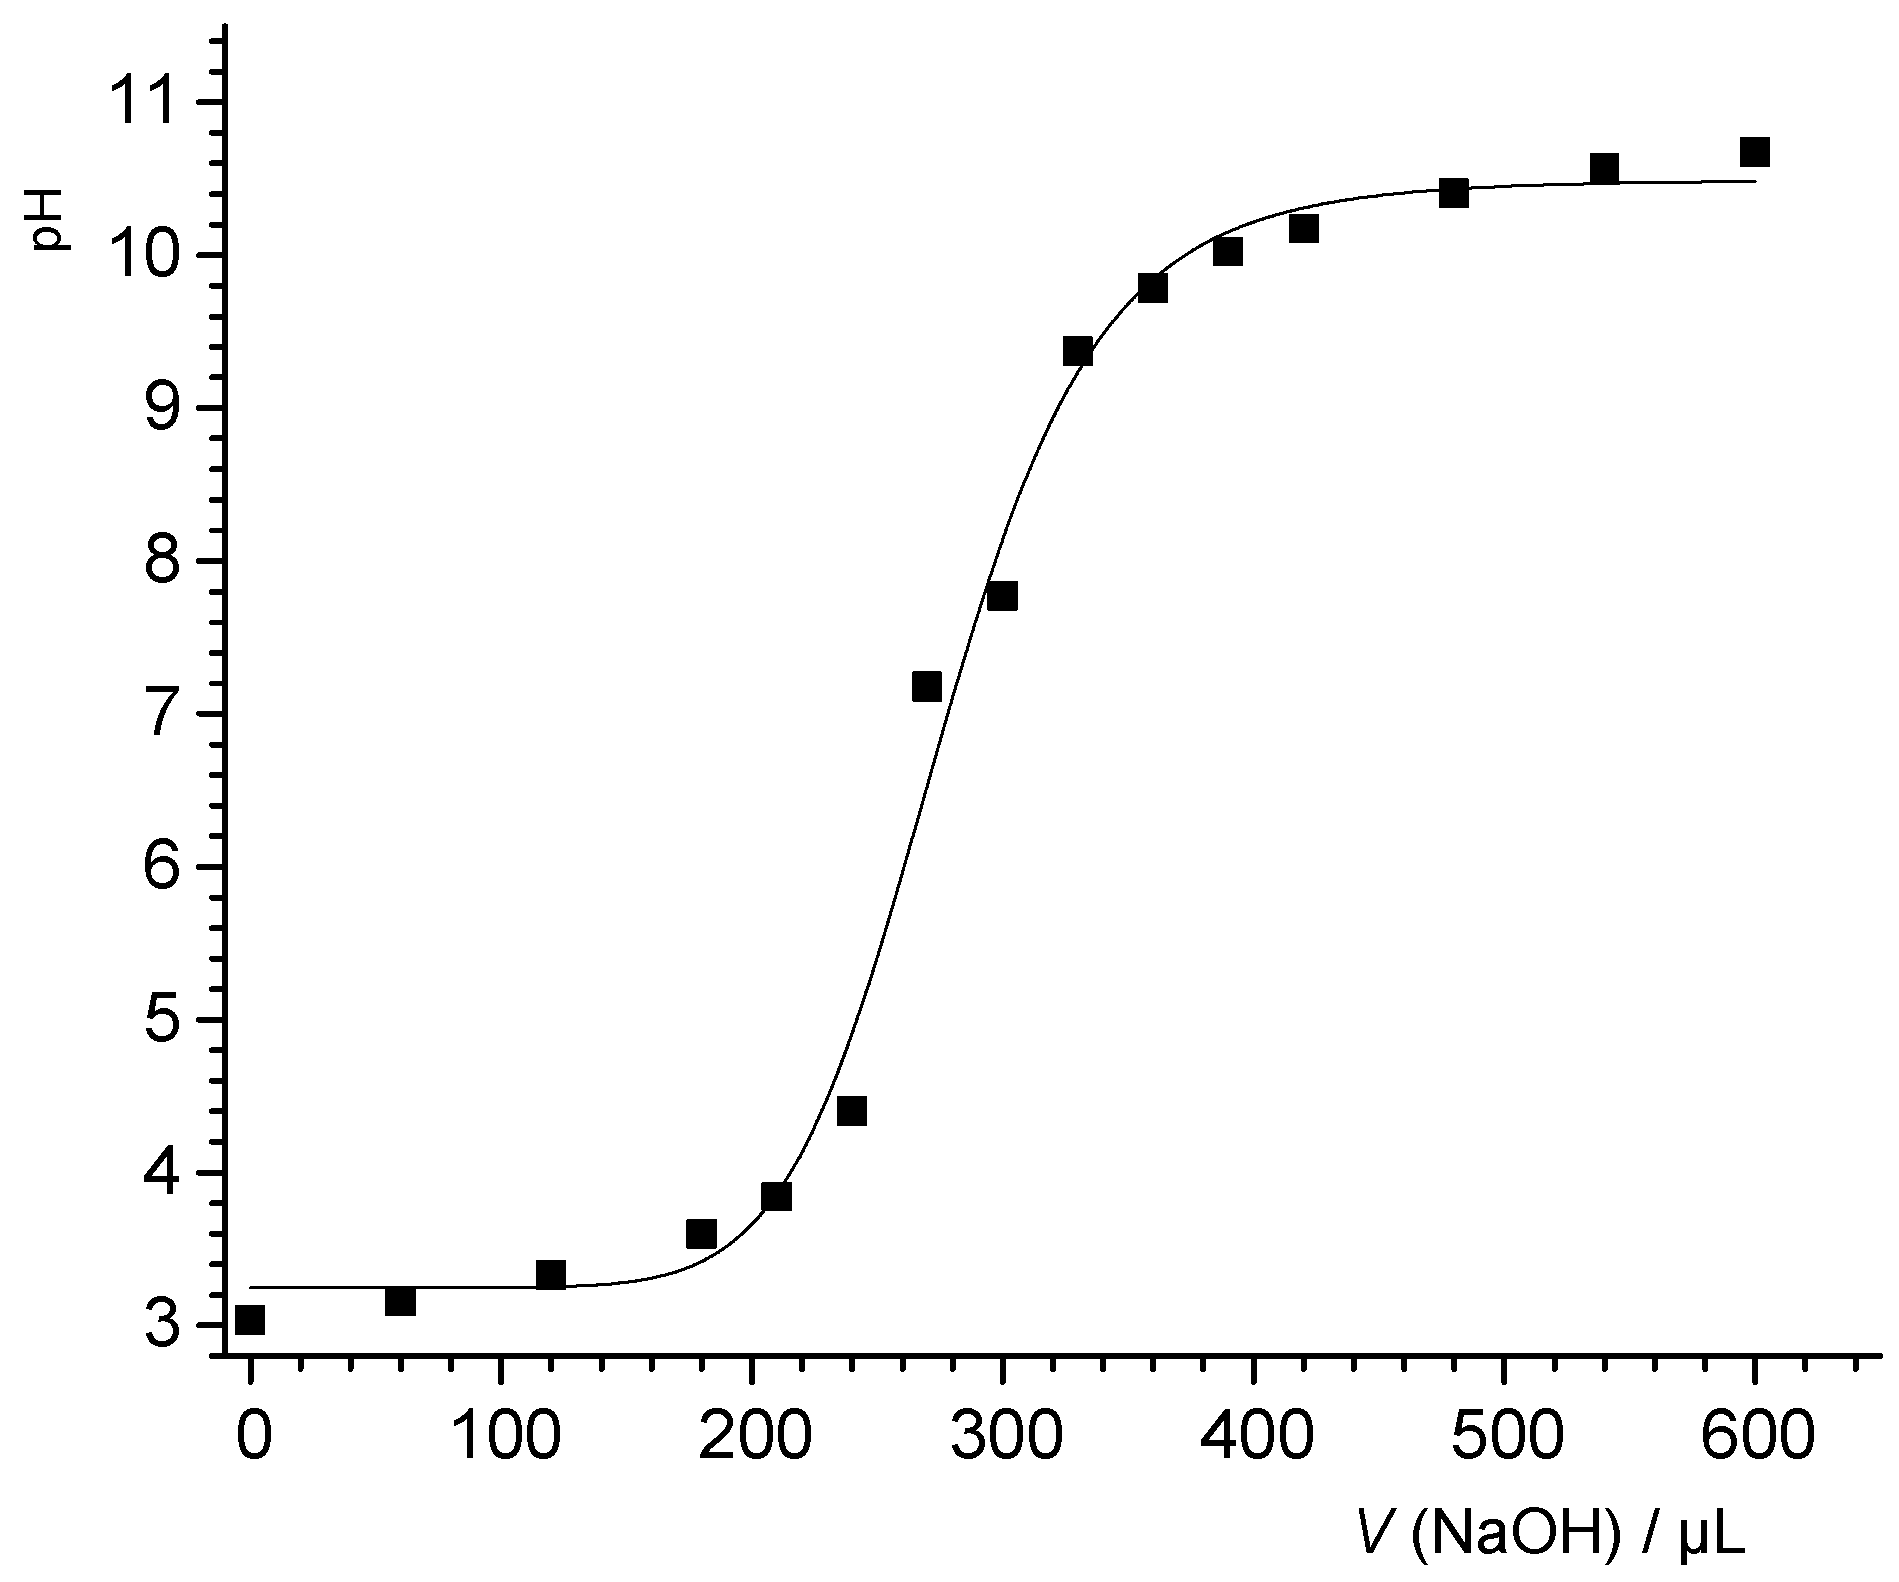
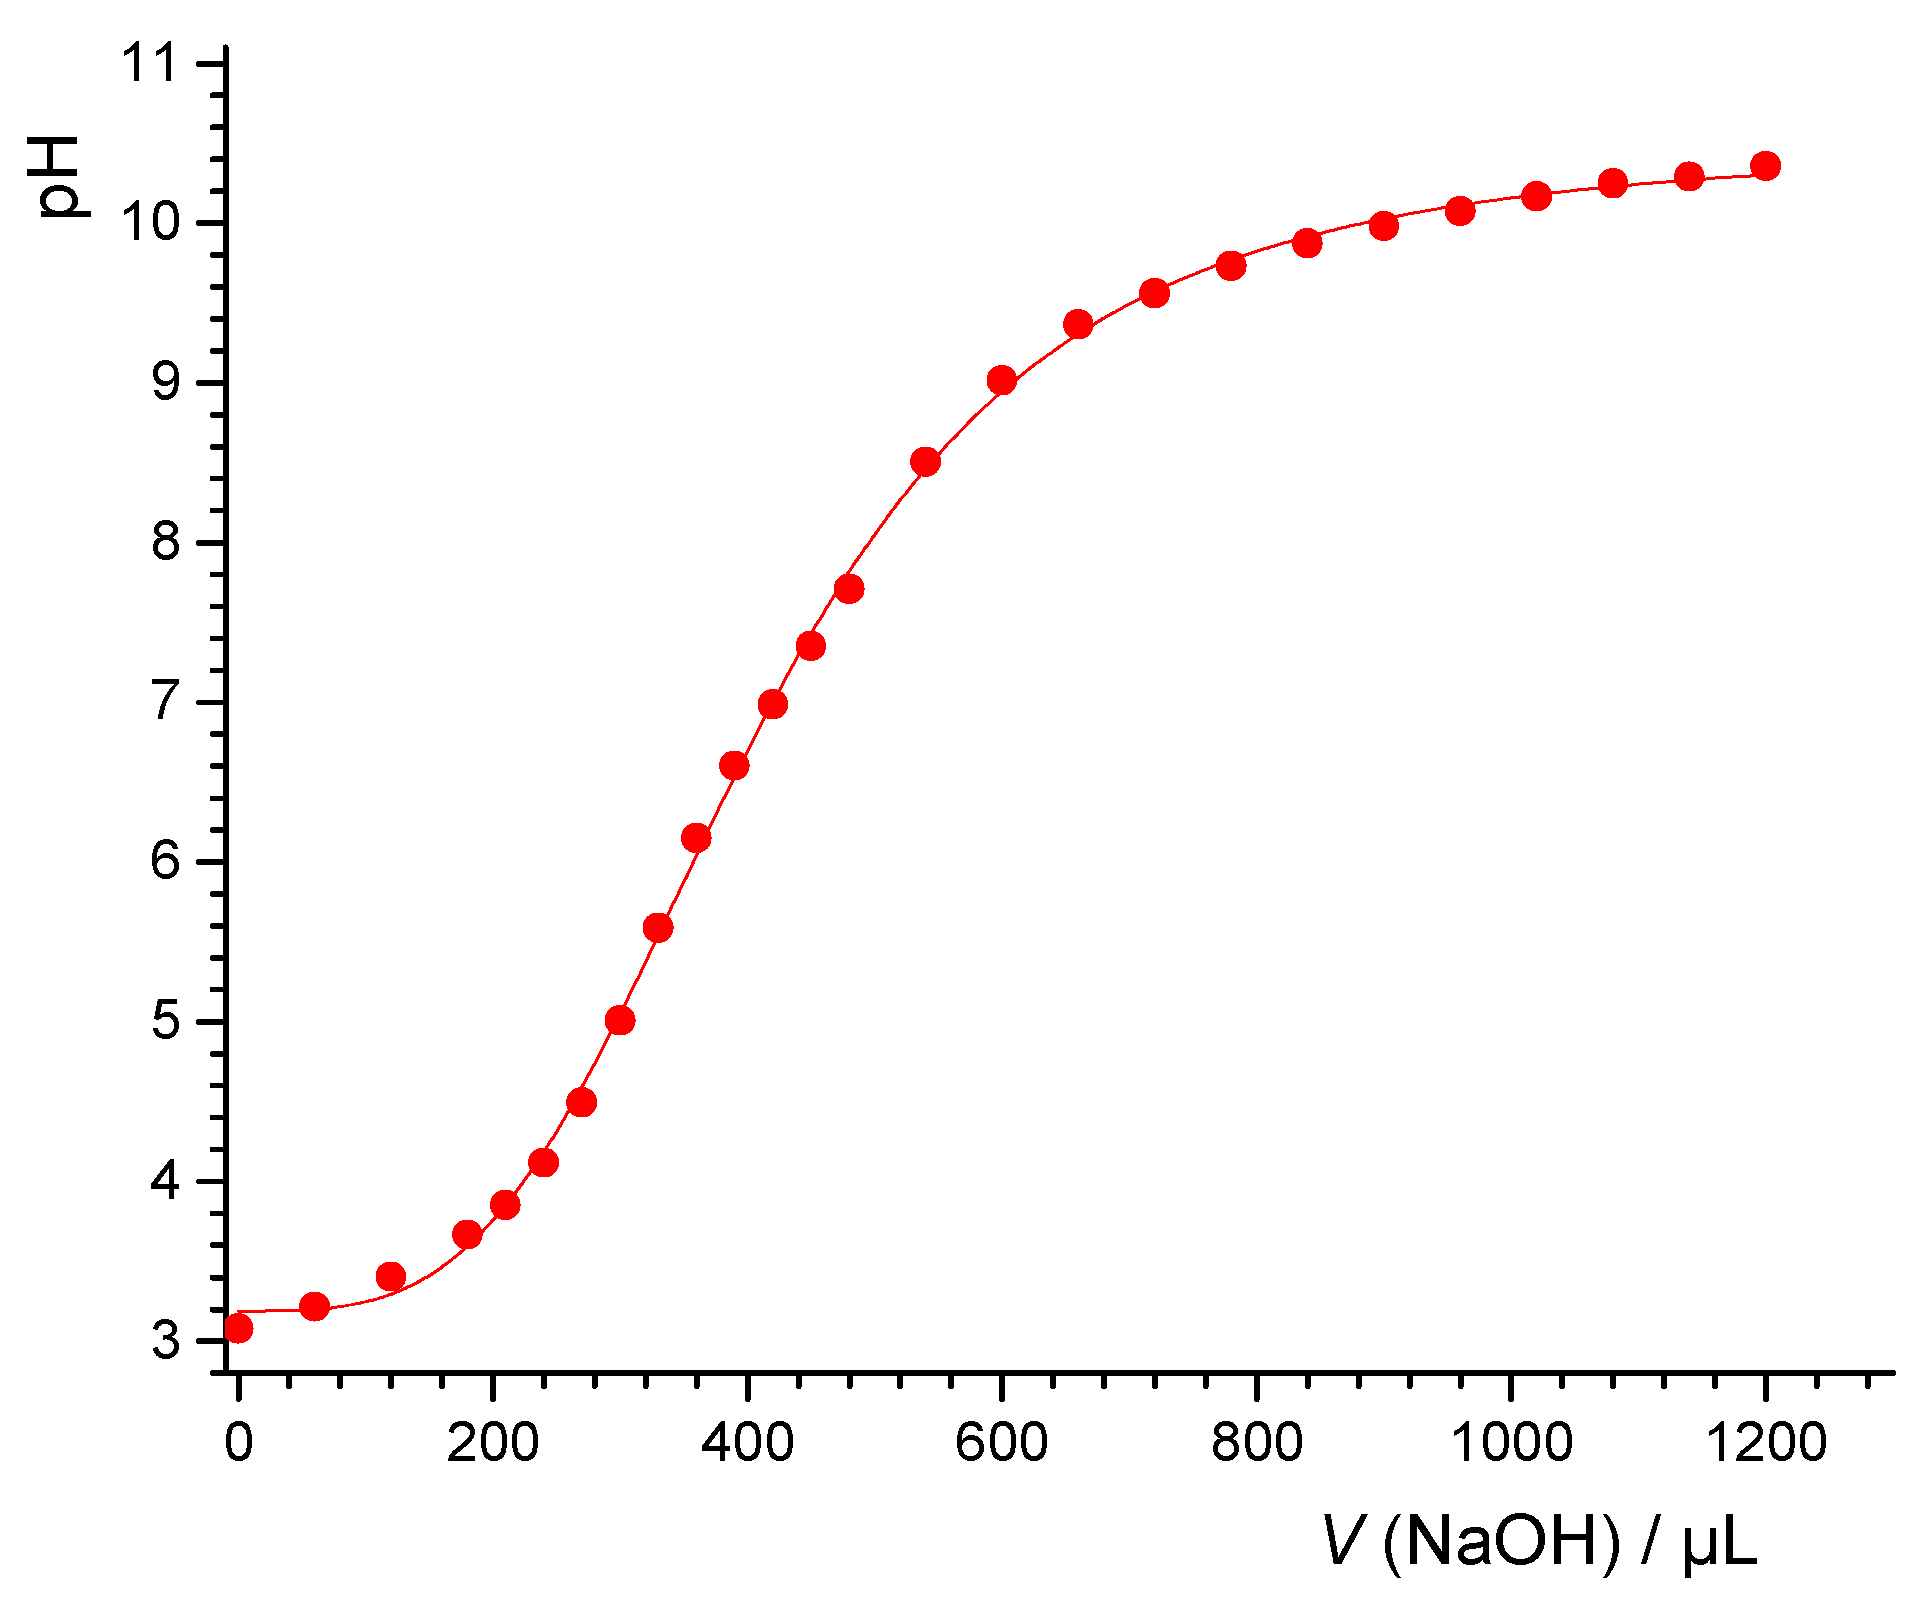
The proton-related surface charge density of CNT as a function of pH was determined by means of potentiometric acid–base titration. For the blank titration, an aqueous electrolyte solution (Ic = 2 mmol dm−3, pH0 = 3) was prepared by adding NaCl and HCl in 10 mL of water. The solution was titrated with NaOH and after each addition the pH was measured. A blank titration was conducted until pH > 9. Afterwards a suspension of carbon nanotubes (γ = 5 g cm−3) was prepared by adding 50 mg of carbon nanotubes to 10 mL of an aqueous electrolyte solution of the same composition as in the blank titration. After each addition of NaOH, the pH of the suspension was measured, and between measurements the suspension was treated with an ultrasound probe for 1 min. Again, potentiometric titration of CNT suspension was conducted until pH > 9.
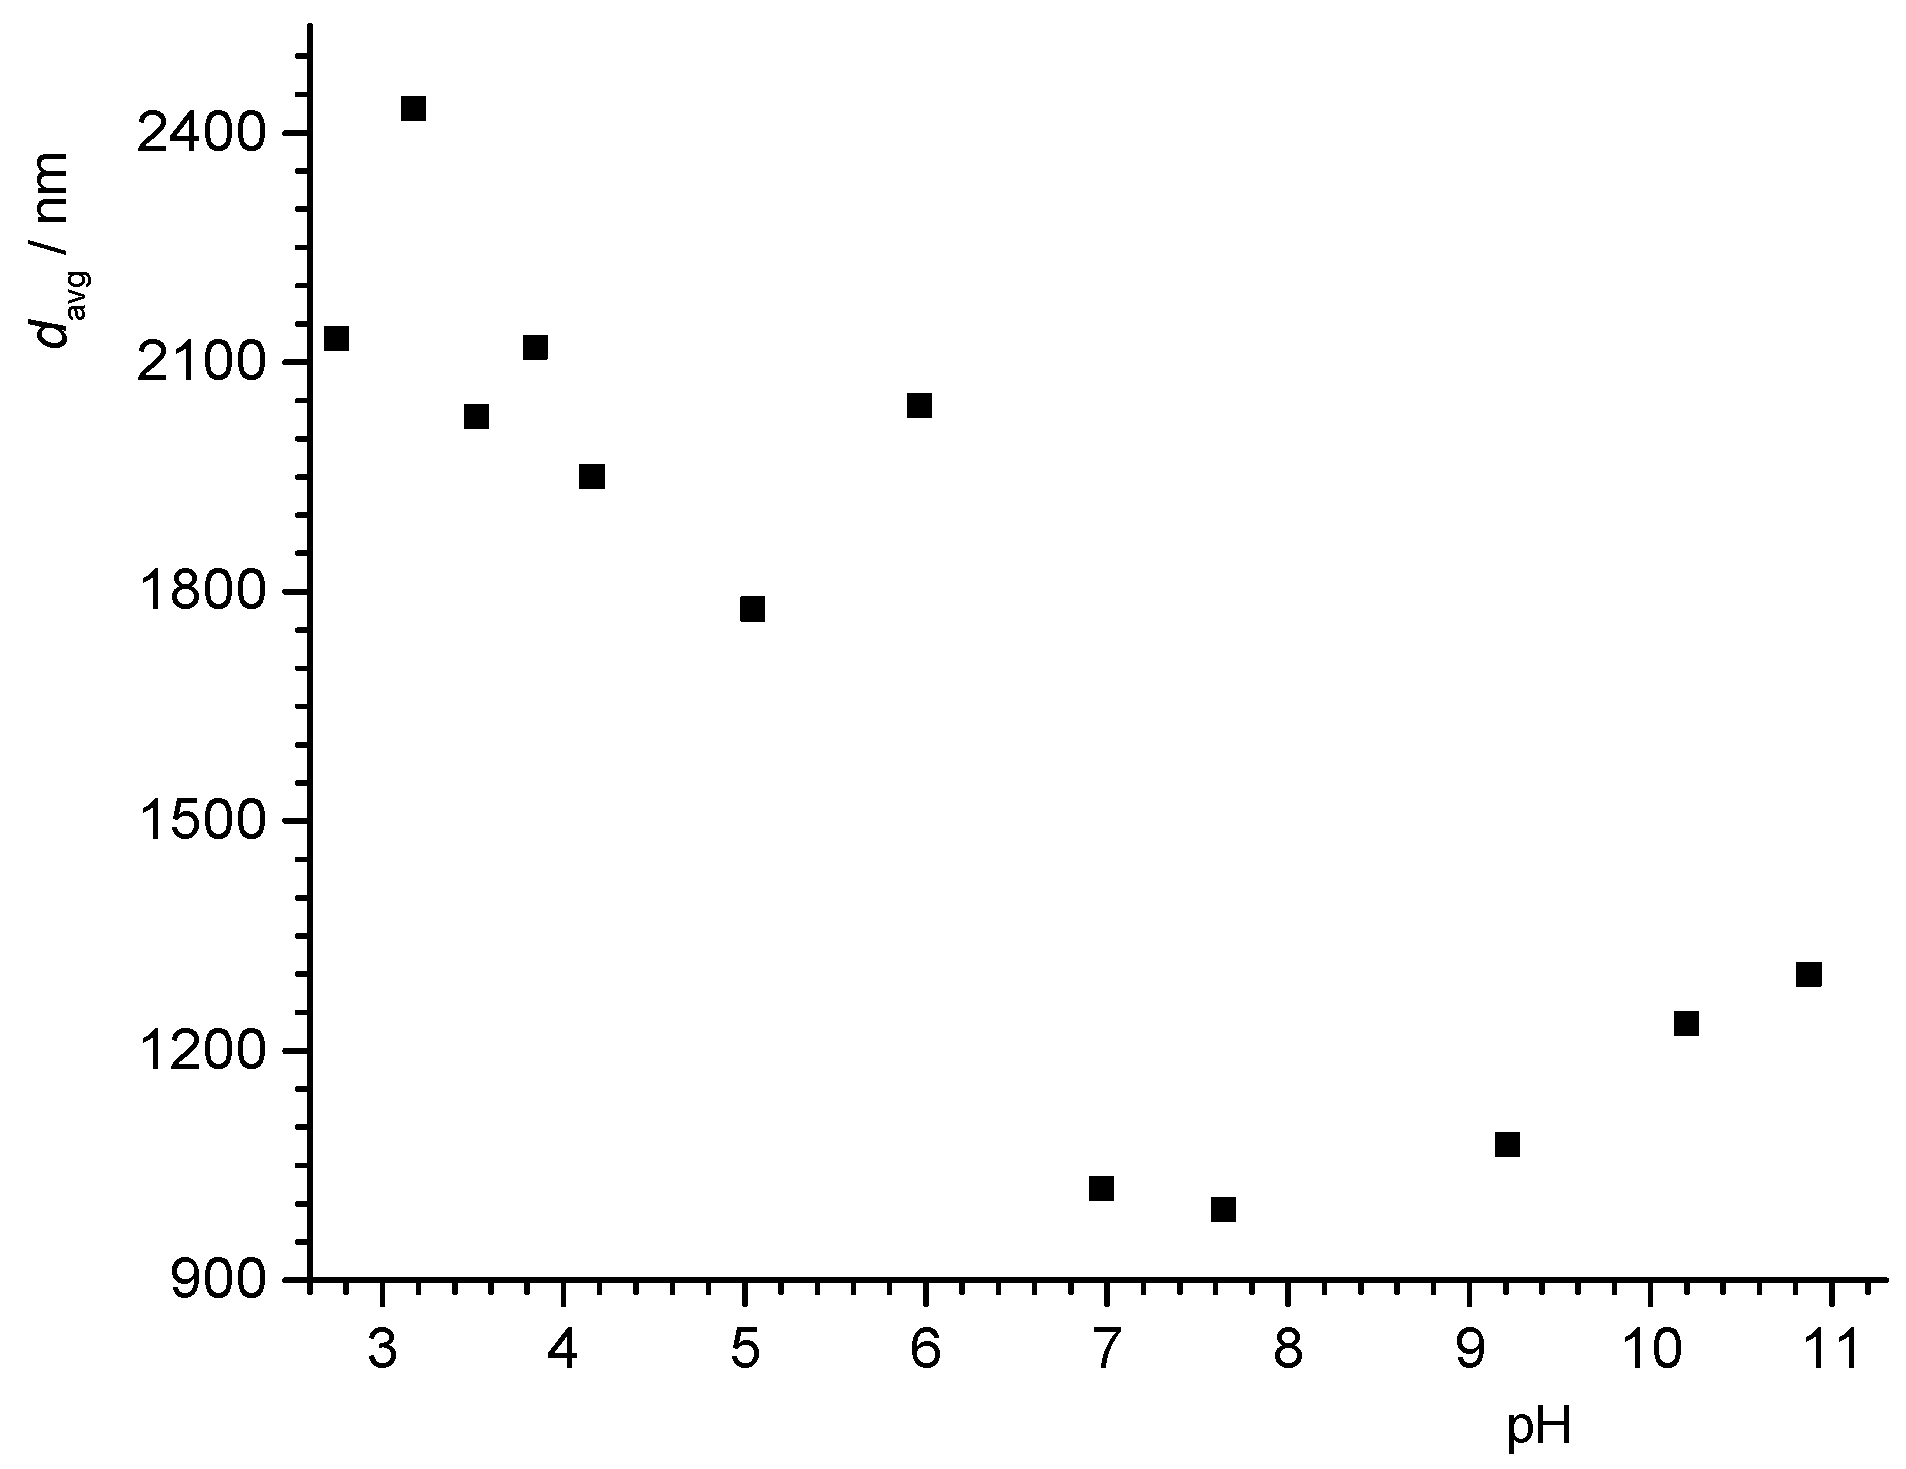
The electrophoretic mobilities of the colloidal particles and their average hydrodynamic diameters were obtained in parallel experiments on a Brookhaven 90Plus/BI-MAS. Initial suspensions were prepared by dispersing colloidal particles (
γ(graphite) = 0.4 g dm
−3,
γ(CNT) = 0.05 g dm
−3) in aqueous solution, which contained 1 mmol dm
–3 NaCl and NaOH (pH
0 ≈ 11,
Ic = 2 mmol dm
−3). The prepared suspensions were titrated with HCl(aq) solution. Electrophoretic mobilities at each pH are reported as average values of 10 runs. The average hydrodynamic diameters of the graphite colloidal particles were determined with dynamic light scattering measurements simultaneously with the electrophoretic measurements (results are presented in
Appendix A.2).
The electrokinetic potential for the flat surfaces (PTFE, graphite, and graphene) was determined using the streaming potential technique on the SurPass apparatus (Anton Paar). Flat surfaces were fixed to the self-made epoxy carriers and were pretreated with an aqueous solution that contained 1 mmol dm−3 NaCl and 1 mmol dm−3 NaOH. The NaCl/NaOH solution (pH0 ≈ 11, Ic = 2 mmol dm−3) was titrated with HCl(aq). The streaming potential gap cell width was adjusted to 100 μm while maximum cell pressure was 200 mbar.
2.3. Materials and Methods at the University of Umeå
XPS spectra of the PTFE powders were recorded with a Kratos Axis Ultra DLD electron spectrometer using a monochromated Al K-alpha source operated at 150 W, a hybrid lens system with magnetic lens providing an analysis area of 0.3 × 0.7 mm
2, and a charge neutralizer. The binding energy scale was referenced to the C 1s line of Teflon, set at 292.5 eV [
34]. Processing of the spectra was accomplished with the Kratos software. Accuracy in BE determination was 0.1 eV, and in atomic ratio—8–10% rel. Data for the bare PTFE powder were acquired at room temperature using the conventional XPS procedure. For the PTFE samples equilibrated in aqueous solutions, we performed XPS measurements under liquid nitrogen cooling using the fast-freezing sample preparation technique. The fast-freezing protocol for cryo-XPS has been described in detail elsewhere [
35].
3. Results and Discussion
3.1. Potentiometric Acid–Base and Mass Titration
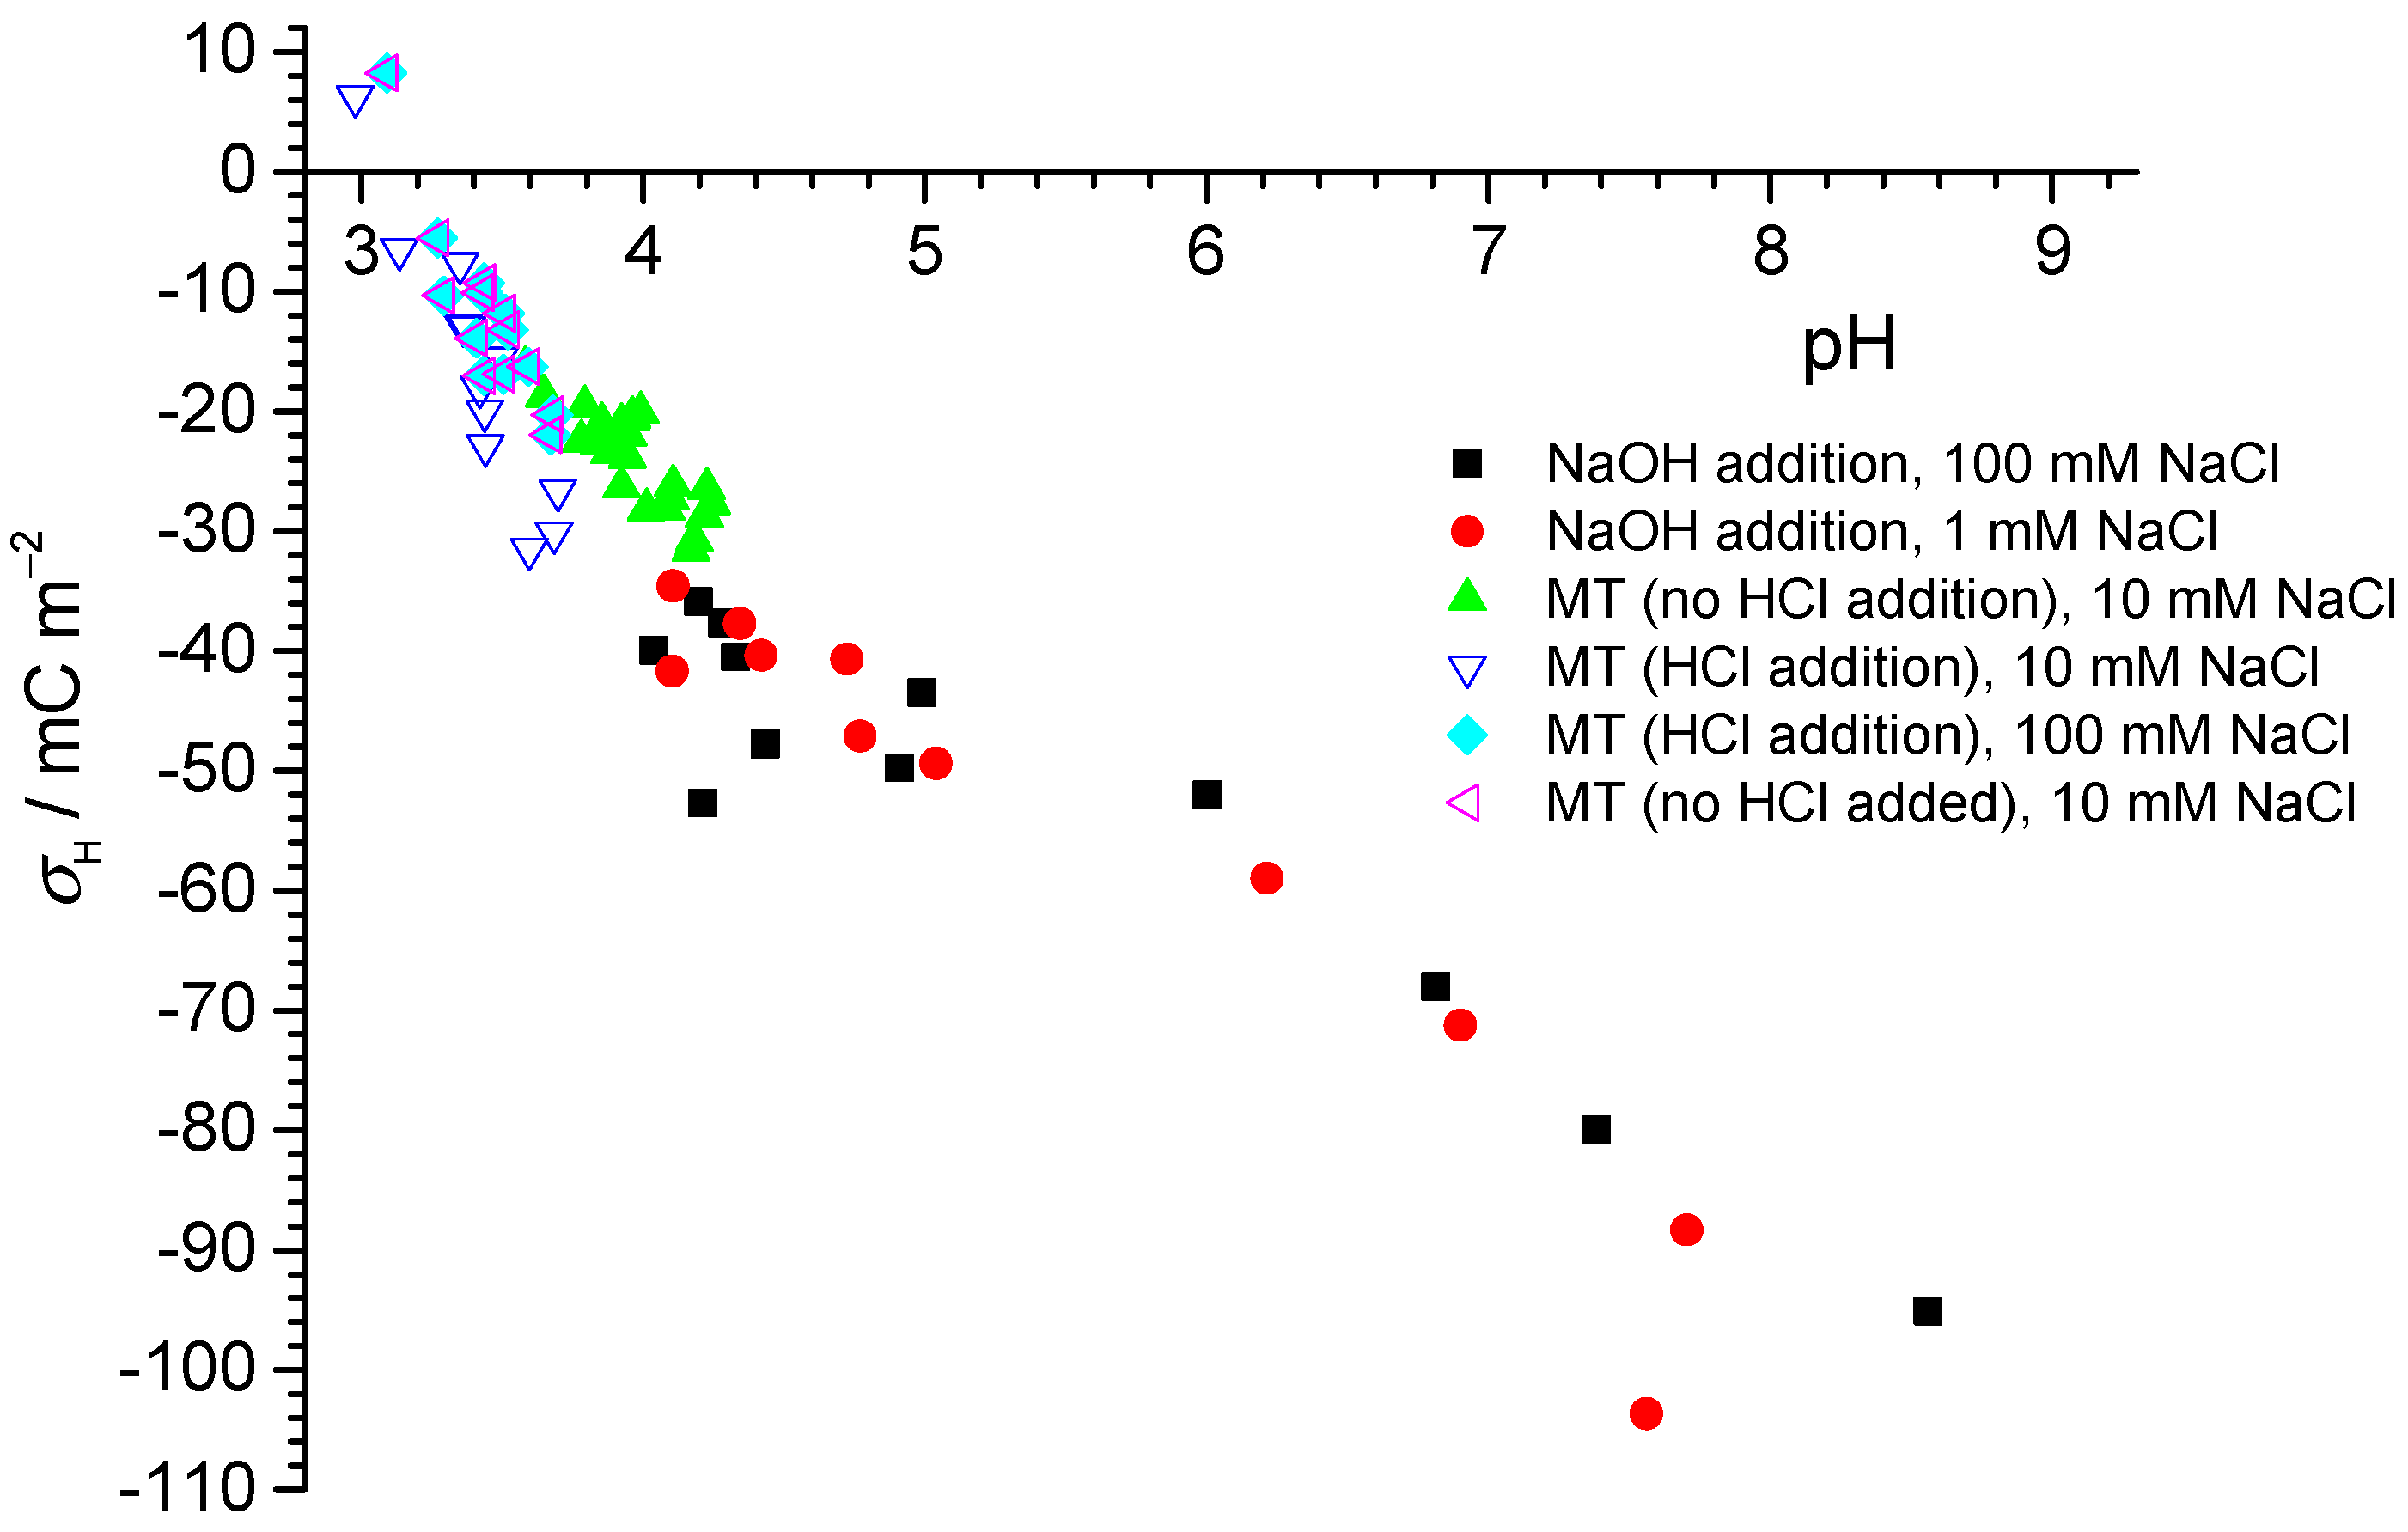
Figure 1 shows the potentiometric titration results for PTFE-B-200, which were consistent at low pH between results from mass titrations and independent potentiometric (batch) titrations. The mass titration results set a point of zero net proton charge at pH 3. The data coincided at the low pH, irrespective of whether acid was added or not. With increase in pH, more negative fundamental charge accumulated at the interfaces. Unlike what would be observed for an oxide surface, the proton-related surface charge did not depend on the salt level for the PTFE sample.
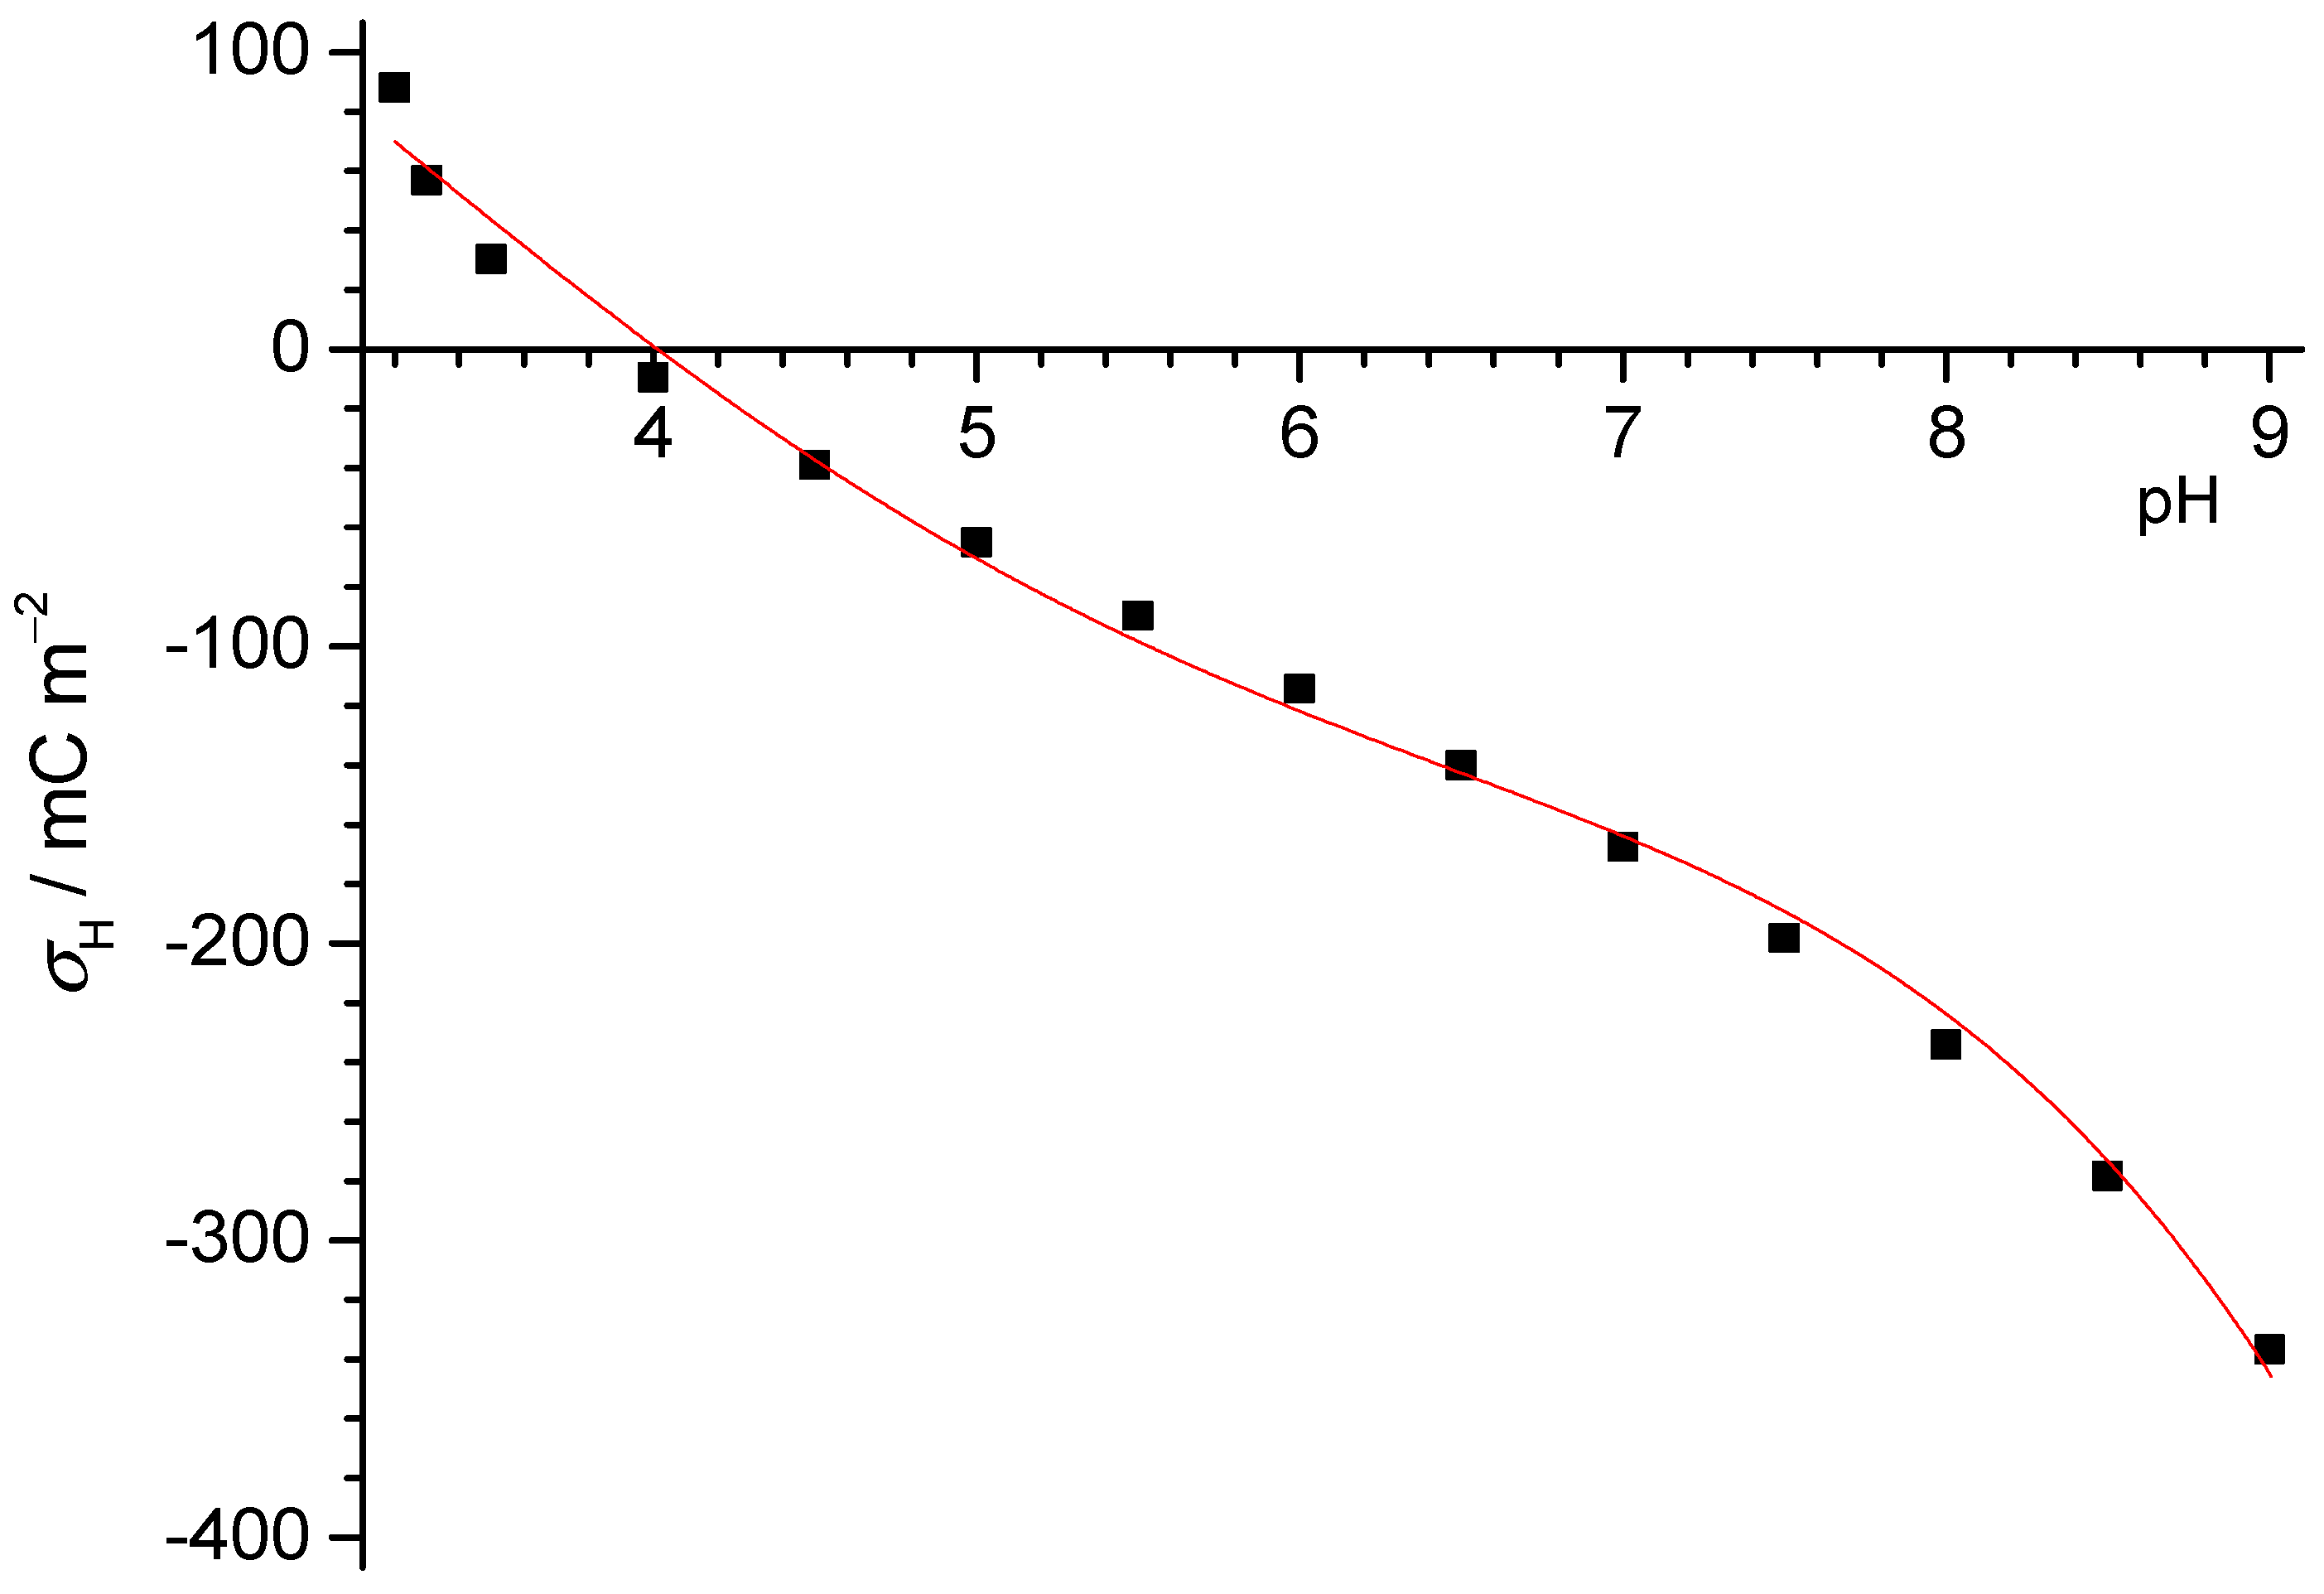
Proton-related surface charge densities of CNT obtained from continuous potentiometric acid–base titration (see
Appendix A,
Figure A1,
Figure A2 and
Figure A3) are presented in
Figure 2. The point of zero charge of CNT in sodium chloride aqueous solution was found to be at pH
pzc = 4. The values of the proton-related surface charge density in the basic region were higher than the values obtained for PTFE particles.
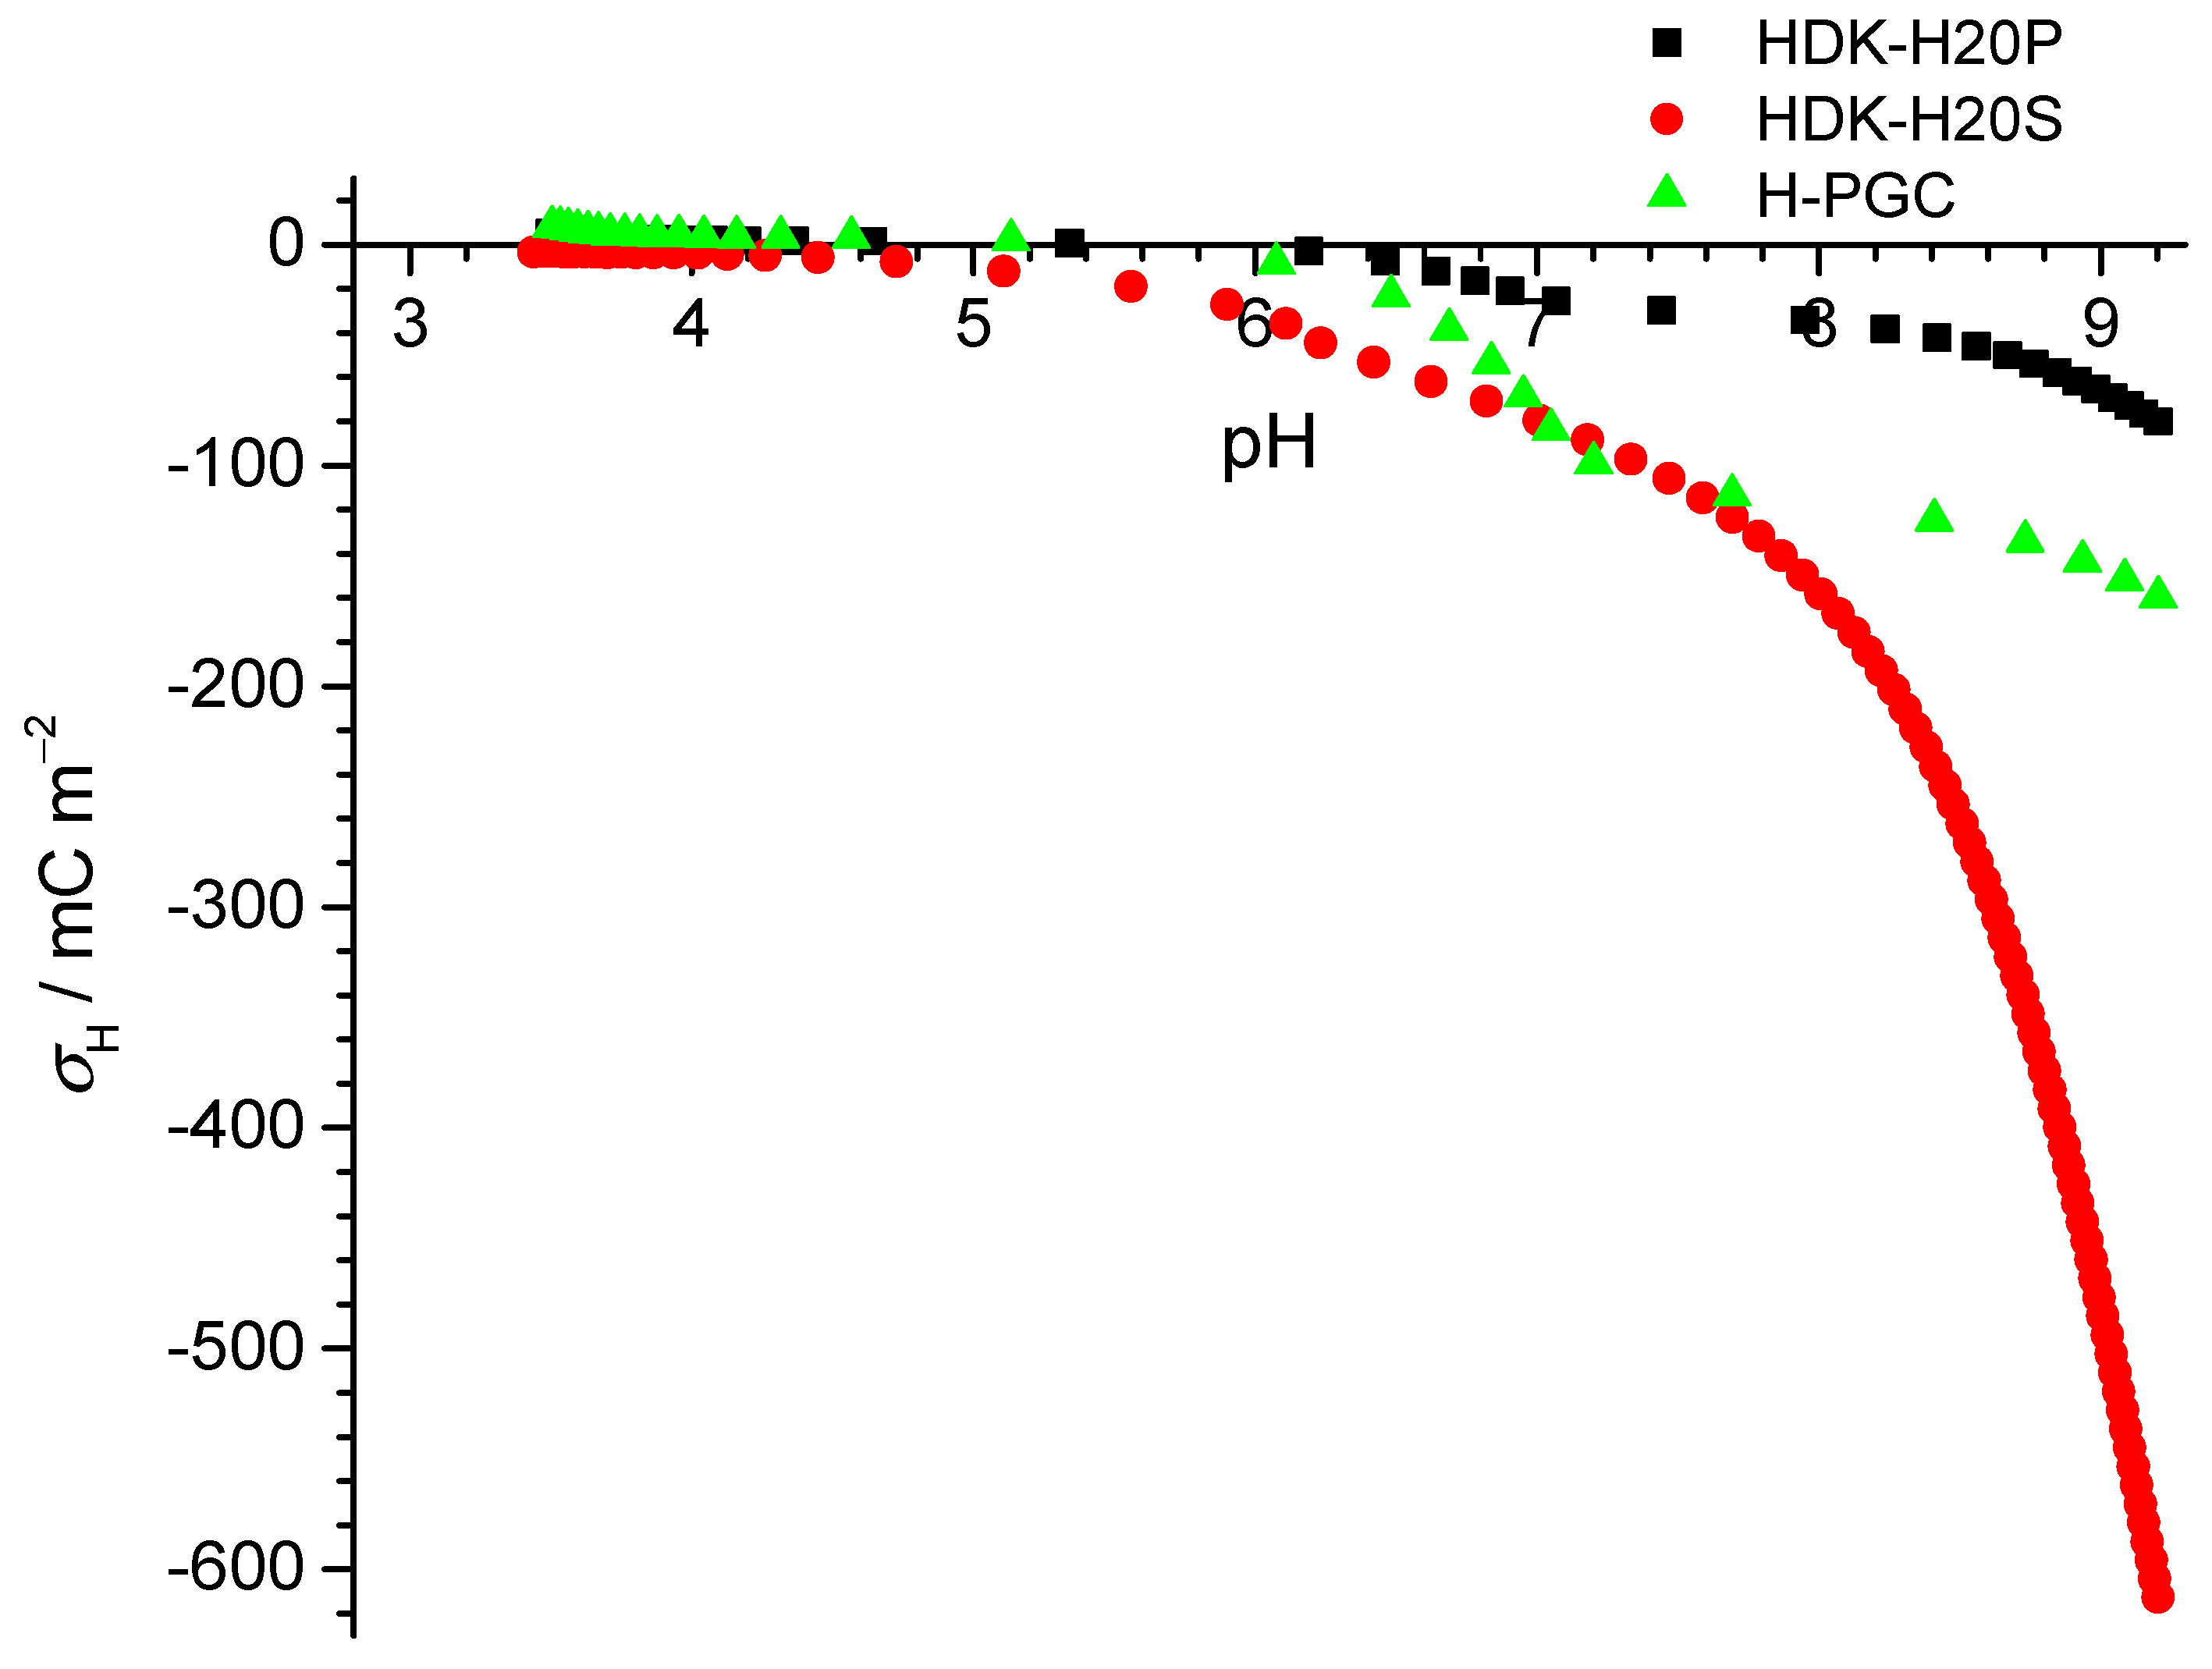
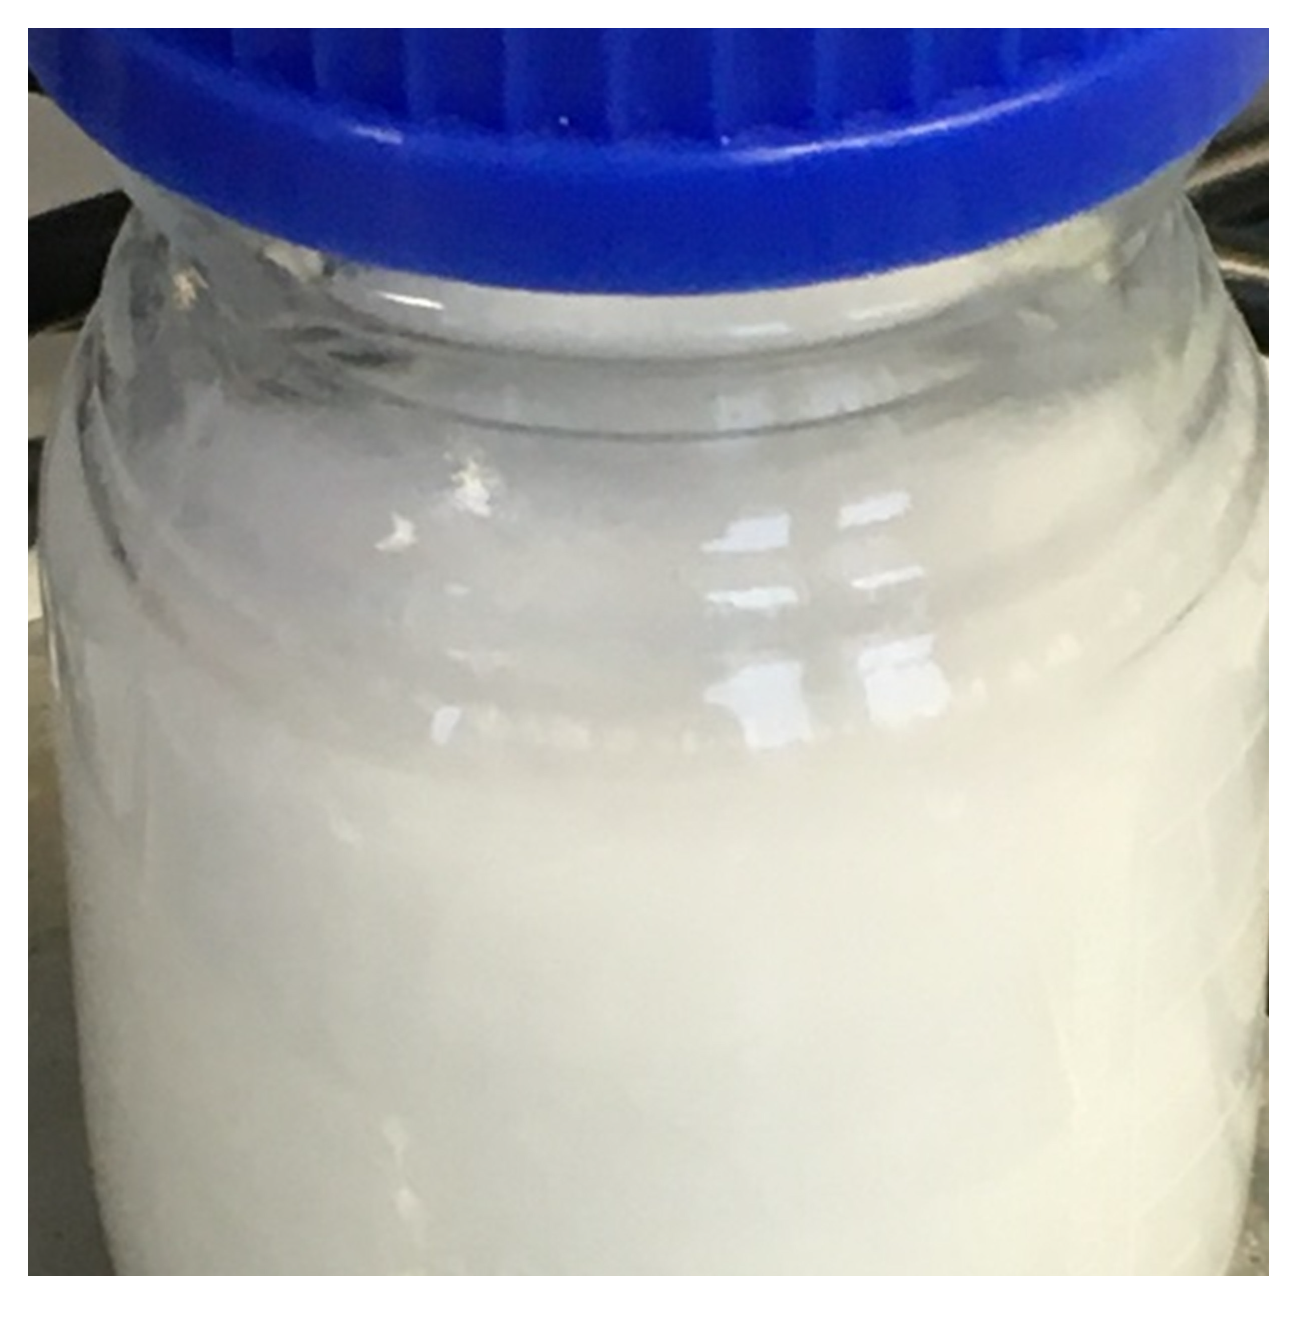
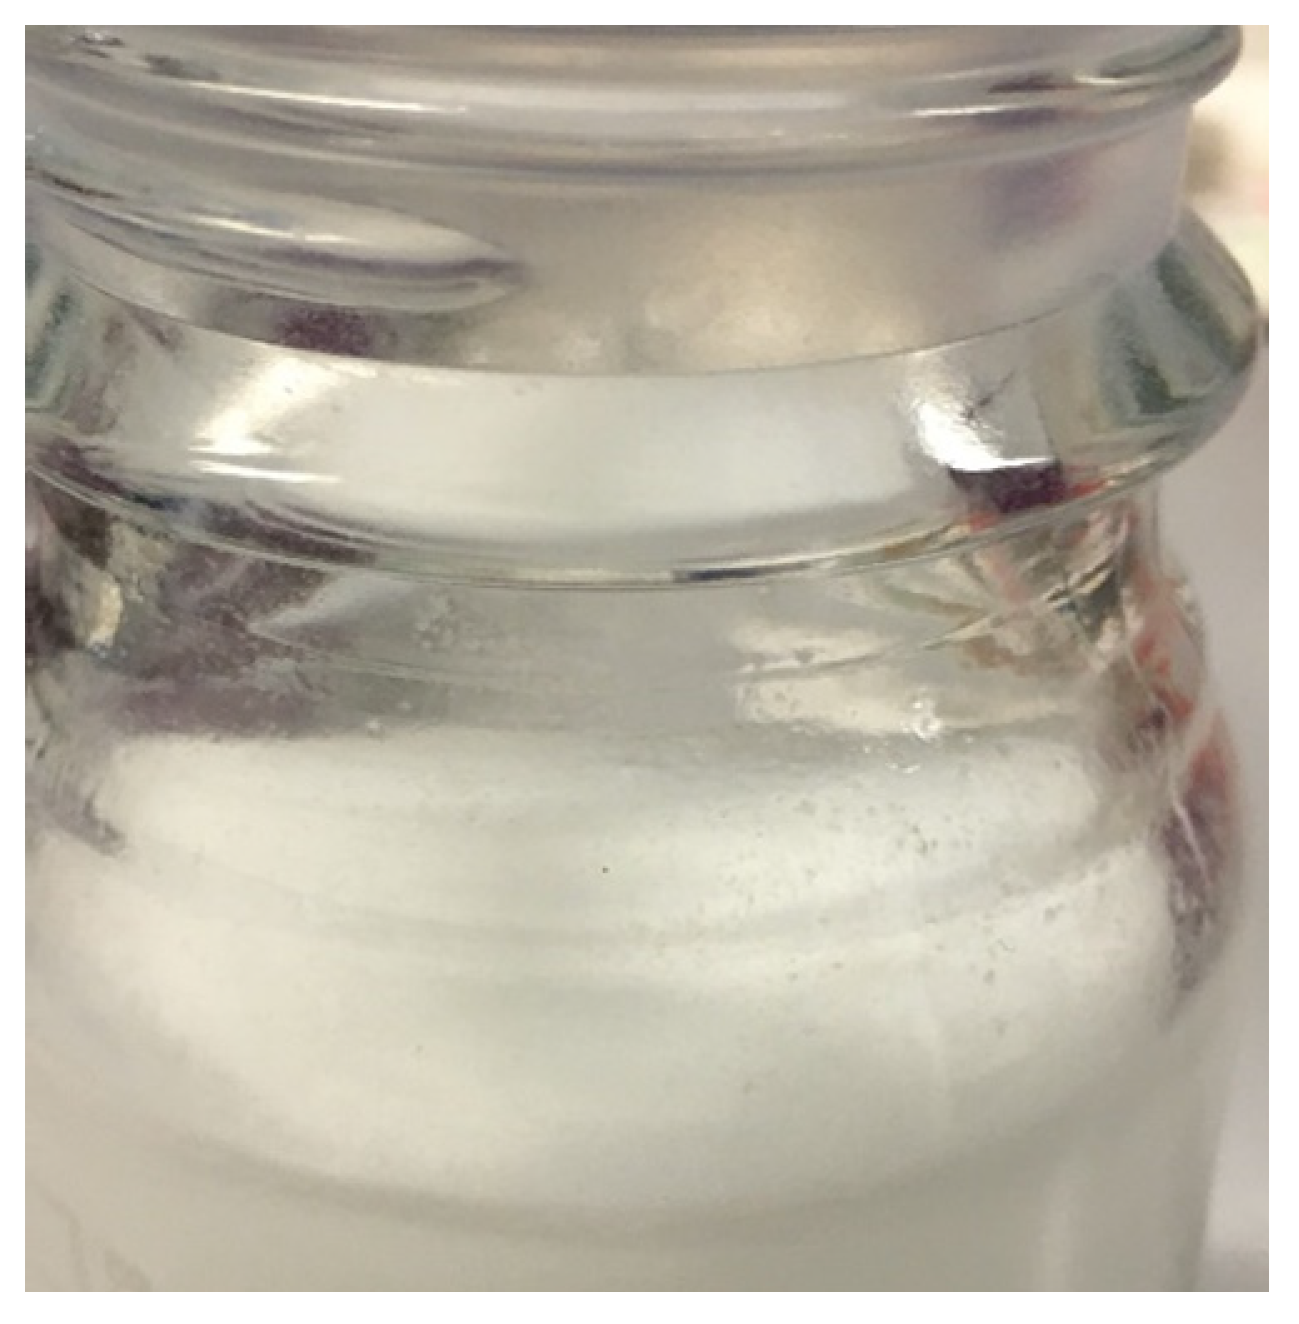
Figure 3 shows that the titrations of the hydrophobic surfaces, graphite (H-PGC), and hydrophobic silica (HDK-H20P) yielded much less proton release than a typical hydrophilic surface (HDK-H20S). The latter was obtained from HDK-H20P by suspension in MilliQ water and agitating for weeks. Initially, the powder (added at high solid concentration) was sticking to the air–water interfaces, and thus the container could not even be filled with water. However, with time, the material must have turned (at least partially) hydrophilic, because the particles became very well dispersed (see
Appendix B,
Figure A5), and thus the missing volume of water could be added. It was observed that this hydrophilic sample behaved like conventional silica. The comparison to the hydrophobic surfaces shows that the deprotonation of the latter was clearly weaker than on oxidic surfaces. Furthermore, with both hydrophobic surfaces, we observed (i) positive charges at the lowest pH, i.e., below pH 4.5, and (ii) changes in slope that are uncommon and were not observed in the batch titrations of the PTFE particles. The continuous titrations yielded relative surface charges. The data in
Figure 3 were translated to absolute charge supposing that the bare particles did not introduce any charge, and since we know the amounts of titrants added to the system for each point, we can assume that the relative charge corresponded to the absolute charge for this case.
When the stirring of the HDK-H20S sample was stopped, part of the material floated immediately on the surface of the suspension (see
Appendix B,
Figure A6). Stirring again immersed all the material again into the suspension, which did not show any phase segregation under the mechanical treatment. The observations that the hydrophobic HDK-H20P particles at some point become “hydrophilic” under continuous mixing with water (yielding HDK-H20S) could have been due to various issues. Among other potential reasons, this observation may be related to the non-equilibrium nature of the systems. In such thermodynamically unstable systems (particle suspensions/dispersions), kinetics (here, for example, affected by the mixing time) may influence the state of dispersions/suspension of initially hydrophobic particles. Furthermore, HDK-H20P particles could be, at least to some extent, water-dispersible, but require some specific mixing time and mixing energy to be suspended in water.
Comparing the determined surface charge densities at pH ≈ 9 for different materials, we found that the proton-related surface charge density increased as the surface became more hydrophilic. The results of the acid–base titrations are shown in
Table 1 for this pH, and although the salt levels were different, the data in
Figure 1 suggest that this variation was not relevant for the hydrophobic surfaces.
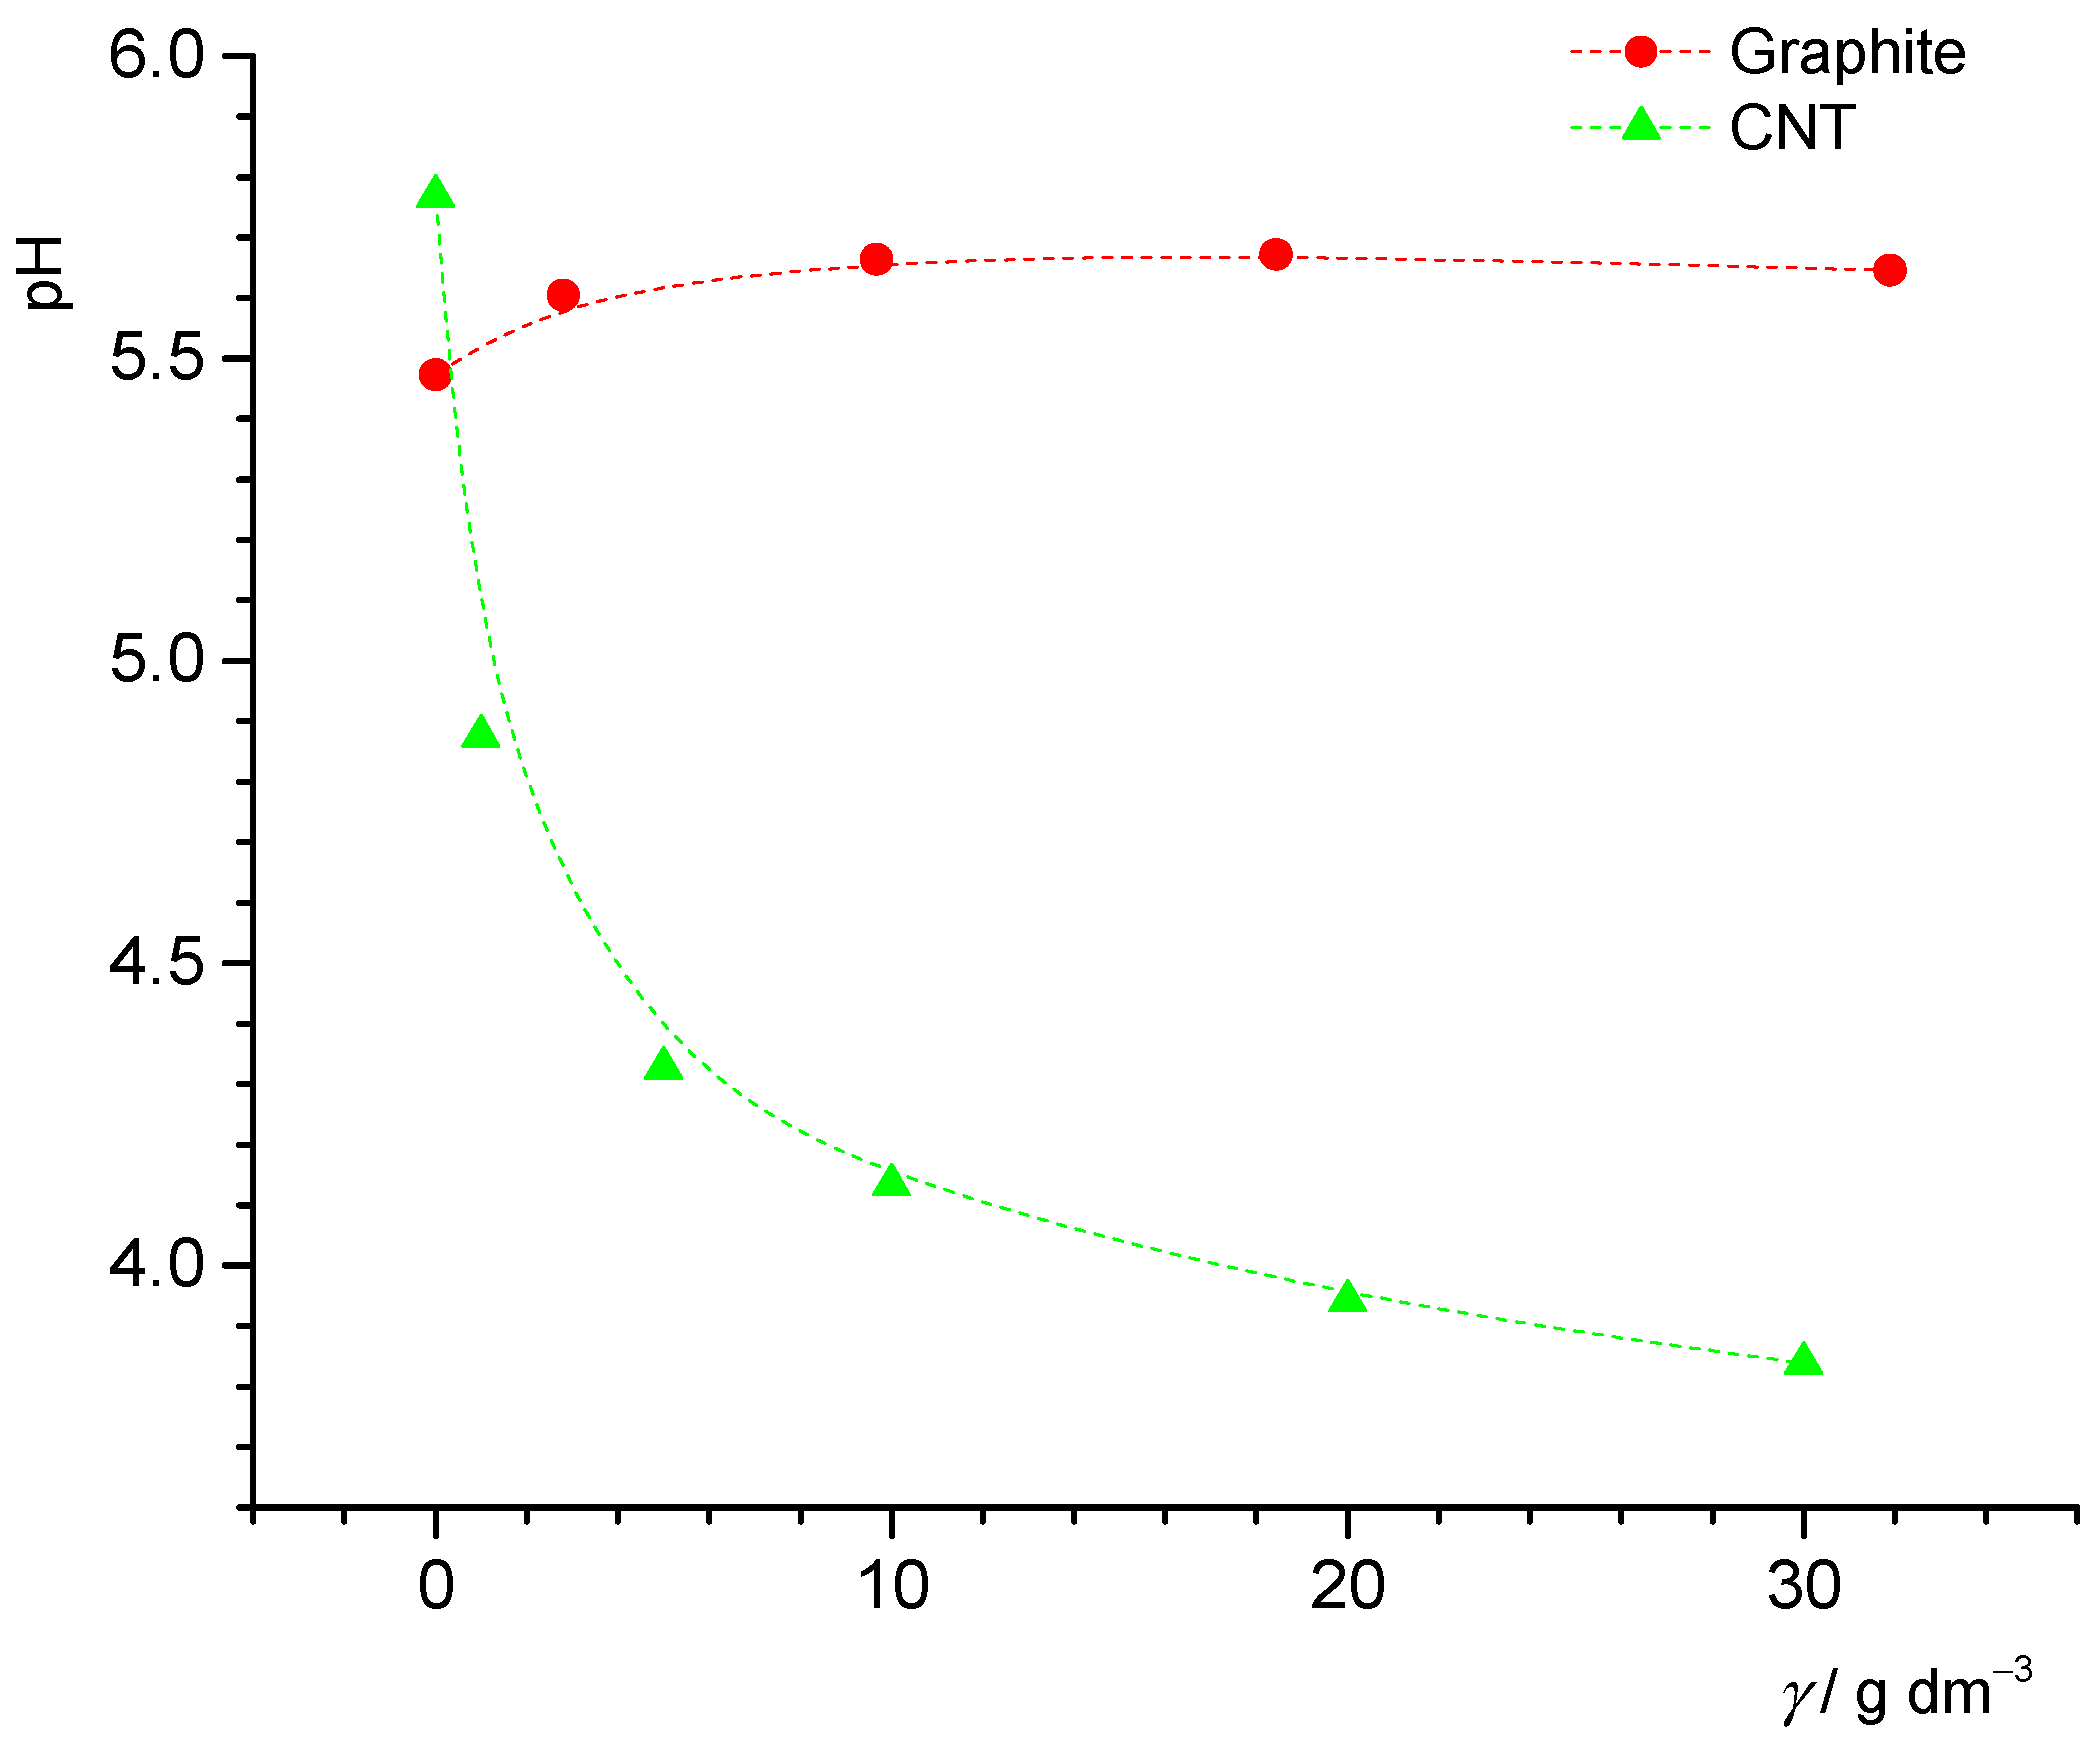
The point of zero charge (pH
pzc) was determined for graphite and CNT particles using potentiometric mass titrations. Continuous additions of solid particles were made to the NaCl(aq) solution, and it was assumed that the finally obtained constant value of pH represented pH
pzc. The constant pH was reached at mass concentrations 30 g dm
−3 in both cases. The measured pH values are presented in
Figure 4. The point of zero charge of graphite was pH
pzc = 5.6, somewhat higher than the value obtained by results presented in
Figure 3 (pH
pzc = 5.1). It should be stressed that two different graphite samples in two laboratories were analyzed. The mass titration curve determined in Zagreb (
Figure 4) shows that addition of dry graphite particles to aqueous sodium chloride solution led to increasing pH values. This result might suggest the presence of basic impurities in the graphite sample. However, the surface charge density curve (
Figure 3) has a wide plateau around the point of zero charge, which makes an accurate determination of pH
pzc difficult.
The point of zero charge of CNT obtained with two different methods, namely, potentiometric mass titration (pHpzc = 3.8) and potentiometric acid-base titration (pHpzc = 4.0), was in good agreement.
3.2. Electrokinetic Potential of Particles
At pH values where the trend towards less negative charges was quite clear in titrations, the electrokinetic data continued to show persistent negative values for PTFE-B-200 (
Figure 5). In both kinds of data, the scatter was relatively large. This has been observed in separate experiments as well, and has also been reported by others [
36], being potentially attributable to the difficulty to disperse the hydrophobic material or to changes in size (i.e., formation of aggregates that might settle and affect the measurements; in the experiments here, the size was not measured). In the paper by Marinova et al. [
36], data for xylene showed similar scattering at high pH and the absence of a clear trend to zero mobility at low pH in 1 mmol dm
−3 NaCl. This has been observed in separate experiments as well and is attributed to the difficulty to disperse the hydrophobic material. Additional experiments have been carried out where the PTFE particles were initially dispersed in ethanol and subsequently transferred to an aqueous solution, resulting in better dispersions [
32]. This yielded similar results, but the scatter of the data persisted. Even with such a suspension, once the amount of ethanol was decreased (as checked by IR spectroscopy), the dispersion became worse.
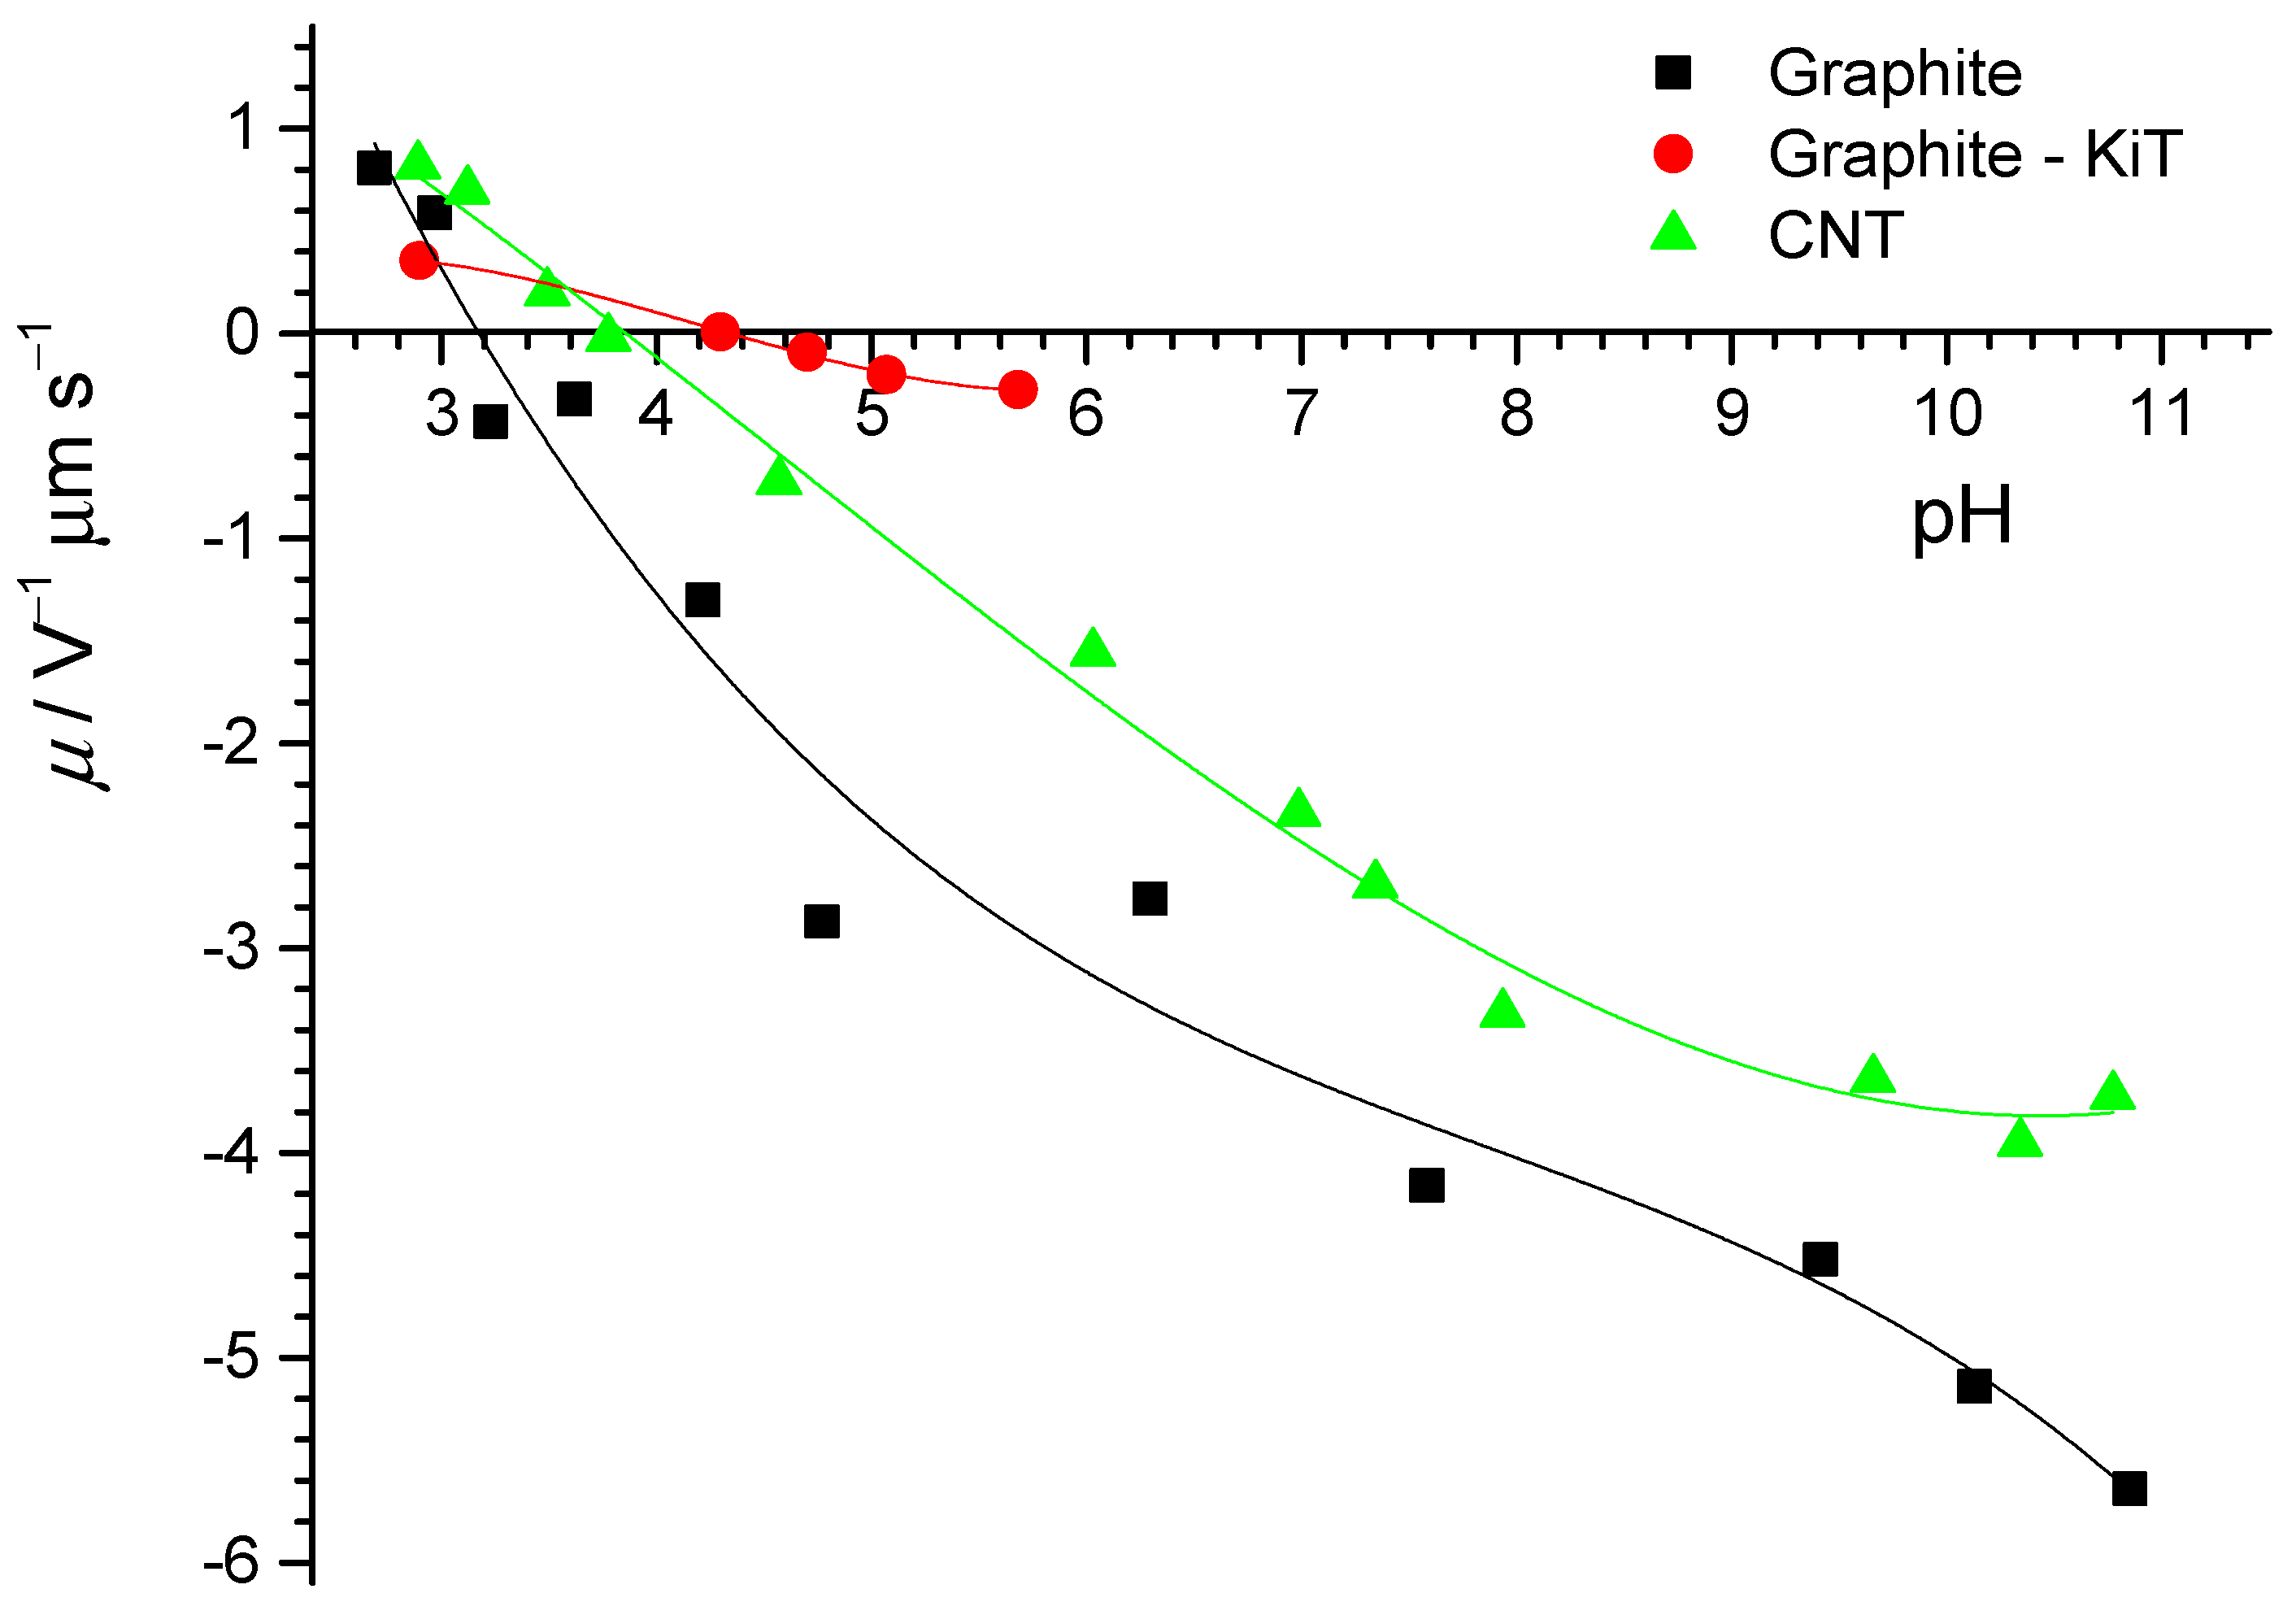
The electrophoretic mobilities of the two different graphite samples and the CNT particles in NaCl(aq) suspension at various pH values are presented in
Figure 6. The IEPs of the graphite samples were found to be about pH
iep = 4.2 (KTI laboratory) and pH
iep = 3.2 (Zagreb laboratory). This shift is opposite of that observed for the shift of pH
pzc obtained for two graphite samples, which indicates the adsorption of anions on graphite surfaces. Nevertheless, the isoelectric points of the graphite and CNT particles were in the same range as other inert surfaces (3 < pH < 4). The IEP of the graphite particles (Zagreb laboratory) was in agreement with measurements of the hydrodynamic radius as a function of pH (see
Appendix A,
Figure A4).
Concerning the electrophoretic mobility of graphite and CNT particles, we found no crossing in the studied pH range, which would allow us to fully compare these datasets. Lower values of the electrophoretic mobility of graphite particles and their lower value of pHiep could be explained, as in the case of PTFE electrokinetic potentials. Moreover, the lower electrophoretic mobility of the graphite particles could have been the result of asymmetric counter ion association on graphite. Unlike PTFE, where the surface is fully chemically inert and has no detectable contamination (see later), graphite often contains oxygen groups that attract ions from aqueous solution. It could in particular be possible that carboxylate groups exist in these carbon-based particles. The presence of carboxylate groups should result in low isoelectric points as well.
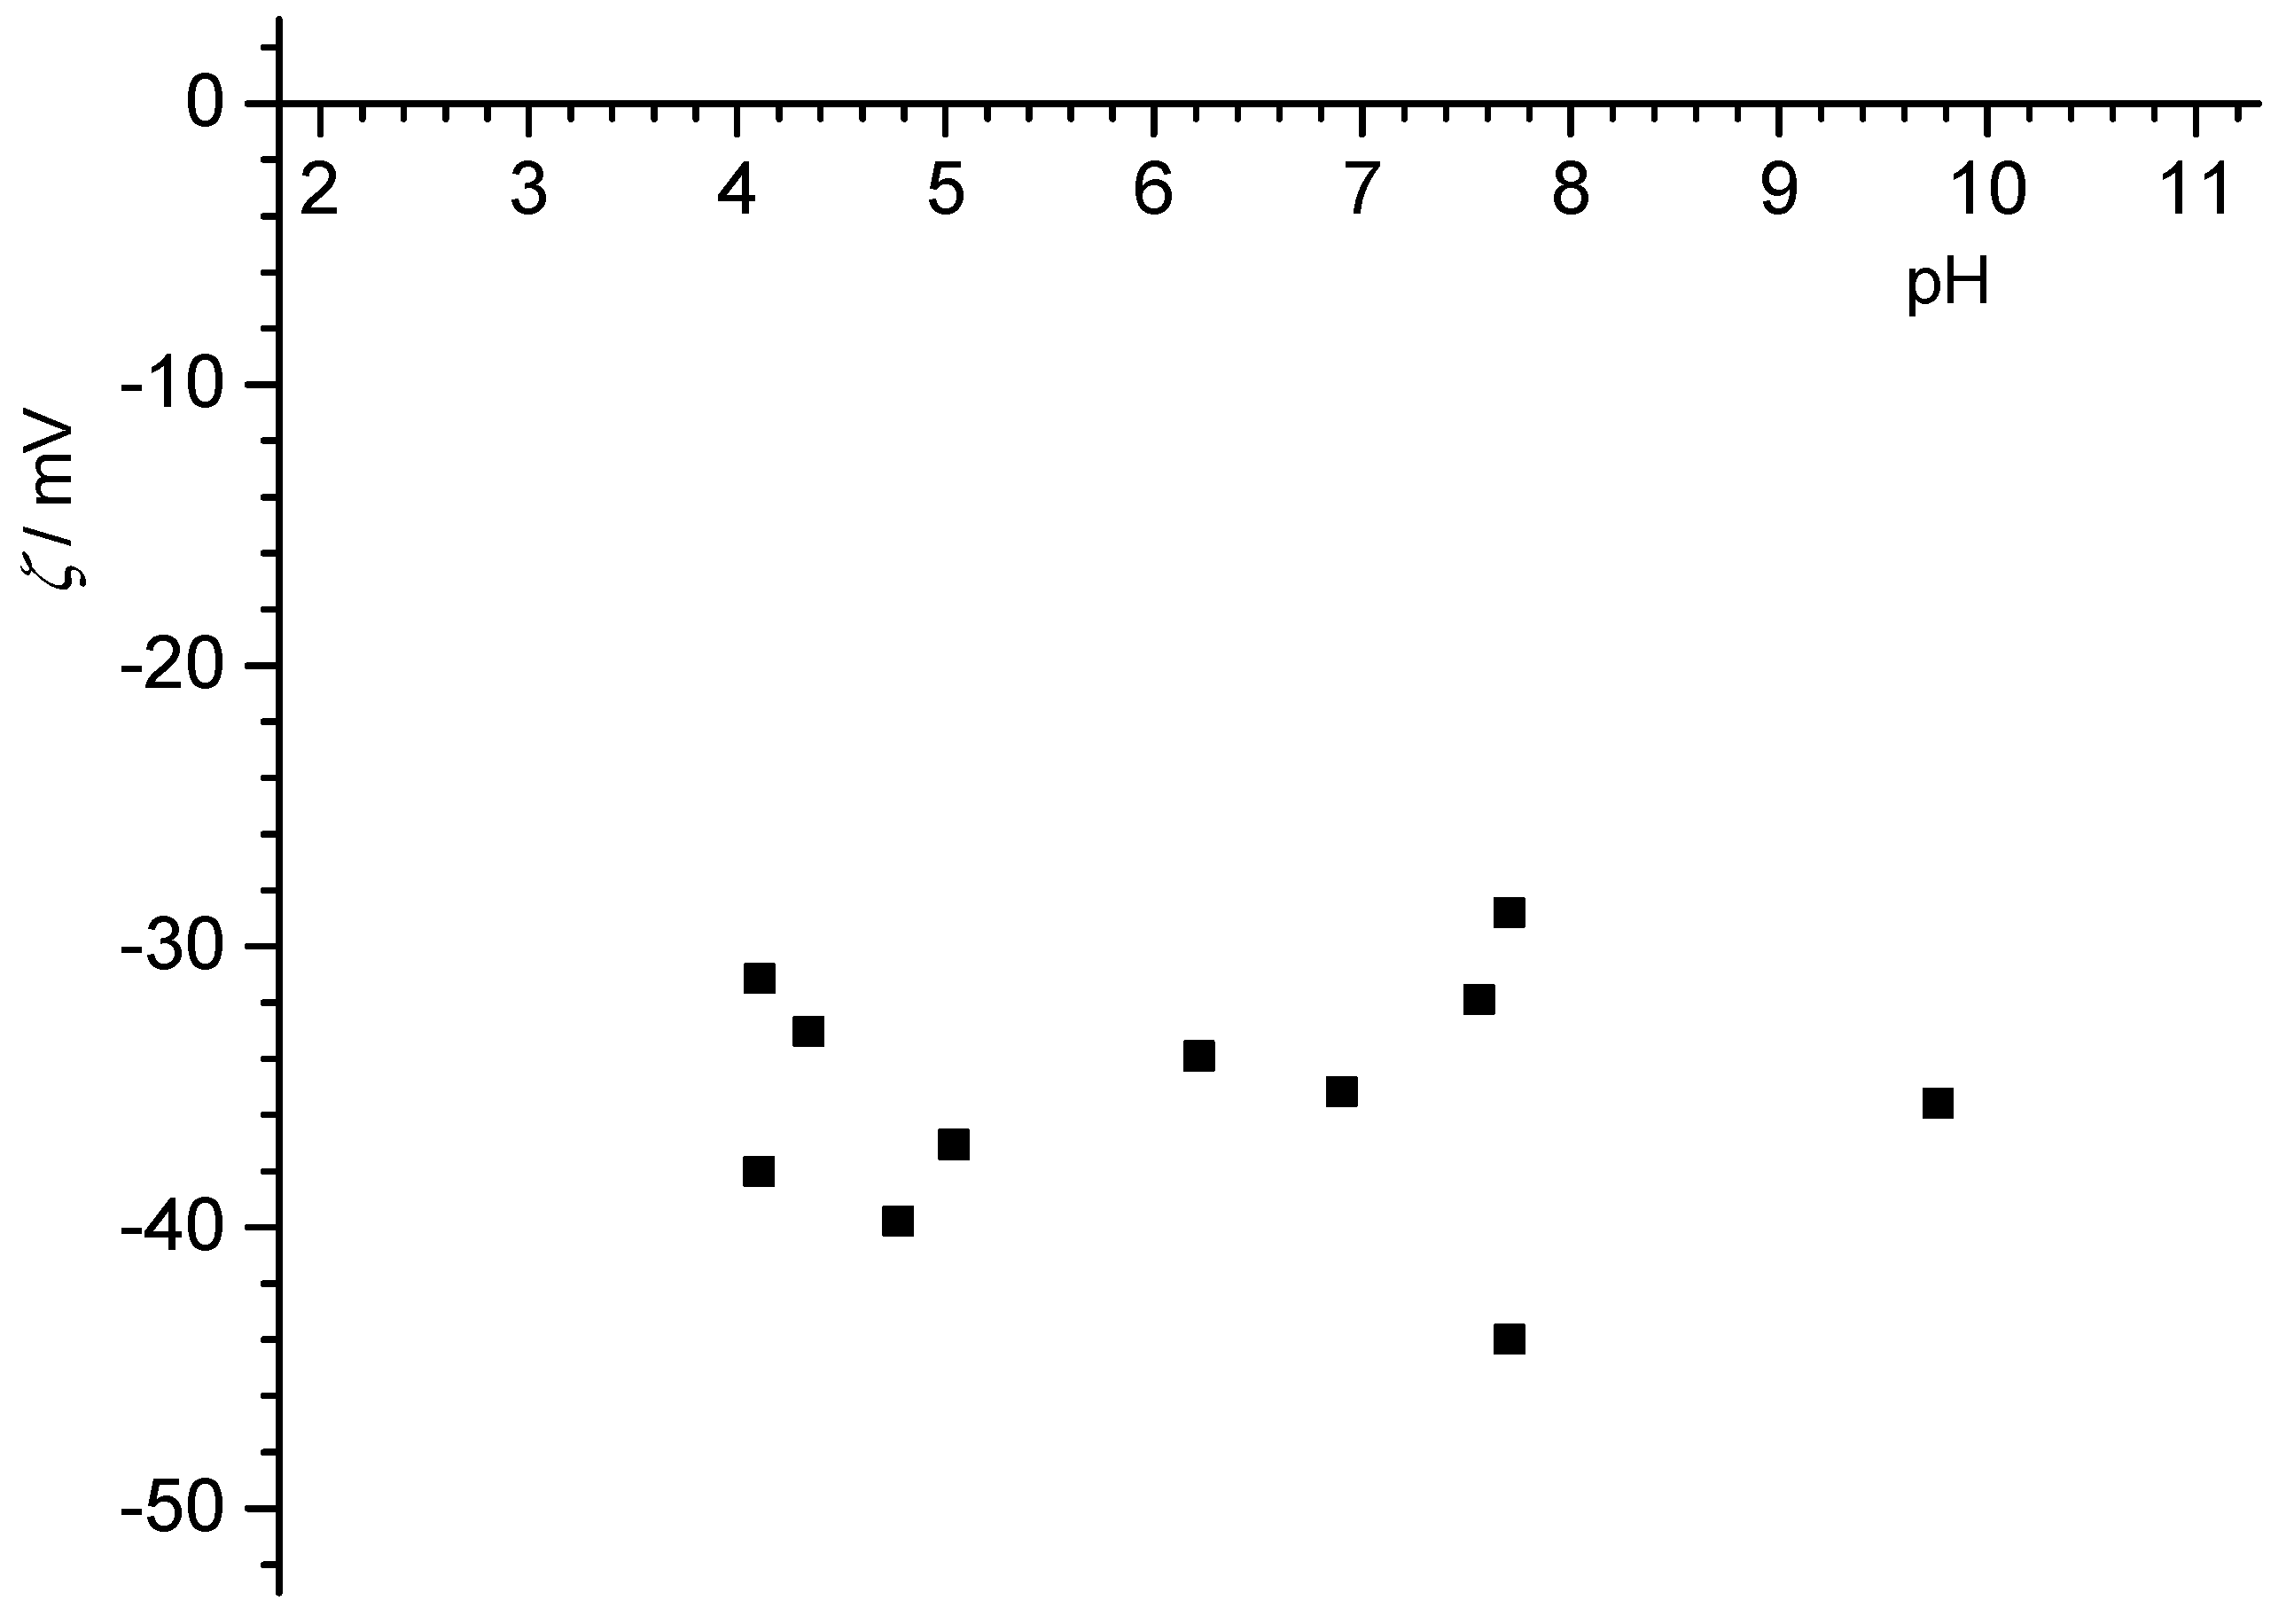
For graphite particles, the electrokinetic potential can be calculated using the Smoluchowski equation, which then allows comparison between flat graphite samples and graphite particles. At a neutral pH, the calculated electrokinetic potential of graphite particles was ζ ≈ −45 mv, which is much more negative than the electrokinetic potential of the flat graphite surface. The electrokinetic potential of graphite particles is in the range of the electrokinetic potential for the graphene surface. Despite this difference, the pHiep for graphite particles and flat graphite was similar. It indicates that the same amount of hydronium ions is needed to neutralize the interfacial water layer.
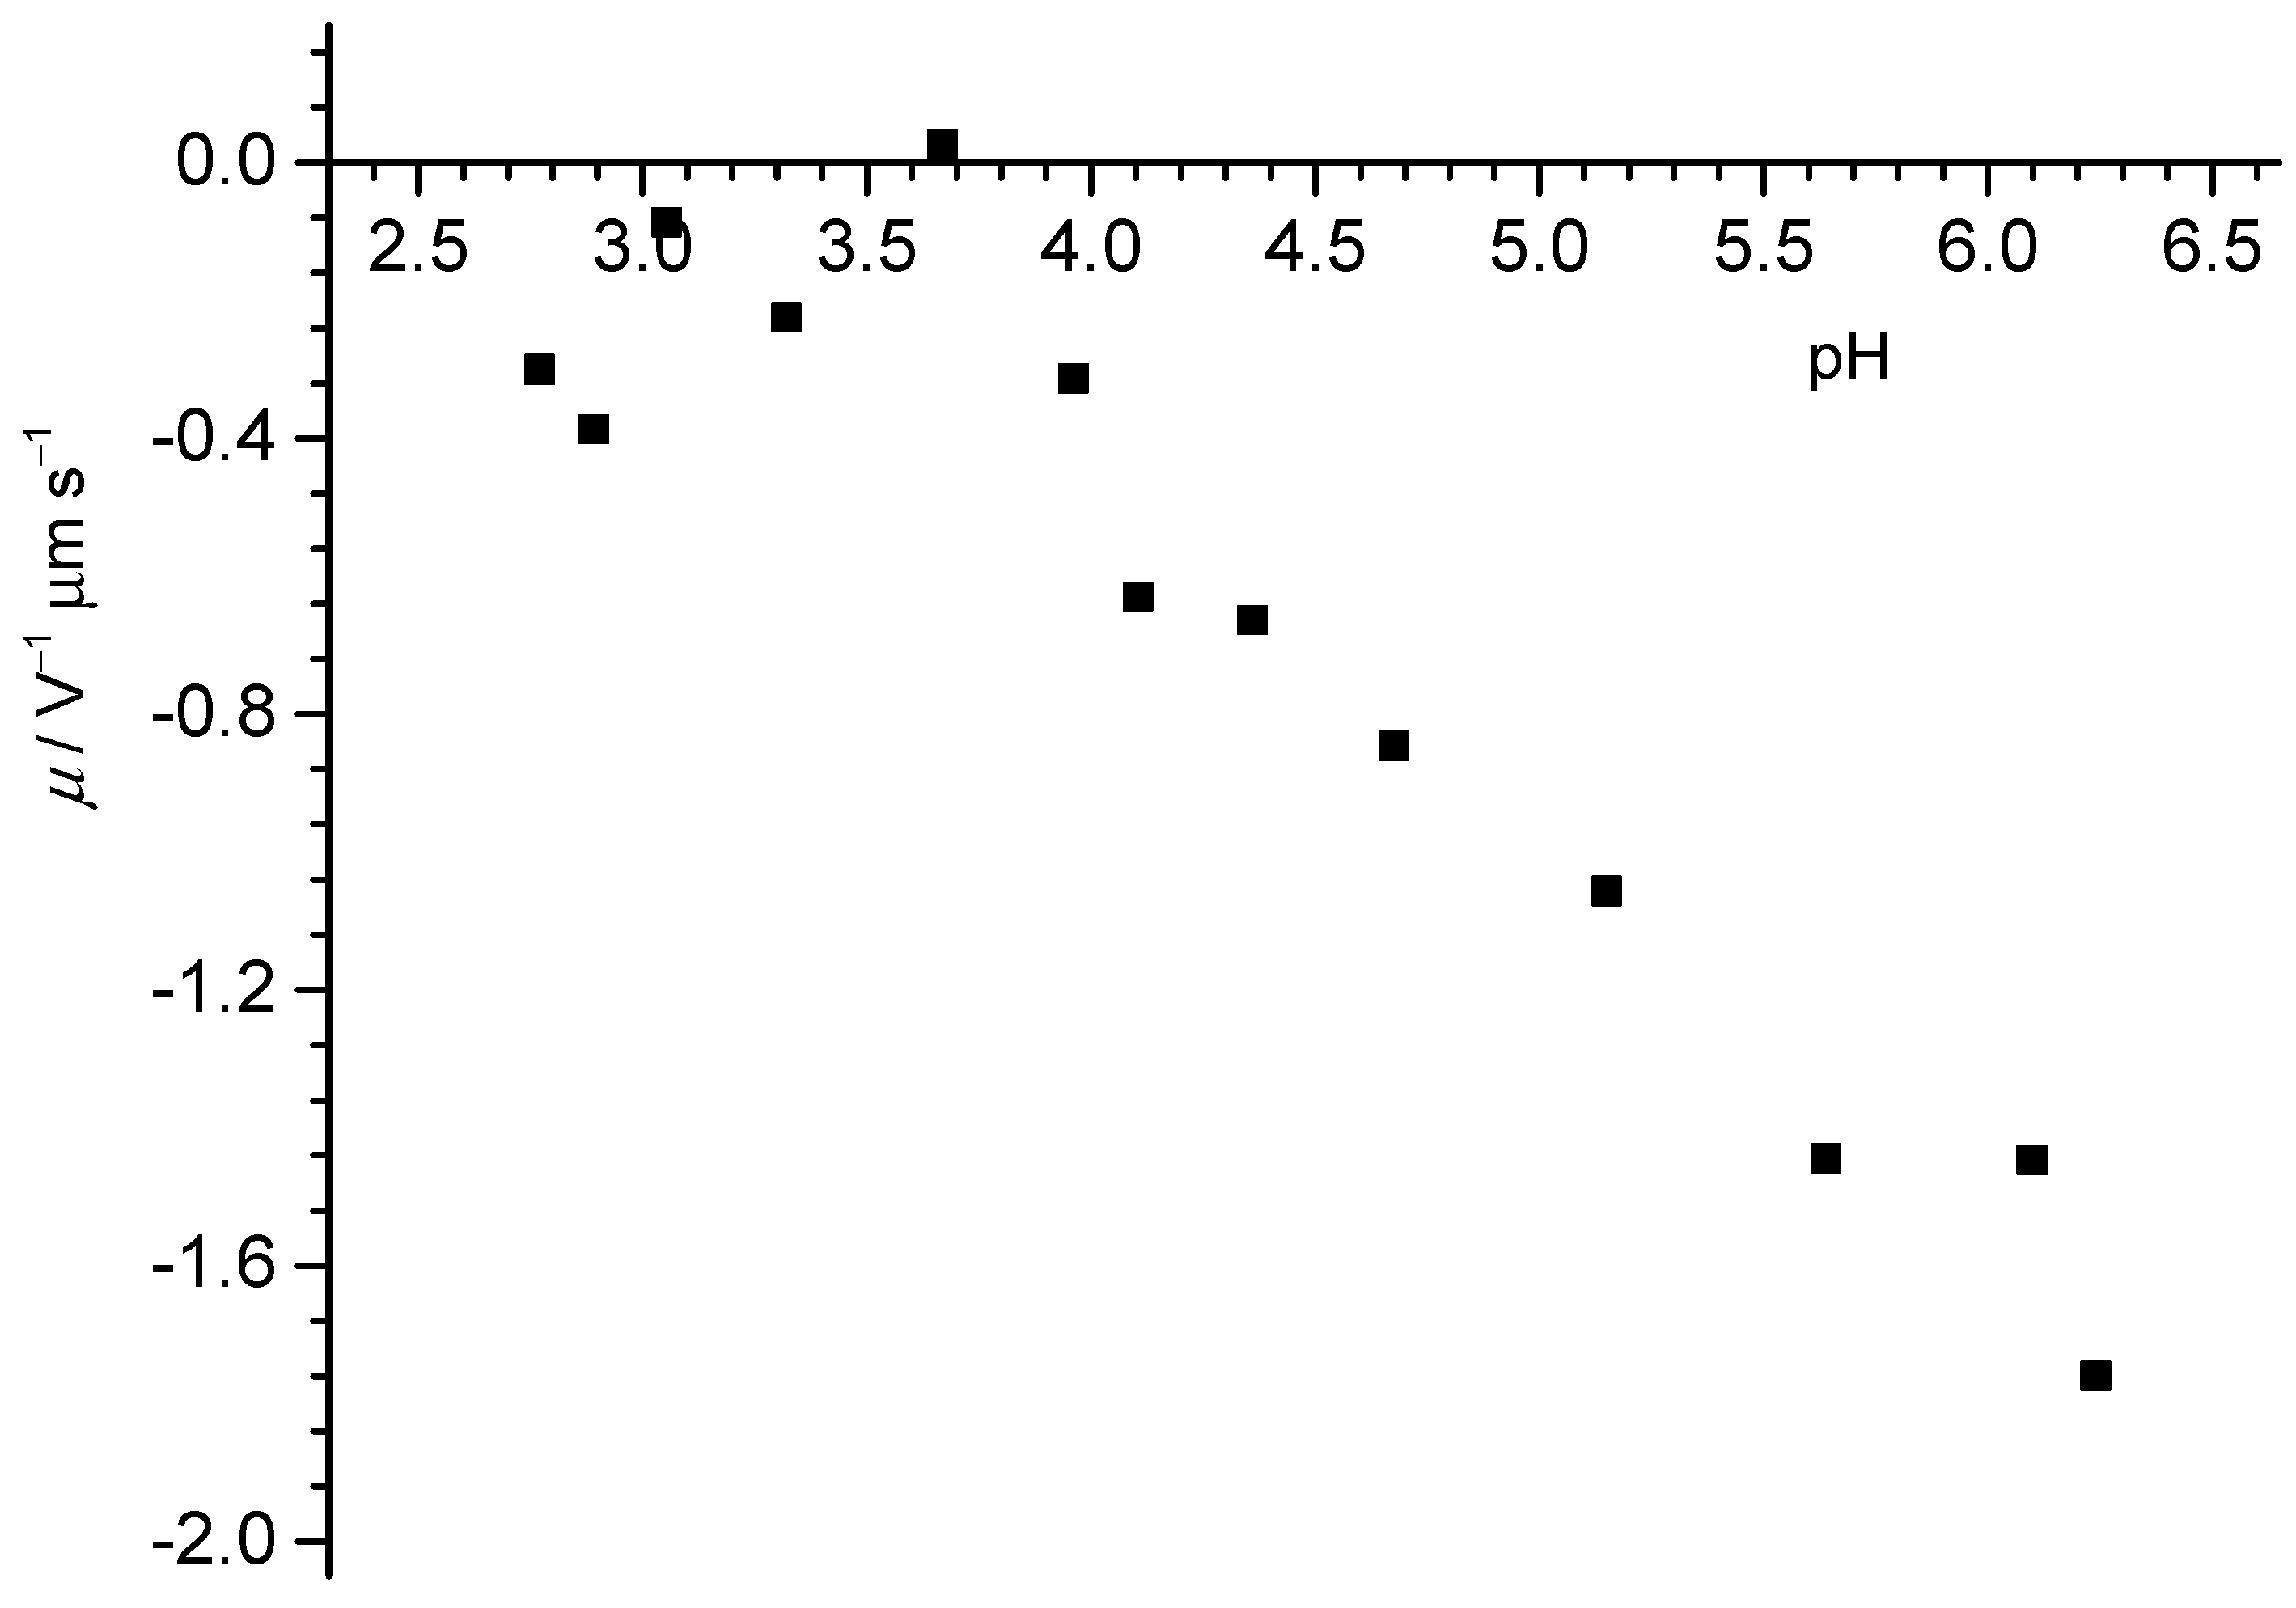
The electrophoretic mobility of the hydrophobic silica particles (HKD20-P) is presented in
Figure 7. The IEP was close to pH 3, in the range of other inert surfaces. As for the PTFE particles, there was significant scatter in these data.
Interestingly, the electrokinetic data showed a lower IEP (for HDK-H20P, the IEP was below pH 4, for H-PGC, it was at pH 4.1) than what we inferred for the point of zero net proton charge from the titrations. Again, this is comparable for some of the samples studied in Zagreb and at KIT for the particles. It also is comparable to the differences observed by Chibowski and co-workers for the ice surface, where an IEP near pH 3.5 and a point of zero net proton charge at pH 7 [
29] was obtained. The same authors reported an isoelectric point of 3.3, and the point of zero net proton charge was 6.3 for hexadecane [
29]. While this agrees with our observations (i.e., significantly higher points of zero net proton charge than isoelectric points), for some samples, we stress again that the continuous titrations yielded relative charges and thus the obtained points of zero charge are subject to debate. Moreover, the calculation of the absolute charges is only possible through book-keeping of the charge. Since we know how much titrant was added to initially increase the pH, the point of zero net proton charge can be calculated. This can be easily falsified by contamination of the NaOH solution by carbon dioxide, which is almost impossible to avoid. Thus, the proton balance is questionable as soon as base titrants are involved.
3.3. Electrokinetic Potential of Flat Surfaces
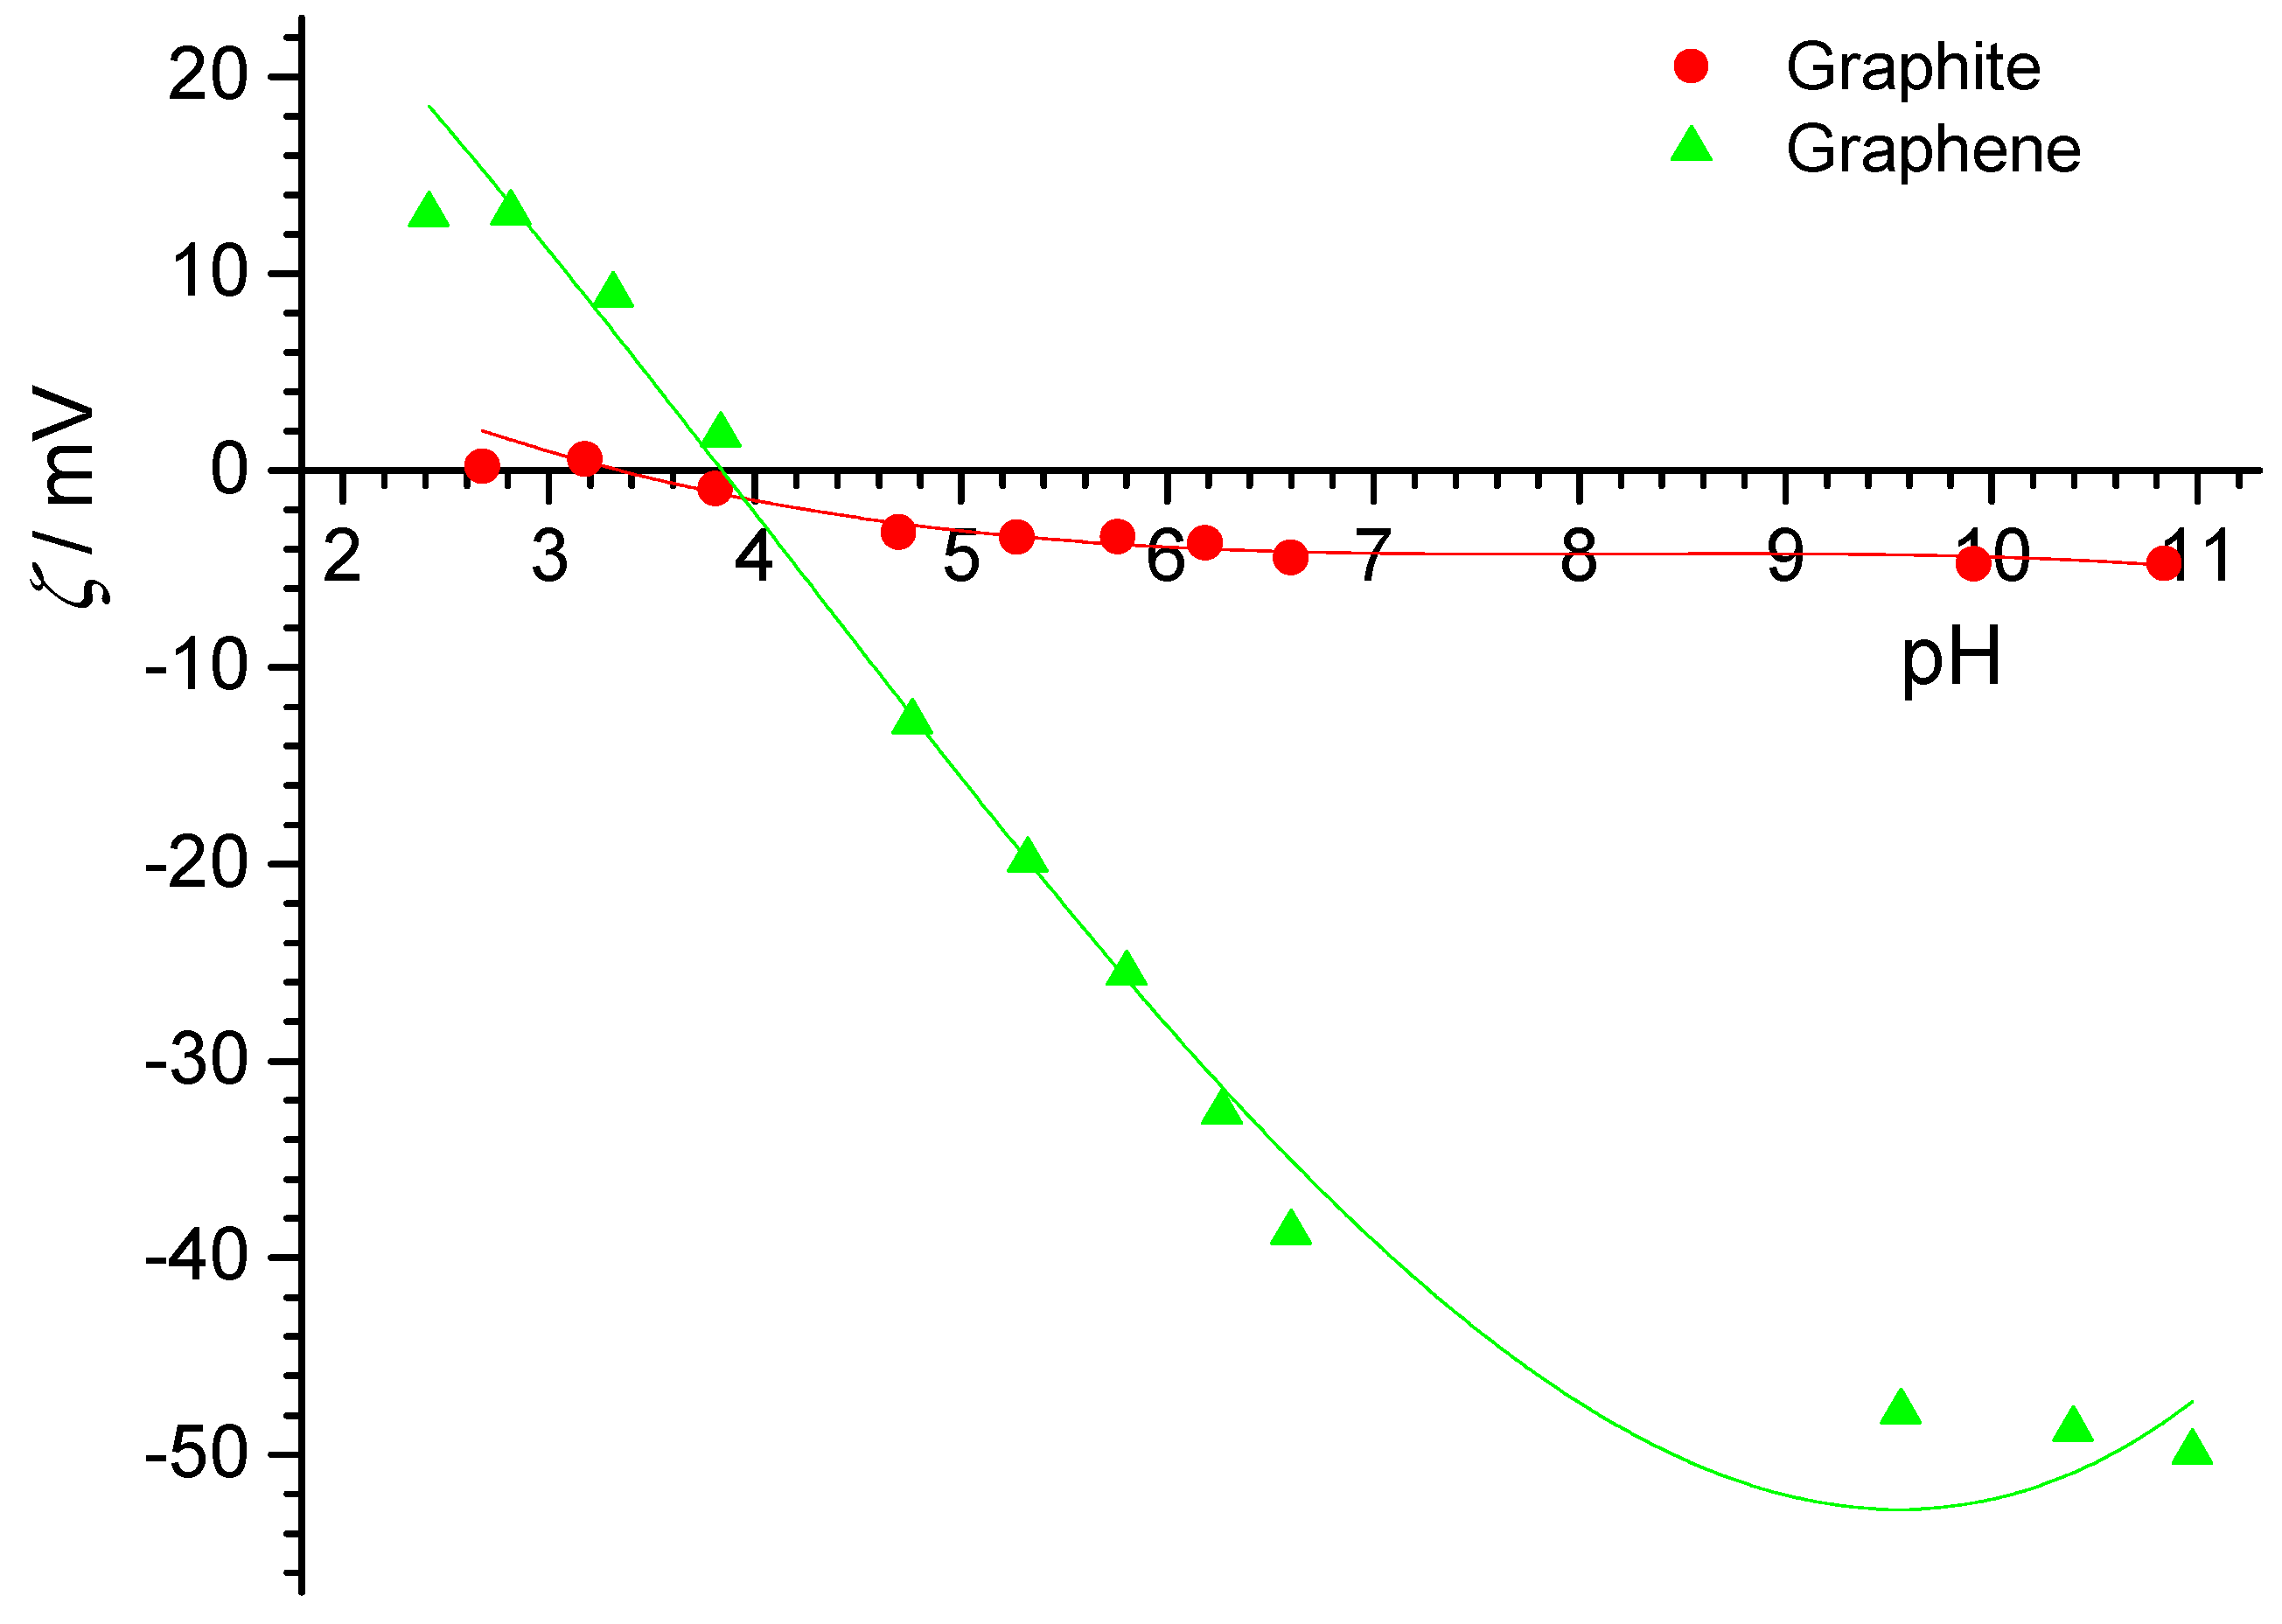
The obtained values of the electrokinetic potential at various pH values for graphite and graphene flat surfaces are presented in
Figure 8.
The determined pH
pzc for the graphite particles was much higher (pH
pzc = 5,6,
Figure 4) than determined values of the pH
iep. This suggests that the surface of the graphite particles contained oxygen groups, as previously discussed in the context of electrophoretic measurements. The presence of these groups on the surface of the graphite particles caused other ions to have affinity toward the surface, which in turn caused pH
iep to be at lower values then pH
pzc.
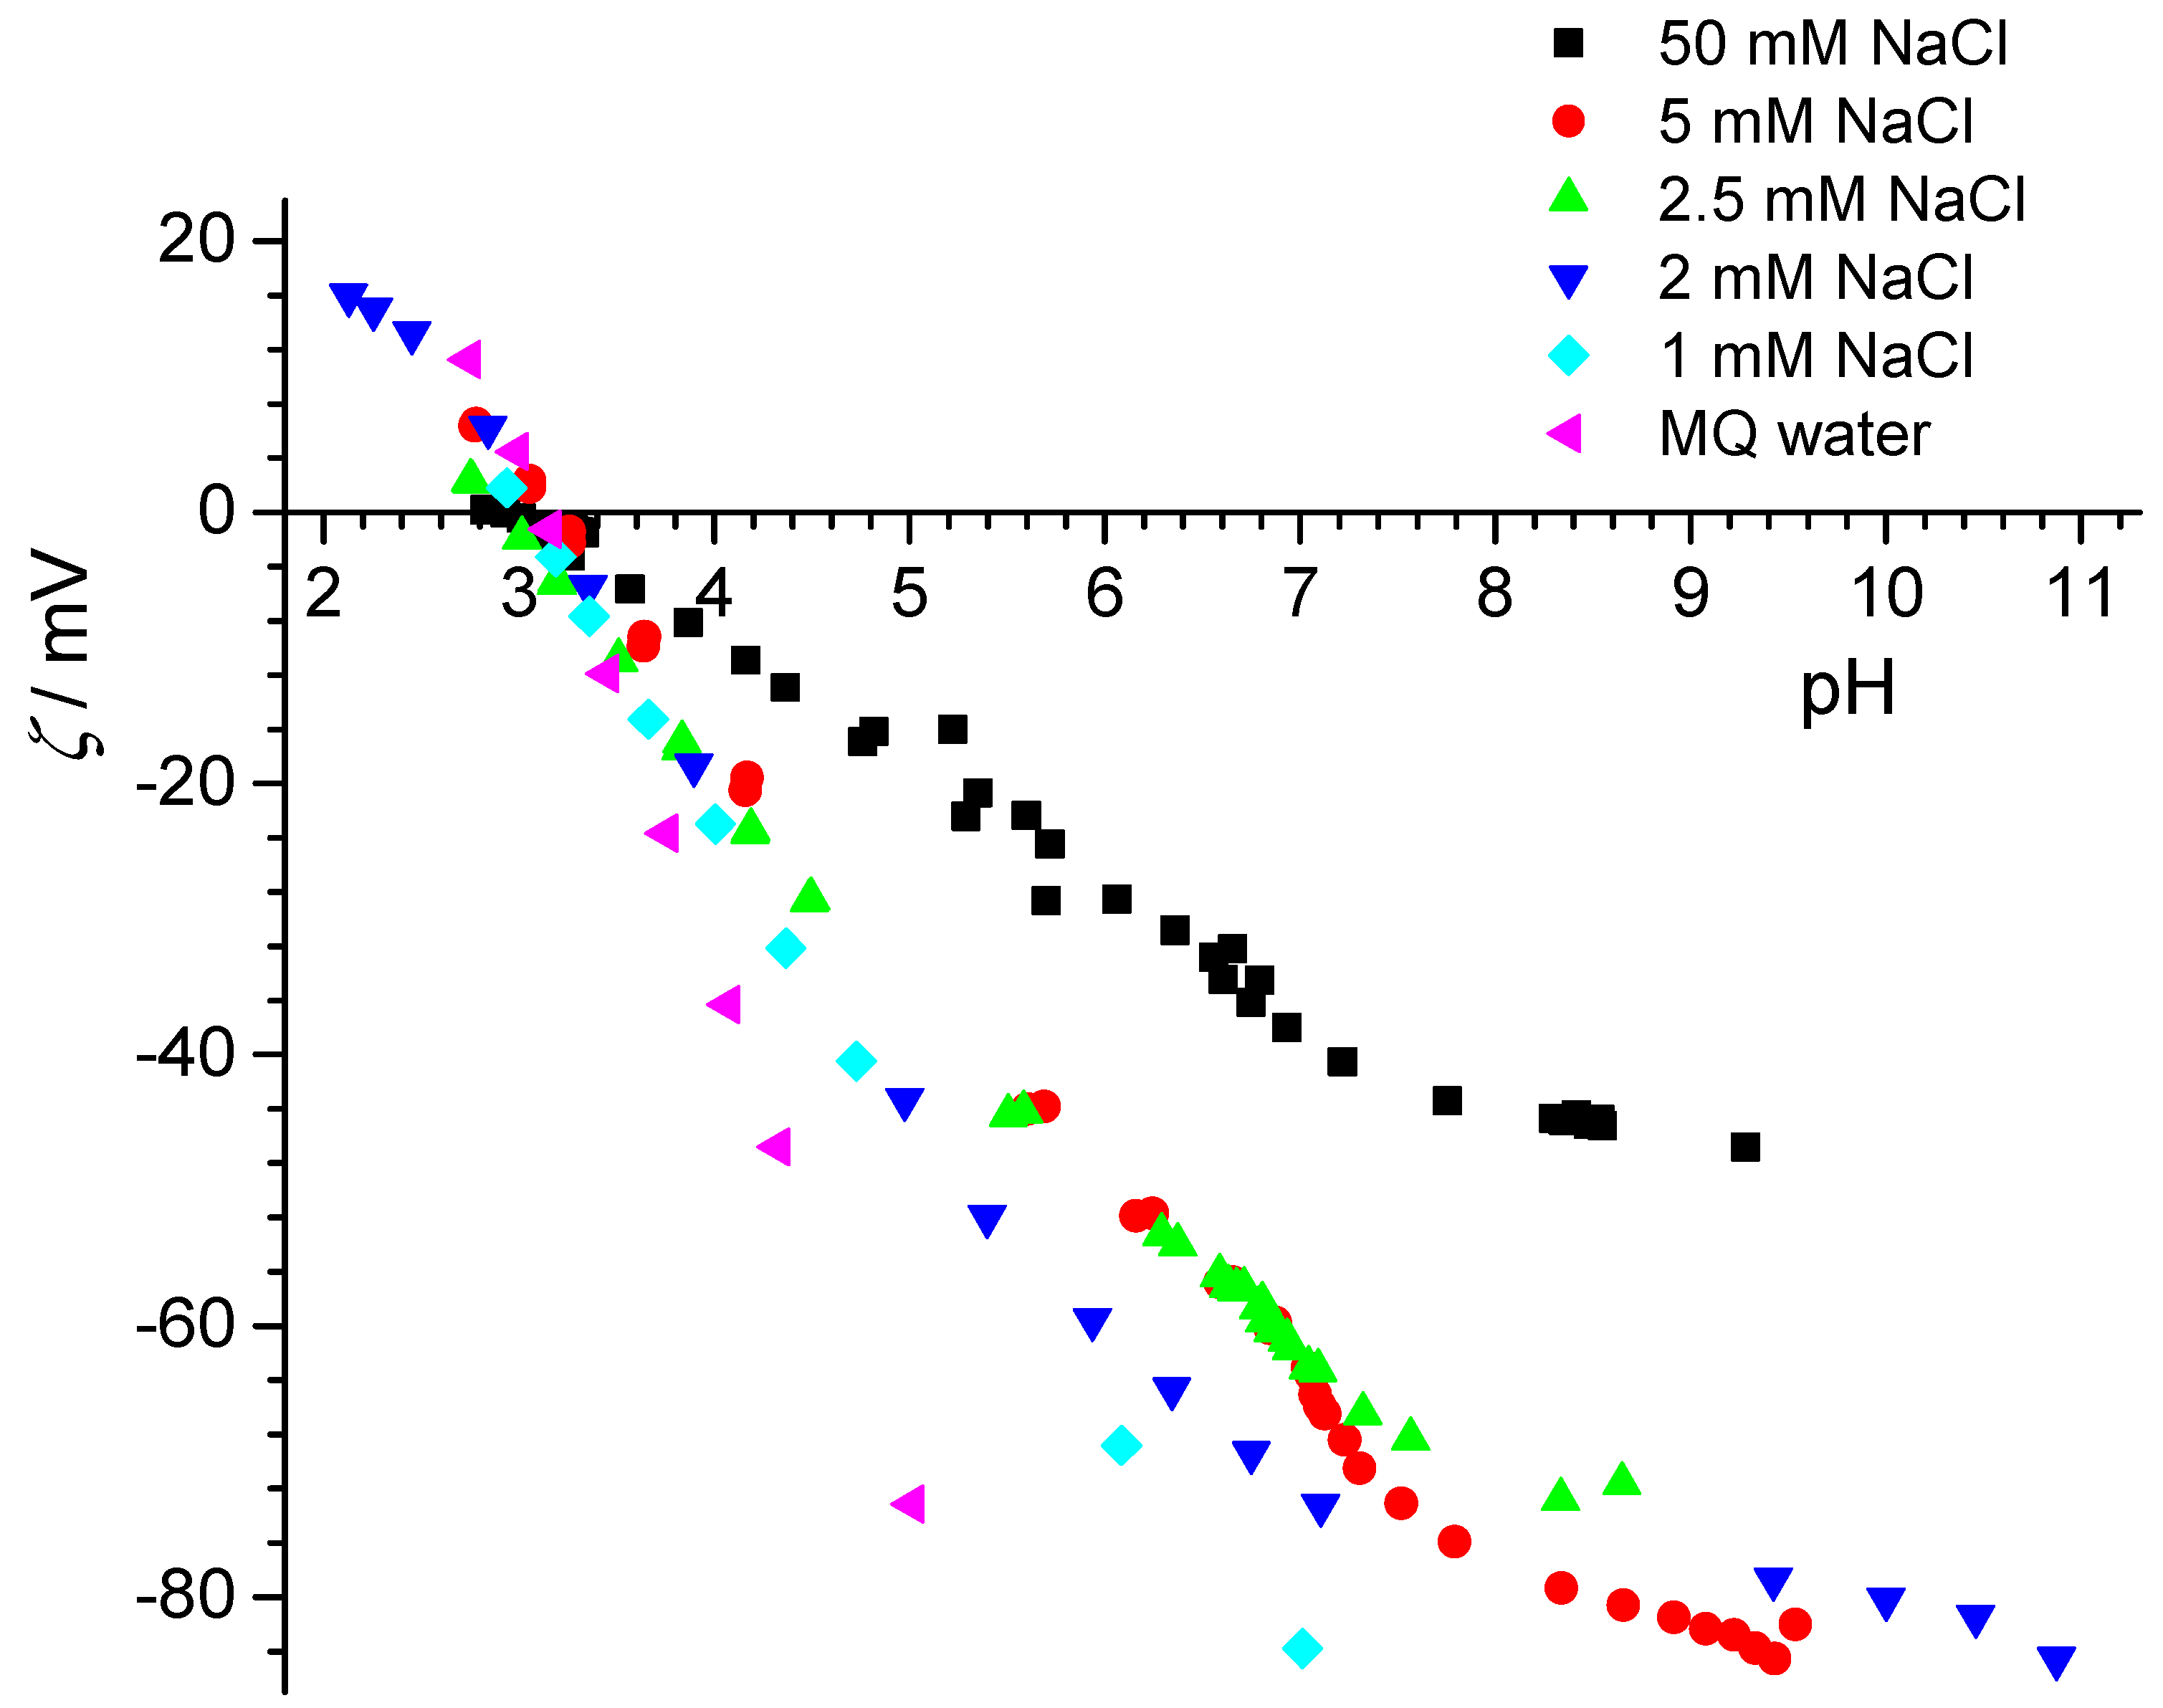
Electrokinetic potentials of PTFE flat surface were also determined by means of streaming potential measurements in two laboratories and were in very good agreement (
Figure 9). The isoelectric point was at pH
iep = 3.1 and did not depend on sodium chloride concentration. These results were also consistent with results for isoelectric point and point of surface charge obtained for PTFE particles. The electrokinetic potential was negative at neutral pH (pH ≈ 7), which was explained by the stronger affinity of hydroxide ions (than hydronium ions) toward the inert PTFE surfaces.
Overall, the graphite surfaces did not show classical zeta-potentials, with the far too low magnitudes observed with increasing distance from pHIEP, while conventional behavior was observed for the PTFE samples.
The points of zero net proton charge matching the values of point of zero charge and isoelectric point indicate that asymmetric adsorption of counter ions did not play a significant role on these surfaces.
Since the data for PTFE were very consistent, we focused the XPS investigations on the PTFE particles. These are discussed in the following section.
3.4. XPS Measurements
Table 2 contains the results of XPS measurements of the PTFE particles and cryo-XPS measurements on the particles after having been in contact with a defined solution.
Table 3 contains the precise compositions of these solutions.
The results indicate that the oxygen content at the surface of the PTFE powder was below detection limit (bdl). Thus, there was no detectable impurity on the powder. When this powder was exposed to neat water, the composition of the retrieved powder did not change, i.e., the powder did not take up detectable amounts of persistent contaminants from MilliQ water. A similar result was obtained when the particles were exposed to a 100 µM NaOH solution (sample #3). Interestingly, in the presence of NaCl, oxygen was detected in the system. The signature of the oxygen concurred with the signal from water/ice. In these cases, also a signal from a hydrocarbon component in C 1s spectrum was recorded, which hinted at some adventitious carbon (i.e., a contaminant). Overall, no detectable contamination occurred in pure water, and thus we presume, on the basis of the recorded data, that the charging in such systems does not arise from contaminants. The problem now lies in the detection limits and how much would be required to cause the buffering of the concentrated suspensions at pH 3. Thus, would it be possible to detect the undetectable [
17]? From previous mass titrations in KCl [
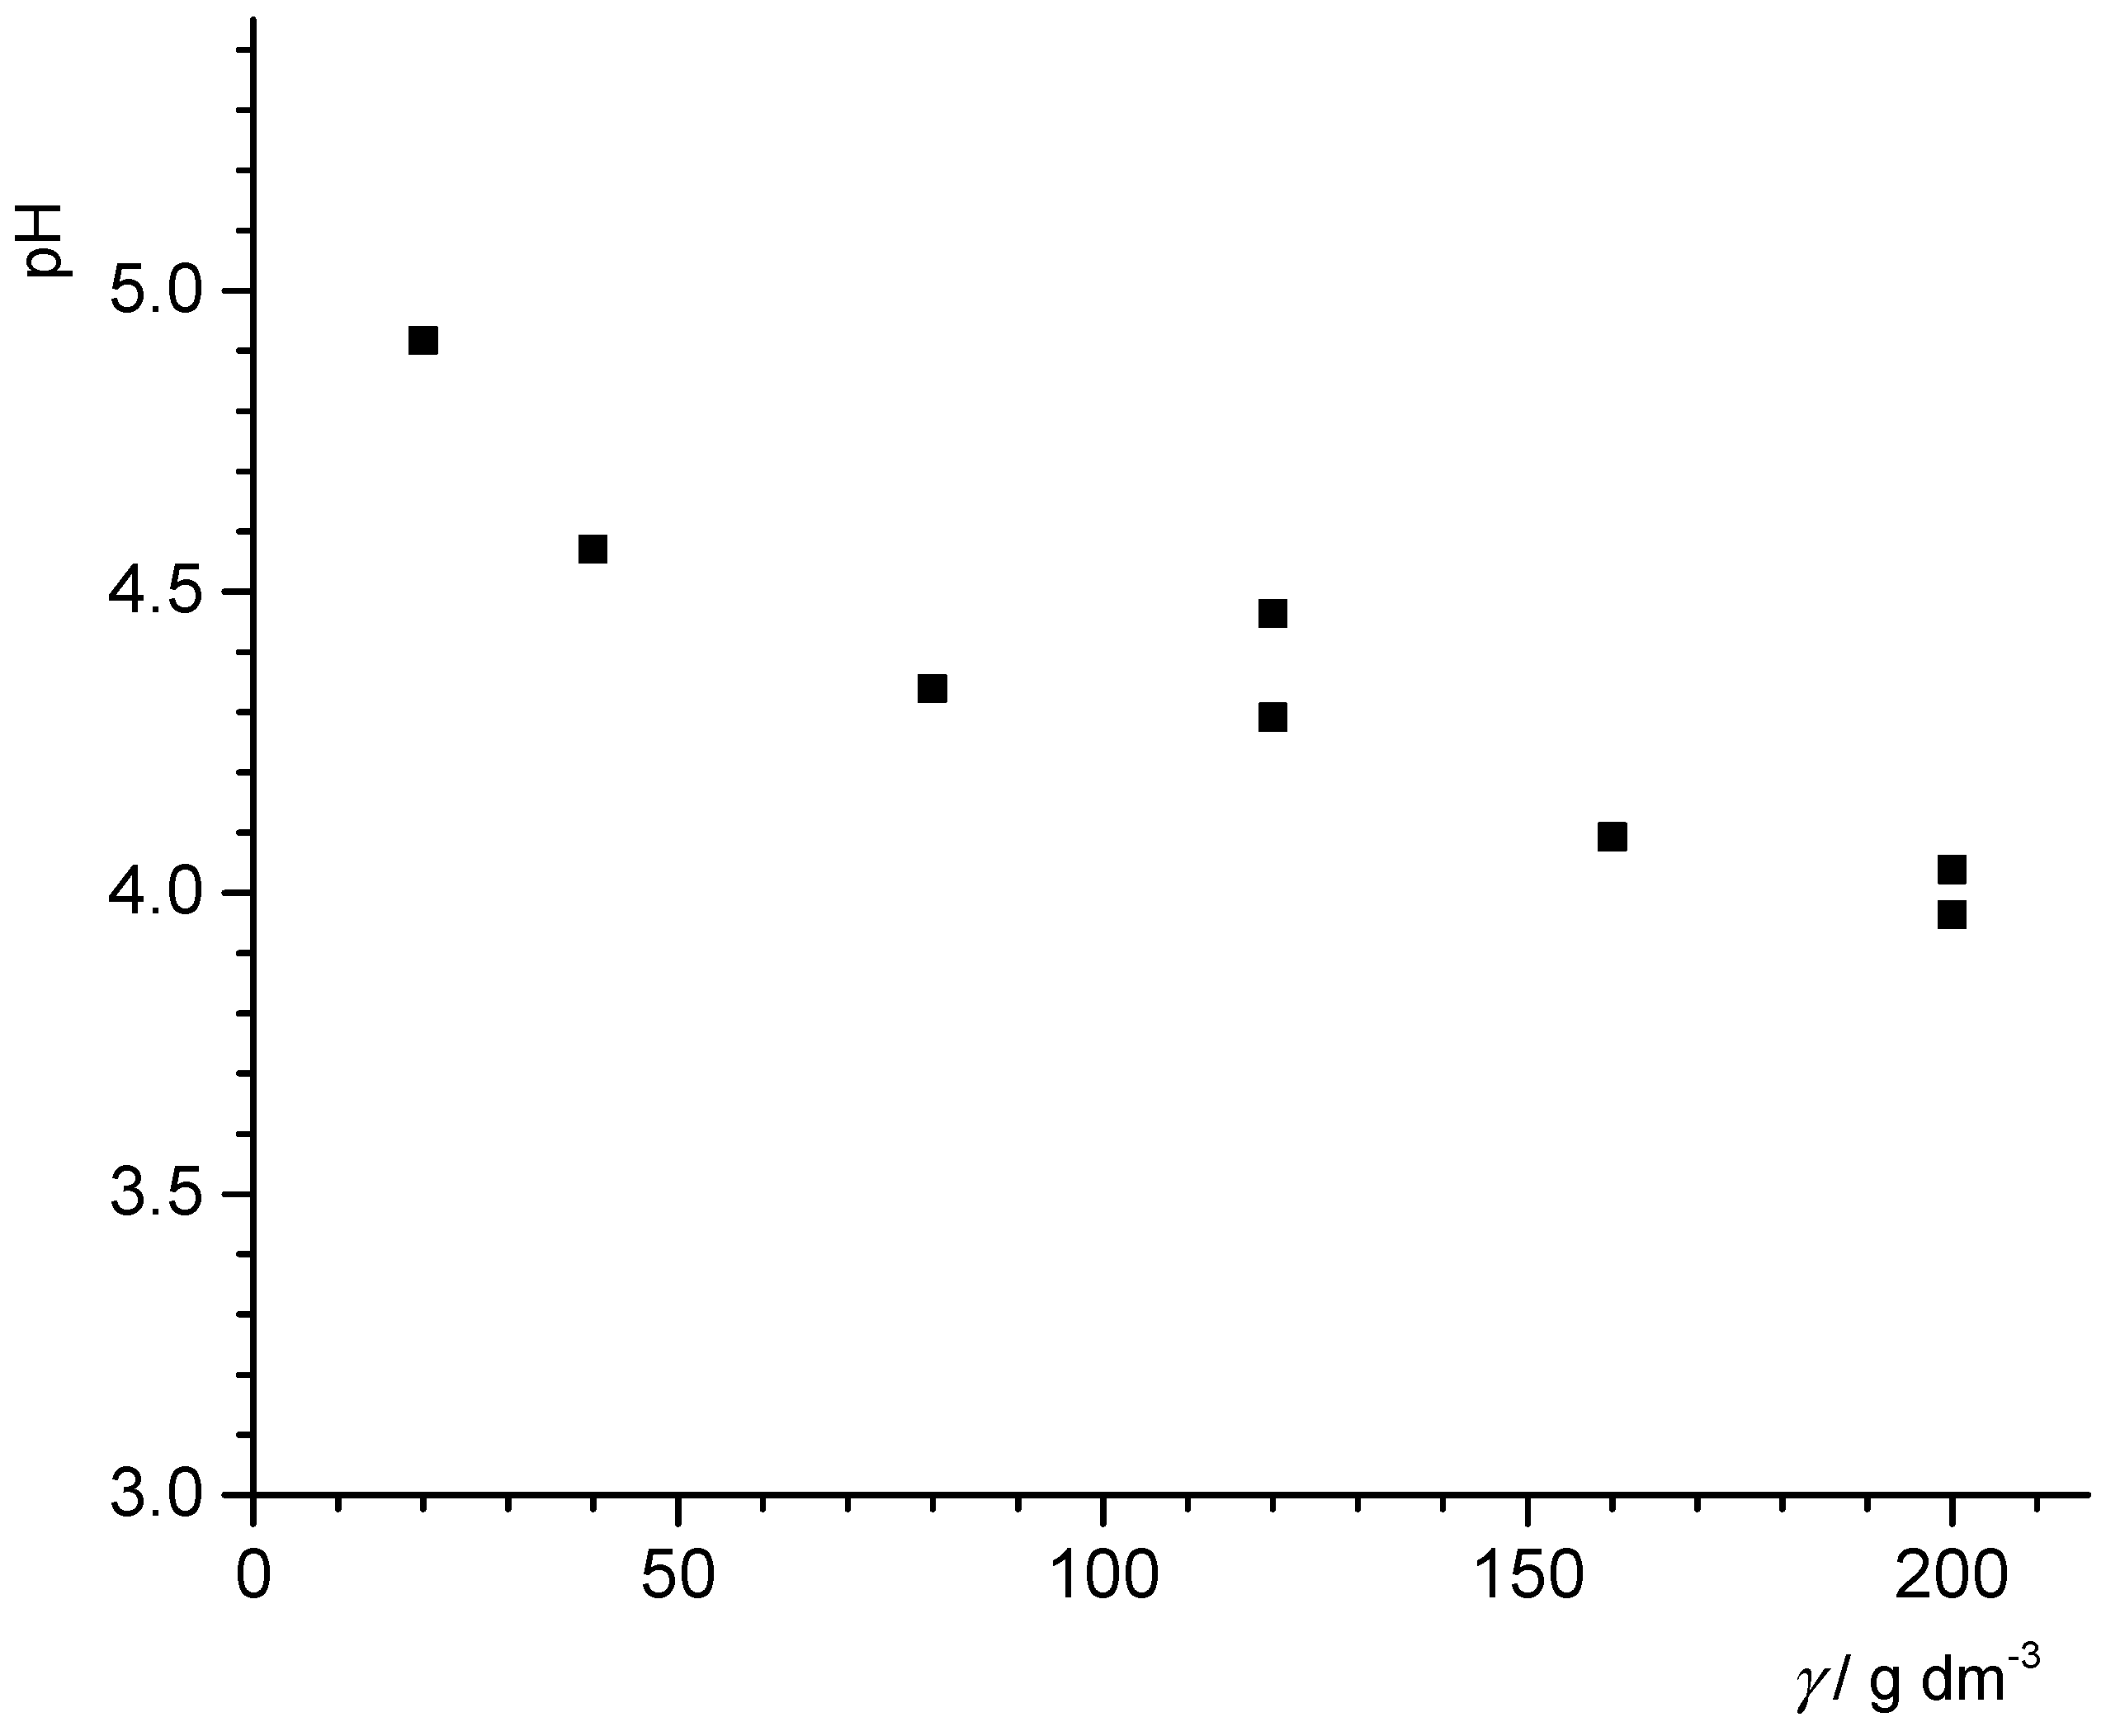
32], the lowest pH should be reached with 200 g/L of the PTFE powder. A mass titration involving the PTFE powder at different concentrations in MilliQ water showed that at 200 g/L, the pH was 4 (see
Figure 10). Assuming the XPS detection limit of 0.1% of a monolayer and further assuming for oxygen in particular that each contaminant oxygen can release one proton, we estimated that for such a system, a pH value of 4.3 should be obtained at most. This would support the idea that contaminations are not responsible for the drop, more so since for carboxylate groups, two oxygens release one proton. However, the theoretical detection limit is probably lower than what usually has to be assumed in practice. With 1% of a monolayer, for example, and assuming that two oxygens release one proton, the pH that could be reached would be 3.6, i.e., lower than the value measured. Unfortunately, the results are not entirely conclusive, and thus the debate must continue.
As for NaCl-containing solutions, the situation is even more ambiguous, since there is measurable oxygen. In this case, we cannot at all rule out the occurrence of contaminants (potentially from the salt) that would provoke the stronger decrease in pH. The initial idea of these experiments was to assess the presence of hydroxide ions in the fast-frozen samples. However, it turned out that most of the water disappeared, and no trace of hydroxide ions was found.
4. Conclusions
In summary, we collected various new sets of experimental data for inert surfaces in electrolyte solutions.
Table 4 summarizes the points of zero charge obtained in this study with different materials and various techniques in two different laboratories.
In general, our electrokinetic data confirm the low isoelectric points at pH < 4 for such systems. The effect of salt on the electrokinetic data was as expected. Titrations showed various features that were not expected—the batch-type titrations of PTFE-B-200 did not show any salt dependence of the proton-related surface charge, different from what was observed on hydrophilic surfaces with protonable groups, where higher salt content resulted in increased protonation or deprotonation for a given pH; the titration data for two other inert materials exhibited several changes in slope of the charging curve, which was again different from the typical shapes of titration curve for variable charge minerals. Finally, mass titrations in some systems yielded low end points, in the vicinity of the isoelectric point. However, notably for graphite and the hydrophobic silica, these end points and estimated points of zero charge from continuous titrations were clearly higher. At present, the different observations cannot be interpreted in a simple way. The higher mass titration end points could stem from the respective degrees of hydrophobicity. For example, the graphite samples could contain some (de)protonable groups or the hydrophobic silica could include some silica contribution. However, such groups, in particular carboxylate groups, should lead to low points of zero charge, while the values were higher than expected. Graphite data cannot be easily reconciled with points of zero charge varying between shape and origin of the substrate and the methods. Contrary to this, PTFE data were very self-consistent. The XPS investigation on the PTFE powder did not indicate the presence of contaminants. Even after contact with MilliQ water, no contaminations were detectable. On contact with NaCl containing solutions, new signals were found. Considering the XPS results, the possible number of contaminants on the PTFE-B-200 in terms of estimates of the theoretical XPS detection limit suggest that they should have been observed if the low pH of a given suspension of the particles in MilliQ water under argon was due to contamination from the surface. When using “practical” detection limits, which are higher than the theoretical ones, the required number of contaminants is in the range of possible contamination. It is important to note here that the samples for XPS measurements were exposed to air. Overall, our results, although favoring the absence of contaminants, should not be considered as ultimate proof of the absence of contamination and their role in the charge of inert surfaces in the presence of aqueous solutions. The most comprehensive interpretation of the observations therefore from our point of view remains the adsorption of water ions.

 ,
, 


