
Understanding the Dynamics of a Lipid Monolayer on a Water Surface under a Marangoni Flow

1
Department of Physics, Kindai University, 3-4-1 Kowakae, Higashiosaka City, Osaka 577-8502, Japan
2
Japan Synchrotron Radiation Research Institute, 1-1-1 Kouto, Sayo-cyo, Sayo-gun, Hyogo 679-5198, Japan
*
Author to whom correspondence should be addressed.
Colloids Interfaces 2021, 5(2), 31; https://0-doi-org.brum.beds.ac.uk/10.3390/colloids5020031
Submission received: 5 April 2021
/
Revised: 23 May 2021
/
Accepted: 27 May 2021
/
Published: 2 June 2021
(This article belongs to the Special Issue Interfacial Dynamics)
Abstract
:Biological membrane is composed of lipid molecules, because of its fluidity, it is possible to carry out physiological functions. Therefore, it is important to study the hydrodynamic properties of membranes toward understanding its function. Here, we observed the dynamical behavior of a lipid monolayer on the water surface under Marangoni flow. By using X-ray reflectometry, we obtained the tilt angle of the hydrocarbon chains of the lipid at different surface pressures. Comparing them with the dynamical surface pressure under Marangoni flow, it was found that the lipid molecules in rotational rather than translational motion. At low surface pressure, the molecular tilt angle is reduced by 20 degrees, even though the molecular area is reduced by at most 10%.

1. Introduction
Biological membranes are formed by self-assembly of lipids in aqueous solutions. Therefore, it is fluid and has lipid molecules and proteins diffused laterally. Conventionally, biological membranes have been treated as homogeneous membranes, but in recent years, microscopic observations have become possible, and it is becoming clear that biological membranes are not uniform fluids. In these days, a concept of “raft model” has been widely accepted in which specific lipids and cholesterol aggregate to form a liquid-ordered phase, which exerts functions such as intracellular transport and signal transduction [1,2]. Since the formation of the domain structure in the biological membrane can be regarded as a phase separation phenomenon of the multi-component lipid membrane, research on the phase behavior of artificially prepared biological membranes and vesicles in the equilibrium state has been energetically conducted. However, although the liquid-ordered phase of the artificial membrane is observed as a micron-scale domain, such a large domain is not observed in the cell membrane. This is because the actual cell membrane is placed in a non-equilibrium state, and lipid exchange is constantly occurring [3]. Consequently, biological membranes require both of structural rigidity and high lateral fluidity [4]. However, having both seems contradictory. Therefore, it is important to visualize the structure of the membrane in the flowing state to understand the behavior of biological membranes.
The Marangoni effect is a factor that gives a non-equilibrium state to condensed matter. Marangoni convection is a liquid flow induced by spatial surface tension gradients which are caused by differences not only in temperature, but also composition [5]. In recent years, it has been reported that Marangoni convection causes spontaneous oscillation of surface tension [6,7,8]. In early studies, the spontaneous oscillation of surface tension due to Marangoni convection was vigorously studied for systems containing single-component surfactants [6,9]. Retaining a droplet of surfactant in water causes spontaneous oscillation of surface tension under certain conditions. It has been reported that the amplitude and period of spontaneous oscillation depend not only on the type of surfactant but also on the shape of the water container with aspect ratio (the ratio of the radius to the height) of the order of unity. By using numerical simulation based on fluid mechanics, the oscillation of surface tension was revealed to synchronize with the occurrence of Marangoni convection [10,11]. In later study, a system coexisting with a spread surfactant monolayer was also studied [7]. In this case, the amplitude and period depend on the initial surface coverage of the monolayer rather than the aspect ratio of the water container.
Previously, we have investigated several systems coexisting with spread surfactant monolayers with different species [12]. We found that the amplitude of spontaneous oscillation strongly correlates with the elasticity of the monolayers. Figure 1a shows the schematics of the experimental setup. When small amount of a lipid (acceptor) was spread to form a monolayer on the water surface and a partially soluble surfactant (donor) droplet was formed at a capillary tip immersed into water, an oscillation of the surface tension was observed, in which a gradual increase of the surface tension followed after a sharp decrease as shown in Figure 1b. As shown in Figure 1a, if we flow small particles on the water surface, it is observed that the particles move quickly in the direction away from the capillary in synchronization with the decrease in surface tension, and then slowly return to their original state (Figure 1b bottom). Microscopically, the donor surfactant dissolved from the droplet adsorbs at the air−water interface. The local surface pressure around the capillary gradually increases in accordance with the adsorption amount and beyond the threshold value, an abrupt burst of Marangoni flow is generated at the water surface. It pushes the acceptor surfactant outward subsequently dissolves in the water. This process occurs faster for the more soluble surfactant, leading to a decreasing oscillation period. In this system, the lipid monolayer is rapidly compressed by the mechanical energy of Marangoni convection generated by the donor surfactant, and then slowly returns to its original state, repeating elastic motion periodically. Change in surface tension was found to be consistent with the change in the surface pressure of the lipid investigated by using in situ X-ray reflectometry. In this paper, we analyze in detail the elastic motion of a lipid monolayer under Marangoni convection toward an understanding of the behavior of biological membranes having both structural rigidity and high lateral fluidity.
2. Materials and Methods
2.1. Experimental Methods
2.1.1. Materials
The surfactant, 1-octanol (purity >98.0%), was purchased from Kishida Chemical Co., Ltd., Osaka, Japan, and was used as received. The phospholipid, 1,2-dioctadecanoyl-sn-glycero-3-phosphocholine (DSPC; purity >95.0%) was purchased from Tokyo Chemical Industry Co., Ltd., Tokyo, Japan, and was used as received. DSPC was dissolved in chloroform stabilized with 0.75% ethanol to give a final concentration of 10−3 mol/L.
2.1.2. Experimental Setup
A 43 mL amount of UHQ-grade water was filled into a Teflon trough (95 × 105 mm2, 3 mm depth) as shown in Figure 1a. A Pasteur pipette with an outer diameter of 1 mm was inserted in the water to a depth of 1 mm. A freshly annealed platinum Wilhelmy plate to measure surface tension was placed approximately 70 mm apart from the pipette. DSPC solution was spread on the water surface to give an appropriate surface pressure, Π0. After a uniform monolayer is formed, 24 μL of 1-octanol was filled into the pipette. The spontaneous oscillation of surface tension was observed within 10 min after a 2 mm droplet was formed at the tip of the pipette.
The surface tension is monitored as the distance between a digital displacement sensor (EX-V, Keyence, Co. Ltd., Osaka, Japan) and a flat spring (the spring constant is 0.35 g/mm) that suspends the Wilhelmy plate. Typically, we obtain the surface tension value of water, 71.8 ± 0.1 mN/m (23.1 ± 0.1 °C) in 1000 s. The pink stars (the distance between two corners is 2.8 mm) are made of polyethylene terephthalate and were placed at the center of the trough as a tracer particle. The motion of the tracer particle was observed with a digital microscope (3R-MSUSB201, 3R SOLUTION Co. Ltd., Fukuoka, Japan).
2.1.3. X-ray Reflectometry Measurements for Lipid Monolayers under Static Condition
X-ray reflectometry measurements for the DSPC monolayers without the Marangoni flow were performed using the liquid-interface reflectometer at the undulator beamline BL37XU at SPring-8 [13]. The measurements were made at angles of incidence in the range of 0.005–3.0° with an X-ray energy of 15 keV, which corresponds to qz of 0.001–0.7 Å−1. The time resolved X-ray reflectometry measurements under the Marangoni flow were also performed using the same reflectometer at the angle of incidence 0.8°.
2.2. Data Analysis
2.2.1. Elasticity of the Lipid Monolayer
The surface pressure Π is defined as the difference between the surface tension of the bare subphase γw and the that of the subphase covered by surfactants γ as
Π = γw − γ
The mechanical characteristics of thin films on liquids are described in a similar way to the three-dimensional case. The elasticity k is the inverse of the compressibility of the monolayer and is typically defined as [14]
where A is the molecular area in the monolayer, which can be calculated directly from the slope of the Π –A isotherm (Figure 2a). In the calculation procedure, the value of k was obtained by approximating the Π-A curve in the literature [15] with a quartic function and taking its derivative.
k = –A dΠ/dA
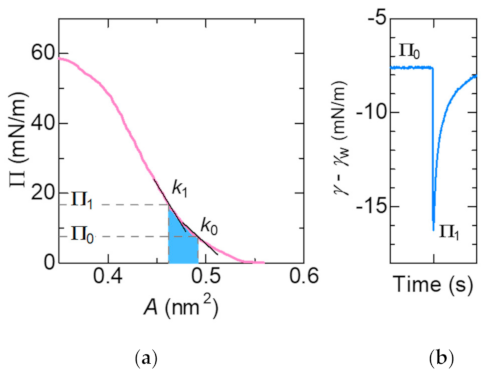
The change in surface tension as shown in Figure 2b corresponds to the change in surface pressure of the lipid monolayer in Figure 2a. When the surface tension is minimum, the lipid monolayer is compressed by mechanical energy of Marangoni convection. We defined the initial molecular area estimated from Figure 2 at Π0 as A0. While for the molecular area when the accepter surfactant is compressed to Π1 is defined as A1. The elastic energy stored in the lipid monolayer can be calculated by integrating the curve between A0 and A1, as shown in blue in Figure 2a.
2.2.2. X-Ray Reflectometry
In the X-ray reflectometry, the density distribution in the interface depth direction is obtained with the resolution of a sub-nanometer [16,17]. It is a powerful analytical method that can apply both solids and liquids, inorganic and organic substances in a nondestructive manner. The electron density profile along the interface normal can be obtained since the wave vector transfer qz, which is determined by the incident and outgoing X-ray beam, is perpendicular to the interface. For liquid surfaces, the reflectivity is described by the Born approximation,
where RF is the Fresnel reflectivity for an ideally flat interface, σ is the roughness of the interface and is the intrinsic structure factor normal to the surface, which is expressed as,
where <ρ(z)>xy is the lateral average scattering length density (SLD) ρ (z) along to the surface normal direction z, which is proportional to the electron density profile. In the present study, the X-ray reflectivity data were fitted using a layer model with the Motofit software based on the Parratt formalism taking parameters of the thickness, the scattering length density and roughness of the layers. Generally, the layer model can be interpreted in molecular terms. Since the simplest submolecular interpretation of an amphiphilic monolayer structure is a division into a hydrophobic and a hydrophilic slab [18], it has naturally been assumed that two layers are an adequate description of monolayer systems. The model contains five adjustable parameters: two layer densities, two layer thicknesses and a smearing parameter between the two layers.
For DSPC monolayer, the maximal extension of the hydrophobic chain of n-CH2 groups in all-trans configurations [19],
The tilt angle β of the chains from the surface normal is estimated by the thickness of the layer describing the lipid chain region,
3. Results
3.1. Elastic Motion of the Lipid Monolayer
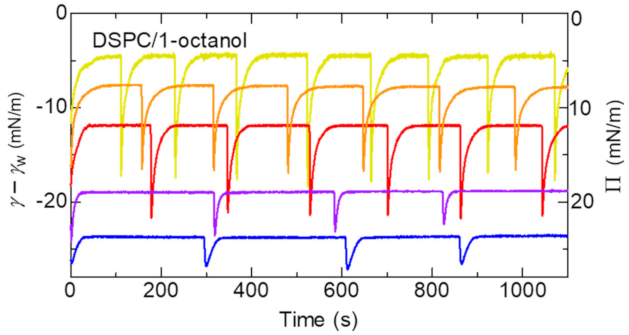
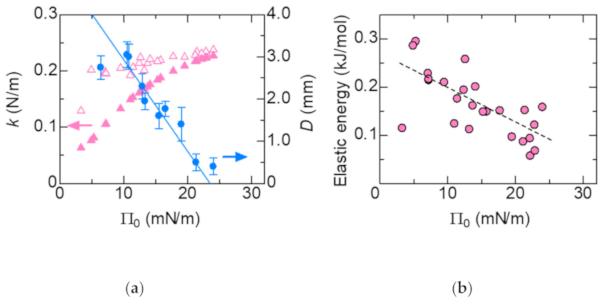
The typical examples for the spontaneous oscillation of surface tension are shown in Figure 3. The amplitude of the oscillation decreases with increasing the initial surface pressure, Π0. Π0 dependence of the displacement D of the tracer particle placed on the center of the trough is shown in Figure 4a. We think D is the macroscopic displacement caused in change of the molecular area of the monolayer. Therefore, the displacement D should be approximately given by.
where L is the distance of the tracer particle from the edge of the trough, 50 mm. The estimated values (the solid line in Figure 4a) show good agreement with those of observations.
D = L (1 – A1/A0)
The elasticity k increases with increasing Π0 as shown in Figure 4a. It is consistent with that the displacement D becomes smaller with increasing k.
3.2. Structure of the Lipid Monolayer
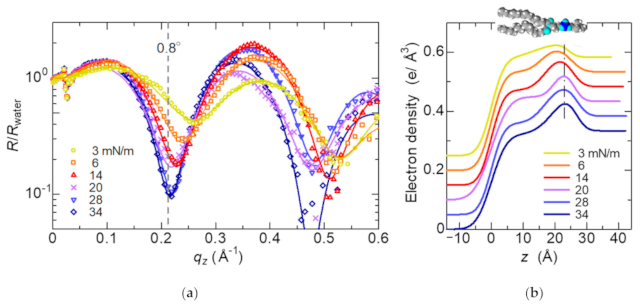
Figure 5 shows X-ray reflectivity curves for the DSPC surfactant monolayer formed with different surface pressures. They are divided by the X-ray reflectivity for water. The Kiessig fringes caused by the interference of X-ray beams reflected by the surfaces of the monolayer and water were observed. Density profiles along the direction normal to the water surface obtained by fitting are shown in Figure 5b. The peaks originated from the phosphor group penetrated in water is denoted by the dashed line in Figure 5b. The DSPC molecules in the monolayer become regularly oriented normal to the surface at higher surface pressure.
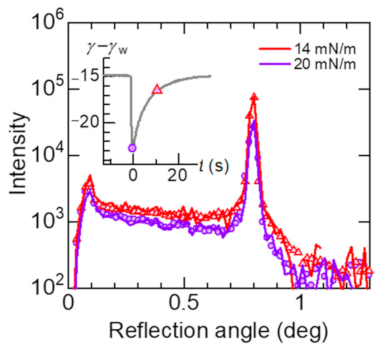
Since the intensity at q = 0.21 Å−1 (α = 0.8°) drastically decreases with increasing the surface pressure as shown in Figure 5a, we observed the time dependence of the reflection profiles at α = 0.8° under the Marangoni flow. They are shown in Figure 6 compared with the profiles without Marangoni flow. The reflectivity data in Figure 5a are calculated by integration of the peak observed at 0.8°. In the reflection profiles, Yoneda wings [16] originated from the critical angle of total reflection are also observed at 0.1°. The reflection profile at which the surface tension shows the minimum value (the purple circles) is similar to the profile at the surface pressure of 20 mN/m (the purple curve), while the profile at which the surface tension being higher (the red triangles) is similar to the profile at the surface pressure of 14 mN/m (the red curve), indicating that the oscillation of the surface tension is consistent with the change in the surface pressure of the DSPC monolayer.
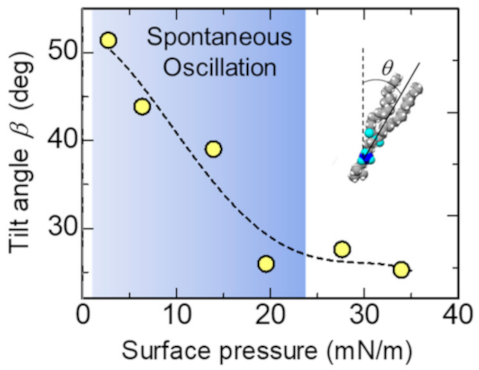
Figure 7 shows the tilt angle β of the chains from the surface normal estimated by the thickness of the layer describing the lipid chain region using Equation (6). The tilt angle becomes almost constant above 20 mN/m, in which the spontaneous oscillation of surface tension does not occur.
4. Discussion
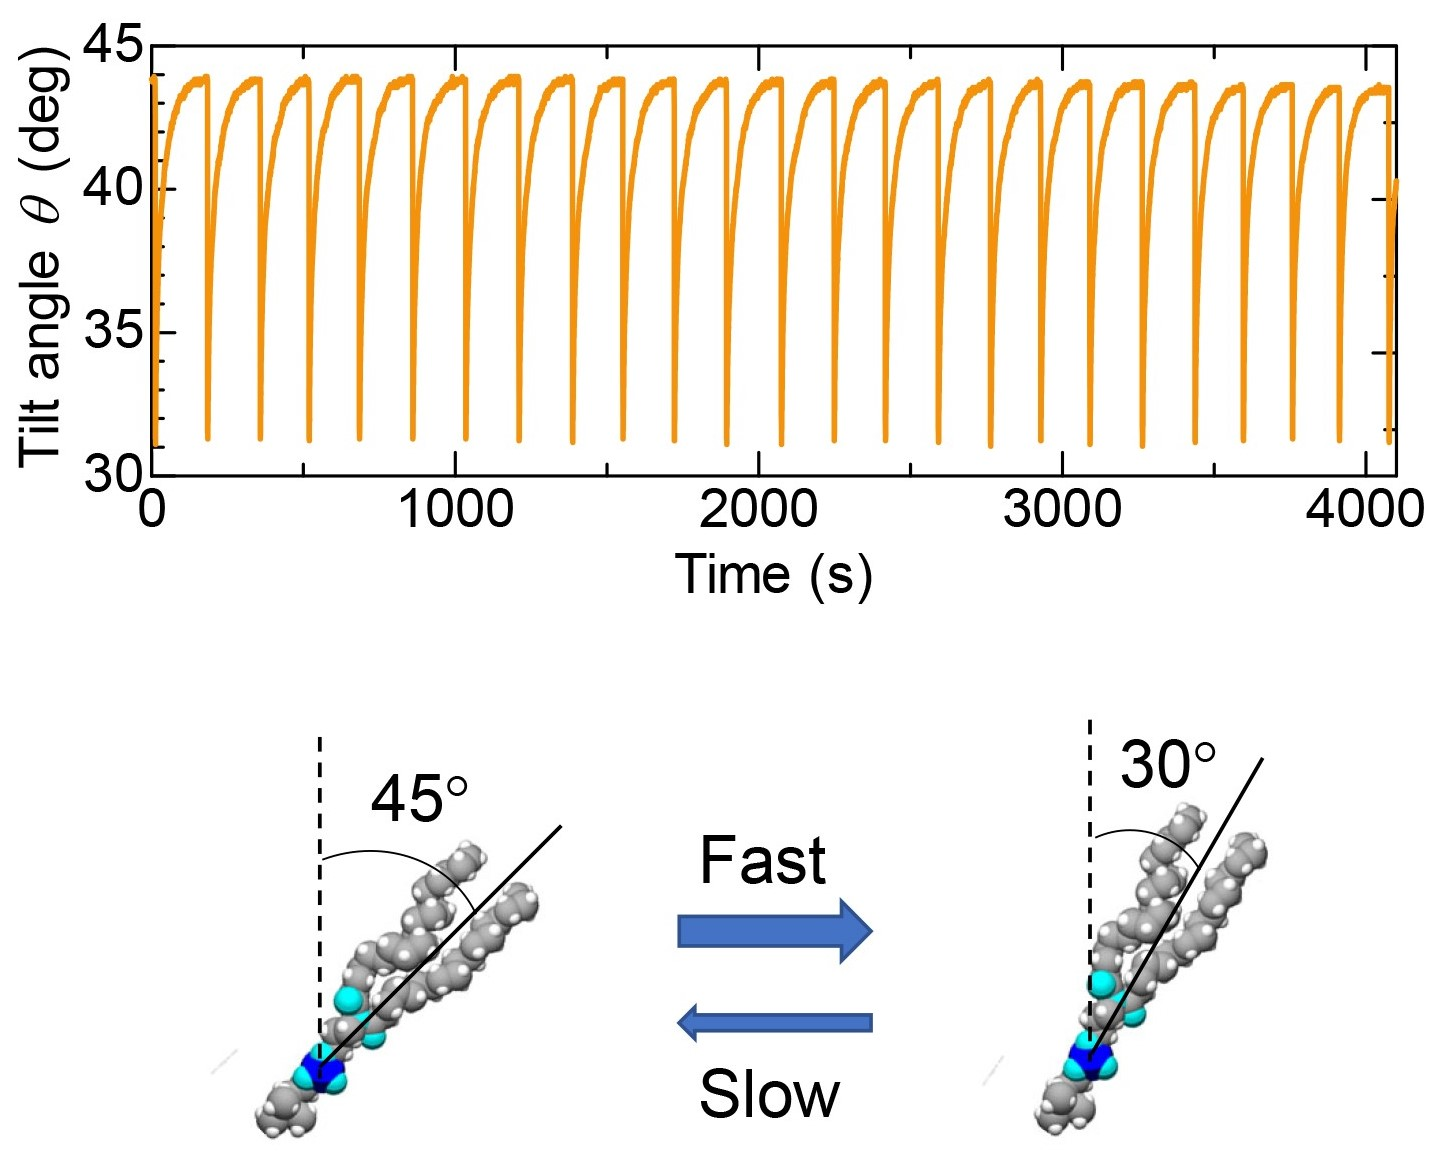
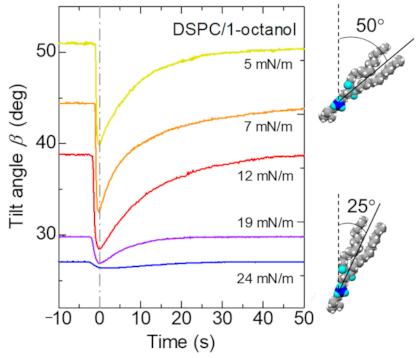
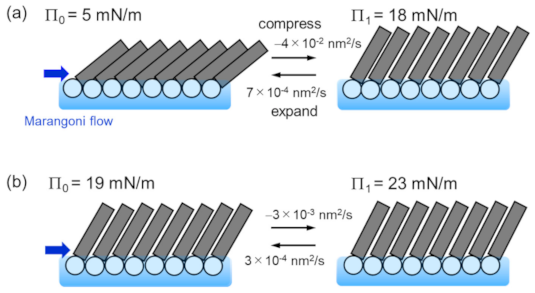
As seen in Figure 7, it was found that the tilt angle of the hydrophobic chain of DSPC decreased as the surface pressure increased. Using this relationship, we investigated how the tilt angle of the alkyl chain of DSPC changes when the spontaneous oscillation of surface tension occurs. Figure 8 shows the oscillation of the tilt angle estimated from the spontaneous oscillation of surface tension shown in Figure 2. The lying lipid molecule suddenly rises and then slowly lays down again.
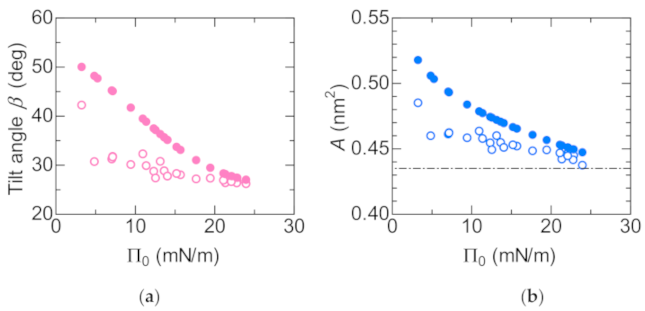
Dependence of the tilt angle on Π0 is shown in Figure 9a. The closed circles represent data for the initial Π0, whereas the open circles represent data for the compressed Π1 (see Figure 2 for the definition of Π0 and Π1). Figure 9b shows the dependence of the molecular area A on Π0. The closed and open circles represent data for the initial area A0 and the compressed A1, respectively. They are derived from the Π-A curve as shown in Figure 2. The horizontal dashed line shows the minimum molecular area at low temperature [20]. As the surface pressure increases, the molecular area decreases, so that the molecules stand in the direction perpendicular to the surface (Figure 9a). The change in tilt angle due to compression by Marangoni convection decreases as the surface pressure increases. However, it is hardly to change at Π0 > 20 mN/m, in which the DSPC molecules are close to the close-packed structure. Considering with that the lateral pressure for phospholipid bilayers was estimated in the region of 30–35 mN/m [21], there is not enough space for phospholipid molecules in biological membranes to freely translate. The schematic illustration of the behavior of DSPC molecules during the spontaneous oscillation of surface tension is shown in Figure 10. The length and tilt angle of the hydrophobic tail, the size of the hydrophilic head and the molecular area are drawn based on the present results. Comparing Figure 10a with Figure 9, at Π0 = 5 mN/m, the molecular area is reduced by only 10%, even though the tilt angle of the molecule is reduced by 20 degrees. Therefore, the molecules can be regarded as rotating rather than translating. While for the case in Figure 10b, the movement of the molecules are very small. In biological membranes, it is known that an additive increases the molecular area [21] and consequently induces a lubrication flow [4]. The rate of compression and expansion are estimated from the oscillation of the surface tension. Since the elasticity of DSPC monolayer becomes higher, the rate of compression decreases with increasing Π0. On the other hand, the rate of expansion is 10 times smaller than that of compression. From the elasticity, it is predicted that the higher the surface pressure, the faster the expansion speed. It seems that this was not the case because the solvation rate of 1-octanol spread on the water surface was lower at higher surface pressures [12].
5. Conclusions
We have investigated the dynamics of the lipid monolayer under spontaneous oscillation of surface tension. In this phenomenon, the lipid molecules are rapidly compressed by the mechanical energy of Marangoni convection, and then slowly returned to its original state, repeating elastic motion periodically. The elastic energy stored in the lipid was found to be five times smaller than the energy of van der Waals interaction between the hydrocarbon chain of the lipid. It was observed that the hydrophobic chain of the inclined lipid was pushed by the Marangoni convection and stood up periodically. The tilt angle with respect to the water surface normal direction changed by about 1–20 degrees. The lower the surface pressure, the greater the change. This behavior is similar to the tumbler doll, a traditional Japanese doll that always comes back to an upright position each time one push it over.
However, in the region where the surface pressure of the biological membrane is known to be about 30–35 mN/m [21], the spontaneous oscillation of surface tension was not observed in the DSPC monolayer. Therefore, in order to increase the fluidity of the membrane, the coexistence of other components is essential, and we should study on mixed monolayers in the future.
Author Contributions
Y.F.Y. conceived the project, planned and conducted the experiments, analyzed the data and wrote the manuscript. T.U. built the X-ray reflectometer at SPring-8. T.U. and T.I. conducted the experiments at SPring-8. Authorship must be limited to those who have contributed substantially to the work reported. All authors have read and agreed to the published version of the manuscript.
Funding
Y.F.Y. acknowledges financial support from a Grant-in-Aid for Scientific Research (C) (No. 17K05616) from the Ministry of Education, Culture, Sports, Science and Technology of Japan.
Institutional Review Board Statement
Not applicable.
Informed Consent Statement
Not applicable.
Acknowledgments
The X-ray reflectivity experiments were conducted at the BL37XU beamlines at the SPring-8 facility with the approval of the Japan Synchrotron Radiation Research Institute (JASRI) (Proposal No. 2017B1137).
Conflicts of Interest
The authors declare no conflict of interest.
References
- Lingwood, D.; Simons, K. Lipid Rafts as a Membrane-Organizing Principle. Science 2010, 327, 46–50. [Google Scholar] [CrossRef] [PubMed] [Green Version]
- Sezgin, E.; Levental, I.; Mayor, S.; Eggeling, C. The Mystery of Membrane Organization: Composition, Regulation and Roles of Lipid Rafts. Nat. Rev. Mol. Cell Biol. 2017, 18, 361–374. [Google Scholar] [CrossRef] [PubMed] [Green Version]
- Turner, M.S.; Sens, P.; Socci, N.D. Nonequilibrium Raftlike Membrane Domains under Continuous Recycling. Phys. Rev. Lett. 2005, 95, 3–6. [Google Scholar] [CrossRef] [PubMed] [Green Version]
- Espinosa, G.; López-Montero, I.; Monroya, F.; Langevin, D. Shear Rheology of Lipid Monolayers and Insights on Membrane Fluidity. Proc. Natl. Acad. Sci. USA 2011, 108, 6008–6013. [Google Scholar] [CrossRef] [PubMed] [Green Version]
- Scriven, L.E. The Marangoni Effects. Nature 1960, 187, 186. [Google Scholar] [CrossRef]
- Kovalchuk, V.I.; Kamusewitz, H.; Vollhardt, D.; Kovalchuk, N.M. Auto-Oscillation of Surface Tension. Phys. Rev. E Stat. Phys. PlasmasFluidsRelat. Interdiscip. Top. 1999, 60, 2029–2036. [Google Scholar] [CrossRef] [PubMed]
- Grigorieva, O.v.; Kovalchuk, N.M.; Grigoriev, D.O.; Vollhardt, D. Spontaneous Non-Linear Surface Tension Oscillations in the Presence of a Spread Surfactant Monolayer at the Air/Water Interface. Colloids Surf. A Physicochem. Eng. Asp. 2004, 250, 141–151. [Google Scholar] [CrossRef]
- Kovalchuk, N.M. Spontaneous Oscillations Due to Solutal Marangoni Instability: Air/Water Interface. Cent. Eur. J. Chem. 2012, 10, 1423–1441. [Google Scholar] [CrossRef]
- Kovalchuk, N.M.; Vollhardt, D. Autooscillations of Surface Tension in Water-Alcohol Systems. J. Phys. Chem. B 2000, 104, 7987–7992. [Google Scholar] [CrossRef]
- Kovalchuk, N.M.; Vollhardt, D. A Numerical Study of Surface Tension Auto-Oscillations. Effect of Surfactant Properties. J. Phys. Chem. B 2001, 105, 4709–4714. [Google Scholar] [CrossRef]
- Kovalchuk, N.M.; Vollhardt, D. Theoretical Description of Repeated Surface-Tension Auto-Oscillations. Phys. Rev. E Stat. Phys. PlasmasFluidsRelat. Interdiscip. Top. 2002, 66, 1–9. [Google Scholar] [CrossRef] [PubMed]
- Yano, Y.F.; Tada, H.; Arakawa, E.; Voegeli, W.; Ina, T.; Uruga, T.; Matsushita, T. Periodic Elastic Motion in a Self-Assembled Monolayer under Spontaneous Oscillations of Surface Tension: Molecules in a Scrum Push Back a Marangoni Flow. J. Phys. Chem. Lett. 2020, 11, 6330–6336. [Google Scholar] [CrossRef] [PubMed]
- Yano, Y.F.; Uruga, T.; Tanida, H.; Toyokawa, H.; Terada, Y.; Yamada, H. Simultaneous Measurement of X-Ray Specular Reflection and off-Specular Diffuse Scattering from Liquid Surfaces Using a Two-Dimensional Pixel Array Detector: The Liquid-Interface Reflectometer of BL37XU at SPring-8. J. Synchrotron Radiat. 2010, 17, 511–516. [Google Scholar] [CrossRef] [PubMed] [Green Version]
- Gaines, G.L. Insoluble Monolayers at Liquid-Gas Interfaces; Interscience Publishers: New York, NY, USA, 1966. [Google Scholar]
- Miyoshi, T.; Kato, S. Detailed Analysis of the Surface Area and Elasticity in the Saturated 1,2-Diacylphosphatidylcholine/Cholesterol Binary Monolayer System. Langmuir 2015, 31, 9086–9096. [Google Scholar] [CrossRef] [PubMed]
- Pershan, P.S.; Schlossman, M. Liquid Surfaces and Interfaces: Synchrotron X-Ray Methods; Cambridge University Press: Cambridge, UK, 2012. [Google Scholar]
- Skoda, M.W.A. Recent Developments in the Application of X-Ray and Neutron Reflectivity to Soft-Matter Systems. Curr. Opin. Colloid Interface Sci. 2019, 42, 41–54. [Google Scholar] [CrossRef] [Green Version]
- Schalke, M.; Lösche, M. Structural Models of Lipid Surface Monolayers from X-Ray and Neutron Reflectivity Measurements. Adv. Colloid Interface Sci. 2000, 88, 243–274. [Google Scholar] [CrossRef]
- Helm, C.A.; Möhwald, H.; Kjör, K.; Als-Nielsen, J. Phospholipid Monolayer Density Distribution Perpendicular to the Water Surface. A Synchrotron x-Ray Reflectivity Study. Europhys. Lett. 1987, 4, 697–703. [Google Scholar] [CrossRef]
- Nagle, J.F.; Wilkinson, D.A. Lecithin Bilayers. Density Measurement and Molecular Interactions. Biophys. J. 1978, 23, 159–175. [Google Scholar] [CrossRef] [Green Version]
- Marsh, D. Lateral Pressure in Membranes. Biochim. Biophys. Acta-Rev. Biomembr. 1996, 1286, 183–223. [Google Scholar] [CrossRef]
Figure 1.
(a) Experimental setup. The surface tension is measured using a Wilhelmy plate. The motion of the tracer particle made of polyethylene terephthalate placed on the center of the trough was observed to visualize the Marangoni convective flow.; (b) Oscillations of surface tension compared with the movement of a tracer particle. The movement of the particle was exactly synchronized with the abrupt decrease in the surface tension.

Figure 2.
(a) Π –A isotherm of DSPC monolayers on the aqueous subphase at 25 °C [15]. The elasticity k0 and k1 is calculated directly from the slope at Π0 and Π1, respectively. The elastic energy stored in the lipid monolayer corresponds to the area denoted in blue; (b) Oscillation of surface tension. See the definition of Π0 and Π1.

Figure 3.
Oscillations of surface tension produced by 1-octanol in the presence of a spread monolayer of DSPC with different initial surface pressure, Π0. γ-γw is the difference of the surface tension with that for water, γw. Yellow: Π0 = 5 mN/m; Orange: Π0 = 7 mN/m; Red: Π0 = 12 mN/m; Purple: Π0 = 19 mN/m; Blue: Π0 = 24 mN/m.

Figure 4.
(a) Pink: Dependence of the elasticity k on Π0. Closed and open triangles represent data for k0 and k1, respectively. Blue: Dependence of the maximum displacement of the tracer particle D on Π0. The solid lines are estimated from the Π–A curve (Figure 2a); (b) Dependence of the elastic energy on Π0. The dashed line is a guide to the eye.

Figure 5.
(a) X-ray reflectometry curves of DSPC films divided by that of water. (b) Electron density profiles corresponding to the fits of the reflectometry curves. For clarity, data sets are shifted vertically. The peaks originate from the phosphor group of DSPC penetrated in the water.
Figure 5.
(a) X-ray reflectometry curves of DSPC films divided by that of water. (b) Electron density profiles corresponding to the fits of the reflectometry curves. For clarity, data sets are shifted vertically. The peaks originate from the phosphor group of DSPC penetrated in the water.

Figure 6.
Reflection profiles at α = 0.8° monitored under the Marangoni flow compared to the profiles without Marangoni flow. The corresponding spontaneous oscillation of surface tension is shown in the inset. The reflection profile at the minimum surface tension (the purple circles) is similar to the profile at the static surface pressure of 20 mN/m (the purple curve), while the profile at which the recovering surface tension (the red triangles) is similar to the profile at the surface pressure of 14 mN/m (the red curve).

Figure 7.
Dependence of the tilt angle of the hydrophobic chains on the surface pressure of the DSPC. The region of the spontaneous oscillation of surface tension shown in blue. The dashed curve is a guide to the eye.
Figure 7.
Dependence of the tilt angle of the hydrophobic chains on the surface pressure of the DSPC. The region of the spontaneous oscillation of surface tension shown in blue. The dashed curve is a guide to the eye.

Figure 8.
Oscillations of the tilt angle of the hydrophobic chain in DSPC with different initial surface pressure, Π0. Yellow: Π0 = 5 mN/m; Orange: Π0 = 7 mN/m; Red: Π0 = 12 mN/m; Purple: Π0 = 19 mN/m; Blue: Π0 = 24 mN/m.
Figure 8.
Oscillations of the tilt angle of the hydrophobic chain in DSPC with different initial surface pressure, Π0. Yellow: Π0 = 5 mN/m; Orange: Π0 = 7 mN/m; Red: Π0 = 12 mN/m; Purple: Π0 = 19 mN/m; Blue: Π0 = 24 mN/m.

Figure 9.
(a) Dependence of the tilt angle on Π0. Closed and open circles represent data for initial Π0 and final Π1, respectively; (b) Dependence of the molecular area A on Π0. Closed and open circles represent data for A0 and A1, respectively. The horizontal dashed line shows the minimum molecular area at low temperature [20].

Figure 10.
The schematic illustration of the behavior of DSPC molecules during the spontaneous oscillation of surface tension. (a) DSPC monolayer at Π0 = 5mN/m. The tilt angle changes from 51° to 30° during the oscillation. (b) DSPC monolayer at Π0 = 19mN/m. The tilt angle changes from 30° to 27° during the oscillation. The rate of compression and expansion are estimated from the oscillation curves.

Publisher’s Note: MDPI stays neutral with regard to jurisdictional claims in published maps and institutional affiliations. |
© 2021 by the authors. Licensee MDPI, Basel, Switzerland. This article is an open access article distributed under the terms and conditions of the Creative Commons Attribution (CC BY) license (https://creativecommons.org/licenses/by/4.0/).
Share and Cite
MDPI and ACS Style
Yano, Y.F.; Ina, T.; Uruga, T. Understanding the Dynamics of a Lipid Monolayer on a Water Surface under a Marangoni Flow. Colloids Interfaces 2021, 5, 31. https://0-doi-org.brum.beds.ac.uk/10.3390/colloids5020031
AMA Style
Yano YF, Ina T, Uruga T. Understanding the Dynamics of a Lipid Monolayer on a Water Surface under a Marangoni Flow. Colloids and Interfaces. 2021; 5(2):31. https://0-doi-org.brum.beds.ac.uk/10.3390/colloids5020031
Chicago/Turabian StyleYano, Yohko F., Toshiaki Ina, and Tomoya Uruga. 2021. "Understanding the Dynamics of a Lipid Monolayer on a Water Surface under a Marangoni Flow" Colloids and Interfaces 5, no. 2: 31. https://0-doi-org.brum.beds.ac.uk/10.3390/colloids5020031