
A pH-Responsive Foam Formulated with PAA/Gemini 12-2-12 Complexes
by

Hernán Martinelli
1, 
Claudia Domínguez
1,
Marcos Fernández Leyes
1,
Sergio Moya
2 and
Hernán Ritacco
1,* 1
Instituto de Física del Sur (IFISUR-CONICET), Av. Alem 1253, Bahía Blanca 8000, Argentina
2
CIC biomaGUNE, Paseo de Miramón 182, 20014 Donostia-San Sebastián, Spain
*
Author to whom correspondence should be addressed.
Colloids Interfaces 2021, 5(3), 37; https://0-doi-org.brum.beds.ac.uk/10.3390/colloids5030037
Submission received: 14 June 2021
/
Revised: 8 July 2021
/
Accepted: 13 July 2021
/
Published: 19 July 2021
(This article belongs to the Special Issue Interfacial Phenomena)
Abstract
:In the search for responsive complexes with potential applications in the formulation of smart dispersed systems such as foams, we hypothesized that a pH-responsive system could be formulated with polyacrylic acid (PAA) mixed with a cationic surfactant, Gemini 12-2-12 (G12). We studied PAA-G12 complexes at liquid–air interfaces by equilibrium and dynamic surface tension, surface rheology, and X-ray reflectometry (XRR). We found that complexes adsorb at the interfaces synergistically, lowering the equilibrium surface tension at surfactant concentrations well below the critical micelle concentration (cmc) of the surfactant. We studied the stability of foams formulated with the complexes as a function of pH. The foams respond reversibly to pH changes: at pH 3.5, they are very stable; at pH > 6, the complexes do not form foams at all. The data presented here demonstrate that foam formation and its pH responsiveness are due to interfacial dynamics.
1. Introduction
Polyelectrolytes and surfactants are used in a broad number of industries and technologies, both on their own and mixed. Polyelectrolytes are polymers that, when dissolved in water, dissociate into macroions, the polymer chain, and small counterions. Surfactants are small molecules with a chemical structure composed of two distinct parts: one of them, the polar head, with an affinity to water (or any other polar solvent) and the other one, the hydrophobic tail, with an affinity to nonpolar fluids such as air or oil. Surfactants have the property of adsorbing spontaneously at the interface separating immiscible polar and nonpolar fluids. At a certain concentration, the interfaces saturate with surfactant molecules, at which point surfactants spontaneously self-aggregate in bulk to form micelles. The concentration at which this happens is called critical micelle concentration (cmc) [1].
The richness of the behavior of polyelectrolyte/surfactant mixtures [2,3,4,5,6,7] is such that they are envisaged as systems to be used in a large number of new technological applications. Among them, there are some in the personal care and oil industries, in wastewater treatment, in paints, as gene carriers in gene therapy, and in encapsulation in drug delivery systems, to name but a few [3,4,5,6]. The complexation process between polymers and surfactants is driven by physical interactions among species, but even for opposite charged species both hydrophobic and electrostatic interactions are involved. The structure and features of polyelectrolyte/surfactant complexes in bulk and at interfaces are the result of an intricate balance between attractive and repulsive interactions between polyelectrolytes and surfactants and depend on both the physical conditions, such as pH, temperature, or ionic strength, and the chemical nature of surfactants and polyelectrolytes [4,8,9,10]. The dependence on physical conditions makes these complexes a candidate for the formulation of responsive systems. The idea is to trigger a response by means of a given external physical or chemical stimulus, such as pH, temperature, light, or electric, or magnetic fields. For instance, a drug delivery system could be formulated by encapsulating the drug in a polyelectrolyte–surfactant complex whose stability depends on pH, so that if pH changes to a certain extent, the aggregate disintegrates and the cargo is released. The same type of responses could be obtained at interfaces. For example, we were able to produce a temperature-responsive foam stabilized by a temperature-responsive polyelectrolyte surfactant complex [11]. The formulation of smart foams whose stability can be modulated by an external stimulus is an active and very interesting area of research [12,13,14], with applications ranging from cosmetic and pharmaceutical industries, oil recovery, and multiphase reaction catalysts [15] to environmental remediation, among many others [14]. The design of smart foams and bubbles for drug delivery systems [16] is of particular interest to us. Among these few developments, oxygen delivery to treat hypoxia is a very nice example [17].
Liquid foams are formed by the dispersion of gaseous regions in a liquid matrix [18,19,20]. They are ubiquitous systems found in nature, in the daily life of humans, and in industry [21]. They are metastable systems that lasts for a certain and limited time. Metastability is accomplished by arresting and slowing down the processes that drive the dispersion to its true thermodynamic equilibrium state, which is the complete phase separation. This is achieved by adding surface-active agents, the foam stabilizers. Stabilizers arrest or slow down one or several of the three main processes involved in foam destruction: drainage [22], coarsening [22], and coalescence [23]. The most commonly used foam stabilizers are surfactants; however, polymers, proteins, and particles, among others, can also be used. Mixtures of polyelectrolytes and oppositely charged surfactants [24] present some advantages as foam stabilizers, such as the low surfactant and polymer concentrations needed to produce and stabilize foams. In general, the improvement in foam stabilization when using polymer-surfactant complexes is due to the presence of polymers at the interfaces, to which they confer an increased viscoelasticity when compared to simple surfactants [25].
In the present article, mixtures of polyacrylic acid (PAA) and a cationic surfactant, Gemini 12-2-12 (G12), are studied in aqueous solutions. PAA is a weak acid, thus the charge of the carboxylic groups can be modulated by changing the pH, which could modify the interactions with the oppositely charged G12 surfactant; this in turn could change the structure and properties of the complexes, both in bulk and at interfaces. We hypothesized that this could produce pH-responsive foams and focused on the surface properties of PAA/G12 complexes for the formulation of smart foams. We used equilibrium and dynamic surface tension, surface dilational rheology, and X-ray reflectometry to characterize the interfaces. We then formulated foams with complexes at three different pHs (3.5, 6, and 11) and study the stability of these foams by means of multiple light scattering and CCD cameras. The foams are pH responsive, very stable at pH 3.5 and at surfactant concentrations as low as 4 × 10⁻² mM, which is 1/23 the cmc. The maximum stability at this pH is reached for a surfactant concentration (cs) range of 0.01< cs < 0.5 mM. At pH 6, the systems do not form foams at all. At pH 11, they form very little and unstable foams. The response to pH is fully reversible; by adding hydrochloric acid (HCl) or sodium hydroxide (NaOH) to cyclically change the pH, we obtained cyclically stable and unstable foams. The data presented here demonstrate unambiguously that the response mechanism is entirely due to interfacial dynamics. These results contrast with the response mechanism of foams formulated with colloidal polystyrene-PAA particles [26], for which the hydrophobicity/hydrophilicity balance at different pHs modifies the surface activity of the particles, being this the main pH response mechanism of the foams. For PAA-G12 complexes, the surface activity at equilibrium is not modified by pH at the surfactant concentrations used.
2. Materials and Methods
We synthetized G12 in our laboratory [27] following a method employed by Zana et al. [28], which is the same procedure we had used in a previous work [29]. The success of the synthesis was checked by NMR. After synthesis and purification, the surfactant was kept under vacuum over dried silica. We used Milli-Q water (resistance > 18.2 MΩ.cm) for the preparation of all solutions used in this work. PAA (MW: 5.0 × 10⁵ g mol−1), HCl, and NaOH were purchased from Sigma-Aldrich and used as received.
PAA-G12 complexes were prepared by mixing a 50 mg mL−1 stock solution of PAA (5.0 × 10⁻⁴ M) to a final concentration of 1 mg mL−1 (1.0 × 10⁻⁵ M) in surfactant solution at different concentrations. In all samples, the polymer concentration was fixed and the same, 1 mg mL−1. All samples were prepared at room temperature and left to equilibrate for 30 min before the experiments. The pH responsiveness of the complexes was studied by adding different amounts of 2 M HCl (or 4 M NaOH) to the solution to change the pH to the desired value.
Equilibrium surface tension, γ, measurements were performed using the sensor of a KSV LB-5000 Langmuir balance system (KSV-NIMA). Disposable 20.6 mm paper (KSV-NIMA) or Pt-Wilhelmy probes were used. The measuring cell (10 mL) was made of Teflon, and the temperature was controlled by circulating water from a thermostat (Lauda ALPHA RA 8, Lauda-Konigshofen, Germany) through a jacket placed at the bottom of the cell. The temperature near the surface was measured with an accuracy of 0.01 °C using a calibrated Pt-100 sensor. All measurements were performed at T = 22 °C. For the equilibrium surface tension, we followed the surface tension over time and considered that equilibrium was reached if the surface tension remained constant for at least 30 min.
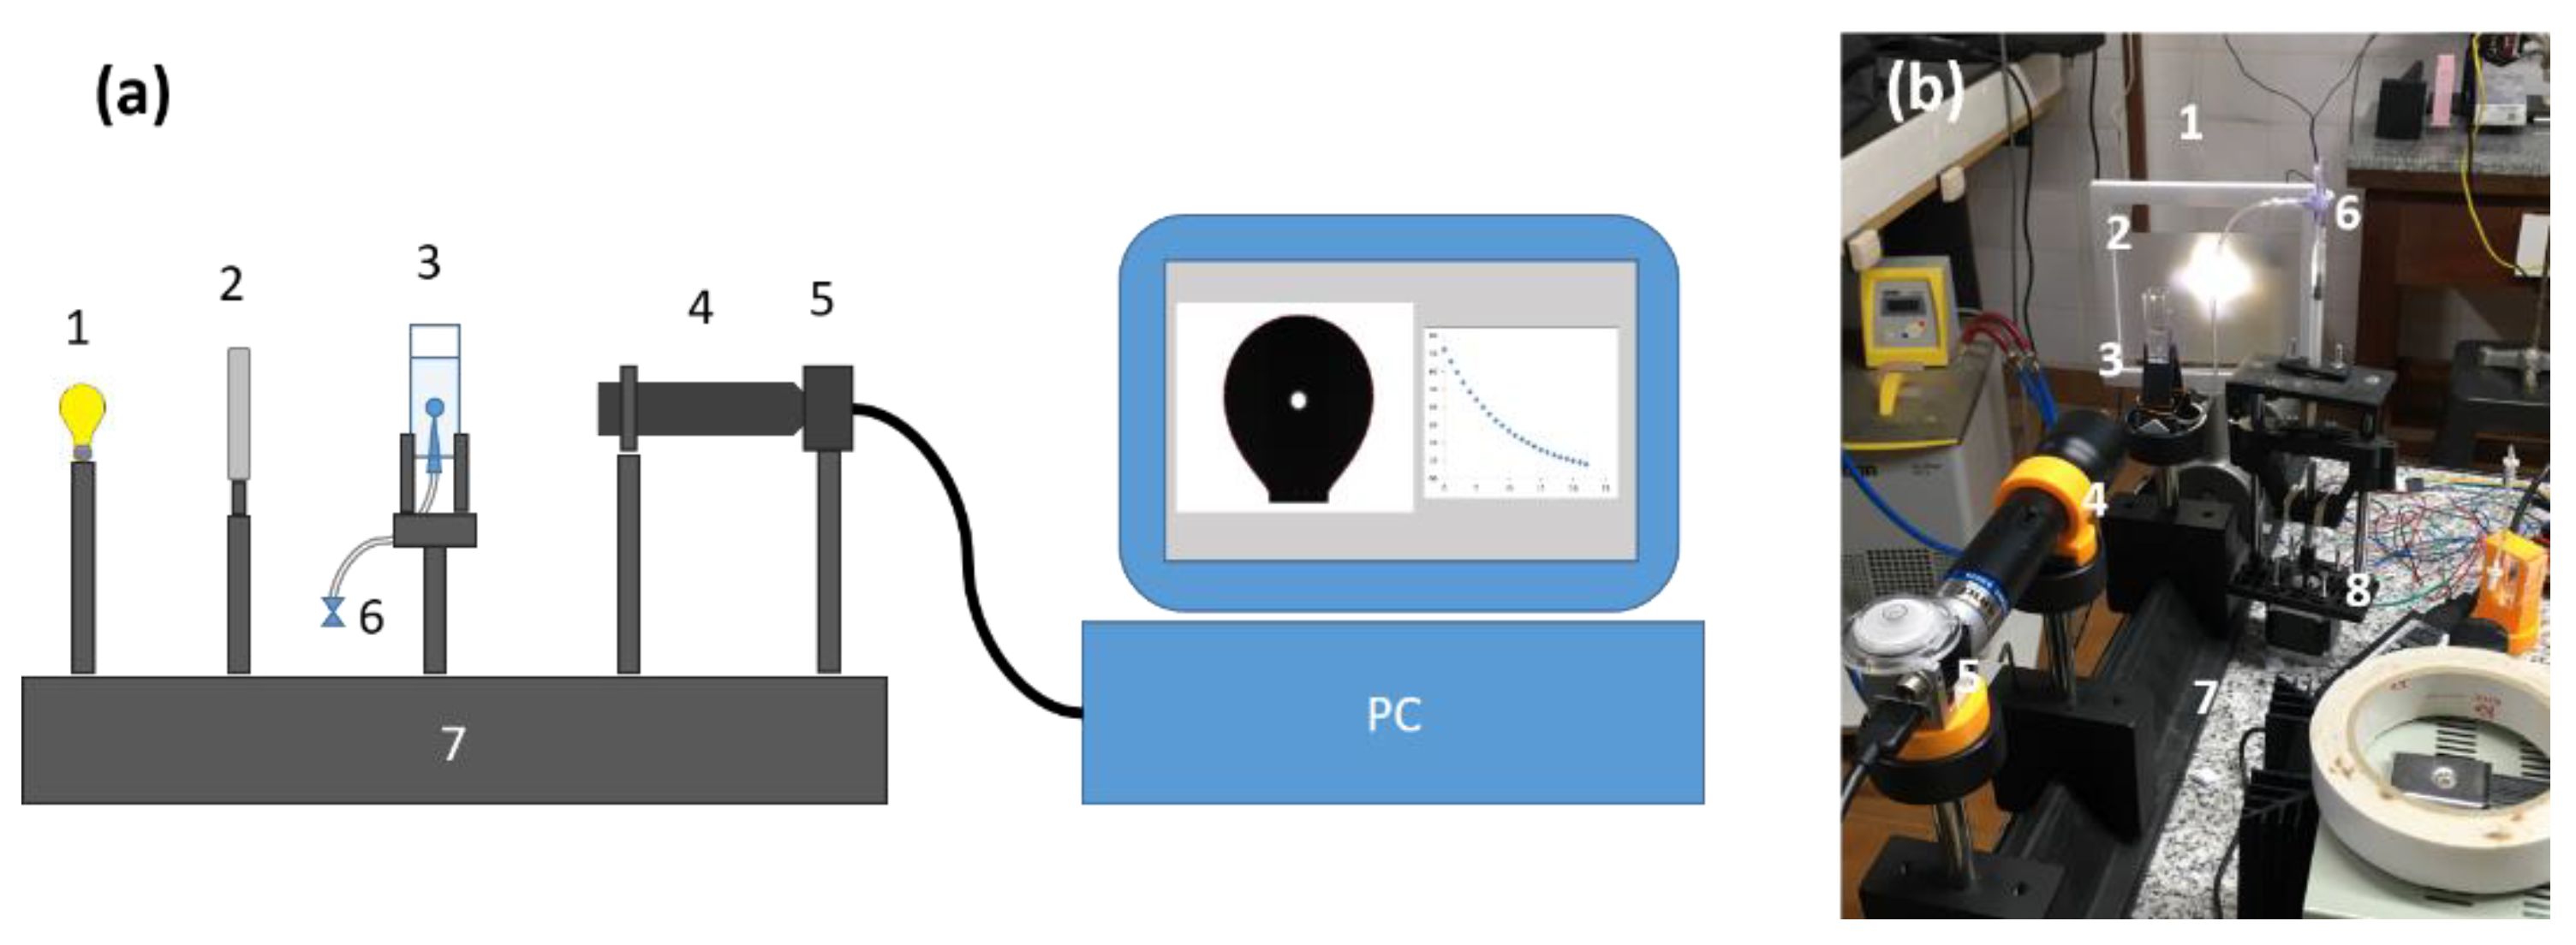
The dynamic surface tension, γ(t), was measured by means of a homemade apparatus using the pendant drop (PD) or rising bubble technique. A pendant drop tensiometer consists of three main parts: a bubble or drop forming mechanism, an image acquisition system, and a software to extract and fit the bubble or drop profile with the Young-Laplace equation to obtain the interfacial tension. The CCD camera takes pictures of the bubble/drop profile at different frame rates, analyzing each of these images to obtain the time evolution of the surface tension. We built a pendant drop tensiometer with a Basler acA1300-30um CCD camera with a telecentric lens, model 0.50X Silver TL from Edmund Optics, to minimize image aberration. We employed disposable polystyrene cuvettes DTS0012 from Malvern for the samples. Air bubbles were formed at the end of a Sartorius 10 µL Optifit tip. A hole was made in the base of the cell to fit the tip, and the assembly was fixed and sealed with a plastic welding gun. The air to form the bubble was injected with an automatically controlled, homemade syringe pump. We used white LED as a light source and added a frosted plastic filter to generate diffused light. Once the bubble was formed, a valve was closed to keep the air volume constant. All elements were mounted on an optic bench. To calculate the surface tension, we used the ImageJ plugin developed by Daerr [30]. The apparatus is shown in Figure 1.
Surface viscoelasticity at solution-air interfaces was measured by means of surface tension relaxation experiments. We measured the time evolution of the surface tension after a sudden compression of the interface area in a Langmuir balance (KSV-NIMA, medium), as we had done previously [29]. All experiments were performed using a barrier speed of 500 cm min−1 and a relative area perturbation, ΔA/A0, of 5%, being ΔA and A0 the area change and the initial area, respectively. Assuming an instantaneous perturbation, the measured surface pressure relaxation can be expressed as the sum of all relaxation processes involved,
where γn and τn are the equilibrium surface tension and the characteristic relaxation time of each process, respectively. The relaxation spectrum, H(ln t), is related to the surface pressure relaxation by [31],
and can be obtained by inverse Laplace transformation using CONTIN algorithm [32,33]. The storage, E′, and the loss, E″, moduli can then be obtained by
where Π is the surface pressure, being γ0 the surface tension of water; being γeq the equilibrium surface tension before the compression.
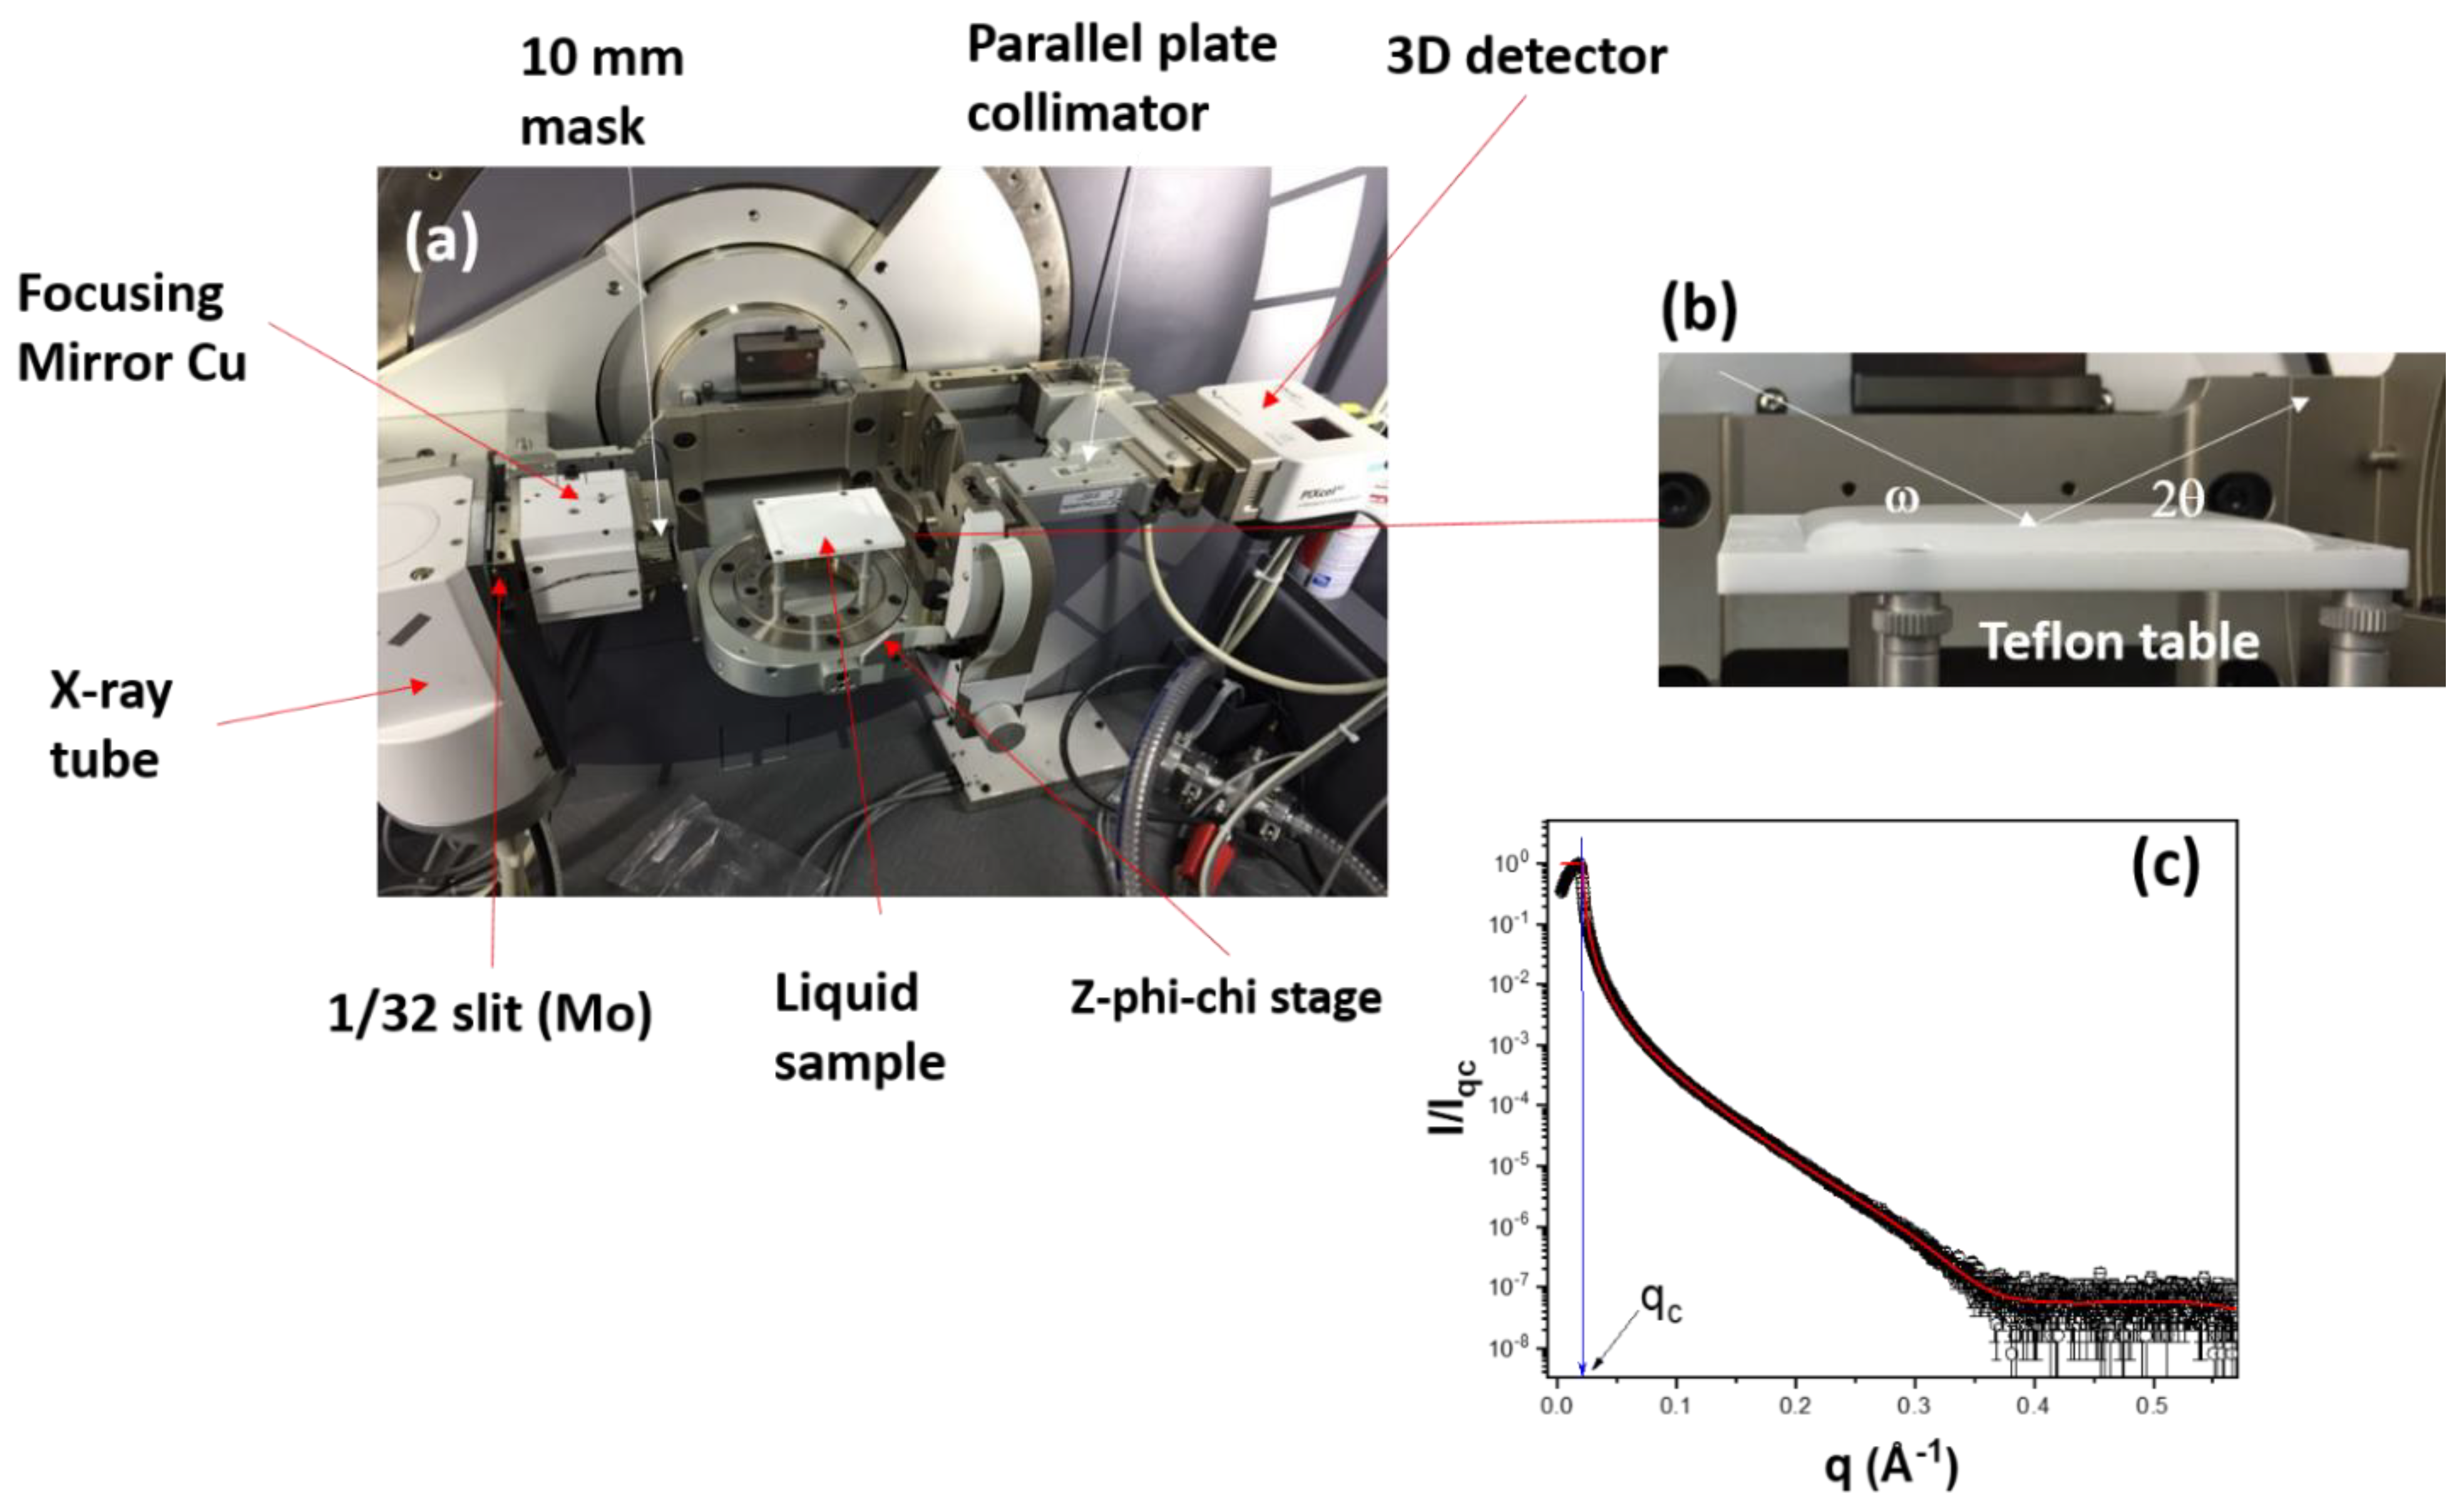
X-ray reflectometry measurements were performed in an Empyrean III apparatus (Malvern-Panalytical) at the Laboratorio de Técnicas de Rayos-X (LaTeR-X) of the Universidad Nacional del Sur. The instrument uses a sealed copper X-ray tube as X-ray source (1.54 Å) in combination with a focusing X-ray mirror (line collimation. 1/32” Mo slit). The device is equipped with a PIXcel3D detector used in 0D mode with only three active channels (active length 0.165) attached to a parallel plate collimator (PPC). A 10 mm mask was used in all experiments. The omega-2theta (ω-2θ) angle was varied between 0.1° and 8° with a step size of 0.0016° and a measuring time of 1.5 s/step, being the explored scattering vector range of about 0.004 < q < 0.57 Å−1. The experiment was adapted to perform measurements at liquid interfaces (see Figure 2). For this purpose, Teflon cuvettes were designed and constructed in such a way that, when filled with samples, the liquid interface exceeds the surface of the cuvette for about 1 mm (see Figure 2a,b; the effect is due to the surface tension and hydrophobicity of Teflon). The cuvette with the sample is placed on z-phi-chi automated stage that allows for precise location of the liquid interface by scanning the direct X-ray beam in z. Using an iteration process, we adjusted z and ω to properly align the sample interface.
All experiments were performed at room temperature (~25 °C) and all data were fitted an analyzed using a stochastic model-independent method [34].
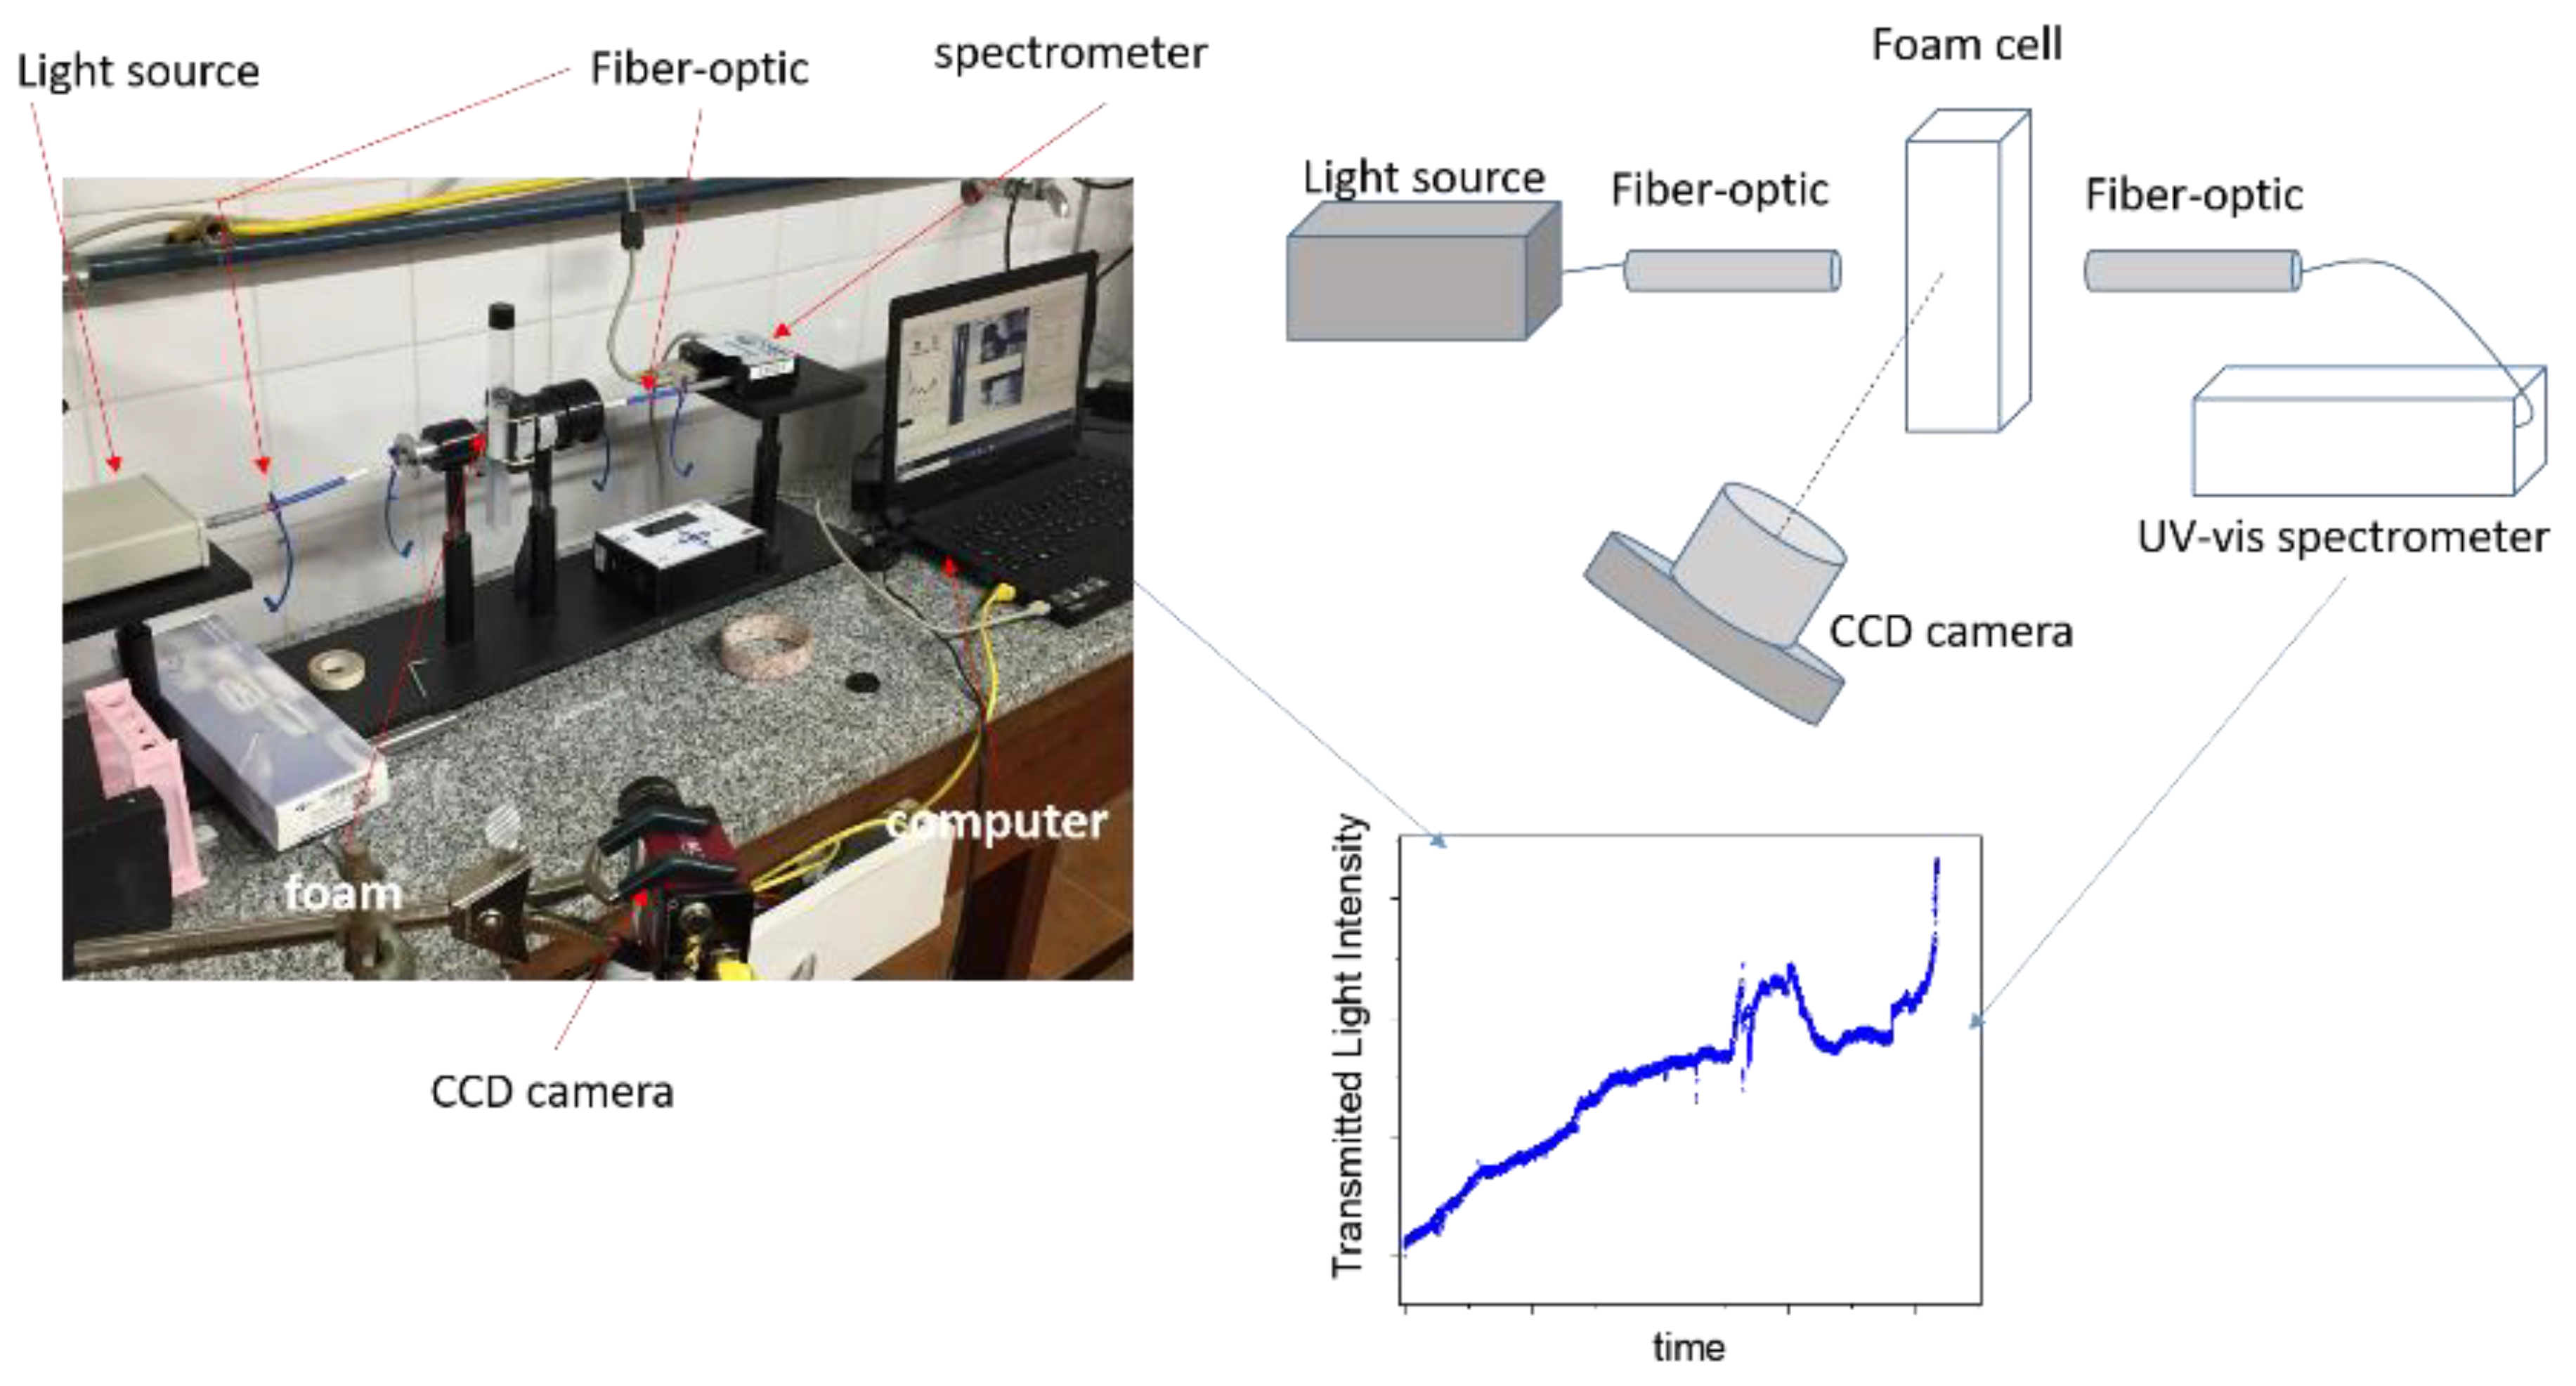
To evaluate the properties of the foams formulated with the PAA-G12 mixtures, we produced foams by simply agitating the liquid in a glass tube for 60 s. The foam thus produced was placed into a homemade holder adapted to a UV-vis fiber optic spectrometer (Ocean optics USB2000+), as shown in Figure 3. A CCD camera (Allied, GE680) was placed in front of the cell. Light emitted by a xenon lamp (Ocean Optics PX-2) was sent through the foam sample via an optical fiber placed at half the height of the cell. The transmitted light intensity was collected by a second optical fiber and measured with the UV-vis spectrometer, integrating the whole spectrum as a function of time (every second a spectrum was taken and saved in a computer for analysis). With this setup, which is similar to the one we had used in [11], we simultaneously followed the foam height and the transmitted light intensity as a function of time, which is related to coarsening dynamics [35,36,37].
3. Results
3.1. Phase Behavior
For all mixtures, at surfactant concentrations below 0.05 mM, and for the entire range of pH from 3 to 11, all solutions are transparent, homogeneous, and no precipitation is observed after 24 h. At pH 3.2 and surfactant concentrations close to and above 0.1 mM, the solutions are homogenous, translucent but whitish, and no aggregates appear after 24 h. When the pH increases to 6, the solution becomes less whitish and more transparent; at pH 11, they are completely transparent. At surfactant concentrations between 0.2 and 0.8 mM and pH 3, the system forms precipitates that remain in suspension and do not redissolve until pH reaches the value close to pH 7.6. At this point, the solution is milky but homogenous throughout the pH range from 7.6 to 11. At pH 3.2 and a surfactant concentration corresponding to the G12 cmc (~0.9 mM), the precipitation of aggregates occurs instantaneously, but these precipitates are completely redissolved at pH 7.4 or higher. When the surfactant concentration exceeds the cmc by a factor of 2 or more, the precipitates cannot redissolve, even at pH 11.
3.2. Equilibrium Surface Tension
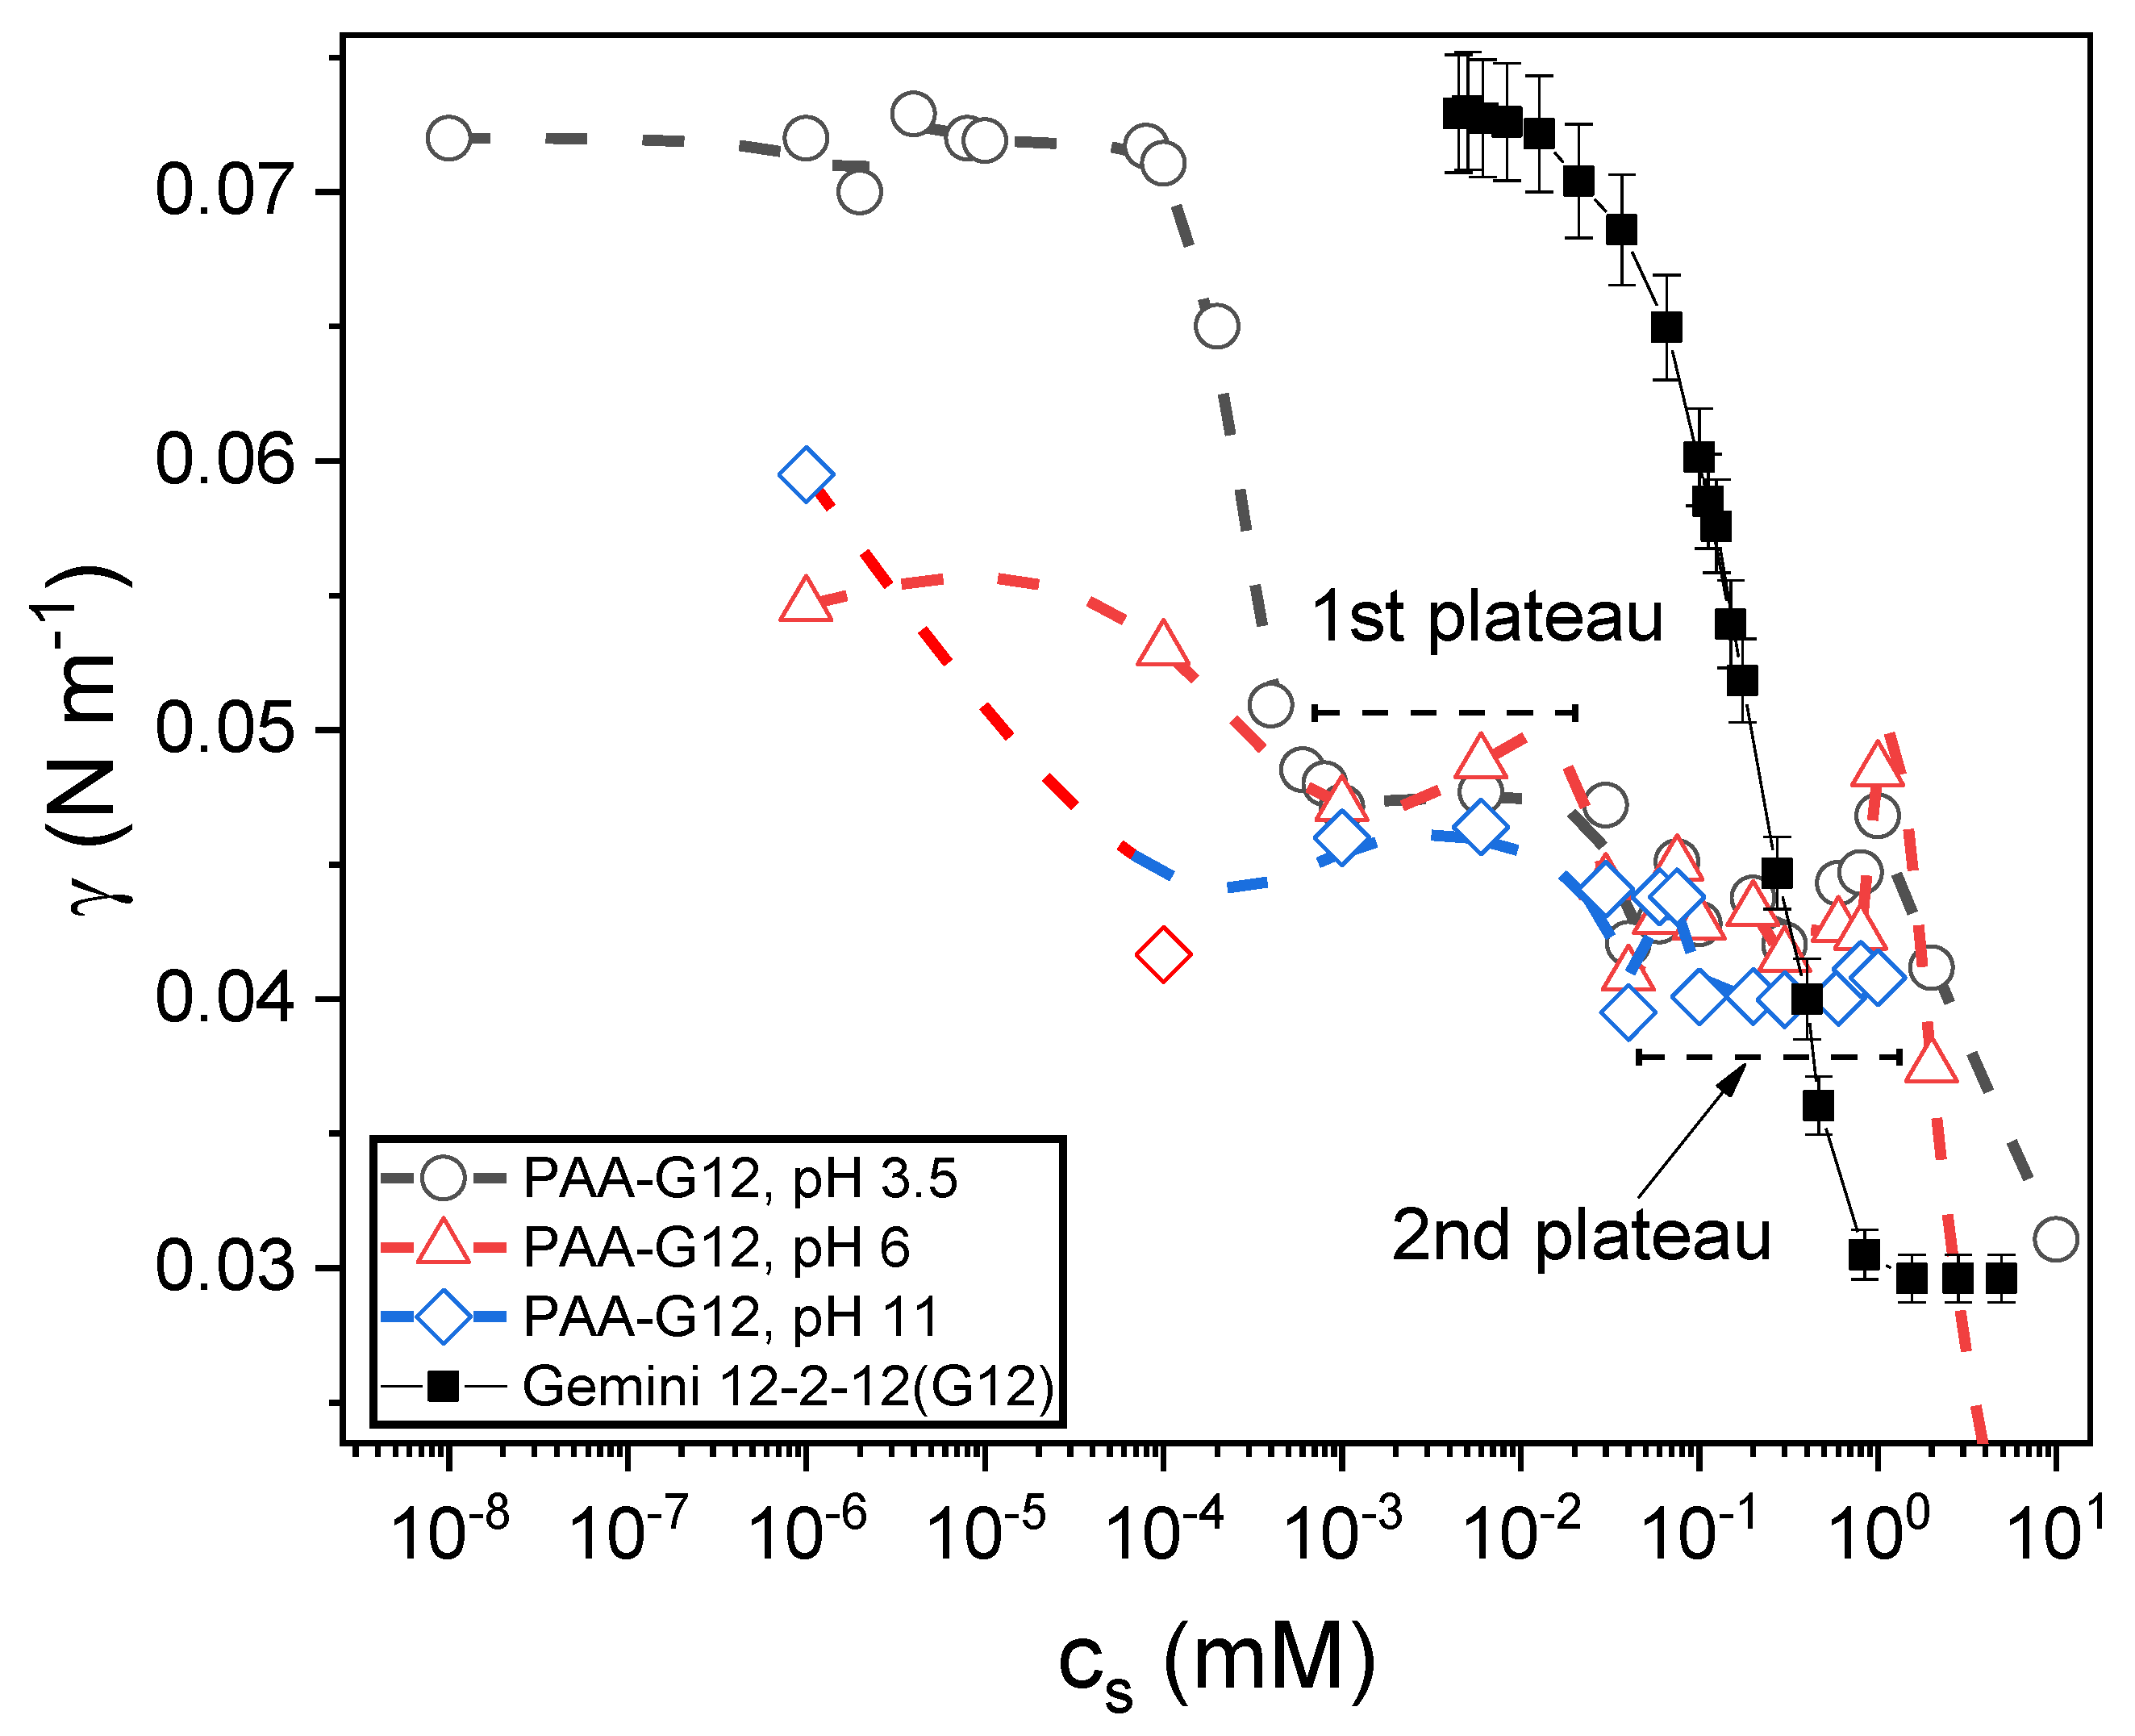
Figure 4 shows the equilibrium surface tension isotherms of PAA-G12 mixtures in aqueous solution as a function of surfactant concentration for three values of pH: 3.5, 6, and 11. The equilibrium isotherm for PAA-free Gemini solutions is included.
First, note the synergistic effect produced by the addition of only 1 mg per milliliter PAA to the G12 equilibrium surface tension. For example, at all three pHs, the surface tension is reduced to about 45 mN m−1 at surfactant concentrations as low as 10−3 mM, which is three orders of magnitude bellow the cmc. At this concentration, the PAA-free G12 solution has a surface tension equal to that of pure water, 72 mN m−1. Differences in the isotherms are also observed depending on the pH, the synergy increases as the pH increases from 3.5 to 11, being the effect more pronounced when the pH rises from 3.5 to 6 than when it rises from 6 to 11. Two plateaus are clearly observed on the isotherms: the first one in the range 10−3 < cs < 0.026 mM and the second one for 0.03 < cs < 1 mM (~cmc). Based on these isotherms, we decided to study next the mixtures at cs = 10−3 and 4 × 10⁻² mM, which correspond to the first point and to a point in the middle of the first plateau, respectively, and the ones at cs = 0.1 and 0.5 mM, both in the second plateau.
3.3. Dynamic Surface Tension
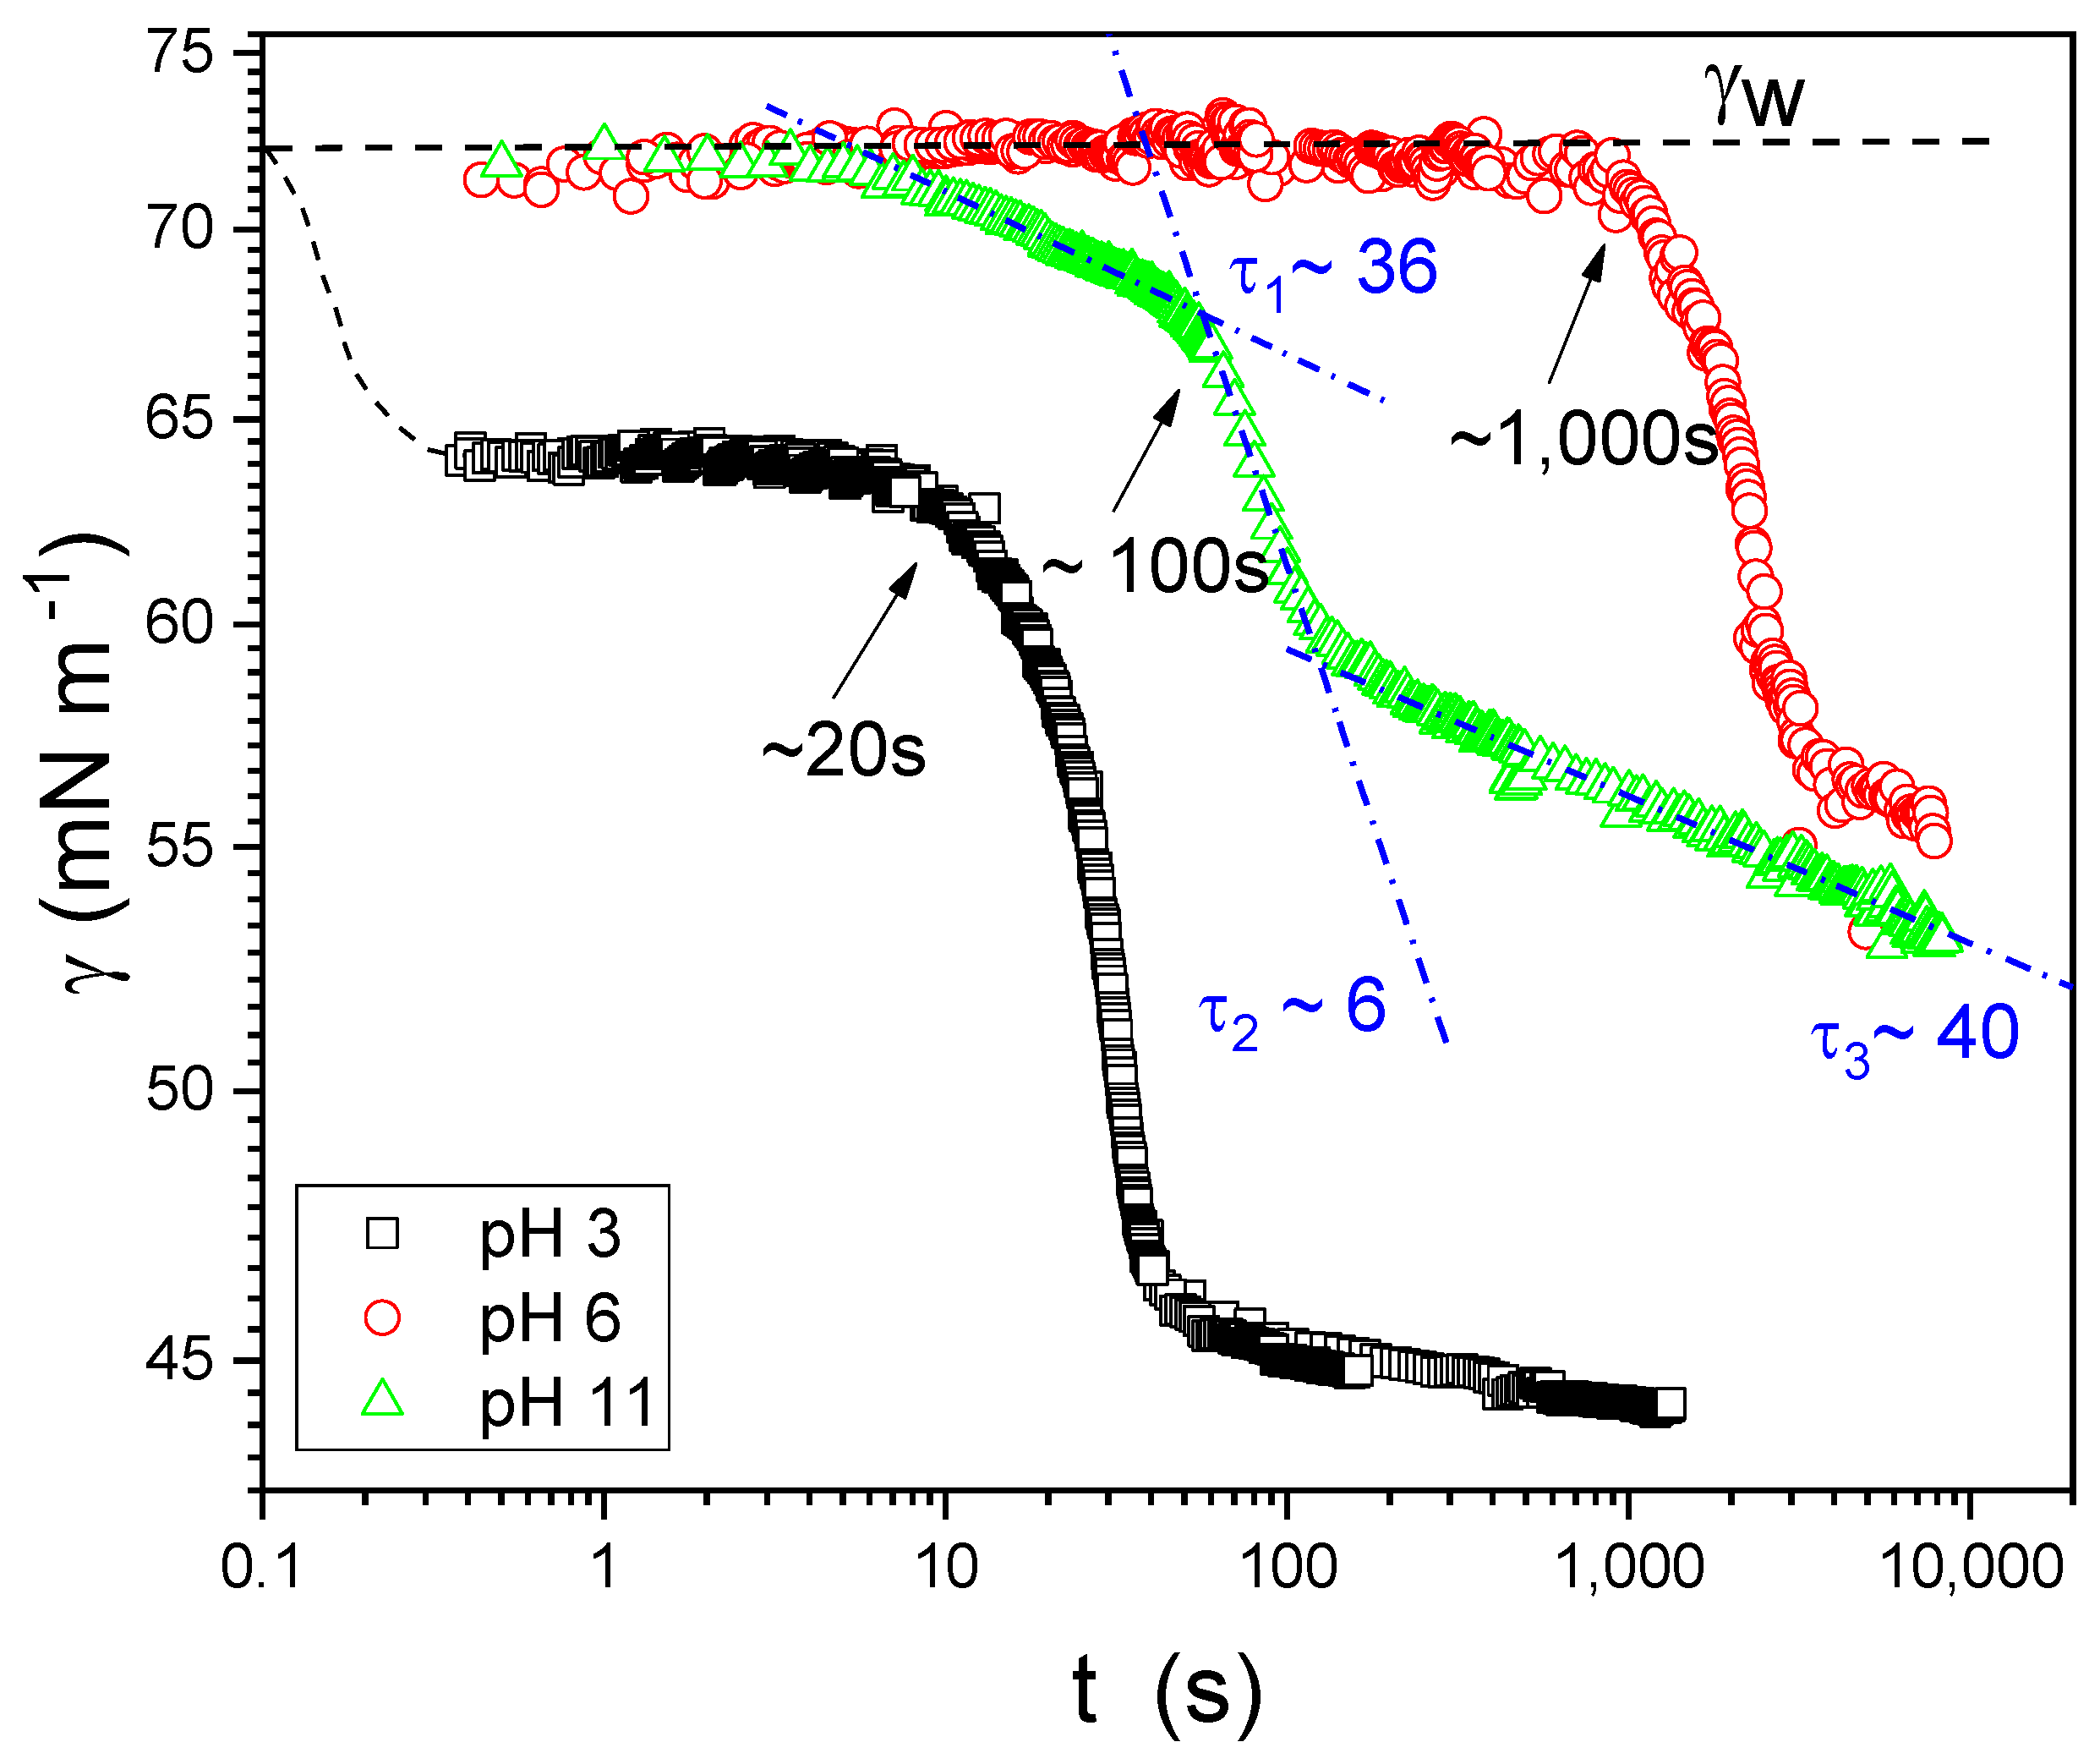
Figure 5 shows the dynamic surface tension results for a mixture at cs = 0.5 mM and the three pHs studied. The results for other surfactant concentrations are similar (see Supplementary Figures S1–S3). For all pH values, the surface tension decreases appreciably only after a certain induction time (shown by arrows in Figure 5). This induction time depends strongly on pH. The induction times are tind ~ 20 s, 1000 s, and 100s for pH 3.5, 6, and 11, respectively. Note that, at pH 6, the dynamics is very slow, but at the end of the adsorption process the equilibrium surface tension value is quite the same at all pH (see Figure 4, equilibrium isotherms). In the experiments for pH 6 and 11, the measurements were interrupted before the equilibrium values were reached, due to bubble detachment (it was very difficult to keep the bubble attached to the tip for such a long time). At pH 3.5, the curves start at a surface tension of about 65 mN m−1, well below that of pure water, γw = 72 mN m−1. This is because the time needed to form the initial bubble (~1 s) in pendent drop experiments is large compared to the initial adsorption step in this system, at this pH. As stated above, the results are qualitatively similar for the surfactant concentrations studied: cs = 10−3; 4 × 10⁻² and 0.1 mM (see Supplementary Materials).
We also observed that the adsorption dynamics are complex, with several characteristic times that can be fitted with exponentials. These fittings are represented in Figure 5 as dash-dot lines in the case of pH 11, for which the characteristic times are also indicated in the figure (τ1, τ2, τ3). Additional data for other concentrations and pHs are included in the Supplementary Material, but all have the same features: multiple relaxation processes and the presence of a pH-dependent induction time. The induction time, τI, follows the order τI, pH=3 < τI, pH=11 < τI, pH=6.
3.4. Surface Viscoelasticity
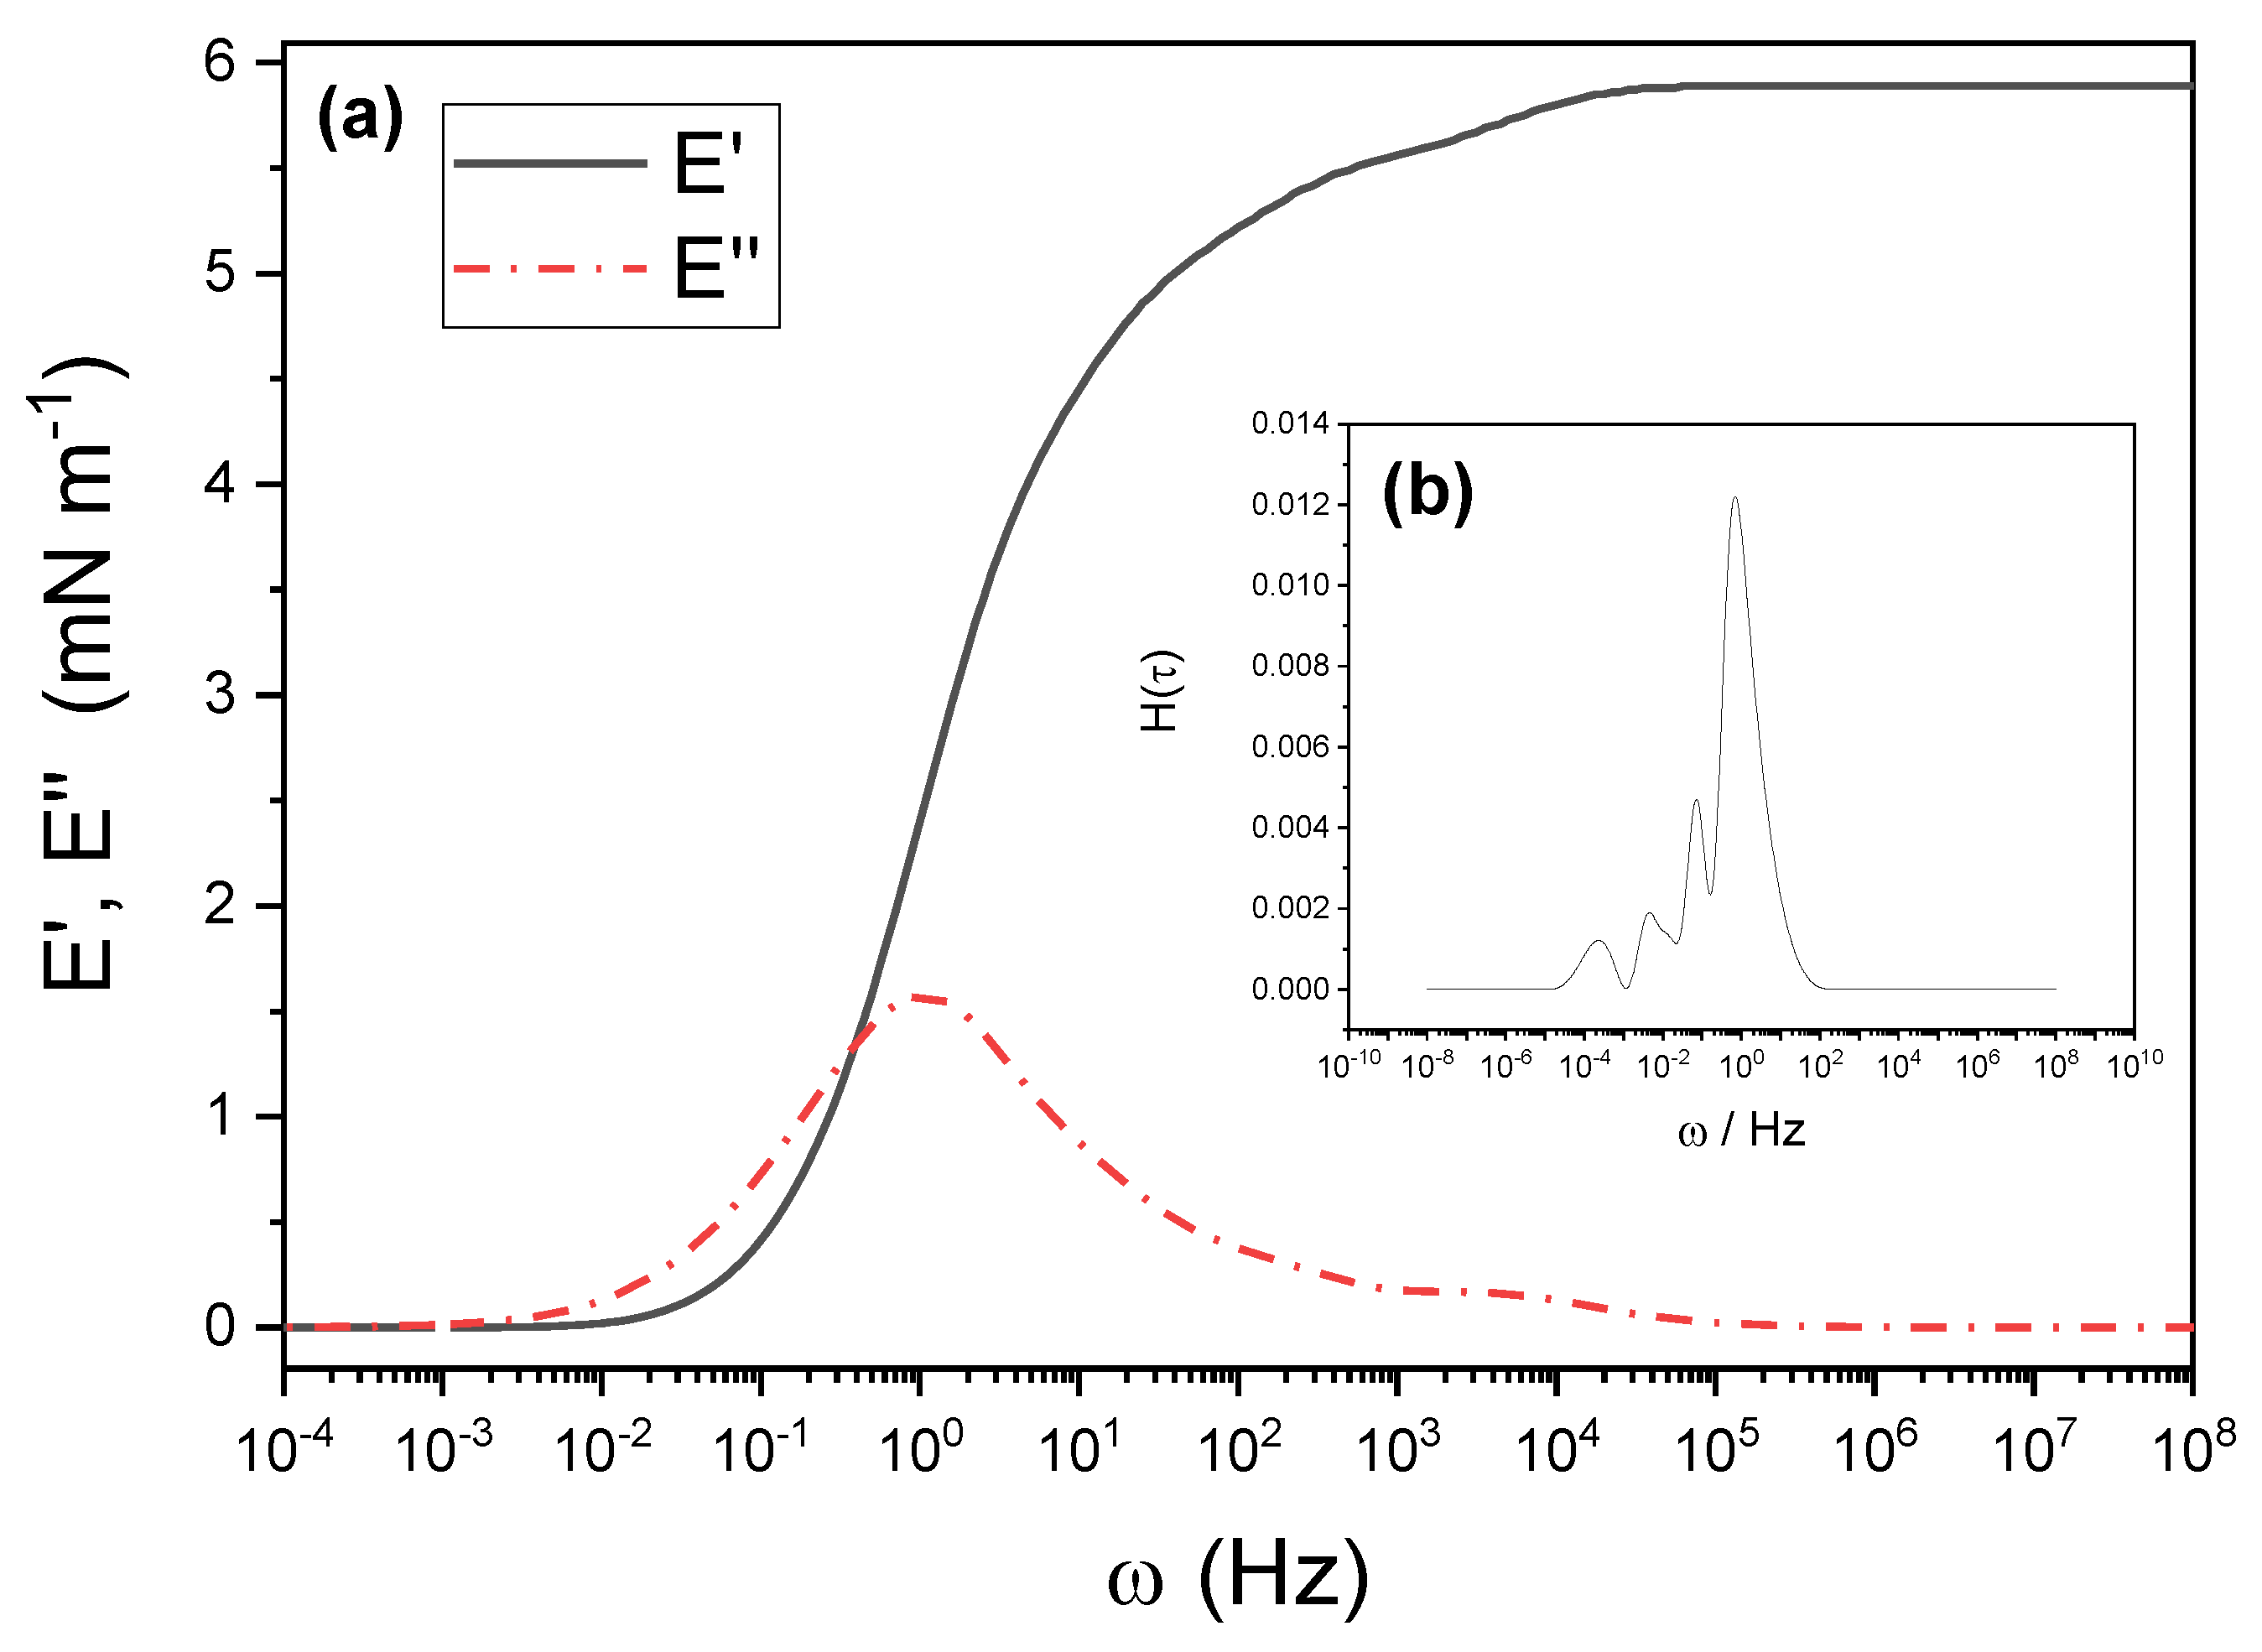
It is generally accepted that the dynamics and stability of foams depend on the surface elasticity [25,38,39]. Figure 6 and Figure 7 show the results of step-compression experiments analyzed with CONTIN [32], as explained in the Methods section and done previously [11]. The figures correspond to the mixtures at cs = 0.1 mM at the three studied pHs. Results for other concentrations are presented in Supplementary Figure S4. Figure 6b corresponds to pH 3.5 and shows the output of CONTIN, H(τ), from which, by integration with Equation (4), the elastic and viscous moduli are obtained. The result is shown in Figure 6a. Figure 7a,b present the results at pH 6 and 11, respectively.
Note that both the elasticity modulus and the viscosity modulus decrease by a factor of about 10 when changing from pH 3.5 to pH 6. The values of E′ and E″ at pH 11 fall between these values but are closer to those at pH 6. The results are qualitatively similar for cs = 0.5 mM (see Supplementary Figure S4). Viscoelasticity decreases with the pH, but the absolute value for the elasticity modulus at pH 3.5 is lower than that at cs = 0.1 mM. We will see later on that this correlates well with foam stability.
3.5. X-ray Reflectometry (XRR)
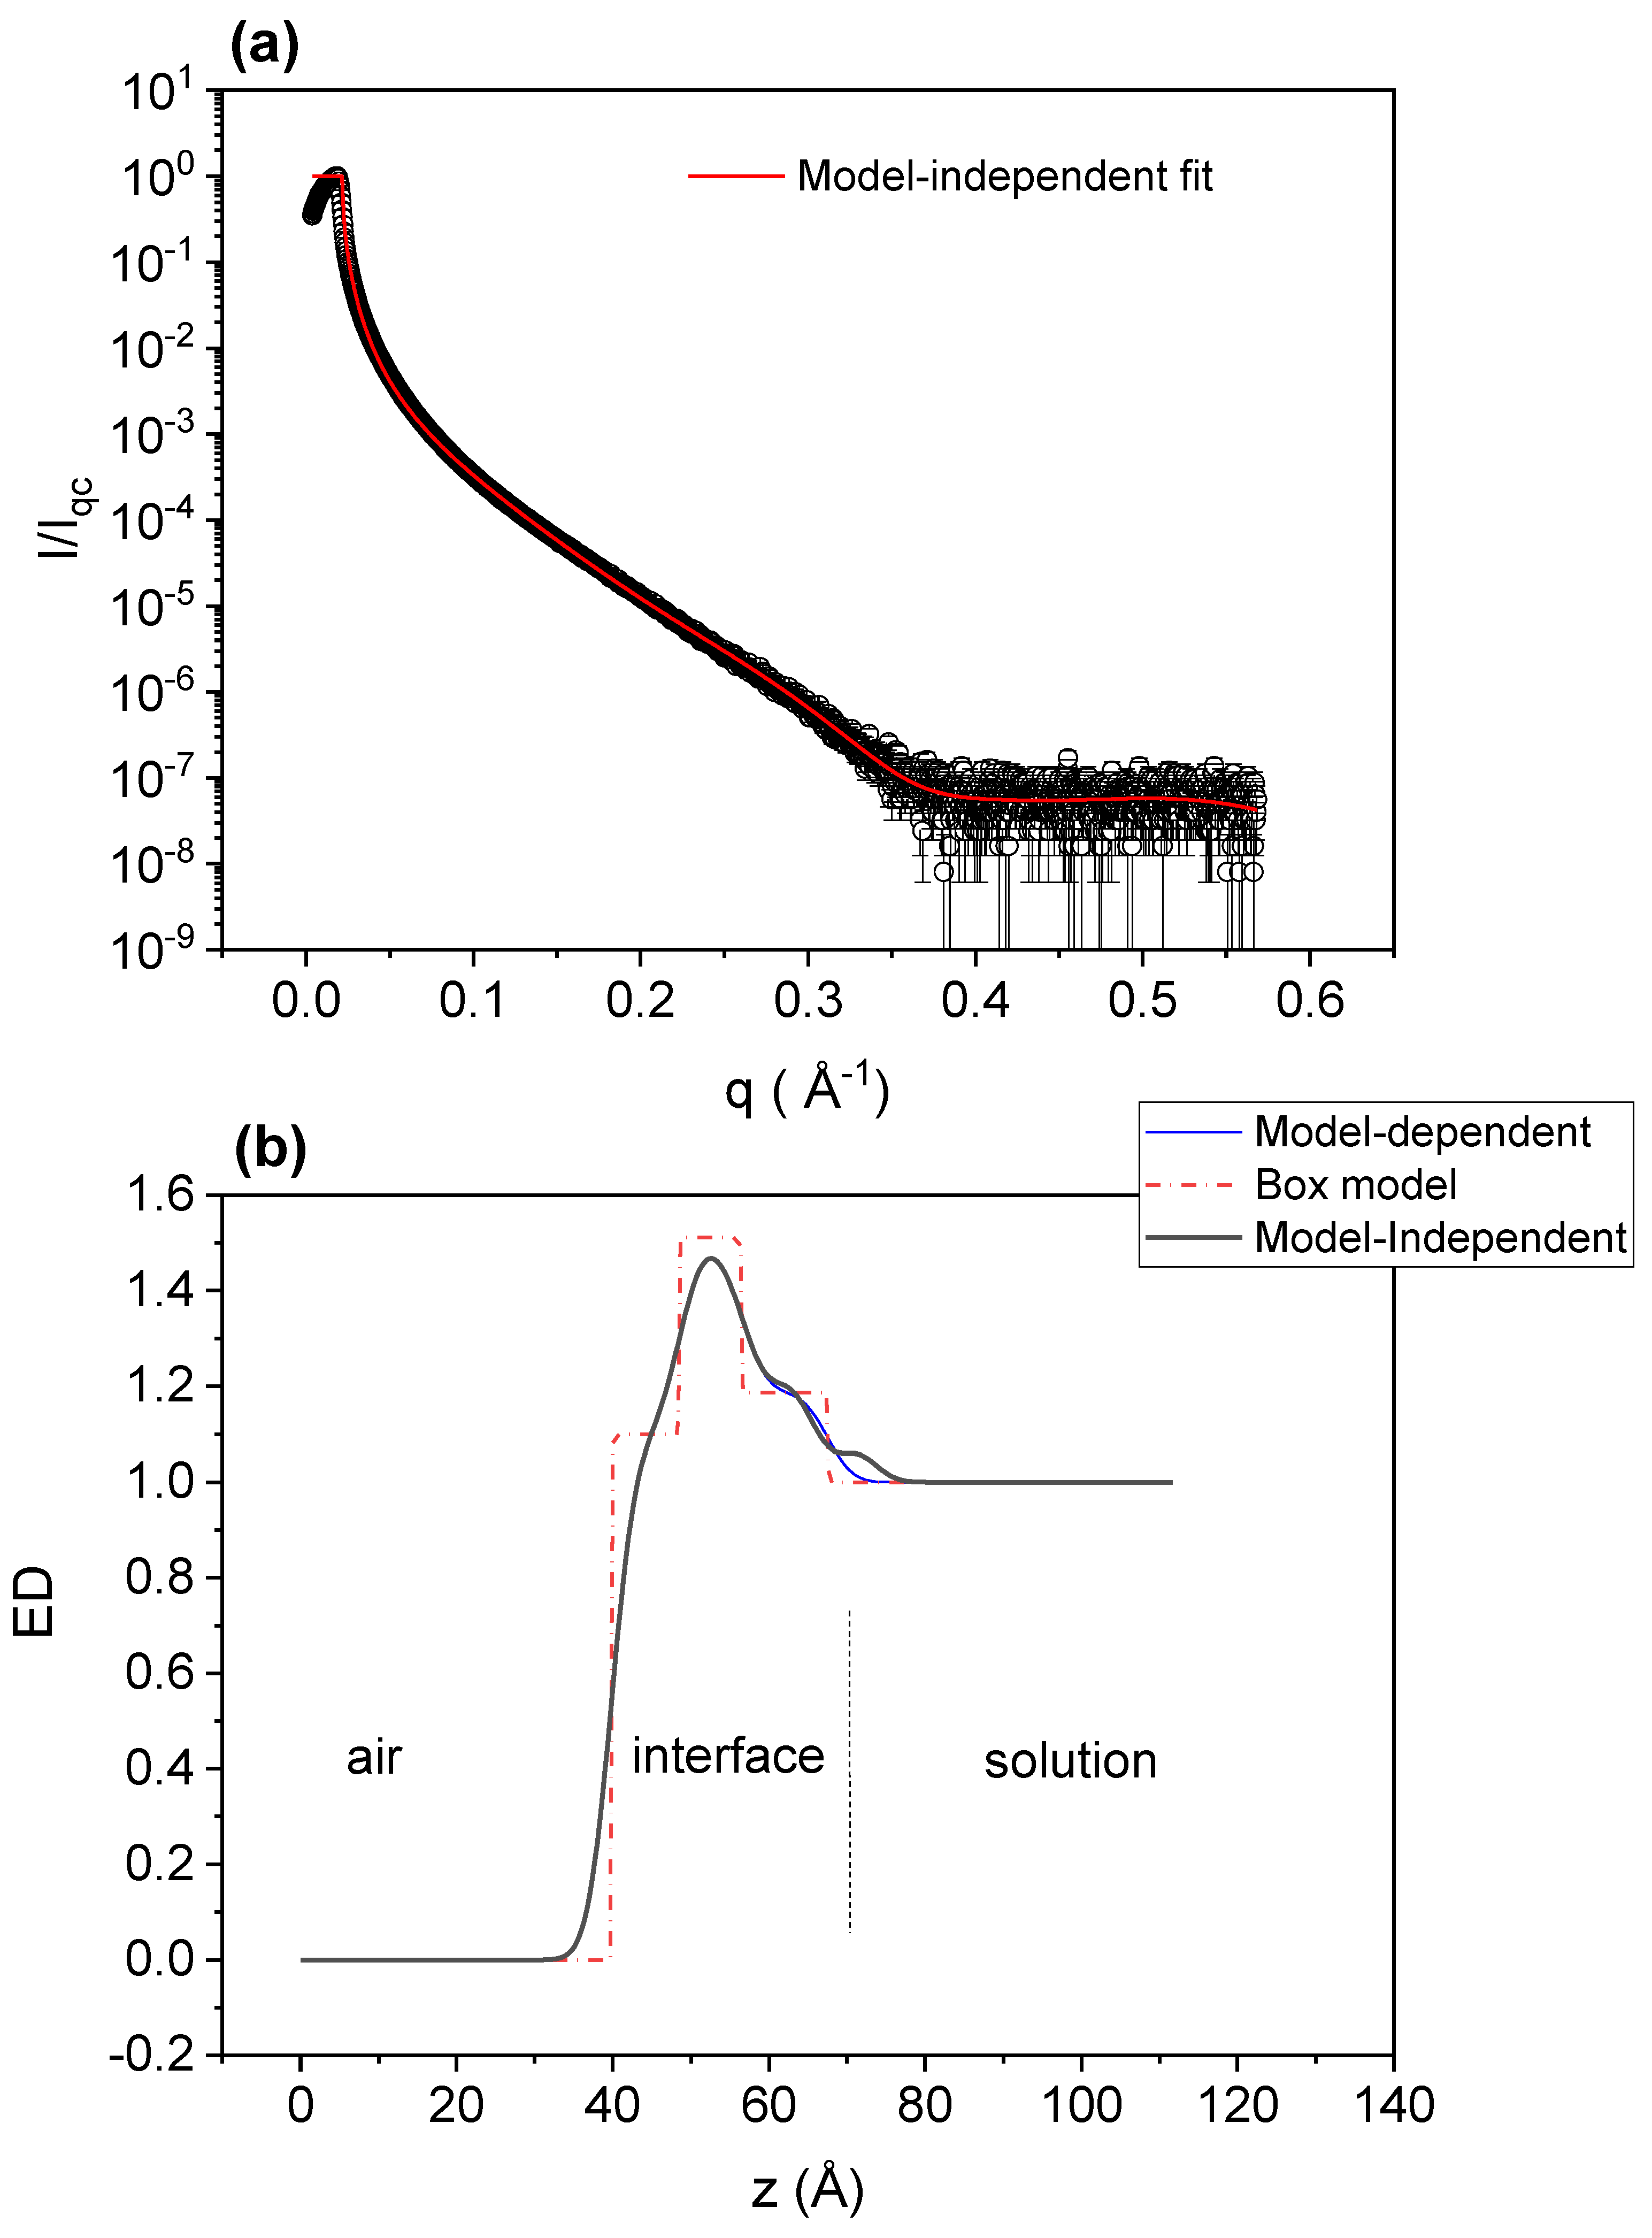
To gain insight concerning the complexation and responsiveness at interfaces, we performed XRR experiments. XRR has been used previously in the study of polyelectrolyte–surfactant adsorption at liquid–air interfaces and in relation with foam stability [40,41,42]. First, we measured the solution–air interface for the PAA-free G12 mixture at a concentration above the cmc. Figure 8 shows the XRR results for G12 at a concentration of 2 mM, which is twice the surfactant cmc, ensuring that the interface is saturated with a monolayer of surfactant molecules. Panel (a) of that figure presents the reflectivity, R = I/Iqc, where I is the intensity reflected from the interface and Iqc is the intensity reflected at the critical angle versus the z-component of the wave vector, q. The line is a model-independent fitting using StochFit [34]. The resulting electron density (ED) profile in the z direction (perpendicular to the interface) is shown in Figure 8b together with a model-dependent fit, using the box model shown on the figure. The box model fits the data quite well, given a total monolayer thickness of (27.5 ± 0.5) Å. If we consider the width of the first box as the length for the hydrophobic tail of G12, that gives (9.1 ± 0.3) Å, which means that the head region, including the counterions, would have a thickness of (18.4 ± 0.8) Å. The maximum relative ED with respect to the bulk solution of this region gives 1.51 ± 0.01, and it is located at a distance from air of 12.4 Å. The distance from air to the maximum ED is a closer estimation for the hydrophobic tail, and it correlates well with the length (l) of an aliphatic chain of n-CH2 in all-trans configuration. This length can be calculated [43,44] by l = 1.5 + 1.265 n Å, given, for n = 12 (G12), l = 15.2 Å.
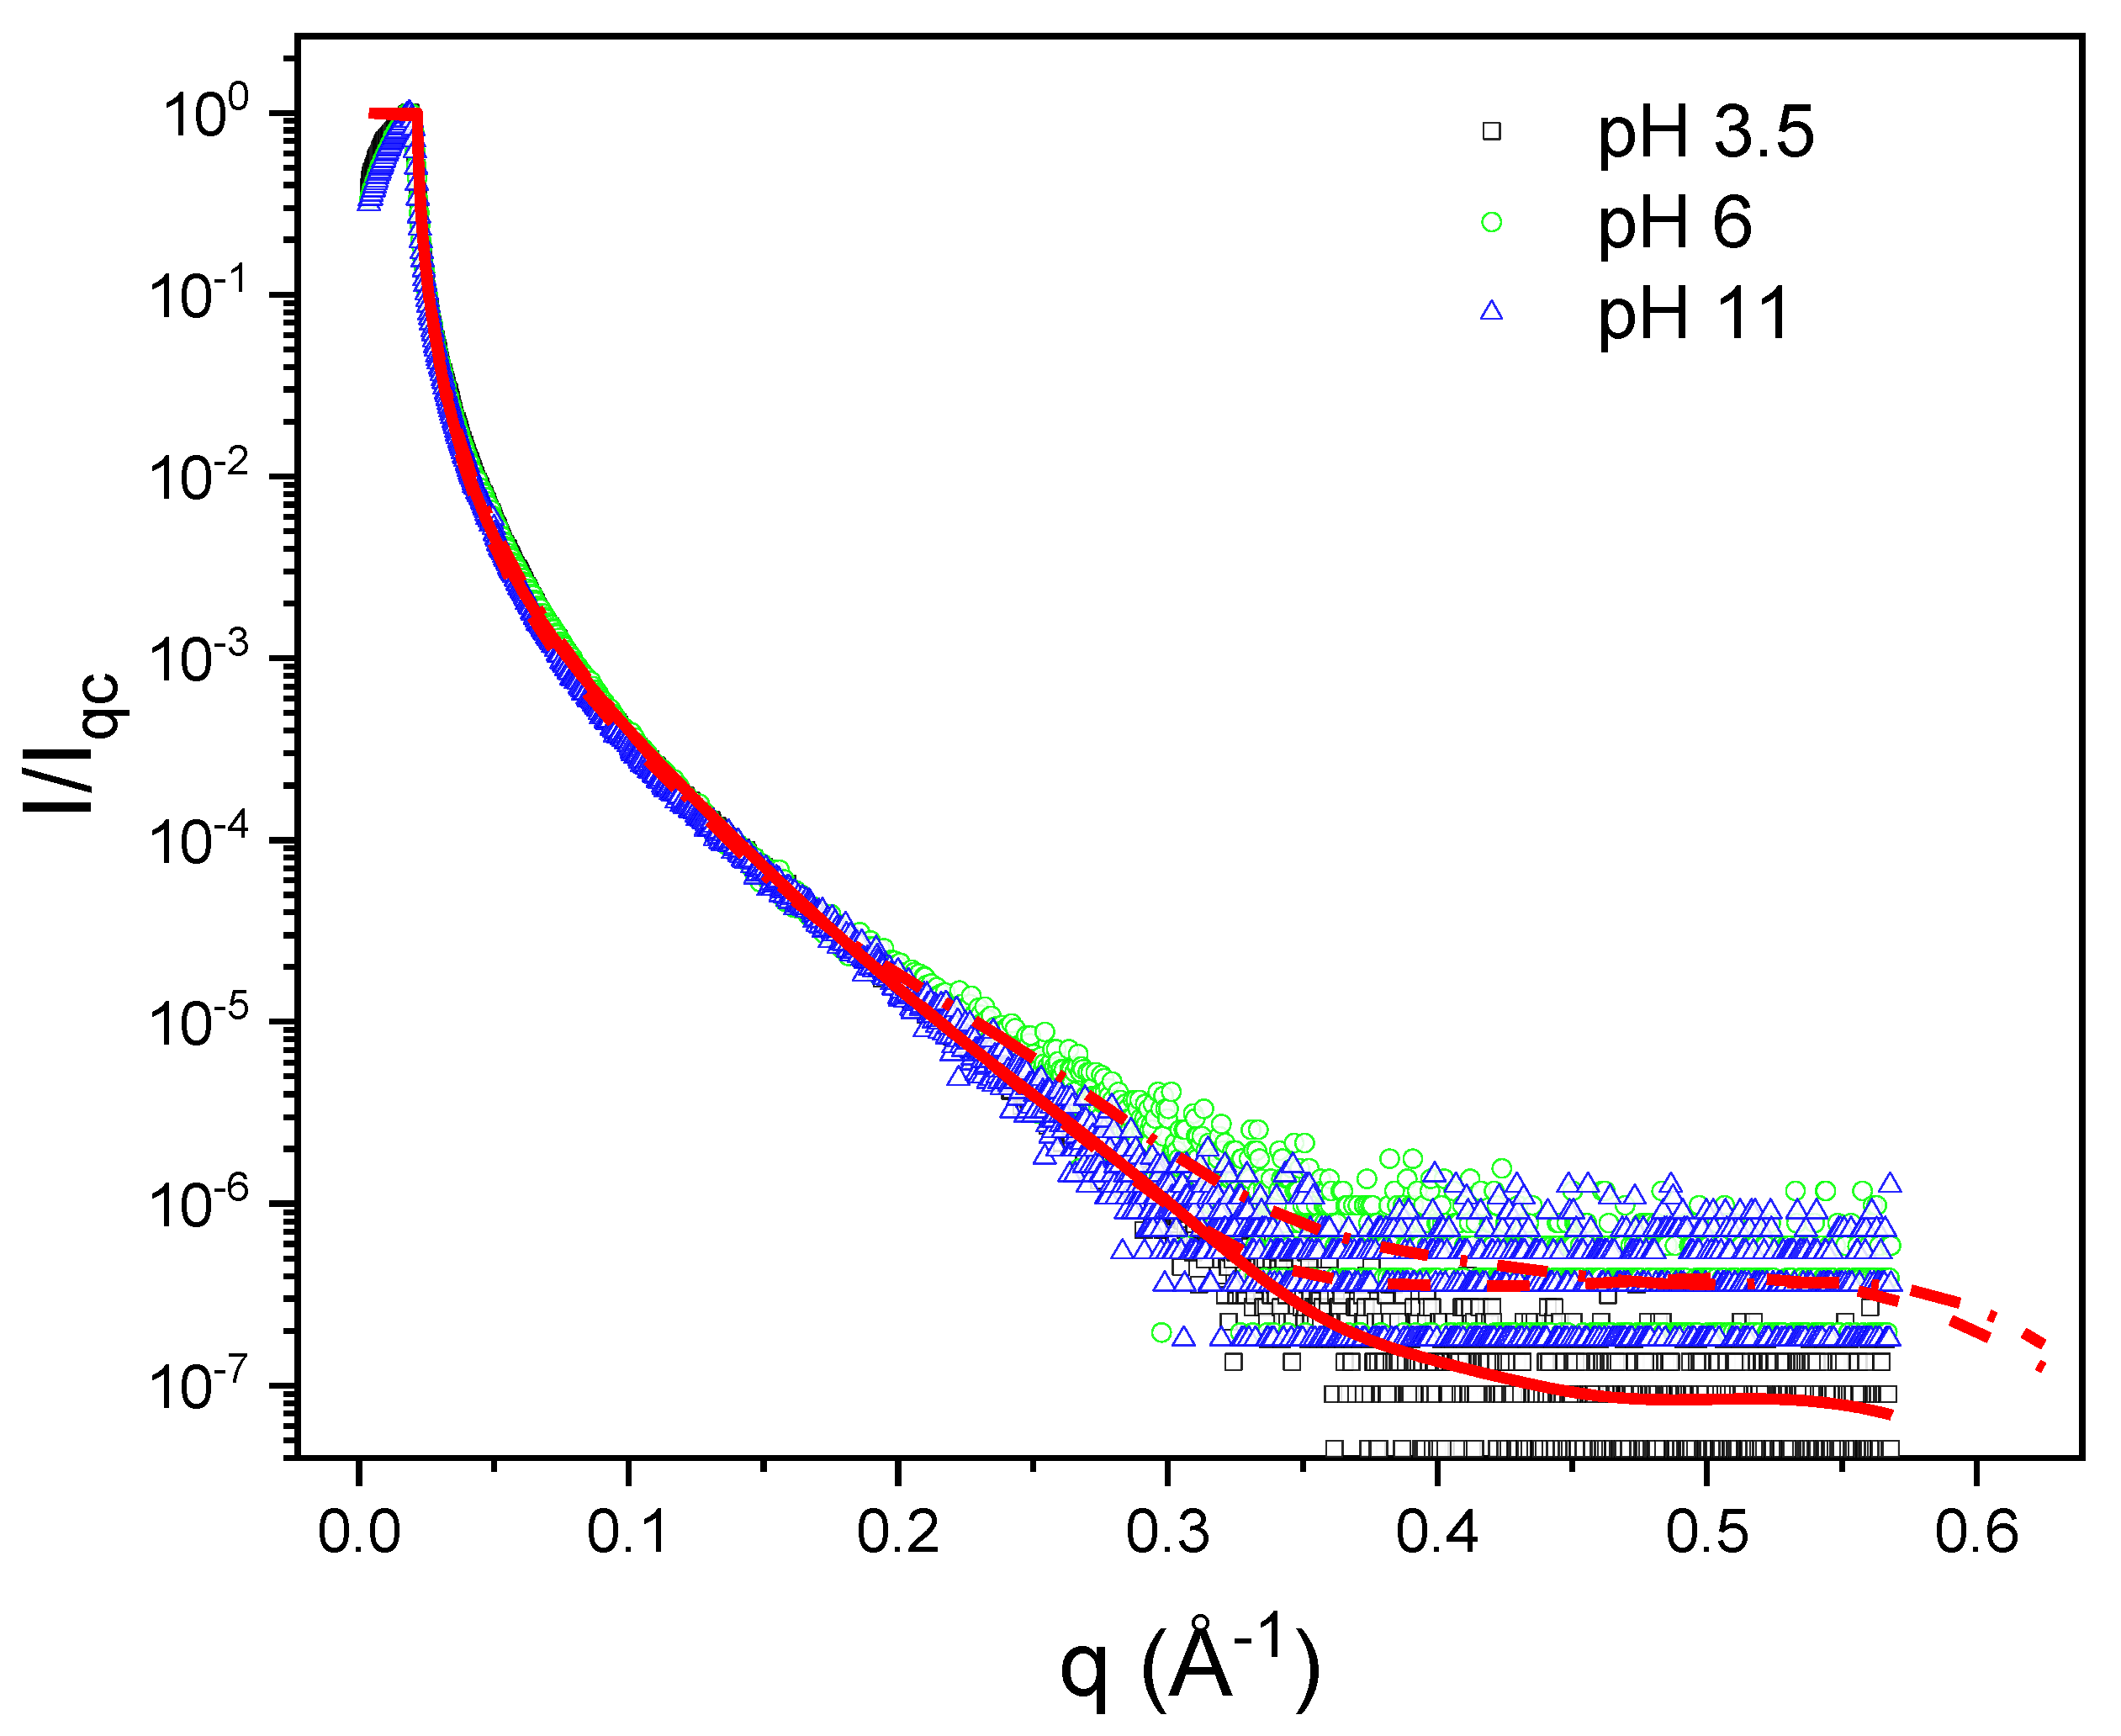
Figure 9 shows XRR results for 1 mg L−1 PAA + 0.5 mM G12 at pH 3.5, 6, and 11. We included in the figure the fitting curves using StochFit. Note that all the curves are quite similar and they do not depend much on pH. This behavior is reproduced for all surfactant concentrations measured. The results of the fittings are summarized in Table 1, where we present the results for all surfactant concentrations studied.
Table 1 shows that the interfacial thickness of the PAA-G12 complex layer, ~45 Å at pH 3, is approximately 60% greater than the thickness of the pure Gemini monolayer, ~27 Å. At pH 6, the apparent thickness for the complex layer is close to that of pure Gemini. Note that the maximum relative ED, in all cases, is ~1.5, which is the same value obtained for PAA-free Gemini monolayers (~1.51). The distance from the air to the region with the maximum ED for the complex layer is between 10 and 17 Å, a value close to that of pure Gemini monolayers, ~12.6 Å. The apparent thickness of the PAA-G12 layers depends on the pH, following the order pH 6 < pH 11 < pH 3.5.
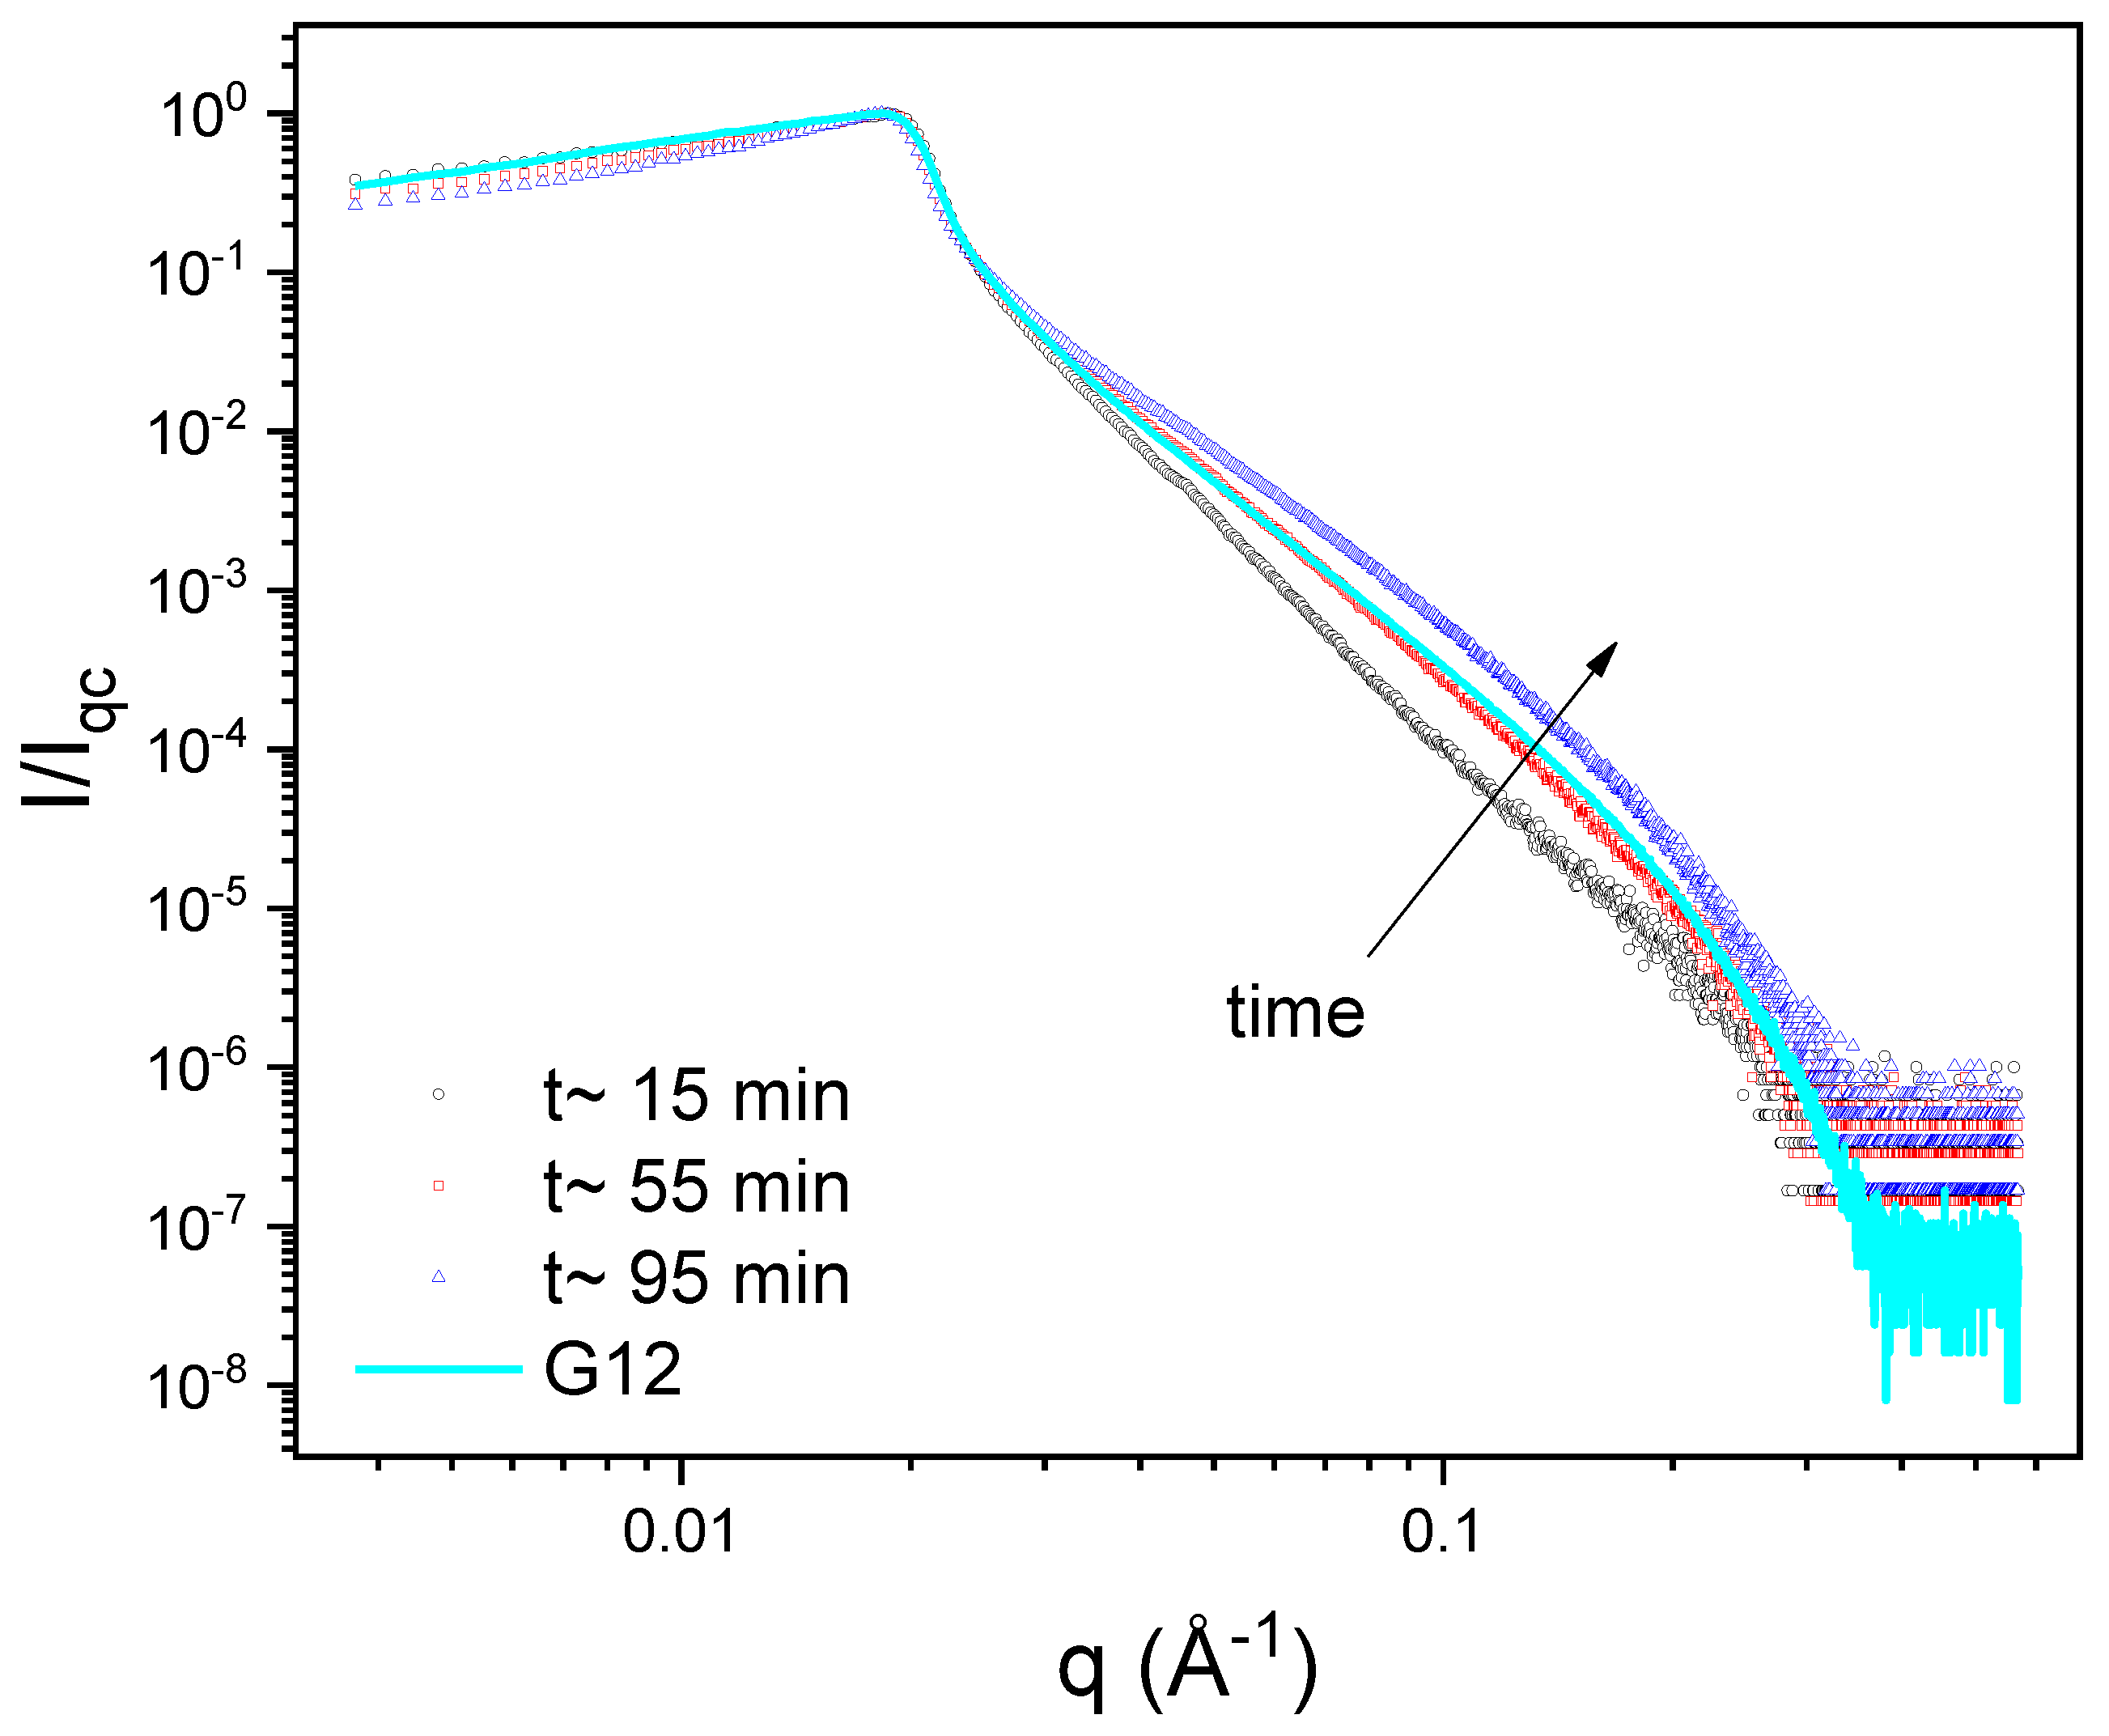
Because of the very slow interfacial dynamics we observed from the dynamic surface tension (see Figure 5), we tried to observe the adsorption process by XRR. For all solutions at pH 3.5, this was not possible due to the time needed to prepare the experiments and align the liquid samples, which is about 15 min (see Supplementary Figure S5). The only exception was the mixture at cs = 10−3 (see Supplementary Figure S6). At pH 6 and 11, it was possible to observe this. A typical result is shown in Figure 10.
The results of fitting the curves in Figure 10 are shown in Table 2. Both the layer thickness and the relative ED increase with time, from very low values to those of equilibrium. Compare the results in Table 2 with those for the same surfactant concentration and pH (cs = 0.1 and pH 11) in Table 1. The values are almost the same, which is reassuring because they correspond to independent measurements on samples prepared on different days for the same mixture and pH. Note that, at 55 min, the curve is quite indistinguishable, except for the baseline, from that of G12.
3.6. Foam Stability
We produced foams with PAA and G12 mixtures and studied their dynamics to evaluate their stability as a function of pH. For surfactant concentrations below 4 × 10⁻² mM, the foams were very unstable at all pHs. For the range 4 × 10⁻² ≤ cs ≤ 0.5 mM, very stable foams were produced only at pH 3.5, the stability being at cs = 0.5 slightly lower than cs = 0.1 and 4 × 10⁻² mM. When the pH increases to 6 and above, the foamability, that is, the ability of produce foams, was very low and the little foam that was formed was very unstable. We observed that the production and stability of foams were slightly better at pH 11 than at pH 6 (this is illustrated on the video in Supplementary Materials).
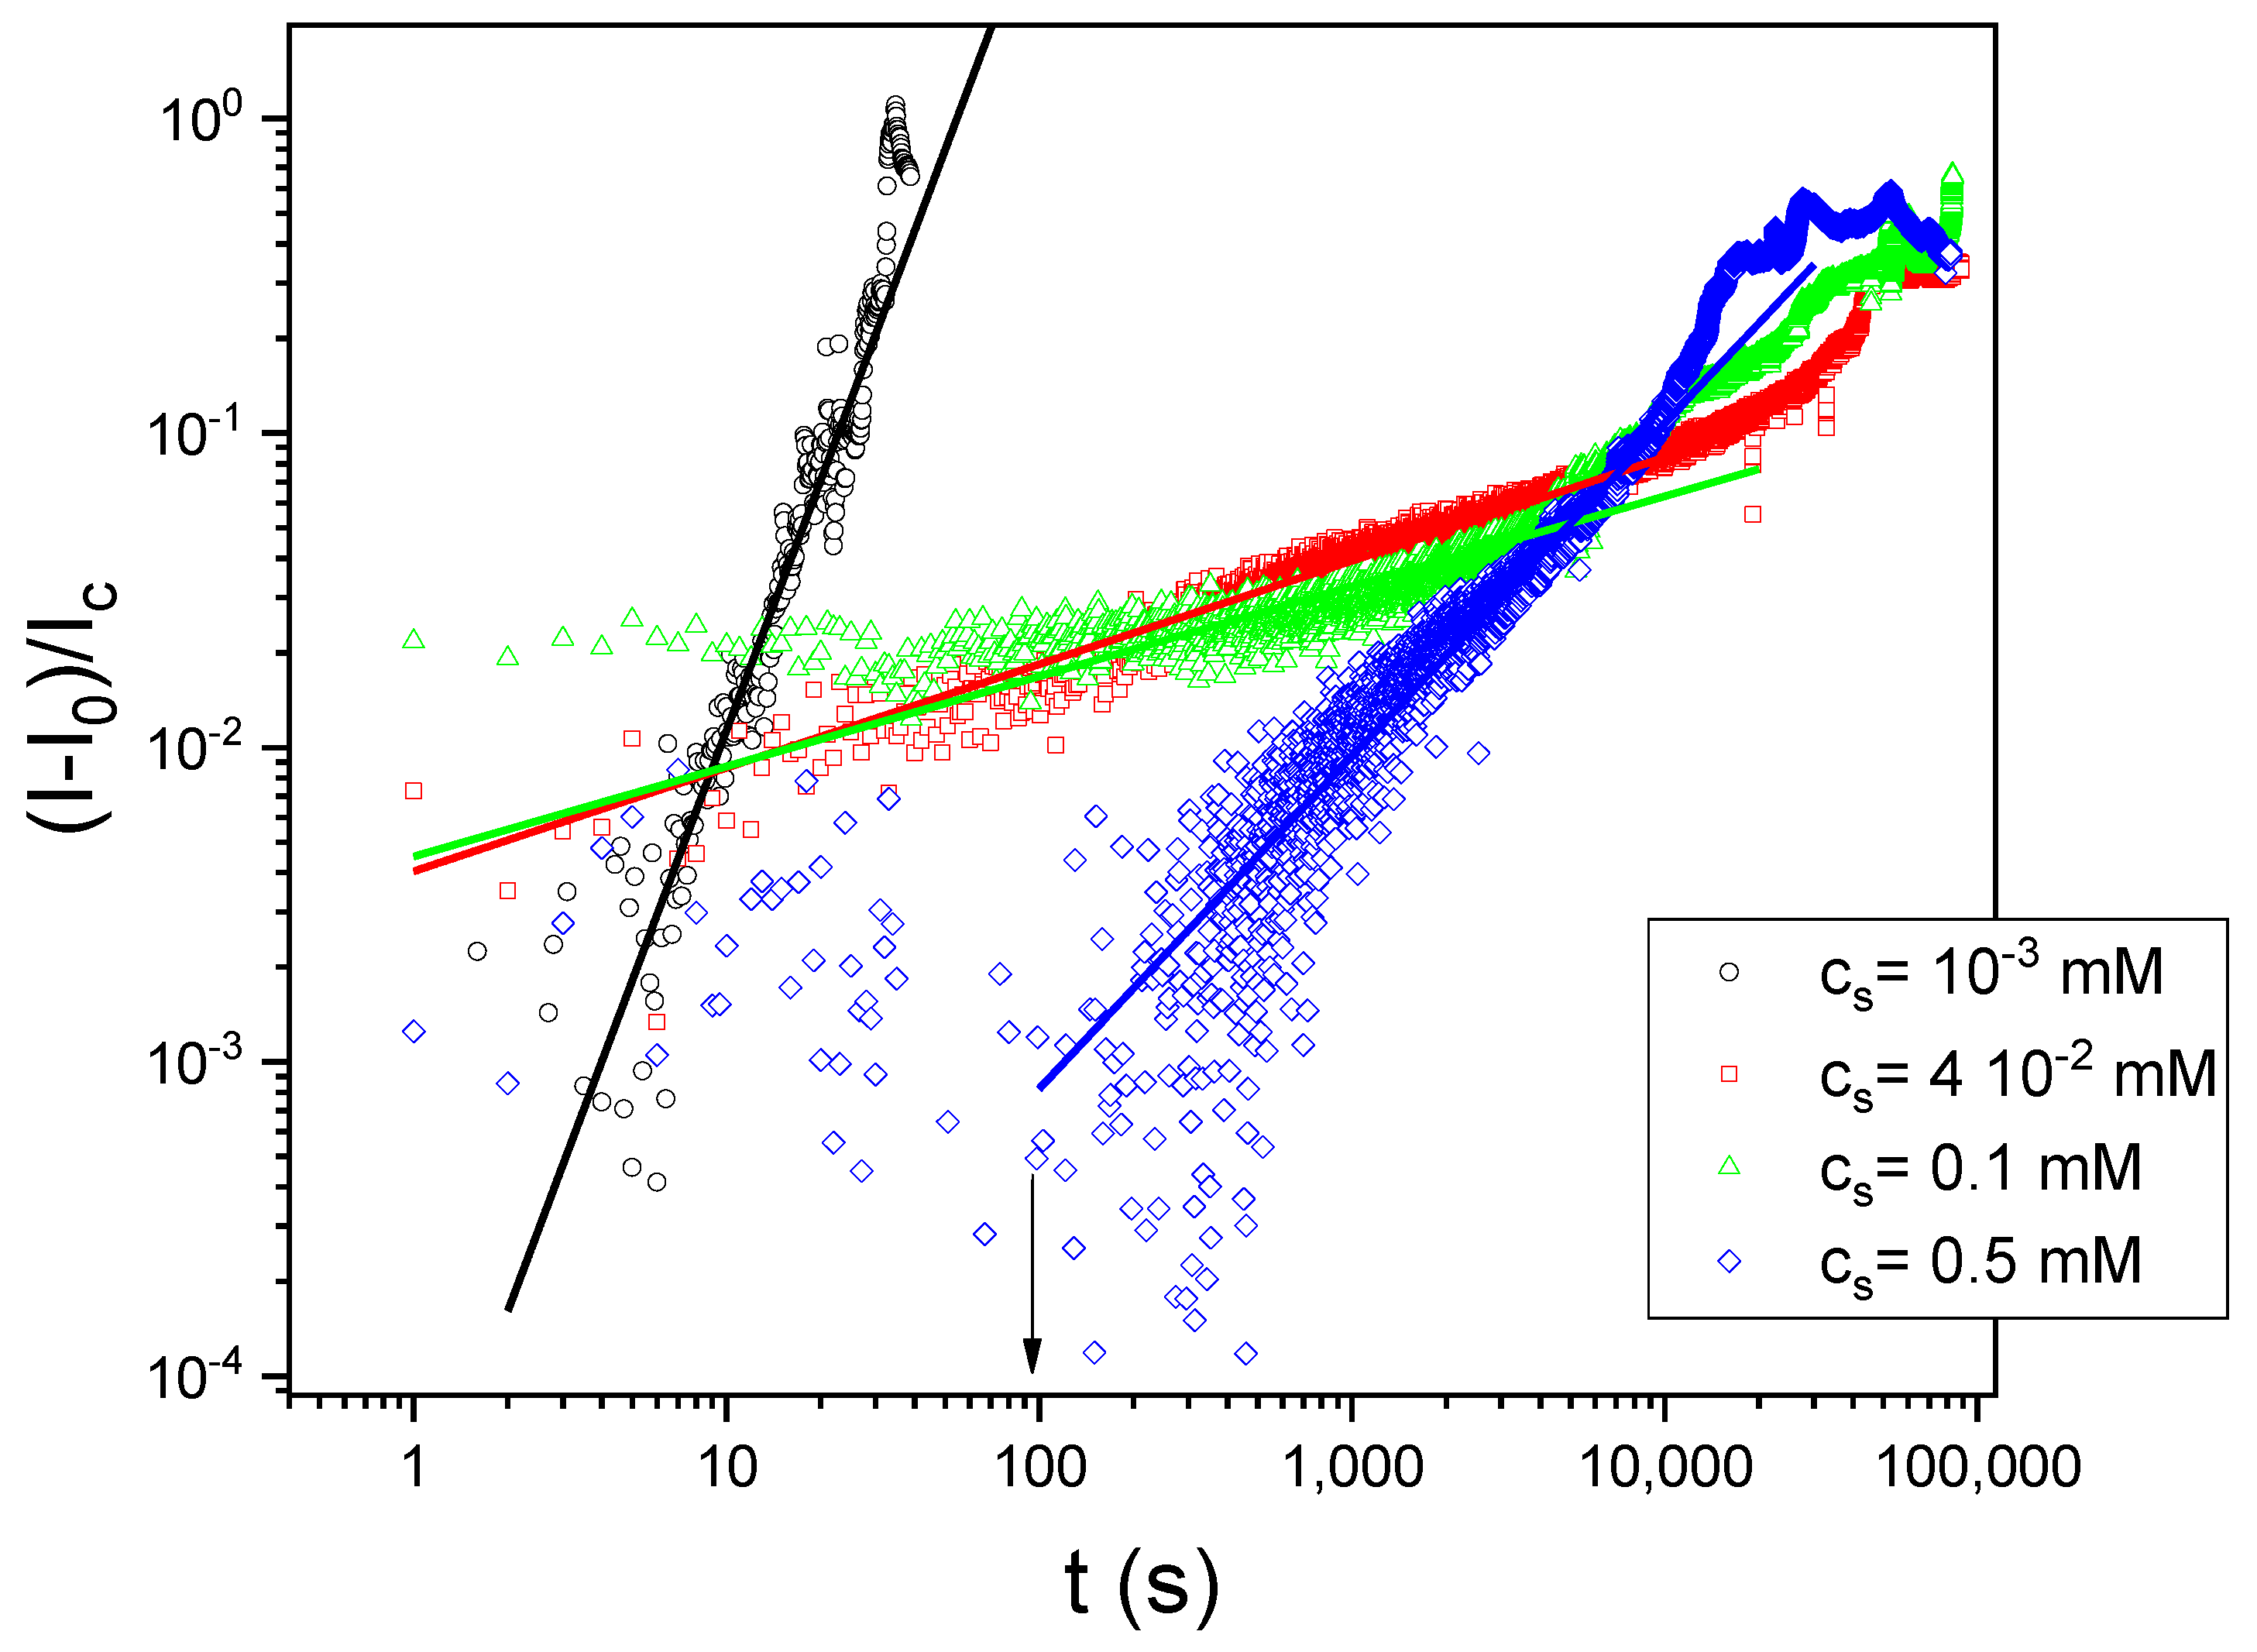
Figure 11 shows the results for multiple light scattering experiments from which we followed the foam dynamics. The light intensity transmitted through the foam sample is related to the mean free path for photons and thus can be related to coarsening dynamics, at least under certain assumptions (see Discussion). We observed that the slopes on a log-log plot are smaller for the most stable foams, that is, at cs = 4 × 10⁻² and 0.1 mM (see Discussion).
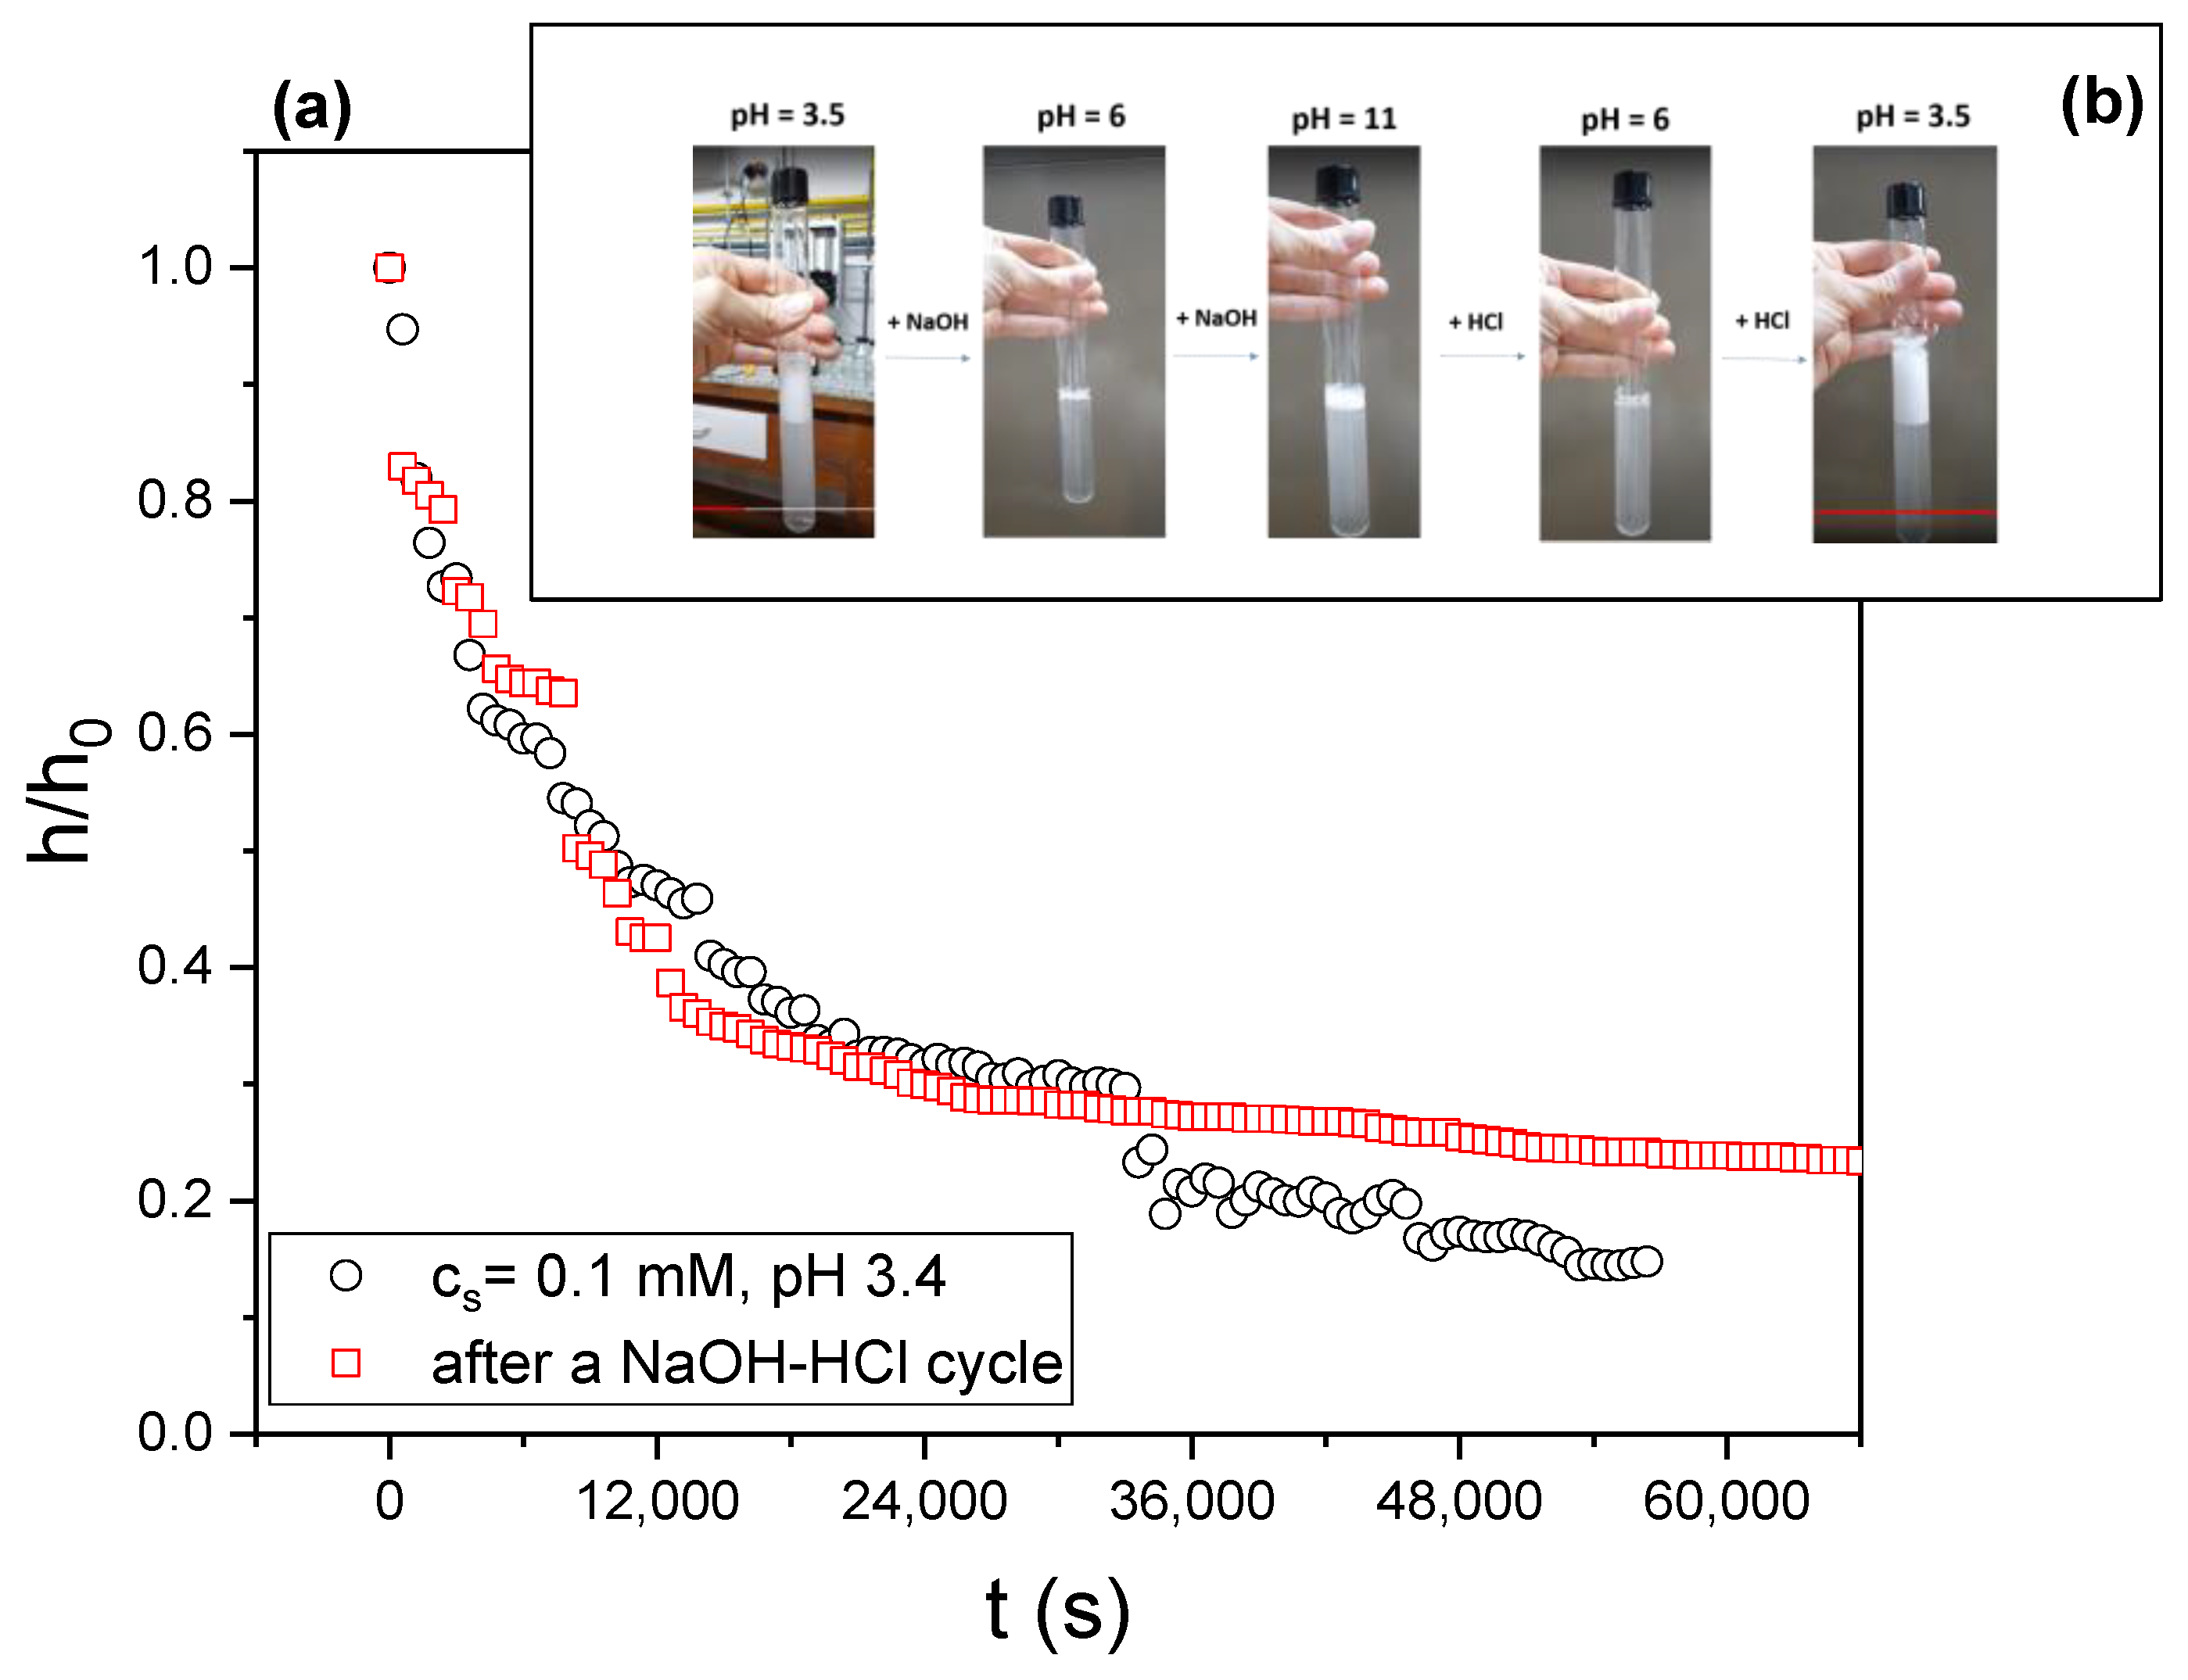
Foam stability and foamability are fully reversible, at least after three cycles. We produced foams starting with solutions at pH 3.5, added enough NaOH to change the pH to 6 or 11, and agitated. We then added HCl to change the pH back to 3.5 and agitated again. We repeated these cycles on the same sample three times. The behavior of the foams thus obtained is completely reversible (see inset in Figure 12 and the video available as Supplementary Material with the present paper).
Figure 12 and Supplementary Figure S7 illustrate the reversibility in foam behavior by presenting the relative foam height as a function of time before and after a first NaOH-HCl cycle. The data were obtained by imaging the sample with a CCD camera (see Figure 3).
4. Discussion
Here, we will discuss the mechanisms of foam responsiveness in relation with interfacial properties mainly. The physics of the polyelectrolyte–surfactant assembling in bulk will be addressed in a future work in the framework of the accumulated knowledge about phase behavior and complexes structures and morphologies [7,45,46]. From the surface tension isotherms in Figure 4, it is seen that the surface activity of the complexes at the interfaces is higher at pH 6 and 11 than at pH 3.5, when the surfactant concentration is very low. For this last pH value, no surface activity is observed until the surfactant concentration exceeds 2 × 10⁻⁴ mM, whereas at pH 6 and 11, the surface tension drops appreciably at surfactant concentrations as low as 10−6 mM (1 nM). However, above cs = 2 × 10⁻⁴ mM, the systems reach a plateau with the same surface tension value, ~47 mN m−1, regardless of pH. Despite this, foam stability strongly depends on pH. Thus, it is clear that the equilibrium surface tension does not play a role in the foam responsiveness to pH. As regards the interfacial dynamics, a clear pH dependence on the dynamic surface tension can be seen in Figure 5. This behavior is common to all surfactant concentrations explored in this work. At pH 3.5, the dynamics is fast and, after only a few seconds, the surface tension starts to drop rapidly. At pH 6, the surface tension begins to decrease after a very long induction time. For the system in Figure 5, this time is about 1000 s. At pH 11, there is an induction time, but it is shorter (~100 s) than that at pH 6. Although these differences in the surface tension dynamics suggest a mechanism for the pH responsiveness of foams, it is not sufficient to fully explain it. Dynamic surface tension is related to foamability, but to explain stability we need to include surface rheology. As already stated, surface viscoelasticity depends on pH. Figure 6 and Figure 7 show that the interface storage and loss moduli change by an order of magnitude when the pH changes from 6 to 3. Dilatational elasticity is related to foam and liquid film stability [23,25,38]. Exerowa et al. [47] and de Gennes [48] proposed that a single isolated foam film ruptures via thermal fluctuations of the surfactant concentration at the film interfaces. These fluctuations could produce holes (i.e., regions without surfactant molecules) at the interfaces. If the size of these ‘holes’ is larger than a certain critical value (typically on the order of half the film thickness), the hole grows and the film breaks. De Gennes proposed that the characteristic nucleation time for the holes should vary exponentially with the compression elastic modulus, being the lifetime of foam films, τc as [23,48],
where a is the area occupied by surfactant molecules at the interface and E0 is the compression elastic modulus in the high frequency limit. Even though Equation (4) is valid for thermal fluctuations in isolated single liquid films, and despite the fact that the dynamics of macroscopic foam is very complex [49], one would expect the formation of more stable foams for systems with large surface elastic modulus, as observed in PAA-G12 systems as pH changes. Note that both dynamic surface tension and surface viscoelasticity correlate very well with foam stability at different pHs: pH 6 < pH 11 < pH 3.5 (see Figure 12b).
On the other hand, for insoluble or irreversible adsorbed monolayers, and from theoretical models and computer simulations, it was shown that the coarsening dynamics is also influenced by the compression elastic modulus [50,51] in the low frequency region [38,39]. In this respect, the temporal dependence of the light transmitted through the foam samples, as shown in Figure 11, can be used to follow the coarsening dynamics [35,36,37]. The transmitted light intensity, I(t), is proportional to the photon transport mean free path, L*, which is proportional to the mean bubble diameter, R [35]. The coarsening dynamics often follows power laws. Thus, one expects,
For three-dimensional foams, it was shown that the exponent z of the power law is z = 1/3 and z = 1/2 for wet and dry foams, respectively [52]. Figure 11 shows that the time evolution of the light intensity does in fact follow power laws (lines in that figure). The z values obtained by fitting the data in Figure 11 with Equation (5) give z = 2.64 ± 0.1, z = 0.33 ± 8 × 10⁻⁴, z = 0.29 ± 0.002, and z = 1.06 ± 0.0034 for cs = 10−3, 4 × 10⁻², 0.1, and 0.5 mM, respectively. For intermediate surfactant concentrations, cs = 4 × 10⁻² and 0.1 mM, z ~ 1/3, as expected for coarsening dynamics in wet foams. We recall that the foams at these surfactant concentrations were the most stable ones. The z value for cs = 10−3 mM and for cs = 0.5 is larger than 1/3. In these experiments, the temporal evolution of the light intensity could depend simultaneously on drainage, coarsening, and coalescence dynamics, thus the observed behavior cannot be assigned exclusively to the coarsening rate. Foams at cs = 10−3 are unstable; they disappear after a few seconds. Therefore, in this case, we are seeing coalescence dynamics reflected in the large value of z ~3. For cs = 0.5 mM, foams are stable but the mechanism of stabilization seems different from that for cs = 4 × 10⁻² and 0.1 mM. Note that in Figure 11 there is a certain time for cs = 0.5 mM, during which the intensity remains constant (indicated by an arrow in that figure); this is due to a very slow drainage dynamics. Remember that at cs = 0.5 mM there are visible aggregates in bulk at pH = 3.5; those aggregates could arrest or slow down the liquid drainage through the plateau borders, stabilizing the foams, but when the drainage process finishes, the bubble in the foam starts to coarsen and coalesce. The z value (~1) reflects a mixture of coarsening and coalescence.
As regards XRR results, the thickness found for the surfactant layer (considering the maximum ED, between 13 and 17 Å), with and without PAA, is in perfect agreement with neutron reflectometry on DTAB monolayers [40]. Recall that G12 is formed by two DTAB molecules linked at the polar head by an ethyl group. At equilibrium and at a given pH, all mixtures studied, regardless of the surfactant concentration, show similar features: the curves can be fitted quite well by a 3- to 4-box model, where the first boxes (from the air) correspond perfectly well to the surfactant size, as mentioned above. The other region, in the direction towards the bulk solution, is assigned to the PAA polymer interfacial layer as in similar polyelectrolyte-surfactant mixtures [40]. From the XRR data, we showed that the thickness of PAA-free Gemini interfaces is about 25 Å and for the complex layer, ~50 Å. The differences observed in the apparent thicknesses at pH 3, 6 and 11, have to be attributed to differences in the X-ray contrast due to the degree of hydration of the PAA chains and not, in light of the equilibrium surface tension, to the absence of polymer at the interface at pH > 6. Remind that PAA has no surface activity, at least at the concentration used here (1 mg mL−1), thus its presence on the interface is a consequence of its interaction with the surfactant. The adsorption of G12 molecules at the interface acts as an anchor to the interface region for the polymer, via electrostatic and/or hydrophobic interactions. This picture of the complex adsorption process with several steps, as shown in the dynamic surface tension curves (Figure 5), is clearly seen in the XRR results, particularly in Figure 10, which shows the time evolution of the interface in the adsorption process. This process, for the PAA-G12 mixture, goes through a step that results in an interface with the same features as those of pure Gemini interfaces (see Figure 10 and compare the curve at t = 55 min and that of G12). This two-step mechanism was observed and reported previously for other polyelectrolyte-surfactant complexes [53]. The previous picture allows understanding the mechanism involved in pH responsiveness; by changing the pH, we change and modulate the polyelectrolyte-surfactant interaction. At pH 3.5, PAA is more protonated (~90%), the polymer chains are less hydrated and thus more hydrophobic (that is why the solution is milky), the electrostatic interaction with positively charged G12 head groups is weaker, the size of the aggregates is smaller (but denser, less hydrated) and the adsorption dynamics is faster. The opposite occurs as pH increases. At pH > 6, about 90% of the carboxylic groups in PAA are deprotonated; however, the electrostatic interaction with G12 molecules is stronger, aggregates are more hydrated (that is why the bulk solution becomes transparent as pH increases). The complexes have a lower tendency to adsorb onto the interface, and the dynamics slow down. Nevertheless, and despite the different adsorption dynamics, due to the synergy in the adsorption of both species after the two-step process mentioned above, the final, equilibrium, complex layers are quite similar, as shown for the surface tension isotherms at the three pHs and also from XRR in Figure 9.
As a conclusion of the above discussion, interfacial dynamics explains the pH dependence of both foamability (dynamic surface tension) and foam stability (surface viscoelasticity).
5. Conclusions and Outlooks
pH-responsive foams have been produced previously [12]. Binks et al. [26] were successful in formulating pH-responsive foams using polystyrene particles covered with PAA as a stabilizer, a system similar to ours. However, to our knowledge, no pH-responsive foams have been formulated with polyelectrolyte-surfactant complexes. These systems allow the use of very low surfactant and polymer concentrations, which is both economically and environmentally advantageous. We were able to produce very stable foams by stabilizing them with PAA-G12 mixtures at surfactant concentrations as low as 4 × 10⁻² mM. Foams stabilized with PAA-G12 are not only pH responsive; the response is fully reversible, at least after three cycles of NaOH-HCl additions. By means of dynamic surface tension, surface rheology, and X-ray reflectometry, we demonstrated that the pH response mechanism is entirely due to interfacial dynamics. First, the fast adsorption process that changes rapidly the surface tension is responsible for the initial foam formation; surface compression elasticity accounts for foam stability. Both the adsorption velocity of the complexes at the liquid-air interface and the surface viscoelasticity are modified by pH, being the pH responsiveness of foam stability well correlated with these interfacial dynamics and not with the equilibrium surface activity of the chemical stabilizer. This pH response controlled by interfacial dynamics contrasts with the stabilization mechanism and pH responsiveness of the mentioned system based on PS-PAA colloidal particles for which the response is due to the fact that, at pH > 6, PS-PAA particles become hydrophilic and non-surface active. PAA-G12 complexes are surface active at all pHs, but the adsorption process dynamics strongly depends on pH.
Note that the addition of NaOH and HCl to change the pH in order to modulate foam stability is not really convenient if one wants to repeat the cycles without limit. The addition of acids and bases in repeated cycles would continuously increase the ionic strength, changing the system composition, and eventually affecting the system behavior. To overcome this issue, we plan to explore the use of diphenyliondonium salts in the formulation of these systems [54]. These salts are photoacid generators. They photolyze by UV light, generating an acid that, in water solution, causes a pH decrease. Thus, we could in principle change the basic pH-responsive system to a light-responsive foam. Another strategy to produce a light-responsive foam could be to take advantage of the effect of surfactant concentration on foam stability observed in the PAA-G12 system for other oppositely charged polyelectrolyte-surfactant complexes, by formulating the complexes with azoTab molecules [55] or other photo-responsive surfactants [56]. The addition of a polyelectrolyte to this kind of surfactants might produce more stable foams while keeping the stability response to light. Both photoacid generators and photo-responsive surfactant formulations will be explored in future works as soon as the COVID-19 crisis allows us to return to a regular working routine in the laboratory.
A final word is necessary regarding the data presented in the present article, particularly those of phase behavior, equilibrium surface tension, and dynamic surface tension. The information they provided us about the PAA-G12 systems is much richer than what we have discussed here. For space reasons and to keep the focus of the article, we used only the minimum information needed to explain the mechanism of foam formation and its responsiveness to pH. A complete theoretical analysis of the dynamic surface tension and surface rheology data in this complex system, as well as the phase behavior including additional data of z-potential, light scattering, small X-ray scattering (SAXS), and Electric Birefringence [2] will be part of future articles. This will be done in the context of the use of these kind of complexes in nanomedicine, the other branch of interest of our group.
Supplementary Materials
The following are available online at https://0-www-mdpi-com.brum.beds.ac.uk/article/10.3390/colloids5030037/s1, Figure S1: Dynamic surface tension at cs = 10−3 mM, Figure S2: Dynamic surface tension at cs = 4 × 10⁻² mM; Figure S3: Dynamic surface tension at cs = 0.1 mM; Figure S4: Storage and loss modulus for cs = 0.5 mM; Figure S5: XRR vs. time, cs = 4 × 10⁻² mM; Figure S6: XRR vs. time, cs = 10−3 mM; Figure S7: Foam height vs. time, cs = 0.5 mM; Video S1: Reversibility in pH-response demonstration.
Author Contributions
H.M. and C.D. should both be considered as first authors. Equilibrium surface tension and surface rheology experiments and data analysis, H.M.; all experiments with foams and data analysis, C.D.; pendent drop apparatus construction and dynamic surface tension experiments, M.F.L.; conceptualization, supervision, funding acquisition, writing—review, and editing, S.M.; conceptualization, supervision, resources, funding acquisition, XRR experiments and data analysis, writing—original draft preparation, and project administration, H.R. All the authors have participated in the discussion and writing-editing of the manuscript. All authors have read and agreed to the published version of the manuscript.
Funding
This research was funded by the Agencia Nacional de Promoción Científica y Tecnológica (ANPCyT), Argentina, PICT-2016-0787 and PICT-2019-3185; by the Consejo Nacional de Investigaciones Científicas y Técnicas (CONICET), Argentina, PIP GI n° 11220130100668CO; and by the Universidad Nacional del Sur (UNS), Argentina, PGI-UNS 24/F080.
Institutional Review Board Statement
Not applicable.
Informed Consent Statement
Not applicable.
Data Availability Statement
Data is contained within the article and Supplementary Materials.
Acknowledgments
We thank Ezequiel Cuenca for helping us with the use of CONTIN software.
Conflicts of Interest
The authors declare no conflict of interest. The funders had no role in the design of the study; in the collection, analyses, or interpretation of data; in the writing of the manuscript, or in the decision to publish the results.
References
- Rosen, M.J. Surfactants and Interfacial Phenomena, 3rd ed.; Wiley-Interscience: Hoboken, NJ, USA, 2004; ISBN 0471478180. [Google Scholar]
- Ritacco, H.A. Electro-optic Kerr effect in the study of mixtures of oppositely charged colloids. The case of polymer-surfactant mixtures in aqueous solutions. Adv. Colloid Interface Sci. 2017, 247, 234–257. [Google Scholar] [CrossRef] [PubMed]
- Guzmán, E.; Llamas, S.; Maestro, A.; Fernández-Peña, L.; Akanno, A.; Miller, R.; Ortega, F.; Rubio, R.G. Polymer–surfactant systems in bulk and at fluid interfaces. Adv. Colloid Interface Sci. 2016, 233, 38–64. [Google Scholar] [CrossRef] [PubMed]
- Piculell, L. Understanding and Exploiting the Phase Behavior of Mixtures of Oppositely Charged Polymers and Surfactants in Water. Langmuir 2013, 29, 10313–10329. [Google Scholar] [CrossRef]
- Kristen-Hochrein, N.; Laschewsky, A.; Miller, R.; Von Klitzing, R. Stability of Foam Films of Oppositely Charged Polyelectrolyte/Surfactant Mixtures: Effect of Isoelectric Point. J. Phys. Chem. B 2011, 115, 14475–14483. [Google Scholar] [CrossRef]
- Bain, C.D.D.; Claesson, P.M.M.; Langevin, D.; Meszaros, R.; Nylander, T.; Stubenrauch, C.; Titmuss, S.; von Klitzing, R. Complexes of surfactants with oppositely charged polymers at surfaces and in bulk. Adv. Colloid Interface Sci. 2010, 155, 32–49. [Google Scholar] [CrossRef]
- Gradzielski, M.; Hoffmann, I. Polyelectrolyte-surfactant complexes (PESCs) composed of oppositely charged components. Curr. Opin. Colloid Interface Sci. 2018, 35, 124–141. [Google Scholar] [CrossRef]
- Goddard, E.D.; Ananthapadmanabhan, K.P. Interactions of Surfactants with Polymers and Proteins; CRC Press: Boca Raton, FL, USA, 1993; ISBN 978-0849367847. [Google Scholar]
- Kwak, J.C.T.; Jan, C.T. (Eds.) Polymer-Surfactant Systems. Surfactant Science Series Vol. 77; M. Dekker: New York, NY, USA, 1998; ISBN 9780824702328. [Google Scholar]
- Langevin, D. Complexation of oppositely charged polyelectrolytes and surfactants in aqueous solutions. A review. Adv. Colloid Interface Sci. 2009, 147–148, 170–177. [Google Scholar] [CrossRef]
- Lencina, M.M.M.S.S.; Fernández Miconi, E.; Fernández Leyes, M.D.; Domínguez, C.; Cuenca, E.; Ritacco, H.A. Effect of surfactant concentration on the responsiveness of a thermoresponsive copolymer/surfactant mixture with potential application on “Smart” foams formulations. J. Colloid Interface Sci. 2018, 512, 455–465. [Google Scholar] [CrossRef] [Green Version]
- Fujii, S.; Nakamura, Y. Stimuli-Responsive Bubbles and Foams Stabilized with Solid Particles. Langmuir 2017, 33, 7365–7379. [Google Scholar] [CrossRef]
- Fameau, A.-L.; Carl, A.; Saint-Jalmes, A.; von Klitzing, R. Responsive Aqueous Foams. ChemPhysChem 2015, 16, 66–75. [Google Scholar] [CrossRef] [PubMed]
- Fameau, A.L.; Fujii, S. Stimuli-responsive liquid foams: From design to applications. Curr. Opin. Colloid Interface Sci. 2020. [Google Scholar] [CrossRef]
- Huang, J.; Cheng, F.; Binks, B.P.; Yang, H. pH-Responsive Gas–Water–Solid Interface for Multiphase Catalysis. J. Am. Chem. Soc. 2015, 137, 15015–15025. [Google Scholar] [CrossRef]
- Tang, C.; Xiao, E.; Sinko, P.J.; Szekely, Z.; Prud’homme, R.K. Responsive foams for nanoparticle delivery. Colloids Surfaces B Biointerfaces 2015, 133, 81–87. [Google Scholar] [CrossRef] [Green Version]
- Peng, Y.; Seekell, R.P.; Cole, A.R.; Lamothe, J.R.; Lock, A.T.; van den Bosch, S.; Tang, X.; Kheir, J.N.; Polizzotti, B.D. Interfacial Nanoprecipitation toward Stable and Responsive Microbubbles and Their Use as a Resuscitative Fluid. Angew. Chem. Int. Ed. 2018, 57, 1271–1276. [Google Scholar] [CrossRef] [PubMed]
- Langevin, D. Aqueous Foams: A Field of Investigation at the Frontier between Chemistry and Physics. ChemPhysChem 2008, 9, 510–522. [Google Scholar] [CrossRef]
- Weaire, D.L.; Hutzler, S. The Physics of Foams; Clarendon Press: Oxford, UK, 1999; ISBN 0198505515. [Google Scholar]
- Exerowa, D.R.; Kruglyakov, P.M. Foam and Foam Films: Theory, Experiment, Application, 1st ed.; Möbius, D., Miller, R., Eds.; Elsevier Science B.V.: Amsterdam, The Netherlands, 1998; Volume 5, ISBN 978-0-444-81922-2. [Google Scholar]
- Hill, C.; Eastoe, J. Foams: From nature to industry. Adv. Colloid Interface Sci. 2017, 247, 496–513. [Google Scholar] [CrossRef] [Green Version]
- Saint-Jalmes, A. Physical chemistry in foam drainage and coarsening. Soft Matter 2006, 2, 836. [Google Scholar] [CrossRef] [PubMed]
- Langevin, D. Bubble coalescence in pure liquids and in surfactant solutions. Curr. Opin. Colloid Interface Sci. 2015, 20, 92–97. [Google Scholar] [CrossRef]
- Bureiko, A.; Trybala, A.; Kovalchuk, N.; Starov, V. Current applications of foams formed from mixed surfactant-polymer solutions. Adv. Colloid Interface Sci. 2015, 222, 670–677. [Google Scholar] [CrossRef]
- Langevin, D. Influence of interfacial rheology on foam and emulsion properties. Adv. Colloid Interface Sci. 2000, 88, 209–222. [Google Scholar] [CrossRef]
- Binks, B.P.; Murakami, R.; Armes, S.P.; Fujii, S.; Schmid, A.; Binks, B.P.; Murakami, R.; Armes, S.P.; Fujii, S.; Schmid, A.; et al. PH-responsive aqueous foams stabilized by ionizable latex particles. Langmuir 2007, 23, 8691–8694. [Google Scholar] [CrossRef]
- Cuenca, V.E.; Falcone, R.D.; Silber, J.J.; Correa, N.M. How the Type of Cosurfactant Impacts Strongly on the Size and Interfacial Composition in Gemini 12-2-12 RMs Explored by DLS, SLS, and FTIR Techniques. J. Phys. Chem. B 2016, 120, 467–476. [Google Scholar] [CrossRef]
- Zana, R.; Benrraou, M.; Rueff, R. Alkanediyl-.alpha.,.omega.-bis(dimethylalkylammonium bromide) surfactants. 1. Effect of the spacer chain length on the critical micelle concentration and micelle ionization degree. Langmuir 1991, 7, 1072–1075. [Google Scholar] [CrossRef]
- Cuenca, V.E.; Fernández-Leyes, M.; Falcone, R.D.D.D.; Correa, N.M.; Langevin, D.; Ritacco, H.H.A.; Fernández Leyes, M.; Falcone, R.D.D.D.; Correa, N.M.; Langevin, D.; et al. Interfacial dynamics and its relations with “negative” surface viscosities measured at water-air interfaces covered with a cationic surfactant. Langmuir 2019, 35, 8333–8343. [Google Scholar] [CrossRef]
- Daerr, A.; Mogne, A. Pendent_Drop: An ImageJ Plugin to Measure the Surface Tension from an Image of a Pendent Drop. J. Open Res. Softw. 2016, 4, 2–6. [Google Scholar]
- Monroy, F.; Ortega, F.; Rubio, R.G. Dilatational rheology of insoluble polymer monolayers: Poly(vinylacetate). Phys. Rev. E 1998, 58, 7629–7641. [Google Scholar] [CrossRef] [Green Version]
- Provencher, S.W. A constrained regularization method for inverting data represented by linear algebraic or integral equations. Comput. Phys. Commun. 1982, 27, 213–227. [Google Scholar] [CrossRef]
- Provencher, S.W. Contin: A general purpose constrained regularization program for inverting noisy linear algebraic and integral equations. Comput. Phys. Commun. 1982, 27, 229–242. [Google Scholar] [CrossRef]
- Danauskas, S.M.; Li, D.; Meron, M.; Lin, B.; Lee, K.Y.C. Stochastic fitting of specular X-ray reflectivity data using StochFit. J. Appl. Crystallogr. 2008, 41, 1187–1193. [Google Scholar] [CrossRef]
- Durian, D.J.; Weitz, D.A.; Pine, D.J. Scaling behavior in shaving cream. Phys. Rev. A 1991, 44, R7902–R7905. [Google Scholar] [CrossRef] [PubMed] [Green Version]
- Vera, M.U.; Saint-Jalmes, A.; Durian, D.J. Scattering optics of foam. Appl. Opt. 2001, 40, 4210. [Google Scholar] [CrossRef] [PubMed] [Green Version]
- Ritacco, H. Playing with Liquid Foams: Learning Physical Chemistry. J. Chem. Educ. 2008, 85, 1667. [Google Scholar] [CrossRef]
- Georgieva, D.; Cagna, A.; Langevin, D. Link between surface elasticity and foam stability. Soft Matter 2009, 5, 2063. [Google Scholar] [CrossRef]
- Georgieva, D.; Schmitt, V.V.; Leal-Calderon, F.; Langevin, D. On the possible role of surface elasticity in emulsion stability. Langmuir 2009, 25, 5565–5573. [Google Scholar] [CrossRef] [PubMed]
- Langevin, D. Polyelectrolyte and surfactant mixed solutions. Behavior at surfaces and in thin films. Adv. Colloid Interface Sci. 2001, 89–90, 467–484. [Google Scholar] [CrossRef]
- Ritacco, H.; Albouy, P.-A.; Bhattacharyya, A.; Langevin, D. Influence of the polymer backbone rigidity on polyelectrolyte–surfactant complexes at the air/water interface. Phys. Chem. Chem. Phys. 2000, 2, 5243–5251. [Google Scholar] [CrossRef]
- Stubenrauch, C.; Albouy, P.-A.A.; Klitzing, R.V.; Langevin, D. Polymer/surfactant complexes at the water/air interface: A surface tension and X-ray reflectivity study. Langmuir 2000, 16, 3206–3213. [Google Scholar] [CrossRef]
- Tanford, C. The Hydrophobic Effect: Formation of Micelles and Biological Membranes, 2nd ed.; Wiley Interscience Publication; Wiley: Somerset, NJ, USA, 1980; ISBN 978-0471048930. [Google Scholar]
- Israelachvili, J.N. Intermolecular and Surface Forces, 3rd ed.; Academic Press: Cambridge, MA, USA, 2011; ISBN 9780123919274. [Google Scholar]
- Ferreira, G.A.; Loh, W. Liquid crystalline nanoparticles formed by oppositely charged surfactant-polyelectrolyte complexes. Curr. Opin. Colloid Interface Sci. 2017, 32, 11–22. [Google Scholar] [CrossRef]
- Guzmán, E.; Fernández-Peña, L.; Ortega, F.; Rubio, R.G. Equilibrium and kinetically trapped aggregates in polyelectrolyte–oppositely charged surfactant mixtures. Curr. Opin. Colloid Interface Sci. 2020, 48, 91–108. [Google Scholar] [CrossRef]
- Exerowa, D.; Kashchiev, D.; Platikanov, D. Stability and permeability of amphiphile bilayers. Adv. Colloid Interface Sci. 1992, 40, 201–256. [Google Scholar] [CrossRef]
- De Gennes, P.-G. Some remarks on coalescence in emulsions or foams. Chem. Eng. Sci. 2001, 56, 5449–5450. [Google Scholar] [CrossRef]
- Ritacco, H.A. Complexity and self-organized criticality in liquid foams. A short review. Adv. Colloid Interface Sci. 2020, 285, 102282. [Google Scholar] [CrossRef] [PubMed]
- Kloek, W.; van Vliet, T.; Meinders, M. Effect of Bulk and Interfacial Rheological Properties on Bubble Dissolution. J. Colloid Interface Sci. 2001, 237, 158–166. [Google Scholar] [CrossRef] [PubMed]
- Meinders, M.B.; van Vliet, T. The role of interfacial rheological properties on Ostwald ripening in emulsions. Adv. Colloid Interface Sci. 2004, 108–109, 119–126. [Google Scholar] [CrossRef] [PubMed]
- Isert, N.; Maret, G.; Aegerter, C.M. Coarsening dynamics of three-dimensional levitated foams: From wet to dry. Eur. Phys. J. E 2013, 36, 116. [Google Scholar] [CrossRef] [Green Version]
- Ritacco, H.A.; Busch, J. Dynamic Surface Tension of Polyelectrolyte/Surfactant Systems with Opposite Charges: Two States for the Surfactant at the Interface. Langmuir 2004, 20, 3648–3656. [Google Scholar] [CrossRef] [PubMed]
- Fameau, A.L.; Arnould, A.; Lehmann, M.; Von Klitzing, R. Photoresponsive self-assemblies based on fatty acids. Chem. Commun. 2015, 51, 2907–2910. [Google Scholar] [CrossRef] [PubMed] [Green Version]
- Chevallier, E.; Monteux, C.; Lequeux, F.; Tribet, C. Photofoams: Remote Control of Foam Destabilization by Exposure to Light Using an Azobenzene Surfactant. Langmuir 2021, 28, 48. [Google Scholar] [CrossRef] [PubMed]
- Honnigfort, C.; Campbell, R.A.; Droste, J.; Gutfreund, P.; Hansen, M.R.; Ravoo, B.J.; Braunschweig, B. Unexpected monolayer-to-bilayer transition of arylazopyrazole surfactants facilitates superior photo-control of fluid interfaces and colloids. Chem. Sci. 2020, 11, 2085–2092. [Google Scholar] [CrossRef] [Green Version]
Figure 1.
Pendent drop/sessile bubble setup. (a) scheme of the device; (b) photo of the same device. (1) light source (2) light diffuser (3) measurement cell (4) telecentric lens (5) CCD camera (6) valve (7) optical bench. (8) Syringe pump automatized system.
Figure 1.
Pendent drop/sessile bubble setup. (a) scheme of the device; (b) photo of the same device. (1) light source (2) light diffuser (3) measurement cell (4) telecentric lens (5) CCD camera (6) valve (7) optical bench. (8) Syringe pump automatized system.

Figure 2.
XRR experiments. (a) Description of the general setup for the experiments; (b) details of the liquid cell and geometry used for the measurements; (c) Typical XRR curve represented as the normalized intensity (I/Iqc) as a function of the wave vector, q. Iqc is the intensity at the critical angle of total reflectivity and qc is the corresponding wave vector.

Figure 3.
Scheme and photo of the device used to study foam dynamics. The intensity of the light transmitted through the foam sample is measured as a function of time by means of a UV-vis spectrometer. The temporal evolution of the foams is observed and recorded with a CCD camera.
Figure 3.
Scheme and photo of the device used to study foam dynamics. The intensity of the light transmitted through the foam sample is measured as a function of time by means of a UV-vis spectrometer. The temporal evolution of the foams is observed and recorded with a CCD camera.

Figure 4.
Surface tension isotherms for polyacrylic acid (PAA)-Gemini 12-2-12 (G12) mixtures at different pHs: 3.5 (open circles), 6 (open triangles), and 11 (open diamonds). The surface tension isotherm for PAA-free G12 solutions (filled squares) is included.
Figure 4.
Surface tension isotherms for polyacrylic acid (PAA)-Gemini 12-2-12 (G12) mixtures at different pHs: 3.5 (open circles), 6 (open triangles), and 11 (open diamonds). The surface tension isotherm for PAA-free G12 solutions (filled squares) is included.

Figure 5.
Dynamic surface tension for 1 mgL−1 PAA mixed with G12 at a concentration of 0.5 mM. Curves for three pHs are shown: pH 3.5 (squares), pH 6 (circles), and pH 11 (triangles). The arrows indicate the induction time at which the surface tension starts to decrease appreciably. The lines superimposed to the curve at pH 11 are fittings with exponentials. We identified at least three processes with distinct characteristic times: τ1 ~ 36 s, τ2 ~ 6 s, and τ3 ~ 40 s.

Figure 6.
(a) Storage, E′, and loss, E″, moduli measured from step-compression experiments on a Langmuir balance and analyzed using Equation (4) after applying an inverse Laplace transform by means of the CONTIN algorithm. The results correspond to 1 mg mL−1 PAA + 0.1 mM G12 at pH 3.5. (b) H(τ) from CONTIN.

Figure 7.
Storage, E′, and loss. E″, moduli of dilations surface rheology experiments for 1 mg mL−1 PAA + 0.1 mM G12 mixtures in aqueous solution. (a) pH 6; (b) pH 11.
Figure 7.
Storage, E′, and loss. E″, moduli of dilations surface rheology experiments for 1 mg mL−1 PAA + 0.1 mM G12 mixtures in aqueous solution. (a) pH 6; (b) pH 11.

Figure 8.
XRR results for G12 at a concentration of 2 mM. (a) Reflectivity, R = I/Iqc vs. wave vector, q. (b) Electron density (ED) profile from a model-independent fitting (black line) and from a box model (dashed red line) fit (dash-dot line in blue).
Figure 8.
XRR results for G12 at a concentration of 2 mM. (a) Reflectivity, R = I/Iqc vs. wave vector, q. (b) Electron density (ED) profile from a model-independent fitting (black line) and from a box model (dashed red line) fit (dash-dot line in blue).

Figure 9.
XRR curves for 1 mg mL−1 PAA + 0.5 mM G12 for the three pHs studied. The red lines are the fitting curves.
Figure 9.
XRR curves for 1 mg mL−1 PAA + 0.5 mM G12 for the three pHs studied. The red lines are the fitting curves.

Figure 10.
XRR curves as a function of time for 1 mg mL−1 PAA + 0.1 mM G12 at pH 11. The first curve (black circles) was obtained after an adsorption time of about 15 min (the time needed to prepare the experiments). The second (red squares) and third (blue tringles) measurements were performed after 55 and 95 min, respectively. We included for comparison the curve corresponding to PAA-free Gemini monolayer (the same as in Figure 8a; cyan line). The plot is in log-log scale. Error bars were removed for ease of visualization.

Figure 11.
Foam dynamics from multiple light scattering experiments. The abscise represents the relative light intensity transmitted through the foam sample. I is the instantaneous light intensity transmitted through the sample, I0 the intensity a time zero and Ic the transmitted light intensity through the cell without foam ((I–I0)/Ic = 1 corresponds to the light transmitted through the container without foam). All measurements were performed at pH 3 and for the four surfactant concentrations studied: 10−3 mM (black circles); 4 × 10⁻² mM (red squares), 0.1 mM (green triangles), and 0.5 mM (blue diamonds). The lines are fittings with scaling laws (see Discussion).

Figure 12.
(a) Relative foam height, h/h0 (h0 is the initial foam height). as a function of time for the same sample before and after a NaOH-HCl cycle that takes the pH from 3 to 11 and then back to 3. (b) Sequence of images showing the foam produced immediately after 20 s agitating the liquid; each photo corresponds to a step in the NaOH-HCl cycle from pH 3.5 to 11 and back.


Table 1.
Fitting results of XRR measurements of PAA-G12 mixtures at the air-solution interface.
| cs/mM | Total Thickness/Å | ED 1 | Distance from the Air to Maximum ED/Å |
|---|---|---|---|
| 10−3 | 48.9 ± 1 (pH 3.5) 2 | 1.52 (pH 3.5) 2 | 17.1 (pH 3.5) 2 |
| 4 × 10⁻² | 52 ± 2 (pH 3.5) | 1.54 (pH 3.5) | 16 (pH 3.5) |
| 0.1 | 44.5 ±1 (pH 3.5) | 1.52 (pH 3.5) | 11.3 (pH 3.5) |
| 25.9 ± 1 (pH 6) | 1.7 (pH 6) | 9.6 (pH 3.5) | |
| 37.6 ±1 (pH 11) | 1.44 (pH 11) | 14.2 (pH 11) | |
| 0.5 | 45.8 ± 1 (pH 3.5) | 1.52 (pH 3.5) | 12.7 (pH 3) |
| 26.8 ± 1 (pH 6) | 1.49 (pH 6) | 13.1 (pH 6) | |
| 28.2 ± 1 (pH 11) | 1.44 (pH 11) | 13.3 (pH 11) |
1 Maximum electron density (ED) in the ED profile relative to bulk solution. 2 Measured at an adsorption time of 254 min.
Table 2.
Fitting results of the XRR measurements of PAA-G12 mixtures at cs = 0.1 mM and pH 11, as a function of time.
Table 2.
Fitting results of the XRR measurements of PAA-G12 mixtures at cs = 0.1 mM and pH 11, as a function of time.
| Time/Min | Total Thickness/Å | ED 1 | Distance from the Air to Maximum ED/Å |
|---|---|---|---|
| 15 | 15.3 ± 0.8 | 1.18 | 14.1 |
| 55 | 30.0 ± 0.6 | 1.37 | 13.2 |
| 95 | 36.9 ± 0.5 | 1.76 | 12.7 |
1 Maximum ED in the ED profile relative to bulk solution.
Publisher’s Note: MDPI stays neutral with regard to jurisdictional claims in published maps and institutional affiliations. |
© 2021 by the authors. Licensee MDPI, Basel, Switzerland. This article is an open access article distributed under the terms and conditions of the Creative Commons Attribution (CC BY) license (https://creativecommons.org/licenses/by/4.0/).
Share and Cite
MDPI and ACS Style
Martinelli, H.; Domínguez, C.; Leyes, M.F.; Moya, S.; Ritacco, H. A pH-Responsive Foam Formulated with PAA/Gemini 12-2-12 Complexes. Colloids Interfaces 2021, 5, 37. https://0-doi-org.brum.beds.ac.uk/10.3390/colloids5030037
AMA Style
Martinelli H, Domínguez C, Leyes MF, Moya S, Ritacco H. A pH-Responsive Foam Formulated with PAA/Gemini 12-2-12 Complexes. Colloids and Interfaces. 2021; 5(3):37. https://0-doi-org.brum.beds.ac.uk/10.3390/colloids5030037
Chicago/Turabian StyleMartinelli, Hernán, Claudia Domínguez, Marcos Fernández Leyes, Sergio Moya, and Hernán Ritacco. 2021. "A pH-Responsive Foam Formulated with PAA/Gemini 12-2-12 Complexes" Colloids and Interfaces 5, no. 3: 37. https://0-doi-org.brum.beds.ac.uk/10.3390/colloids5030037