Article

An Innovative Deep Learning Algorithm for Drowsiness Detection from EEG Signal

1
STMicroelectronics, Stradale Primosole 50, 95121 Catania, Italy
2
Department of Biomedical and Biotechnological Sciences, Physiology Section, University of Catania, Via S. Sofia, 97, 95123 Catania, Italy
*
Authors to whom correspondence should be addressed.
Submission received: 12 January 2019 / Revised: 18 February 2019 / Accepted: 21 February 2019 / Published: 28 February 2019
(This article belongs to the Section Computational Engineering)

Abstract

:
The development of detection methodologies for reliable drowsiness tracking is a challenging task requiring both appropriate signal inputs and accurate and robust algorithms of analysis. The aim of this research is to develop an advanced method to detect the drowsiness stage in electroencephalogram (EEG), the most reliable physiological measurement, using the promising Machine Learning methodologies. The methods used in this paper are based on Machine Learning methodologies such as stacked autoencoder with softmax layers. Results obtained from 62 volunteers indicate 100% accuracy in drowsy/wakeful discrimination, proving that this approach can be very promising for use in the next generation of medical devices. This methodology can be extended to other uses in everyday life in which the maintaining of the level of vigilance is critical. Future works aim to perform extended validation of the proposed pipeline with a wide-range training set in which we integrate the photoplethysmogram (PPG) signal and visual information with EEG analysis in order to improve the robustness of the overall approach.
Keywords:
EEG; DCT; Deep Learning

1. Introduction

Drowsiness represents the transition state between awakening and sleep during which the vigilance decrement is observed. As an antecedent of the sleep state, this phase is characterized by an almost total lack of reflexes and therefore does not agree with tasks which, on the contrary, require robust levels of vigilance. Therefore, the tracking of drowsiness represents the goal of increasing security in favor of human health. In fact, this topic is becoming very important in healthcare applications for further improvement of medical assessment [1,2].
In this context, the most reliable methods for detecting drowsiness are those based on physiological measurements, including electroencephalogram (EEG), electrocardiogram (ECG), and photoplethysmogram (PPG). Among these several methods, EEG is the most widely used technique to measure the electrical activity of the brain, and since it is the standard technique in sleep studies, it has been proposed by several authors for drowsiness tracking analysis [3,4,5,6]. EEG has also been extensively used for fatigue classification, which is strictly correlated to the drowsiness monitoring [7,8,9,10,11,12]. In this context, appropriated EEG artifacts removal procedures must be implemented for obtaining reliable post-processed signals [13,14,15].
ECG is also used to detect drowsiness by means of heart rate determination, which varies significantly through the different stages of drowsiness, from an awake state to a drowsy state [16]. PPG traces, which noninvasively measure the pulse rate variability in response to autonomous nervous system activity, have also been applied as appropriate methods for relaxation, fatigue, and drowsiness detection [17].
However, the development of detection systems for reliable drowsiness tracking is still a challenging task. Robust and complex algorithms of analysis are required. In this context, the Machine Learning methodologies (i.e., Deep Learning) represent powerful methodologies [18,19,20] offering promising approaches for reliable results on signal analysis [21]. In this field, the Convolutional Neural Networks (CNNs) are the most appealing methods for this kind of analysis. CNNs were originally introduced by LeCun and Bengio in computer vision [22].
Recent studies have investigated the use of PPG signals combined with ECG samples for the estimation of drowsiness by means of a heart rate variability (HRV) indicator [23,24]. We also recently described an advanced and innovative pipeline for drowsiness tracking based on the usage of PPG signals, ECG reconstructed from PPG signals, and EEG-to-PPG correlation [25].
However, the principal method for drowsiness detection is based on the EEG analysis [26]. The EEG is produced by inhibitory and excitatory postsynaptic potentials of cortical pyramidal neurons. These signals are integrated at the cortical level and propagate up to the scalp [5]. The rhythmical activity in the EEG is the expression of the more or less synchronized activity of large populations of adjacent cortical neurons, and it is believed to be generated by the interaction between cortical nerve cells and subcortical pacemakers. The electrical activity of the brain is usually classified according to rhythms, defined in terms of frequency bands—delta, theta, alpha, and beta—typically related to vigilance levels [5]. In particular, delta activity is characterized by slow waves between 0.5 and 4 Hz; these waves are present during the transition to drowsiness and during sleep. Theta rhythm displays a frequency range between 4 and 7 Hz; this rhythm is considered to be related to decreased information and is associated with low levels of alertness during drowsiness and sleep. Alpha rhythm is characterized by a frequency range between 8 and 13 Hz and is considered to be related to an alert and relaxed state; it occurs during wakefulness, is heightened at eye closure while it weakens at eye opening, and is highly attenuated during attention. Beta waves are a fast frequency ranging between 13 and 30 Hz and are associated with increased alertness, arousal, and excitement. It has long been known that changes in brain arousal involve specific variations in EEG activity; in particular, increases in alpha and theta rhythms and reduction of beta waves are interpreted as indicating states of weariness and sleepiness [3,4,5,6].
Regarding EEG processing and Machine Learning for drowsiness detection, several methods have been proposed in the literature. In Reference [27] the authors present two models using artificial neural networks to detect the degree of drowsiness and to predict the time required to reach a particular drowsiness level (moderately drowsy). The proposed approach seems to be very promising since it is able to detect drowsiness level with a mean square error of 0.22, and it can predict the reaching of drowsiness level with a mean square error of 4.18 min. In [28], the authors proposed an algorithm which evaluates a driver’s sleepiness level directly from cerebral activity. The results seem good, even though the authors confirmed that the method needs further investigation. In [29], the authors analyzed interesting Deep Learning methods for drowsiness tracking from EEG. The proposed deep learning solutions are based on novel channel-wise convolutional neural network (CCNN). To test the performance, the authors collected a large EEG dataset from three studies of driver fatigue that included 70 sessions from 37 subjects. All proposed methods were tested on both raw EEG and independent component analysis (ICA)-transformed data for cross-session predictions. The results seem very good and will be used as a benchmark for the algorithm proposed herein. In Reference [30], the authors proposed a study regarding the possibility to develop a drowsiness detection system for car drivers based on the integration of three methods: EEG, EOG signal processing, and driver image analysis. The approach seems very promising, but it needs two-dimensional images of the driver during the car driving, so the complexity of the pipeline is greater than the same ones based on EEG processing only. Finally, in [31], the authors proposed a deep convolution network and autoencoders-based model (AE-CDNN), which was constructed in order to perform unsupervised feature learning from EEG in epilepsy. The authors extracted features by the AE-CDNN model and classify the features based on two public EEG data sets. Experimental results showed that the classification results of features obtained by AE-CDNN are more optimal than features obtained by principal component analysis and sparse random projection.
In the present study, an innovative Deep Learning bio-inspired pipeline able to detect the level of drowsiness from EEG signals is described. The algorithm uses the Discrete Cosine Transform (DCT) analysis of EEG signal followed by a Deep learning stage (stacked autoencoders with softmax layers) for proper DCT post-processing data classification.
Results presented herein prove this approach can be very promising for use in the next generation of medical devices.

2. Materials and Methods

2.1. Volunteers Recruitment and Acquisition Protocol

Experiments were carried out on 62 healthy subjects of both sexes (31 men and 31 women), aged between 20 and 74 years; none of the volunteers were using drugs capable of changing cortical excitability. Volunteers gave informed consent to the procedures approved by the Ethical Committee Catania 1 (authorization n. 113/2018/PO), which were conducted in accordance with the Declaration of Helsinki. Participation criteria included the possession of a valid driving license for motor vehicles.

2.2. EEG Recordings

Standard EEG traces were recorded from 62 healthy subjects, of both sexes (31 men and 31 women), aged between 20 and 74 years. Two EEG electrodes were placed on the scalp at points O1 and O2 of the International System 10–20 [32] and held adherent to the skin by means of an adhesive/conductive paste; a ground electrode was placed at the right ankle. Standard recordings were made by using a standard EEG device (Galileo NT, EB Neuro, Italy), with the low-frequency filter between 0.53 Hz and 1.6 Hz (corresponding to 0.3 and 0.1 s of the time constant) and the 70 Hz high-frequency filter. From each channel, the data were acquired at the speed of 128/s. Subjects had to stay for 5 min in conditions of maximum relaxation, and then for another 5 min, they had to perform mental calculations to increase their level of vigilance.

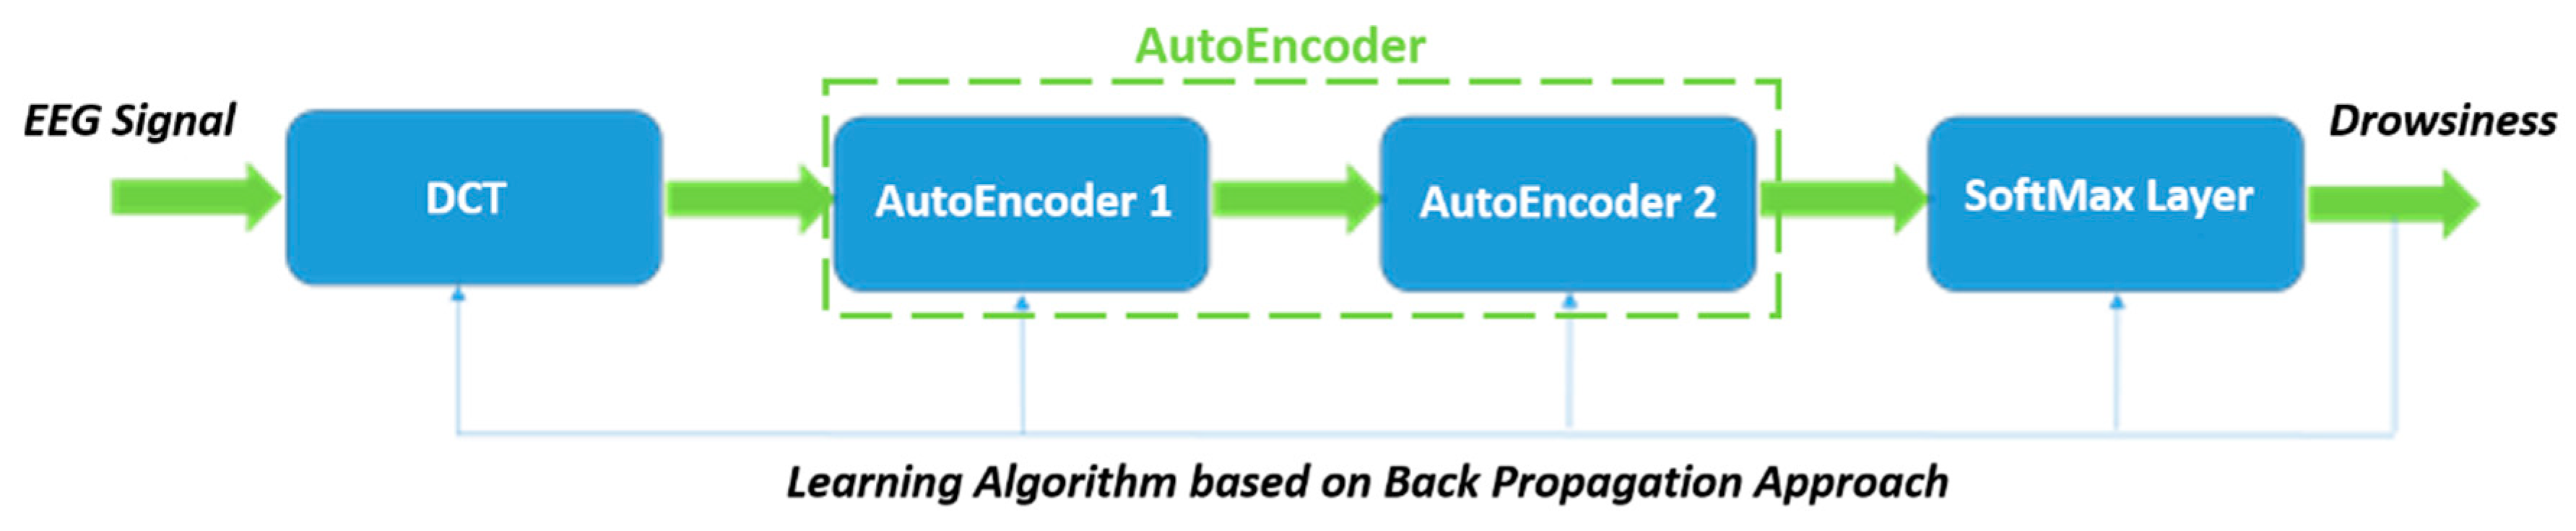
2.3. Algorithm Description

The Deep Learning algorithm described herein has been developed in a MATLAB framework. Figure 1 reports the Deep Learning algorithm pipeline.
Following are the descriptions of the methods used in the single blocks:
(a) DCT—Discrete Cosine Transform Block
EEG signals were fed into the DCT block which performed frequency domain transformation of the source EEG samples (EEG(k) composed by N samples) as per the modified classical DCT equation [18], as follows:
φ ( u ) = ω ( u ) k = 0 N 1 e e g ( k ) c o s [ π ( 2 k + 1 ) u 2 N + σ ] ;     u = 0 . N 1 ;     σ       , ω ( u ) = { 2 / N u     0 1 / N u   =   0
where N is the number of samples of the source EEG signals, while u(*) represents the frequency domain variable. The term “σ" is a dynamic variable self-learned during the training process of the proposed system. The frequency domain representation of the time domain source of EEG samples was therefore obtained. The DCT is suitable to better detect periodic intrinsic frequency components as it exploits such mathematical features as the discrete representation of the function correlated to the EEG signal. By means of the self-adaptive parameter “σ”, we are able to autodetect the optimal “frequency window” for performing mathematical discrimination between DCT transformation of a source EEG signal of a drowsy person (EEG with alpha wave component) and DCT signals of a wakeful person (EEG with beta wave component).
The results from DCT processing were further resized by means of bicubic remapping composed of 256 samples. The processed DCT samples were further processed in order to resize them into a vector of 256 frequency samples as per bicubic interpolation.
In this context, we used a modified DCT function for the pre-processing of EEG signals in order to generate optimized window frequency signals for the autoencoder layer. The usage of self-adaptive “σ” parameters allowed us to correctly find the best frequency window for improving the features generated by the latent representation of the used autoencoder layer.
(b) Autoencoder—The Autoencoder System Block
An autoencoder neural network is a bio-inspired system with a supervised learning algorithm that applies a typical error back-propagation scheme for firstly encoding input vectors (DCT samples), and secondly for decoding its internal representation in order to obtain the original input data with minimum error, which is usually the mean squared error (DCT internal representation) [20].
Figure 2 shows a typical neural structure of an autoencoder (used in our proposed pipeline) for learning DCT signal dynamics.
The autoencoder proposed herein is structured with many input neurons, many hidden layers, many neurons, and one output layer composed of multiple neurons. More specifically, an autoencoder takes an input vector:
x   [ 0 , 1 ] d         d     1
and maps it into a hidden representation
y   [ 0 , 1 ] d       d     1
through a deterministic mapping
  y = ϑ ( x ) = β ( W x + b ) ;     W d x   d ;   b   β ( x ) = a c t i v a t i o n   f u n c t i o n   ( e x a m p l e : S i g m o i d ( 1 + e x ) 1 ) .
The matrix W represents the synaptic weights of the neural system. The hidden representation y, sometimes called the latent representation, is then mapped back to a reconstructed vector z ∈ [0,1]d where
z = γ ( y ) =   β ( W y + b ) .
The basic idea here is that the autoencoder is constructed in such a way that the mapping x(i) -> y(i) reveals essential structures in the input vector x(i) that is not otherwise obvious.
In the autoencoder learning, the parameters φ and φ’ of the model are optimized to minimize the average reconstruction error as shown in the following equation
φ *   ,   φ , * = arg   min φ ,   φ 1 n i = 1 n L ( x ( i ) , z ( i ) ) = arg   min φ ,   φ 1 n i = 1 n L ( x ( i ) , γ ( β ( W x + b ) )
where the loss function L is a traditional squared error.
In order to avoid overfitting issues, an empirical risk minimization approach has been combined with regularized empirical risk, where the regularization imposes a degree of sparseness on the derived encodings.
Finally, the learning aims to find the optimal parameters φ* satisfying
φ *   = arg   min φ ,   φ 1 n R ( β , D n )
where R( β ,Dn) is the regularized empirical risk function reported above.
The effect of the autoencoder described above is forcing the latent representations to be sparse (sparse autoencoder). The sparsity constraints are based on the Kullback–Leibler divergence function, defined as
K L ( ρ | | ρ ^ ) = ρ l o g ρ ρ j ^ + ( 1 ρ ) l o g ( 1 ρ ) ( 1 ρ j ^ )
where ρ ^ is a sparsity parameter of which the value is close to zero while
ρ ^ j = 1 n i = 1 n β ( W x ( i ) j + b )
is the average activation of hidden unit j. By combining Equations (5)–(9) we obtain:
arg min φ ,   φ i = 1 n L ( x ( i ) , γ ( β ( W x ( i ) + b ) ) + τ j = 1 H d K L ( ρ | | ρ ^ )
where Hd is the number of hidden units and τ is a sparsity weighting term. This approach is used to avoid overfitting issues and improve its sparsity.
In order to increase the learning capability of the proposed system, we have used stacked autoencoders (SAEs). In SAEs, after the first layer is trained, the autoencoder output layer is discarded, and the related features (latent representation) are used as the input to the next layer (autoencoder). Hence, the training is greedy and layer-wise. The final step is to fine tune the network using the back-propagation algorithm. The architecture of each autoencoder used herein is composed of 256 neurons as an input layer and one 10-neuron hidden layer.
(c) Softmax Neural Layer Block
The softmax function is also known as the normalized exponential [21]. In the field of deep and machine learning, a softmax function or layer is able to classify a K-dimensional vector of real values in the range [0,1]. Formally, if we define the output of the latest layer (zj as the input of that layer) of a feed-forward neural network as
a k     = 1 n j = 1 M w k j z j
In a multi-class K classification problem, the softmax transformation function is defined as
g ( a k ) = e a k l = 1 K e a l .
This can be defined as the conditioned probability that, given an input u, the output y is a member of j-th class, where y can be computed as follows:
y k =   g ( j = 1 M w k j h ( i = 1 d w j i x i ) ) .
In the proposed pipeline, we used a softmax layer to classify the input into two classes, i.e., drowsy person (0–0.5, class ‘0’) and wakeful person (0.51–1, class ‘1’) considering all the outputs normalized into [0,1] range.

2.4. Algorithm Testing and Validation Framework

The proposed pipeline was tested in a PC with an Intel i5 quad Core@64MGb RAM. All the EEG input records of 62 people were split into 70% as a training set and the remaining 30% for testing and validation. The training phase required about 20 min while the testing and validation took about 5 min.

3. Results and Discussion

Drowsiness is physiologically defined as “a state of near sleep due to fatigue”. The effects of both sleepiness and fatigue are similar and involve mental alertness, reduced awareness, and prejudiced judgment. This leads to a decrease in a person’s ability to operate and an increase in the risk of human error that could lead to fatalities and injuries. For this reason, the development of reliable and easy-to-use methods to detect drowsiness can make substantial improvements in the prevention of fatal accidents and can be implemented in the next generation of medical devices.
The goal of researchers working in this field is to achieve an advanced method that is easily applied and appropriate in all those conditions that require a high level of vigilance. As discussed in the background section, several studies have proposed techniques to detect drowsiness using different types of data as input. To achieve this goal, in this study we combined the EEG traces—the most suitable physiological measurement of vigilance levels—with the powerful Machine Learning methodology of data analysis.
In the following subsections, the results obtained in the three blocks of the algorithm schemed in Figure 1 and described in the previous section are reported.

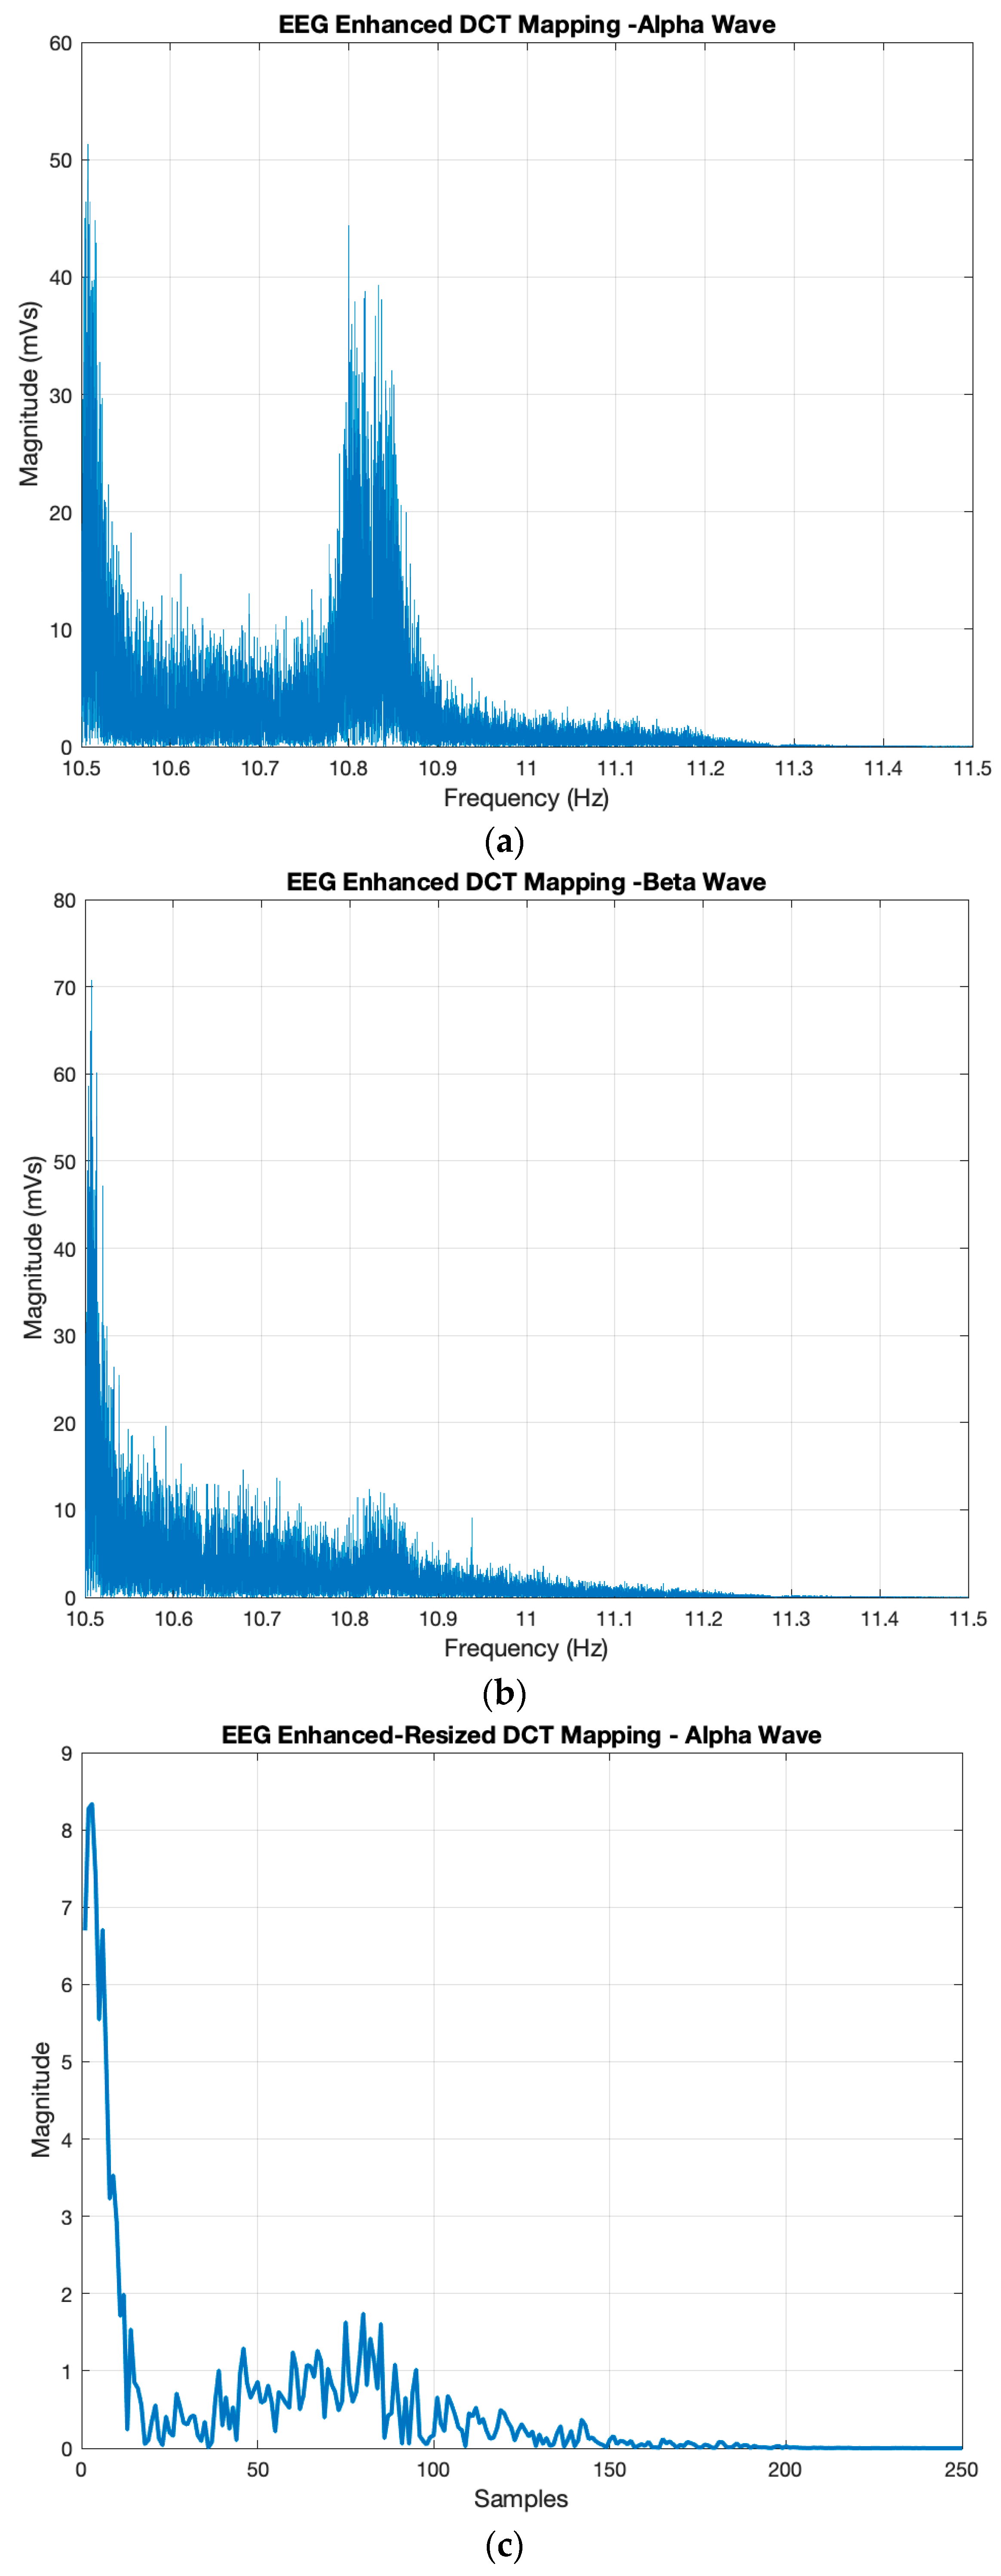
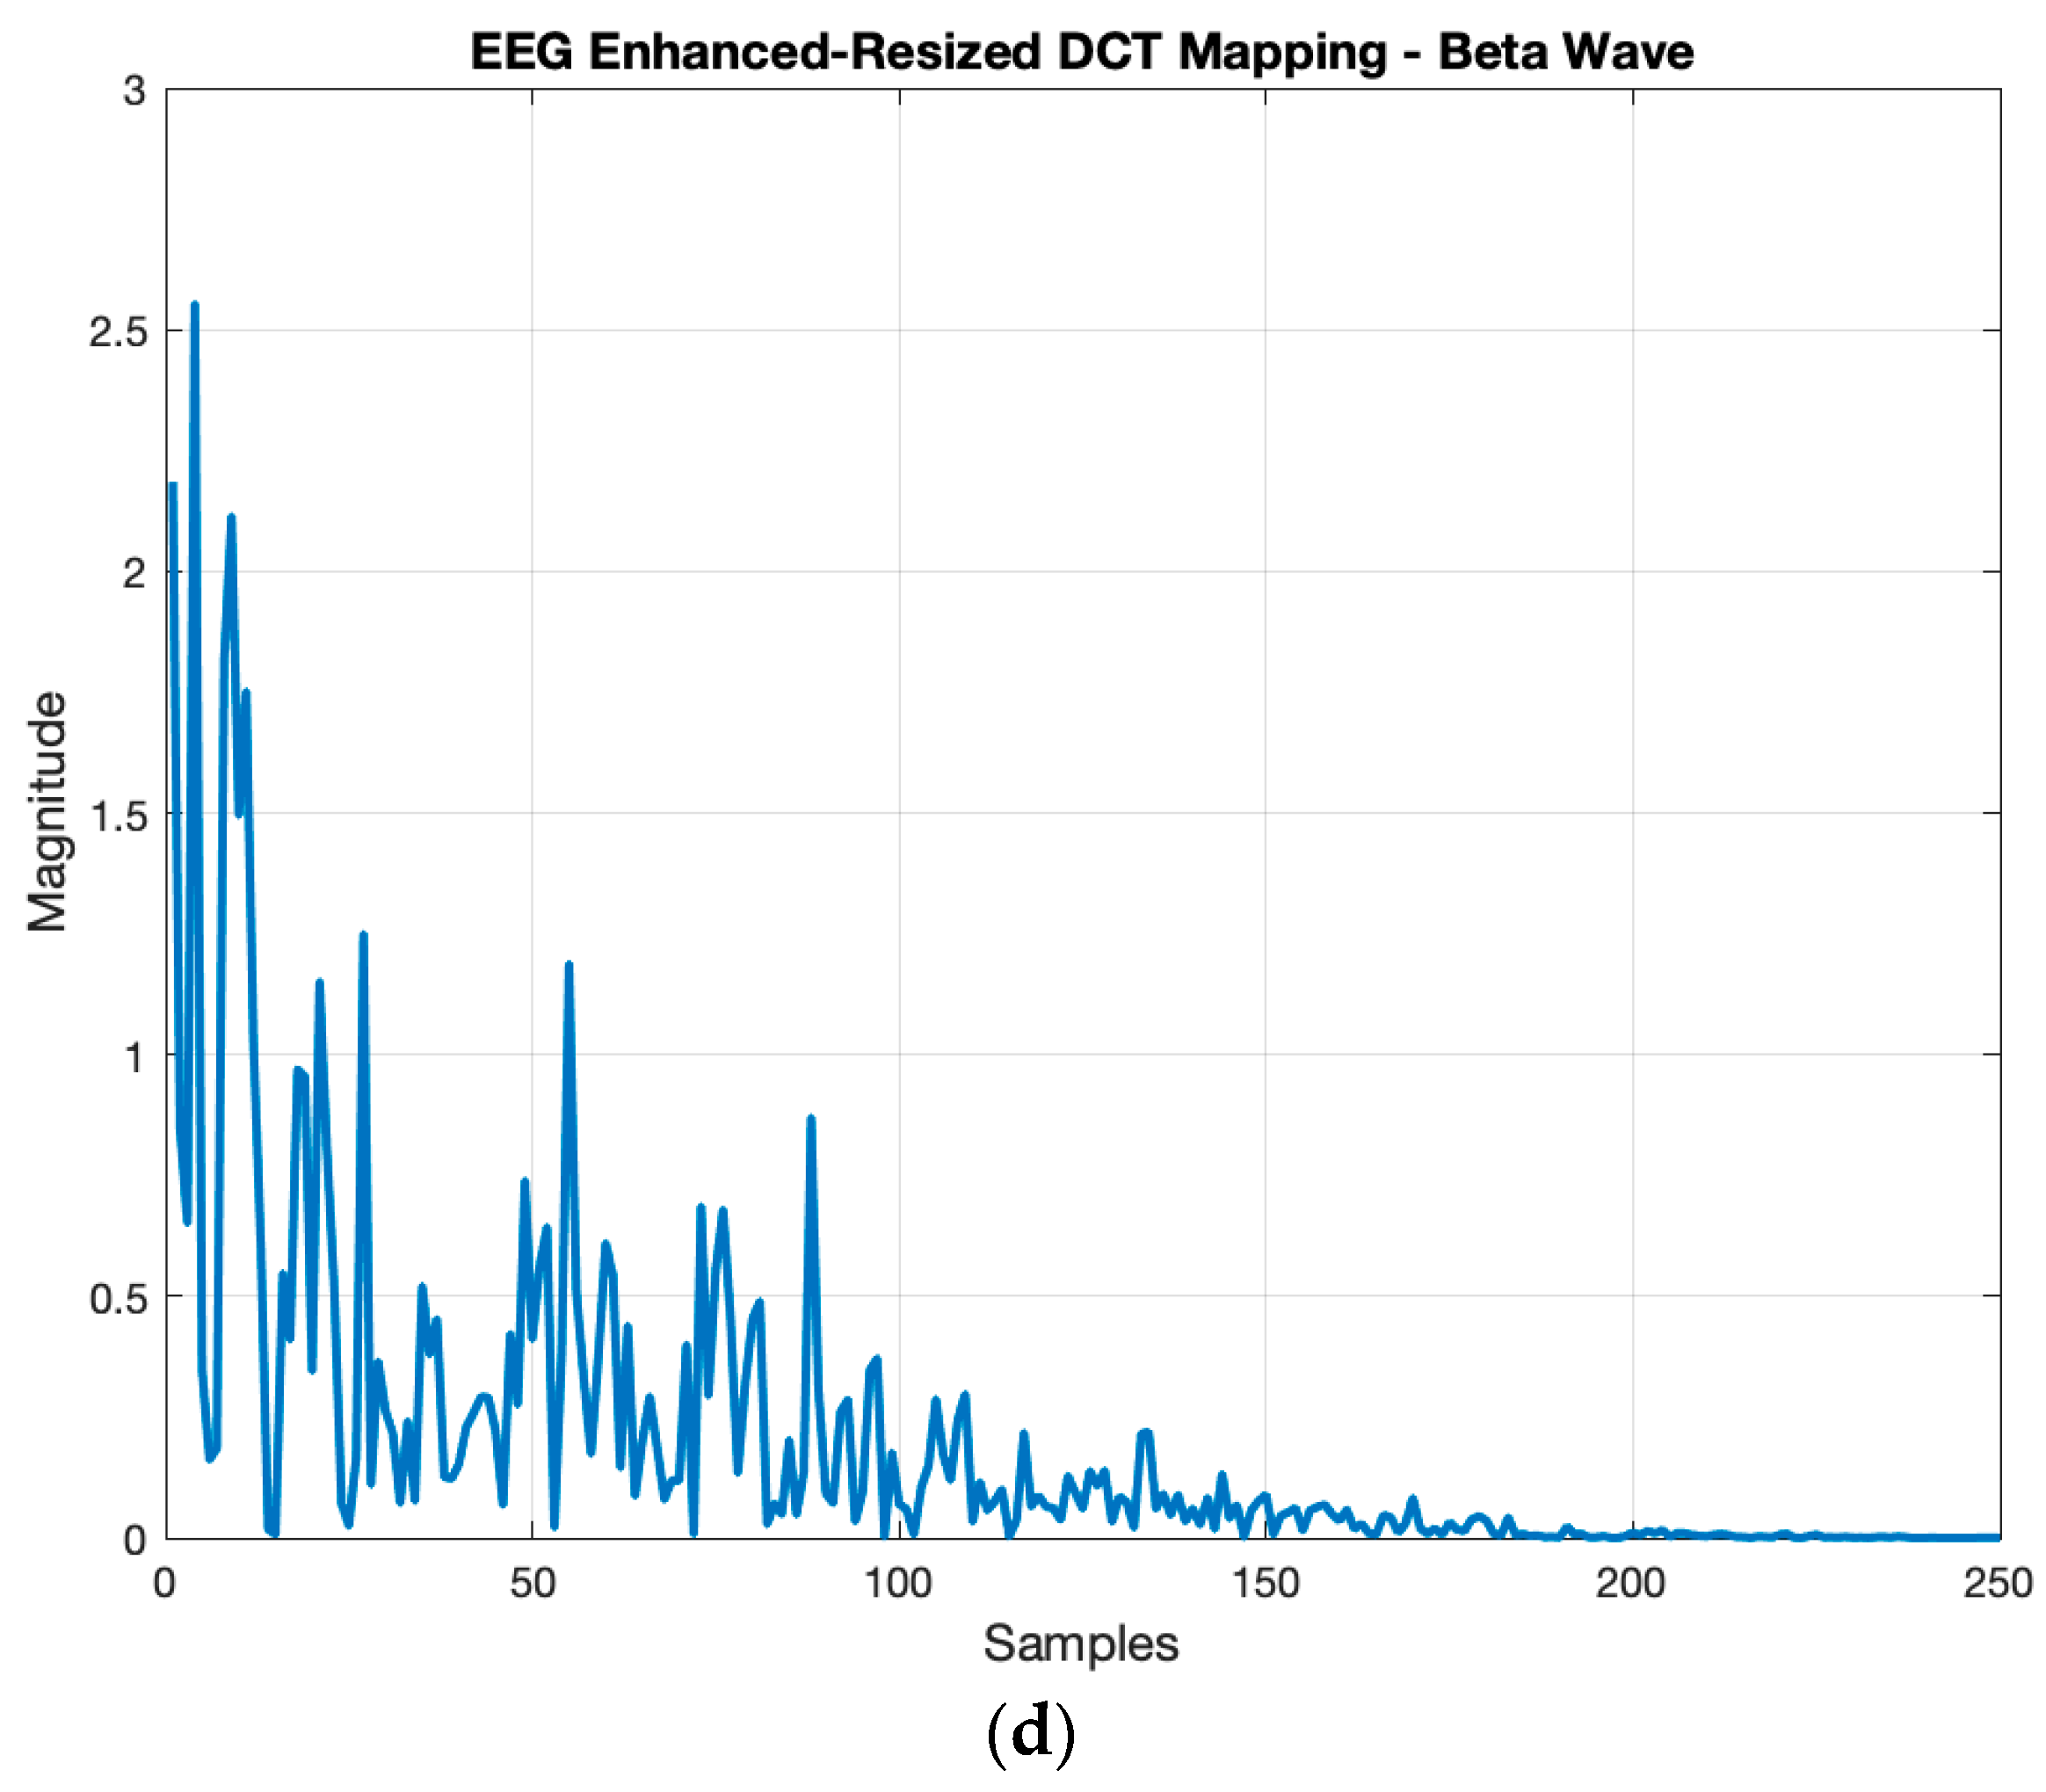
3.1. Results of the DCT Block

Figure 3 shows a representative example of the DCT transformation spectral dynamics of the EEG signals before (a,b) and after (c) the resizing step. In particular, Figure 3a reports the DCT results for a drowsy person, while Figure 3b reports those for a wakeful person. Figure 3c reports the resized DCT signal to reduce the spectral bandwidth and the possible spurious components. This signal is then fed into the autoencoder block.

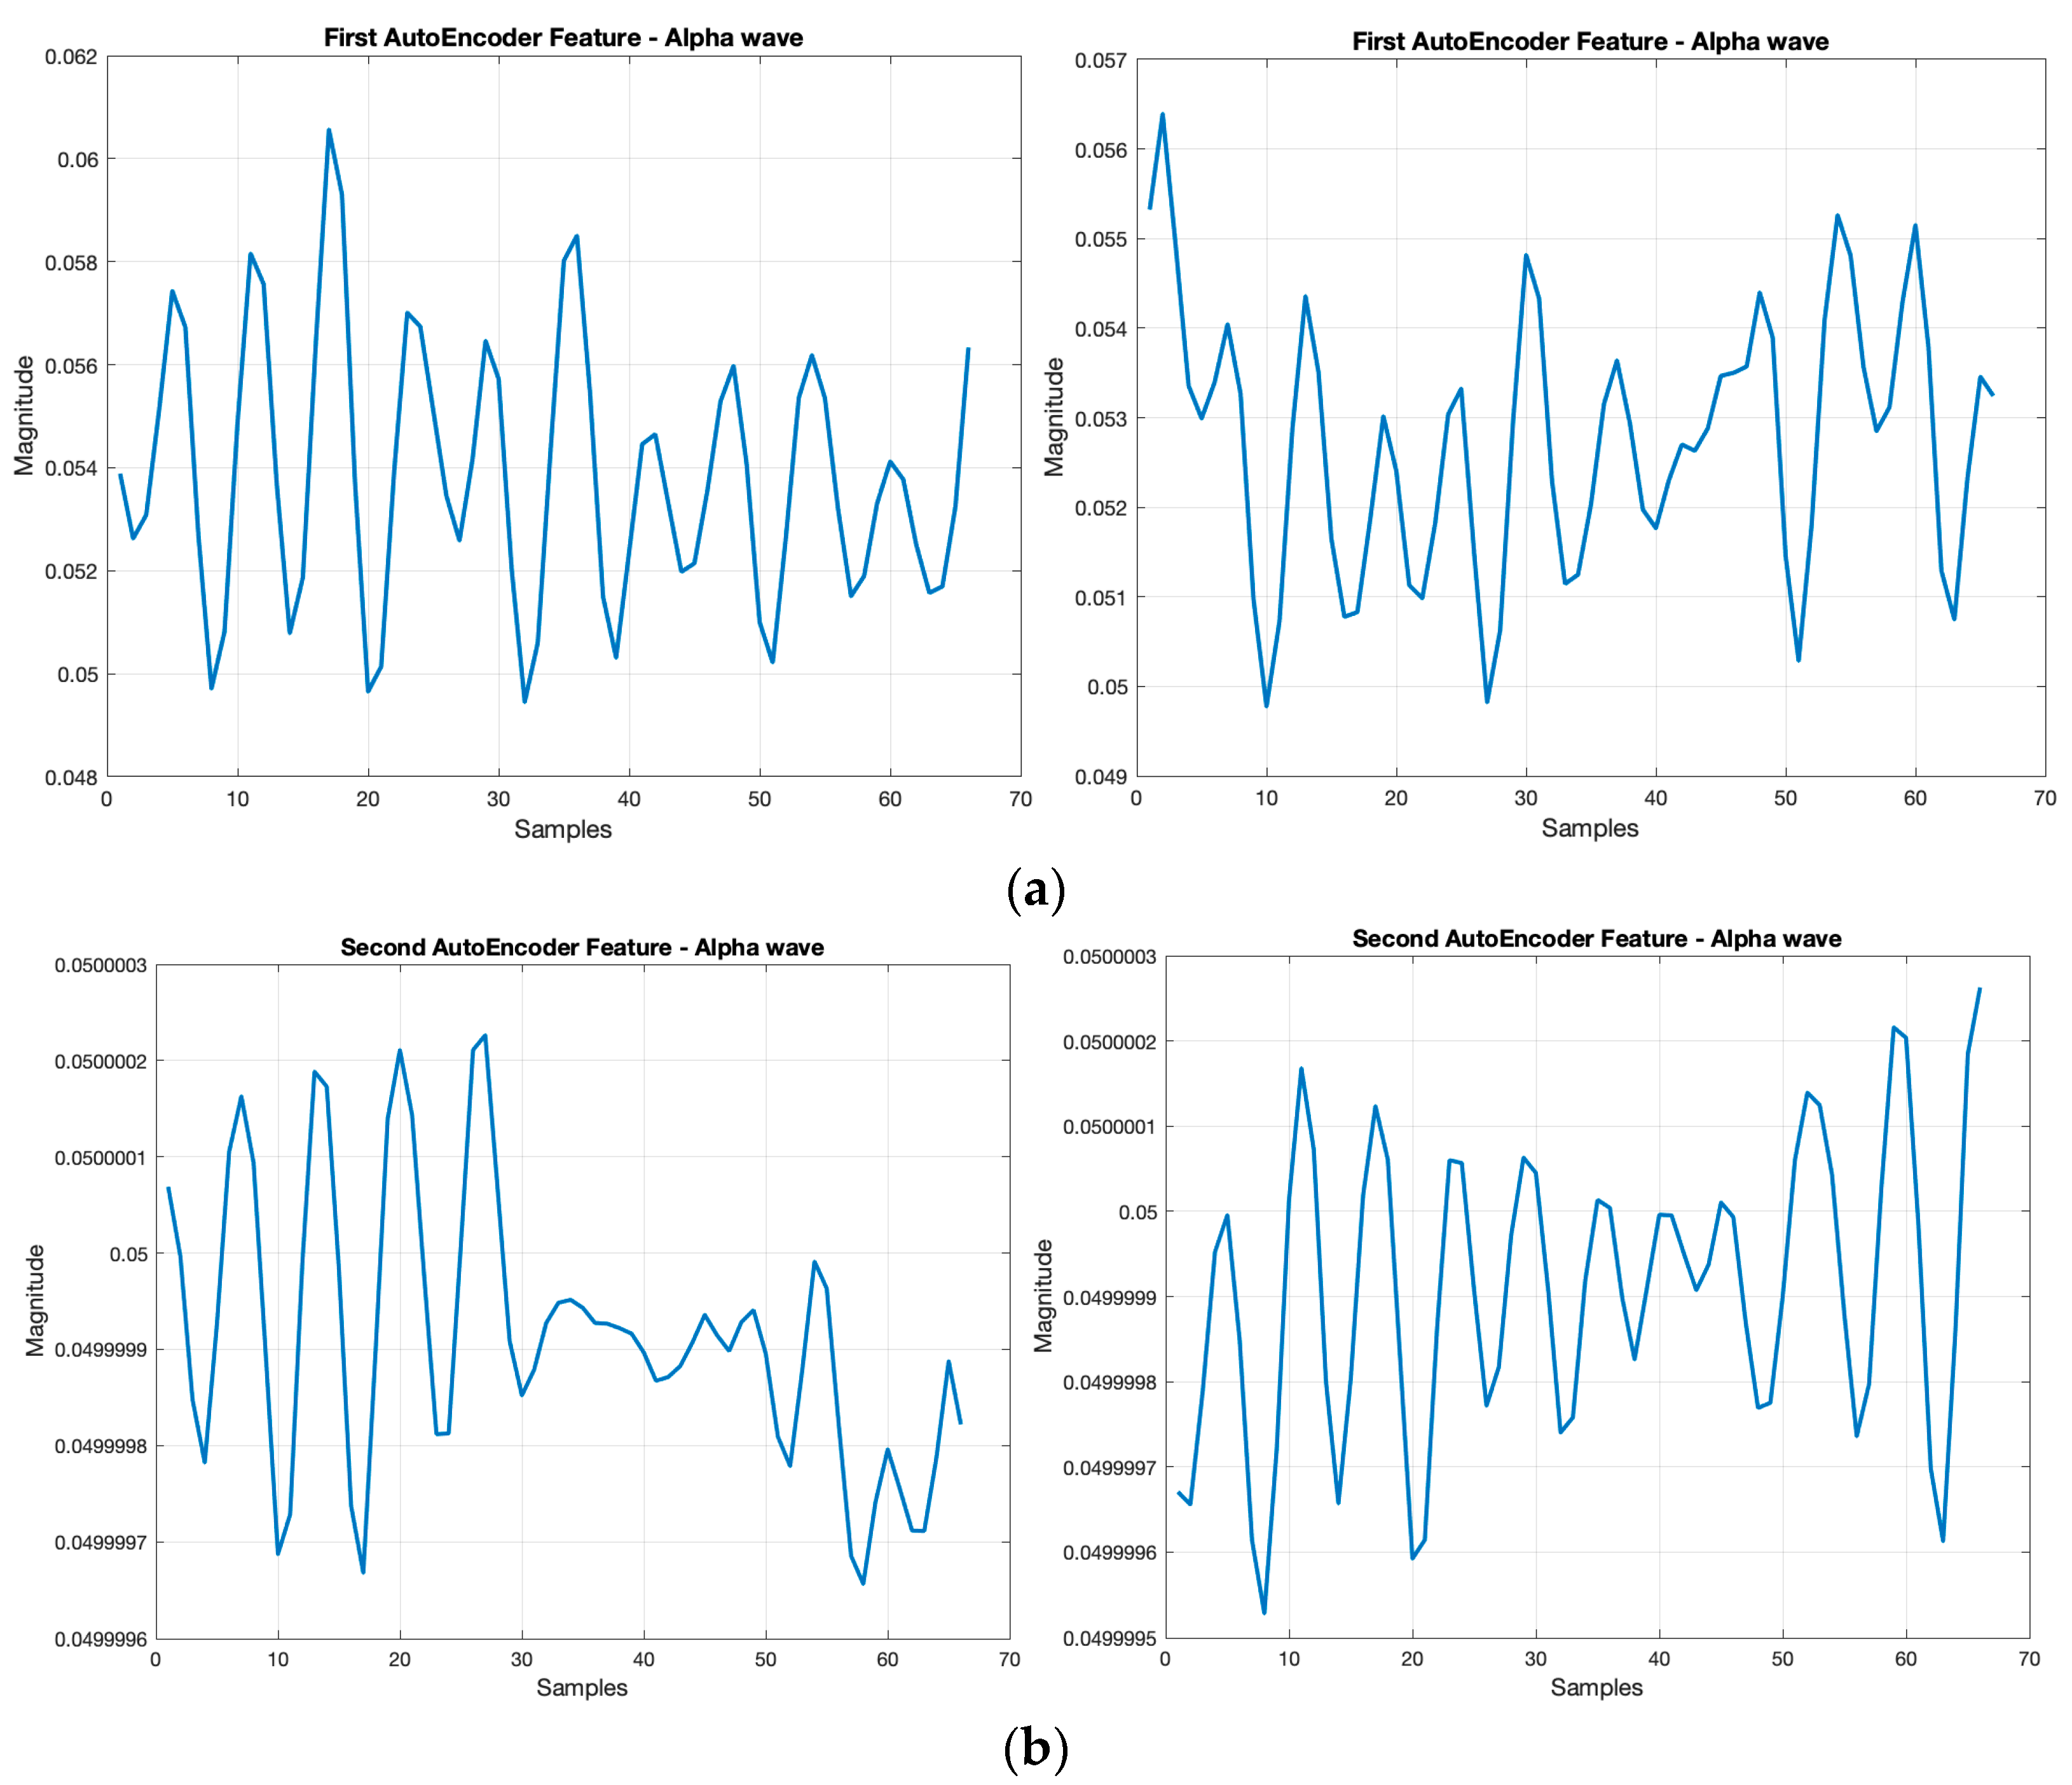
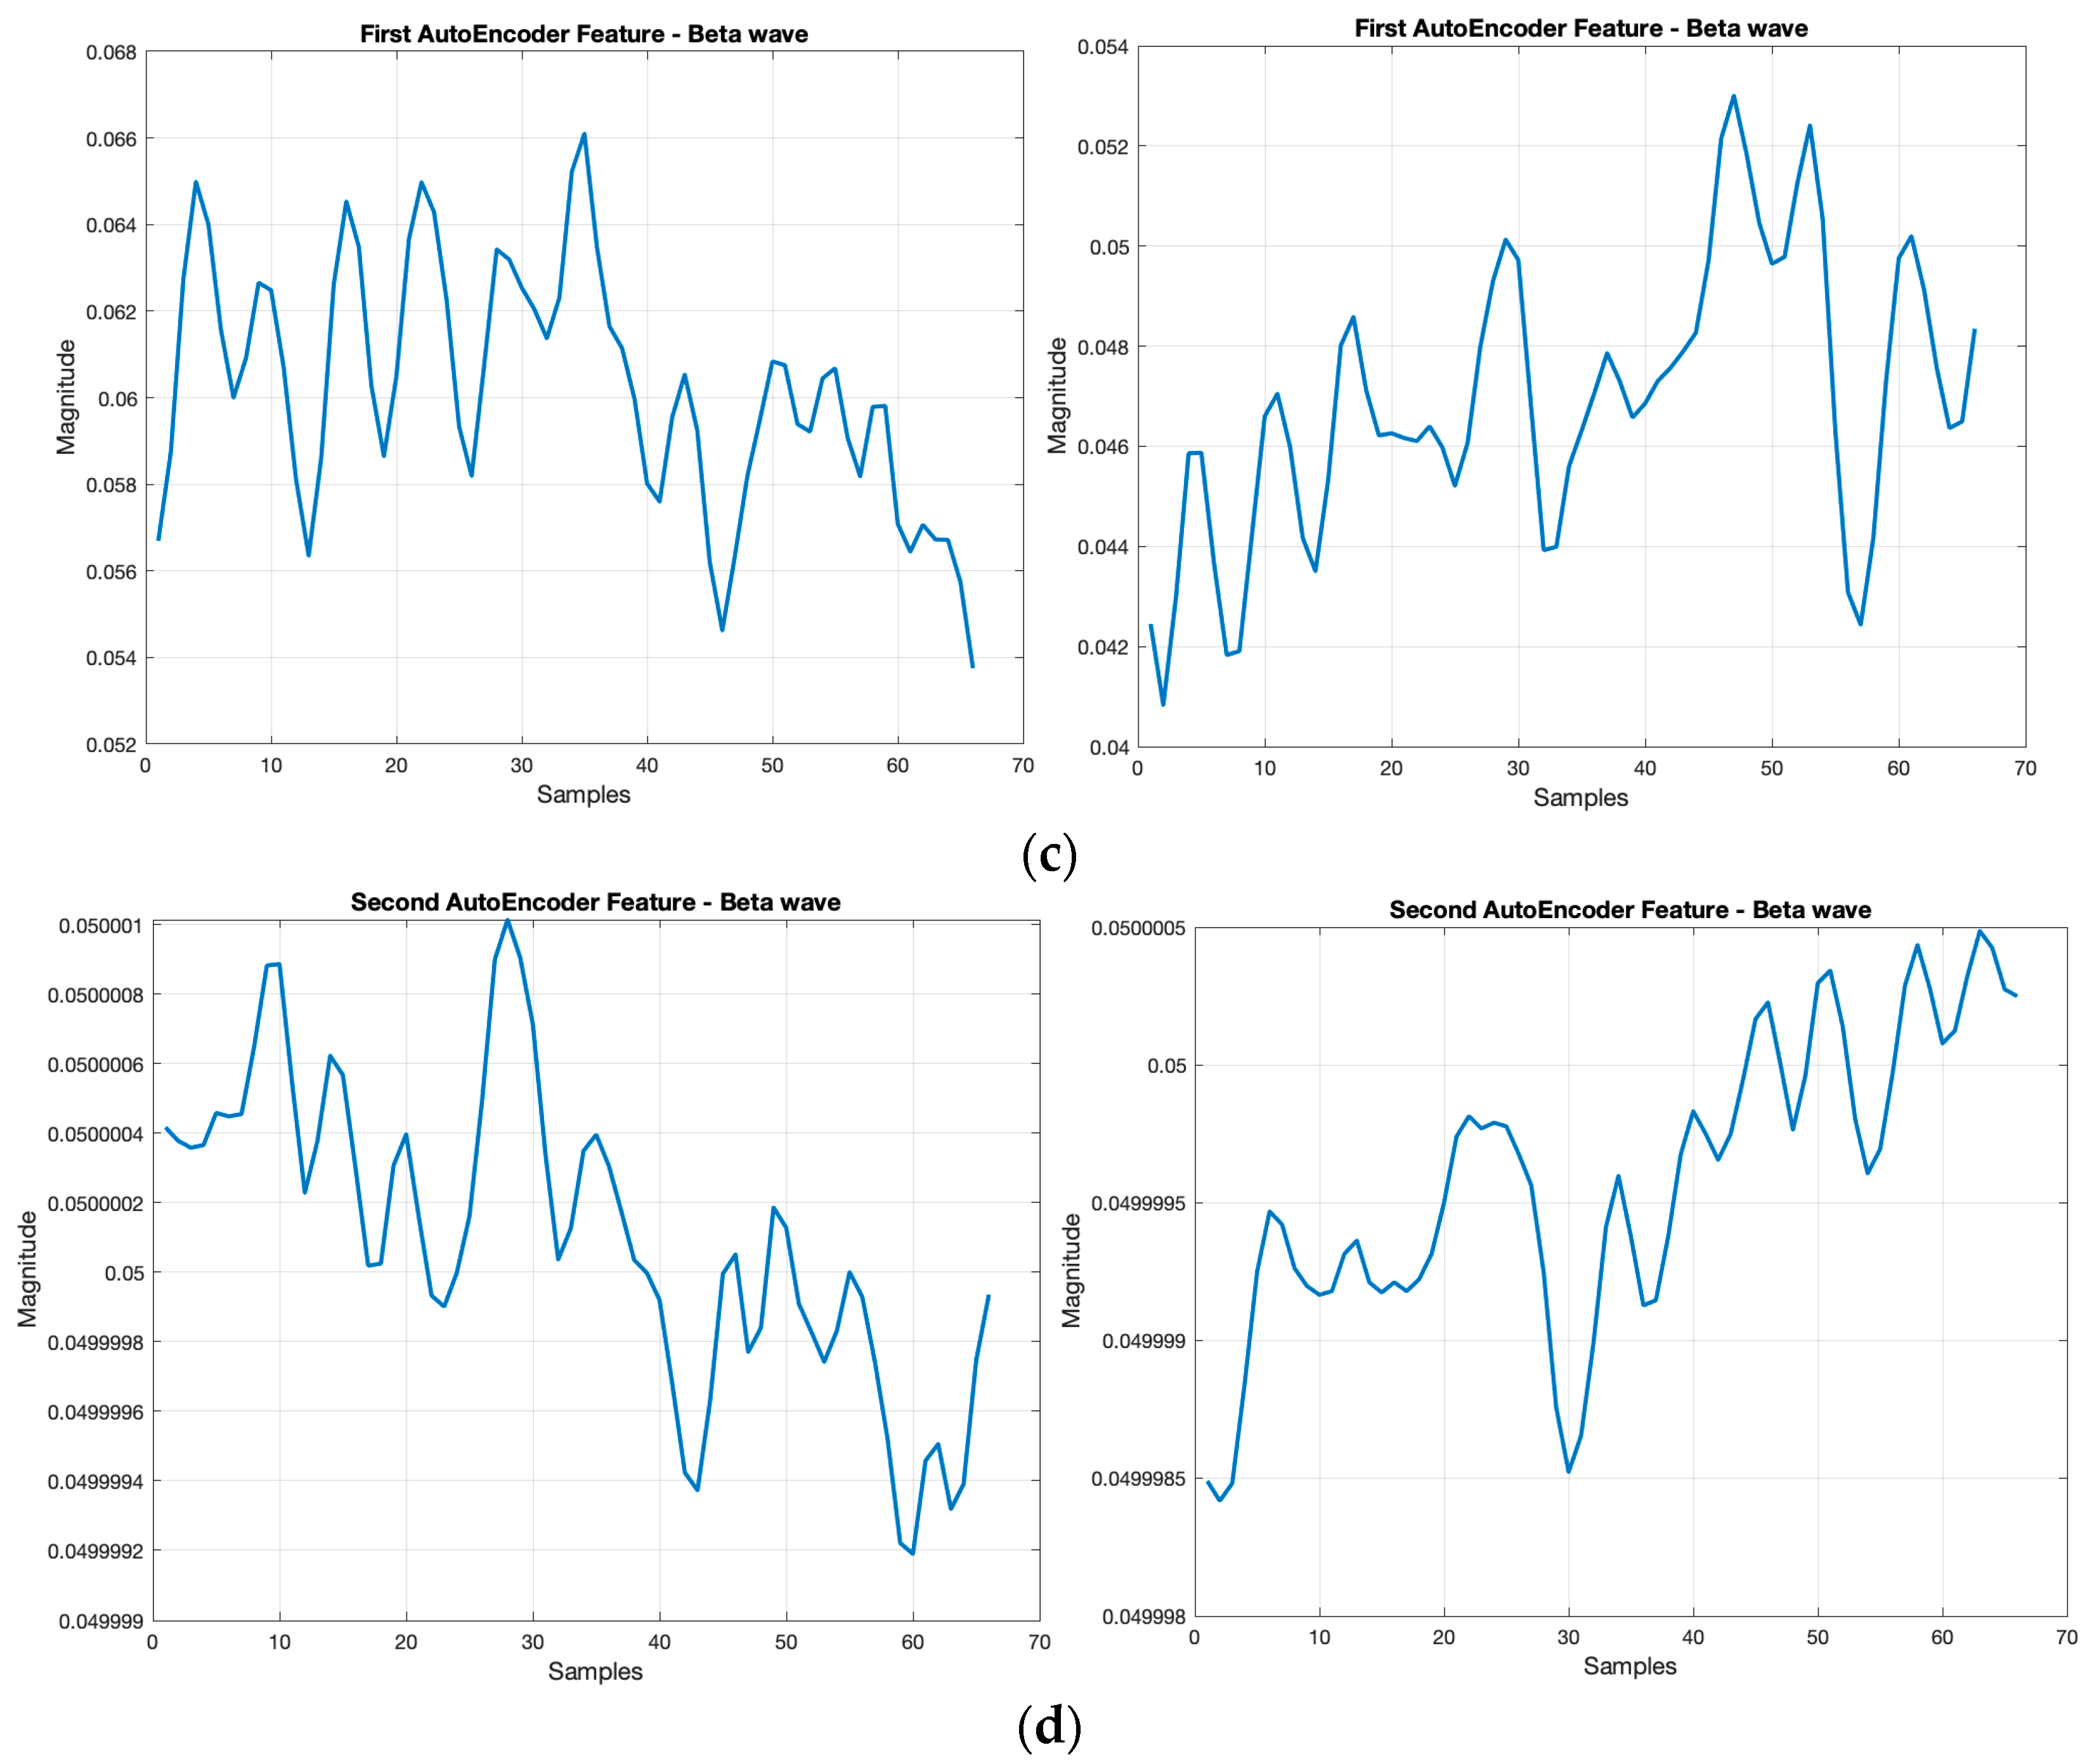
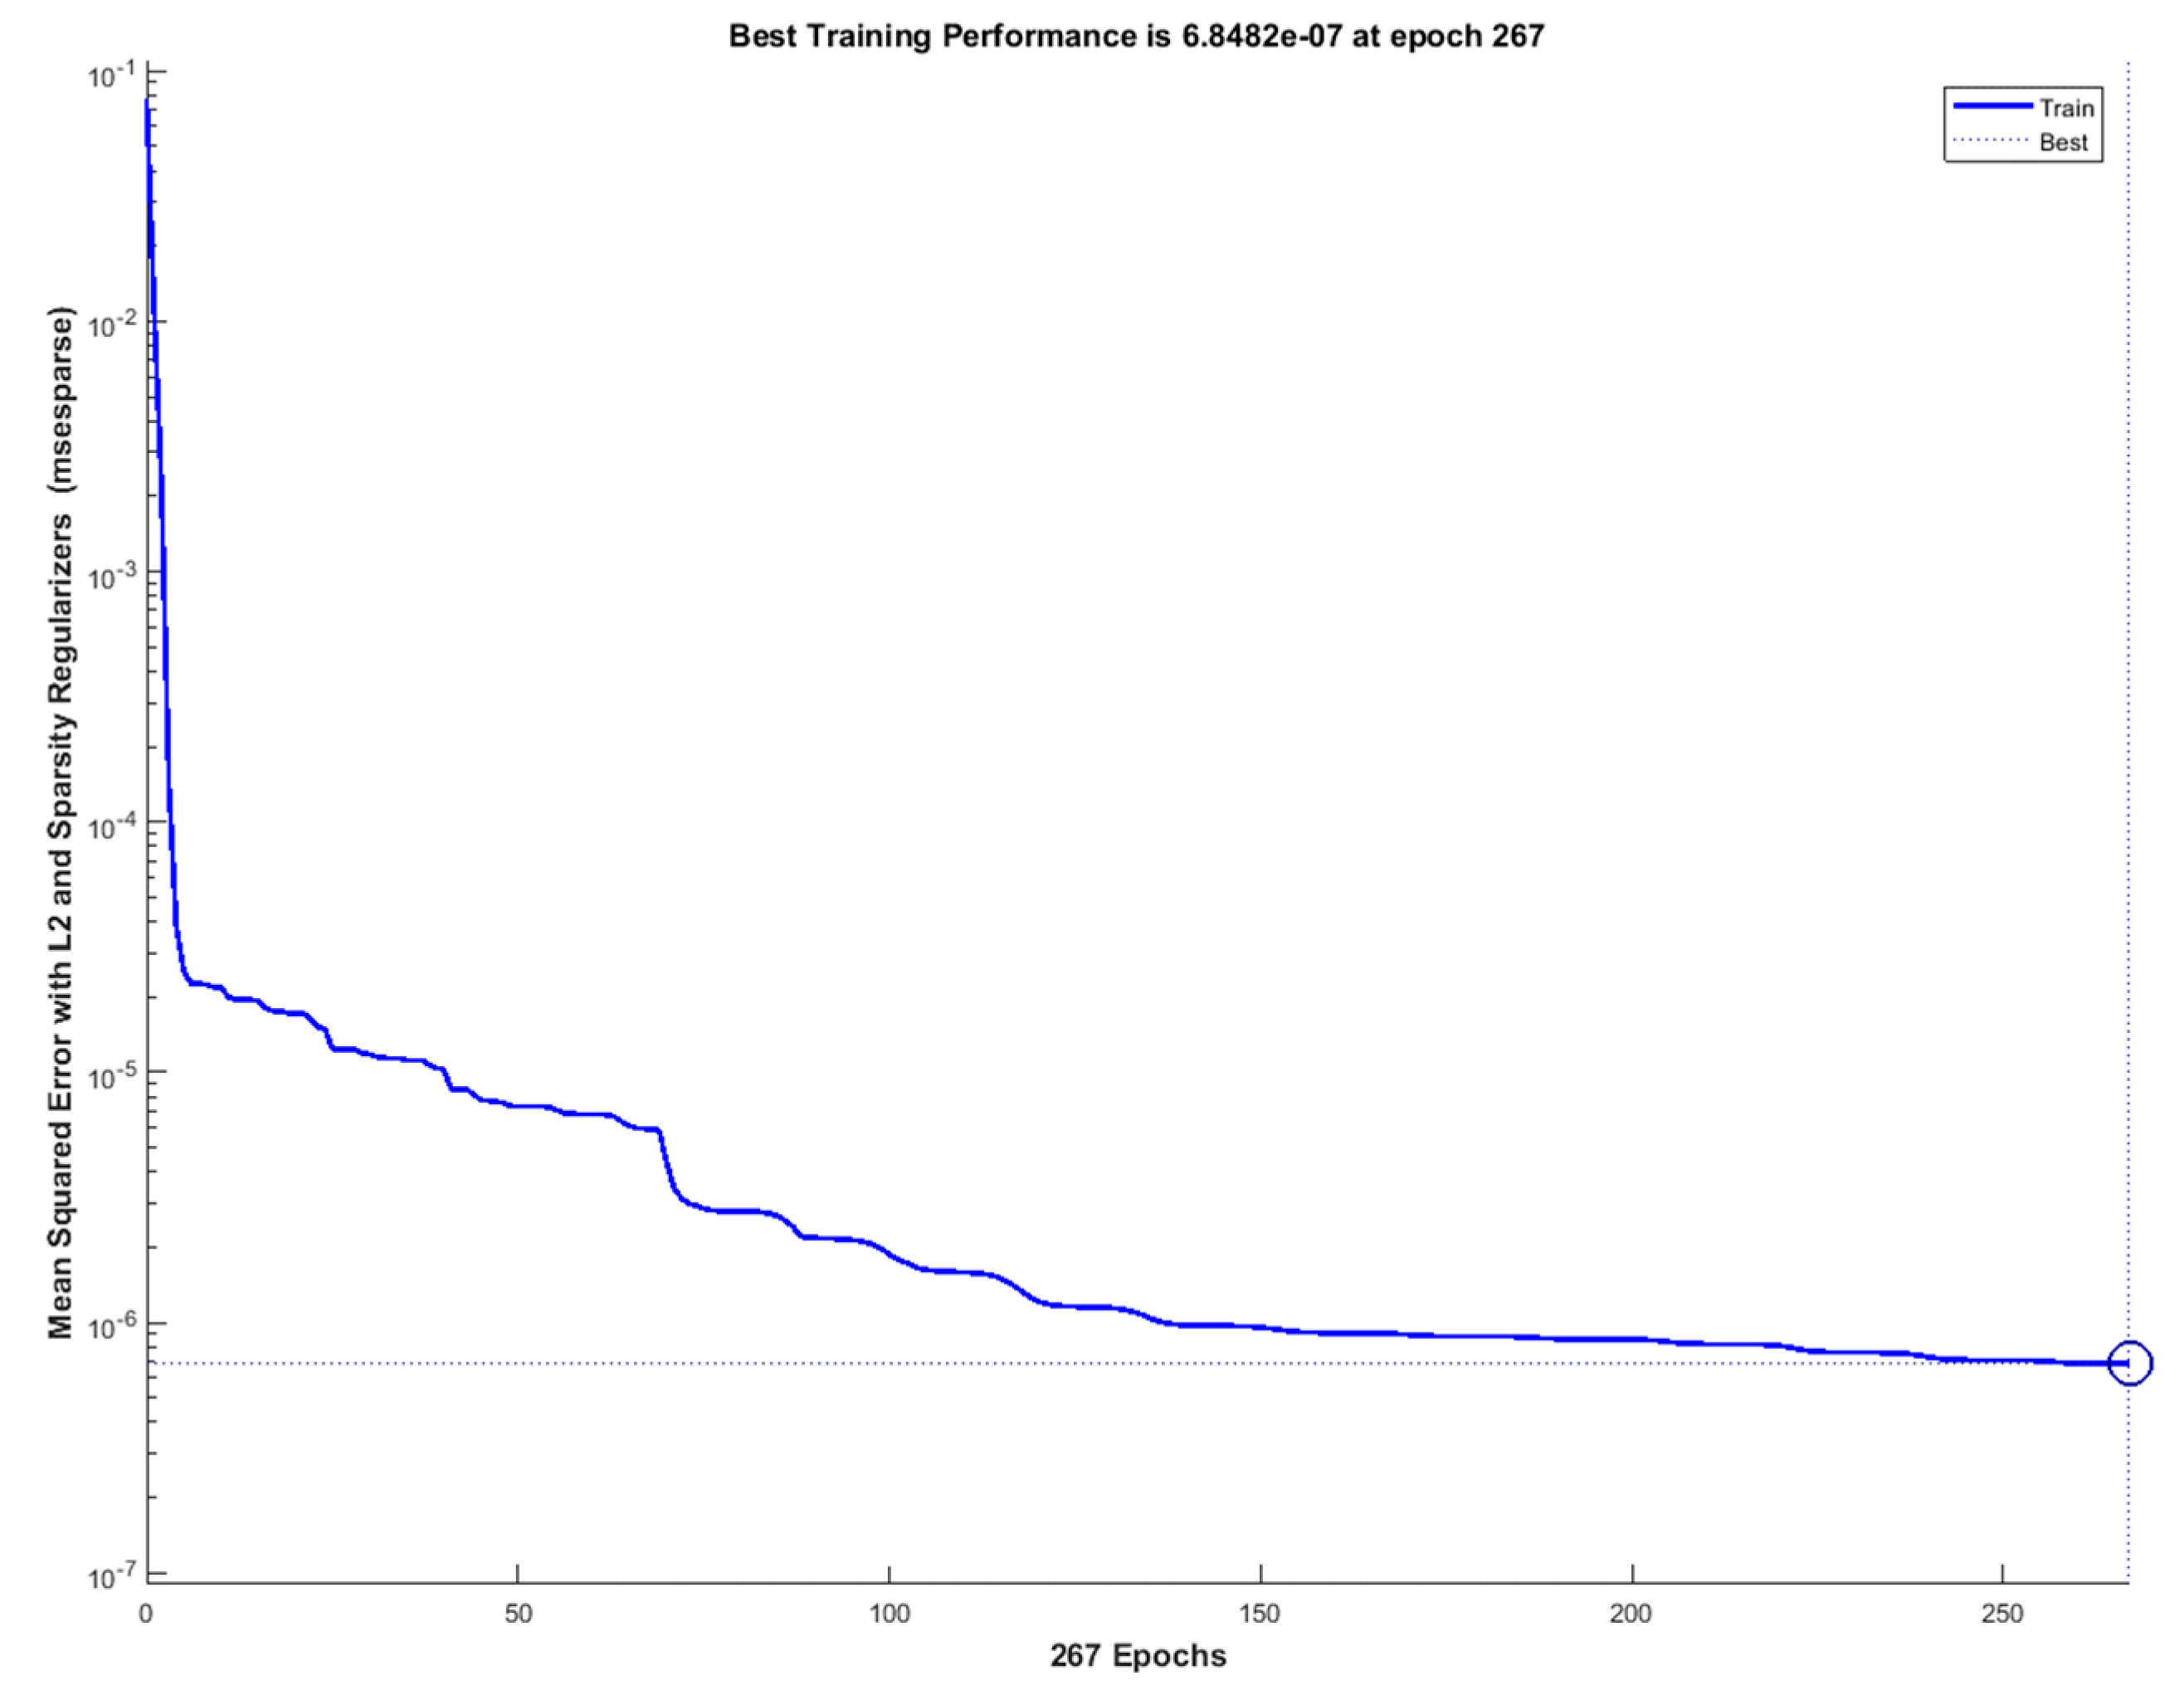
3.2. Results of the Autoencoder Block

According to the architecture described in the Methods section, Figure 4 reports the latent representations (features) of the input DCT-based preprocessed EEG samples and output of the autoencoder block. In particular, the results obtained by the first encoder block are illustrated in Figure 4a, while Figure 4b shows the latent representation after further processing by the second encoder block.
The features provided by the latest autoencoder (Figure 4b) were then fed into the softmax layer, which is described in the next paragraph. The dynamic of the mean squared error during the learning phase of the pipeline is reported in Figure 5.

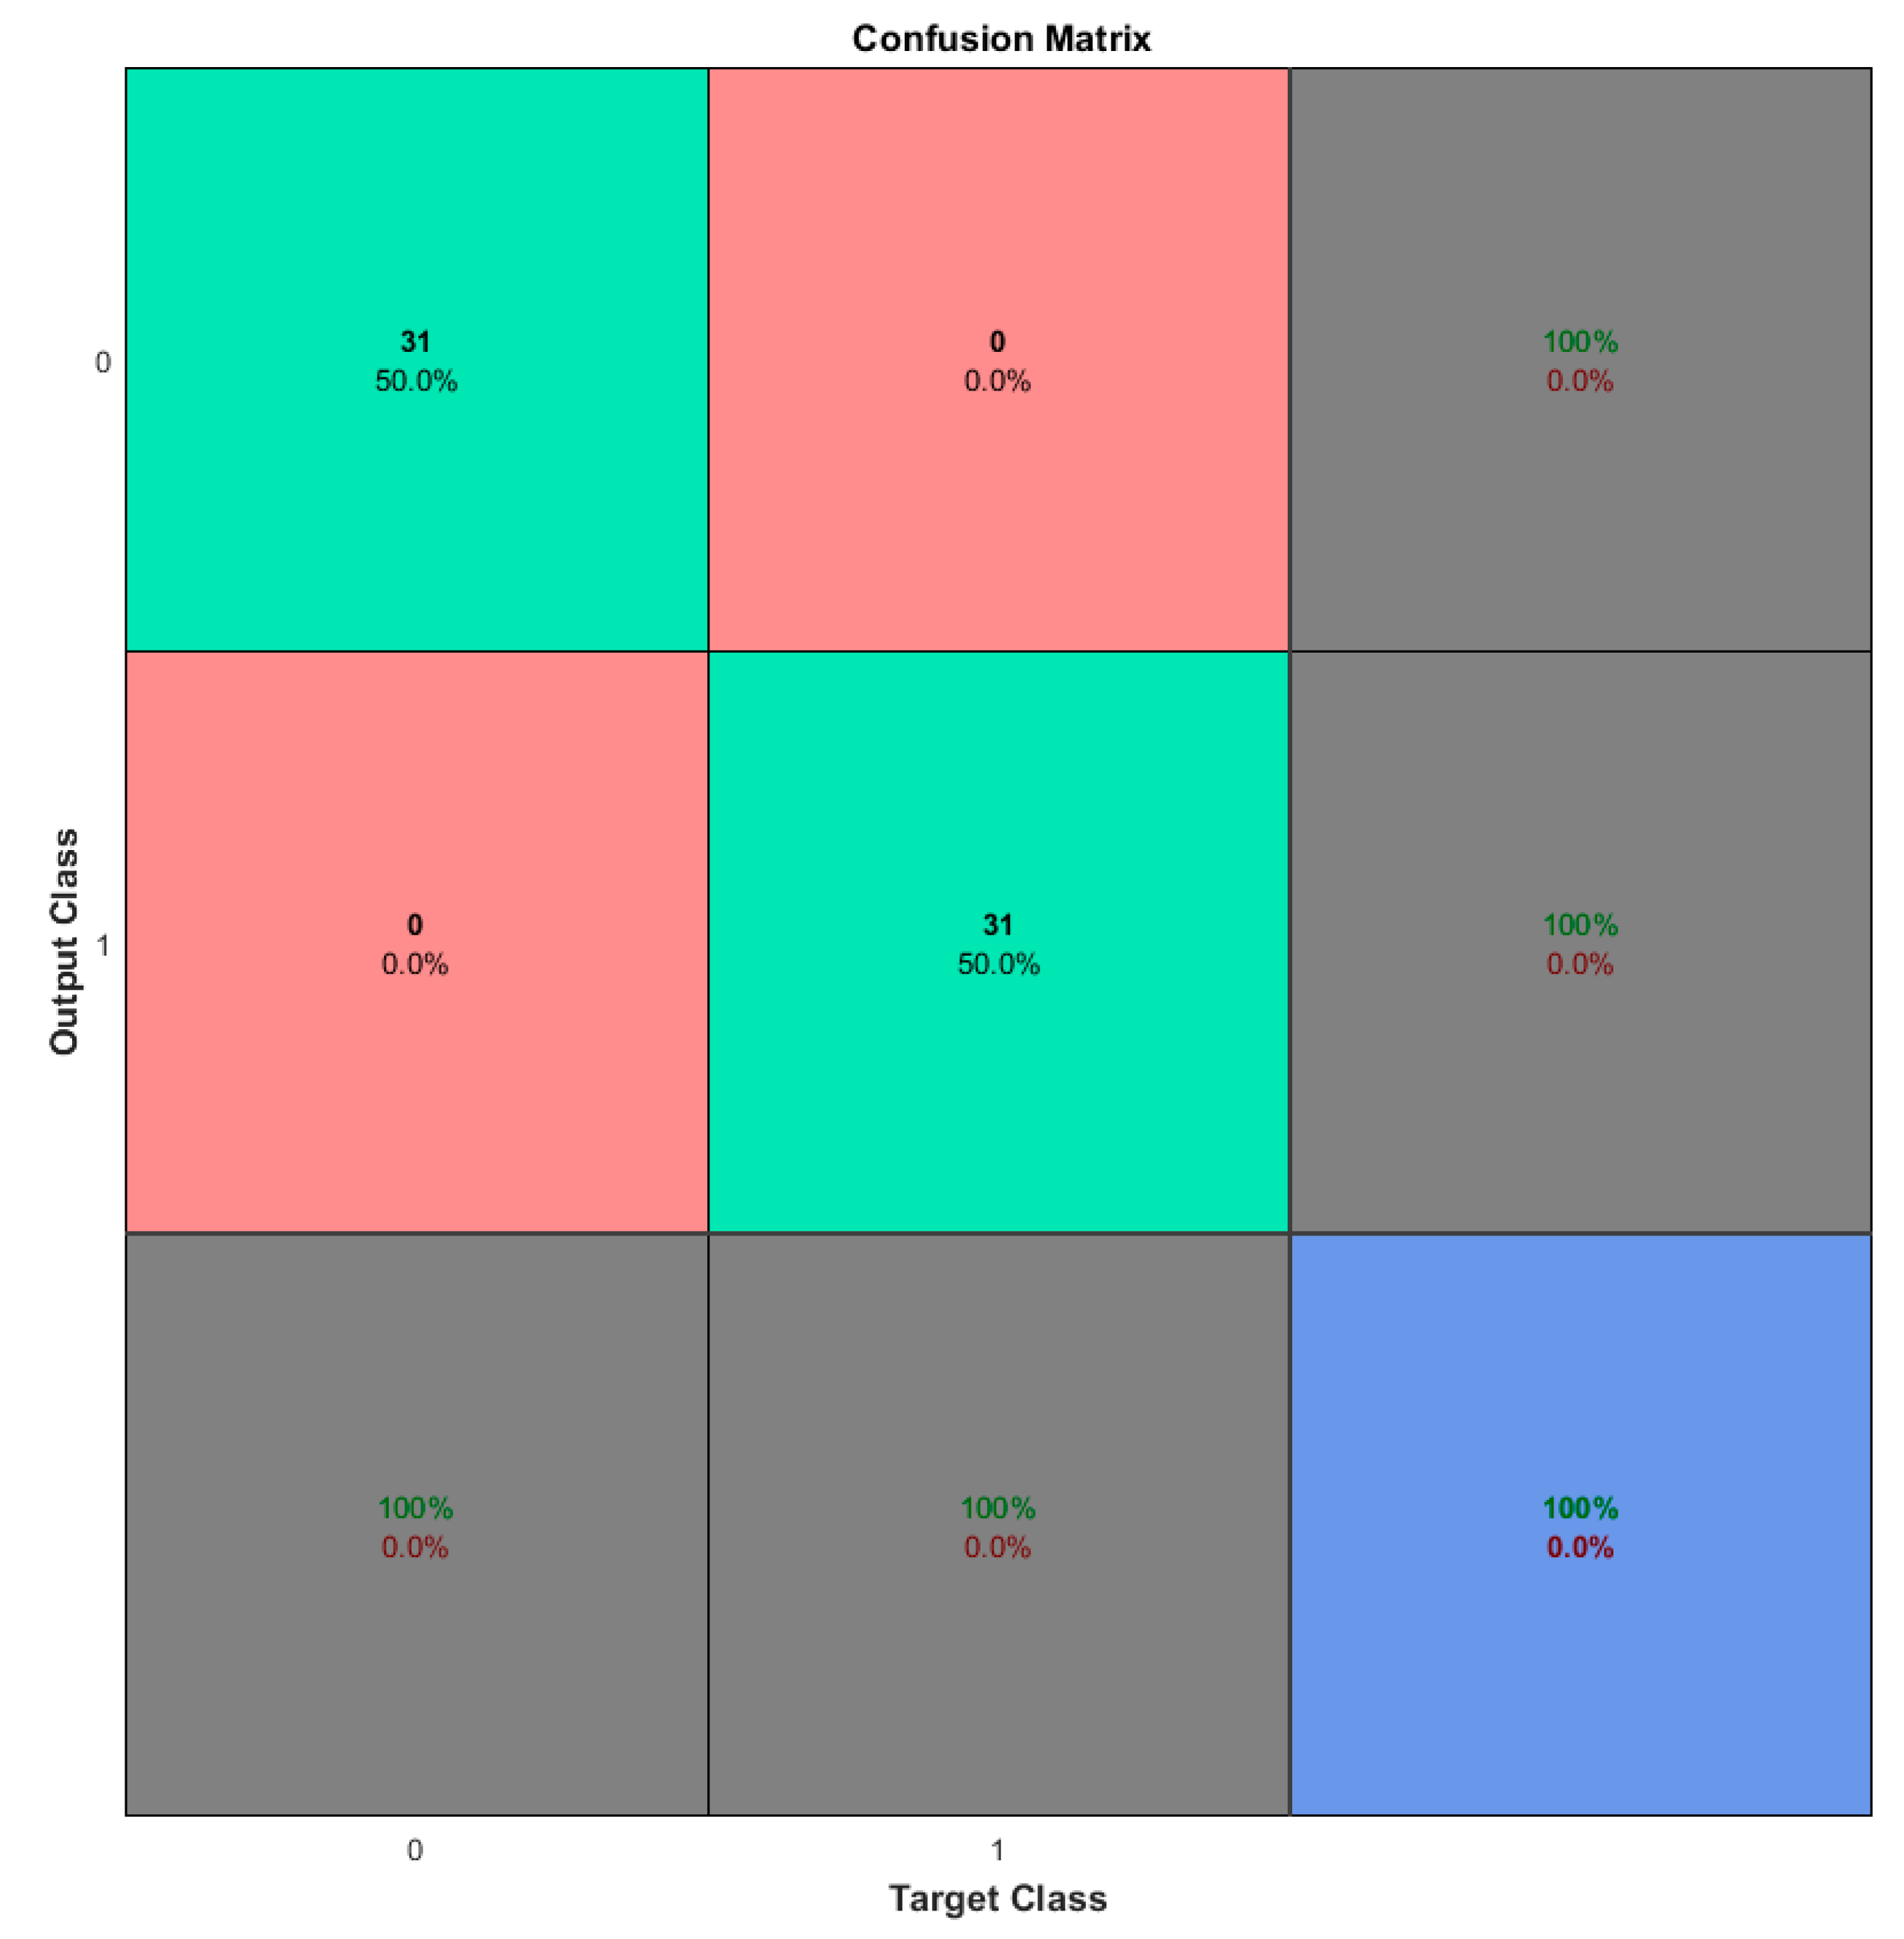
3.3. Results of the Softmax Block

This block executed the classifications of signal features coming from the previous block, and gave an output number in the range of 0–0.5 for a drowsy person and in the range of 0.51–1 for a wakeful person. We tested the proposed pipeline with a training set composed of 62 subjects for which sampled EEG signals were separated into two scenarios: drowsy and wakeful. The acquired EEG signals were used partly for training (55%) and partly for testing and validation (45%) of the pipeline. Results are reported in the confusion matrix illustrated in Figure 6.
The results reported in the confusion matrix of Figure 6 indicates that the system showed 100% accuracy in drowsy/wakeful discrimination. As highlighted in the confusion matrix reported in Figure 6, both specificity and sensitivity (and then the ROC (Receiver Operating Characteristic) analysis) of the proposed algorithm was 100%, as the pipeline was able to discriminate the two classes (drowsy vs. wakeful) without the issue of false positive or false negative results.
In fact, this matrix expresses the performance of the algorithm by statistical classification representing the instances in a predicted class (rows as the target classes) versus the instances in a real class (columns as the output classes) with the assumption of 0 for drowsy and 1 for wakeful. It can be seen that the training was successfully performed since all cases were correctly recognized by the pipeline (green boxes) with no errors (red boxes).
These results are also supported by the dynamic of mean squared error related to the autoencoder block (Figure 5) that asymptotically tends to be very low values.
Table 1 and Table 2 report feature comparisons between our proposed pipeline and other methods reported in the literature, based on deep learning approaches for EEG processing. It is noteworthy that our methodology outperformed other methods in the literature, with respect to both accuracy and training performances.
These findings prove that the present research is very promising in identifying a methodology characterized by minimum invasiveness, high reliability, and considerable speed in the response, which allows for the identification of the reduction in the level of vigilance of a person within a few seconds. This observation, which can be extended to other uses in everyday life in which the maintaining of the level of vigilance is critical, confirms the significant correlations between the activity of the cerebral cortex and that of the cardiovascular apparatus, with the latter coming to be considered as a useful monitoring system of electrocortical activity.

4. Conclusions

The reliable tracking of drowsiness is an important research topic due to the strong impact on the improvement of medical assessment. This is a challenging task requiring accurate and robust algorithms of analysis.
In this study, an innovative Deep Learning bio-inspired pipeline able to detect the level of drowsiness from EEG signals is described. The algorithm is based on the Discrete Cosine Transform (DCT) analysis of EEG signals followed by a Deep learning stage (stacked autoencoders with softmax layers) for proper DCT post-processing data classification.
Results obtained from 62 volunteers indicated 100% accuracy in drowsy/wakeful discrimination. Additionally, the present study has provided experimental evidence that the proposed approach is able to highlight, with high reliability, changes in the level of vigilance in a few minutes, regardless of the age and gender of the subjects. Results presented herein prove this approach can be very promising regarding use in the next generation of medical devices. In order to improve the robustness of the proposed approach, we will analyze such signal features starting from descriptors reported in [33,34,35].
Future works aim to perform extended validation of the proposed pipeline with a wide-range training set in which we integrate the PPG signal and visual information with EEG analysis in order to improve the robustness of the overall approach over a very large dataset.

Author Contributions

Work conceptualization and writing, S.C.; design of experiments, R.P.; experimental work with volunteers, S.R., S.M., and M.C.; algorithms and data analysis, F.R.; experimental data collection, G.F.; work conceptualization and data validation, V.P.

Funding

This research was funded by Italian MIUR - Project PON – ADAS + grant number ARS01_00459.

Conflicts of Interest

The authors declare no conflict of interest.

References

  1. Lin, C.T.; Chang, C.J.; Lin, B.S.; Hung, S.H.; Chao, C.F.; Wang, I.J. A Real-Time Wireless Brain–Computer Interface System for Drowsiness Detection. IEEE Trans. Biomed. Circuits Syst. 2010, 4, 214–222. [Google Scholar] [CrossRef] [PubMed]
  2. Rundo, F.; Conoci, S.; Fallica, G. A Method of Processing Electrophysiological Signals, Corresponding System, Vehicle and Computer Program Product. IT Patent Application Nr. 102017000120714, 24 October 2017. [Google Scholar]
  3. Santamaria, J.; Chiappa, K.H. The EEG of drowsiness in normal adults. J. Clin. Neurophysiol. 1987, 4, 327–382. [Google Scholar] [CrossRef] [PubMed]
  4. Garcés Correa, A.; Orosco, L.; Laciar, E. Automatic detection of drowsiness in EEG records based on multimodal analysis. Med. Eng. Phys. 2014, 36, 244–249. [Google Scholar] [CrossRef] [PubMed]
  5. Fisch, B. Fish and Spehlmann’s EEG Primer: Basic Principles of Digital and Analog EEG, 3rd ed.; Elsevier Science BV: Amsterdam, The Netherlands, 1999. [Google Scholar]
  6. Akin, M.; Kurt, M.; Sezgin, N.; Bayram, M. Estimating vigilance level by using EEG and EMG signals. Neural Comput. Appl. 2008, 17, 227–236. [Google Scholar] [CrossRef]
  7. Kasakawa, S.; Yamanishi, T.; Takahashi, T.; Ueno, K.; Kikuchi, M.; Nishimura, H. Approaches of Phase Lag Index to EEG Signals in Alzheimer’s Disease from Complex Network Analysis. In Innovation in Medicine and Healthcare 2015; Springer International Publishing: Cham, Switzerland, 2016; pp. 459–468. [Google Scholar]
  8. Chai, R.; Ling, S.H.; San, P.P.; Naik, G.R.; Nguyen, T.N.; Tran, Y.; Craig, A.; Nguyen, H.T. Improving EEG-Based Driver Fatigue Classification Using Sparse-Deep Belief Networks. Front. Neurosci. 2017, 11, 103. [Google Scholar] [CrossRef] [PubMed]
  9. Liu, G.; Zhang, Y.; Hu, Z.; Du, X.; Wu, W.; Xu, C.; Wang, X.; Li, S. Complexity Analysis of Electroencephalogram Dynamics in Patients with Parkinson’s Disease. Park. Dis. 2017, 2017, 8701061. [Google Scholar] [CrossRef] [PubMed]
  10. Al-Ani, A.; Koprinska, I.; Naik, G. Dynamically Identifying Relevant EEG Channels by Utilizing Their Classification Behaviour. Expert Syst. Appl. 2017, 83, 273–282. [Google Scholar] [CrossRef]
  11. Chai, R.; Naik, G.R.; Nguyen, T.N.; Ling, S.H.; Tran, Y.; Craig, A.; Nguyen, H.T. Driver fatigue classification with independent component by entropy rate bound minimization analysis in an EEG-based system. IEEE J. Biomed. Health Inform. 2017, 21, 715–724. [Google Scholar] [CrossRef] [PubMed]
  12. Jia, H.; Li, H.; Yu, D. The relationship between ERP components and EEG spatial complexity in a visual Go/Nogo task. J. Neurophysiol. 2017, 117, 275–283. [Google Scholar] [CrossRef] [PubMed]
  13. Bhardwaj, S.; Jadhav, P.; Adapa, B.; Acharyya, A.; Naik, G.R. Online and automated reliable system design to remove blink and muscle artefact in EEG. In Proceedings of the 2015 37th Annual International Conference of the IEEE Engineering in Medicine and Biology Society (EMBC), Milan, Italy, 25–29 August 2015; pp. 6784–6787. [Google Scholar]
  14. Kwon, Y.; Kim, K.I.; Tompkin, J.; Kim, J.H.; Theobalt, C. Efficient learning of image super-resolution and compression artifact removal with semi-local Gaussian processes. IEEE Trans. Pattern Anal. Mach. Intell. 2015, 37, 1792–1805. [Google Scholar] [CrossRef] [PubMed]
  15. Jadhav, P.N.; Shanamugan, D.; Chourasia, A.; Ghole, A.R.; Acharyya, A.A.; Naik, G. Automated detection and correction of eye blink and muscular artefacts in EEG signal for analysis of Autism Spectrum Disorder. In Proceedings of the 2014 36th Annual International Conference of the IEEE Engineering in Medicine and Biology Society, Chicago, IL, USA, 26–30 August 2014; pp. 1881–1884. [Google Scholar]
  16. Sahayadhas, A.; Sundaraj, K.; Murugappan, M. Detecting driver drowsiness based on sensors: A review. Sensors 2012, 12, 16937–16953. [Google Scholar] [CrossRef] [PubMed]
  17. Vinciguerra, V.; Ambra, E.; Maddiona, L.; Oliveri, S.; Romeo, M.F.; Mazzillo, M.; Rundo, F.; Fallica, G. Progresses towards a processing pipeline in photoplethysmogram (PPG) based on SiPMs. In Proceedings of the 2017 European Conference on Circuit Theory and Design (ECCTD), Catania, Italy, 4–6 September 2017; pp. 1–5. [Google Scholar]
  18. Conoci, S.; Rundo, F.; Petralta, S.; Battiato, S. Advanced skin lesion discrimination pipeline for early melanoma cancer diagnosis towards PoC devices. In Proceedings of the European Conference on Circuit Theory and Design, ECCTD, Catania, Italy, 4–6 September 2017. [Google Scholar]
  19. Rundo, F.; Ortis, A.; Battiato, S.; Conoci, S. Advanced Bio-Inspired System for Noninvasive Cuff-Less Blood Pressure Estimation from Physiological Signal Analysis. Computation 2018, 6, 46. [Google Scholar] [CrossRef]
  20. Rundo, F.; Conoci, S.; Banna, G.L.; Stanco, F.; Battiato, S. Bio-Inspired Feed-Forward System for Skin Lesion Analysis, Screening and Follow-Up. In Image Analysis and Processing—ICIAP 2017; Lecture Notes in Computer Science; Springer: Cham, Switzerland, 2017; Volume 10485. [Google Scholar]
  21. Rundo, F.; Conoci, S.; Banna, G.L.; Ortis, A.; Stanco, F.; Battiato, S. Evaluation of Levenberg–Marquardt neural networks and stacked autoencoders clustering for skin lesion analysis, screening and follow-up. IET Comput. Vis. 2018, 12, 957–962. [Google Scholar] [CrossRef]
  22. LeCun, Y.; Bengio, Y. The Handbook of Brain Theory and Neural Networks; Arbib, M.A., Ed.; MIT Press: Cambridge, MA, USA, 1998; pp. 1–5. [Google Scholar]
  23. Rundo, F.; Conoci, S.; Ortis, A.; Battiato, S. An Advanced Bio-Inspired PhotoPlethysmoGraphy (PPG) and ECG Pattern Recognition System for Medical Assessment. Sensors 2018, 18, 405. [Google Scholar] [CrossRef] [PubMed]
  24. Vicente, J.; Laguna, P.; Bartra, A.; Bailón, R. Detection of driver’s drowsiness by means of HRV analysis. Comput. Cardiol. 2011, 38, 89–92. [Google Scholar]
  25. Rundo, F.; Fallica, P.G.; Conoci, S.; Parenti, R.; Perciavalle, V. A Method of Processing Electrophysiological Signals, Corresponding System, Vehicle and Computer Program Product. IT Patent N. 102018000005512, 18 May 2018. [Google Scholar]
  26. Lal, S.K.; Craig, A. A critical review of the psychophysiology of driver fatigue. Biol. Psychol. 2001, 55, 173–194. [Google Scholar] [CrossRef]
  27. De Naurois, C.J.; Bourdin, C.; Stratulat, A.; Diaz, E.; Vercher, J. Detection and prediction of driver drowsiness using artificial neural network models. Accid. Anal. Prev. 2017. [Google Scholar] [CrossRef] [PubMed]
  28. Balandong, R.P.; Ahmad, R.F.; Saad, M.N.M.; Malik, A.S. A Review on EEG-Based Automatic Sleepiness Detection Systems for Driver. IEEE Access 2018, 6, 22908–22919. [Google Scholar] [CrossRef]
  29. Hajinoroozi, M.; Mao, Z.; Huang, Y. Prediction of driver’s drowsy and alert states from EEG signals with deep learning. In Proceedings of the 2015 IEEE 6th International Workshop on Computational Advances in Multi-Sensor Adaptive Processing (CAMSAP), Cancun, Mexico, 13–16 December 2015; pp. 493–496. [Google Scholar] [CrossRef]
  30. Vesselenyi, T.; Moca, S.; Rus, A.; Mitran, T.; Tătaru, B. Driver drowsiness detection using ANN image processing. IOP Conf. Ser. Mater. Sci. Eng. 2017, 252, 012097. [Google Scholar] [CrossRef] [Green Version]
  31. Wen, T.; Zhang, Z. Deep Convolution Neural Network and Autoencoders-Based Unsupervised Feature Learning of EEG Signals. IEEE Access 2018, 6, 25399–25410. [Google Scholar] [CrossRef]
  32. Towle, V.L.; Bolaños, J.; Suarez, D.; Tan, K.; Grzeszczuk, R.; Levin, D.N.; Cakmur, R.; Frank, S.A.; Spire, J.P. The spatial location of EEG electrodes: Locating the best-fitting sphere relative to cortical anatomy. Electroencephalogr. Clin. Neurophysiol. 1993, 86, 1–6. [Google Scholar] [CrossRef]
  33. Narasimha, M.; Peterson, A. On the Computation of the Discrete Cosine Transform. IEEE Trans. Commun. 1978, 26, 934–936. [Google Scholar] [CrossRef]
  34. Moller, M.F. A Scaled Conjugate Gradient Algorithm for Fast Supervised Learning. Neural Netw. 1993, 6, 525–553. [Google Scholar] [CrossRef]
  35. Bishop, C.M. Pattern Recognition and Machine Learning; Springer: New York, NY, USA, 2006; Volume 1. [Google Scholar]
Figure 1. The proposed Deep Neural Networks-based pipeline.
Computation 07 00013 g001
Figure 2. Autoencoder system architecture.
Computation 07 00013 g002
Figure 3. DCT spectral dynamics of the source EEG samples: (a) drowsy and (b) wakeful; bicubic remapped DCT spectral dynamic: (c) drowsy and (d) wakeful.
Computation 07 00013 g003aComputation 07 00013 g003b
Figure 4. Latent representation of input DCT-based EEG computed by: the first autoencoder block for drowsy (a) and wakeful (c); the second autoencoder block for drowsy (b) and wakeful (d).
Computation 07 00013 g004aComputation 07 00013 g004b
Figure 5. Mean squared error dynamic of autoencoder.
Computation 07 00013 g005
Figure 6. Confusion matrix (target/output class: “0”, Drowsy; “1”, wakeful).
Computation 07 00013 g006
Table 1. Accuracy comparison with respect to such several methods reported in the review paper [28].
Drowsiness Detection Methodologies [28]Accuracy
SVM + Bayes90.6%
SVM-RBF93.1% +/− 5.2%
K-SVD93.87%
SVM98% (average accuracy)
ANN99.5%
LDA97%
SVM(NR)92%
Proposed100%
Table 2. Performance comparison with respect to such similar methods described in Reference [30].
Drowsiness Detection MethodologiesTraining Performance (Min MSE)Training Performance (Number of Epochs)Type of Signals
Method proposed in [30]10−6430Imaging + Signal
Proposed10−6280Signal

