Targeted Drug Delivery of Magnetic Nano-Particle in the Specific Lung Region


1
School of Chemistry, Physics & Mechanical Engineering, Queensland University of Technology (QUT), 2 George Street, GPO Box 2434, Brisbane, QLD 4001, Australia
2
School of Mechanical and Mechatronic Engineering, Faculty of Engineering and Information Technology, University of Technology Sydney, Ultimo, New South Wales 2007, Australia
*
Author to whom correspondence should be addressed.
Computation 2020, 8(1), 10; https://0-doi-org.brum.beds.ac.uk/10.3390/computation8010010
Submission received: 8 January 2020
/
Revised: 24 January 2020
/
Accepted: 27 January 2020
/
Published: 4 February 2020
(This article belongs to the Section Computational Engineering)
Abstract
:Aerosolized drug inhalation plays an important role in the treatment of respiratory diseases. All of the published in silico, in vivo, and in vitro studies have improved the knowledge of aerosol delivery in the human respiratory system. However, aerosolized magnetic nano-particle (MNP) transport and deposition (TD) for the specific position of the human lung are still unavailable in the literature. Therefore, this study is aimed to provide an understanding of the magnetic nano-particle TD in the targeted region by imposing an external magnetic field for the development of future therapeutics. Uniform aerosolized nano-particle TD in the specific position of the lung airways will be modelled by adopting turbulence k–ω low Reynolds number simulation. The Euler–Lagrange (E–L) approach and the magneto hydrodynamics (MHD) model are incorporated in the ANSYS fluent (18.0) solver to investigate the targeted nano-particle TD. The human physical activity conditions of sleeping, resting, light activity and fast breathing are considered in this study. The aerosolized drug particles are navigated to the targeted position under the influence of external magnetic force (EMF), which is applied in two different positions of the two-generation lung airways. A numerical particle tracing model is also developed to predict the magnetic drug targeting behavior in the lung. The numerical results reveal that nano-particle deposition efficiency (DE) in two different magnetic field position is different for various physical activities, which could be helpful for targeted drug delivery to a specific region of the lung after extensive clinical trials. This process will also be cost-effective and will minimize unwanted side effects due to systemic drug distribution in the lung.
1. Introduction
Micron and nano-particles (NPs) are mostly produced from nature (volcanic ash, smoke, ocean spray, fine sand, and dust, etc.), the workplace (running diesel engines, large-scale mining, and industry) and man-made processes (fires, traffic, and drug aerosols are generated by inhalers for therapeutic purposes) [1]. A range of studies [2,3,4,5,6,7,8,9,10,11,12] improved the knowledge of the micron-size particle transport in the upper and lower airways, while the magnetic nano-particle (MNPs) transport for targeted drug delivery in literature is greatly missing. The increased popularity of nanomaterial products expose a significant amount of NP emission into the atmosphere [13]. These NPs or drug aerosols are inhaled through the extrathoracic and tracheobronchial airways down into the alveolar region [14]. As a result of strong diffusion and thermophoretic effects, inhaled NPs deposit into extrathoracic airways [15]. A certain percentage may deposit in various lung regions by touching the moist airway surfaces and hence, are accessible for interactions with respiratory tissue [14]. Therefore, toxic particles may instigate pulmonary and other diseases, while drug aerosols may be harnessed to struggle with diseases [14,16]. The inhalation of drug aerosols is broadly used for the treatment of lung disorders such as chronic obstructive pulmonary disease, asthma, respiratory infection, cystic fibrosis and more recently, lung cancer. NPs significantly influence their retention for shape and size in the lungs and targeting properties. At present, for drug delivery purposes, NPs are widely used through various delivery routes, including inhalation. Targeted NP delivery to the affected lung tissue may improve therapeutic efficiency and minimize unwanted side effects [17]. Despite these attractive advantages, systemic inhalation of therapeutic drug aerosol delivery in the specific position of the lung is still not clear [18]. A comprehensive investigation of magnetic nano-particles (MNPs) transport and deposition (TD) in a lung model is essential for the understanding of pharmaceutical aerosol transport into the targeted position of the lung.
There are limited studies that have been conducted on MNPs for targeting magnetic drug delivery. Dames et al. [17] developed superparamagnetic iron oxide nano-particles in a combination of target-directed magnetic gradient fields for targeting aerosol delivery to the lungs of mice [6]. The theoretical and experimental study concluded that the superparamagnetic iron oxide nano-particles might be useful for treating specified lung disease. Bennett et al. [19] discussed the potential application of aerosol drug delivery and deposition techniques for both serial and parallel pathways in the lung [4]. They concluded that aerosol bolus delivery and extremely slow inhalation of aerosols in diagnostic lung tests might be useful for targeting drug delivery to the conducting airways. Ally et al. developed an in vitro model to investigate the possibility of targeted magnetic aerosol deposition for lung cancer and to predict the trajectories of the aerosol particles Ally et al. [20]. They concluded that aerosol particle concentration and magnetic field gradient are important considerations for targeting magnetic delivery of aerosols. Mishra et al. [21] focused on the potential application of nanotechnology in medicine and discussed drug-delivery systems as well as their applications in therapeutics, imaging, and diagnostics. They concluded that the surface characteristics of NPs could achieve successful development on targeted NPs to use in therapy and imaging. Wilczewska et al. [22] investigated the nano carrier connections with drugs and magnetic nano-particles as carriers in drug delivery systems. The authors concluded that for the drug delivery systems, nanocarriers could improve the therapeutic and pharmacological properties of conventional drugs. Lübbe et al. [23] reported that magnetic drug targeting is one of the various possibilities of drug targeting, and site-directed drug targeting is one way of local or regional antitumor treatment. Sharma et al. [24] studied magnetic nano-particles transport in a channel for targeted drug delivery. They concluded that the fluid velocity and MNPs are decreasing with the increasing of a magnetic field. Roa et al. [25] showed that inhalable doxorubicin NPs are an effective way to treat lung cancer. They revealed that a non-invasive route of administration might change the way lung cancer is treated in the future. Pourmehran et al. have used Lagrangian magnetic particle tracking using a discrete phase model to investigate the effect of a magnetic field on the behavior of the magnetic drug carrier [26]. Pourmehran et al. have used a realistic model to investigate the human tracheobronchial airways using computational fluid and particle dynamics [26]. They have developed an optimal magnetic drug characteristics coordination and magnetic impact for drug delivery to the human lung. Boghi et al. [27] have studied the influence of magnetic probe position and circulating direction of electric current and geometry they used was the coeliac trunk for describing MNPs in blood flow. They verified that the effectiveness of their technique can be the treatment of hepatic cancer. Krafcik et al. [28] have studied MNPs in the single alveolus using EMF and they concluded that during breathing sedimentation and particle deposition in lung alveolus is possible. Recently, Russo et al. [29] have used MNPs for targeting drug delivery in the respiratory airways and showed therapy of a lung tumor but did not consider how much particle or drug deposited in that targeted position.
Until now there have been no numerical or analytical studies that consider the human respiratory tract, available in the literature on magnetic nano-particles TD for targeting drug delivery in the specific position of the human lung. Hence, detailed analysis of the MNPs transport and deposition in the human respiratory tract are required for a better understanding of the fluid-particle dynamics. Therefore, this study presents a two-generation symmetric lung model for targeting drug delivery by considering two targeting positions.
2. Numerical Methods
The present study considers a two-generation lung model as derived from the trachea, which does not include the extrathoracic region. ANSYS (Fluent) 18.0 was used to solve the following governing equations with proper initial and boundary conditions. The steady-state flow field is converged when the residuals decreased to less than 10−6. Air was considered as the working fluid with constant density (), viscosity (μ) and fluid static pressure (p). The governing equations for continuity and momentum equations [26] are given as:
Continuity equation:
Momentum equations:
The k-ω low Reynolds number turbulence model is adopted for numerical simulations with maximum Reynolds number is calculated as 5 × 10³. The Reynolds number describes the ratio of the magnitudes of the inertial and viscous forces on the particle. Due to the presence of extra non-linear terms [30] there have some limitation of turbulence multiphase flows model [31], however, in the case of low Reynolds number these terms are negligible.
With Pseudo vorticity equation:
where ; ; ; ; the turbulent viscosity [32], and the function, is defined as with . The other coefficients value used in the above equation have taken from [26] as follows:
Stationary wall condition, pressure outlet, and velocity inlet conditions are used as the boundary conditions. For the boundary conditions, wall condition was considered as trap and conducting for the targeted position, outlet condition was considered as a pressure outlet and turbulence specification method was and omega values, and the inlet condition was considered a uniform mass flow. In this analysis deposition efficiency (DE) is identified by calculating trapped particle percentage and the equation as follows:
A Lagrangian particle-tracking scheme and finite volume based ANSYS 18.0 (Fluent) solver together with Euler–Lagrange (E–L) approach and magneto-hydrodynamics (MHD) model have been applied to investigate the particle TD in the double bifurcation airways model. Euler–Euler [33] and Euler–Lagrange (E–L) approaches are usually used for nano-particle simulation. An E-L approach solves the particle trajectory equation while an E–E approach is used to solve convection-diffusion equations [13]. The E–L method tracks the individual particle trajectory by considering inertia, electrostatic effects, diffusivity, and near wall terms directly [34]. The present study uses the E–L approach as it also considers dp 100 nm. In this approach, the force balance equation for individual particles is given as follows:
where is the particle velocity and is the force term. are drag and magnetic forces respectively. Brownian motion is considered for the present nano-particle simulation. An appropriate particle motion equation is solved to calculate the individual particles.
For a spherical particulate, the Stokes–Cunningham drag force is expressed as:
where Cc is the Cunningham correction factor. The specific correction factor values are used for different diameter particles. Here are particle density and particle diameter respectively and λ is the mean free path of the gas molecules. The Brownian force amplitude is defined as:
where ζ is the unit variance independent Gaussian random number, ∆t is the particle time-step integration, and S0 is the spectral intensity.
The present study magnetic force, is calculated as:
where is the magnetic permeability, χ is the magnetic susceptibility of the particle, Vp is the particle volume, and is the magnetic field intensity.
The magnetic susceptibility of the particle equation [26] is defined as:
where, is the particle diameter.
The magnetic number Mn (Tesla) is defined as follows [26]:
is the characteristic magnetic field strength. The magnetic number is dependent to the magnetic field intensity. All case studies that have been used in this analysis to get the desired result are listed in Table 1.
3. Computational Domain and Mesh Generation
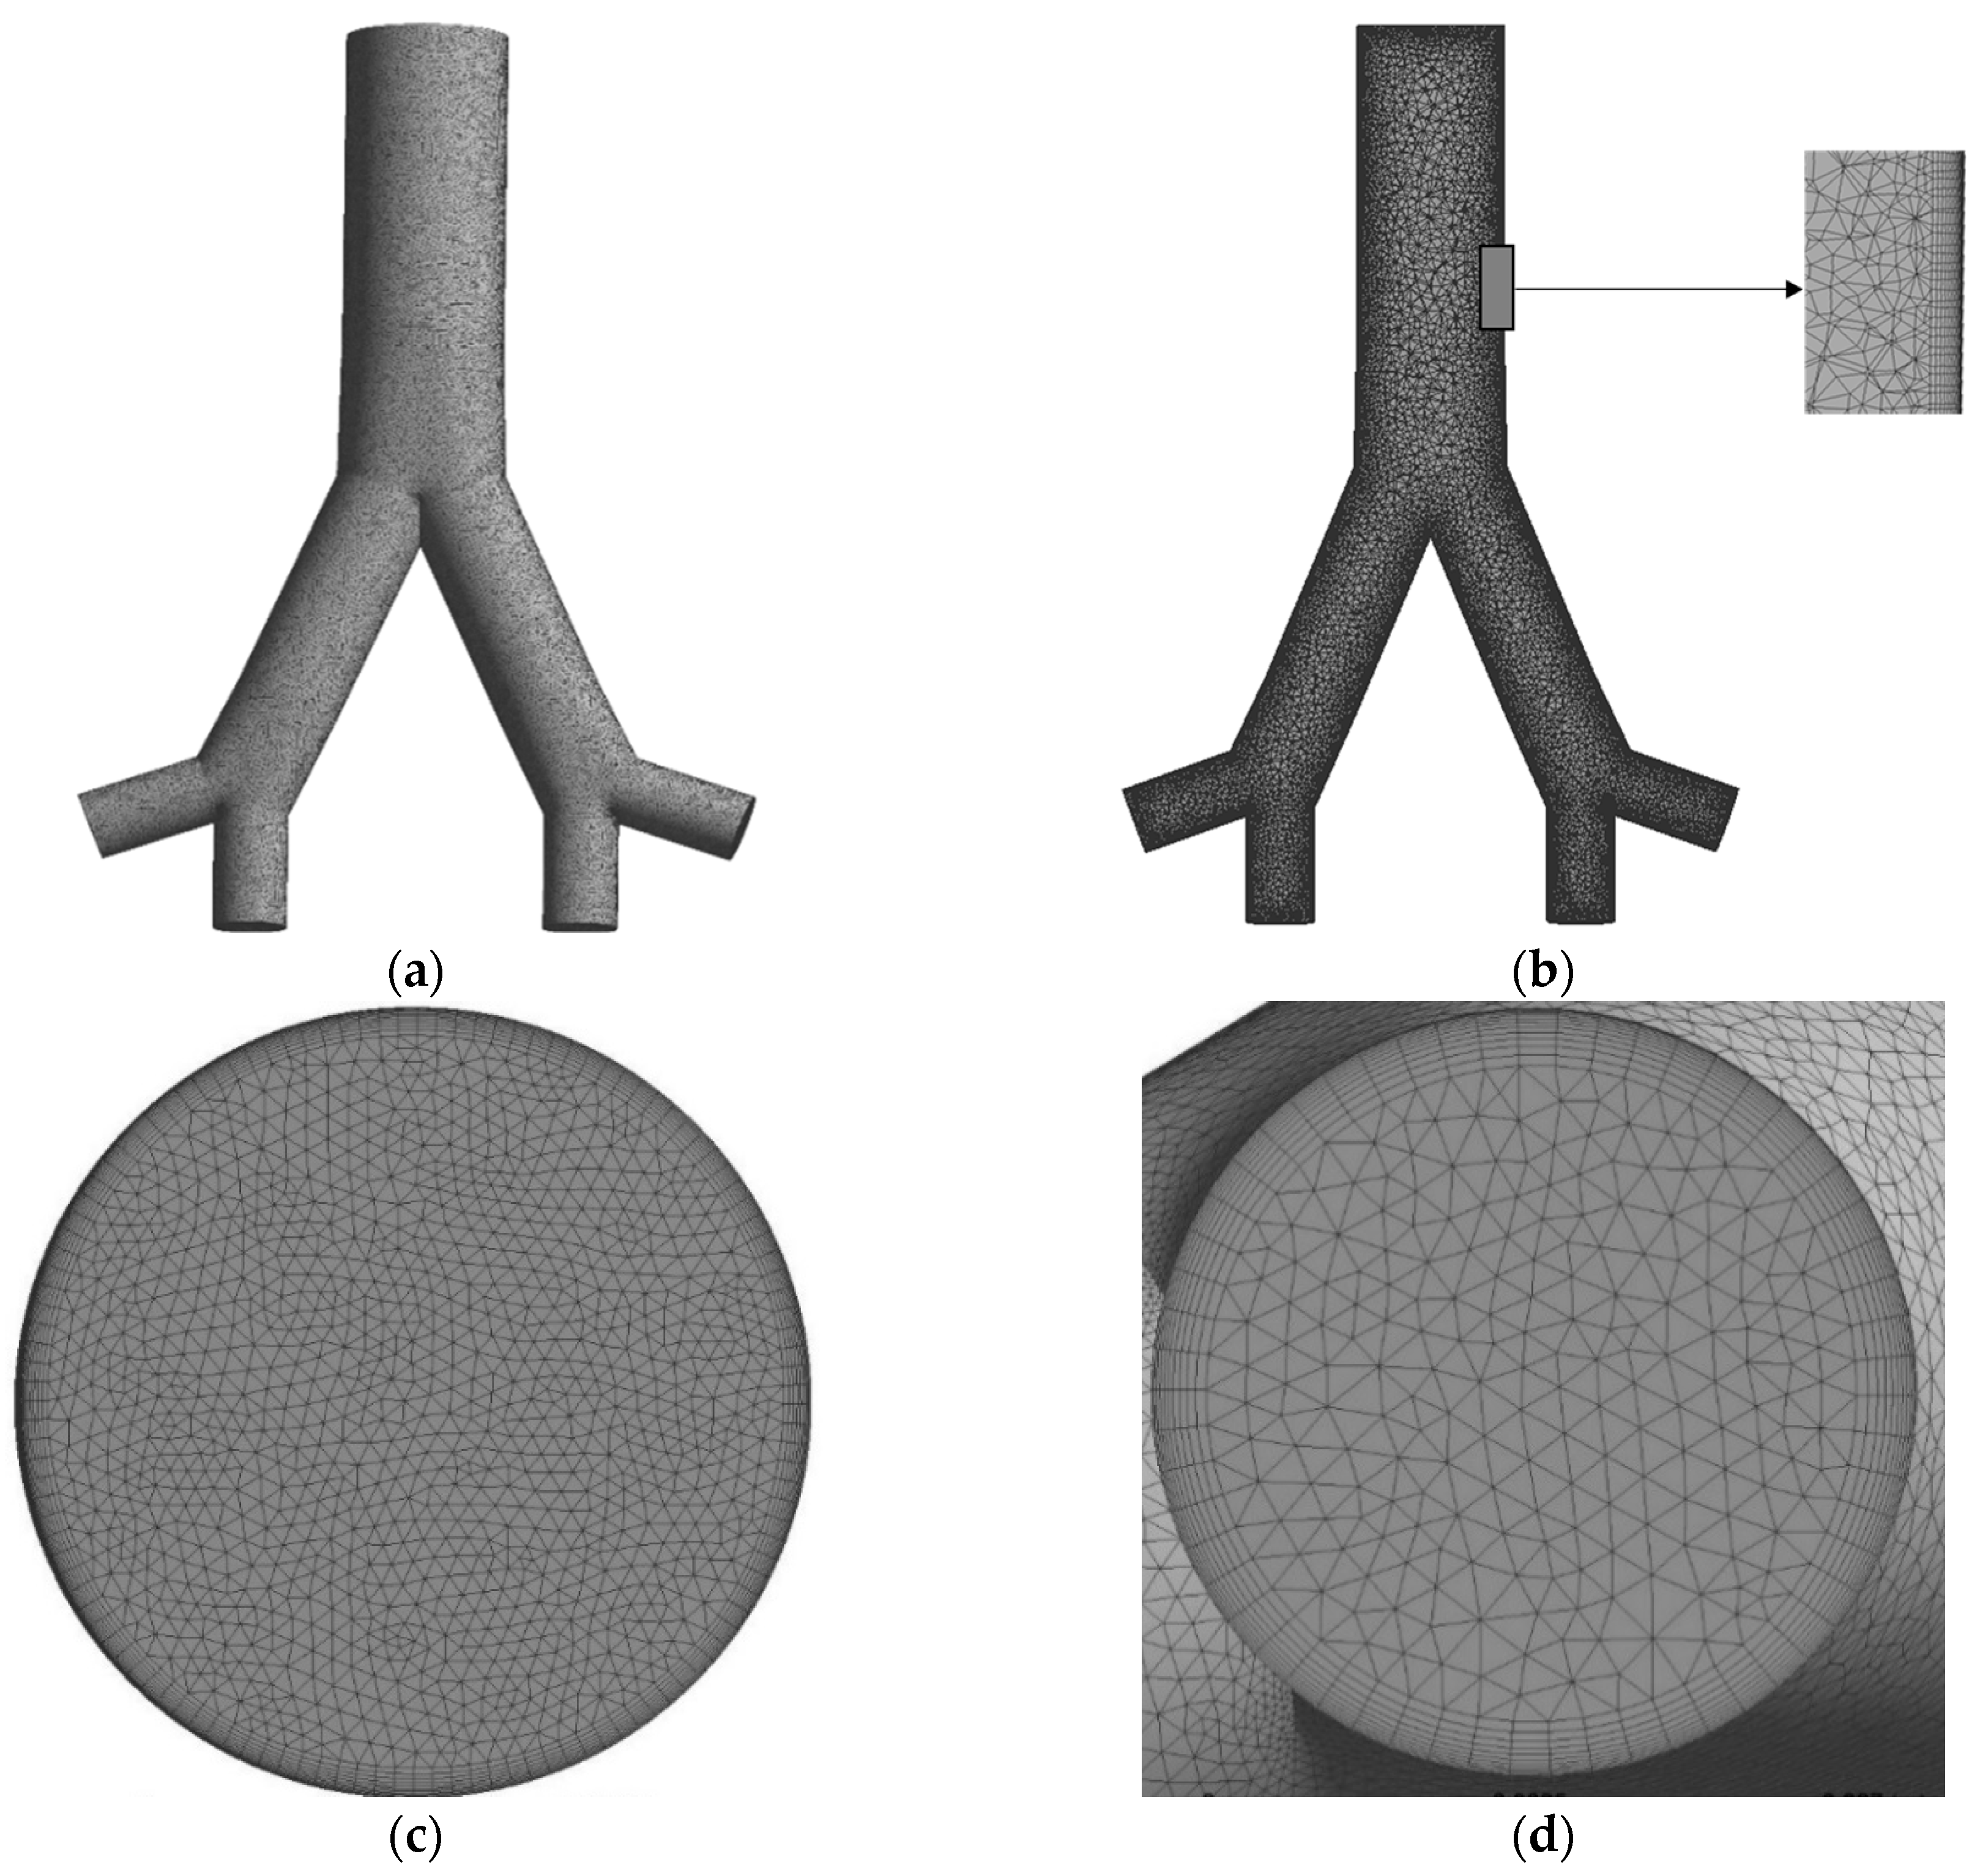
The two-generation Weibel’s lung model is constructed to calculate the complex flow field in a human lung. This two-generation lung geometry contains 1.5 million elements and 0.54 million nodes. An inflation of 10 boundary layer mesh is constructed near the wall as seen in Figure 1.
4. Grid Independence Test
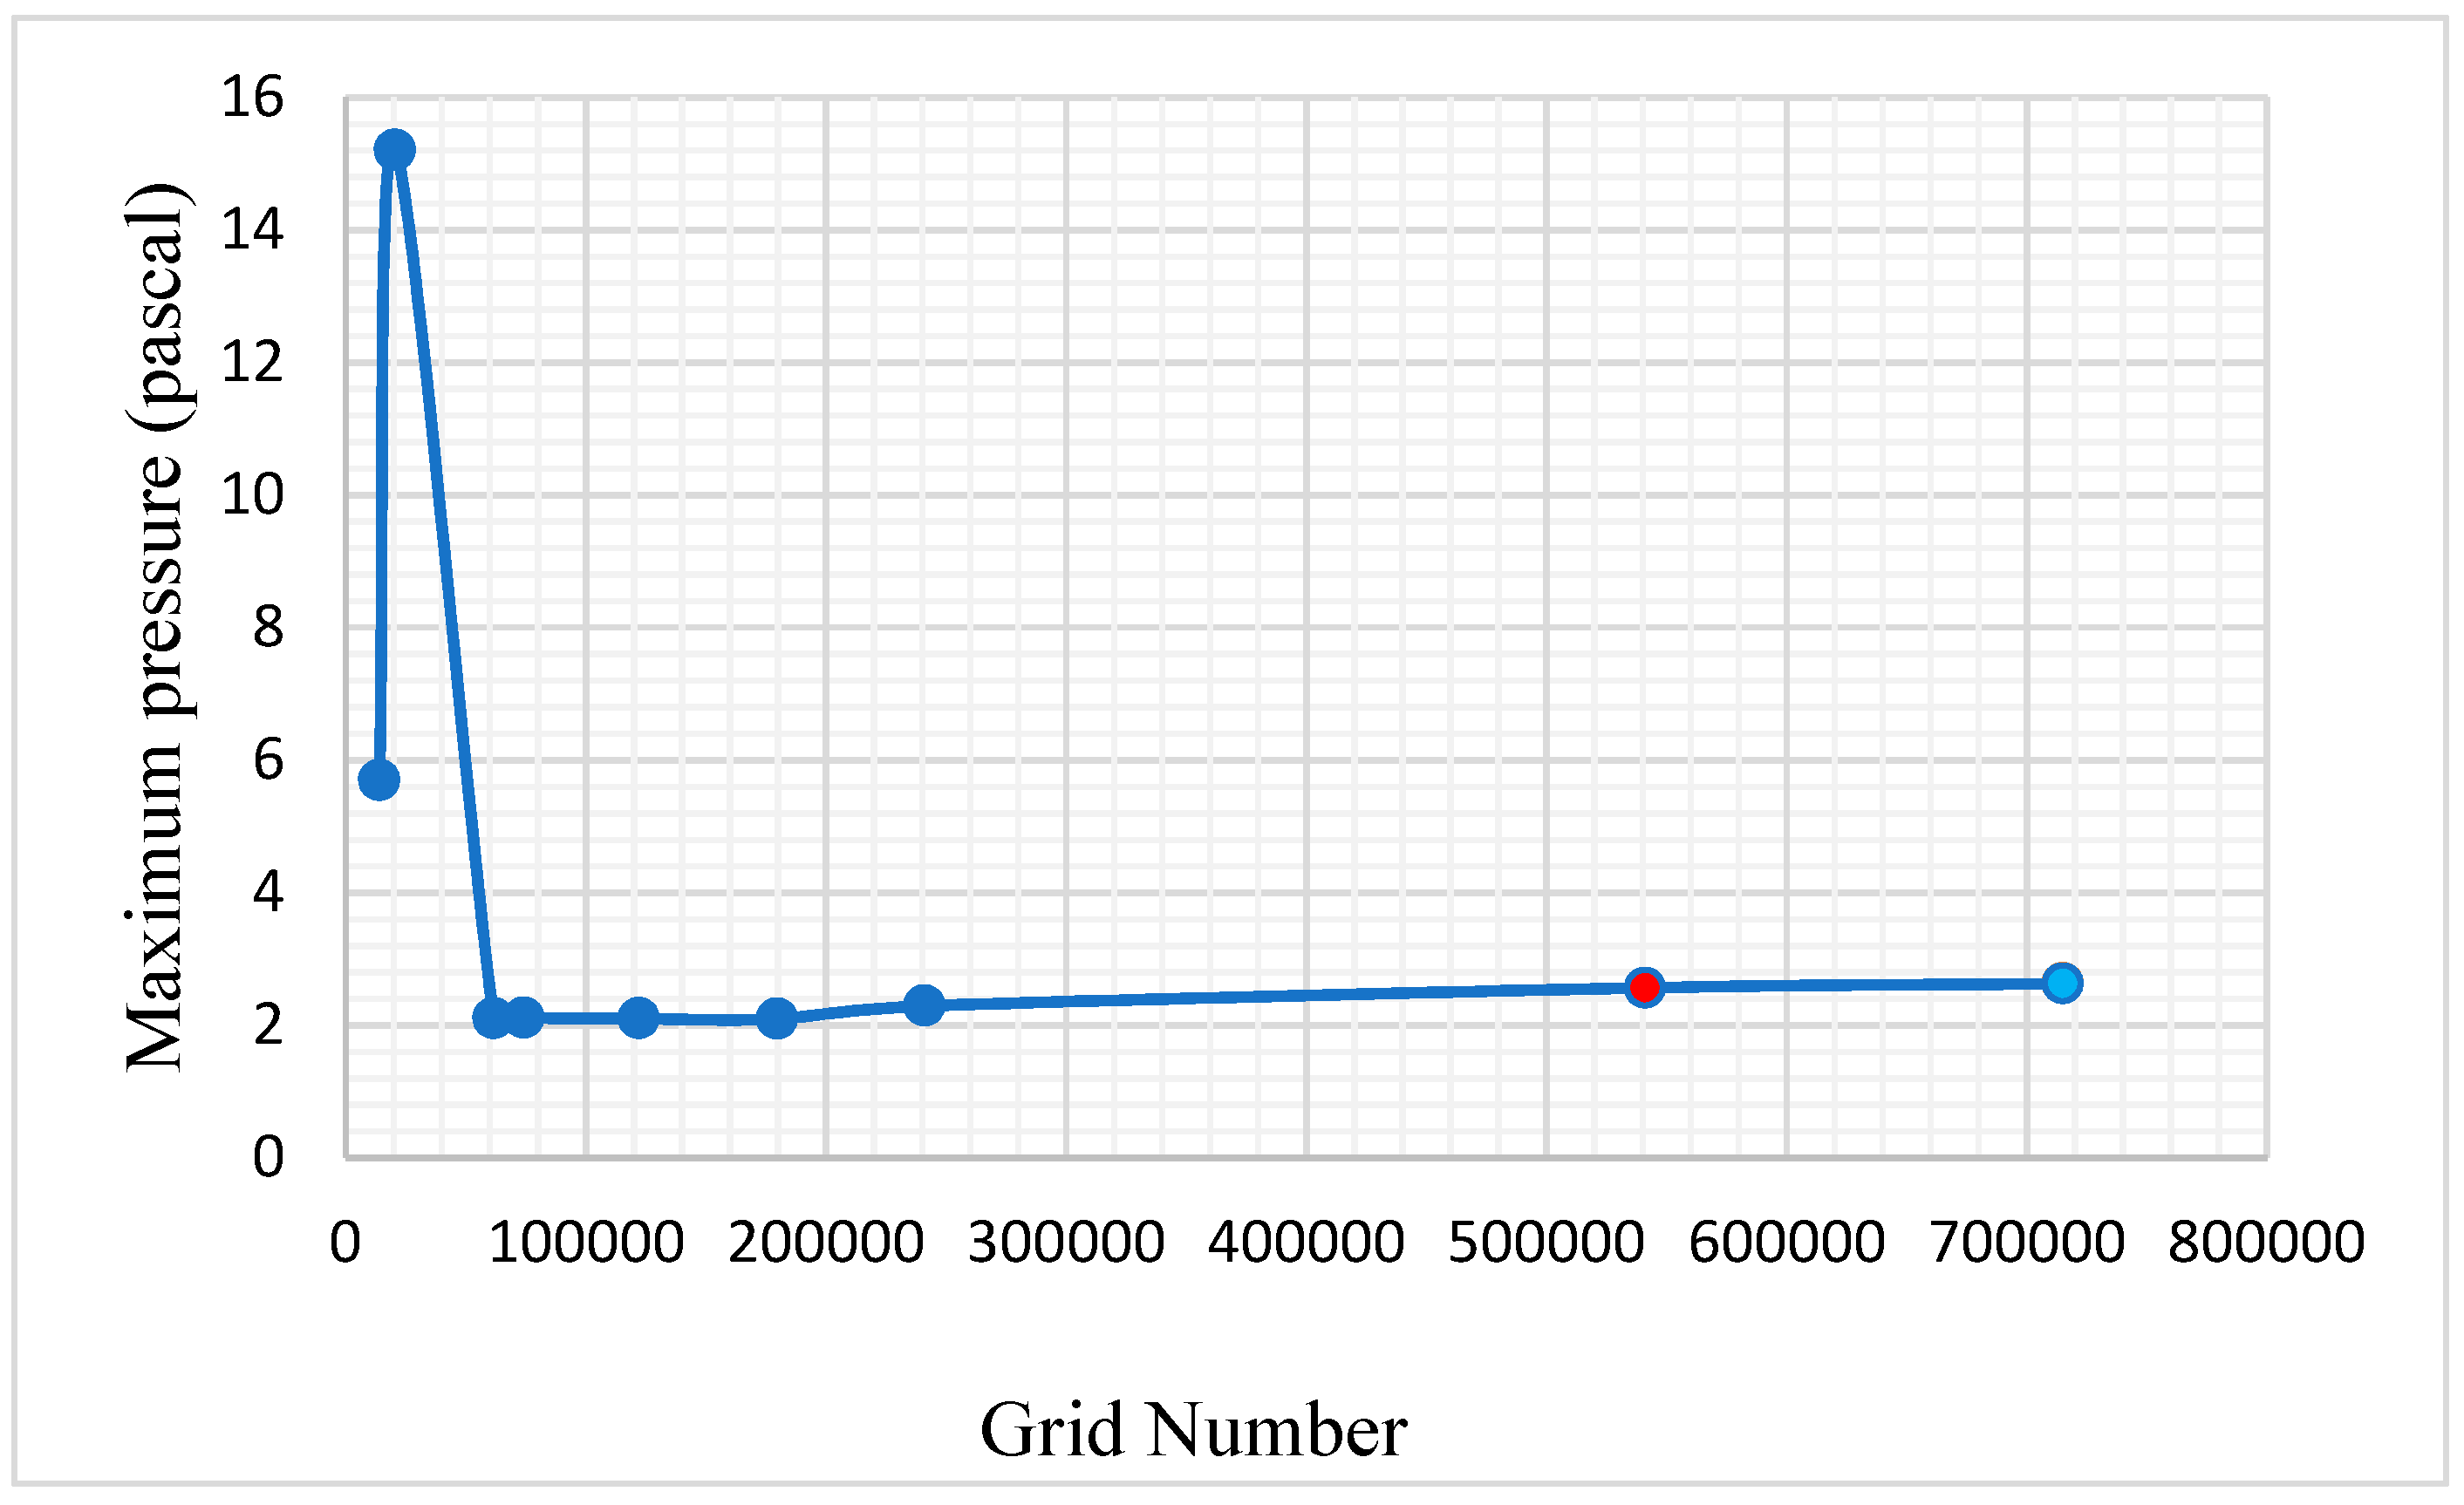
A grid resolution test is performed and an appropriate mesh is adopted for this study. The numerical model is tested for different grid numbers against maximum pressure, which is calculated on the outlet plane. As we can see in Figure 2, the result seems converged from the red point, it is conceivable to use any of the grid cells from this point. However, grid size of 0.54 million nodes is adopted for the present simulations.
5. Model Validation
A comprehensive validation has been performed for the present numerical study. The two-generation nano-particle simulation results have been compared with various published CFD and experimental results.
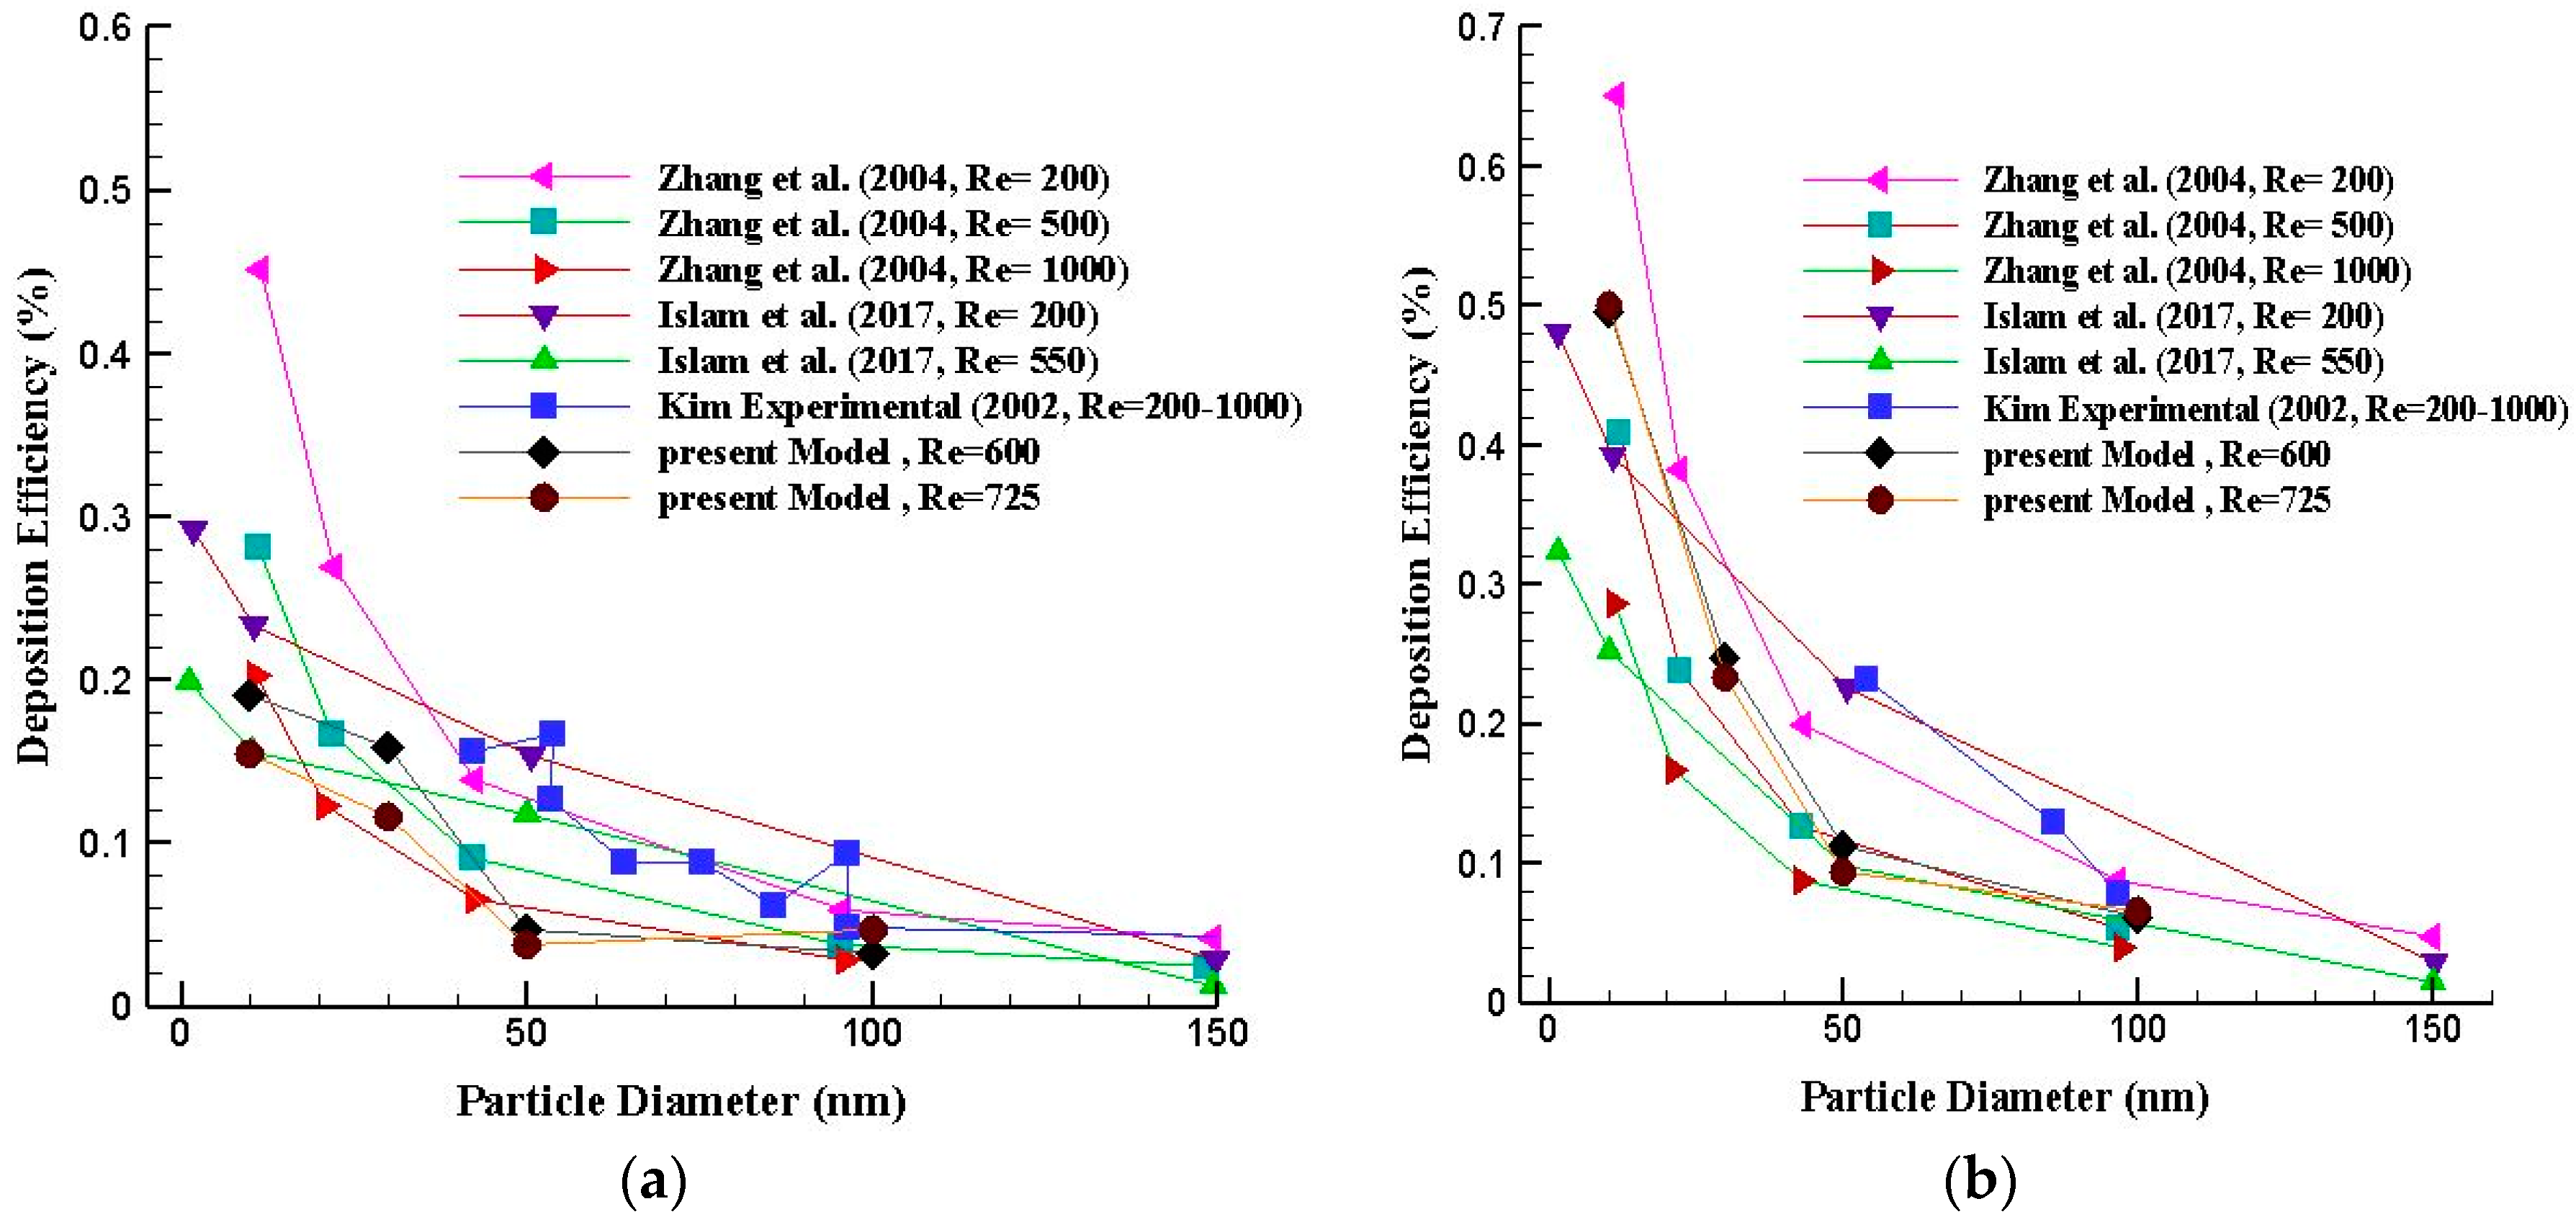
Figure 3 shows the nano-particles DE which is compared with experimental results of a double bifurcation model (G3-G5) conducted by Kim [35]. The results are validated for the first and second bifurcation of the present two-generation model. The current model have also been compared with the CFD result of Zhang and Kleinstreuer [14] for different inlet Reynolds number (Re = 200, 500 and 1000) [35] and Islam et al. for two different inlet Reynolds number (Re = 200, 550) [13]. Figure 3a shows comparison of nano-particles deposition for the first bifurcation and Figure 3b shows the deposition comparison for the second bifurcation. The present NPs DE shows good agreement with both experimental and CFD data published in the literature for both bifurcations.
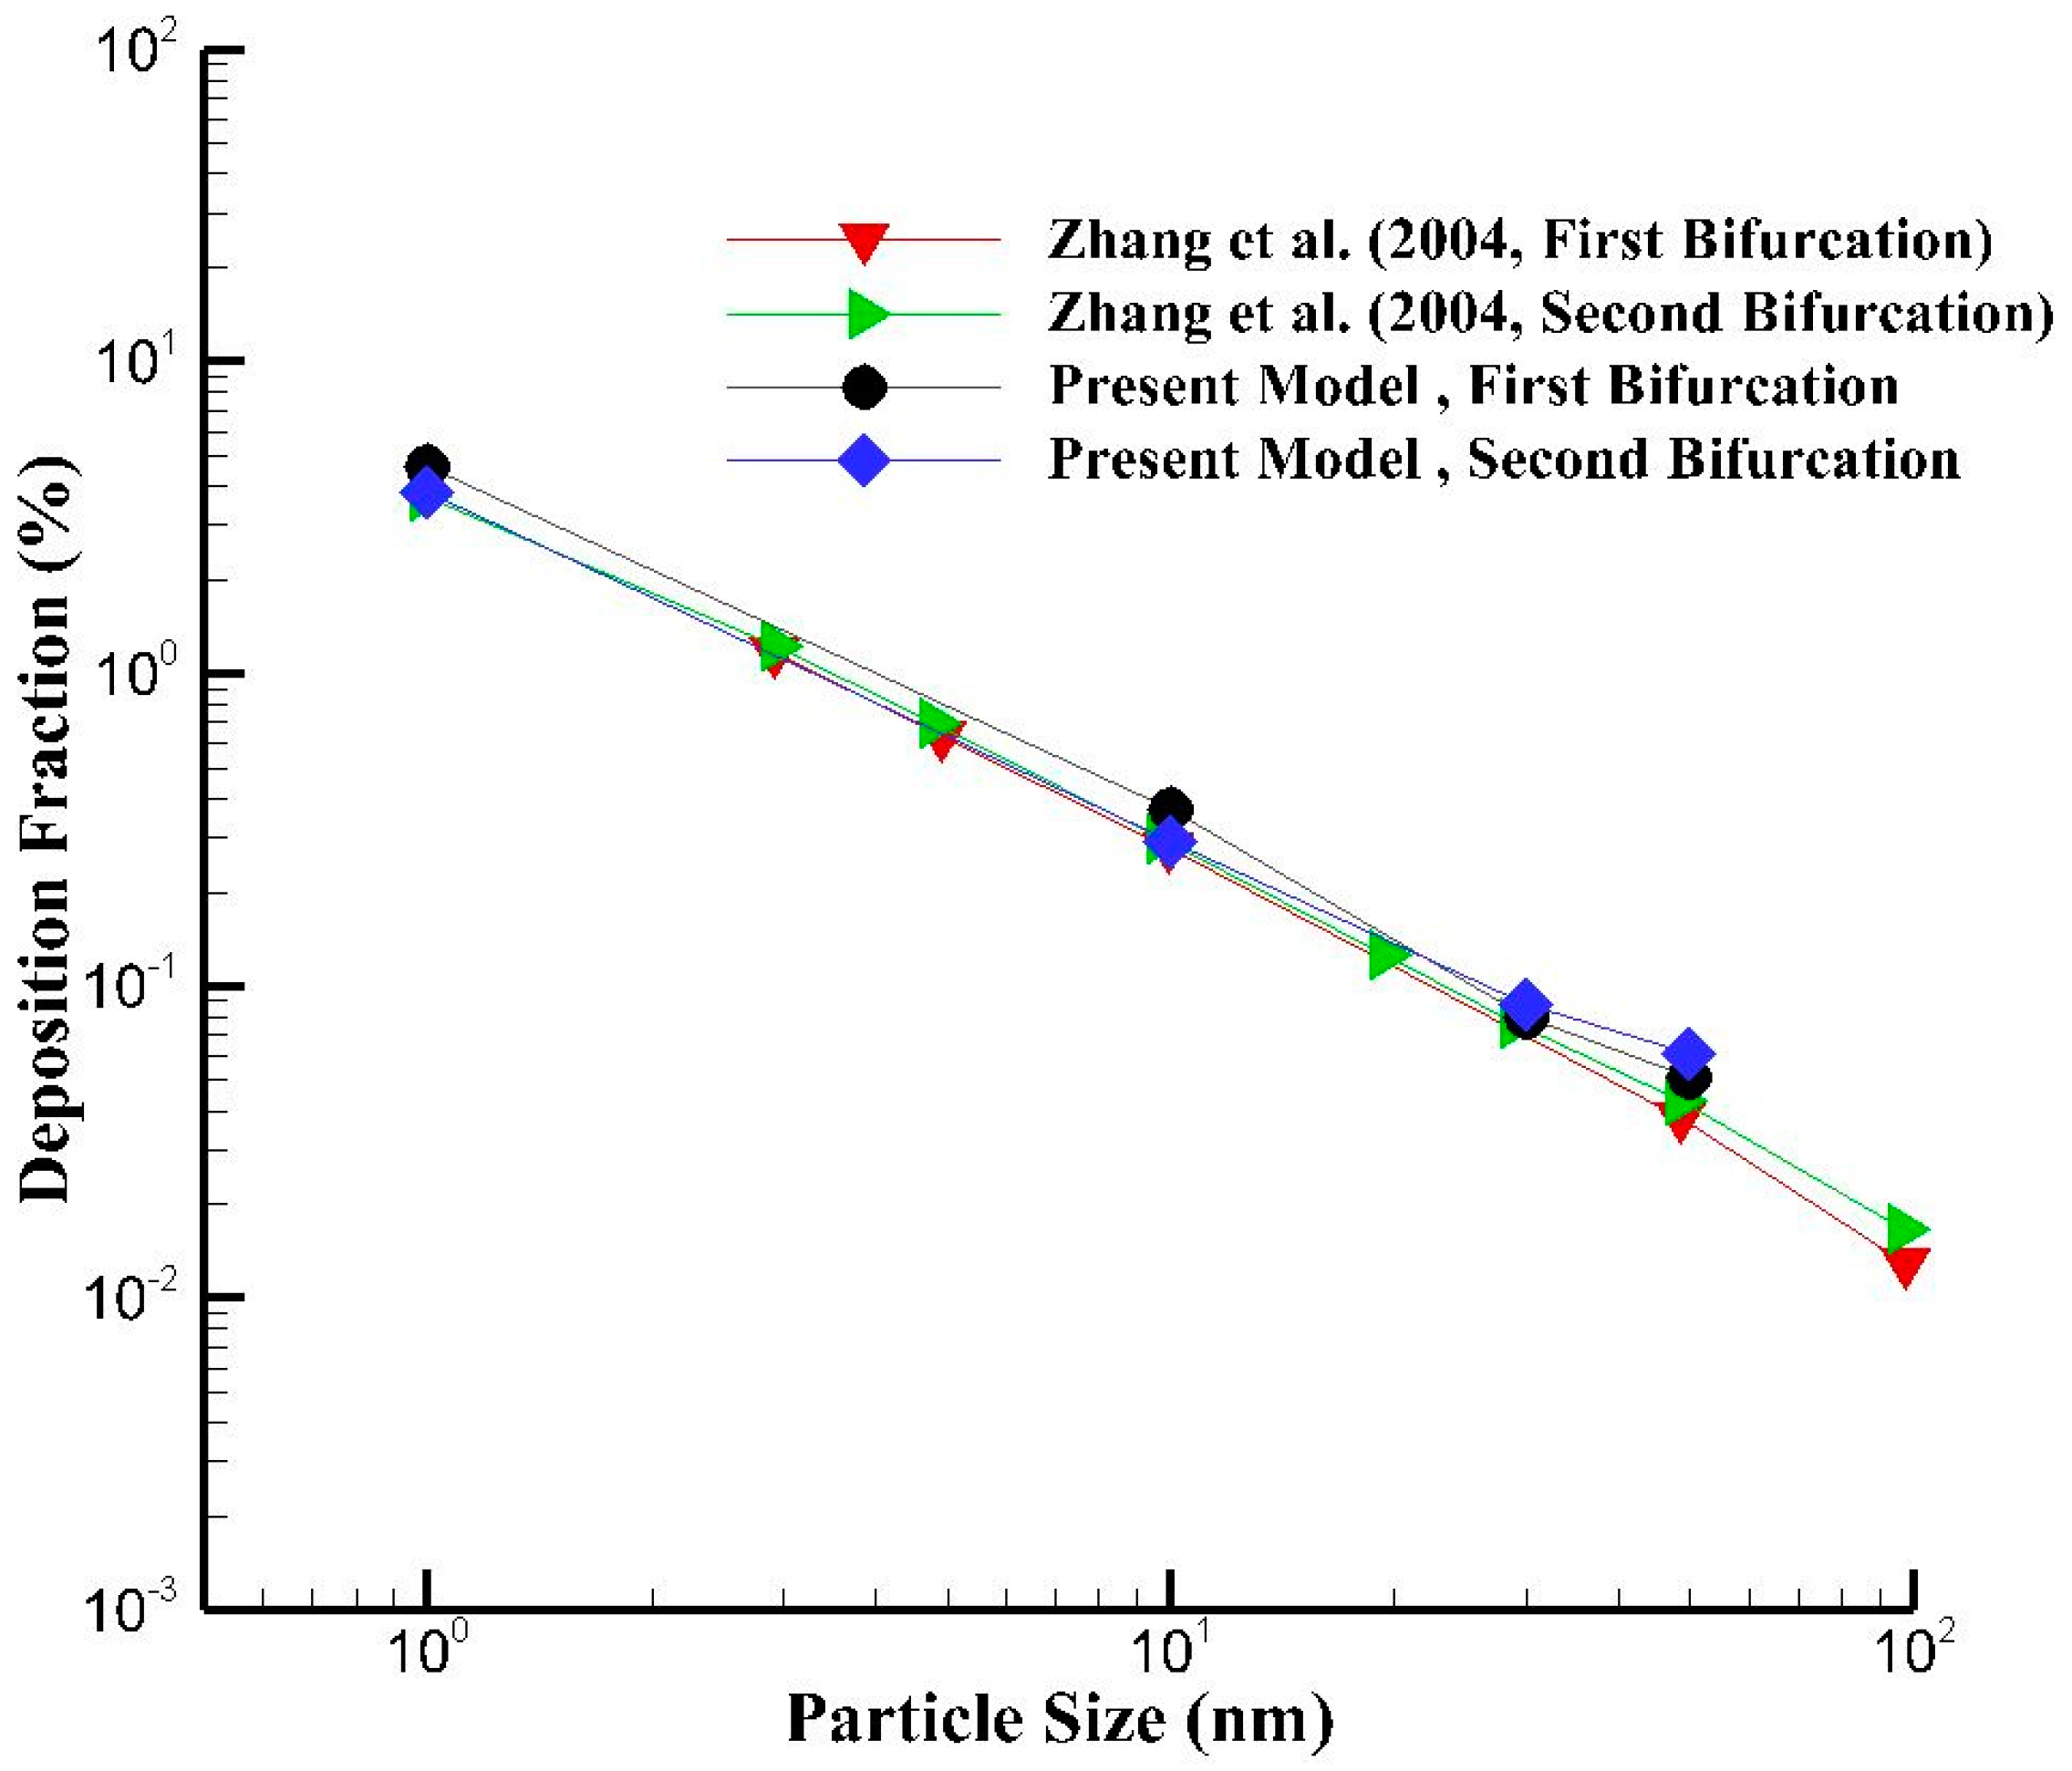
Figure 4 shows the comparison of nano-particles DF with CFD results of a double bifurcation model of Zhang and Kleinstreuer [14]. The results are validated for 30 lpm flow rate. It is found that the present CFD results of DF overlap for both bifurcation with the published results, which confirms the validity of numerical model.
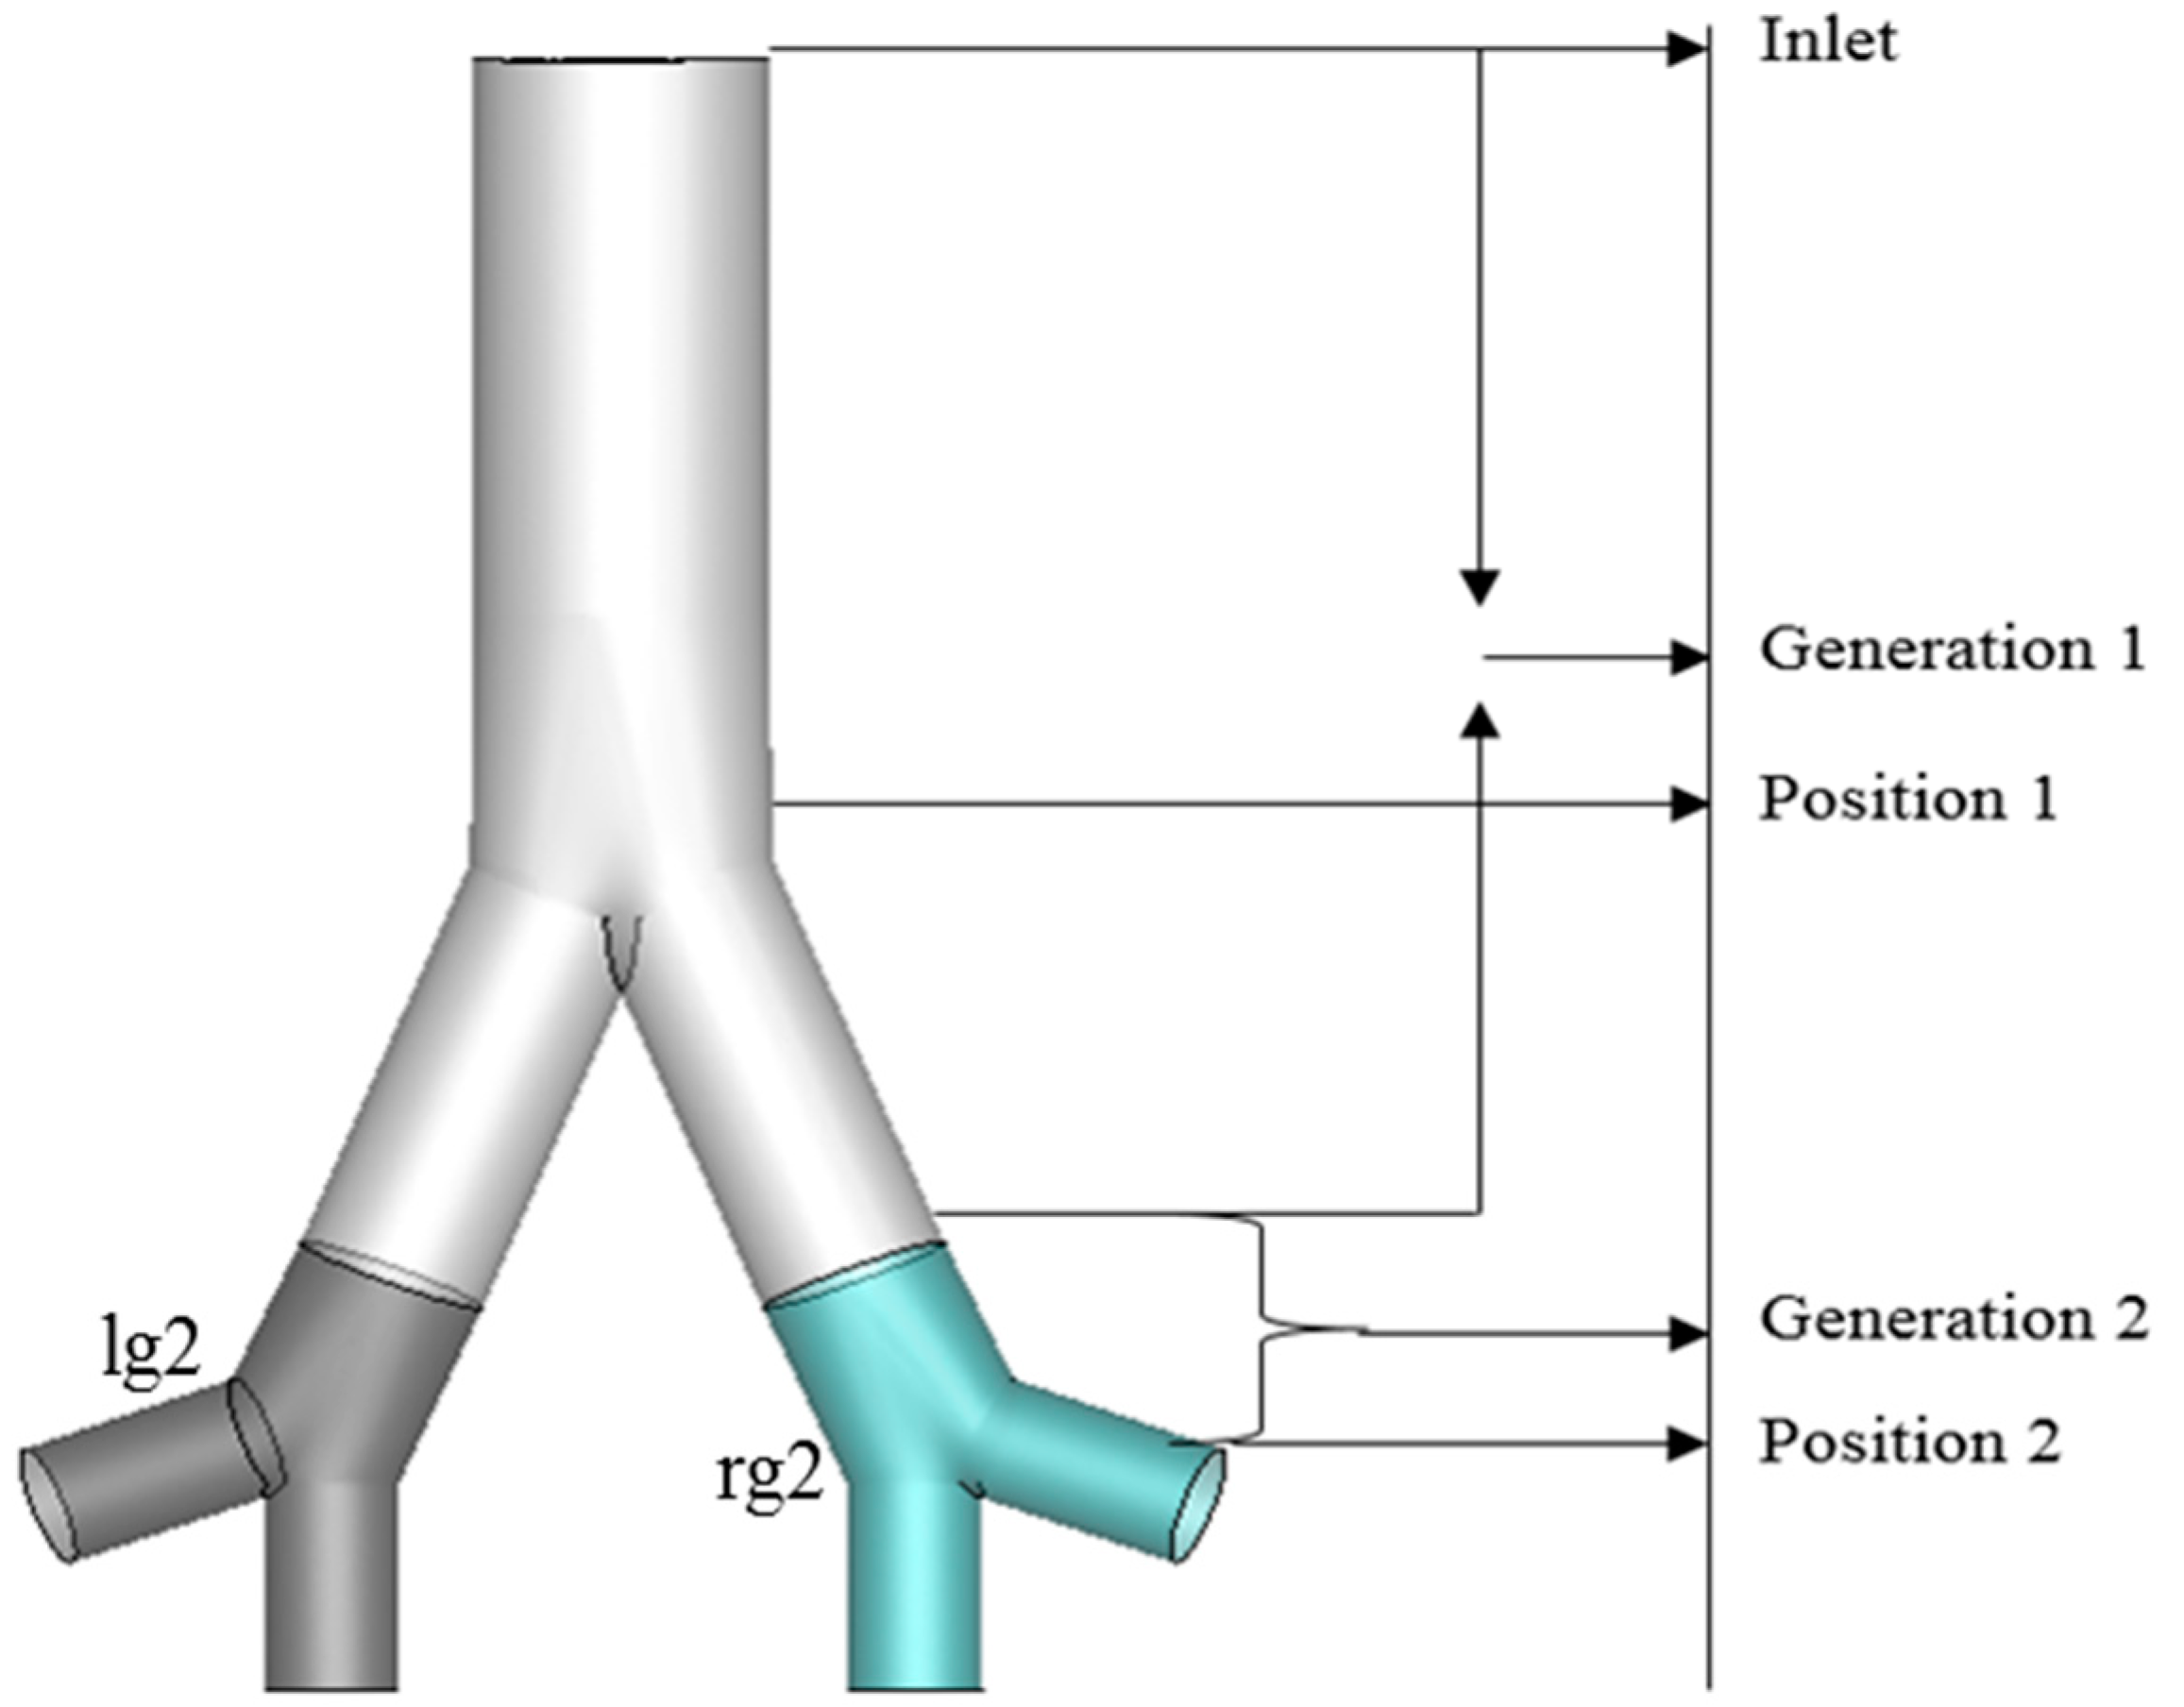
The model specification and the external magnetic source position have been labelled in Figure 5. Position 1 and Position 2 indicate the external magnetic field source. Magnet Position 1 has been set just before the first bifurcation and Position 2 has been set on the right lung, as shown in Figure 5.
6. Results and Discussion
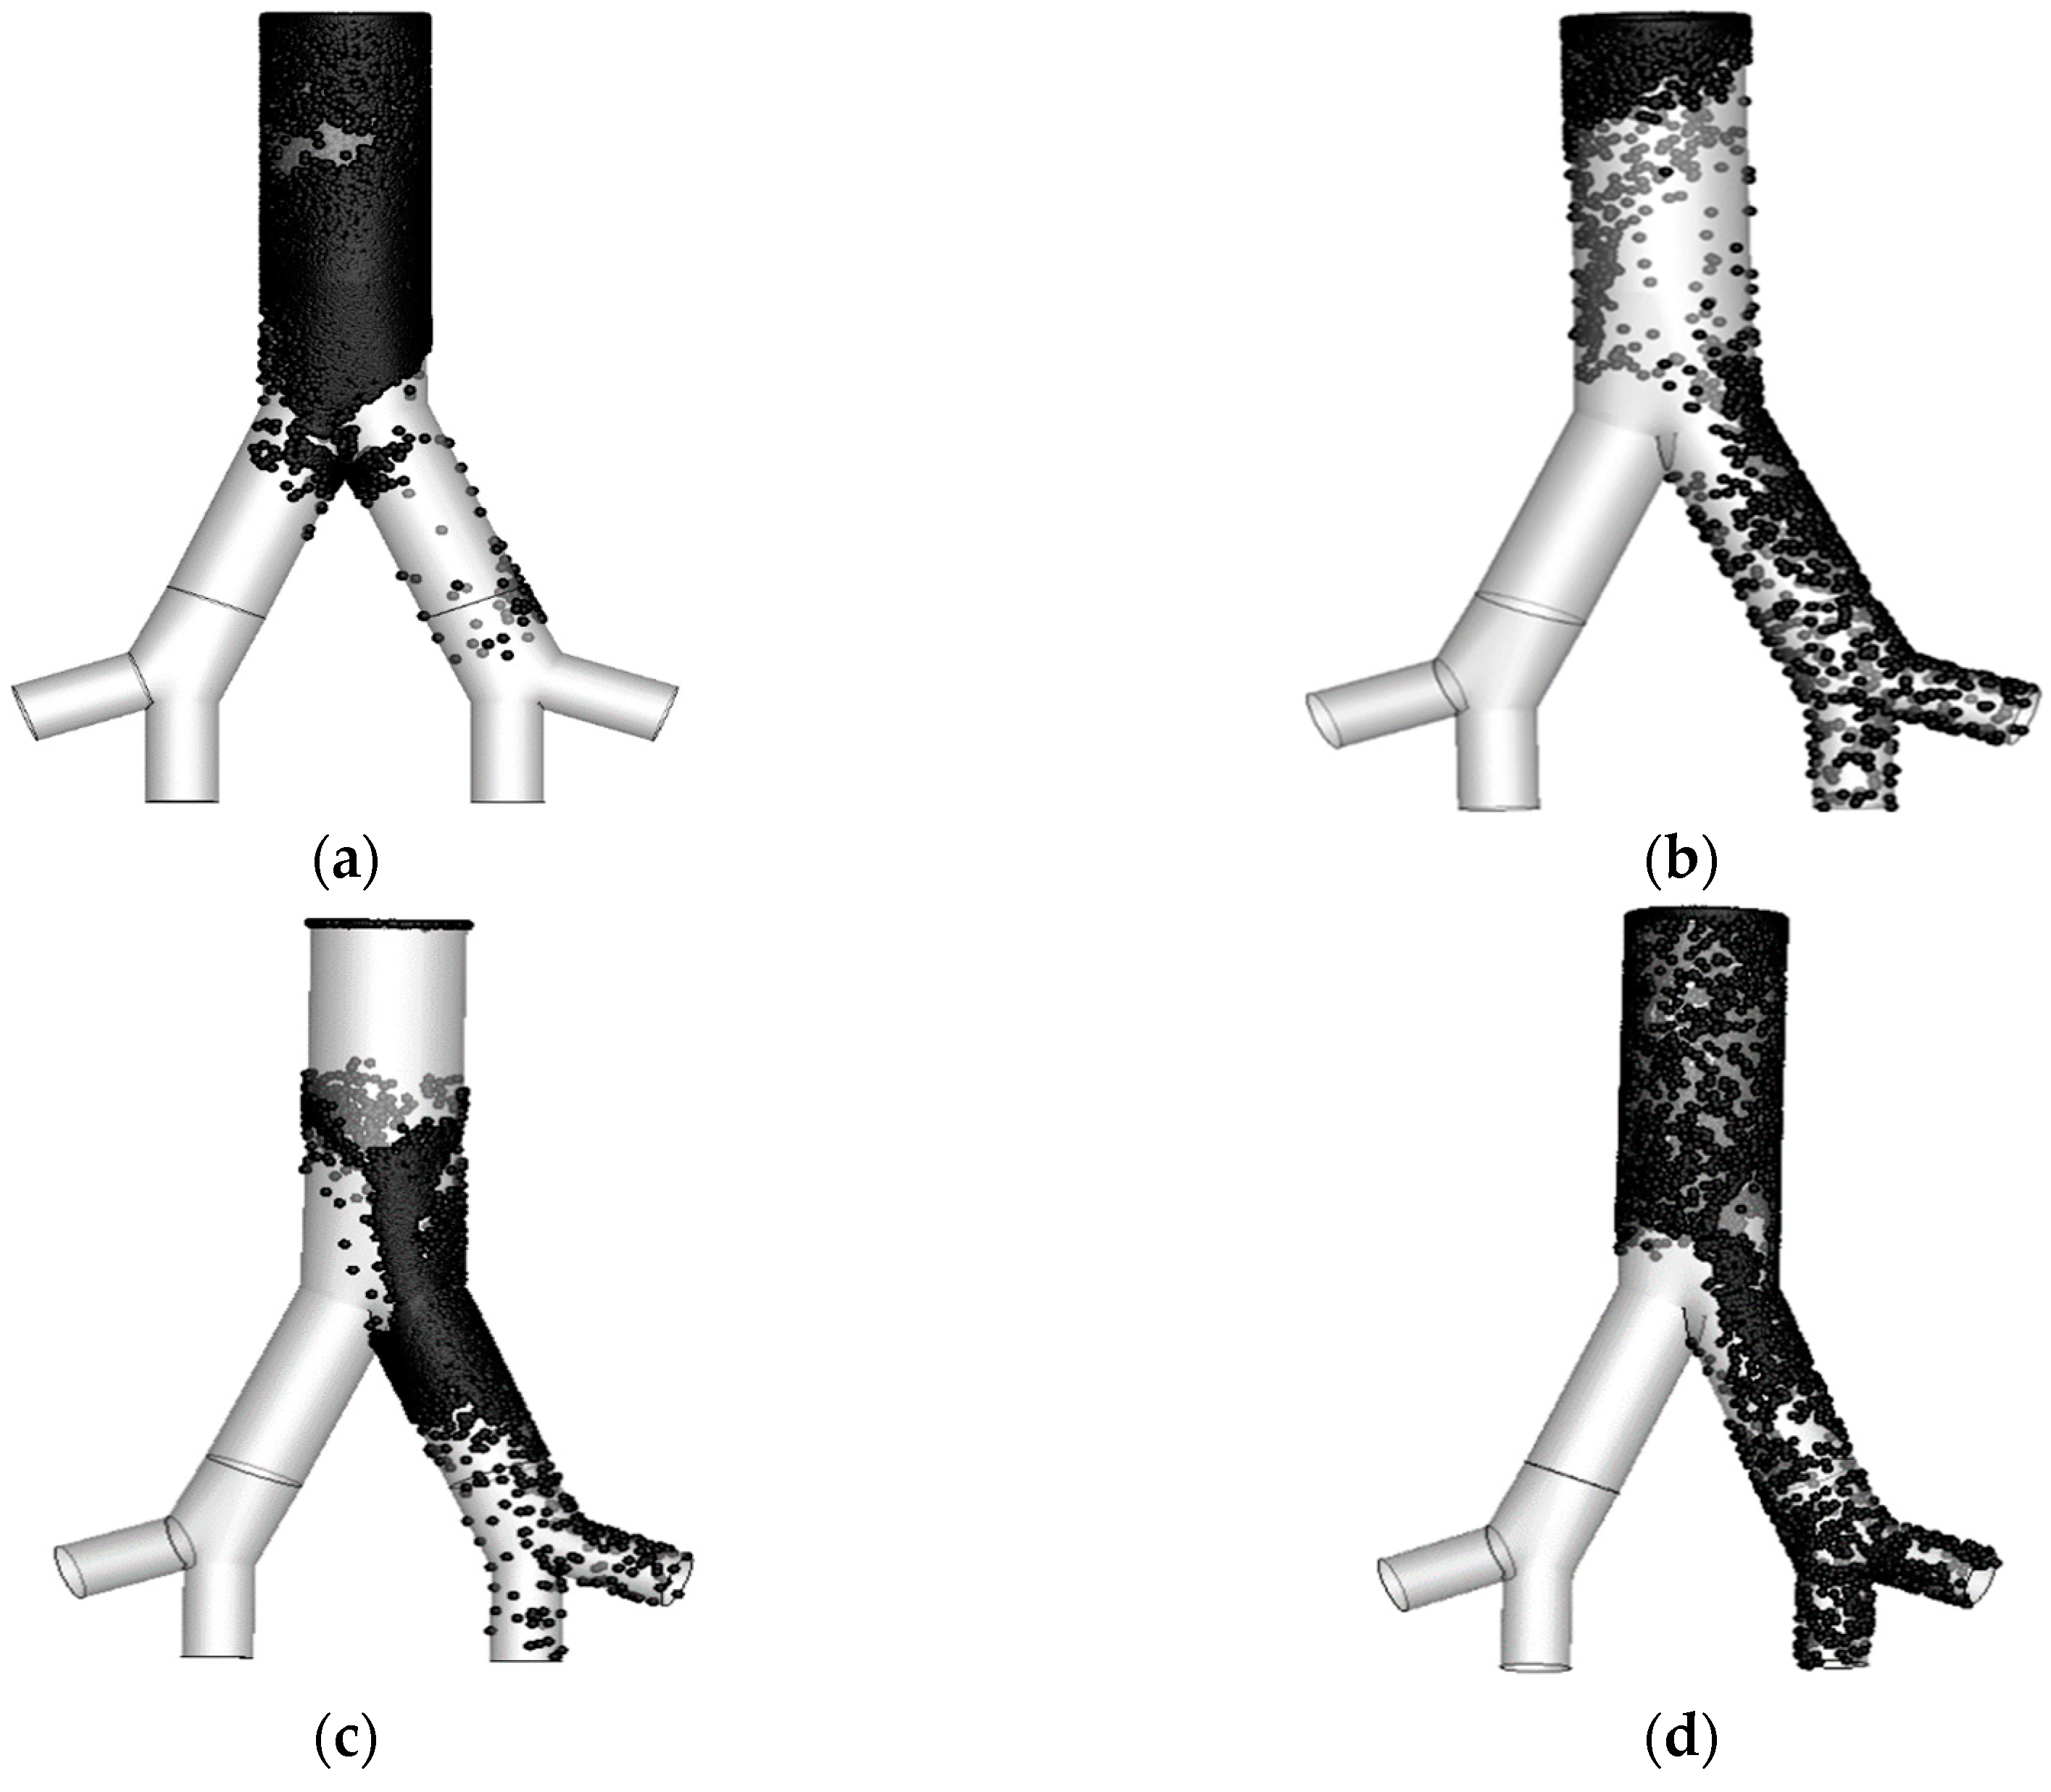
The present two-generation lung airway model has been designed to calculate the NPs deposition in the targeted position of the lung. Figure 6 shows the particle TD for three different flow rates which correspond to sleeping (7.5 lpm), resting (9 lpm) and slow walking (15 lpm) conditions with 1-nm particle diameter and Mn = 2.5.
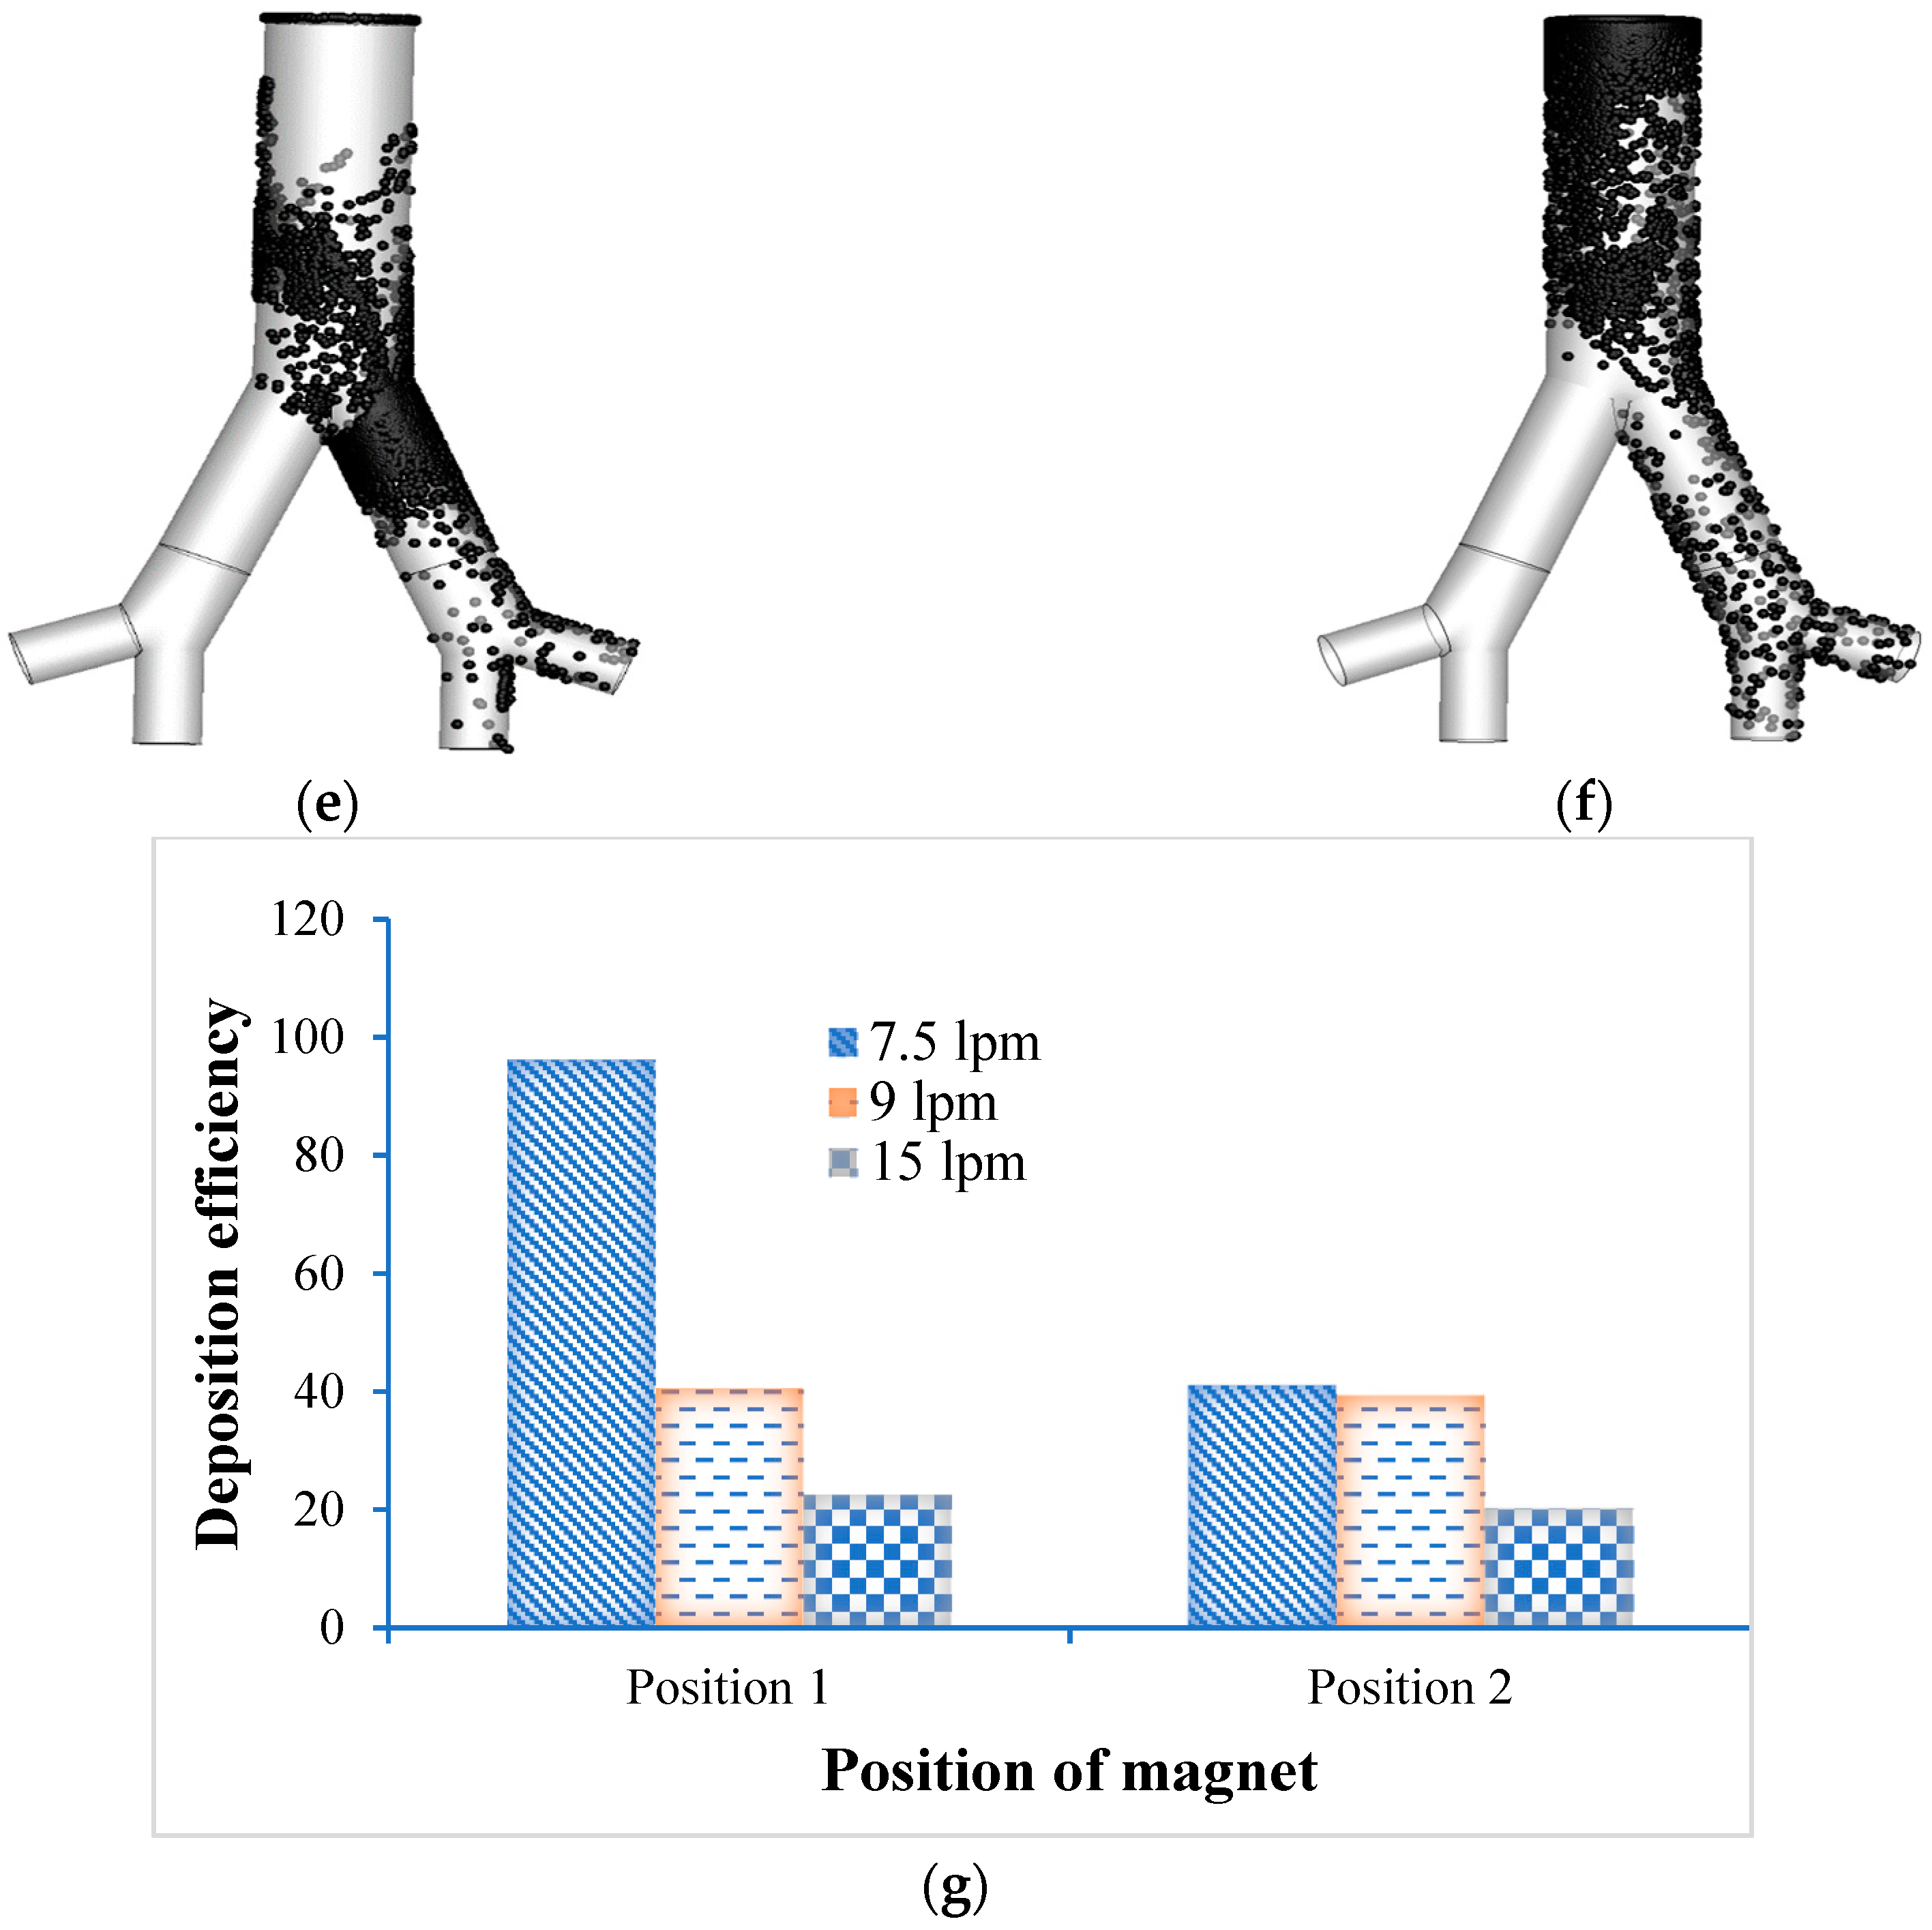
Figure 6a,b represents the particle deposition for 7.5 lpm flow rate with magnetic field acting on Position 1 and Position 2 respectively. At sleeping breathing condition (7.5 lpm), the deposition of NPs at the targeted Position 1 and Position 2 are significantly increased more than any other region of the lung. The total percentage of deposition for sleeping breathing condition, at Position 1 and Position 2 are 96.24 and 41.14, respectively. For 9 lpm flow rate, which represents the resting breathing condition, the total deposition percentage for Position 1 and Position 2 are 56.67 and 39.33 respectively (see Figure 6c,d). The total percentages of deposition during slow breathing condition (15 lpm flow rate) at Position 1 and Position 2, are 22.60 and 20.24 respectively, which are shown in Figure 6e, f. From the deposition scenario of 1-nm diameter particles, it is revealed that under the sleeping condition, a higher number of particles are deposited in Position 1 and Position 2 than any other breathing conditions considered in this study. Figure 6g shows the overall deposition efficiency for three different flow rates. The overall deposition pattern shows that the Brownian motion is more effective for smaller flow rates. The effect of Brownian motion is that it increases with the decrease of flow rates. The overall deposition pattern for different flow rates of 1-nm diameter particles satisfies the general assumption of Brownian motion and shows that depending on the lower flow rates, this Brownian motion is dominant in the upper airways. The DE scenario of MNPs, decreases with the increase of flow rates because of low residence time.
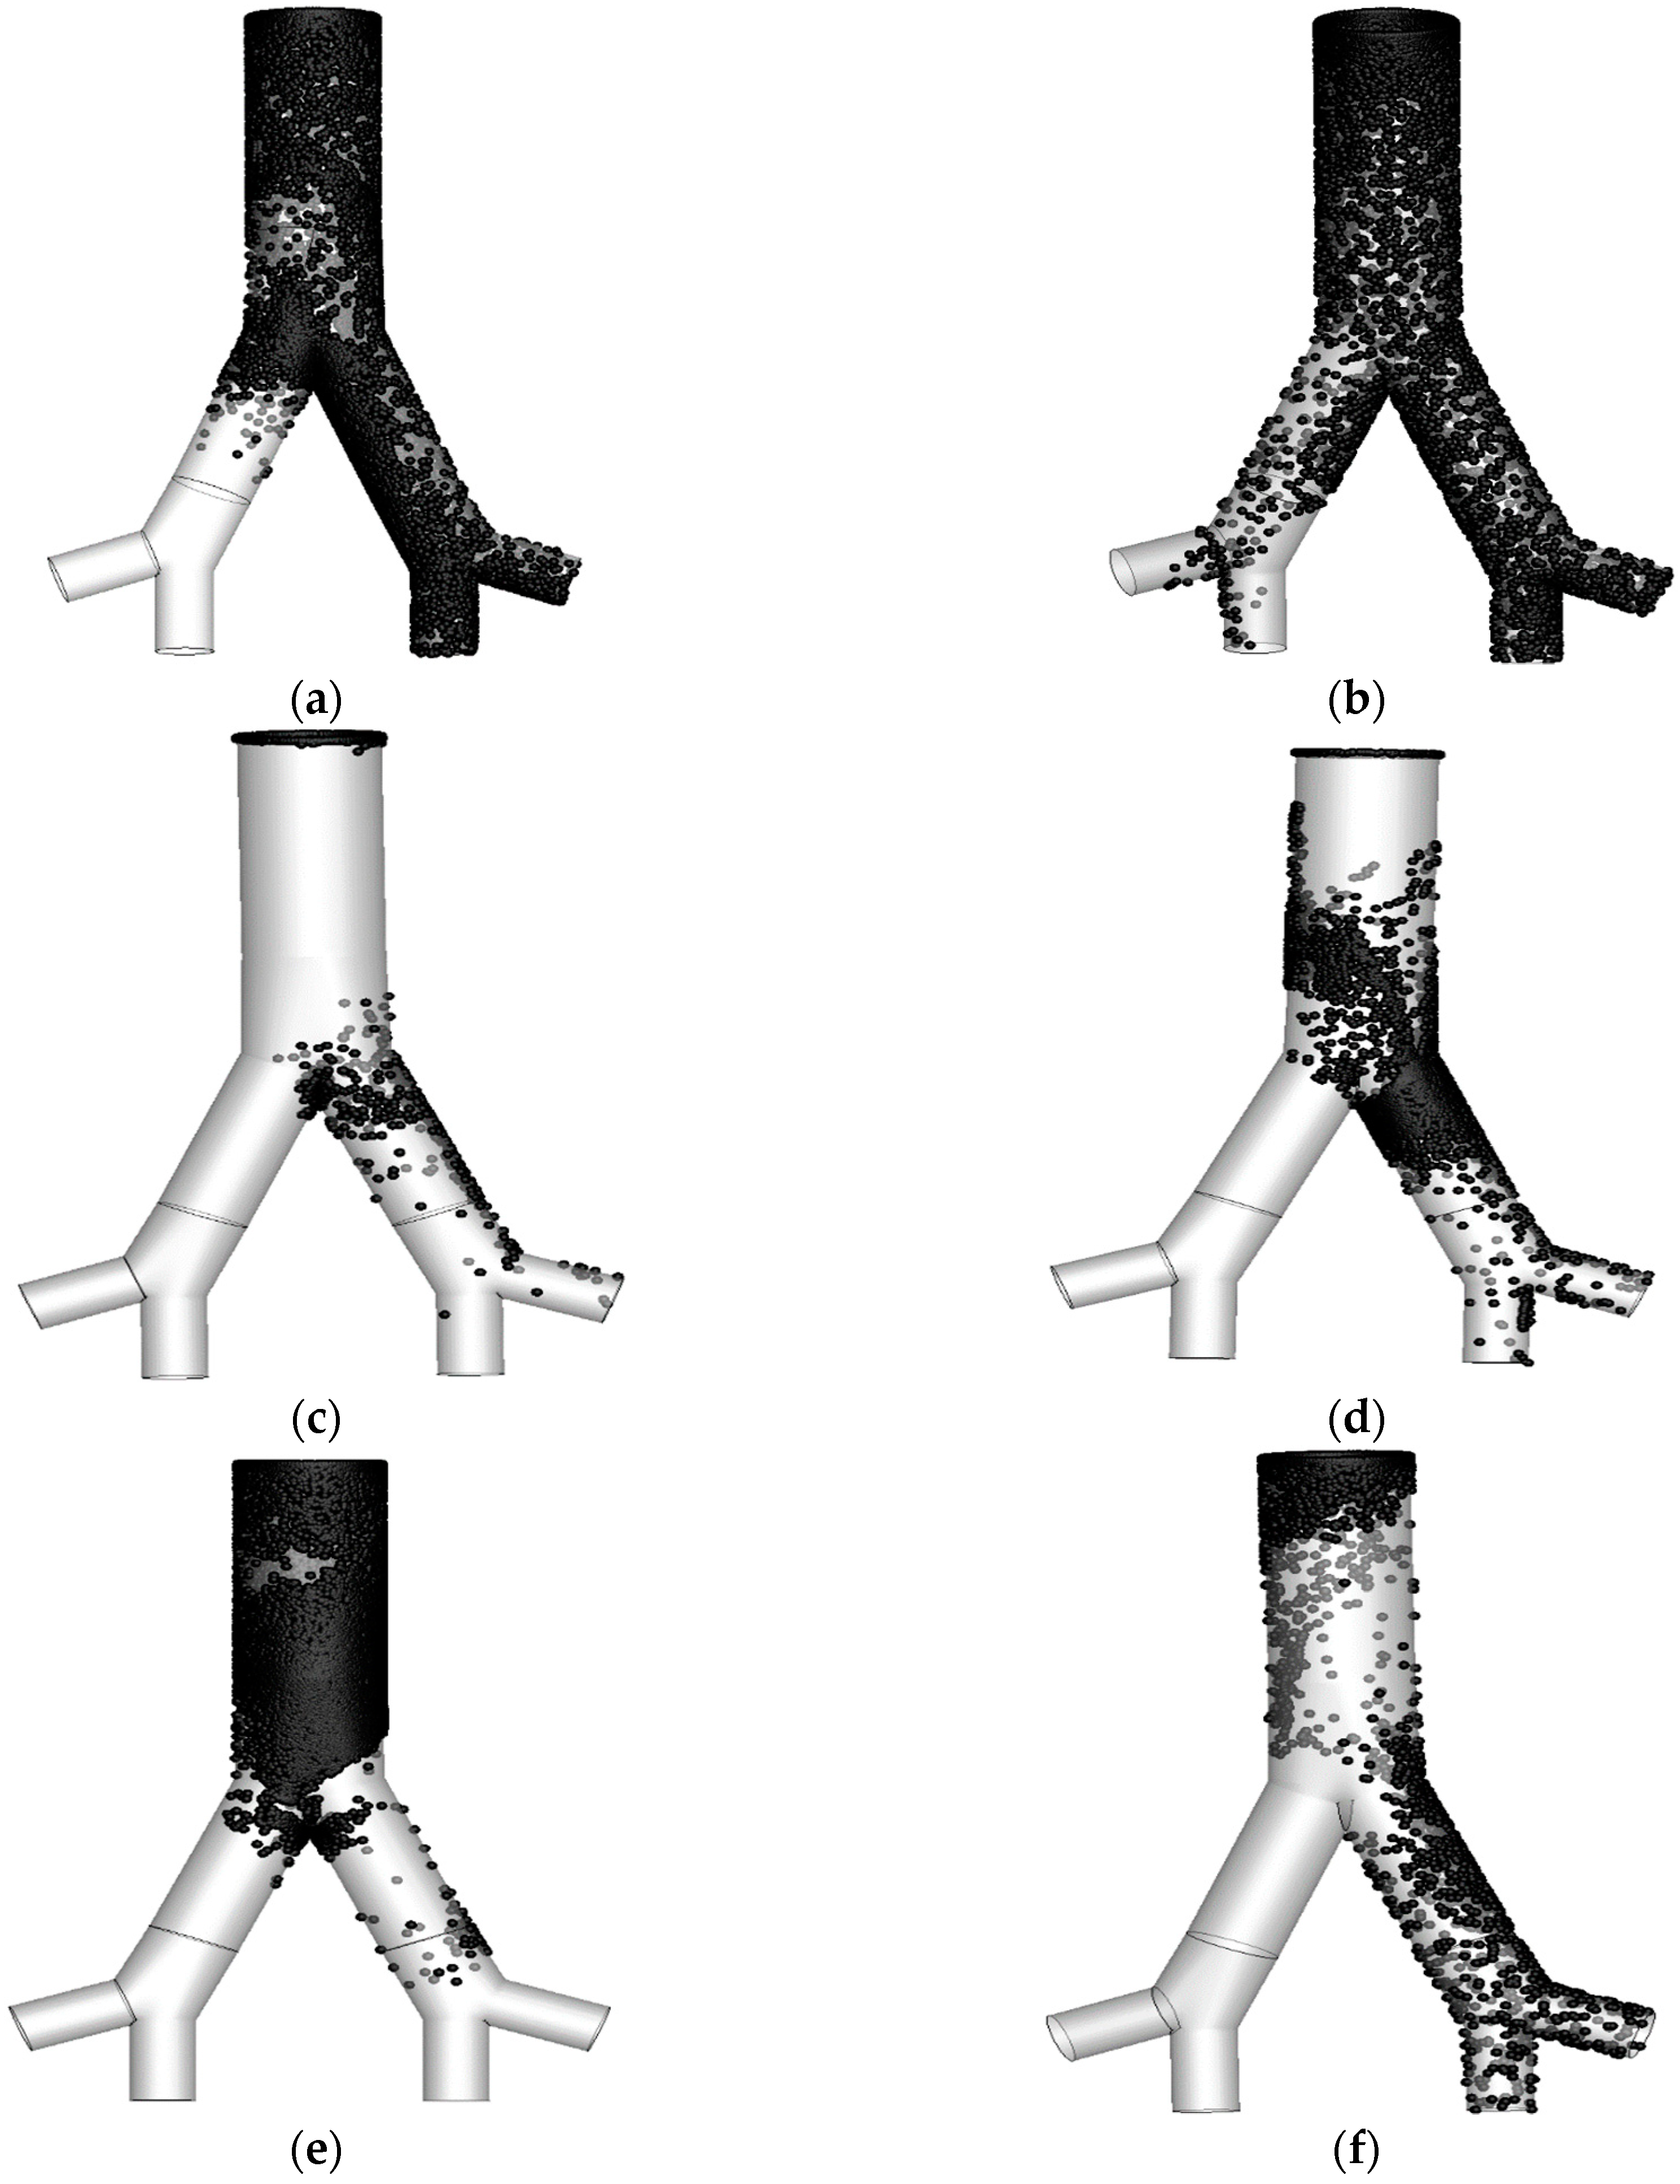
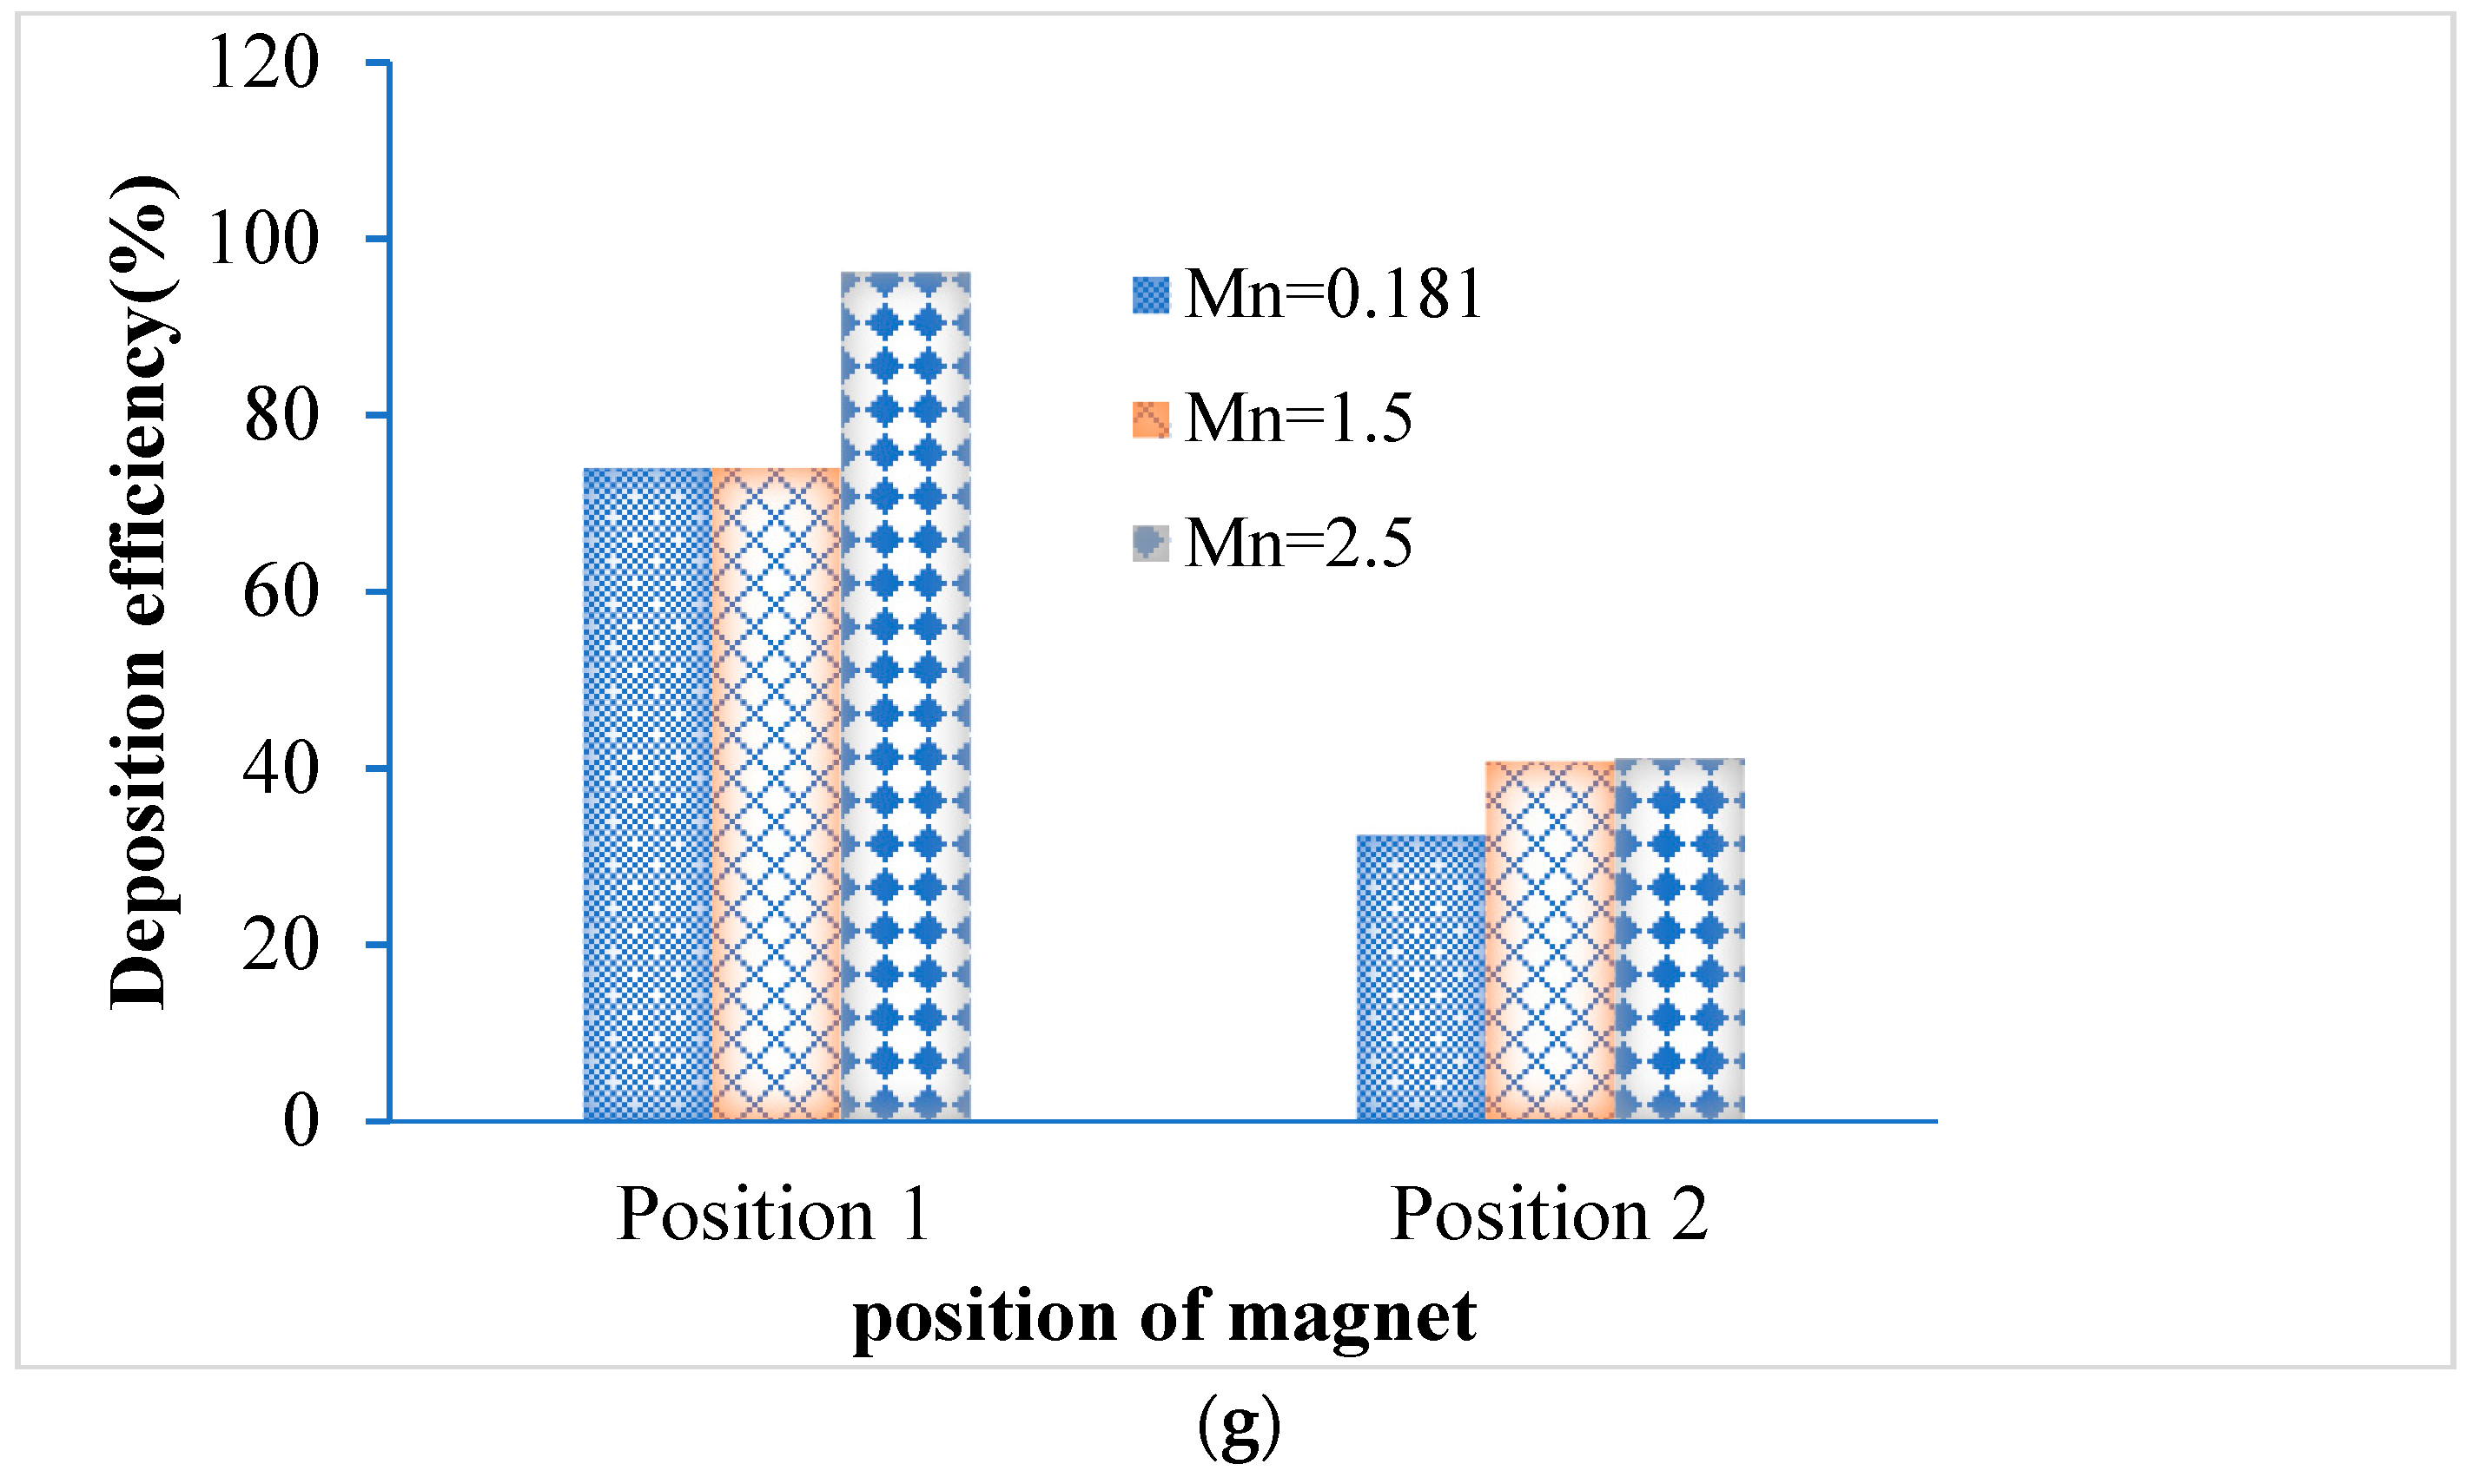
Figure 7 illustrates the effects of magnetic number (magnetic intensity) at Position 1 and Position 2 with 1nm particles and 7.5 lpm flow rate. Figure 7a,b shows the lung airways deposition scenario for magnetic number 0.181 at the targeted Position 1 and Position 2, respectively. The number of total deposition percentages for magnetic number 0.181, at the targeted Position 1 and Position 2 are 74.01 and 32.41, respectively. The deposited particles for magnetic number 1.5 are shown in Figure 7c,d. The overall percentage for magnetic number 1.5 at the targeted Position 1 and Position 2 are 74.05 and 40.72, respectively. Figure 7e,f shows the particle deposition at targeted Position 1 and Position 2 for magnetic number 2.5. The overall deposition percentages for magnetic number 2.5, at the targeted Position 1 and Position 2 are 96.24 and 41.14, respectively. It is estimated that increasing the magnetic number deliberately enhances the deposition on the targeted position [26]. From the deposition scenario of 1-nm diameter particle we found that, under the effect of magnetic number 2.5 and the flow rate of 7.5 lpm, a higher number of particles are deposited in Position 1 and Position 2 compare to other magnetic numbers. Figure 7g shows the overall deposition efficiency at the targeted Position 1 and Position 2 for three different magnetic numbers. We found that the larger magnetic number can play an important role in particulate deposition on the targeted region of the lung. The DE of MNPs is estimated to be enhanced with the increase of the magnetic number [26]. According to the above MNPs’ deposition scenario, the deposition value at the targeted region (right lung) is substantially greater than that at the other region of lung (left lung).
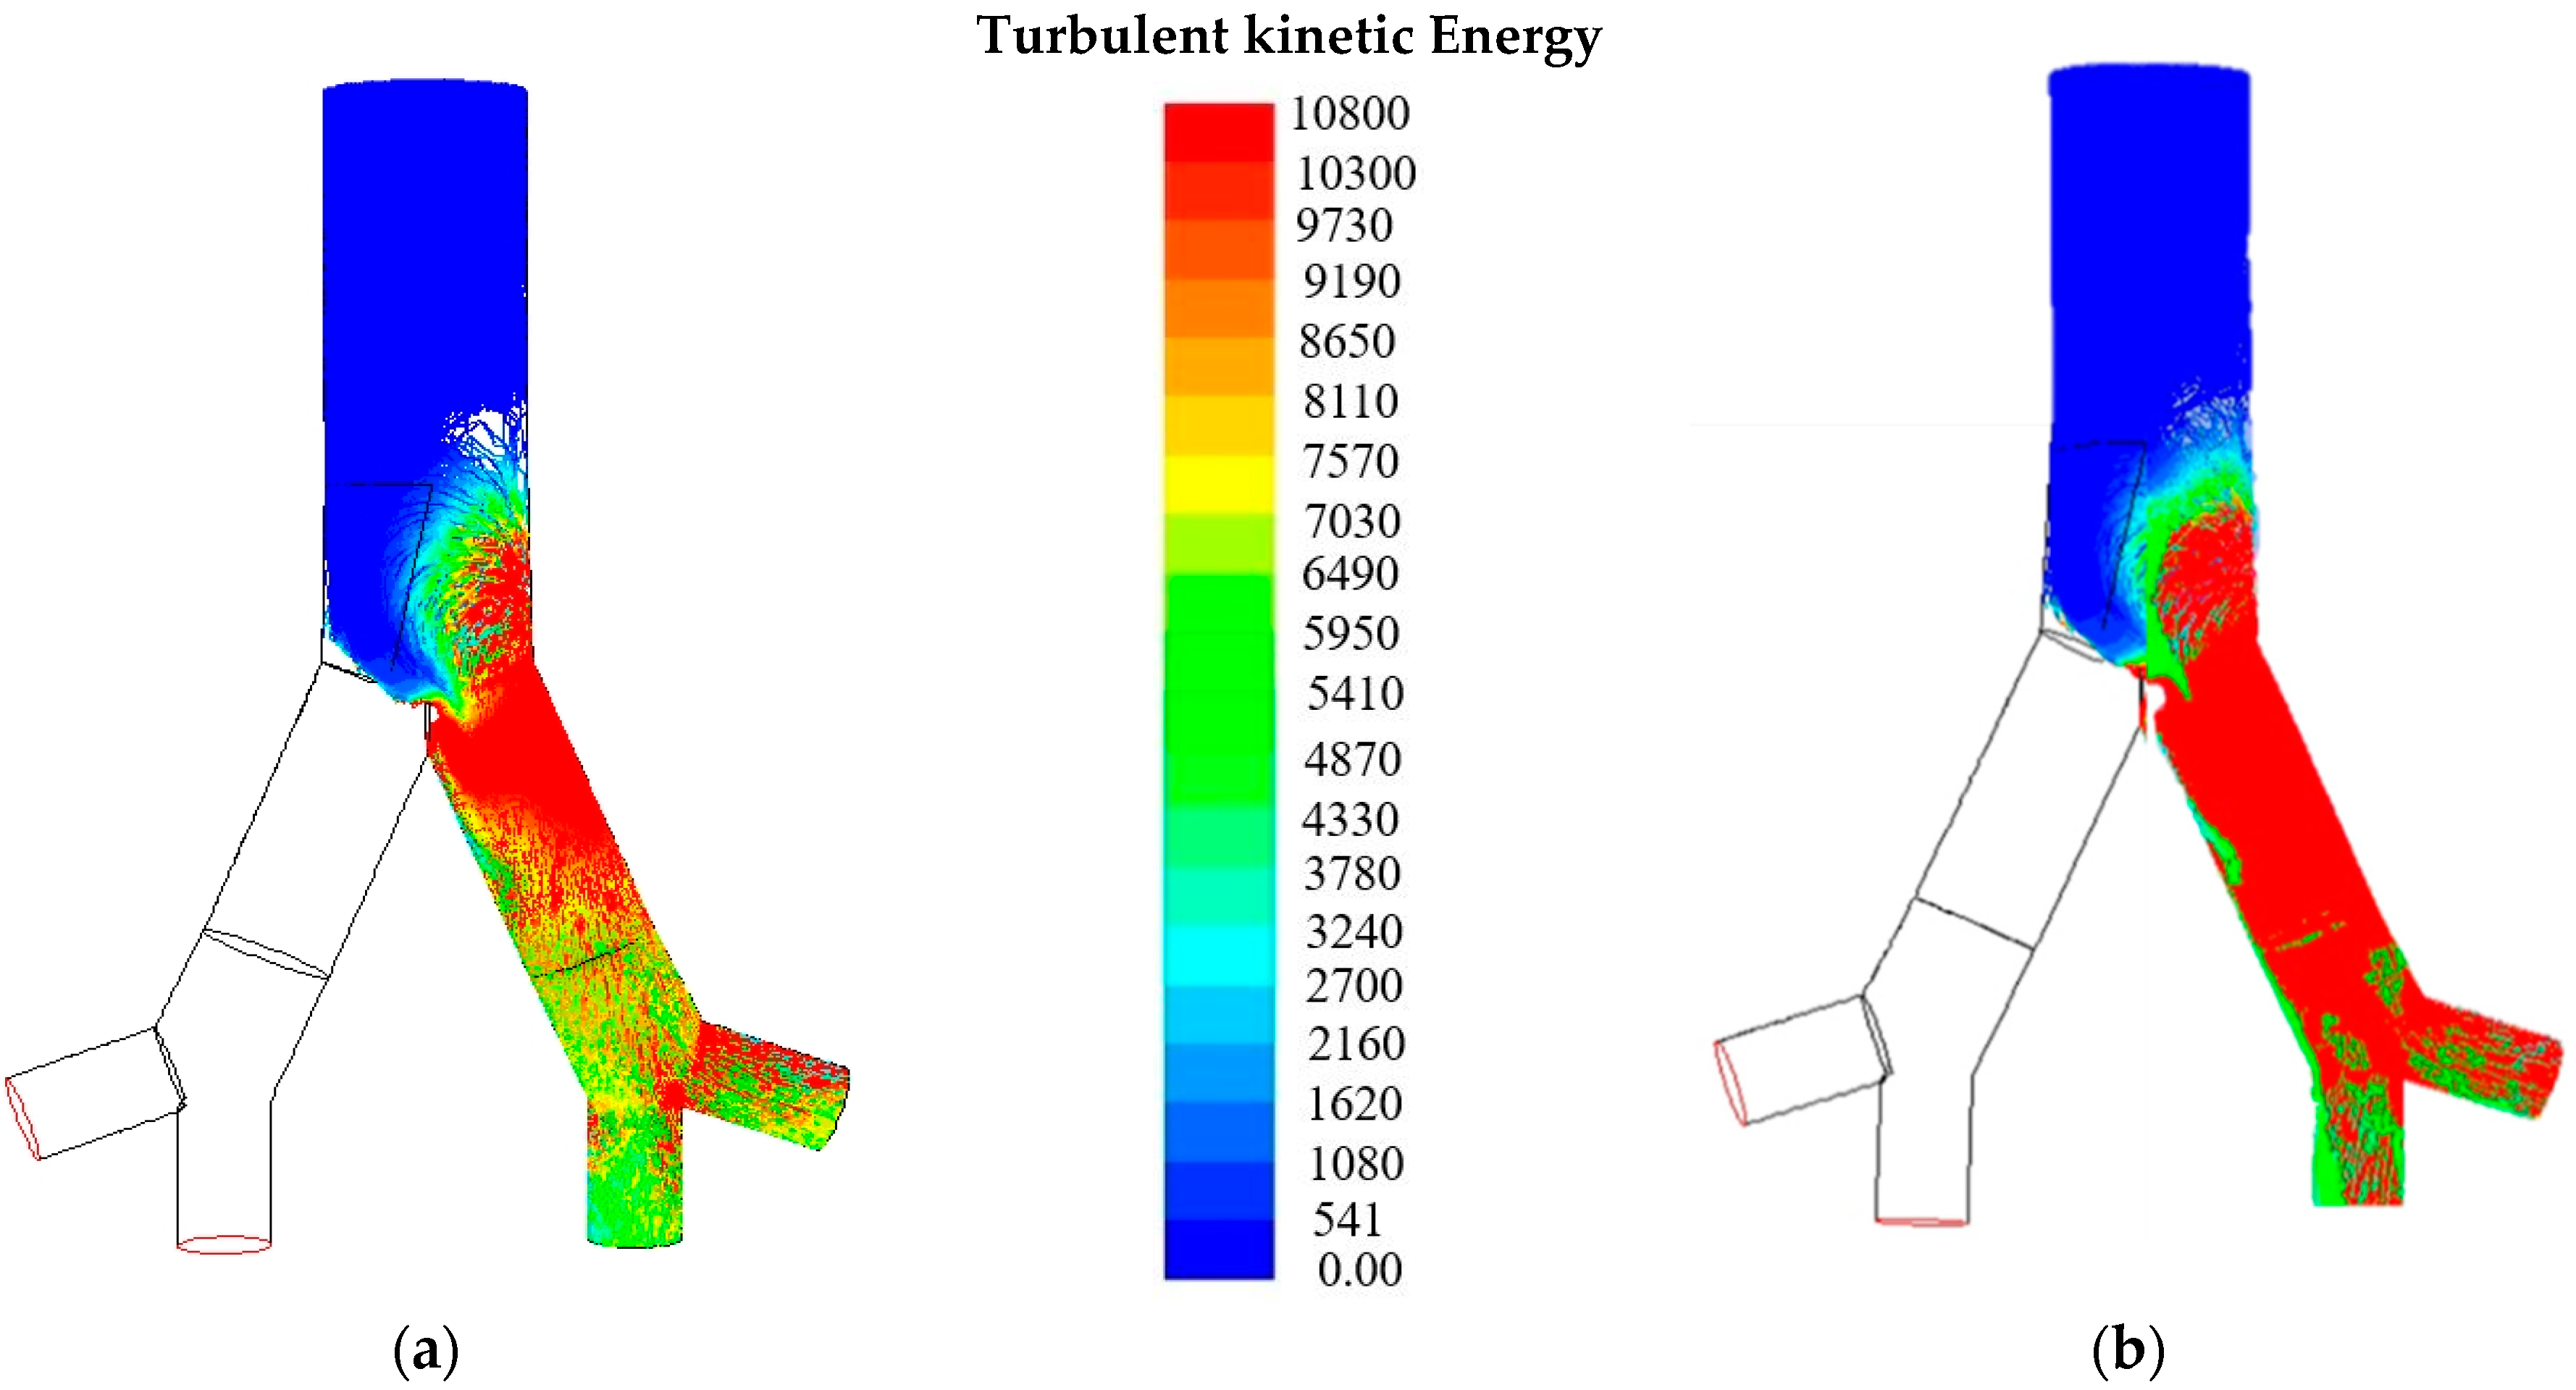
Figure 8 shows the particle tracing colored by turbulent kinetic energy (TKE) for 60 lpm flow rate and Mn = 2.5. The turbulent kinetic energy is calculated for 1-nm and 100-nm diameter particle. At 60 lpm flow rate, the turbulent kinetic energy for-1nm diameter particle is found maximum at the carinal region of the right bronchi. The turbulent kinetic energy for 100-nm diameter particle is found maximum throughout the right bronchioles of the second-generation model. It is recognized that for TKE, airflow goes faster in the compression region and as a result, the maximum number of particles are deposited on that region.
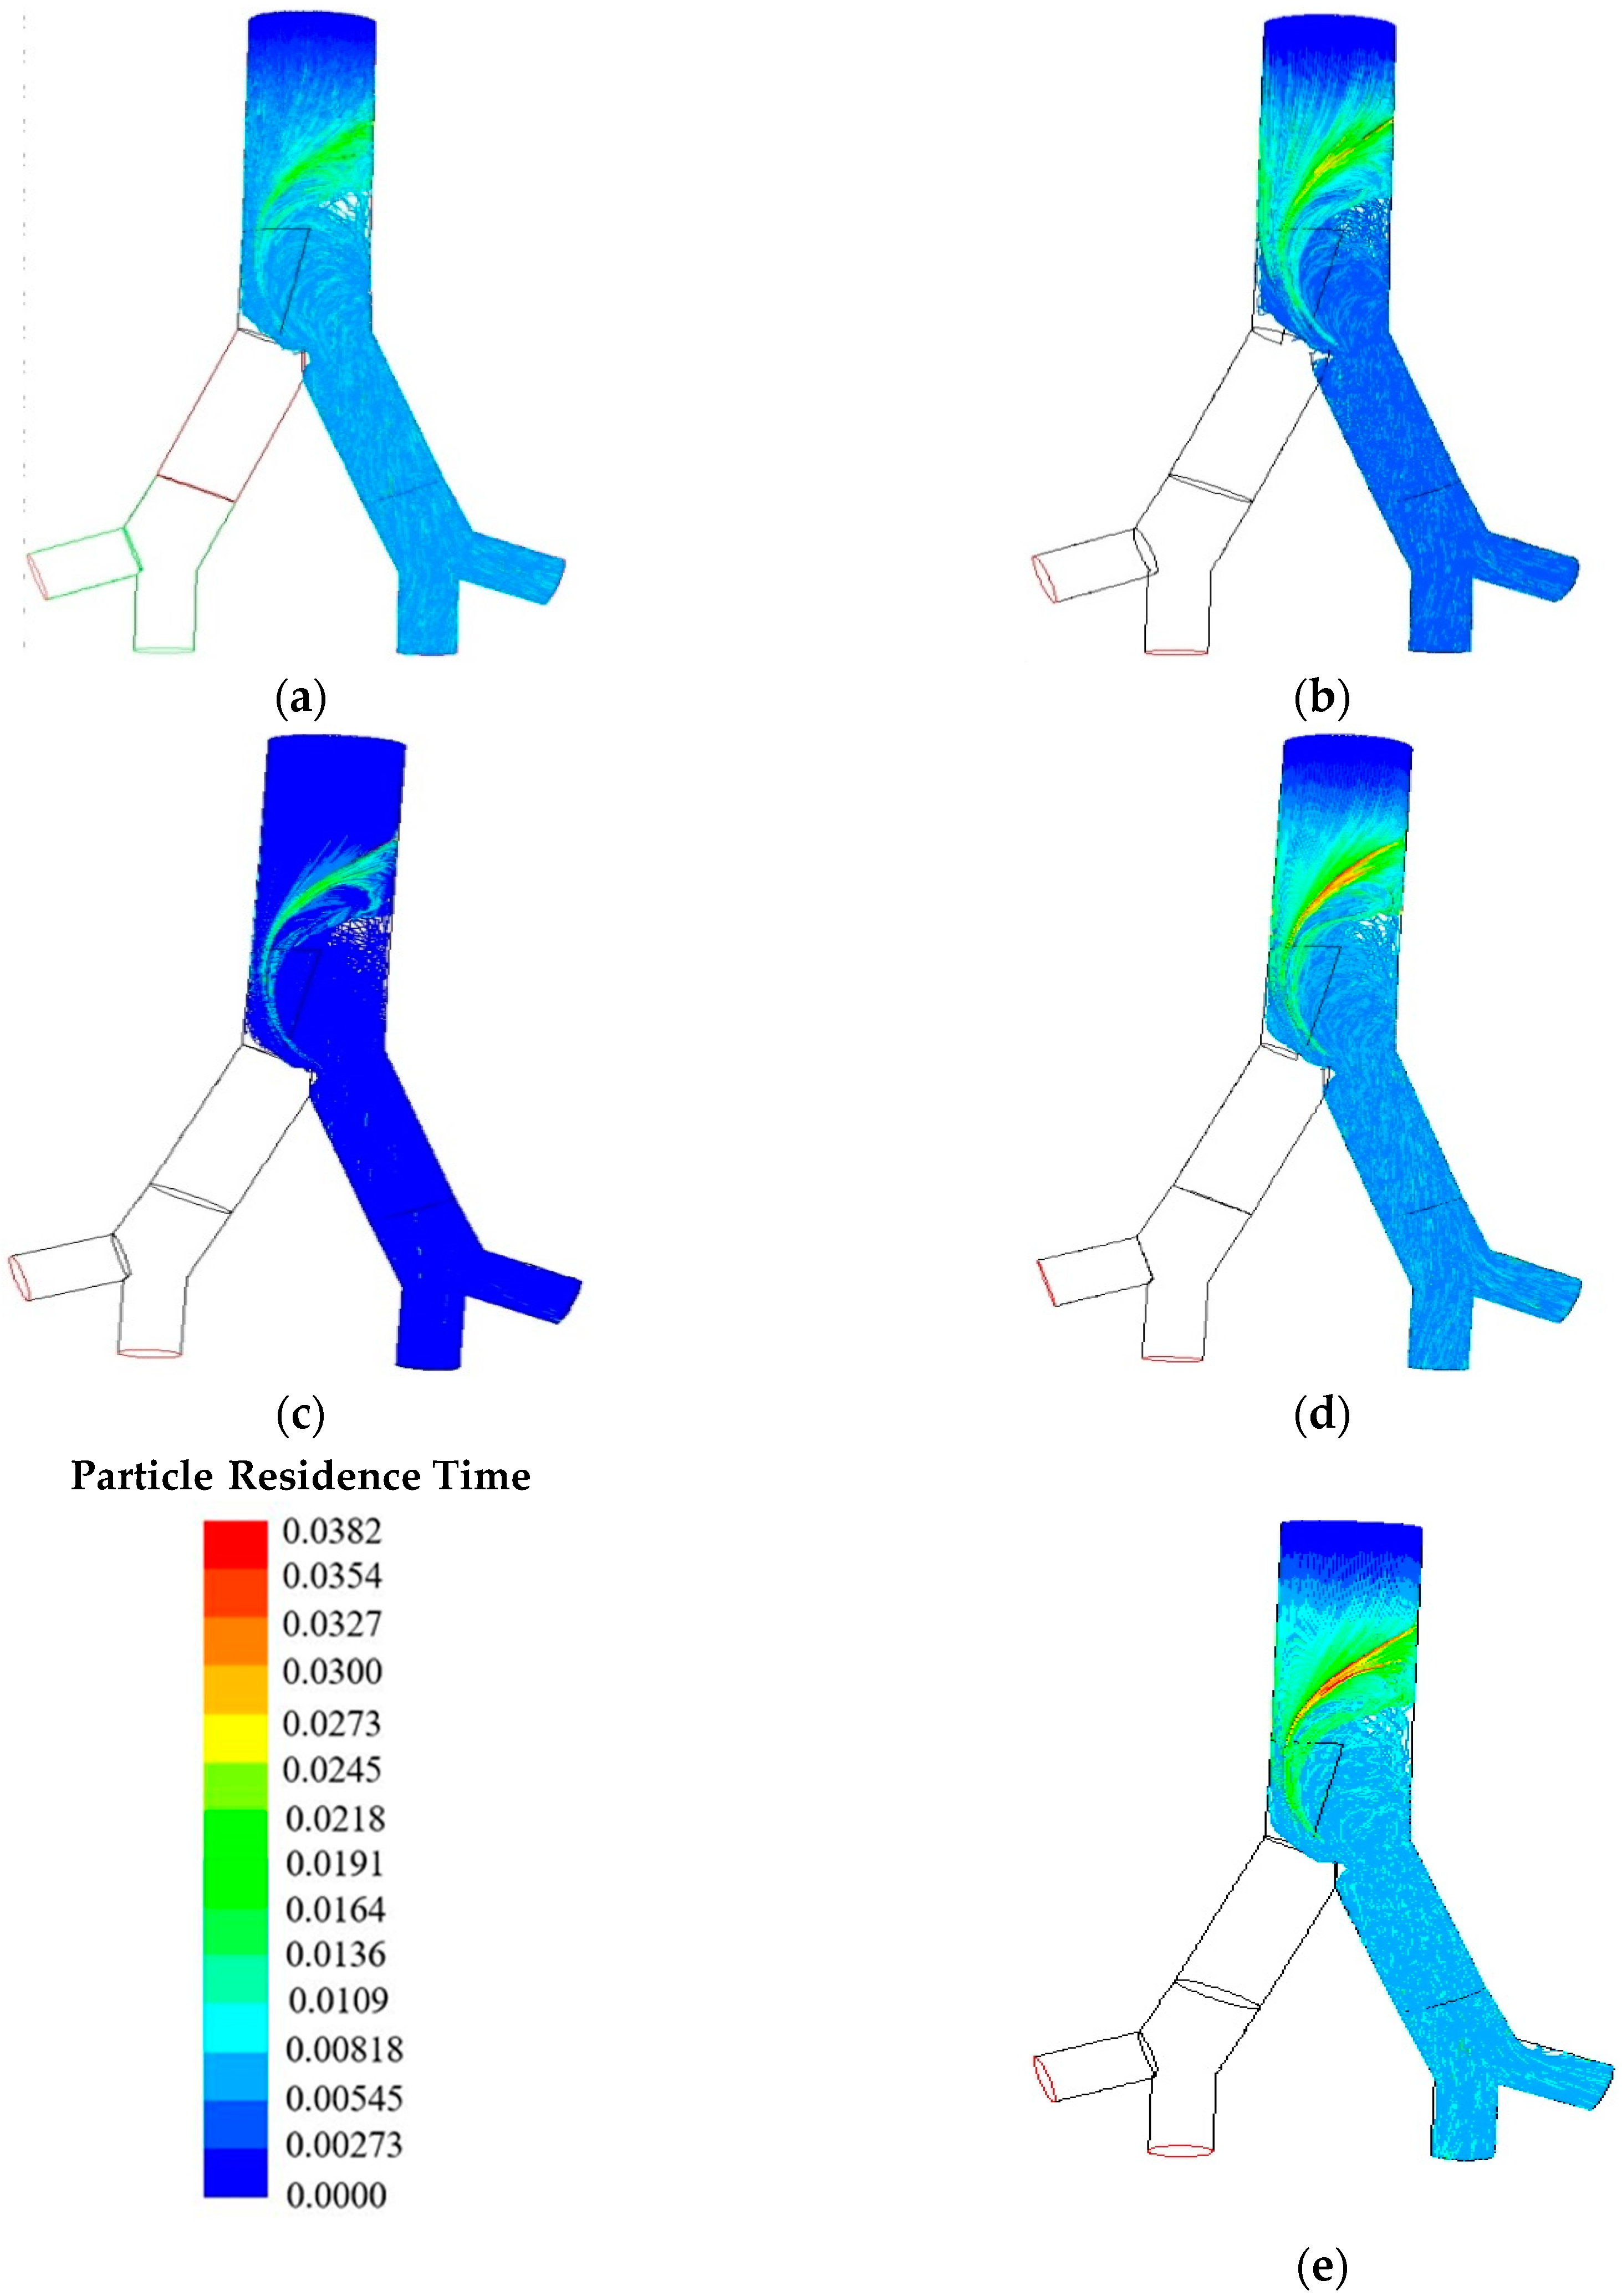
Figure 9 shows the particle tracing colored by particle residence time at magnet Position 2 for 60 lpm flow rate and Mn = 2.5. Residence times are traced for 1-nm, 10-nm, 50-nm, 100-nm, and 500-nm particle diameter. The residence time is the average amount of time spent in a control volume by the particles of a fluid. In medical field, the amount of time that a drug spends in the body is usually referred to by residence time. The residence time of the pharmaceutical aerosol could be different for different diameter particle. Some of the drug molecules stay in the system for a very short time, while others may remain for a long time. The overall calculated residence time of the smaller nano-size particle is found lower than the larger nano-size particle. Figure 9e shows that 500-nm MNPs diameter spend more time inside the lung than other MNPs diameter residence time.
The NPs DE comparison in two different magnetic field positions of the two-generation symmetric lung model at different flow rate and diameter are shown in Figure 10. The DE at two different magnetic field positions is different for particle diameter and flow rates. Overall DE comparison shows higher deposition concentration in the magnetic field Position 1 than Position 2. Figure 10 clearly shows the distinct deposition for different diameter particles at different flow rates for magnetic number 2.5. Figure 10 also shows the maximum number of particles deposited in Position 1 is 96.244% for flow rate 7.5 lpm and 1-nm particle diameter. On the other hand, at the targeted Position 2, the number of deposition percentage is at maximum (70.838) for flow rate 60 lpm and particle diameter 500-nm. The deposition efficiency trend line for flow rate 7.5 lpm shows that when the magnetic source is in Position 1, the maximum number of particles is deposited for 1-nm diameter than for other particle sizes.
Table 2 shows the total flow rate and diameter TD percentage comparison across two different magnetic field position for magnetic number 2.5. Table 2 also shows that the total flow of deposition concentration is higher in magnetic field Position 1 than in Position 2.
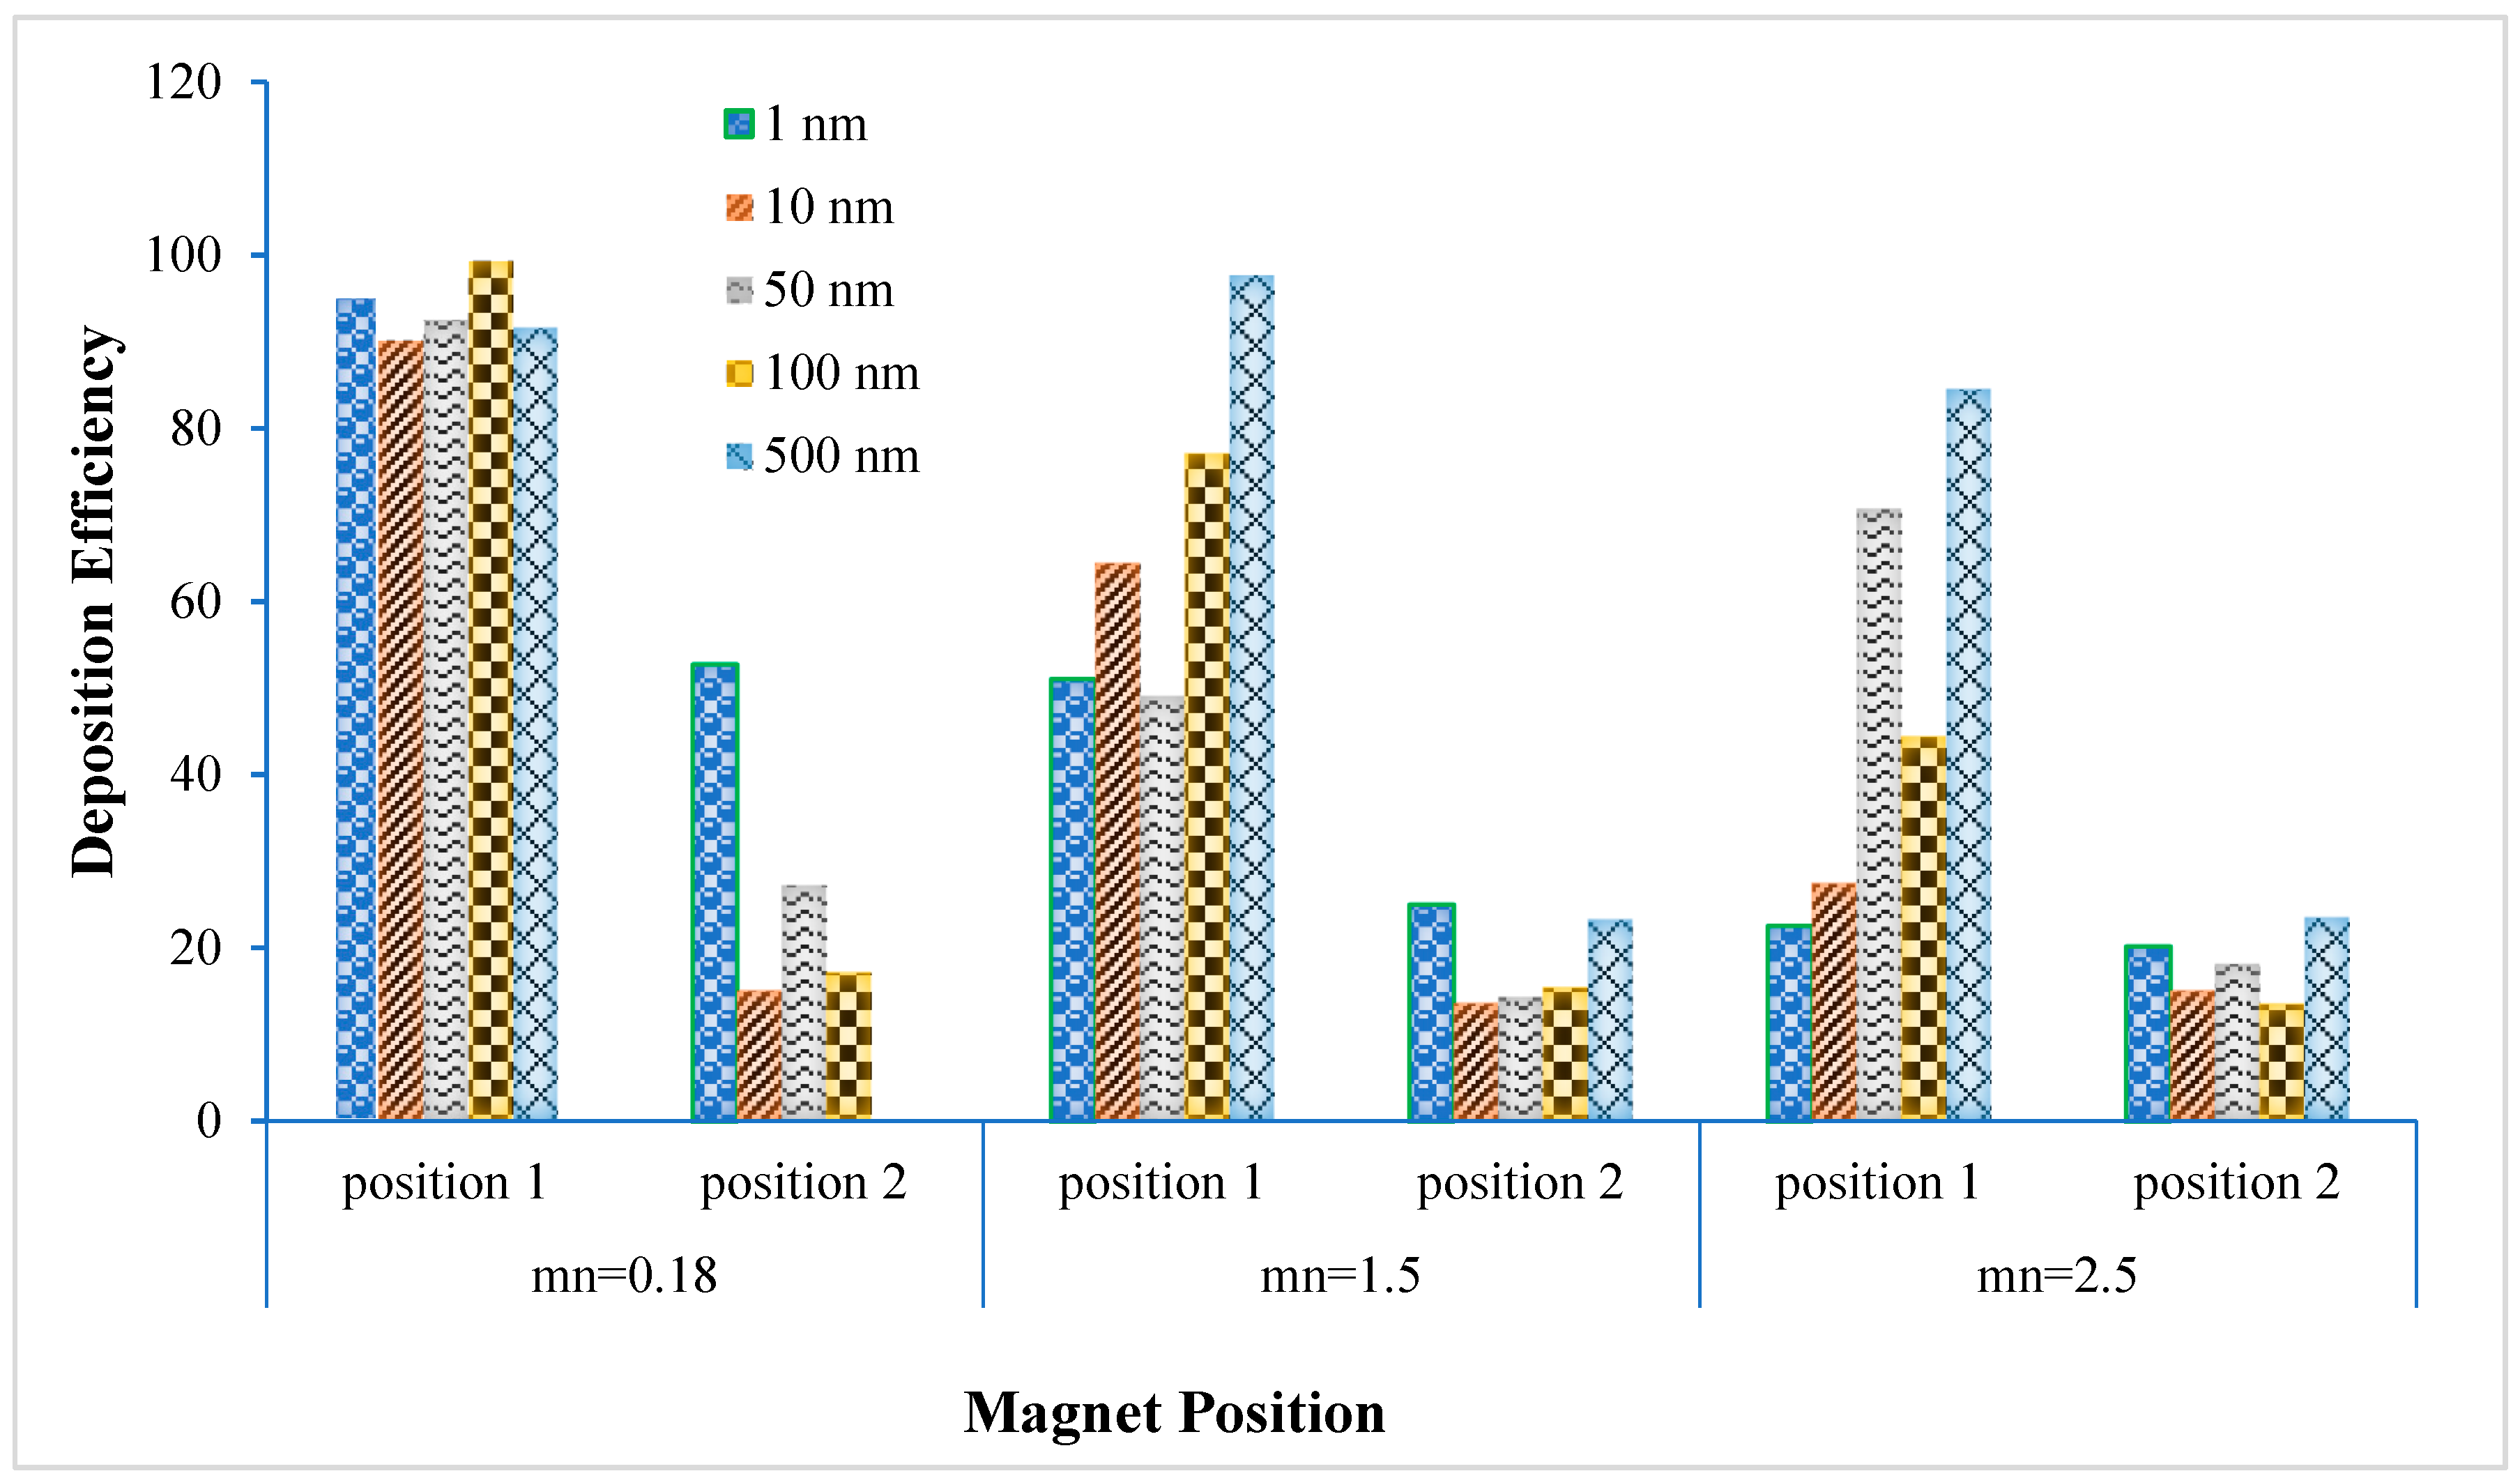
Figure 11 illustrates the effects of magnetic number for targeted drug delivery at magnetic Position 1 and Position 2 with 15 lpm flow rates and 1-nm, 50-nm, 100-nm and 500-nm diameter particles. The overall deposition is significantly higher for small magnetic number, 0.181 than other magnetic numbers. The DE trend line for 1-nm particle diameter for 15 lpm breathing condition shows a linear trend line for Position 1 and Position 2. The deposition trend line of 1-nm, 10-nm and 100-nm particle is significantly increased in small magnetic numbers for both magnetic field positions then decrease as magnetic number increases, shown in Figure 11. The deposition trend lines for 50-nm and 500-nm are fluctuating during the changes of magnetic number. Due to the position of magnetic source, the MNPs tend to accelerate along the targeted position in the presence of magnetic intensity. These specific findings can play an important role in targeted drug delivery.
Table 3 Shows the overall particle TD comparisons at two different targeted positions and different particle diameters for 0.181, 1.5, and 2.5 magnetic number as a function of 15 lpm slow breathing airflow rate. Therefore, the smaller magnetic number can play an important role in particulate deposition on the targeted region of lung during slow breathing condition.
In order to classify the regional deposition of targeted delivery of NPs, the airway geometry is specified in three regions according to Figure 5. The local deposition efficiency in each zone at various inhalation flow rates, particle sizes, and magnetic field position are calculated and shown in Figure 12. Figure 12a–d symbolize the local deposition efficiency for 7.5 lpm, 9lpm, 15 lpm and 60 lpm flow rates respectively with magnetic number 2.5. Due to external magnetic field being set on the right lung and before the first bifurcation, the deposition percentage is significantly increased in Generation 1 of the right lung (rg2). For sleeping (7.5 lpm) and resting (9 lpm) conditions, the regional deposition concentration is higher in Generation 1 of 1-nm particle diameters than other regions as it is seen in Figure 12a,b. Figure 12c shows the region deposition efficiency at two different magnetic positions for slow breathing condition (15 lpm) and magnetic number 2.5. This figure shows that maximum regional deposition is held in Generation 1 for 500-nm. Figure 12d shows the overall regional deposition for fast breathing condition (60 lpm) and magnetic number 2.5. During the fast breathing pattern, the maximum number of regional depositions is calculated in Generation 1 for 50-nm particles. The present two-generation symmetrical airway model allows comprehensive NPs deposition data at different regions, which could potentially increase an understanding of targeted region deposition and specifically, the transport of magnetic nano-particles to the targeted drug delivery system.
7. Conclusions
The present double bifurcation symmetric model illustrates comprehensive MNPs TD in the targeted region of the human lung. The present numerical model shows NPs ranging from 1 ≤ nm ≤ 500 diameter for sleeping, resting, slow and fast breathing condition of physical activities. A comprehensive validation has been performed and the following conclusions are drawn from the present study:
- Particle deposition efficiency on the targeted region were investigated as a function of four different breathing conditions, i.e., 7.5 lpm, 9 lpm, 15 lpm and 60 lpm. The present two-generation lung model shows that the maximum number of particles deposited in the targeted Position 1 for 7.5 lpm flow rates and in Position 2 for fast breathing condition (60 lpm).
- Particle diameter distribution effects in the targeted two different position were investigated for 1-nm, 50-nm, 100-nm and 500-nm particles. Most of the particle deposited on the targeted position and right lung (targeted region). The maximum number of depositions in the targeted Position 1 is for 1-nm and 7.5 lpm flow, for 50-nm and 100-nm it is happening for 60 lpm and for 500-nm it is 15 lpm flow rate. On contrary, for targeted Position 2, the deposition concentration is higher in Position 2 for 500-nm and 60lpm flow rates.
- The deposition scenario was investigated in the targeted position for three different magnetic number, i.e., 0.181, 1.5 and 2.5. The result shows that the overall deposition concentration is higher in both magnetic field position for small magnetic number 0.181 and flow rate is 15 lpm. On contrary, maximum number of the deposited particle in the targeted position are deposited for magnetic number 2.5 and 7.5 lpm flow rates.
- The nano-particle deposition was investigated for two different magnetic source position, i.e., Position 1 (wall position 1) and Position 2. Most of the particle deposited on the wall Position 1, Generation 1(g1), and rg2 (targeted region). Targeted magnetic particles attracted to the specific region of the lung, which allows direct treatment of those specific cells. This system reduces damage to healthy cells in the body.
The obtained results from present study may be used to improve our understanding of realistic drug delivery system in a targeted position of the human lung.
Author Contributions
Data curation, A.G.; writing—original draft, A.G.; writing—review and editing, M.S.I. and S.C.S. All authors have read and agreed to the published version of the manuscript.
Funding
This research received no external funding.
Conflicts of Interest
The authors declare no conflicts of interest.
References
- Lintermann, A.; Schröder, W. Simulation of aerosol particle deposition in the upper human tracheobronchial tract. Eur. J. Mech. B 2017, 63, 73–89. [Google Scholar] [CrossRef]
- Emmett, P.; Aitken, R.; Hannan, W. Measurements of the total and regional deposition of inhaled particles in the human respiratory tract. J. Aerosol Sci. 1982, 13, 549–560. [Google Scholar] [CrossRef]
- Gu, Q.; Qi, S.; Yue, Y.; Shen, J.; Zhang, B.; Sun, W.; Qian, W.; Islam, M.S.; Saha, S.C.; Wu, J. Structural and functional alterations of the tracheobronchial tree after left upper pulmonary lobectomy for lung cancer. Biomed. Eng. Online 2019, 18, 1–18. [Google Scholar] [CrossRef] [PubMed] [Green Version]
- Inthavong, K.; Mouritz, A.P.; Dong, J.; Tu, J.Y. Inhalation and deposition of carbon and glass composite fibre in the respiratory airway. J. Aerosol Sci. 2013, 65, 58–68. [Google Scholar] [CrossRef]
- Islam, M.S.; Paul, G.; Ong, H.X.; Young, P.M.; Gu, Y.T.; Saha, S.C. A Review of Respiratory Anatomical Development, Air Flow Characterization and Particle Deposition. Int. J. Environ. Res. Public Health 2020, 17, 380. [Google Scholar] [CrossRef] [Green Version]
- Saha, S.; Islam, M.; Rahimi-Gorji, M.; Molla, M. Aerosol particle transport and deposition in a CT-scan based mouth-throat model. AIP Conf. Proc. 2019, 2121, 040011. [Google Scholar] [CrossRef]
- Islam, M.S.; Saha, S.C.; Gemci, T.; Yang, I.A.; Sauret, E.; Gu, Y.T. Polydisperse Microparticle Transport and Deposition to the Terminal Bronchioles in a Heterogeneous Vasculature Tree. Sci. Rep. 2018, 8, 16387. [Google Scholar] [CrossRef]
- Islam, M.S.; Saha, S.C.; Gemci, T.; Yang, I.A.; Sauret, E.; Ristovski, Z.; Gu, Y.T. Euler-Lagrange Prediction of Diesel-Exhaust Polydisperse Particle Transport and Deposition in Lung: Anatomy and Turbulence Effects. Sci. Rep. 2019, 9, 12423. [Google Scholar] [CrossRef] [Green Version]
- Islam, M.S.; Saha, S.C.; Sauret, E.; Gemci, T.; Gu, Y. Pulmonary aerosol transport and deposition analysis in upper 17 generations of the human respiratory tract. J. Aerosol Sci. 2017, 108, 29–43. [Google Scholar] [CrossRef] [Green Version]
- Islam, M.S.; Saha, S.C.; Sauret, E.; Gu, Y. Numerical investigation of diesel exhaust particle transport and deposition in up to 17 generations of the lung airway. In Proceedings of the 20th Australasian Fluid Mechanics Conference, Perth, Australia, 5–8 December 2016. [Google Scholar]
- Islam, M.S.; Saha, S.C.; Sauret, E.; Gu, Y.; Ristovski, Z. Numerical investigation of aerosol particle transport and deposition in realistic lung airway. In Proceedings of the International Conference on Computational Methods, Auckland, New Zealand, 14–17 July 2015. [Google Scholar]
- Islam, M.S.; Saha, S.C.; Sauret, E.; Ong, H.; Young, P.; Gu, Y. Euler–Lagrange approach to investigate respiratory anatomical shape effects on aerosol particle transport and deposition. Toxicol. Res. Appl. 2019, 3, 2397847319894675. [Google Scholar] [CrossRef] [Green Version]
- Islam, M.S.; Saha, S.C.; Sauret, E.; Gemci, T.; Yang, I.A.; Gu, Y.T. Ultrafine particle transport and deposition in a large scale 17-generation lung model. J. Biomech. 2017, 64, 16–25. [Google Scholar] [CrossRef] [PubMed] [Green Version]
- Zhang, Z.; Kleinstreuer, C. Airflow structures and nano-particle deposition in a human upper airway model. J. Comput. Phys. 2004, 198, 178–210. [Google Scholar] [CrossRef]
- Asgharian, B.; Price, O.T. Deposition of Ultrafine (NANO) Particles inthe Human Lung. Inhal. Toxicol. 2008, 19, 1045–1054. [Google Scholar] [CrossRef] [PubMed]
- Kleinstreuer, C.; Zhang, Z.; Li, Z. Modeling airflow and particle transport/deposition in pulmonary airways. Respir. Physiol. Neurobiol. 2008, 163, 128–138. [Google Scholar] [CrossRef]
- Dames, P.; Gleich, B.; Flemmer, A.; Hajek, K.; Seidl, N.; Wiekhorst, F.; Eberbeck, D.; Bittmann, I.; Bergemann, C.; Weyh, T.; et al. Targeted delivery of magnetic aerosol droplets to the lung. Nat. Nanotechnol. 2007, 2, 495–499. [Google Scholar] [CrossRef]
- Kuzmov, A.; Minko, T. Nanotechnology approaches for inhalation treatment of lung diseases. J. Control. Release 2015, 219, 500–518. [Google Scholar] [CrossRef] [Green Version]
- Bennett, W.D.; Brown, J.S.; Zeman, K.L.; Hu, S.-C.; Scheuch, G.; Sommerer, K. Targeting delivery of aerosols to different lung regions. J. Aerosol Med. 2002, 15, 179–188. [Google Scholar] [CrossRef]
- Ally, J.; Martin, B.; Behrad Khamesee, M.; Roa, W.; Amirfazli, A. Magnetic targeting of aerosol particles for cancer therapy. J. Magn. Magn. Mater. 2005, 293, 442–449. [Google Scholar] [CrossRef]
- Mishra, B.; Patel, B.B.; Tiwari, S. Colloidal nanocarriers: A review on formulation technology, types and applications toward targeted drug delivery. Nanomed. Nanotechnol. Biol. Med. 2010, 6, 9–24. [Google Scholar] [CrossRef]
- Wilczewska, A.Z.; Niemirowicz, K.; Markiewicz, K.H.; Car, H. Nanoparticles as drug delivery systems. Pharmacol. Rep. 2012, 64, 1020–1037. [Google Scholar] [CrossRef]
- Lübbe, A.S.; Alexiou, C.; Bergemann, C. Clinical Applications of Magnetic Drug Targeting. J. Surg. Res. 2001, 95, 200–206. [Google Scholar] [CrossRef] [PubMed]
- Sharma, S.; Kumar, R.; Gaur, A. A Model for Magnetic Nanoparticles Transport in a Channel for Targeted Drug Delivery. Procedia Mater. Sci. 2015, 10, 44–49. [Google Scholar] [CrossRef] [Green Version]
- Roa, W.H.; Azarmi, S.; Al-Hallak, M.H.D.K.; Finlay, W.H.; Magliocco, A.M.; Löbenberg, R. Inhalable nanoparticles, a non-invasive approach to treat lung cancer in a mouse model. J. Control. Release 2011, 150, 49–55. [Google Scholar] [CrossRef] [PubMed]
- Pourmehran, O.; Gorji, T.B.; Gorji-Bandpy, M. Magnetic drug targeting through a realistic model of human tracheobronchial airways using computational fluid and particle dynamics. Biomech. Model. Mechanobiol. 2016, 15, 1355–1374. [Google Scholar] [CrossRef] [PubMed]
- Boghi, A.; Russo, F.; Gori, F. Numerical simulation of magnetic nano drug targeting in a patient-specific coeliac trunk. J. Magn. Magn. Mater. 2017, 437, 86–97. [Google Scholar] [CrossRef] [Green Version]
- Krafcik, A.; Babinec, P.; Frollo, I. Computational analysis of magnetic field induced deposition of magnetic particles in lung alveolus in comparison to deposition produced with viscous drag and gravitational force. J. Magn. Magn. Mater. 2015, 380, 46–53. [Google Scholar] [CrossRef]
- Russo, F.; Boghi, A.; Gori, F. Numerical simulation of magnetic nano drug targeting in patient-specific lower respiratory tract. J. Magn. Magn. Mater. 2018, 451, 554–564. [Google Scholar] [CrossRef] [Green Version]
- Gori, F.; Boghi, A. A three dimensional exact equation for the turbulent dissipation rate of Generalised Newtonian Fluids. Int. Commun. Heat Mass Transf. 2012, 39, 477–485. [Google Scholar] [CrossRef]
- Gori, F.; Boghi, A. Two new differential equations of turbulent dissipation rate and apparent viscosity for non-newtonian fluids. Int. Commun. Heat Mass Transf. 2011, 38, 696–703. [Google Scholar] [CrossRef] [Green Version]
- Pourmehran, O.; Rahimi-Gorji, M.; Gorji-Bandpy, M.; Gorji, T.B. Simulation of magnetic drug targeting through tracheobronchial airways in the presence of an external non-uniform magnetic field using Lagrangian magnetic particle tracking. J. Magn. Magn. Mater. 2015, 393, 380–393. [Google Scholar] [CrossRef]
- Bates, A.J.; Schuh, A.; Amine-Eddine, G.; McConnell, K.; Loew, W.; Fleck, R.J.; Amin, R.S. Assessing the relationship between movement and airflow in the upper airway using computational fluid dynamics with motion determined from magnetic resonance imaging. Clin. Biomech. 2019, 66, 88–96. [Google Scholar] [CrossRef] [PubMed]
- Longest, P.W.; Xi, J. Computational investigation of particle inertia effects on submicron aerosol deposition in the respiratory tract. J. Aerosol Sci. 2007, 38, 111–130. [Google Scholar] [CrossRef]
- Kim, C. Ultrafine Particle Deposition in a Double Bifurcation Tube with Human G3–G5 Airway Geometry; Internal Report; US EPA: Washington, DC, USA, 2002.
Figure 1.
(a) Anterior view of the two-generation mesh, (b) interior view and inflation layer mesh near to the wall, (c) inlet mesh and (d) outlet mesh of 2-generation lung model.
Figure 1.
(a) Anterior view of the two-generation mesh, (b) interior view and inflation layer mesh near to the wall, (c) inlet mesh and (d) outlet mesh of 2-generation lung model.

Figure 2.
Maximum pressure grid convergence.

Figure 3.
Nano-particle deposition efficiency (DE) comparison with the experimental data of Kim [35] and the CFD results of Zhang and Kleinstreuer [14] and Islam et al. [13] in a double bifurcation model (G3-G5), (a) first bifurcation, and (b) second bifurcation.

Figure 4.
Deposition fraction (DF) of nano-particle comparison with the CFD results of Zhang and Kleinstreuer [14] across different bifurcation for 30 lpm flow rates in the bifurcation airway model.
Figure 4.
Deposition fraction (DF) of nano-particle comparison with the CFD results of Zhang and Kleinstreuer [14] across different bifurcation for 30 lpm flow rates in the bifurcation airway model.

Figure 5.
Geometry specification of two-generation model where magnet Position 2 has been set near the right lung (lg2 indicates left Generation 2 and rg2 indicates right Generation 2).
Figure 5.
Geometry specification of two-generation model where magnet Position 2 has been set near the right lung (lg2 indicates left Generation 2 and rg2 indicates right Generation 2).

Figure 6.
Effect of flow rates on particle transport outline for Position 1 and Position 2, Mn = 2.5, dp = 1-nm, (a) 7.5 lpm for Position 1; (b) 7.5 lpm for Position 2; (c) 9 lpm for Position 1; (d) 9 lpm for Position 2; (e) 15 lpm for Position 1; (f) 15 lpm for Position 2; (g) overall deposition efficiency.


Figure 7.
Effect of magnetic number on particle transport outline for Position 1 and Position 2, 7.5 lpm, dp = 1-nm, (a) Mn = 0.181 for Position 1; (b) Mn = 0.181 for Position 2; (c) Mn = 1.5 for Position 1; (d) Mn = 1.5 for Position 2; (e) Mn = 2.5 for Position 1; (f) Mn = 2.5 for Position 2; (g) overall deposition efficiency for magnetic Position 1 and magnetic Position 2.


Figure 8.
Particle traces colored by turbulent kinetic energy (k) () for 60 lpm, Mn = 2.5 and magnet Position 2, (a) 1-nm, and (b) 100-nm.
Figure 8.
Particle traces colored by turbulent kinetic energy (k) () for 60 lpm, Mn = 2.5 and magnet Position 2, (a) 1-nm, and (b) 100-nm.

Figure 9.
Particle traces colored by particle residence time at magnetic Position 2 for 60 lpm and Mn = 2.5 (a) 1-nm; (b) 10-nm; (c) 50-nm; (d) 100-nm; (e) 500-nm.
Figure 9.
Particle traces colored by particle residence time at magnetic Position 2 for 60 lpm and Mn = 2.5 (a) 1-nm; (b) 10-nm; (c) 50-nm; (d) 100-nm; (e) 500-nm.

Figure 10.
Deposition efficiency comparisons for nano-particles of various diameter and flow rates at Position 1 and Position 2 for magnetic number 2.5.
Figure 10.
Deposition efficiency comparisons for nano-particles of various diameter and flow rates at Position 1 and Position 2 for magnetic number 2.5.

Figure 11.
Deposition efficiency comparisons for nano-particles of various diameters and magnetic number at Position 1 and Position 2 for 15 lpm flow rates.
Figure 11.
Deposition efficiency comparisons for nano-particles of various diameters and magnetic number at Position 1 and Position 2 for 15 lpm flow rates.

Figure 12.
Regional particle deposition efficiency in each zone at different particle sizes, magnet position, magnetic number 2.5 and inhalation rates. Generation 1 (g1), Left Generation 2 (lg2), Right Generation 2 (rg2).
Figure 12.
Regional particle deposition efficiency in each zone at different particle sizes, magnet position, magnetic number 2.5 and inhalation rates. Generation 1 (g1), Left Generation 2 (lg2), Right Generation 2 (rg2).


Table 1.
Number of case studies.
| Flow Rates | ||||||
|---|---|---|---|---|---|---|
| Parameters | 7.5 lpm | 9 lpm | 15 lpm | 60 lpm | ||
| Particle Diameter | 1-nm | 1-, 50-, 100- and 500-nm | 1-, 50-, 100- and 500-nm | 1-, 50-, 100- and 500-nm | 1- and 100-nm | 10-, 50-, and 500-nm |
| Magnetic Number | Mn = 0.181, 1.5 | Mn = 2.5 | Mn = 2.5 | Mn = 0.181, 1.5, 2.5 | Mn = 2.5 | Mn = 2.5 |
| Magnet Position 1 | Position 1 | Position 1 | Position 1 | Position 1 | Position 1 | |
| Magnet Position 2 | Position 2 | Position 2 | Position 2 | Position 2 | Position 2 | Position 2 |
Table 2.
Respiratory particle transport and deposition (TD) comparisons for 1-, 50-, 100- and 500-nm diameter particles as a function of different breathing airflow rates and magnetic number 2.5.
Table 2.
Respiratory particle transport and deposition (TD) comparisons for 1-, 50-, 100- and 500-nm diameter particles as a function of different breathing airflow rates and magnetic number 2.5.
| 7.5 lpm | 9 lpm | 15 lpm | 60 lpm | |||||
|---|---|---|---|---|---|---|---|---|
| Diameter | Position 1 | Position 2 | Position 1 | Position 2 | Position 1 | Position 2 | Position 1 | Position 2 |
| 1-nm | 96.244% | 41.146% | 56.678% | 39.330% | 22.606% | 20.242% | 63.975% | 39.907% |
| 50-nm | 26.201% | 13.871% | 30.779% | 26.820% | 70.724% | 18.203% | 86.918% | 41.595% |
| 100-nm | 30.798% | 11.450% | 21.807% | 7.704% | 44.401% | 13.545% | 62.816% | 52.719% |
| 500-nm | 30.836% | 10.934% | 47.497% | 44.802% | 84.529% | 23.50% | 78.357% | 70.838% |
Table 3.
Respiratory particle TD comparisons at two different targeted positions for 0.181, 1.5, and 2.5 magnetic number as a function of 15lpm breathing airflow rates and 1-, 50-, 100- and 500-nm diameter particle.
Table 3.
Respiratory particle TD comparisons at two different targeted positions for 0.181, 1.5, and 2.5 magnetic number as a function of 15lpm breathing airflow rates and 1-, 50-, 100- and 500-nm diameter particle.
| Mn | Mn = 0.181 | Mn = 1.5 | Mn = 2.5 | |||
|---|---|---|---|---|---|---|
| Diameter | Position 1 | Position 2 | Position 1 | Position 2 | Position 1 | Position 2 |
| 1 nm | 95.275% | 52.828% | 51.116% | 25.080% | 22.606% | 20.242% |
| 10 nm | 90.228% | 15.044% | 64.458% | 13.625% | 27.463% | 15.044% |
| 50 nm | 92.499% | 27.251% | 49.132% | 14.387% | 70.724% | 18.203% |
| 100 nm | 99.404% | 17.146% | 77.095% | 15.427% | 44.401% | 13.545% |
| 500 nm | 91.647% | 0.0193% | 97.729% | 23.278% | 84.529% | 23.500% |
© 2020 by the authors. Licensee MDPI, Basel, Switzerland. This article is an open access article distributed under the terms and conditions of the Creative Commons Attribution (CC BY) license (http://creativecommons.org/licenses/by/4.0/).
Share and Cite
MDPI and ACS Style
Ghosh, A.; Islam, M.S.; Saha, S.C. Targeted Drug Delivery of Magnetic Nano-Particle in the Specific Lung Region. Computation 2020, 8, 10. https://0-doi-org.brum.beds.ac.uk/10.3390/computation8010010
AMA Style
Ghosh A, Islam MS, Saha SC. Targeted Drug Delivery of Magnetic Nano-Particle in the Specific Lung Region. Computation. 2020; 8(1):10. https://0-doi-org.brum.beds.ac.uk/10.3390/computation8010010
Chicago/Turabian StyleGhosh, Anusmriti, Mohammad S. Islam, and Suvash C. Saha. 2020. "Targeted Drug Delivery of Magnetic Nano-Particle in the Specific Lung Region" Computation 8, no. 1: 10. https://0-doi-org.brum.beds.ac.uk/10.3390/computation8010010
Note that from the first issue of 2016, this journal uses article numbers instead of page numbers. See further details here.