
Recent Developments of Noise Attenuation Using Acoustic Barriers for a Specific Edge Geometry


1
Department of Mechanics, University POLITEHNICA of Bucharest, 060042 Bucharest, Romania
2
Authority of Regional Roads Valcea, 240158 Ramnicu Valcea, Romania
*
Author to whom correspondence should be addressed.
Computation 2021, 9(12), 129; https://0-doi-org.brum.beds.ac.uk/10.3390/computation9120129
Submission received: 31 October 2021
/
Revised: 20 November 2021
/
Accepted: 28 November 2021
/
Published: 2 December 2021
(This article belongs to the Special Issue Experiments/Process/System Modeling/Simulation/Optimization (IC-EPSMSO 2021))
Abstract
:The aim of this research is to provide a better prediction for noise attenuation using thin rigid barriers. In particular, the paper presents an analysis on four methods of computing the noise attenuation using acoustic barriers: Maekawa-Tatge formulation, Kurze and Anderson algorithm, Menounou formulation, and the general prediction method (GPM-ISO 9613). Accordingly, to improve the GPM, the prediction computation of noise attenuation was optimized for an acoustic barrier by considering new effects, such as attenuation due to geometrical divergence, ground absorption-reflections, and atmospheric absorption. The new method, modified GPM (MGPM), was tested for the optimization of an y-shape edge geometry of the noise barrier and a closed agreement with the experimental data was found in the published literature. The specific y-shape edge geometry of the noise barrier contributes to the attenuation due to the diffraction phenomena. This aspect is based on the Kirchhoff diffraction theory that contains the Huygens-Fresnel theory, which is applied to a semi-infinite acoustic barrier. The new method MGPM of predicting the noise attenuation using acoustic barriers takes into consideration the next phenomena: The effect of the relative position of the receiver, the effect of the proximity of the source or receiver to the midplane of the barrier, the effect of the proximity of the receiver to the shadow boundary, the effect of ground absorption-reflections, the effect of atmospheric absorption, and the meteorological effect due to downwind. The conclusion of the paper reveals the optimization of the method for computing the noise attenuation using acoustic barriers, including the necessary corrections for ISO-9613 and the Sound PLAN software, as well as the optimization on a case study of a specific geometry of the edge barrier.
1. Introduction
The present paper presents the detailed analysis of computing the noise attenuation using acoustic barriers using four different approaches: Maekawa-Tatge formulation [1,2], Kurze and Anderson algorithm [3], general prediction method (GPM-ISO 9613) [4,5], and Menounou formulation [6]. The noise attenuation of the barrier was computed based on the Kirchhoff diffraction theory, which implies that the Huygens-Fresnel theory is applied to a semi-infinite acoustic thin barrier. The Maekawa-Tatge formulation and Kurze and Anderson algorithm provide almost the same numerical results since they express the noise attenuation using the first Fresnel number N1. This indicates that only one phenomenon is considered: The effect of the relative position of the receiver from the source. The general prediction method considers, for the prediction of noise attenuation, two phenomena: The effect of the relative position of the receiver from the source and the downwind meteorological effect.
The Menounou formulation takes into consideration four phenomena: The effect of the relative position of the receiver from the source, the effect of the proximity of the source or the receiver to the midplane, the effect of the proximity of the receiver to the shadow boundary, and the diffraction effect due to spherical incident waves.
After the analysis of the numerical simulation data of these four methods, the best predicting method for the computation of the noise attenuation for a thin rigid semi-infinite acoustic barrier, is GPM. The GPM was improved by introducing new effects, such as the proximity of the source or the receiver to the mid plane attenuation due to geometrical divergence [6], ground absorption-reflections [7], and atmospheric absorption [8,9]. The new method MGPM was tested by computing the attenuation induced by an y-shape edge geometry of the barrier that optimizes the y-shape angle, as well as the positioning angle of the edge midplane with respect to the source. The new method, which was called by the authors modified general prediction method (MGPM), involved making the necessary corrections in ISO-9613 as well as for the software Sound PLAN, that predict the noise propagation and attenuation for an industrial area and the fields nearby high-ways, railways, and airports. The aim of this research was to provide a better prediction method for the noise attenuation using thin rigid barriers.
2. State of the Art
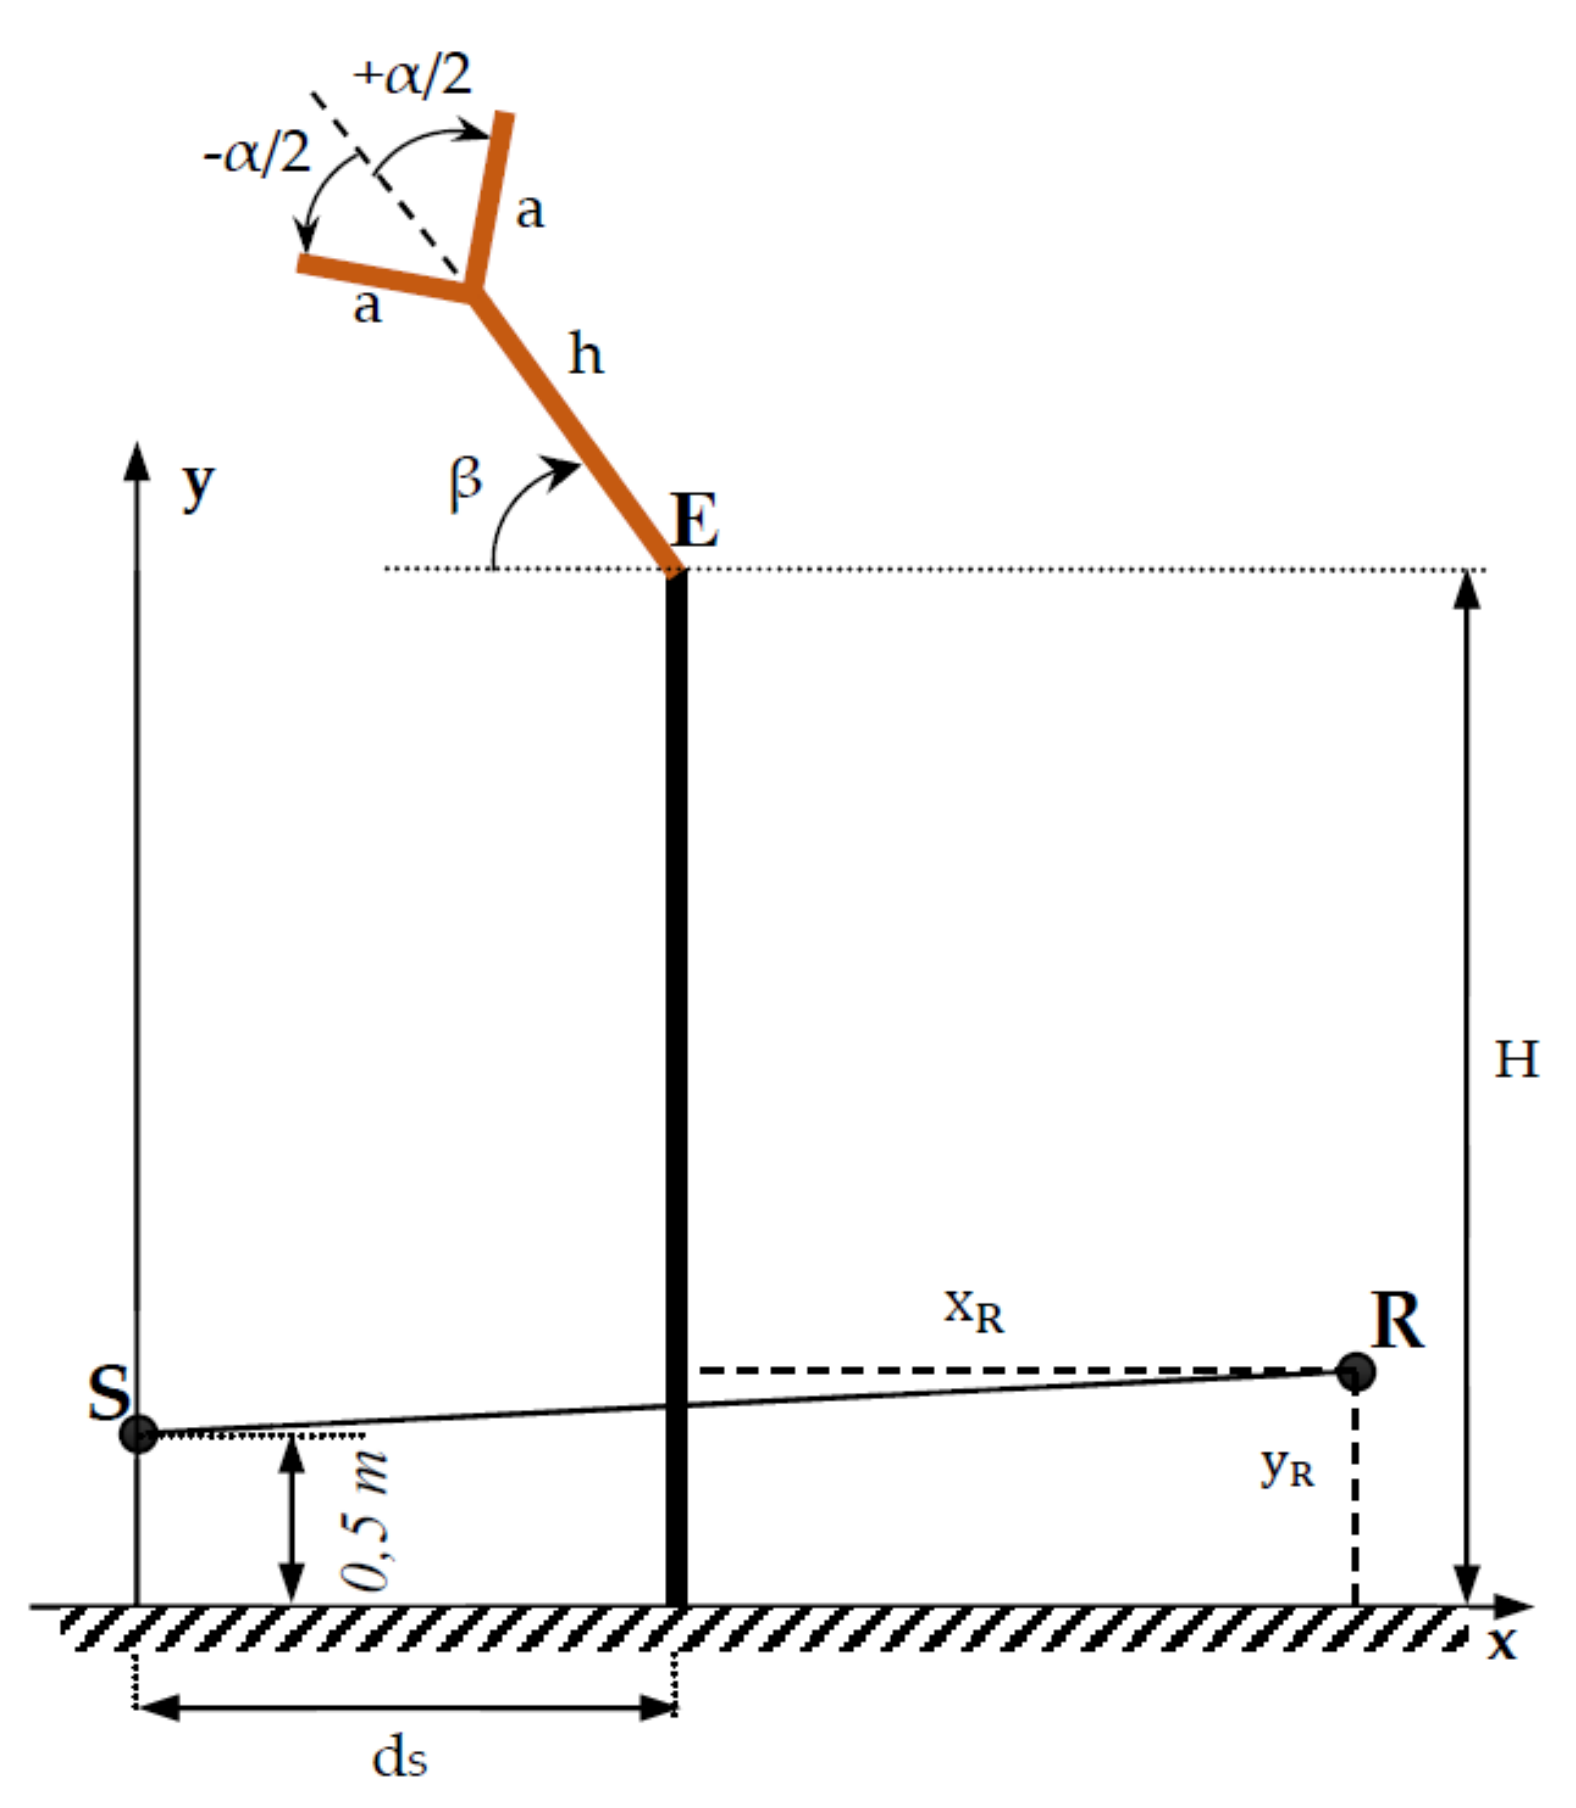
In Figure 1, a semi-infinite thin barrier is presented, which includes the height H, an acoustic source S at the distance ds from the barrier on the left side, a receiver R at the height on the right side, and the distance . Here, the source produces only pure tones and is at 0.5 m over the ground. If we choose the plane referential system, with the x-axis at the “ground zero” and horizontal, as well as the y-axis passing through S and vertical, then the coordinates of the receiver are R () with respect to the system coordinate. Based on the Kirchhoff-Fresnel diffraction theory [10], the Fresnel numbers of the source S and the image of the source S′ (the symmetric geometric point with respect to the plane of the barrier) are N1 and N2, given by the relations:
where f is the frequency in Hz of a pure tone, c is the sound velocity in the air, and δ1 and δ2 are the differences between the diffraction path S-E-R and the shortest path S-R, respectively S′-R, given by the relations:
The attenuation of a thin rigid barrier given by the Maekawa-Tatge formulation [1,2], based only on the source Fresnel number N1, is:
A better approach was given by Kurze and Anderson [3]. Based on the same source Fresnel number N1, the relation of the sound attenuation of pure tones with a thin rigid barrier is:
The GPM [4,5] provides a relation for the sound attenuation based on a modified Fresnel number N1 as mentioned in ISO 9613-2 [5], taking into consideration a correction factor for the downwind meteorological effect Kmet, given by the relation:
With this correction factor Kmet, the modified Fresnel number of the source is:
and therefore, the sound attenuation of a thin rigid barrier, considered by GPM, is:
The GPM is used in the software Sound PLAN for the prediction of the sound attenuation using rigid thin barriers. As can be seen, Relation (9) given by GPM, is like the Maekawa-Tatge approach for the sound attenuation, given by Relation (5).
The Menounou formulation [6] for the sound attenuation of a thin rigid barrier is the most complex approach since it takes into consideration both Fresnel numbers by involving the next effects: The relative position of the receiver from the source (involving only the Fresnel number N1), the proximity of the source or the receiver to the midplane (involving the ratio N2/N1), the proximity of the receiver to the shadow boundary (involving both Fresnel numbers N1 and N2), the diffraction effect due to spherical incident waves. The noise attenuation for a semi-infinite rigid barrier, using the Menounou formulation and considering pure tones, is given by the relation:
where the sound attenuation, given by the effect of the relative position of the receiver from the source, is:
the sound attenuation, given by the effect of the proximity of the source or the receiver to the midplane, is:
the sound attenuation, given by the effect of the proximity of the receiver to the shadow boundary, is:
and the sound attenuation, given by the diffraction effect due to spherical incident waves, is:
3. The Improvements of GPM
The most used method for the prediction of noise attenuation is GPM [5] since the ISO 9613-2 standard prescribed the model of attenuation. However, this method must be improved by considering at least two phenomena: The ground absorption-reflections and the atmospheric absorption. To consider the attenuation introduced by ground absorption-reflections, the most convenient model was used, the Delany-Bazley model [7]. This model takes into consideration the effective flow resistivity of the ground σe and the frequency of the pure tone sound f. By modifying the propagation constant k (known as wave number) of the sound in the air, given by the frequency of pure tones and the sound speed in the air c, the normal is given by the relation:
using an empirical factor αgr, thus the modified propagation constant is given by the relation:
where αgr is:
Accordingly, the Fresnel numbers N1 and N2, given by the Relations (1) and (2), are modified in the same way as Relations (15)–(17).
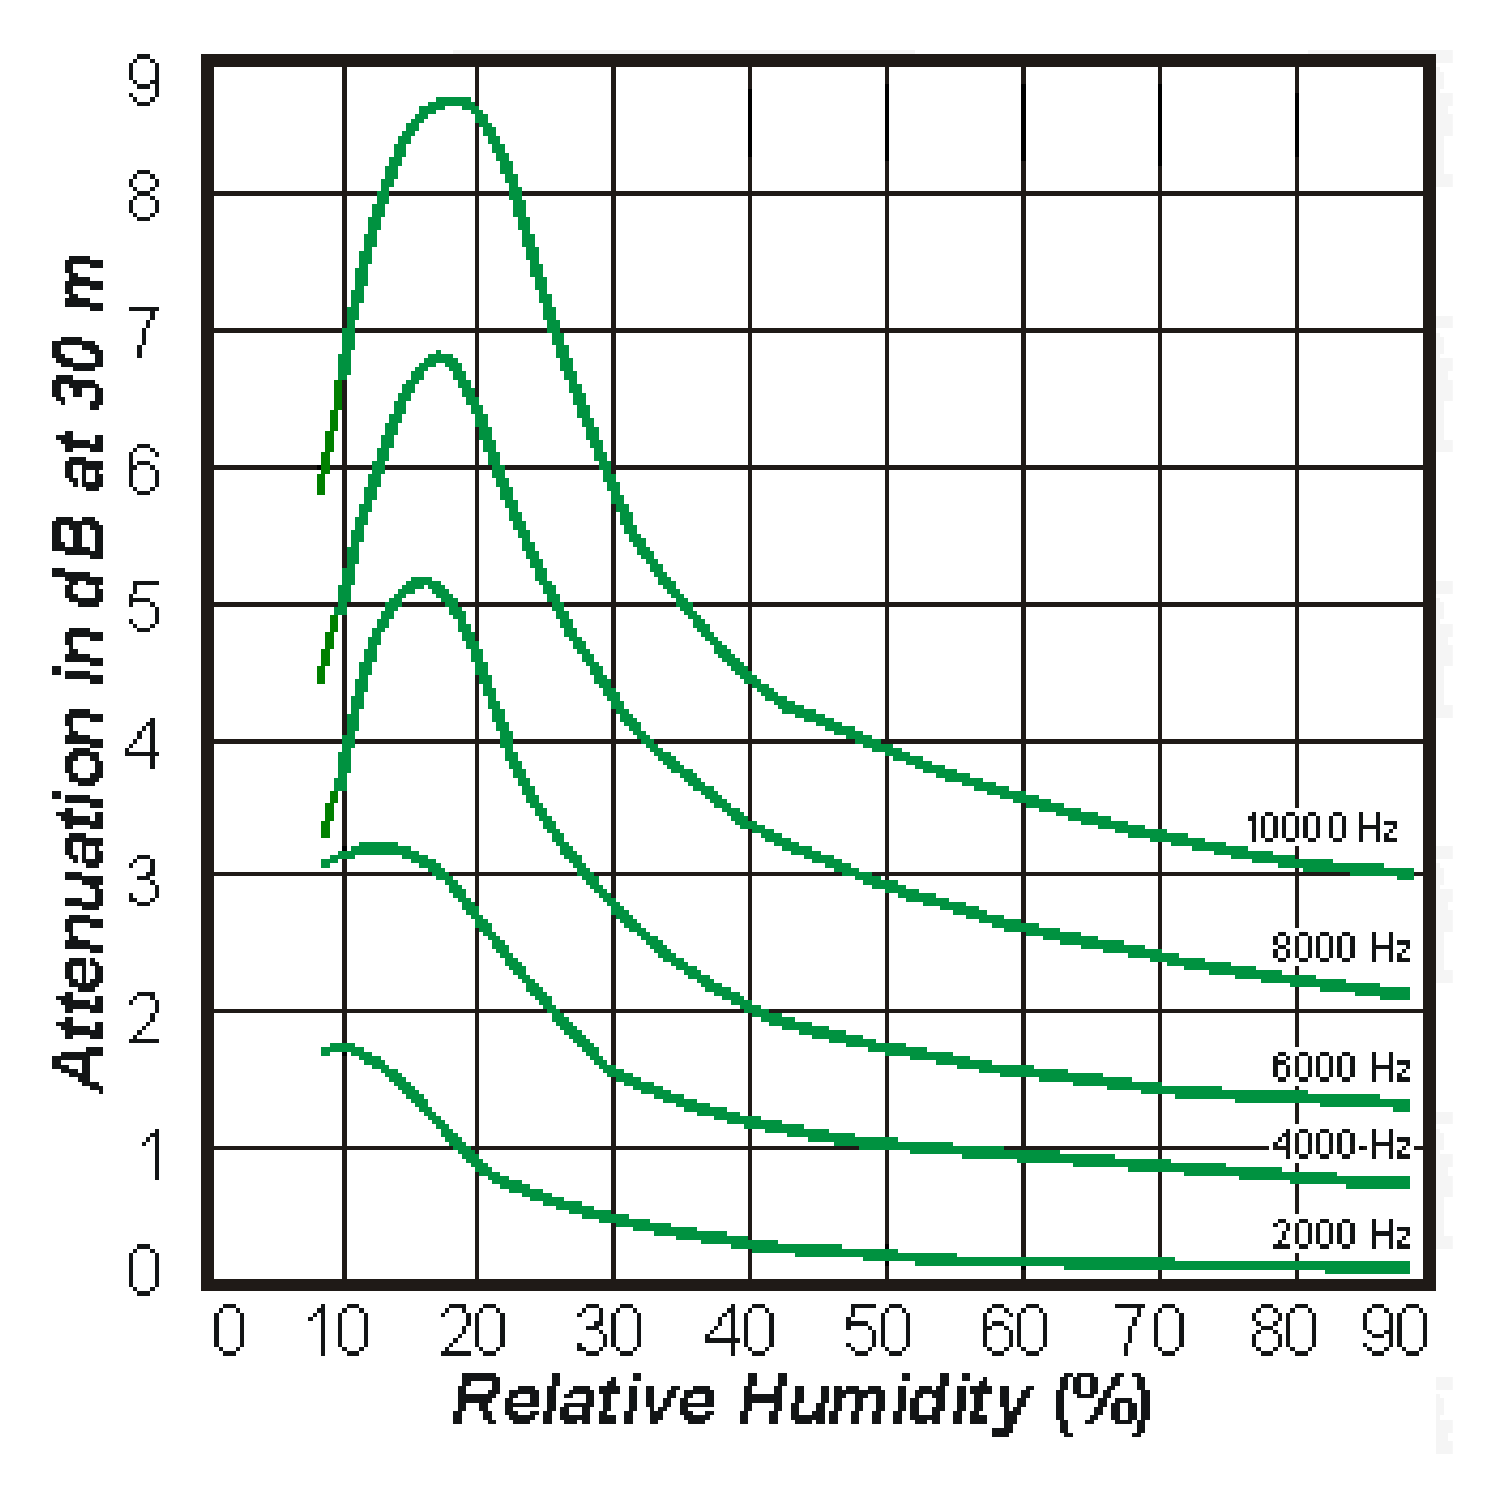
The atmospheric absorption is considered using the Larsson model [8], which considers the next effects: Sound frequency, air humidity, air temperature, and pressure, using an attenuation coefficient αaa, expressed in dBA/m, given by the relation:
where f is the sound frequency, T is the absolute temperature of the atmosphere in Kelvin0, T0 = 293.15 K, ps is the atmospheric pressure, p0 = 101.325 kPa, and fr,N and fr,O are the relaxation frequencies associated with the vibration of nitrogen and oxygen molecules. The sound attenuation due to atmospheric absorption, in the case of a rigid thin barrier (see Figure 1), is:
Taking into consideration this effect as well as the ground absorption, after correcting the Fresnel numbers N1 and N2 that were used in Relations (5), (6) and (8)–(14) using Relations (16) and (17), it is necessary to add the correction given by Relations (18) and (19) in the modified Relations (5), (6), (9) and (10). Based on the ISO 9613-1 standard [9], in Figure 2, the sound attenuation is presented at 30 m distance between the source and receiver as a function of sound frequency and the relative humidity of the air at several frequencies of pure tones (2–10 kHz).
In Appendix A, the mathematical algorithm of the modified GPM is presented in detail, taking into consideration the next attenuation phenomena for the thin rigid acoustic barrier: Downwind meteorological effect that involves the modification of the source Fresnel number N1 as well as Fresnel number N2, the proximity of the source or the receiver to the midplane (involving the ratio N2/N1), the proximity of the receiver to the shadow boundary (involving both Fresnel numbers N1 and N2), the effect of the ground absorption-reflections based on the Delany-Bazley model [7], and the effect of atmospheric absorption based on the Larson model [8].
4. Analyses of Numerical Simulations and Discussion
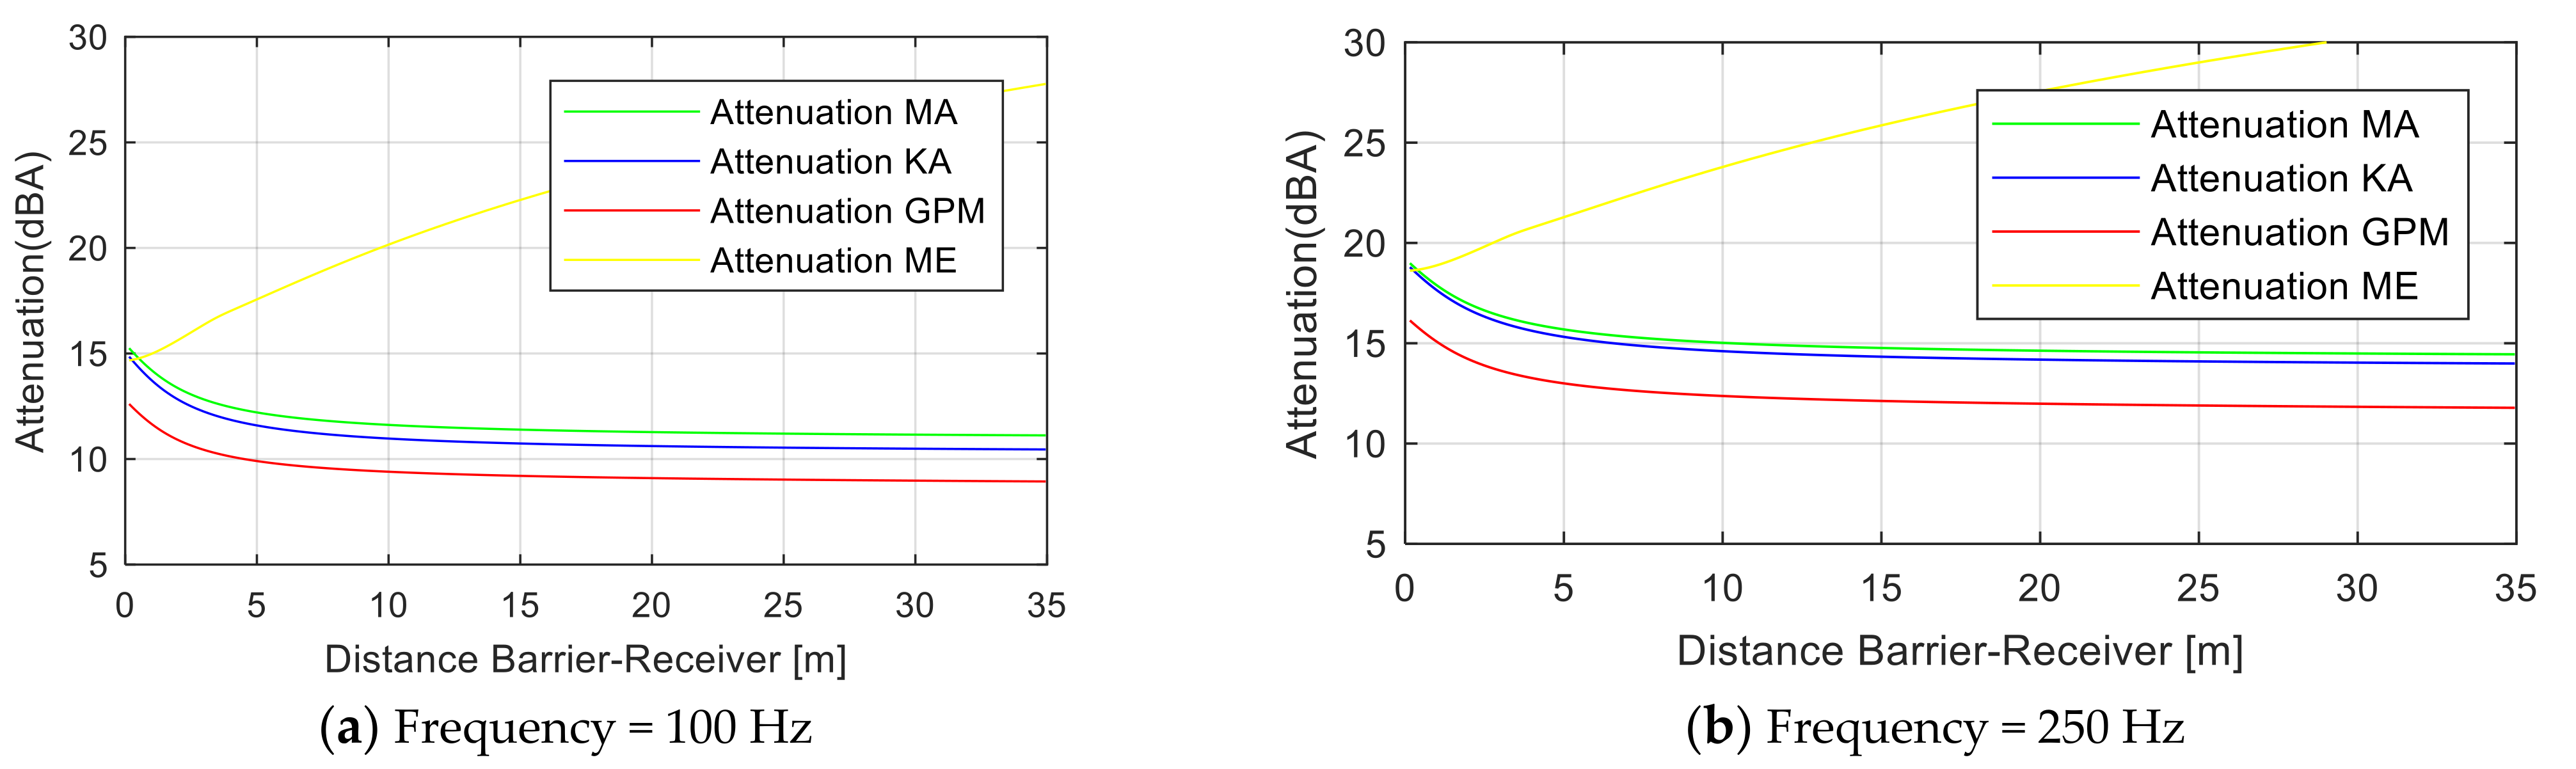
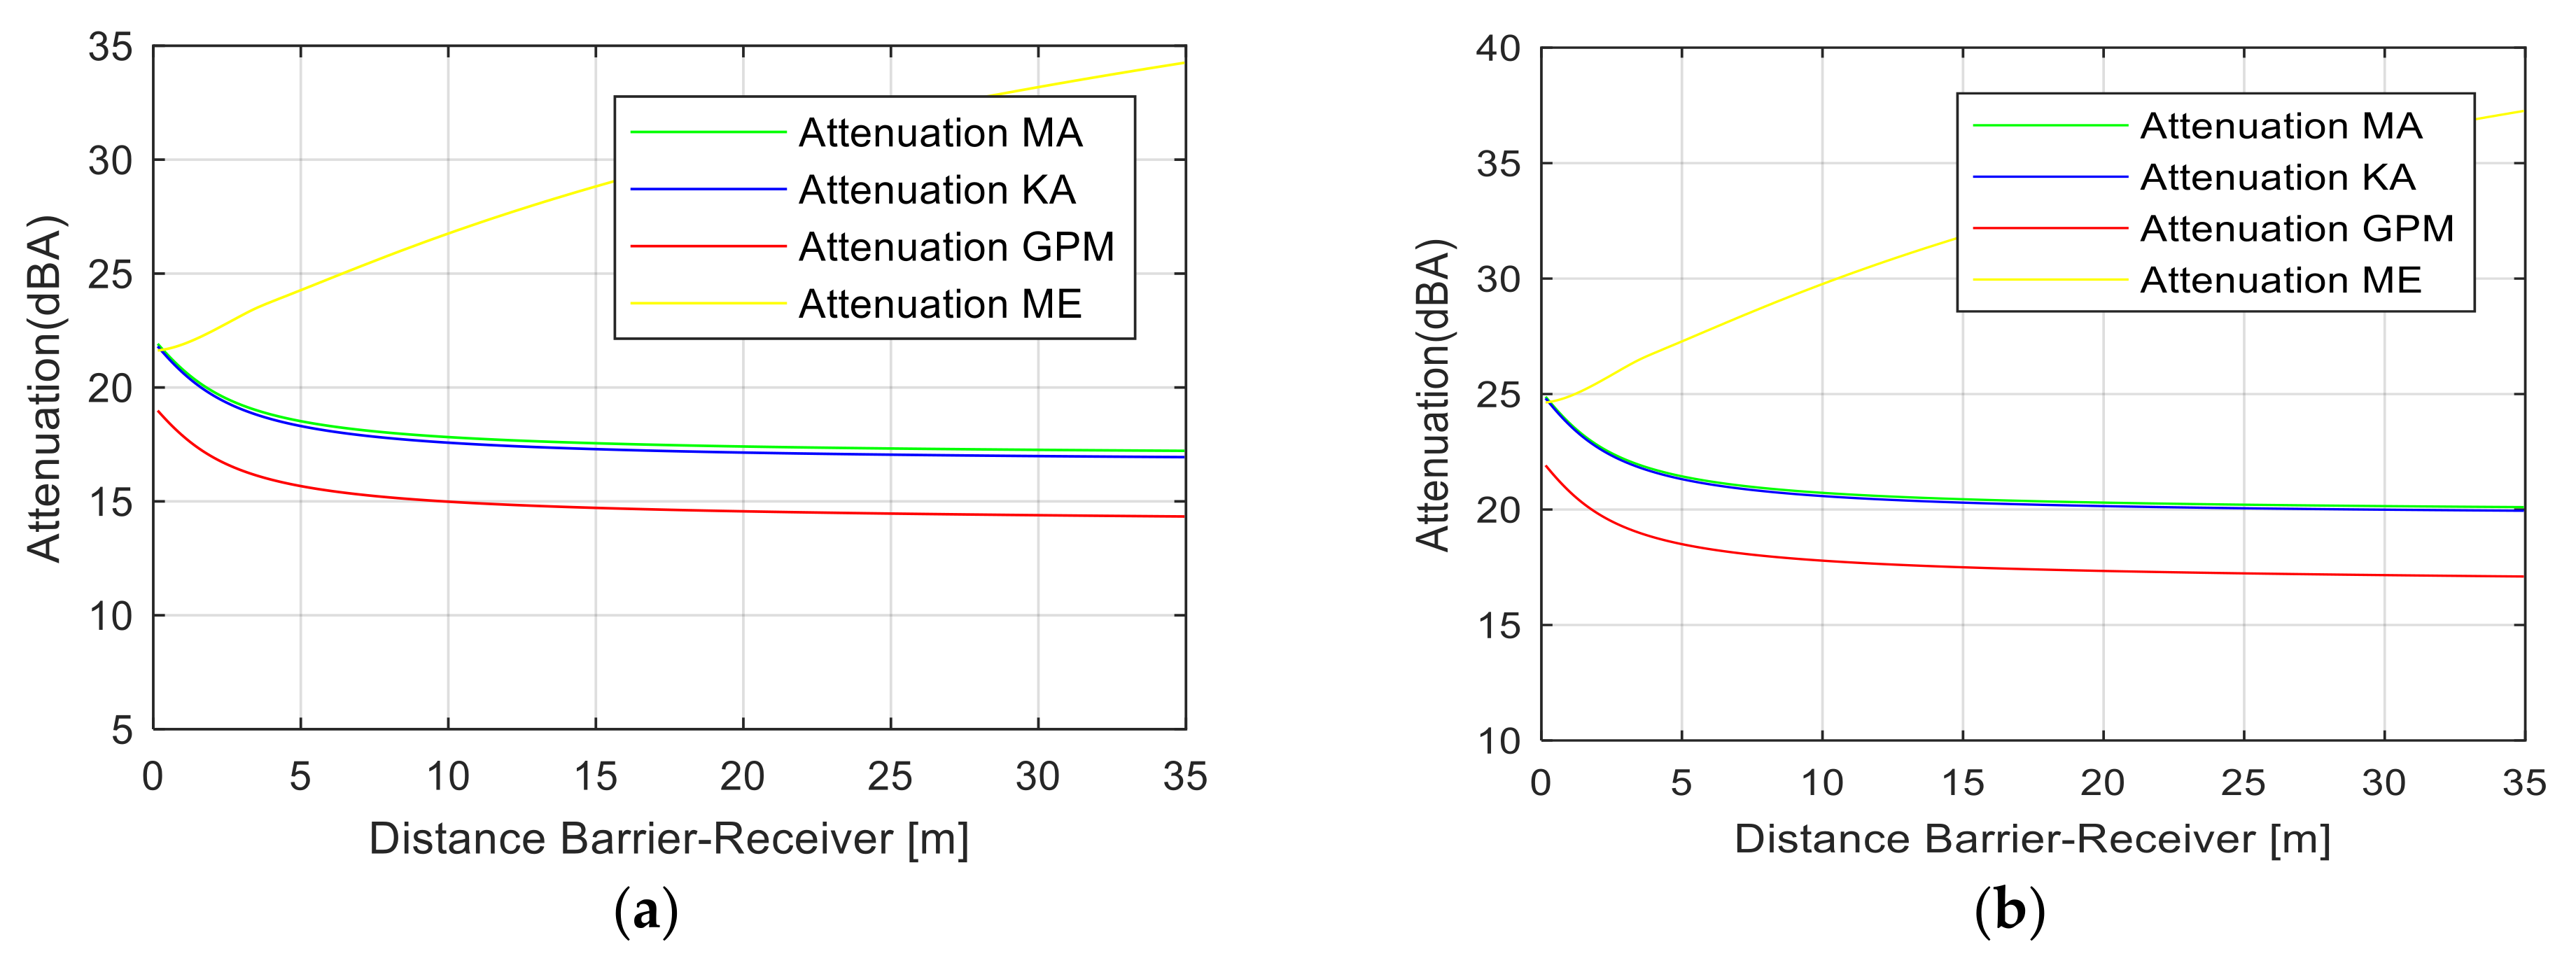
Using Relations (1)–(14), a MATLAB software was developed to compute the sound attenuation of pure tones for the previously mentioned acoustic rigid semi-infinite thin barrier considering: Maekawa-Tatge formulation [1,2], Kurze and Anderson algorithm [3], general prediction method (GPM-ISO 9613) [4,5], and Menounou formulation [6]. The simulations were all represented without the ground effect and the atmospheric sound absorption. As can be seen from Figure 3 and Figure 4, the Maekawa-Tatge approach and Kurze and Anderson algorithm are approximately the same, while the GPM approach gives a difference of less than 3–3.5 dBA with respect to the first two methods. In addition, the Menounou method gives an “over attenuation”. In Figure 3 and Figure 4, the sound attenuation [dBA] of pure tones is presented for an acoustic rigid semi-infinite thin barrier, including a height over the ground of 3 m, the source S is placed at the distance of 3.5 m from the barrier at a height of 0.5 m over the ground, the receiver R is placed at a varying distance from the barrier 0.15 to 35 m at a height of 1.0 m over the ground for different frequencies of sound at 100, 250, 500, and 1000 Hz.
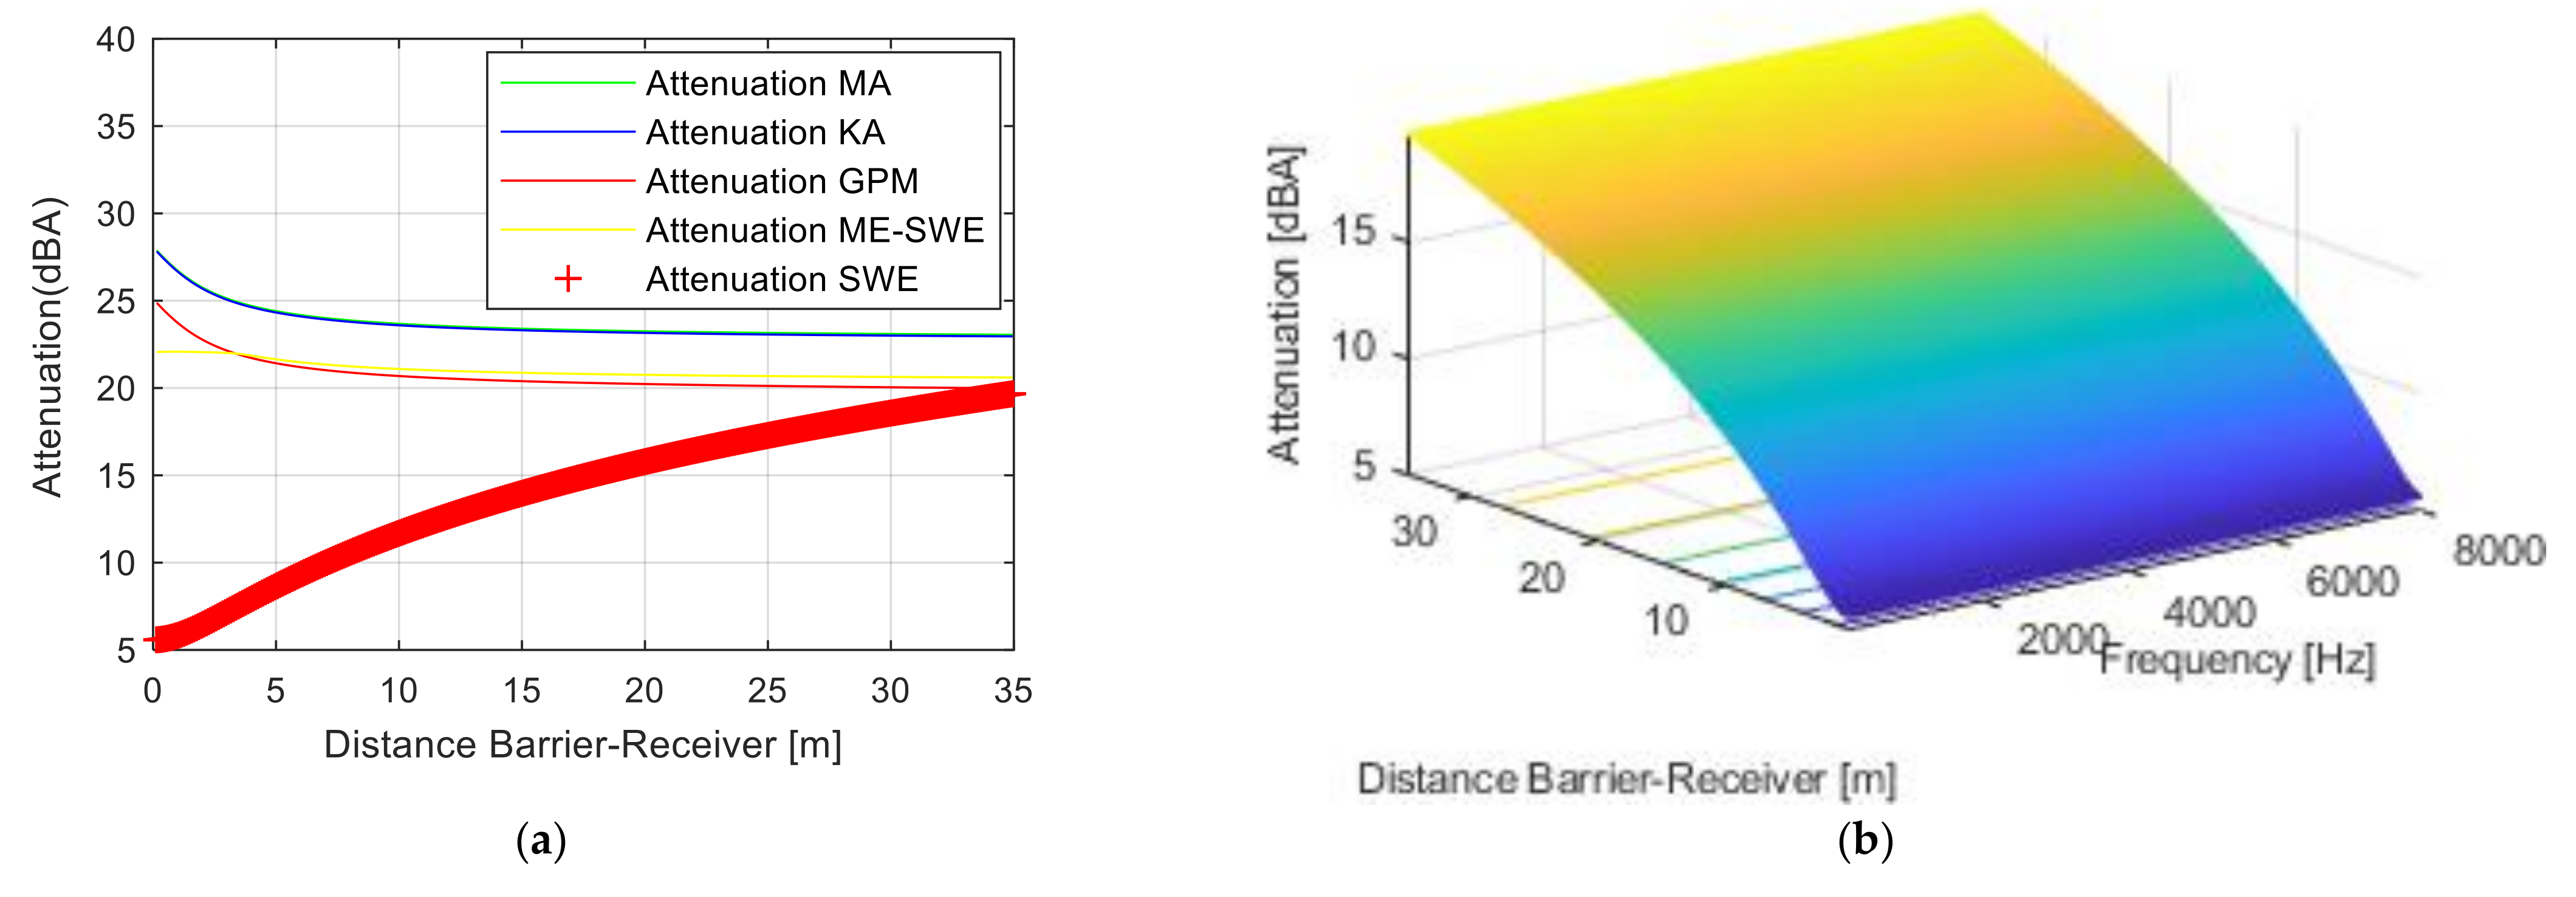
In Figure 5a, the sound attenuation is represented for all the four methods at the sound frequency of 2000 Hz. However, the attenuation was represented separately due to the spherical wave propagation (SWE in Figure 5a). In addition, from the attenuation given by Menounou, the attenuation was subtracted due to the spherical wave propagation (SWE).
In Figure 5b, the attenuation due only to the spherical wave propagation (spherical wave effect (SWE)) is presented. Therefore, it can be seen now that the attenuation due to the spherical wave propagation (SWE) introduces the “over attenuation” in the Menounou approach. As a result, the last term in Equation (10), given by Relation (14), will be changed to zero starting from this point forward for the attenuation given by the Menounou approach.
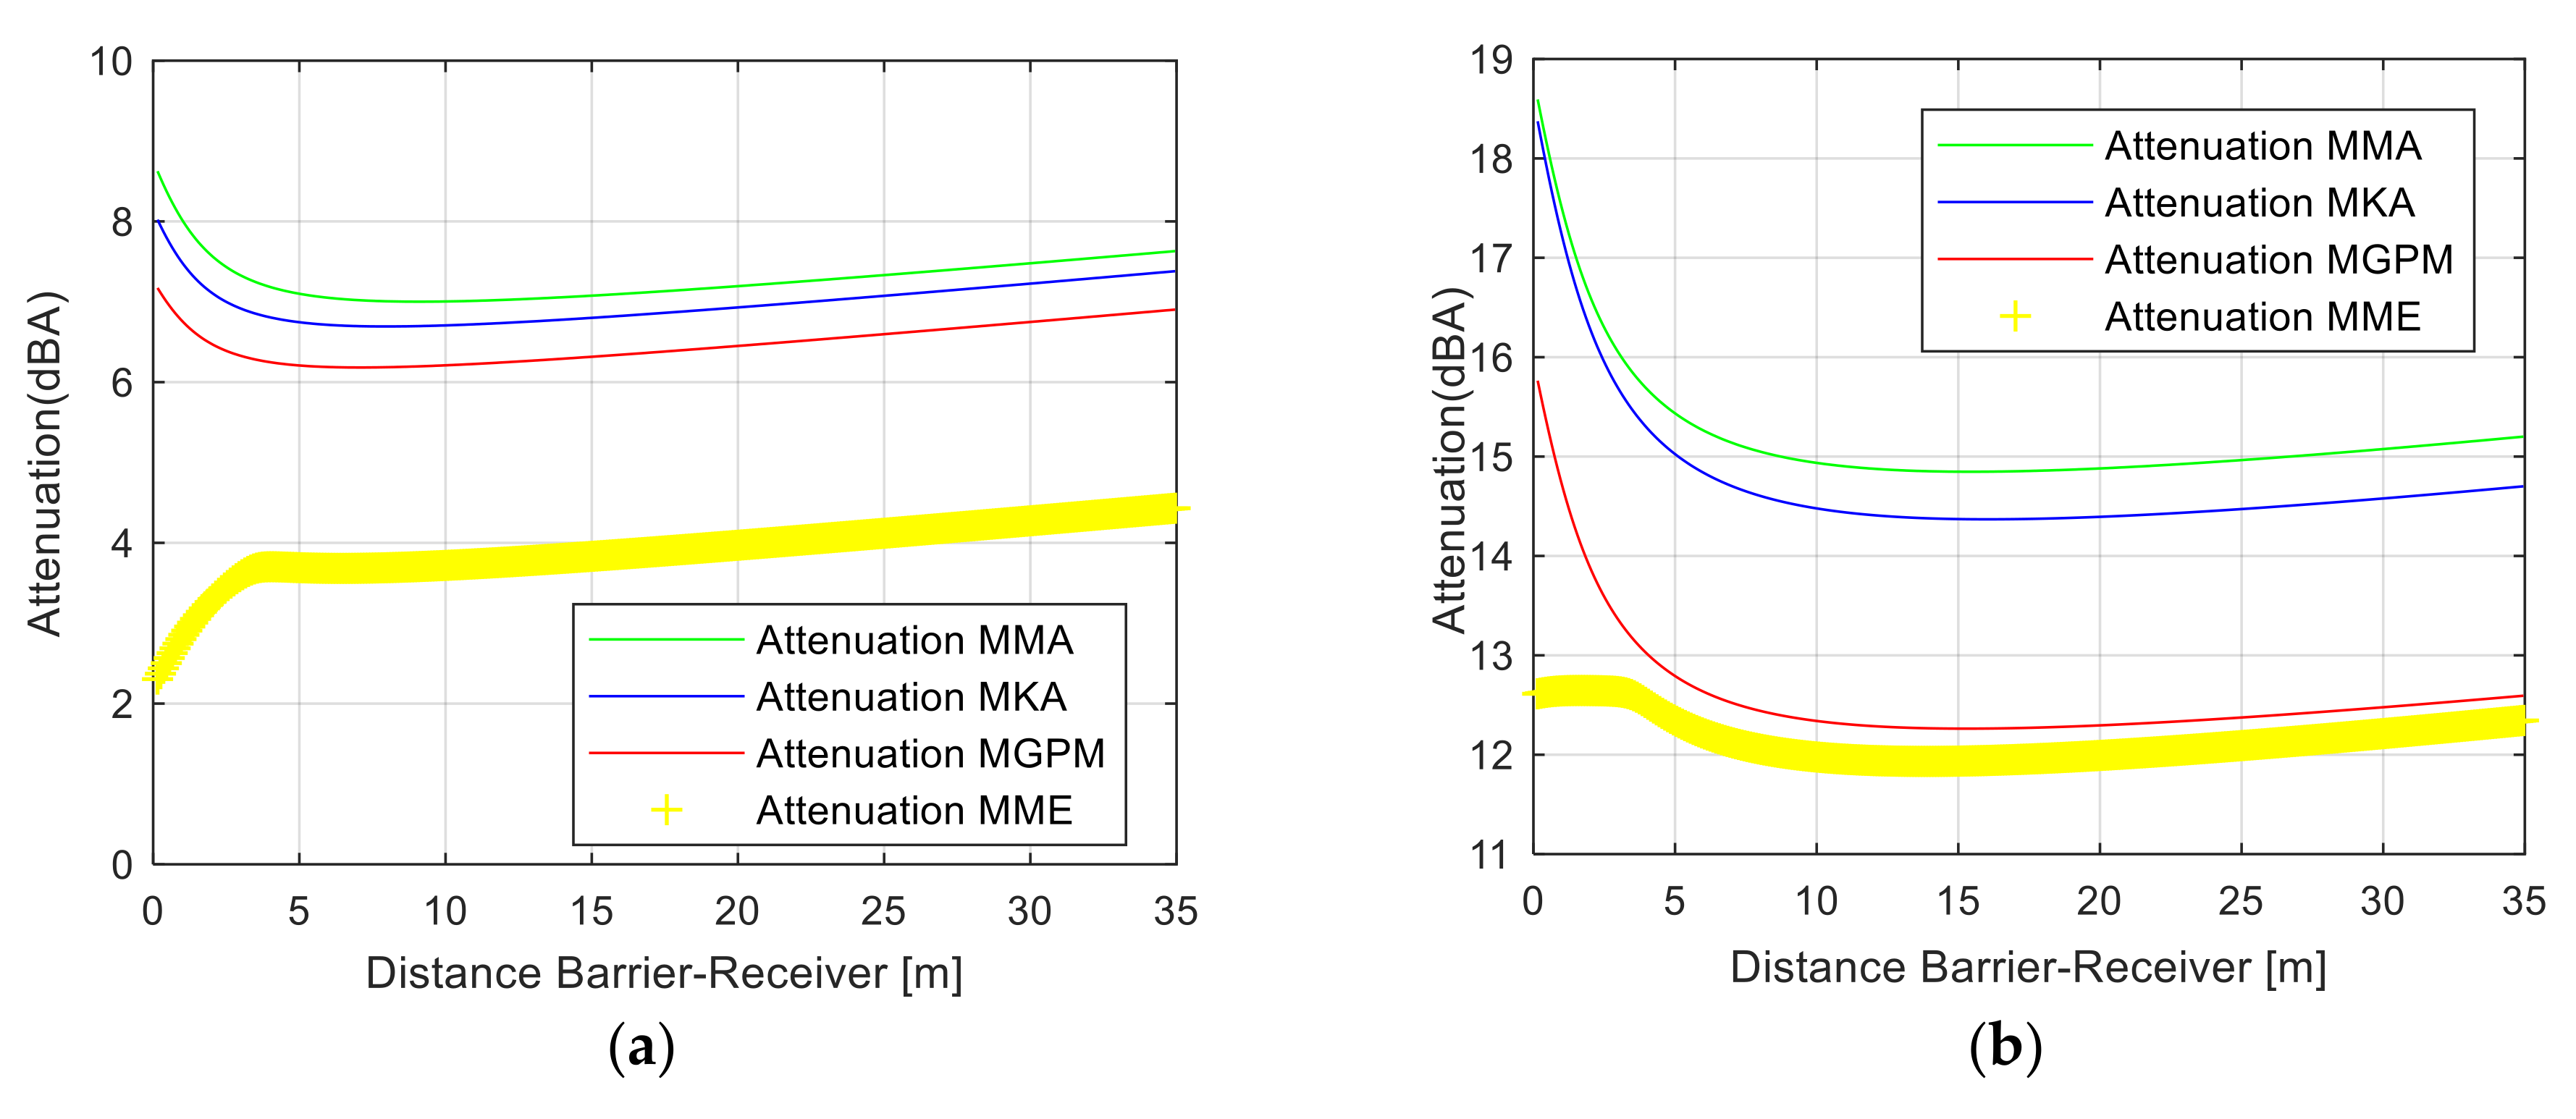
In Figure 6a,b, the effect of ground (ground absorption as well as ground reflections) was considered, given by Equations (16) and (17), as well as air absorption given by Relations (18) and (19) for a relative humidity of the air of 20%, for two values of effective flow resistivity of the ground σe = 10 MPa s m−2 and σe = 104 kPa s m−2, and the sound frequency of 1000 Hz for all of the four approaches: Maekawa-Tatge approach, Kurze and Anderson algorithm, GPM, and Menounou-SWE formulation. This indicates that all the methods are modified by these two effects: Ground absorption-reflections and air humidity (in the figures. The approaches are marked as follows: MMA-Modified Maekawa, MKA-Modified Kurze and Anderson, MGPM-Modified GPM, and MME-Modified Menounou). As can be seen from these two figures, when the ground is “hard”, the flow resistivity of the ground is over 1 MPa·s·m−2. Here, all the modified formulations introduce the ground reflections and the sound attenuation is lower, while if the flow resistivity of the ground is less than 30 kPa·s·m−2, the ground reflections disappear and due to the ground sound absorption, the sound attenuation given by all the approaches increases.
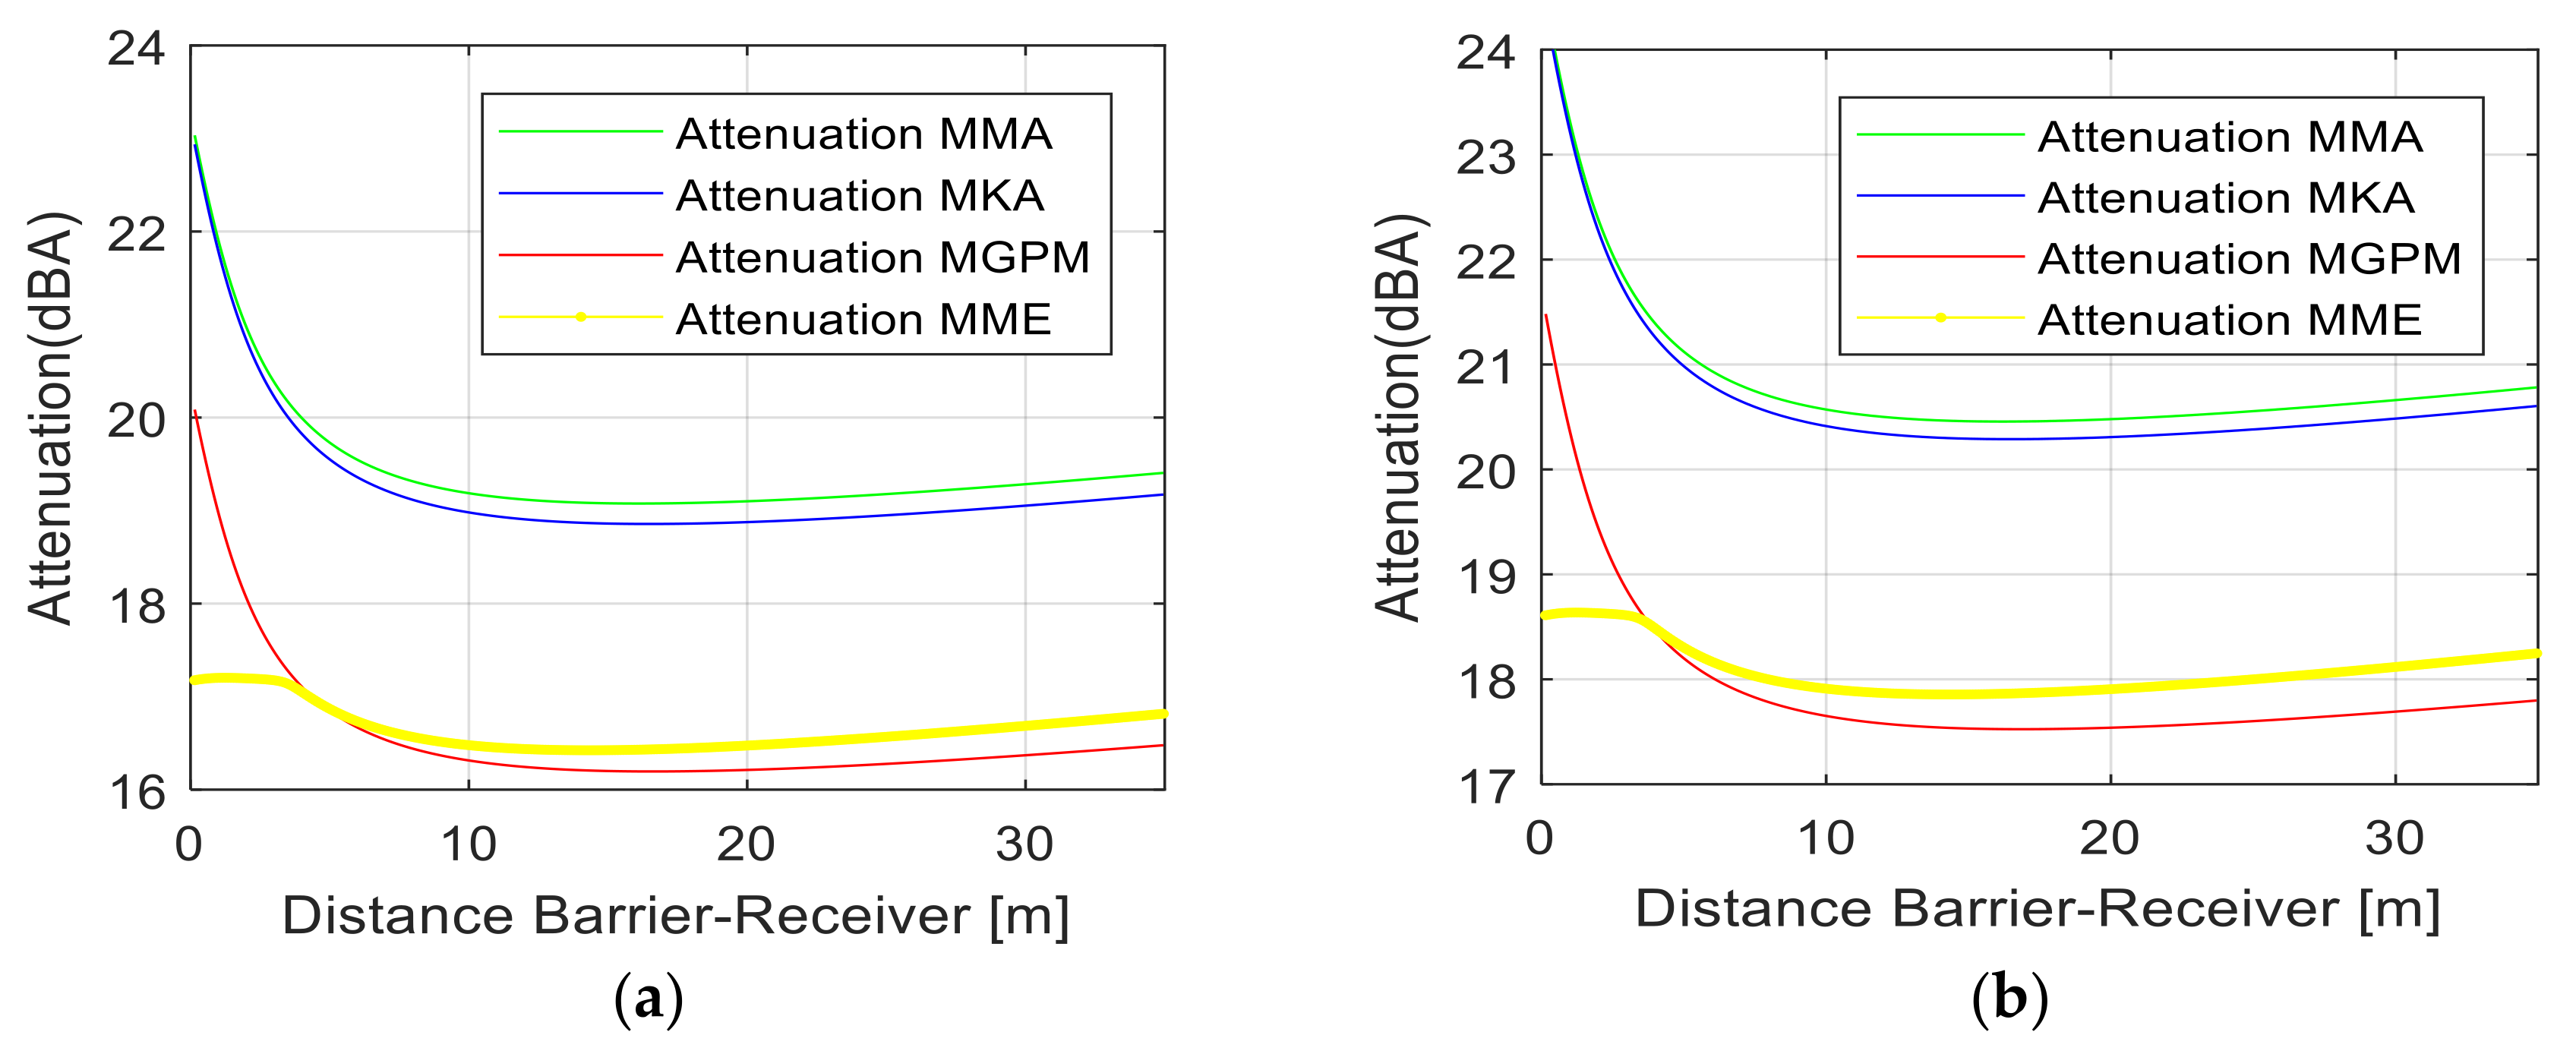
In Figure 7a, for a relative air humidity of 20% and a flow resistivity of the ground of σe= 104 kPa·s·m−2, the sound attenuation for a sound frequency of 2000 Hz is presented. As can be seen, by analyzing Figure 6a,b and Figure 7a, the sound attenuation increases with the frequency of the sound. Using the complete modified GPM (MGPM) approach, this involves: The downwind meteorological effect given by Equations (7) and (8) as well as the effect of edge diffraction given by the Fresnel number N1; adding the effect of the proximity of the receiver to the shadow boundary given by Relation (14) including the second Fresnel number N2; the effect of sound air absorption, also used for the other approaches (Modified Maekawa-MMae), Modified Kurze and Anderson (MKA), Modified Menounou (MMen), given by Relations (18) and (19); and using the effects of ground absorption-reflections, given by Relations (15)–(17), to all of the methods. In Figure 7b, the results obtained include a sound frequency of 2500 Hz, relative air humidity of 20%, and a flow resistivity of the ground of σe = 104 kPa·s·m−2.
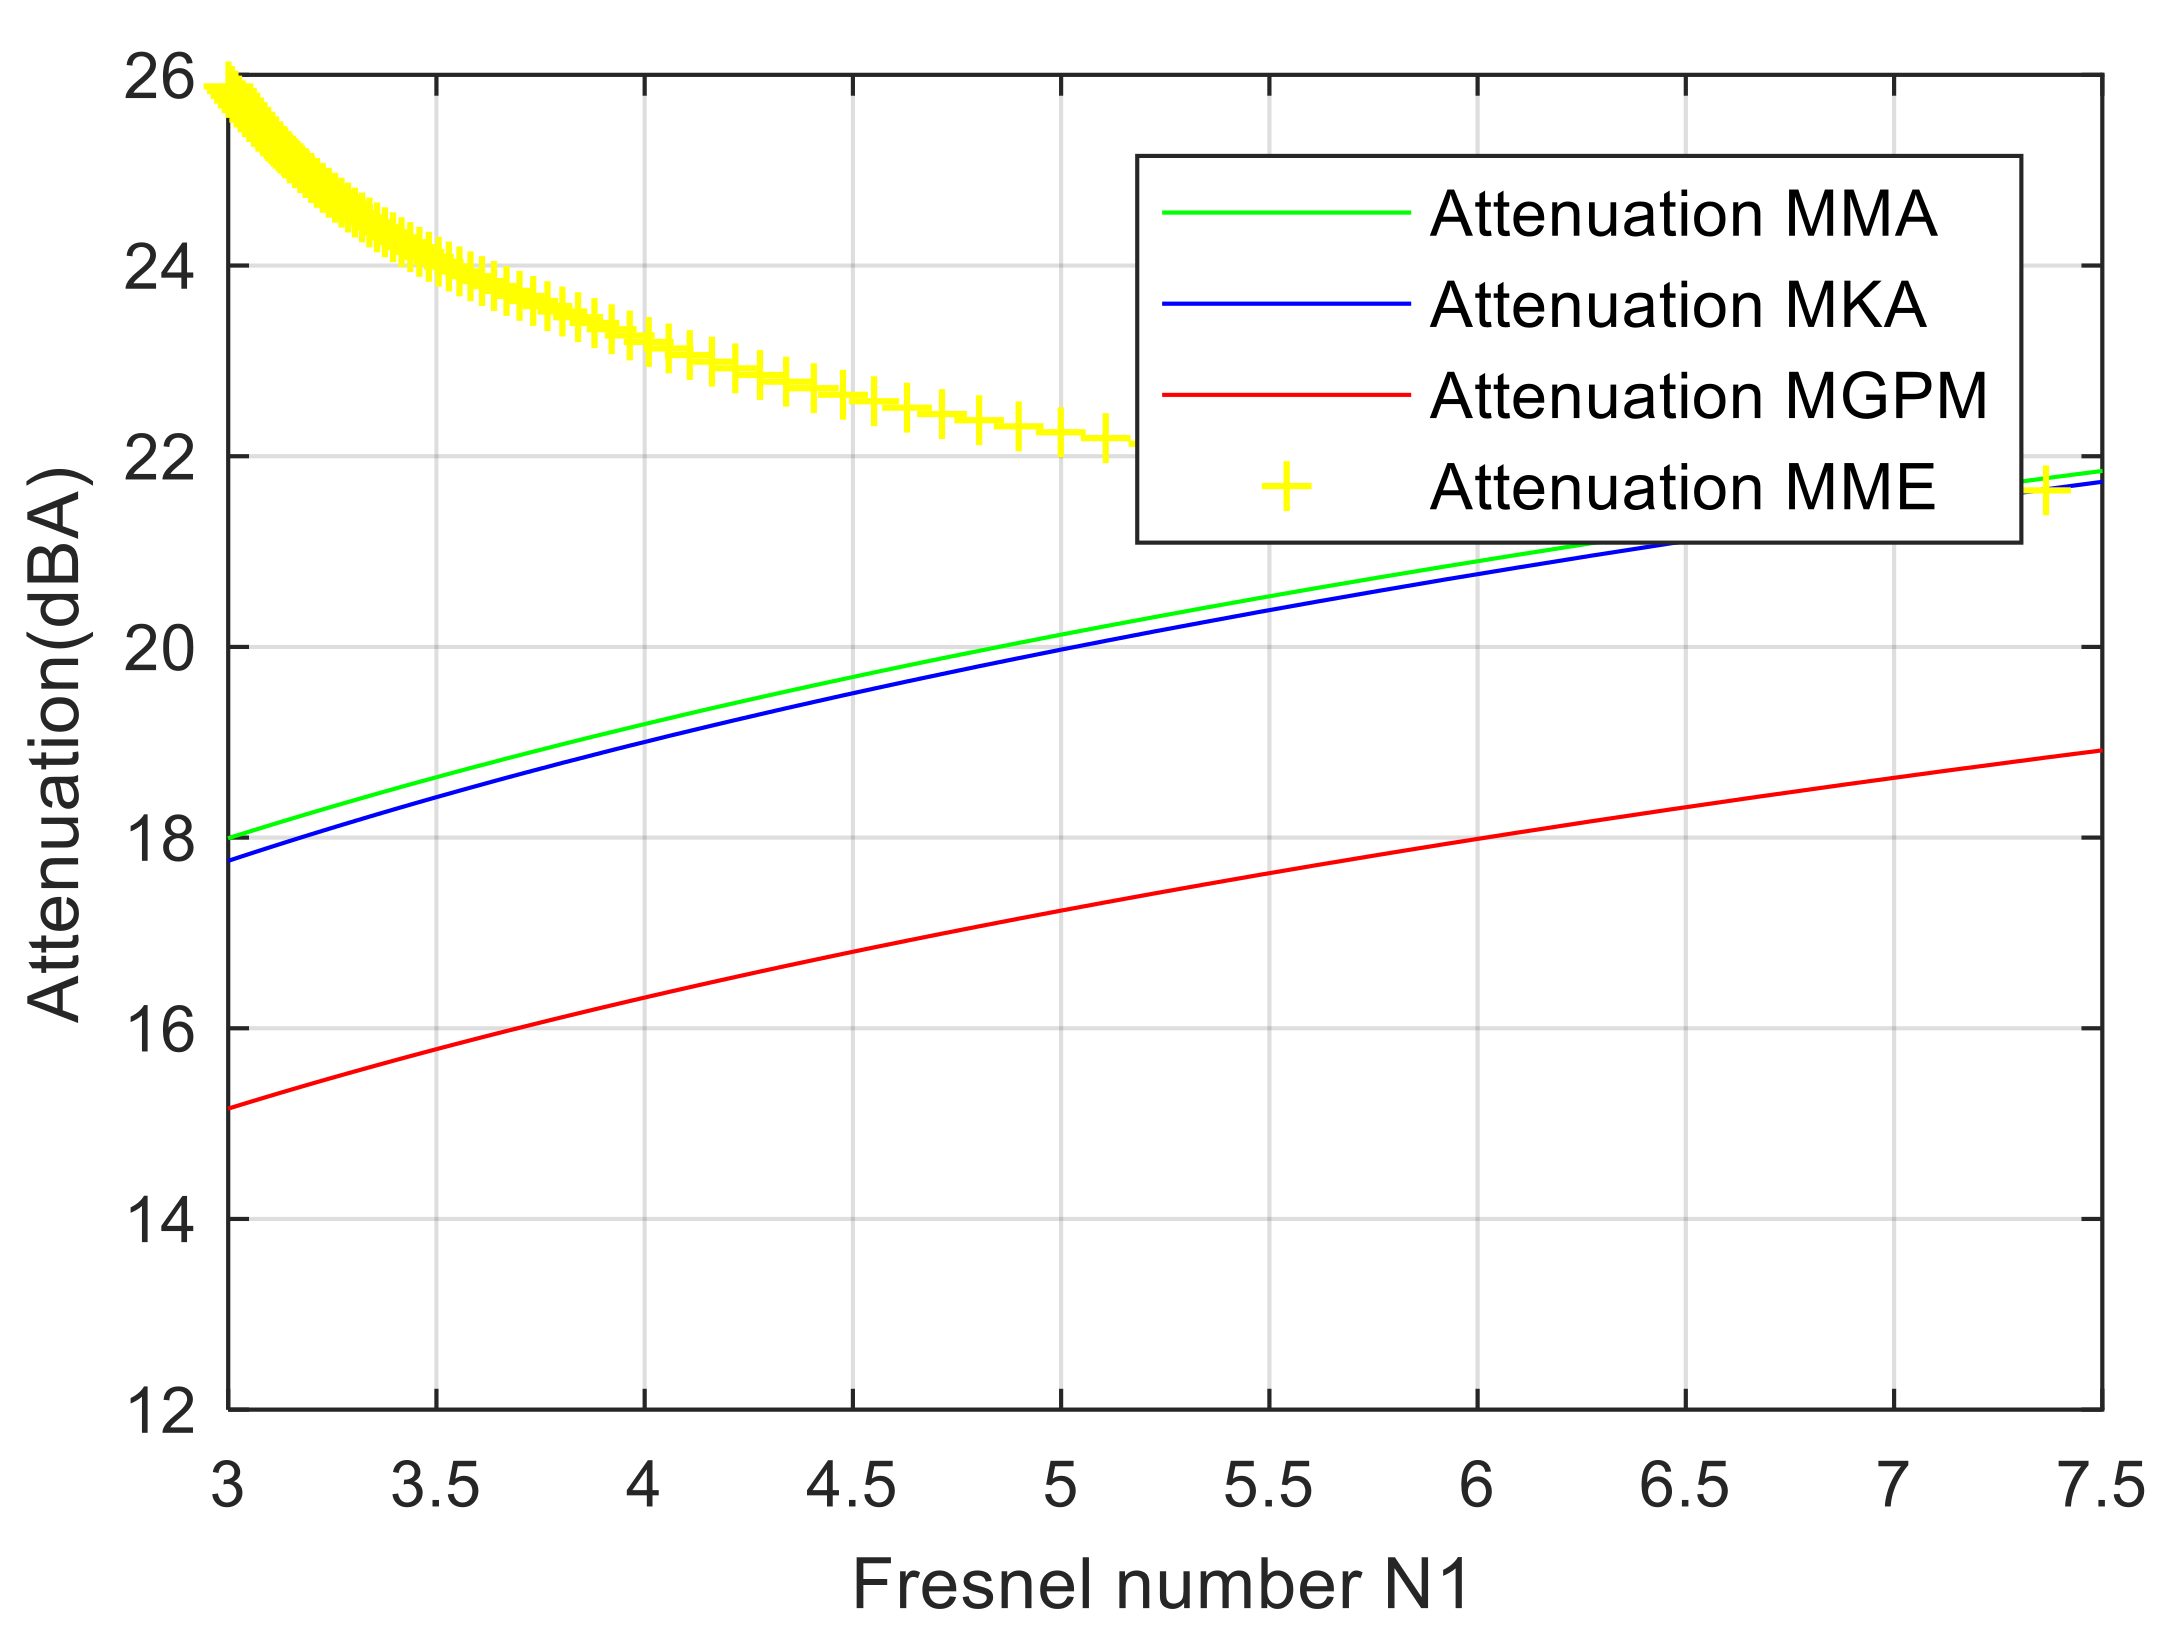
Comparing the results from Figure 7a with the experimental data in the literature [11,12] (p. 361 global experimental data in graphs), this method is in close agreement with the data published in MGPM. In Figure 8, the noise attenuation for all the four modified approaches (MMae, MKA, MGPM, MMen) is presented as a function of the Fresnel number N1, considering the relative air humidity of 20% and an effective flow resistivity of the ground of σe = 104 kPa·s·m−2.
Comparing the results presented in Figure 8 with the experimental data published in the literature [11,12] (p. 362), the algorithm that is closest to the experiments is the modified GPM (MGPM). This explains the reason that the Sound PLAN software for the prediction of the noise barrier attenuation uses GPM (ISO 9613-2). However, this must be corrected using MGPM. To certify that MGPM offers a better prediction than GPM, an y-shape edge barrier using the MGPM rather than GPM was optimized.
5. Case Study. The Y-Shape Edge Barrier Optimization and Discussion
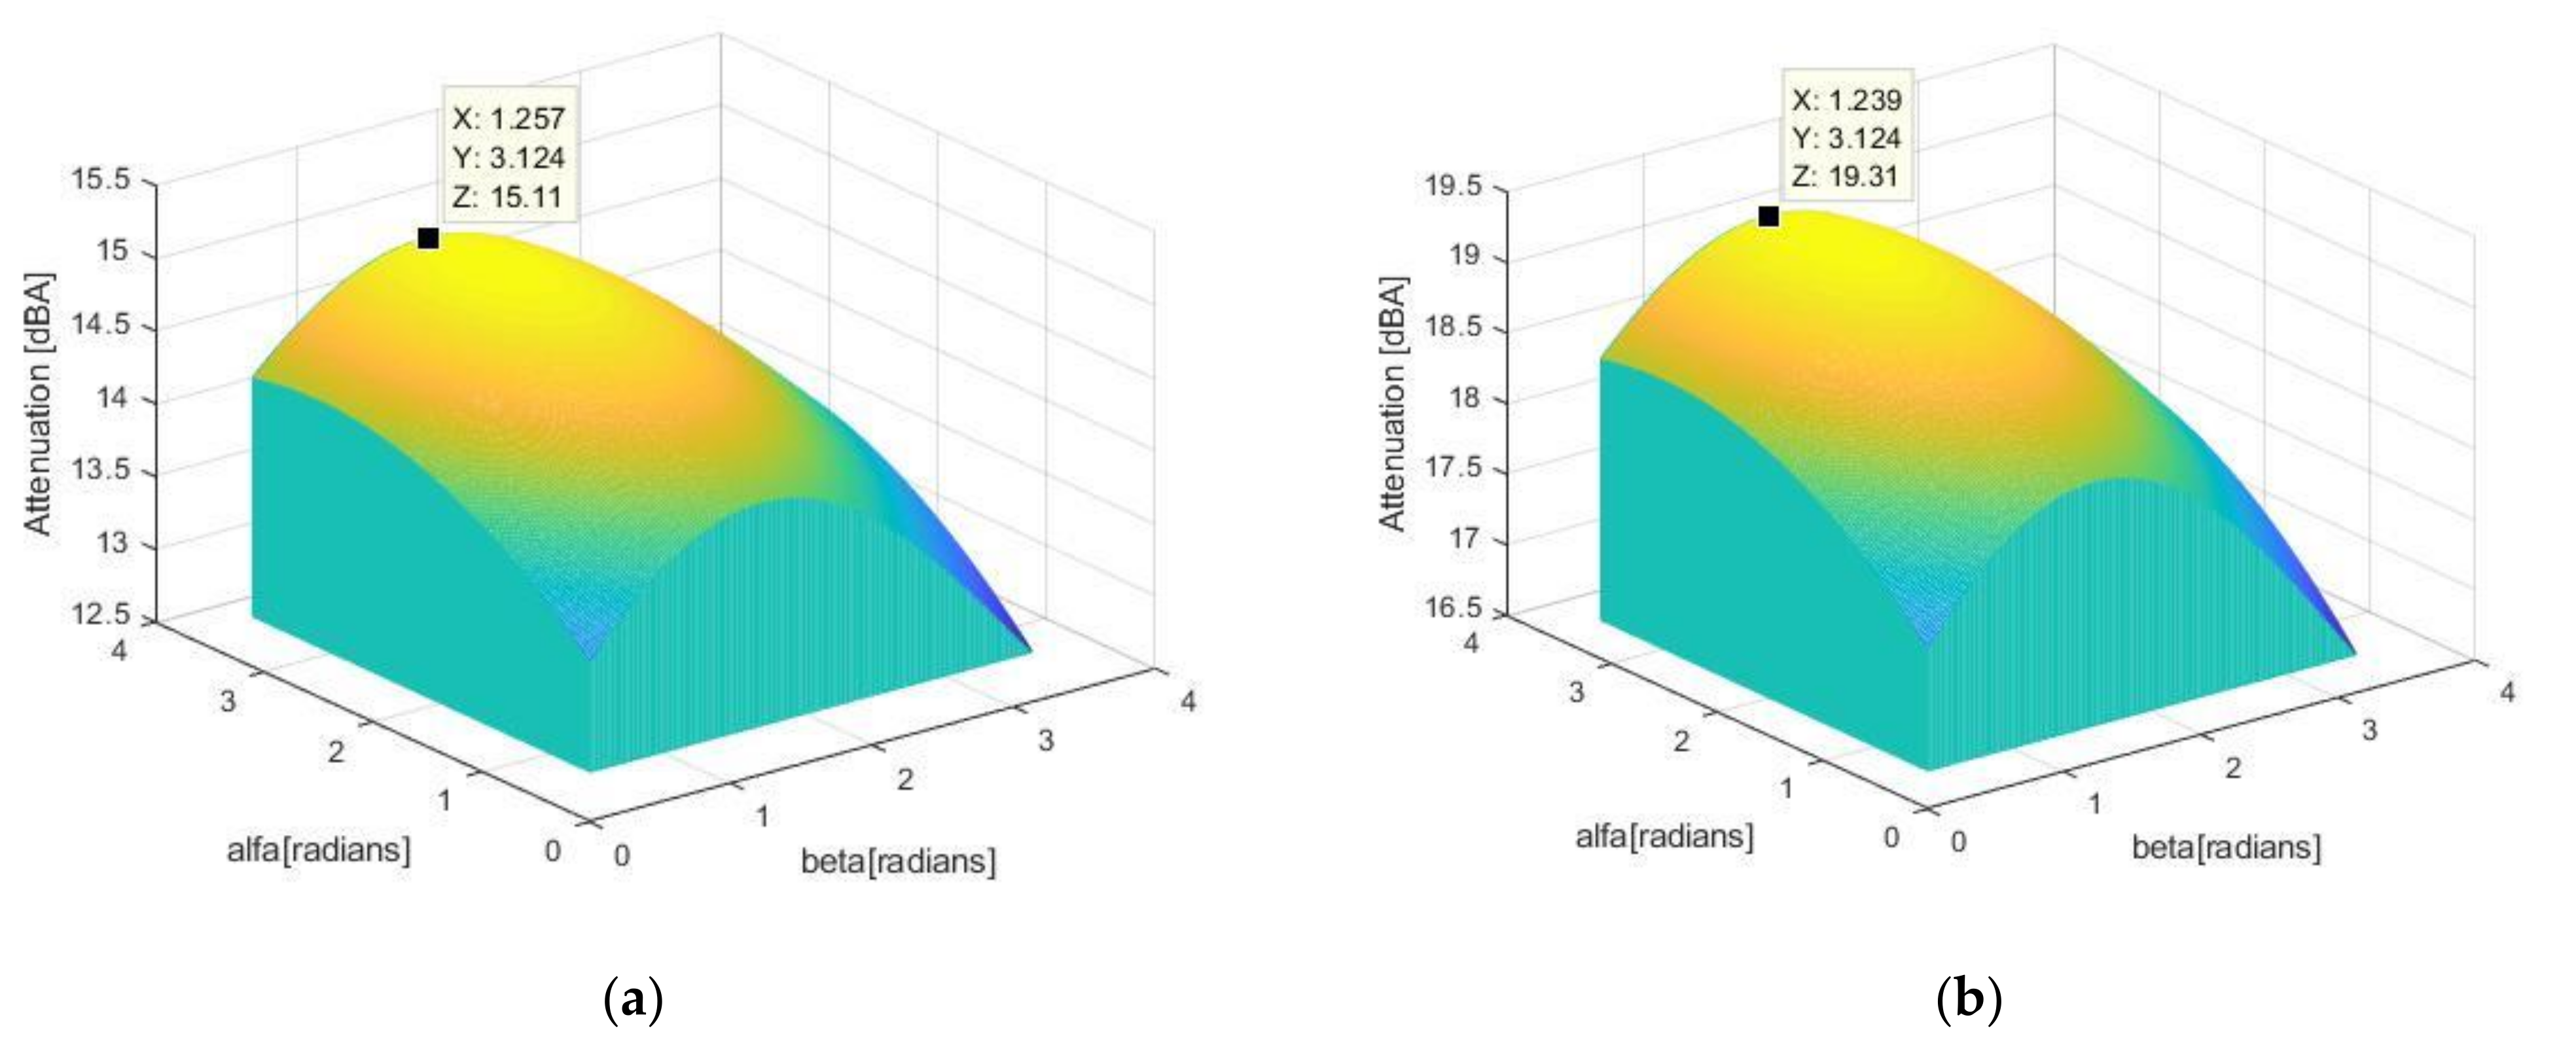
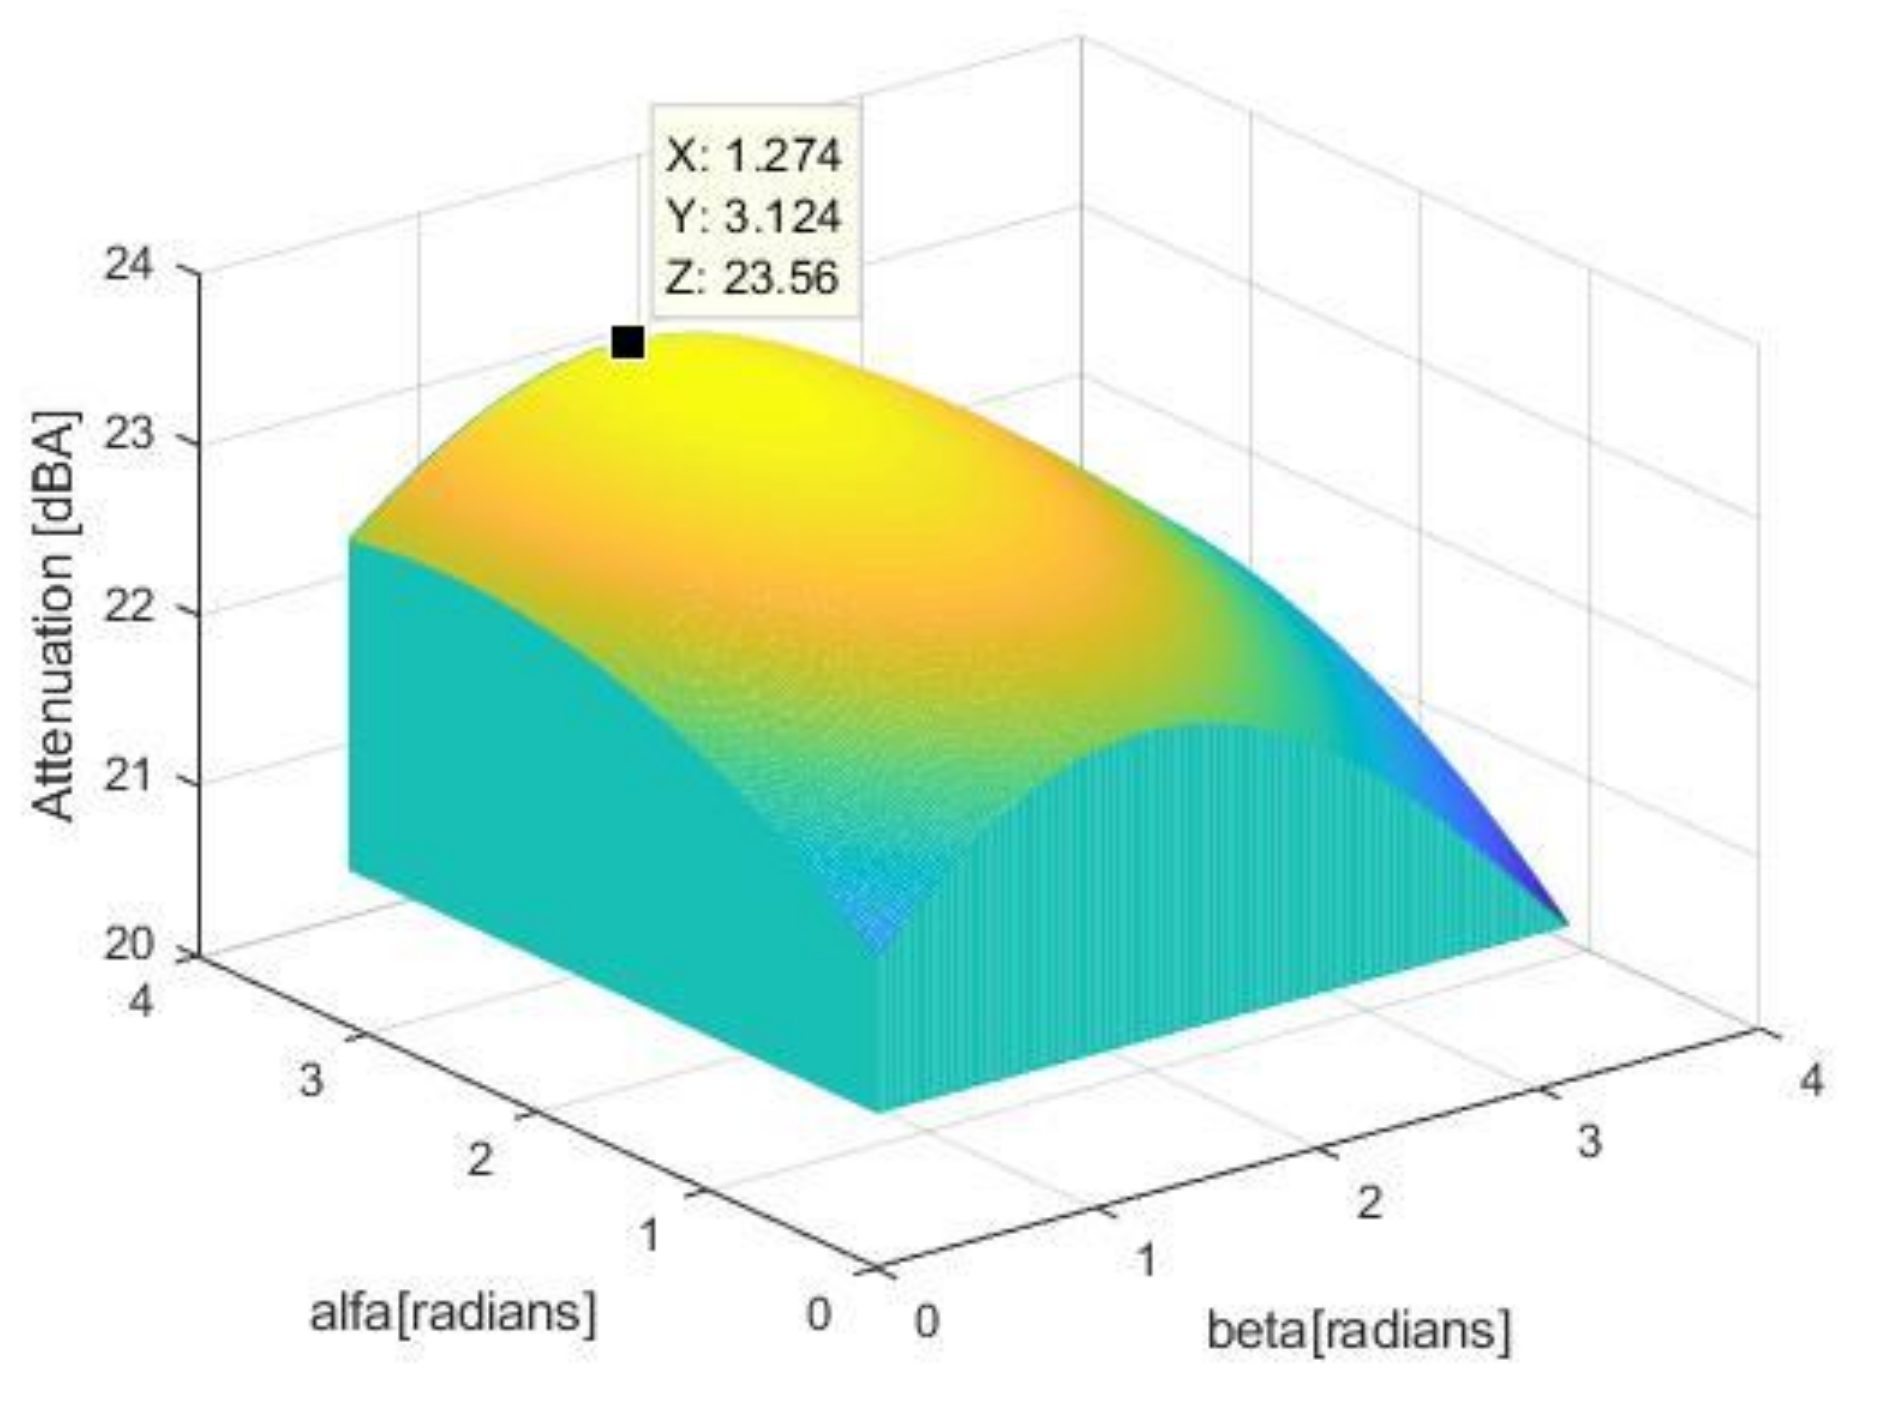
One of the most used “head edge” semi-infinite noise barriers is the y-shape, presented in Figure 9. This is because by varying the y-angle α from 0 to 180°, the y-shape is transformed into a T-shape and the β angle of the direction for the symmetry line of the y-shape can be modified in the range of 0 to 180°, with respect to the ground horizontal line, as presented in the literature [12]. Using the modified general prediction method (MGPM) to compute the attenuation of the sound with a semi-infinite thin rigid barrier for the same geometrical conditions as presented above, the y-shape of the diffracting edge was optimized, considering that a = 0.2 m and h = 0.5 m mounted in point E (see Figure 1 and Figure 9). In Figure 10 and Figure 11, the numerical results for a distance barrier-receiver of 35 m and for three frequencies of the pure tone sound at 1000, 2000, and 4000 Hz, are presented. In addition, the following factors were considered: The relative air humidity is 20% and the effective flow resistivity of the ground is σe = 104 kPa·s·m−2.
As can be seen from Figure 10 and Figure 11, the optimal angles of the y-shape diffraction edge that induce the maximum sound attenuation of the barrier, computed with MGPM, are α = 179° (almost T-shape) and β = 72°, with β as the angle of inclination with respect to the ground horizontal towards the source S, that is in close agreement with the experimental results presented in the literature [12] (α = 180° T-shape (p. 366), β = 70° (p. 366)). Accordingly, the MGPM is tested to predict the noise attenuation, which is closer to the reality phenomena, than GPM.
6. Conclusions
To conclude, the best method for the prediction of the sound attenuation of a noise with a semi-infinite thin rigid barrier is the modified general prediction method (based on the ISO 9613-2 standard), which takes into consideration the following effects: Diffraction effect of the edge barrier based on Fresnel number N1 (basic for GPM and Sound PLAN), the downwind meteorological effect that modifies Fresnel number N1 (basic for GPM and Sound PLAN), the effect of the proximity of the receiver to the shadow boundary, including both the modified Fresnel numbers N1 and N2 (novelty with respect to GPM and Sound PLAN), the effect of sound air relative humidity absorption based on ISO 9613-1 (novelty with respect to GPM and Sound PLAN), and the combined effects of absorption-reflections of the ground (novelty with respect to GPM and Sound PLAN), using an algorithm containing the following Relations: (1), (2), (7), (8), (14) and (16)–(20). The mathematical algorithm for the new MGPM is presented in detail in Appendix A. For future research, the MGPM must only be tested for pure tones sound, with sound frequencies in the interval [100…4000] Hz. Therefore, the MGPM should be tested in one third of an octave band noise frequency in the interval [100…16,000] Hz. In the meantime, the source S was a monopole source, for the MGPM must be tested for at least a quadrupoles noise source or, even better, for a four-lines noise source. These better respects the impact rolling’s conditions between the automotive wheels and the surface of the asphalt road. Furthermore, the optimization of the y-shape edge can be extended for the quadrupoles noise source or for a four-lines noise source in one third of an octave band noise frequency in the range [100…16,000] Hz.
Author Contributions
Conceptualization, M.B. and O.V.; methodology, M.B. and O.V.; software, M.B.; validation, M.B. and M.N.; formal analysis, M.B.; investigation, M.B. and O.V.; resources, M.B. and M.N.; data curation, M.B.; writing—original draft preparation, M.B.; writing—review and editing, M.B.; visualization, M.B.; supervision, M.B.; project administration, M.B. All authors have read and agreed to the published version of the manuscript.
Funding
This research received no external funding.
Institutional Review Board Statement
Not applicable.
Informed Consent Statement
Not applicable.
Data Availability Statement
Not applicable.
Acknowledgments
The first two authors of this article are thankful to the University POLITEHNICA of Bucharest, for providing a serene environment and the facilities to carry out this research work.
Conflicts of Interest
The authors declare no potential conflict of interest with respect to the research, authorship, and/or publication of this article.
Appendix A. MGPM Mathematical Algorithm
References
- Maekawa, Z. Noise reduction by screens. Appl. Acoust. 1968, 1, 157–173. [Google Scholar]
- Tatge, R.B. Barrier-wall attenuation with a finite sized source. J. Acoust. Soc. Am. 1973, 53, 1317–1319. [Google Scholar]
- Kurze, U.J.; Anderson, G.S. Sound attenuation by barriers. Appl. Acoust. 1971, 4, 35–53. [Google Scholar]
- Smith, M. Barriers to consistent results: The effects of weather. In Proceedings of the ACOUSTICS, AAS’08, Geelong, VIC, Australia, 24–26 November 2008; Acoustics and Sustainability. pp. 1–5. [Google Scholar]
- International Standard Organization. ISO 9613-2: Acoustics: Attenuation of Sound during Propagation Outdoors. Part 2: General Method of Calculation; International Standard Organization: Geneva, Switzerland, 1996. [Google Scholar]
- Menounou, P. A correction to Maekawa’s curve for the insertion loss behind barriers. J. Acoust. Soc. Am. 2001, 110, 1828–1838. [Google Scholar]
- Delany, M.E.; Bazley, E.N. Acoustical properties of fibrous absorbent materials. Appl. Acoust. 1970, 3, 105–116. [Google Scholar]
- Larsson, C. Atmospheric Absorption Conditions for Horizontal Sound Propagation. Appl. Acoust. 1997, 50, 231–245. [Google Scholar]
- International Standard Organization. ISO 9613-1: Acoustics: Noise Absorption by Air. Attenuation of Sound during Propagation Outdoors. Part 2: Calculation of the Absorption of Sound by the Atmosphere; International Standard Organization: Geneva, Switzerland, 1993. [Google Scholar]
- Rossing, T.D. Springer Handbook of Acoustics; Springer Science: New York, NY, USA; Würzburg, Germany, 2007; pp. 113–147. [Google Scholar]
- Bugaru, M.; Zaharia, M.C.; Chereches, T.; Arsene, M. Multi-Layered Phono-Insulated and Phono-Absorbing Acoustic Barrier. Romanian Patent No. 00122864, 24 September 2008. [Google Scholar]
- Karimi, M.; Younesian, D. Optimized T-Shape and Y-Shape Inclined Sound Barriers for Railway Noise Mitigation. J. Low Freq. Noise Vib. Act. Control 2014, 33, 357–370. [Google Scholar] [CrossRef] [Green Version]
Figure 1.
Diffraction of sound by a thin barrier.

Figure 2.
Sound attenuation as a function of sound frequency and relative humidity [9].
Figure 2.
Sound attenuation as a function of sound frequency and relative humidity [9].

Figure 3.
Sound attenuation as a function of the distance barrier-receiver and for a pure tone at 100 Hz (a) and 250 Hz (b).
Figure 3.
Sound attenuation as a function of the distance barrier-receiver and for a pure tone at 100 Hz (a) and 250 Hz (b).

Figure 4.
Sound attenuation as a function of the distance barrier-receiver and for a pure tone. (a) Frequency = 500 Hz, (b) frequency = 1000 Hz.
Figure 4.
Sound attenuation as a function of the distance barrier-receiver and for a pure tone. (a) Frequency = 500 Hz, (b) frequency = 1000 Hz.

Figure 5.
Sound attenuation as a function of the distance barrier-receiver and for a pure tone. (a) Frequency = 2000 Hz, (b) attenuation due to SWE. Range frequency 100–8000 Hz.
Figure 5.
Sound attenuation as a function of the distance barrier-receiver and for a pure tone. (a) Frequency = 2000 Hz, (b) attenuation due to SWE. Range frequency 100–8000 Hz.

Figure 6.
Sound attenuation as a function of the distance barrier-receiver and for a pure tone at 1000 Hz. (a) Relative humidity: 20%; σe = 10 MPa·s·m−2. (b) Relative humidity: 20%; σe = 104 kPa·s·m−2.
Figure 6.
Sound attenuation as a function of the distance barrier-receiver and for a pure tone at 1000 Hz. (a) Relative humidity: 20%; σe = 10 MPa·s·m−2. (b) Relative humidity: 20%; σe = 104 kPa·s·m−2.

Figure 7.
Sound attenuation as a function of the distance barrier-receiver and for a pure tone: σe = 104 kPa·s·m−2. (a) Frequency = 2000 Hz, (b) frequency = 2500 Hz.
Figure 7.
Sound attenuation as a function of the distance barrier-receiver and for a pure tone: σe = 104 kPa·s·m−2. (a) Frequency = 2000 Hz, (b) frequency = 2500 Hz.

Figure 8.
Sound attenuation with modified approaches: Relative humidity = 20%; σe = 104 kPa·s·m−2.

Figure 9.
The y-shape of the “head edge” for the semi-infinite noise barrier.

Figure 10.
Sound attenuation: Distance barrier-receiver 35 m; relative air humidity 20%; σe = 104 kPa·s·m−2. (a) Frequency = 1000 Hz, (b) frequency = 4000 Hz.
Figure 10.
Sound attenuation: Distance barrier-receiver 35 m; relative air humidity 20%; σe = 104 kPa·s·m−2. (a) Frequency = 1000 Hz, (b) frequency = 4000 Hz.

Figure 11.
Sound attenuation: Distance barrier-receiver 35 m; sound frequency = 4000 Hz; relative humidity 20%; σe= 104 kPa·s·m−2.
Figure 11.
Sound attenuation: Distance barrier-receiver 35 m; sound frequency = 4000 Hz; relative humidity 20%; σe= 104 kPa·s·m−2.

Publisher’s Note: MDPI stays neutral with regard to jurisdictional claims in published maps and institutional affiliations. |
© 2021 by the authors. Licensee MDPI, Basel, Switzerland. This article is an open access article distributed under the terms and conditions of the Creative Commons Attribution (CC BY) license (https://creativecommons.org/licenses/by/4.0/).
Share and Cite
MDPI and ACS Style
Bugaru, M.; Vasile, O.; Neagoe, M. Recent Developments of Noise Attenuation Using Acoustic Barriers for a Specific Edge Geometry. Computation 2021, 9, 129. https://0-doi-org.brum.beds.ac.uk/10.3390/computation9120129
AMA Style
Bugaru M, Vasile O, Neagoe M. Recent Developments of Noise Attenuation Using Acoustic Barriers for a Specific Edge Geometry. Computation. 2021; 9(12):129. https://0-doi-org.brum.beds.ac.uk/10.3390/computation9120129
Chicago/Turabian StyleBugaru, Mihai, Ovidiu Vasile, and Marian Neagoe. 2021. "Recent Developments of Noise Attenuation Using Acoustic Barriers for a Specific Edge Geometry" Computation 9, no. 12: 129. https://0-doi-org.brum.beds.ac.uk/10.3390/computation9120129
Note that from the first issue of 2016, this journal uses article numbers instead of page numbers. See further details here.