
Principal Components Analysis of EEG Signals for Epileptic Patient Identification


Facultad de Ingeniería, Universidad Distrital Francisco José de Caldas, Bogotá 11021-110231588, Colombia
*
Author to whom correspondence should be addressed.
Computation 2021, 9(12), 133; https://0-doi-org.brum.beds.ac.uk/10.3390/computation9120133
Submission received: 16 October 2021
/
Revised: 26 November 2021
/
Accepted: 6 December 2021
/
Published: 9 December 2021
(This article belongs to the Section Computational Biology)
Abstract
:According to the behavior of its neuronal connections, it is possible to determine if the brain suffers from abnormalities such as epilepsy. This disease produces seizures and alters the patient’s behavior and lifestyle. Neurologists employ the electroencephalogram (EEG) to diagnose the disease through brain signals. Neurologists visually analyze these signals, recognizing patterns, to identify some indication of brain disorder that allows for the epilepsy diagnosis. This article proposes a study, based on the Fourier analysis, through fast Fourier transformation and principal component analysis, to quantitatively identify patterns to diagnose and differentiate between healthy patients and those with the disease. Subsequently, principal component analysis can be used to classify patients, employing frequency bands as the signal features. Besides, it is made a classification comparison before and after using principal component analysis. The classification is performed via logistic regression, with a reduction from 5 to 4 dimensions, as well as from 8 to 7, achieving an improvement when there are 7 dimensions in the precision, recall, and score metrics. The best results obtained, without PCA are: precision , recall , and score ; meanwhile, the best values obtained using PCA are: precision , recall , and score .
1. Introduction
According to [1], epilepsy is a common neurological degenerative disorder that causes recurring seizures. Regarding treatments, in [2], it is estimated that patients could live with no seizures with early detection. Within the diagnosis techniques, spectral (frequency) analysis can be used to identify visual patterns as peaks or variations in frequency that allow the identification of neurological disorders [3]. In this way, the development of models that allow the diagnosis of epilepsy are important for improving the patient’s life quality.
For more accurate diagnoses, different data classification techniques, such as logistic regression (LR), artificial neural networks (ANN), support vector machines (SVM), etc., can be implemented. In order to extract features for the classification process, EEG signals can be analyzed in the time and frequency domains. For this, the TUH EEG Corpus (TUEEG) was employed, described in [4], which contains a dataset related to patients who had an EEG performed. On the basis of this evidence, 20 epileptic and 20 nonepileptic patients were selected, between the ages of 19 and 81 years, with average age of 53 years. In this subset, there are 22 women and 18 men; in this order, Table 1 describes the ages and gender of the samples that are part of the data set [5].
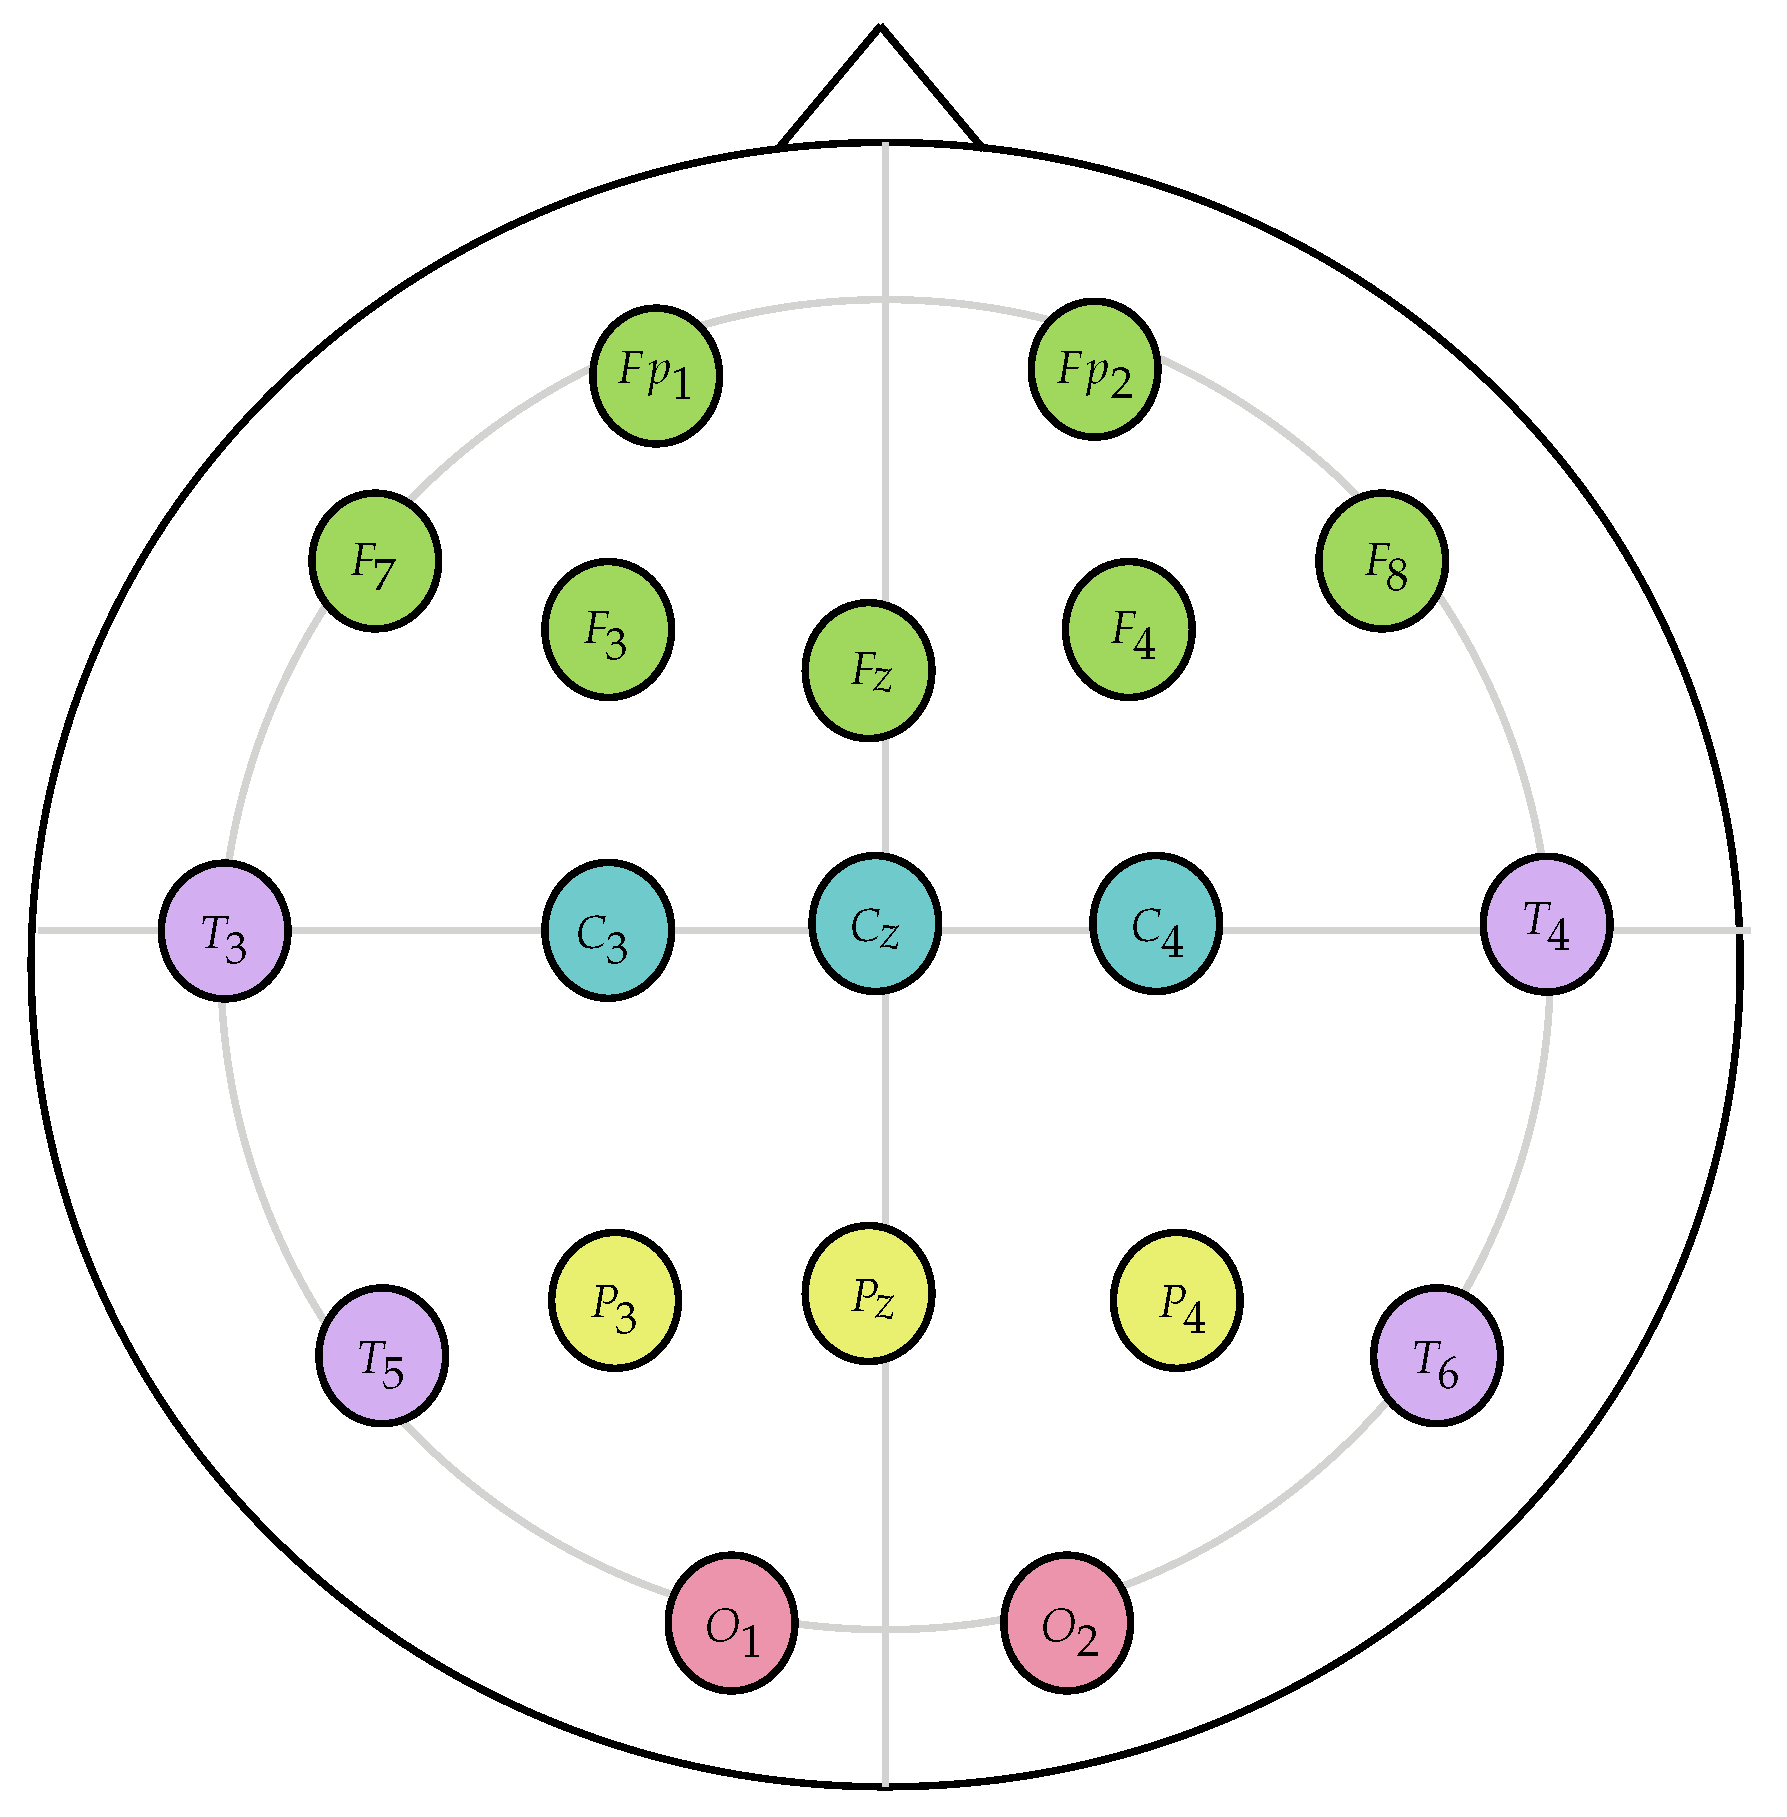
In this article 40 sessions were used, each one from a different patient from the TUH EEG epilepsy section of the corpus, whose data was obtained using the temporal central parasagittal (TCP) configuration, differentiating 21 channels, as shown in Figure 1. Throughout this article, feature extraction techniques, based on frequency domain and the use of principal component analysis (PCA), for the classification of patients will be explored.
Considering the identification of epilepsy via feature extraction, a relevant approach using frequency bands for preictal and interictal analysis is displayed in reference [6], referring to the lapse prior to seizures start in the subject, together with the intermediate period between a series of seizures. Other remarkable work is displayed in [7], where an approach is proposed to analyze the EEG signals of epileptic patients using principal component analysis and wavelet power spectra. By transforming the different EEG signals into a wavelet power spectra, it makes principal component functional analysis useful for extracting significant features from the signals. In this way, it is observed how the signals separation is achieved in a low-dimensional feature space. Regarding seizures detection using EEG signals, paper [8] proposed a model based on deep learning for seizures detection, characterized mainly by a two-dimensional representation of the scalability and features of neural networks. The model sets modules for seizures detection and enhances model flexibility for implementation in different hardware resources.
Within the framework of feature extraction, there is also the approach used in [9] to develop an efficient method based on a Hjorth parameter called “mobility”. This parameter seeks to reduce computational complexity and increases the precision of epilepsy detection. The Hjorth parameters are indicators or metrics of statistical properties of the signal processing in the time domain [10], the mobility parameter used represents an average frequency of the power spectrum.
There are also classification techniques and proposals for epilepsy detection and labeling. The classifiers are built employing machine learning (ML) techniques. Thus, authors in references [11,12] use logistic regression to ease the analysis of results in predictive and explanatory terms.
In connection with the use of EEG signal analysis, in [13] the methods of independent component analysis (ICA) and electroencephalogram (EEG) dipole source localization are used in cases of Event-Related Potentials (ERP), Power Spectral Density (PSD), and Event Related Spectral Perturbation (ERSP) during target detection process with a wireless (EEG) system, which result suitable for real life application. The experimental results show that bodily function affects mental states and psychological performance in cognitive tasks in humans.
Another application of EEG signals consists of emotion recognition. In [14], from the view of spatial topology and brain emotional patterns temporal information in an EEG, such EEG signals are characterized to obtain emotion recognition information. The effective characteristics are entered into the support vector machine classifier to define emotion recognition of subjects applying the method of analysis of dimension reduction. Overall, the experiments showed 18 out of 62 channel EEG signals, chosen by dimension reduction analysis, were noteworthy. Meanwhile, in [15], it is proposed to evaluate the EEG patterns recorded by musicians playing a simple piano score, while manipulating their playing to express specific emotions. In the first instance, a spectral analysis of the EEG signal is carried out, in order to identify relationships between music and emotions. In the results, differences were observed in EEG activity between the different emotions described by the subjects. Regarding related works in [16], a method is proposed to detect the stage of drowsiness in the electroencephalogram (EEG), using machine learning techniques, such as stacked autoencoder with softmax layers. The tests were carried out with 62 volunteers, showing excellent precision in wakeful/drowsy discrimination. Finally, in [17], the differences in the dynamics of the awake brain with Eyes Open (EO) and Eyes Closed (EC) are explored, measuring the respective entropy in each case. Approximate entropy was measured by focusing on the central, frontal, parietal, occipital, and temporal brain areas. EEG data, from 37 healthy adult subjects while resting, were used, where each participant underwent an EO and EC recording. According to results, the EO condition is characterized by higher entropy values than in the EC condition.
Regarding other EEG applications, article [18] revises methods of signal analysis in the assessment of mental stress; such a review emphasizes the most relevant differences in research findings and displays that variations in methods of data analysis result in several conflicting results, caused by a variety of factors, including protocol without defined standards, brain region of interest, adequate EEG processing, mechanisms of feature extraction, type of classifier, and duration of experiment. Thus, such a review suggests the activation of cortical merging with connectivity measures network focused on deep learning to boost the accuracy of mental stress level assessment. Another important application refers to healthy sleep, according to [19], sleep is essential to maintain the body’s metabolism and mental equilibrium to increase concentration and productivity. In [19], a system is proposed for the automated identification of the cyclic alternating pattern (CAP), which is a recurrent electroencephalogram (EEG) physiological activity present in the brain during sleep that seizes the its micro-structure and can be employed to determine sleep fluctuation. The development of the model is rooted using EEG signals from healthy subjects and patients affected and suffering from six different sleep disorders. Finally, a way of measuring presence in virtual environments is proposed in [20], which consists of evaluating the subjective experience of being in one place, when the person is physically in another. Two listening tests were made to acquire the EEG signals, using eight speakers to play urban soundscapes. According to the authors, this study can be applied in virtual reality and immersive video games.
Article Approach and Document Organization
This article proposes a study based on Fourier analysis of signals through the fast Fourier transformation (FFT), applying principal component analysis; this is to identify, in a quantitative way, patterns to diagnose and differentiate between healthy and unhealthy patients. To observe the feasibility of using APC, patient classification is performed using logistic regression. This work can be considered as a step to improve the classification shown in [5] using different classification techniques.
The methodology employed in this work consists of the following steps. For a first stage is made the data collection, then a preprocessing of this data was carried out (making the adaptation of these data to be used in Fourier analysis); then, the characteristics were extracted, using the frequency bands calculated with the FFT. Then the analysis was carried out by PCA, performing the respective dimensional reduction. Finally, the implementation of the classification model was carried out with logistic regression, making the comparison when PCA was and was not employed.
The article is organized as follows, Section 2 describes features extraction of EEG signal using Fourier analysis. Principal component analysis theory is displayed in Section 3; then, in Section 4, the principal component analysis is carried out, using the features of EEGs signals. Section 5 shows the results of using PCA for logistic regression classification. In Section 6, the discussion on the applicability of the analysis is carried out; finally, in Section 7, the conclusions are given.
2. EEG Frequency Features
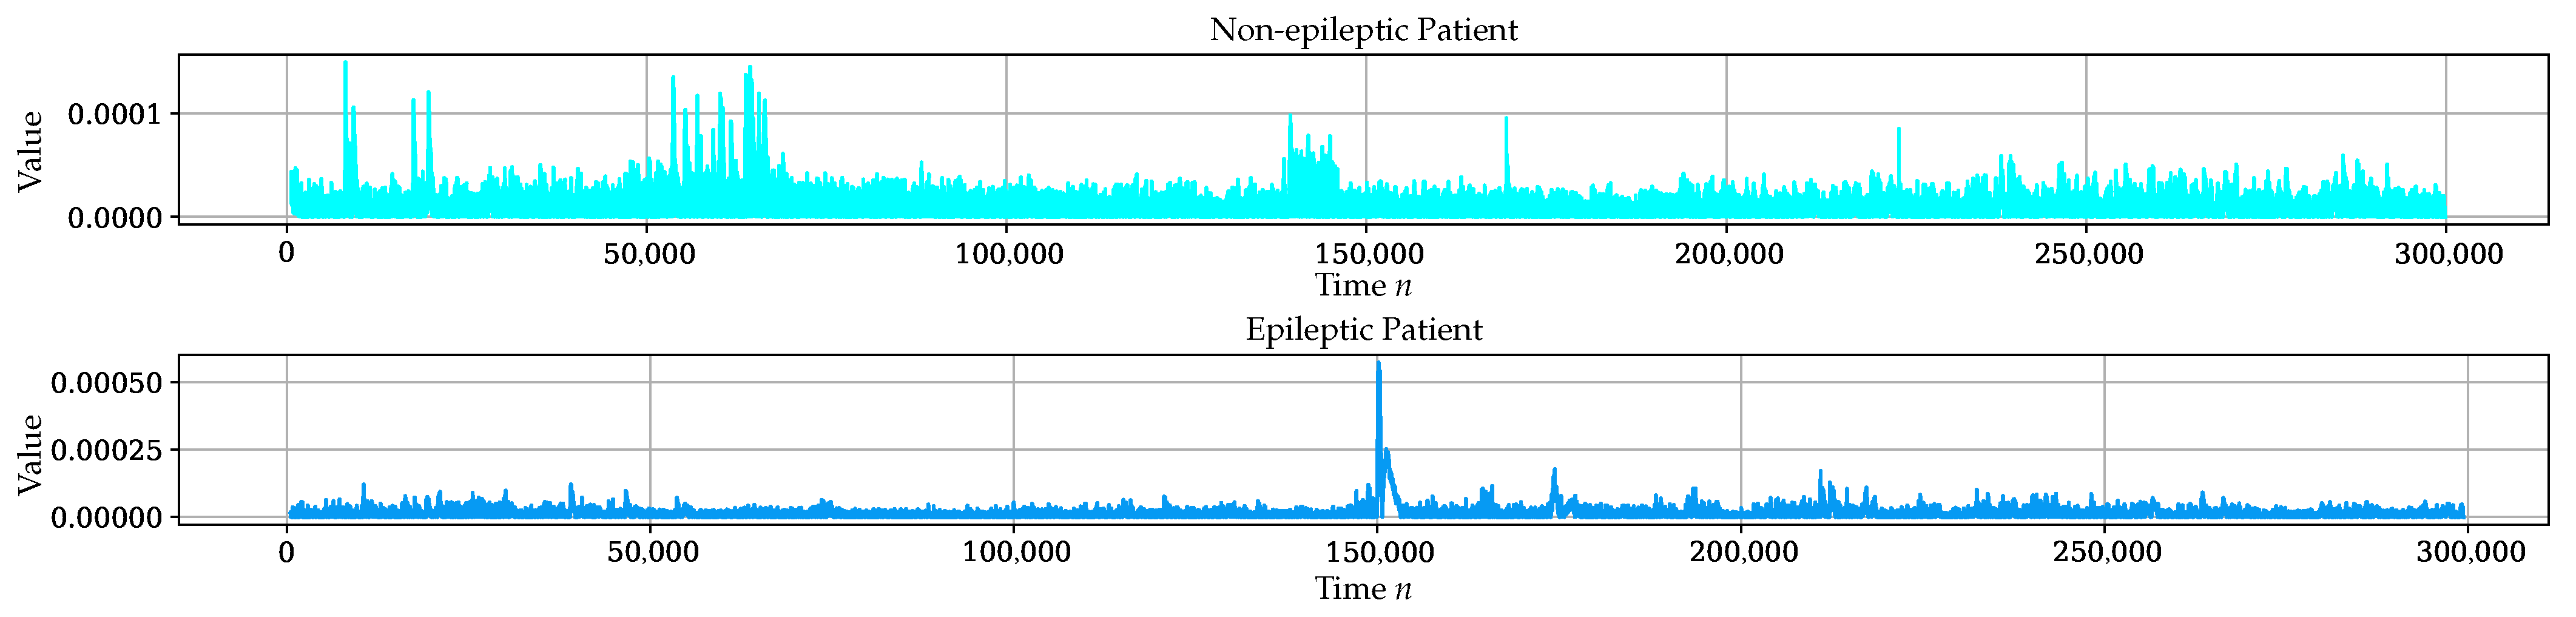
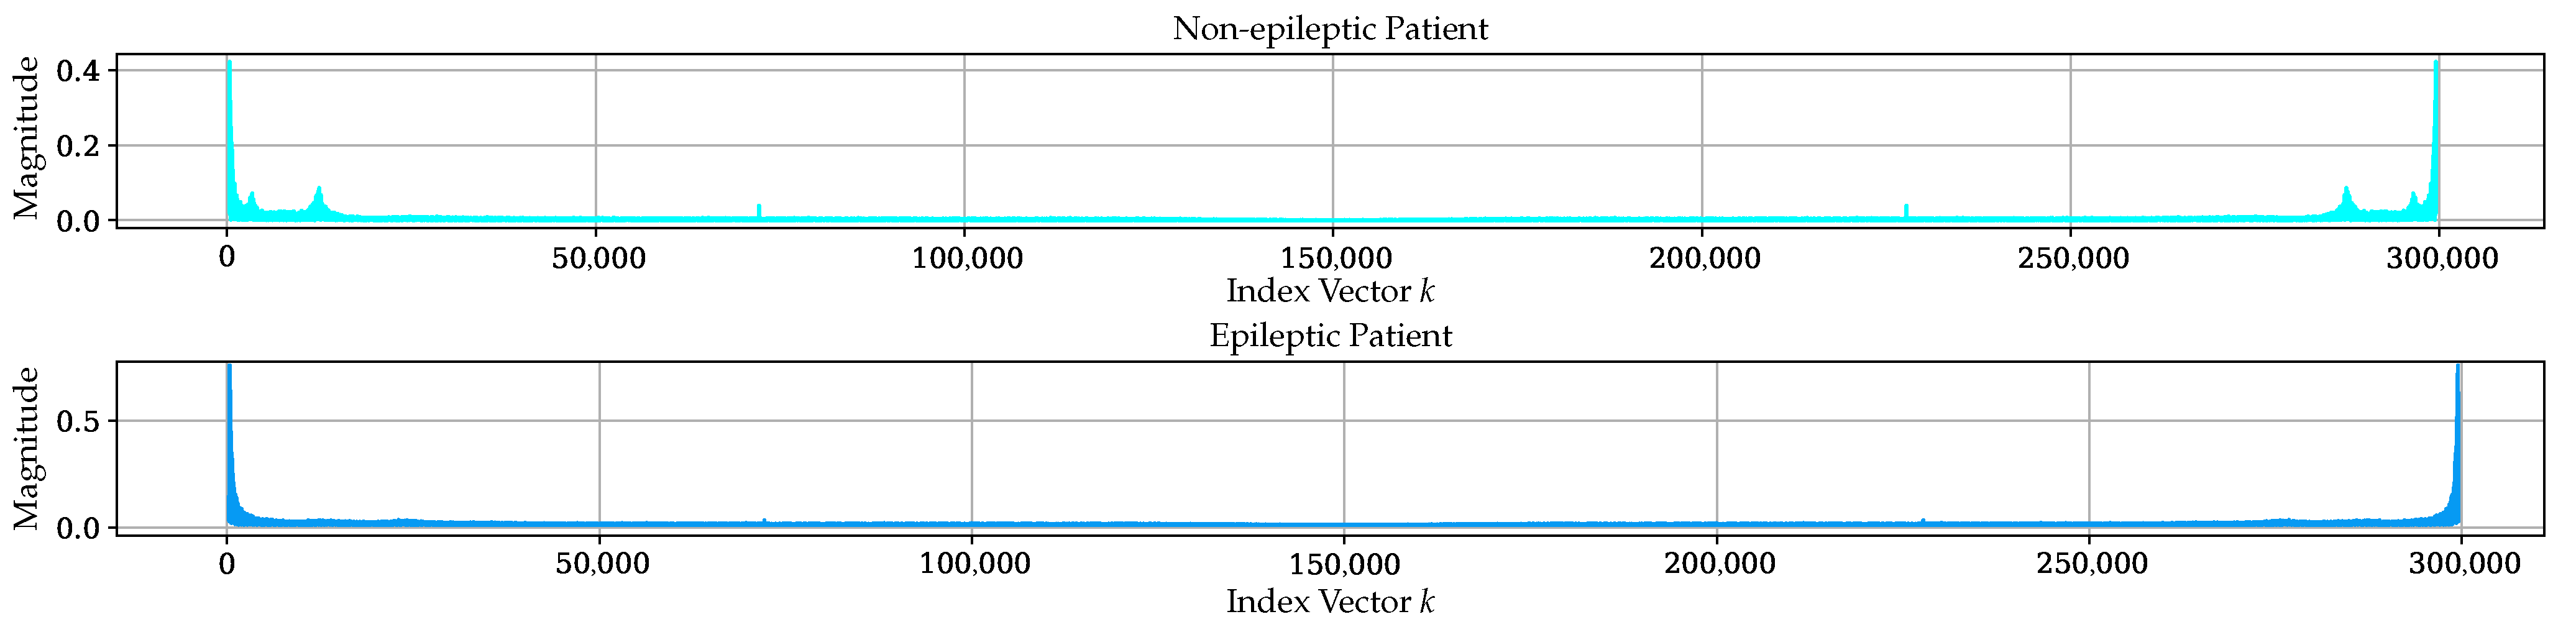
The first step in feature identification was to check what information could be obtained through a spectral analysis in the time domain. Exams of epileptic and non-epileptic patients were compared, and the differences were not noticeable in that domain. Therefore, a Fourier analysis was applied, and the same analysis was performed on the signals, showing differences between patients. Figure 2 and Figure 3 illustrate these differences; in Figure 2, no discernible difference is found in the visual analysis. Meanwhile, in Figure 3, frequency differences are observed. Based on this situation, it was decided to divide the EEG signal into frequency bands, obtained through the application of fast Fourier transform [21]. For this analysis, it is common to take the FFT magnitude square values, to obtain an estimate of the spectral density of the EEG signal power [22]. Equation (1) defines the discrete Fourier transform (DFT). In order to represent the frequency, a Hertz scale can be used the equation , where is the sampling frequency.
Considering the displayed in [21] is used the division into frequencies ranges or bands as illustrated in Table 2.
In order to obtain the frequency features, the relative power is used, given by Equation (2), where corresponds to the respective frequency band (delta, theta, alpha, beta, gamma), N number of total data, while and are initial and final values for the i frequency band.
Regarding EEG frequency features analysis, in [5], several signals in time and frequency domains for epileptic and non-epileptic patients can be observed, where the values of for different channels are calculated, considering, as non-epileptic patient example, a 75-year-old man (checking the mental status) and, for epileptic patient, a 75-year-old woman (with urinary incontinence).
3. Principal Component Analysis
Principal component analysis (PCA) is a technique applied to solve the problem of refining subspace S of dimension for a set of data in a space of high dimensionality [23]. Data can be organized in a matrix X and its generic element that represents the value of variable j on measure i, where and . The data matrix X will have dimensions and can be represented in Equation (3), in a short form .
Using Equation (4), each principal component is calculated by linear combination of the original variables . Terms are the weights (importance) of every single variable in each component. Consequently, it helps to determine the type of information gathered by each component [24].
The respective transformation can be expressed using Equation (5) where W is the transformation (projection) matrix composed by elements .
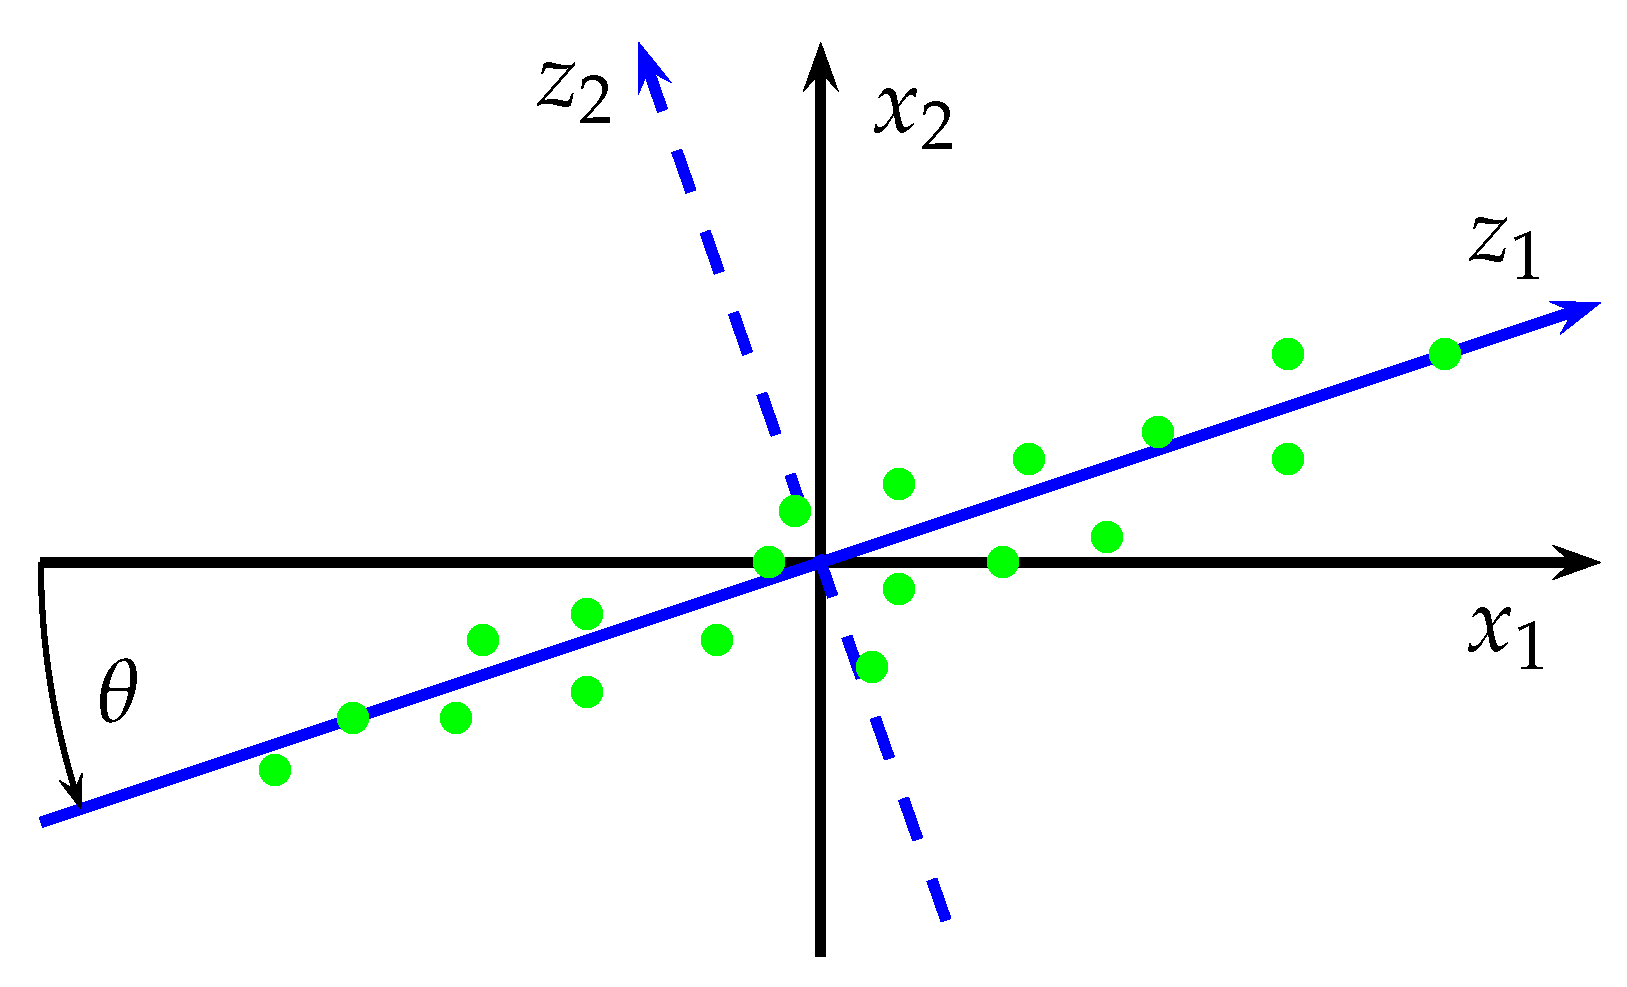
Figure 4 shows a set of data, where axis and are the original data variables, and the main number of data is localized in new axis whereby is a principal component [25].
Considering that the data of X has been centered to have mean zero the co-variance matrix is given by Equation (6).
Is notable that is symmetric, diagonalizable and positive semi-definite (all eigenvalues are positive). The covariance matrix containing estimates of how each variable relates to every other variable [25].
In this way, from the covariance matrix, the eigenvectors represent the direction and the associated eigenvalues the magnitude. The higher the eigenvalues, the more important directions are correlated. It is considered that more variability in a particular direction correlates with better explaining the behavior of a dependent variable. High variability usually indicates “Information” while little variability indicates “Noise” [24,25].
This analysis is useful in pattern recognition to classify objects belonging to an observed pattern, as well as the compression of this data, with the purpose of reducing the number of bits necessary to represent the data without incurring the distortion of its quality [26].
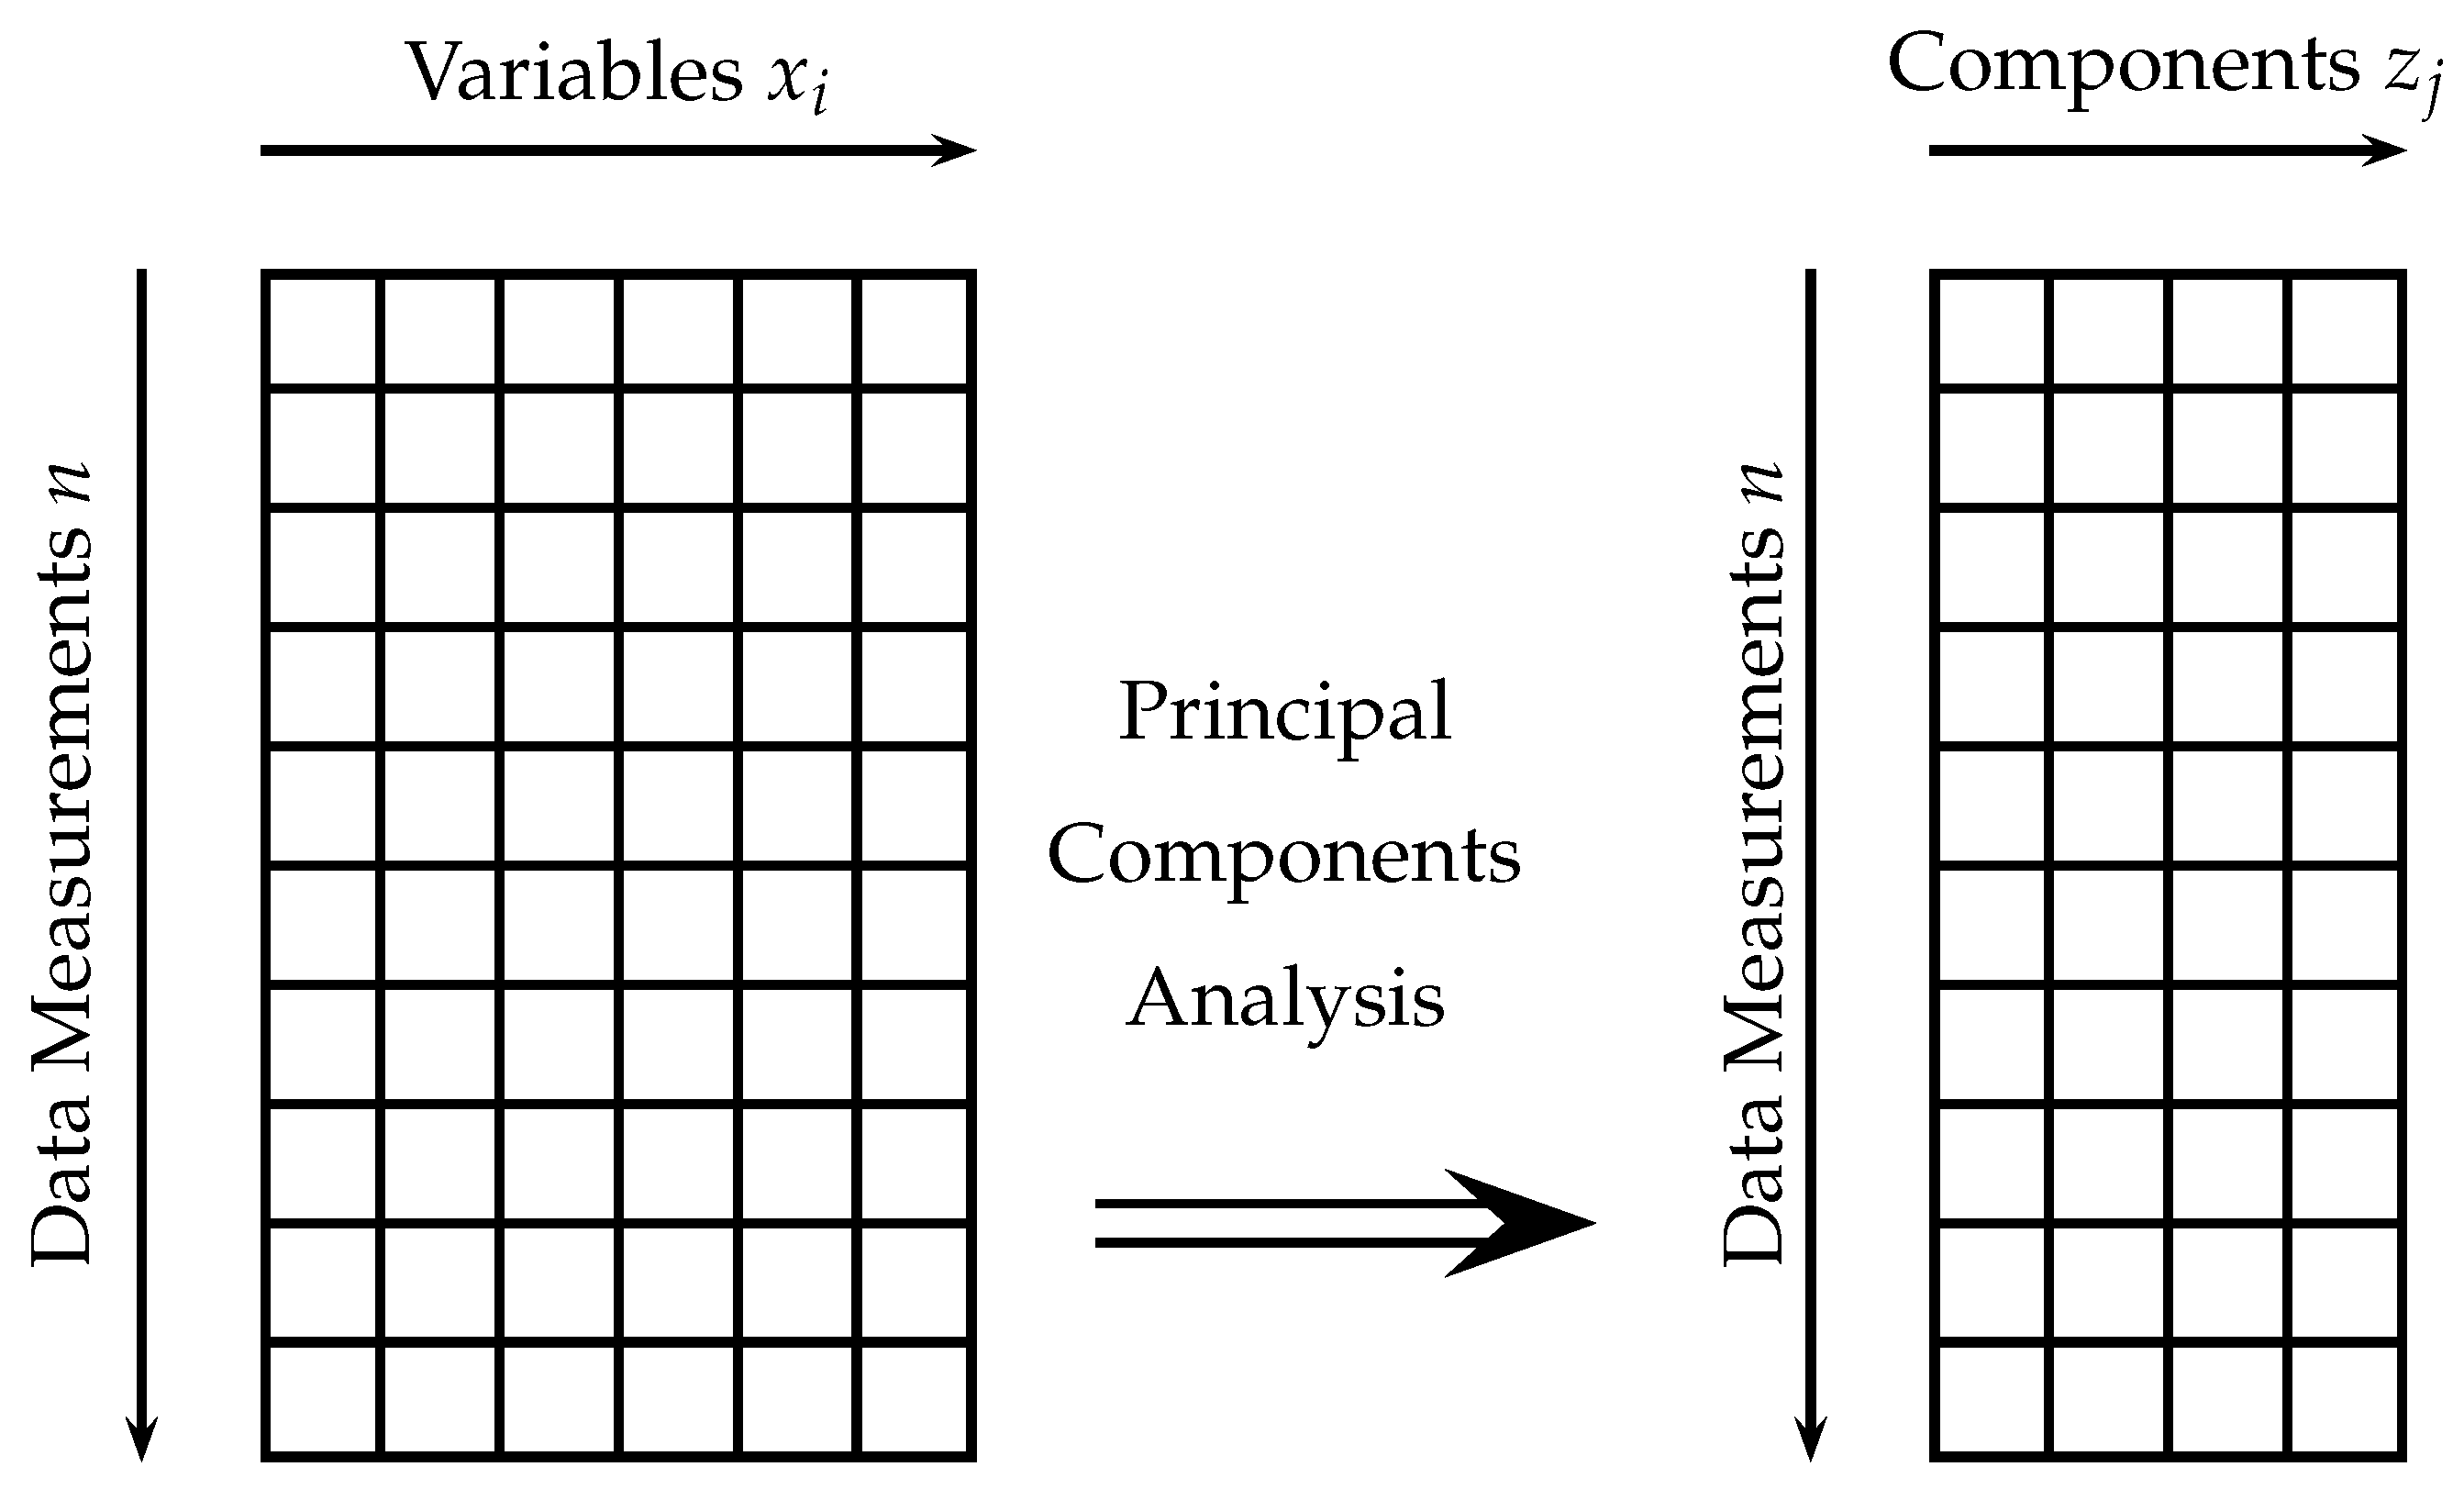
Typically, PCA is used to reduce the feature dimensions of the original space of characteristics. For this, the new dimensions are ranked from best to worst, retaining information (according to variance). To determine relevant variables, dimensions can be taken until a minimum percentage of variability is reached, for example, of total variability [24,25]. Figure 5 describes an example of dimension reduction using PCA.
As can be seen, selecting the proper vectors can establish the transformation matrix. According to [24,25] the steps to perform dimension reduction using PCA are:
- Perform the normalization of the input data (variables normalization).
- From the covariance matrix, determine eigenvectors and eigenvalues.
- Arrange the eigenvalues from largest to smallest and choose the d eigenvectors associated to the largest eigenvalues.
- Build the projection matrix W which consists of with the chosen d eigenvectors.
- Convert the original X standardized dataset using W to obtain the new d-dimensional data (in the new feature subspace).
4. Principal Component Analysis for EEG Signal
For this approach, principal component analysis was used mainly as a tool to visualize the characteristics extracted with fast Fourier transform that have been used for classification proposals.
For many data processing applications and problems, PCA is useful in visualizing data. Generally, the visualization of data of dimension 2 or 3 is not a big challenge; however, it is challenging when required to visualize information with dimensionality greater than 3, which is the particular case for the data used in this work that has 5 dimensions (according to the 5 bands in which signal frequency was classified).
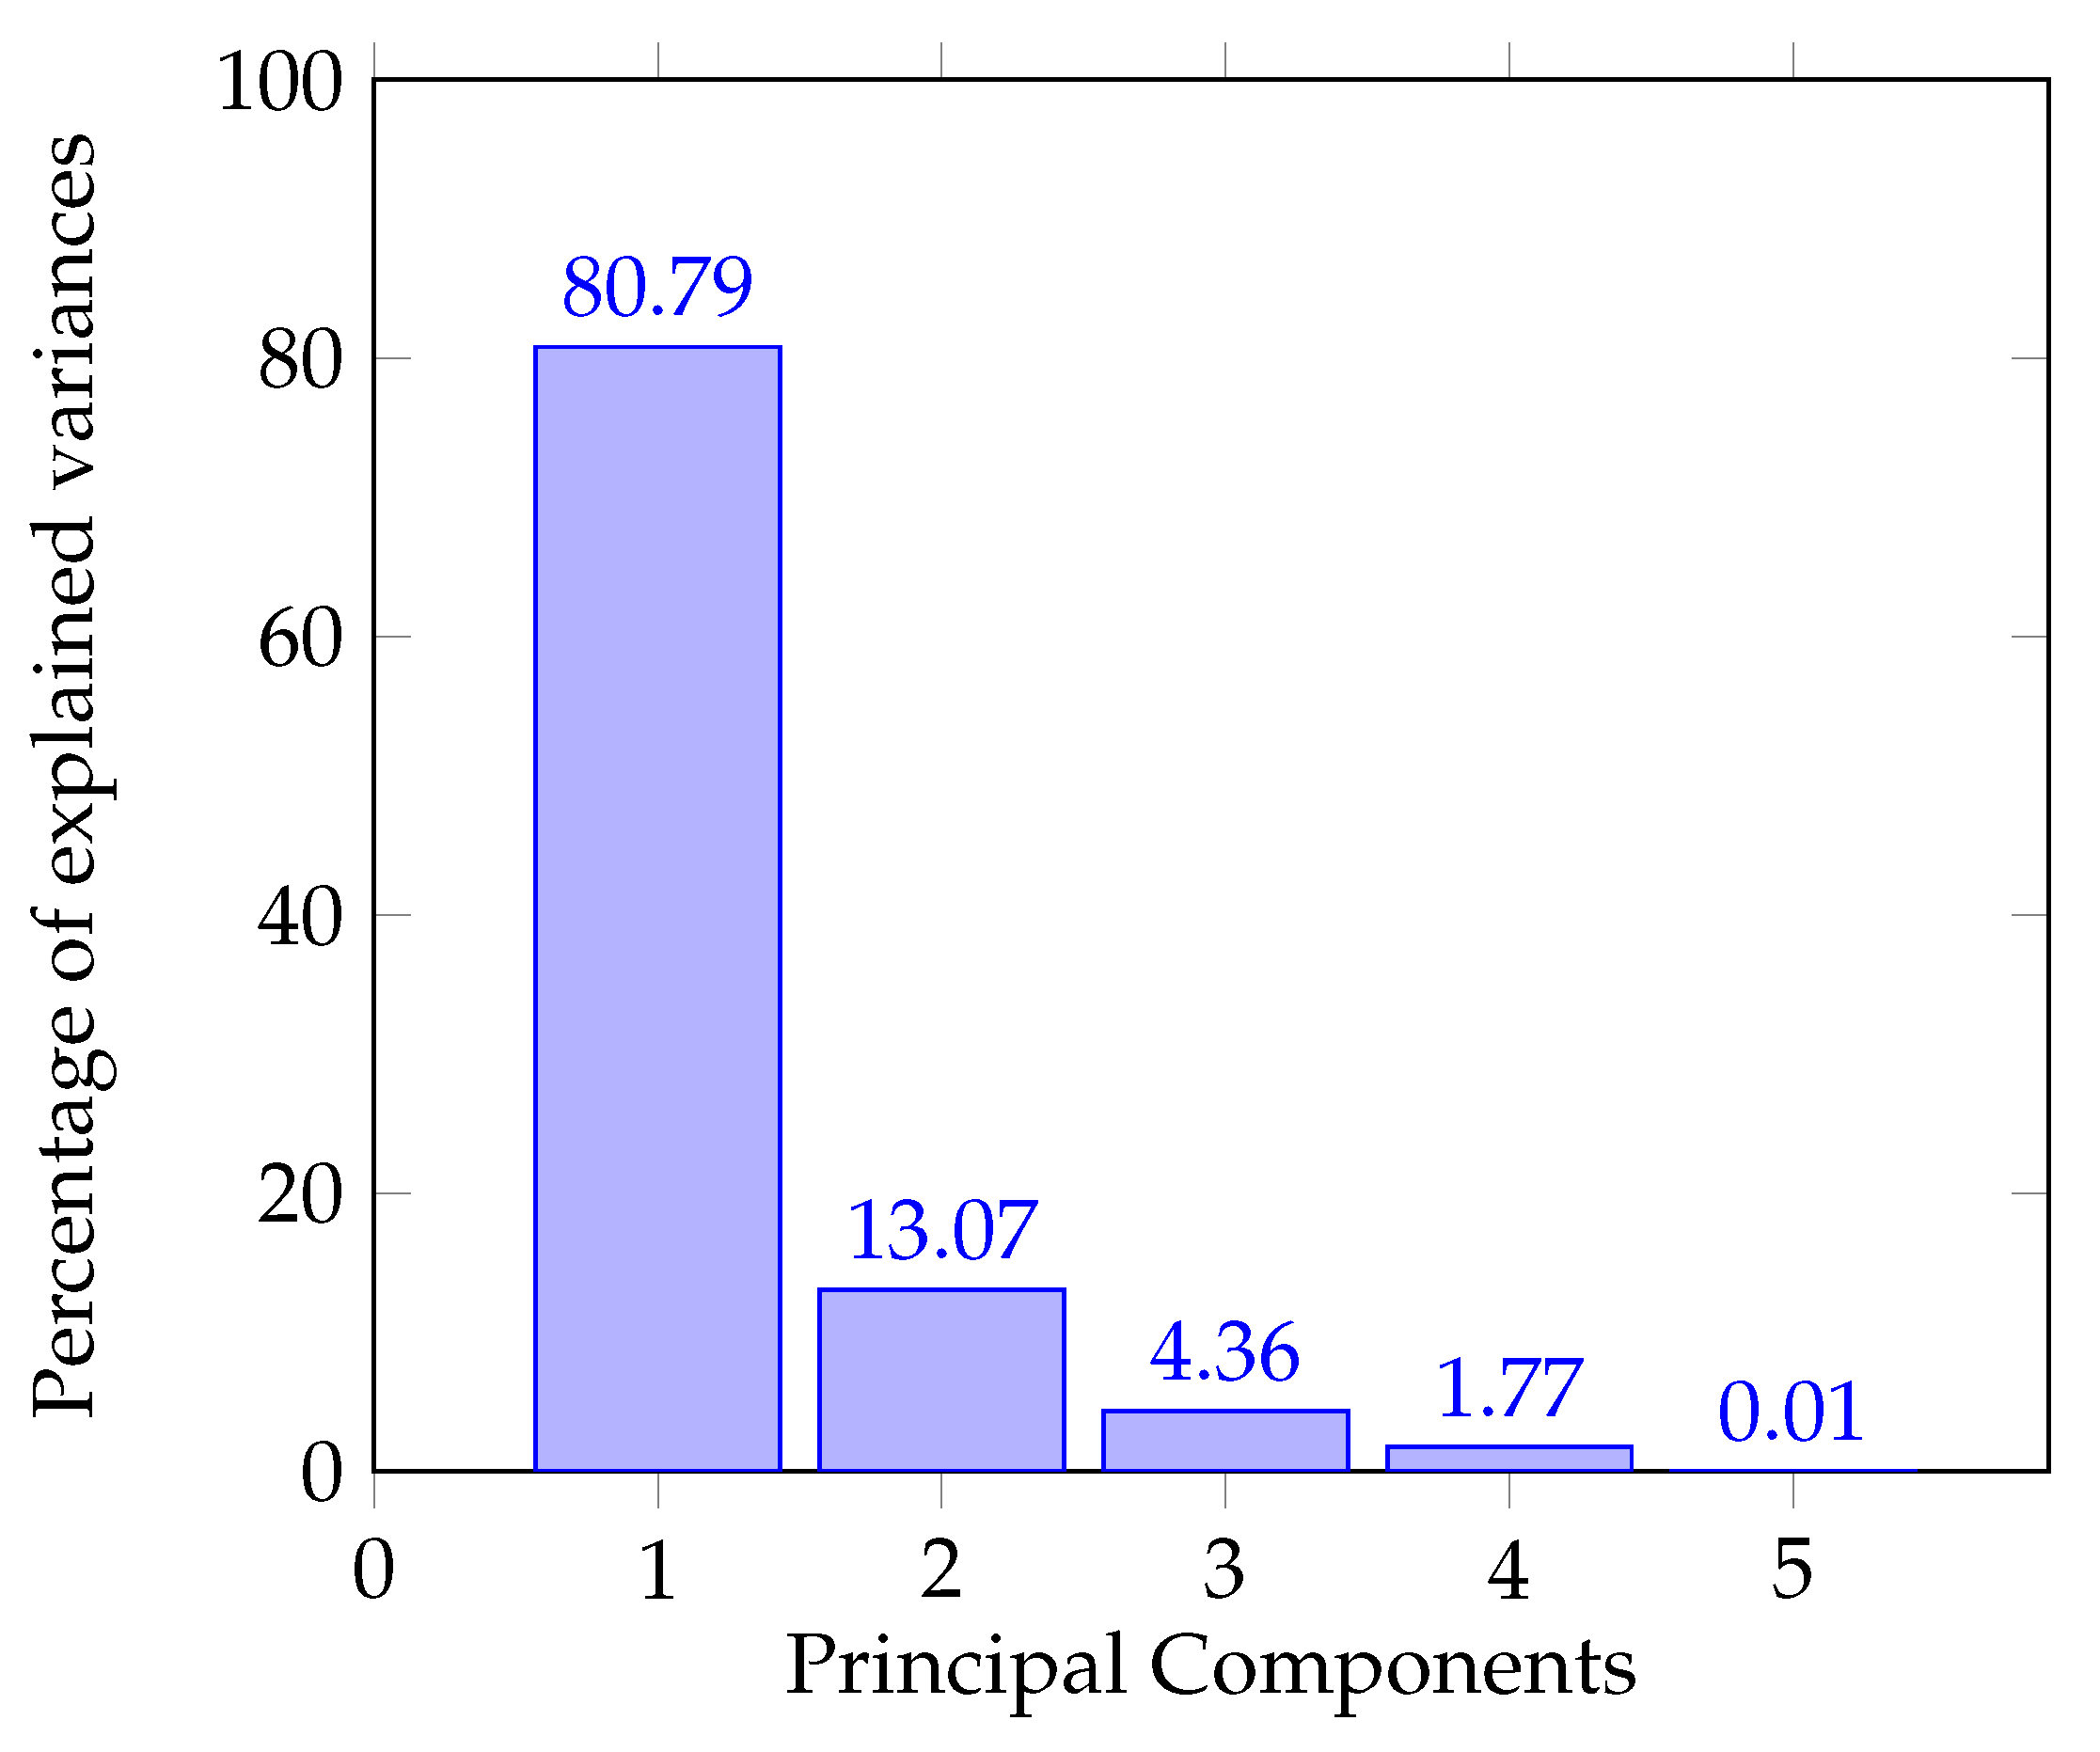
Principal component analysis is effective thanks to scaling; therefore, it is relevant the use of scalers with standard characteristics (normalization) when applying PCA. The data used (relative power per band) consist of 5 characteristics: Alpha, Beta, Theta, Delta, and Gamma; considering these features and applying PCA, Figure 6 displays the percentage of explained variances for the principal components. In this figure a variance of is observed in the first component, in the second component , for the third and for the las two and . This analysis of variance is performed to observe how much information is lost when dimensional reduction is applied.
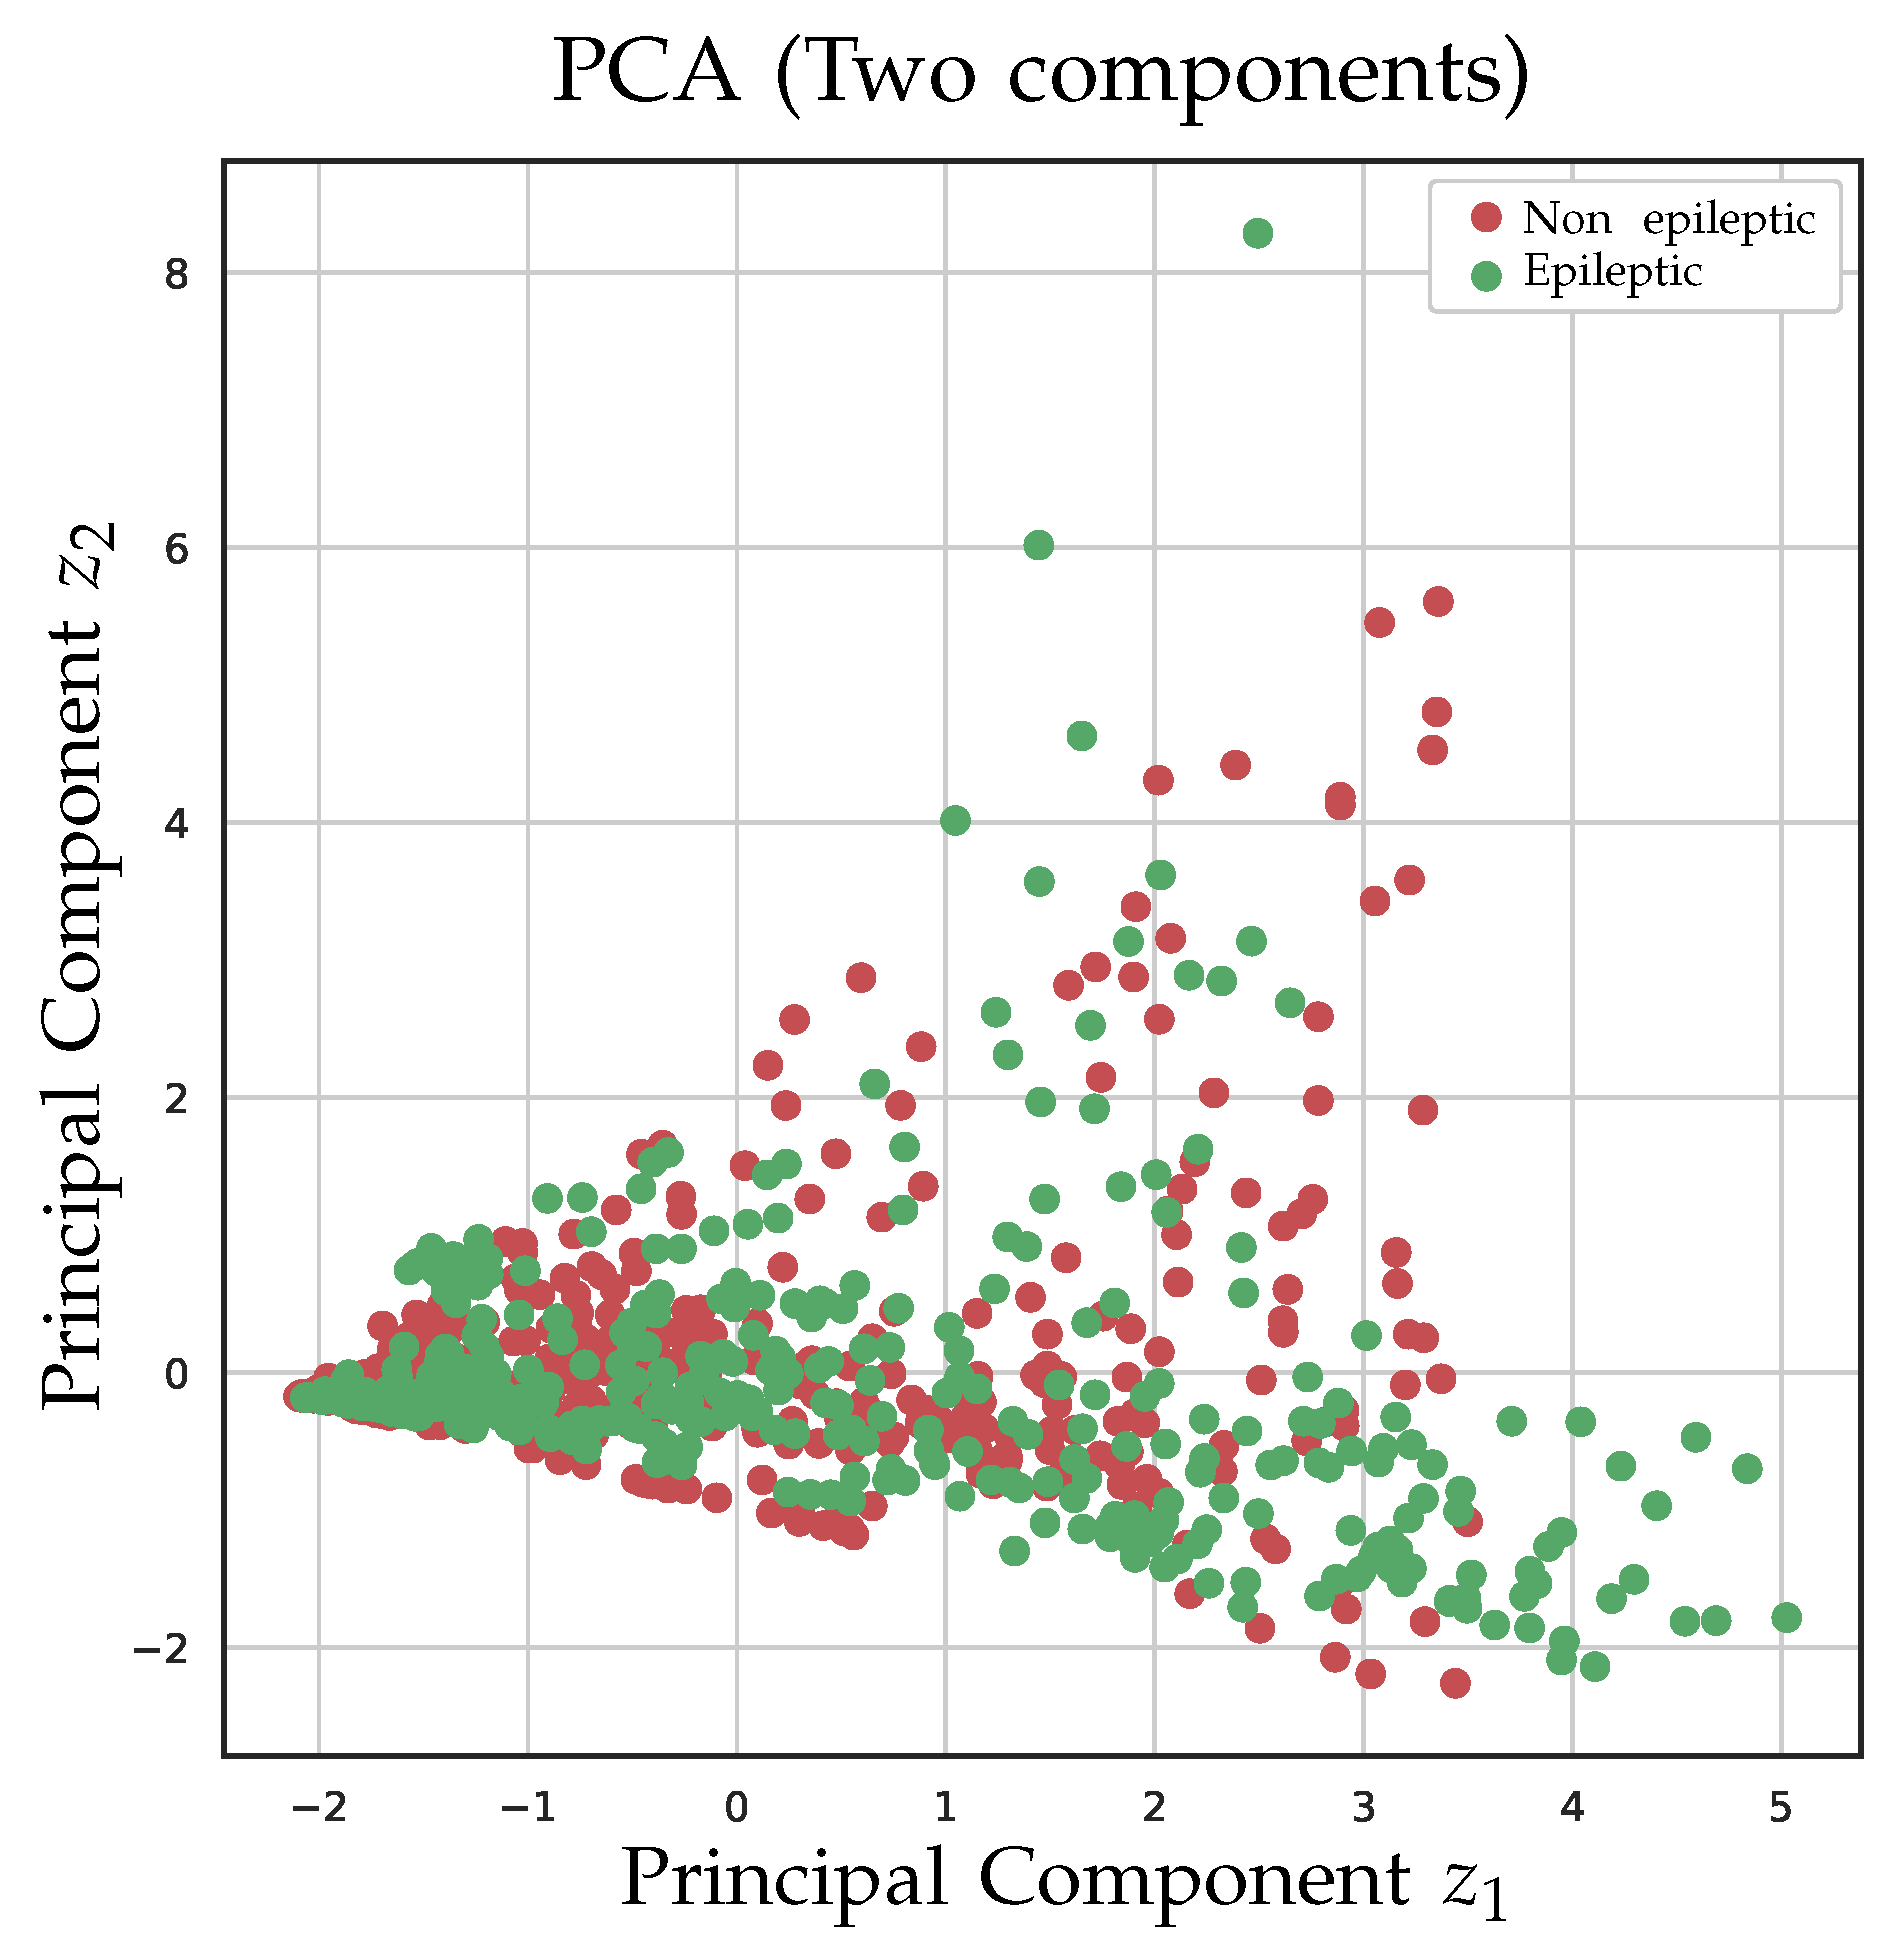
In a first case, the 5 characteristics are projected in 2 dimensions. After reduction, it is observed that there is no particular meaning of each component, it can be seen more as a fit of the original data to two dimensions. In Figure 7 is seen that the reduction from 5 to 2 dimensions does not allow the classes to be separated from each other in the best way.
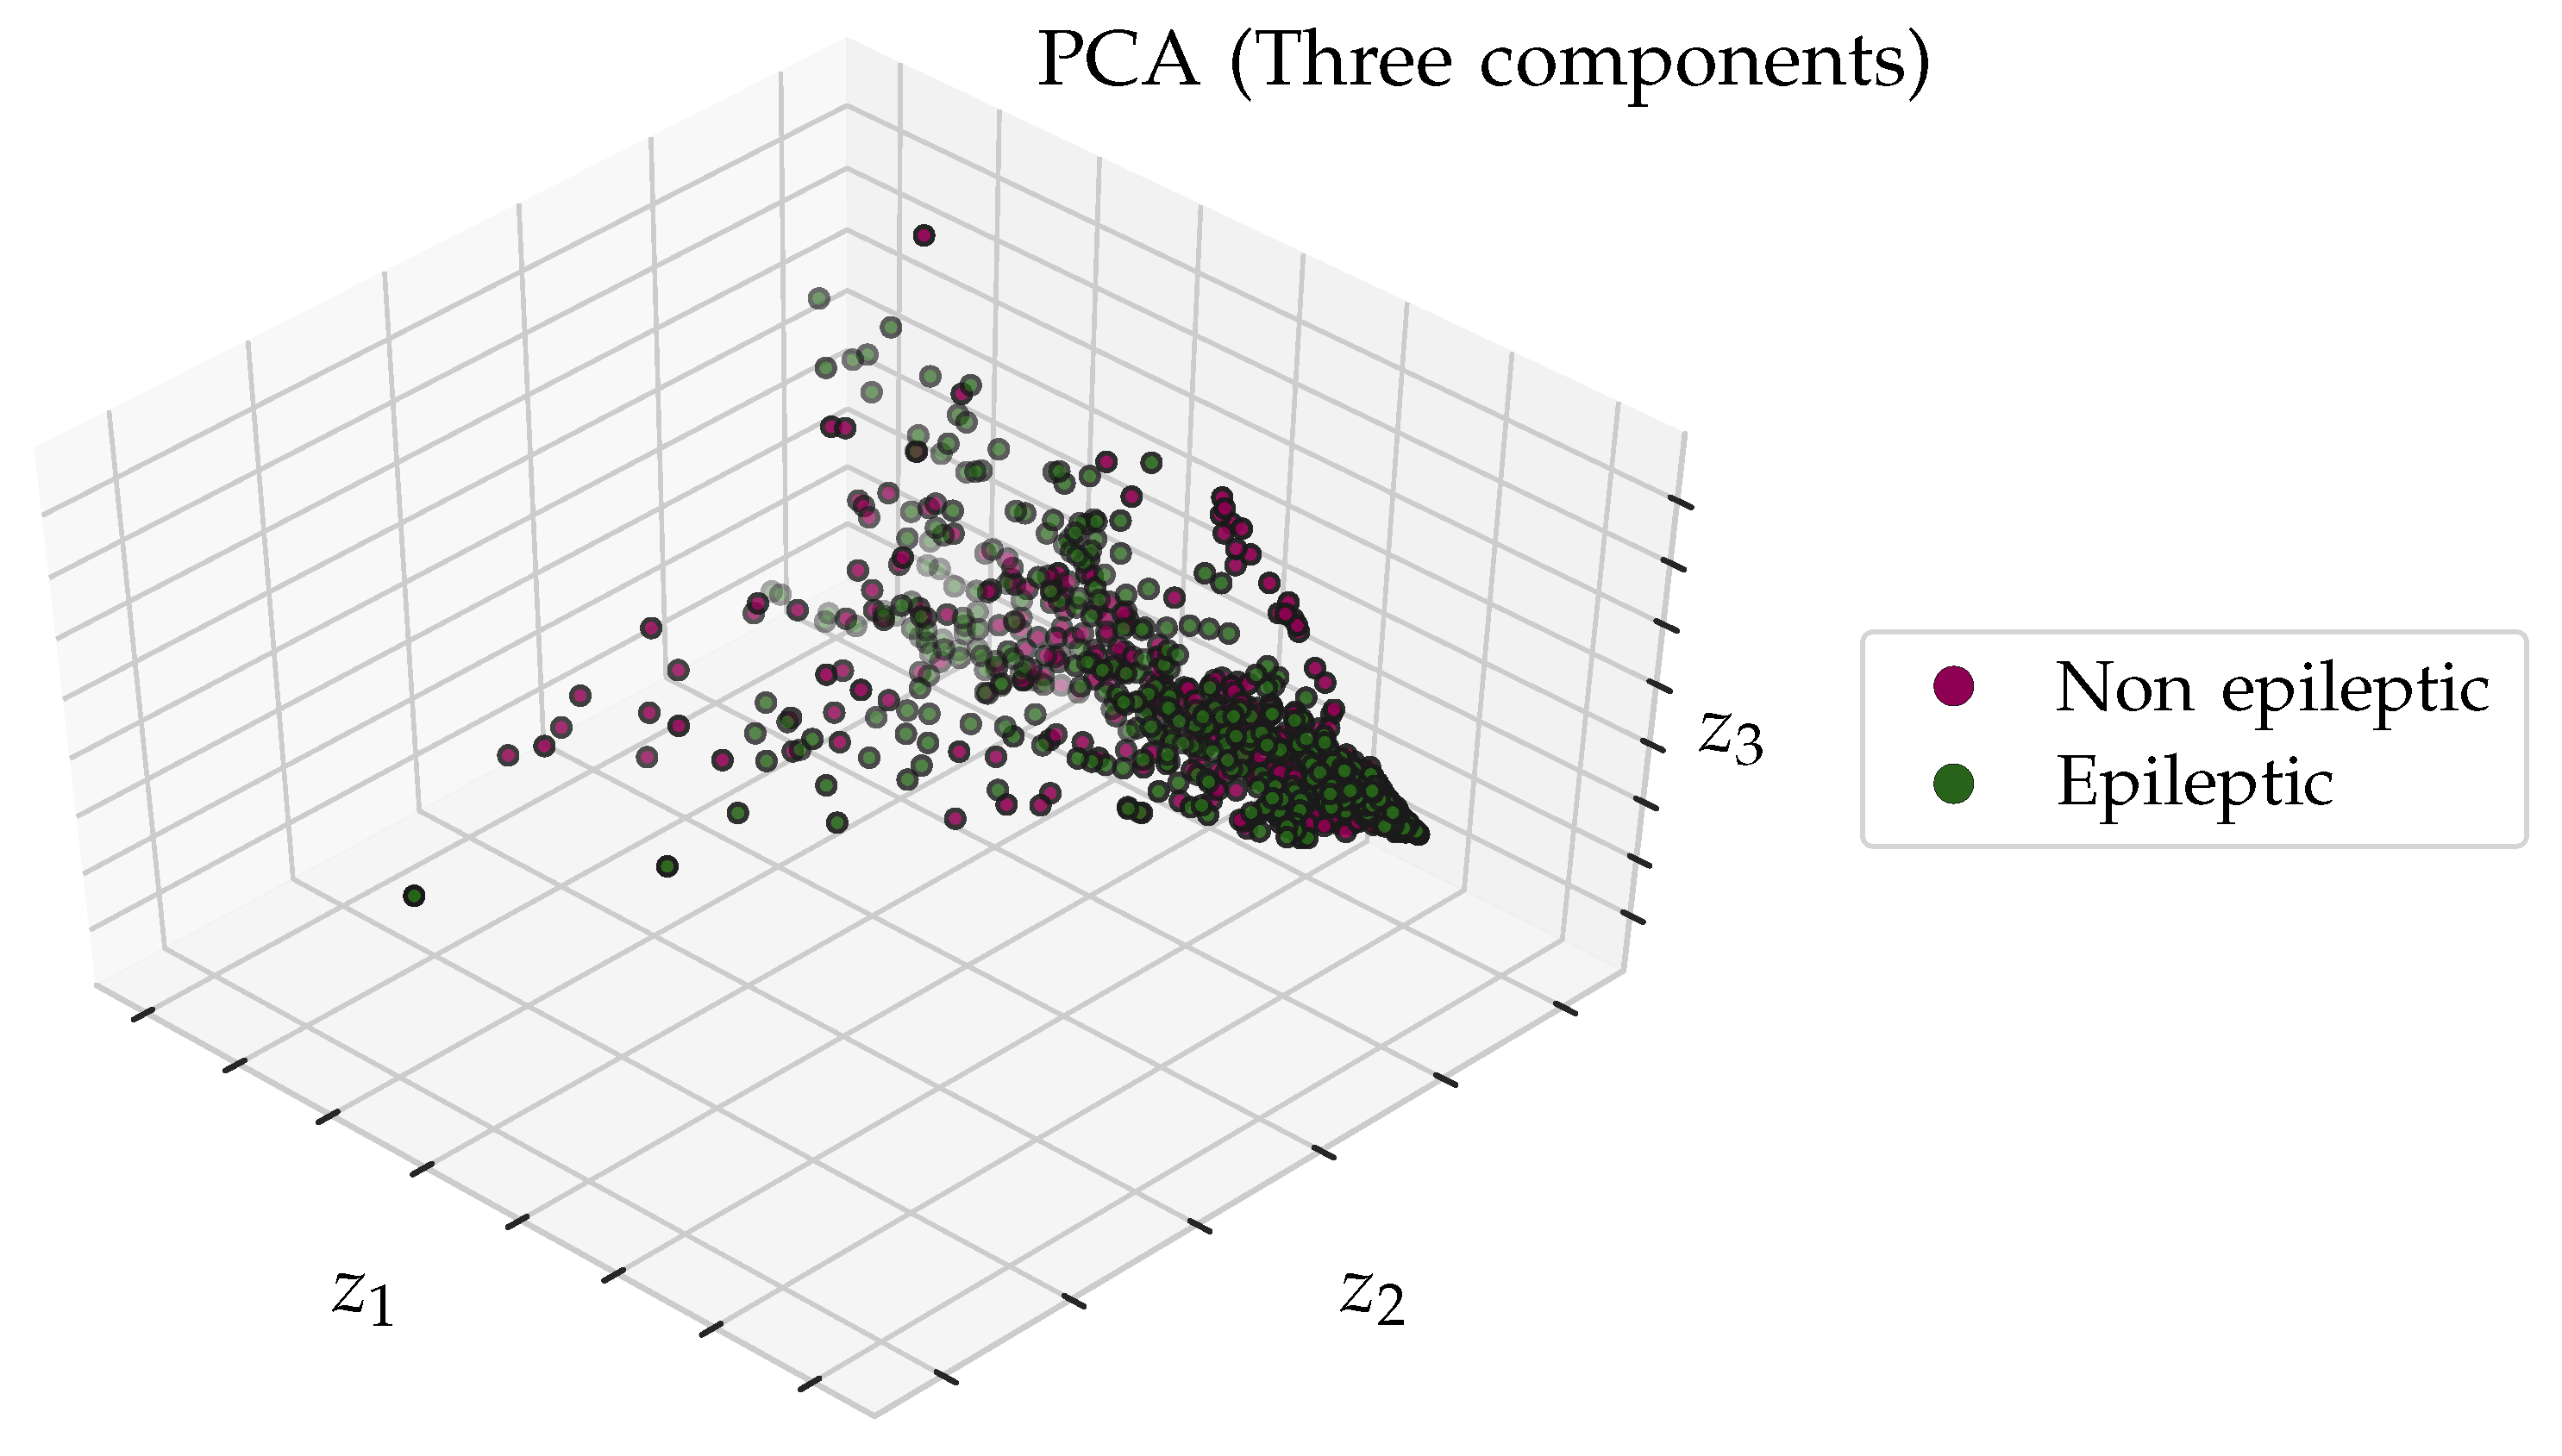
In a second case is performing the description with a 3-dimensional transformation, as shown in Figure 8. In this case, the classes cannot be completely separated with the additional dimension either.
Considering these observations, to classify the classes (for the data used), it is suitable not to carry out the reduction for more than two dimensions.
5. Application of PCA for Logistic Regression Classification
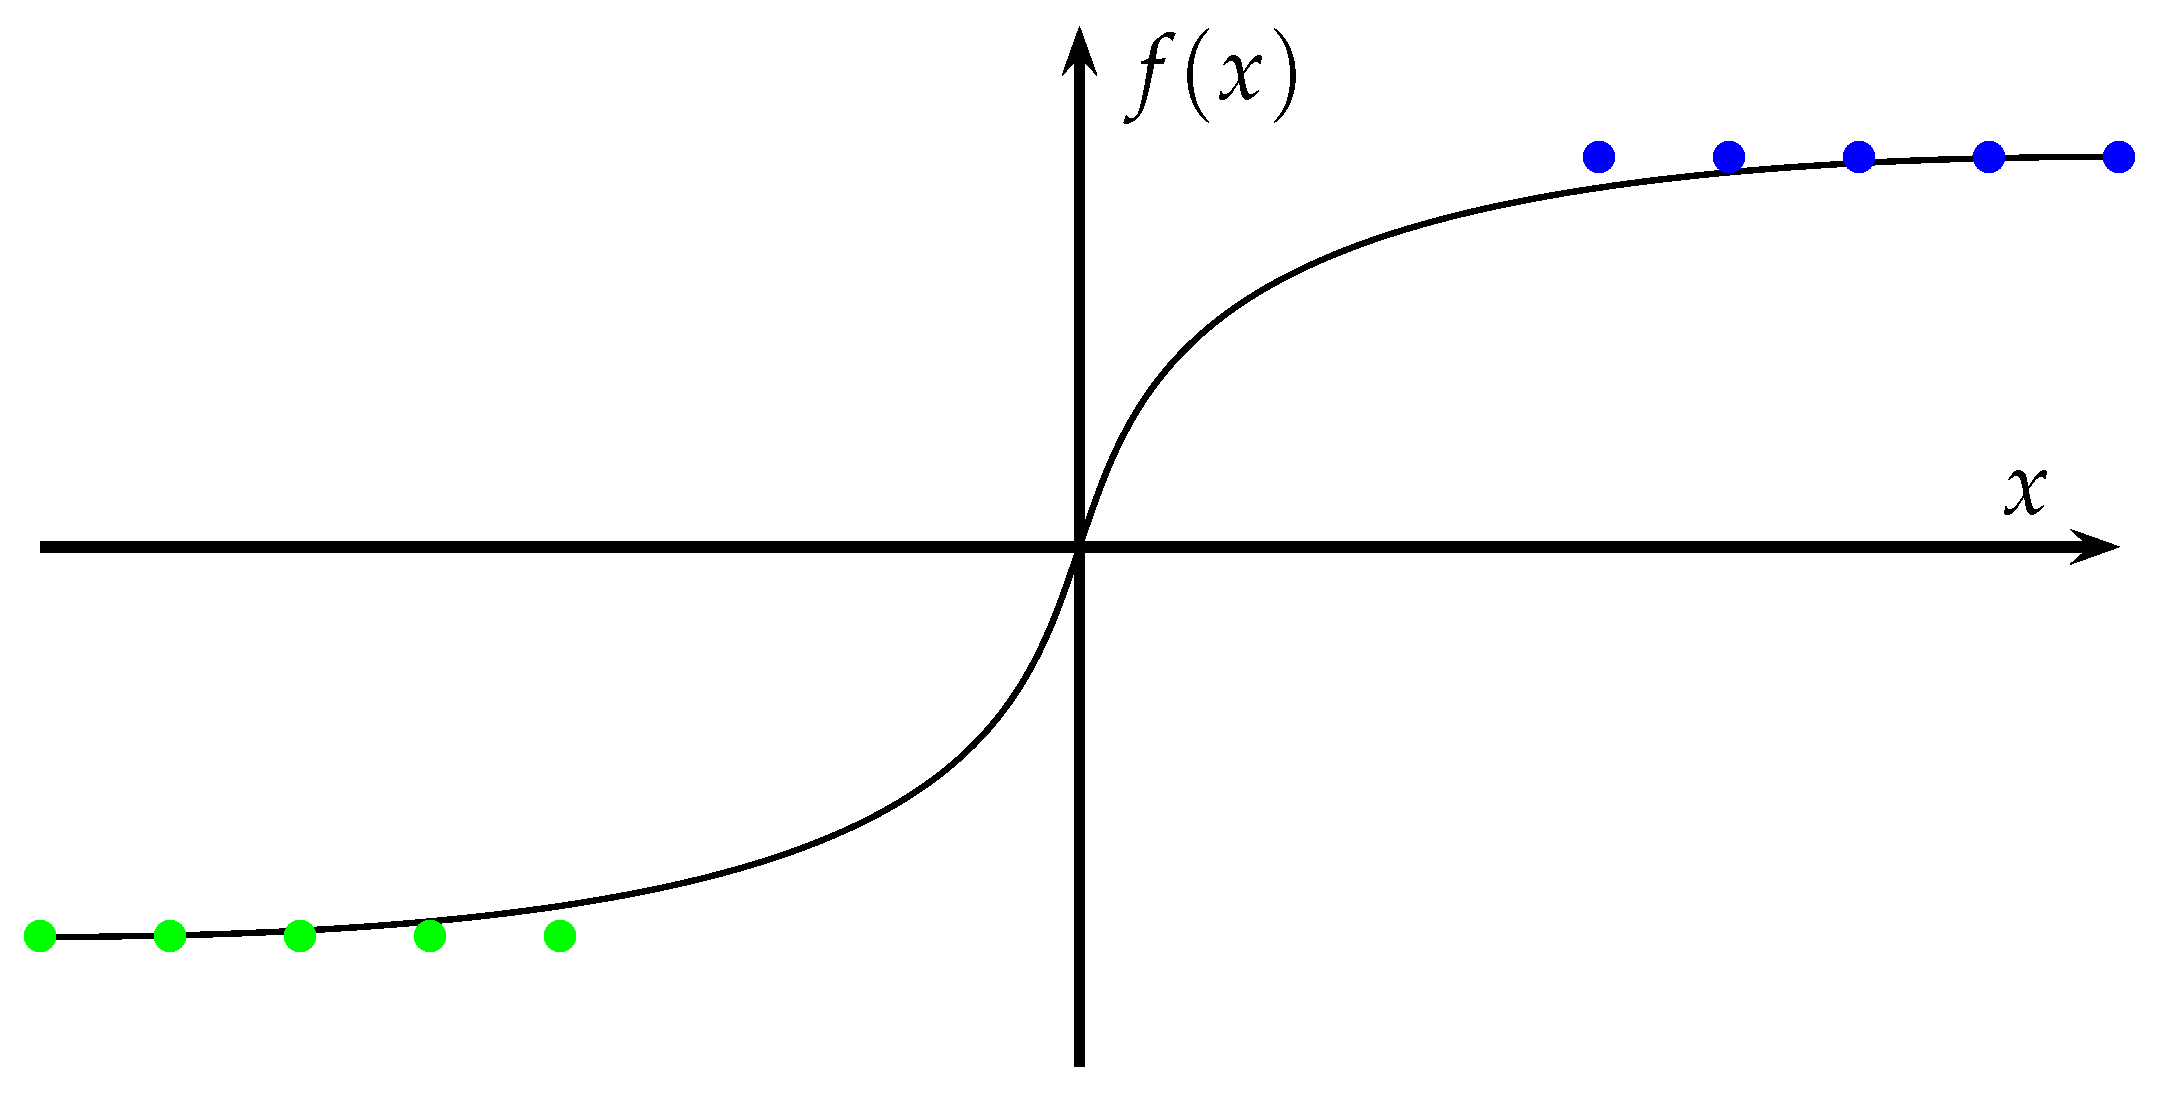
Logistic regression corresponds to a technique that allows data classification, usually employed when having a set of data like those shown in Figure 9, where data with different characteristics can be classified.
In this model, the result is a value between 0 and 1, which can be associated with the probability that x belongs to a class. In the logistic regression is used the sigmoid function given by Equation (7), where z can be calculated as , and, corresponds to the values of the n attributes, and finally are the weights [27].
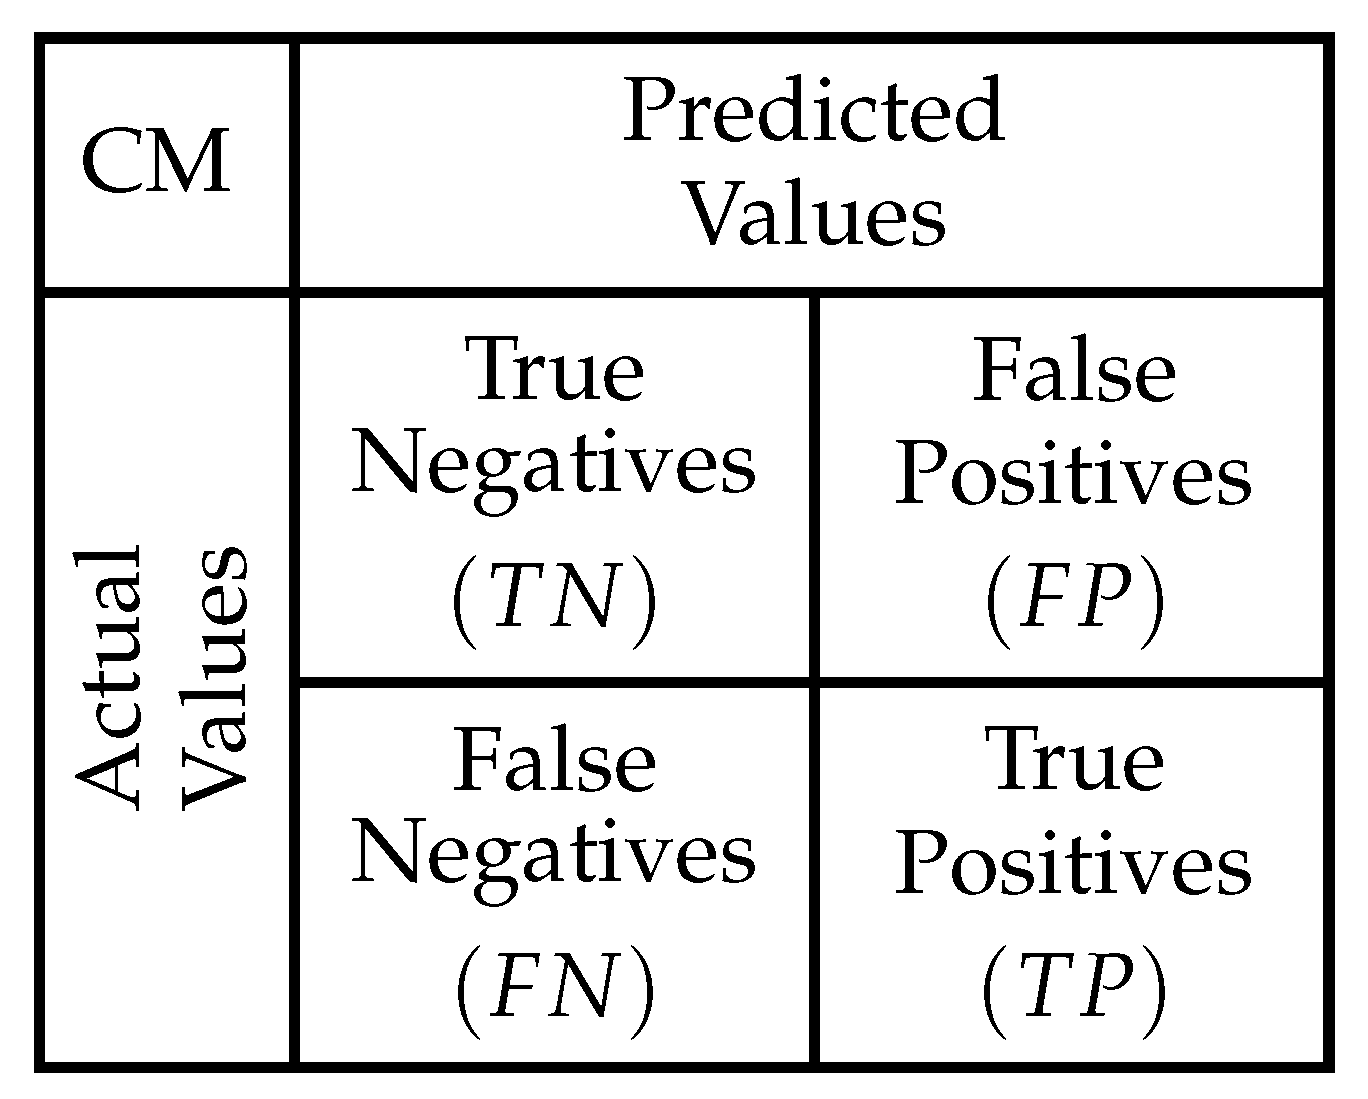
In order to observed the model performance metrics the results are listed in a Confusion Matrix (CM). In Figure 10 each cell of this matrix corresponds to the relations between actual and predicted values calculated by a model.
The precision, recall, and score (performance metrics) can be calculated from the values obtained in confusion matrix. According to [28], the precision metric given by Equation (8) relates the ratio of correctly classified positive data. Meanwhile, recall is calculated using Equation (9) that corresponds to the proportion of positives correctly identified. Finally, the metric score given by Equation (10) corresponds to the harmonic mean between accuracy and completeness.
In order to see the application results of PCA in classification using logistic regression, four experiments are implemented combining the number of features and the singular value decomposition method. The experimental implementation uses 840 EEG signals, taking 420 labeled as epileptic patient examinations and 420 labeled as non-epileptic patients. Additionally, of the data is used for training (32 patients, 672 signals) and for testing (8 patients, 168 signals). The results tables show the metrics employing all 840 signals (40 patients and 21 channels for each patient).
As reference for comparison were implemented two configurations without PCA. First experiment CX1 no using PCA employs the 5 aforementioned input features (frequency bands). On the other hand, a second experiment CX2 was performed increasing the number of features to 8. New features were generated by calculating the product of the alpha-gamma, beta-delta band pairs and the mean values for the 5 frequency bands. Table 3 lists the results of these experiments without PCA application to the input data. In these results, experiment CX2 displays the best performance metrics.
Meanwhile, in Table 4 the first two experiments CZ1 and CZ2 correspond to the application of ARPACK as the SVD technique taking 4 and 7 components. This technique was developed as a Fortran package to find a few eigenvalues or eigenvectors of large sparse matrices [29]. On the other hand, experiments CZ3 and CZ4 correspond to the application of the randomized SVD solver. This technique is based on a stochastic algorithm called Randomized Principal Components Analysis (RPCA) that allows to quickly find an approximation of the principal components that will be generated [30]. As can be seen, PCA was applied in all 4 cases, experiments CZ1 and CZ3 of Table 4 illustrate the results of reducing the features from 5 to 4 (considering configuration CX1 in Table 3). The remaining experiments are the result of reducing the number of features of experiment CX2 of Table 3 from 8 to 7. This reduction is made over the features that were created with feature engineering (product of features).
PCA is usually applied for algorithms enhancement of machine learning to achieve better performance. Given the analysis and the component reduction in frequency made in the previous section, those dimensional reductions were used as inputs of a classifier that uses the logistic regression technique to label individuals as epileptics or non epileptics; those experiments are shown in Table 4.
In accordance with the results experiments in Table 4, the score of those models obtain an improvement in regards to the experiments without dimensional reduction. Comparing the results when employing PCA in Table 4 and Table 3 (when no PCA), the best results are obtained for experiments CZ2 and CZ4. It is also noteworthy that in some configurations using SVD a lower performance is obtained as occurs with the CZ1 configuration in the precision metric.
In addition, to observe the results for the training and validation process, Table 5 displays the Mean Squared Error (MSE) results using training and validation data. From these results, there is a tendency to present a lower MSE value with the validation data.
Finally, Table 6 shows a comparison (for the bests cases) with the models developed in [5] where the classification is carried out without PCA. This table shows the implementation with logistic regression with and without PCA, as well as the implementation with artificial neural networks and vector support machines. As can be seen, the neural network models and vector support machines present a better result than logistic regression, however, when using PCA there is a better result when using logistic regression for classification; thus, it is observed that when using PCA, it is possible to improve the classification by using neural networks and vector support machines.
6. Discussion
The data for this investigation was taken from a public repository, provided by the Temple University [4]. The research included 20 records of epileptic and 20 non-epileptic patients. In this way, new examinations may permit further approaches and obtain information from specific cases.
Regarding the limitations of this work, there are database restrictions, since it is subject to measurements in medical institutions; also, the classification in real time is not considered. Besides, the scope is limited to carry out the classification with logistic regression, since an additional exploration of principal components analysis can be made incorporating characteristics in the time domain, the type of canal, and its location in the patient’s head. Then, the classification with other techniques, such as vector support machines or neural networks, can be carried out in a later work since the principal component analysis can be expanded using other characteristics. Considering this, the work presented in [5] can be complemented via PCA.
The comparison with other models is carried out with the previous implementations performed in [5], where the analysis of principal components and the reduction of dimensions are not implemented.
It should also be considered that the data from the 21 channels were used; therefore, in a later work, the additional analysis should be carried out to identify the most relevant channels to perform the classification.
7. Conclusions
This work aimed to determine if PCA can be applied to enhance the classification of epilepsy-related abnormalities through EEGs. Classification features were expressed, in terms of power associated to frequency bands. From these data, a base data set could be labeled in a binary way (for healthy patients, class 0 was used and for epileptic patients, class 1).
It should be recalled that experiment CZ4, in Table 4, shows the bets improvements in its metrics after applying PCA. However, in some cases, using PCA the improvement is not allowed; this shows that it is also important a suitable selection of features before applying PCA.
As seen in the results, a reduction is made from five to four dimensions, as well as from eight to seven, in the precision metric, an improvement is obtained for the reduction from eight to seven dimensions, while the recall and score were obtained improvements for the reduction from five to four and eight to seven dimensions. Considering the different implementations, the best metric values obtained without PCA were: precision , recall , and score ; meanwhile, the best results obtained using PCA were: precision , recall , and score .
In a further work, to improve the classification before applying PCA, a clustering technique can be used to select the relevant channels and include this information in classification features.
The input data set for the models can be supplemented with characteristics extracted not only from frequency bands but also considering other metrics. Finally, the current system corresponds to a model to detect epilepsy; however, its implementation is extensible to other diseases, as well as its use in portable devices.
Author Contributions
Conceptualization, M.C.G., J.S.P. and H.E.E.; methodology, M.C.G., J.S.P. and H.E.E.; project administration, H.E.E.; supervision, H.E.E.; validation, M.C.G. and J.S.P.; writing—original draft, M.C.G. and J.S.P.; writing—review and editing, M.C.G., J.S.P. and H.E.E. All authors have read and agreed to the published version of the manuscript.
Funding
This research received no external funding.
Institutional Review Board Statement
In this work, direct tests were not carried out on individuals (humans). The historical data used for this study is in [4].
Informed Consent Statement
The data used was requested from [4].
Data Availability Statement
The original database is at [4].
Acknowledgments
The authors express gratitude to the Universidad Distrital Francisco José de Caldas.
Conflicts of Interest
The authors declare no conflict of interest.
References
- Pottoo, F.H.; Salahuddin, M.; Khan, F.A.; AL Dhamen, M.A.; Alsaeed, W.J.; Gomaa, M.S.; Vatte, C.; Alomary, M.N. Combinatorial Regimen of Carbamazepine and Imipramine Exhibits Synergism against Grandmal Epilepsy in Rats: Inhibition of Pro-Inflammatory Cytokines and PI3K/Akt/mTOR Signaling Pathway. Pharmaceuticals 2021, 14, 1204. [Google Scholar] [CrossRef] [PubMed]
- Nolan, S.J.; Marson, A.G.; Weston, J.; Smith, C.T. Carbamazepine versus phenobarbitone monotherapy for epilepsy: An individual participant data review. Cochrane Database Syst. Rev. 2015, 23. [Google Scholar] [CrossRef] [Green Version]
- Fabrice, W.; Marco, C.; Fernando, H.; da Silva, F.L. EEG Analysis: Theory and Practice; Oxford University Press: Oxford, UK, 2017; pp. 1147–1177. [Google Scholar]
- Obeid, I.; Picone, J. The Temple University Hospital EEG Data Corpus. Front. Neurosci. 2016, 10, 196. [Google Scholar] [CrossRef] [PubMed] [Green Version]
- Guerrero, M.C.; Parada, J.S.; Espitia, H.E. EEG signal analysis using classification techniques: Logistic regression, artificial neural networks, support vector machines, and convolutional neural networks. Heliyon 2021, 7, e07258. [Google Scholar] [CrossRef] [PubMed]
- Parvez, M.Z.; Paul, M. EEG signal classification using frequency band analysis towards epileptic seizure prediction. In Proceedings of the 16th International Conference Computer and Information Technology, ICCIT 2013, Khulna, Bangladesh, 8–10 March 2014; pp. 126–130. [Google Scholar] [CrossRef]
- Xie, S. Wavelet Power Spectral Domain Functional Principal Component Analysis for Feature Extraction of Epileptic EEGs. Computation 2021, 9, 78. [Google Scholar] [CrossRef]
- Xiong, Z.; Wang, H.; Zhang, L.; Fan, T.; Shen, J.; Zhao, Y.; Liu, Y.; Wu, Q. A Study on Seizure Detection of EEG Signals Represented in 2D. Sensors 2021, 21, 5145. [Google Scholar] [CrossRef] [PubMed]
- Kang, J.H.; Chung, Y.G.; Kim, S.P. An efficient detection of epileptic seizure by differentiation and spectral analysis of electroencephalograms. Comput. Biol. Med. 2015, 66, 352–356. [Google Scholar] [CrossRef] [PubMed]
- Hjorth, B. EEG analysis based on time domain properties. Electroencephal. Clin. Neurophysiol. 1970, 29, 306–310. [Google Scholar] [CrossRef]
- Rajaguru, H.; Prabhakar, S.K. Logistic regression Gaussian mixture model and softmax discriminant classifier for epilepsy classification from EEG signals. In Proceedings of the 2017 International Conference on Computing Methodologies and Communication (ICCMC), Erode, India, 18–19 July 2017; pp. 985–988. [Google Scholar] [CrossRef]
- Rajaguru, H.; Prabhakar, S.K. Non linear ICA and logistic regression for classification of epilepsy from EEG signals. In Proceedings of the International Conference on Electronics, Communication and Aerospace Technology, ICECA 2017, Coimbatore, India, 20–22 April 2017; pp. 577–580. [Google Scholar] [CrossRef]
- He, C.; Chikara, R.K.; Yeh, C.L.; Ko, L.W. Neural Dynamics of Target Detection via Wireless EEG in Embodied Cognition. Sensors 2021, 21, 5213. [Google Scholar] [CrossRef] [PubMed]
- Yao, L.; Wang, M.; Lu, Y.; Li, H.; Zhang, X. EEG-Based Emotion Recognition by Exploiting Fused Network Entropy Measures of Complex Networks across Subjects. Entropy 2021, 23, 984. [Google Scholar] [CrossRef] [PubMed]
- Pousson, J.E.; Voicikas, A.; Bernhofs, V.; Pipinis, E.; Burmistrova, L.; Lin, Y.P.; Griškova-Bulanova, I. Spectral Characteristics of EEG during Active Emotional Musical Performance. Sensors 2021, 21, 7466. [Google Scholar] [CrossRef] [PubMed]
- Rundo, F.; Rinella, S.; Massimino, S.; Coco, M.; Fallica, G.; Parenti, R.; Conoci, S.; Perciavalle, V. An Innovative Deep Learning Algorithm for Drowsiness Detection from EEG Signal. Computation 2019, 7, 13. [Google Scholar] [CrossRef] [Green Version]
- Vecchio, F.; Miraglia, F.; Pappalettera, C.; Orticoni, A.; Alú, F.; Judica, E.; Cotelli, M.; Rossini, P.M. Entropy as Measure of Brain Networks’ Complexity in Eyes Open and Closed Conditions. Symmetry 2021, 13, 2178. [Google Scholar] [CrossRef]
- Katmah, R.; Al-Shargie, F.; Tariq, U.; Babiloni, F.; Al-Mughairbi, F.; Al-Nashash, H. A Review on Mental Stress Assessment Methods Using EEG Signals. Sensors 2021, 21, 5043. [Google Scholar] [CrossRef] [PubMed]
- Sharma, M.; Patel, V.; Tiwari, J.; Acharya, U.R. Automated Characterization of Cyclic Alternating Pattern Using Wavelet-Based Features and Ensemble Learning Techniques with EEG Signals. Diagnostics 2021, 11, 1380. [Google Scholar] [CrossRef] [PubMed]
- Zhang, S.; Feng, X.; Shen, Y. Quantifying Auditory Presence Using Electroencephalography. Appl. Sci. 2021, 11, 10461. [Google Scholar] [CrossRef]
- Al-Fahoum, A.S.; Al-Fraihat, A.A. Methods of EEG Signal Features Extraction Using Linear Analysis in Frequency and Time-Frequency Domains. ISRN Neurosci. 2014, 2014, 1–7. [Google Scholar] [CrossRef] [Green Version]
- Hindarto, H.; Sumarno, S. Feature Extraction of Electroencephalography Signals Using Fast Fourier Transform. CommIT (Commun. Inf. Technol.) J. 2016, 10, 49. [Google Scholar] [CrossRef] [Green Version]
- Vidal, R.; Ma, Y.; Sastry, S.S. Generalized Principal Component Analysis; Springer: New York, NY, USA, 2016. [Google Scholar] [CrossRef]
- Raschka, S.; Mirjalili, V. Python Machine Learning: Machine Learning and Deep Learning with Python, Scikit-Learn, and TensorFlow 2, 3rd ed.; Packt Publishing: Birmingham, UK, 2019. [Google Scholar]
- Learning, J. Python: This Book Includes: The Guide for Beginners, Machine Learning; Independently Published, 2019. [Google Scholar]
- Kong, X.; Hu, C.; Duan, Z. Principal Component Analysis Networks and Algorithms; Springer: Singapore, 2017; pp. 1–323. [Google Scholar] [CrossRef]
- Sammut, C.; Webb, G.I. (Eds.) Logistic Regression. In Encyclopedia of Machine Learning and Data Mining; Springer: Boston, MA, USA, 2017; Chapter L; pp. 780–781. [Google Scholar] [CrossRef]
- Powers, D. Evaluation: From Precision, Recall and F-Factor to ROC, Informedness, Markedness & Correlation. Mach. Learn. Technol. 2008, 2, 37–63. [Google Scholar]
- Department of Computational and Applied Mathematics Rice University. ARPACK SOFTWARE. 2020. Available online: https://www.caam.rice.edu/software/ARPACK/ (accessed on 7 December 2020).
- Géron, A. Hands-On Machine Learning with Scikit-Learn and TensorFlow: Concepts, Tools, and Techniques to Build Intelligent Systems; O’Reilly Media: Sebastopol, CA, USA, 2017. [Google Scholar]
Figure 1.
TCP Configuration and channel distribution.

Figure 2.
Signals of an epileptic and non-epileptic patient in the time domain.

Figure 3.
Signals of an epileptic and a non-epileptic patient in the frequency domain.

Figure 4.
Example of principal axis for a set of data.

Figure 5.
Example of dimensions reduction.

Figure 6.
Percentage of explained variances for the principal components.

Figure 7.
Two-components transformation for the relative power features.

Figure 8.
Three-components transformation for the relative power features.

Figure 9.
Example of logistic regression.

Figure 10.
Confusion matrix representation.


Table 1.
Ages and gender of the samples that are part of the data set.
| Age | 1–20 | 21–30 | 31–40 | 41–50 | 51–60 | 61–70 | 71–80 |
|---|---|---|---|---|---|---|---|
| Female | 2 | 2 | 3 | 3 | 4 | 5 | 3 |
| Male | 2 | 3 | 1 | 2 | 6 | 3 | 1 |
Table 2.
Frequency bands activity.
| Activity | Frequency (Hz) |
|---|---|
| Delta () | 0.5–4 |
| Theta () | 4–8 |
| Alpha () | 8–13 |
| Beta () | 13–30 |
| Gamma () | 30–40 |
Table 3.
Results of logistic regression for classification of epileptic and non-epileptic patients (no PCA used).
Table 3.
Results of logistic regression for classification of epileptic and non-epileptic patients (no PCA used).
| Experiment | Features | Precision | Recall | Score |
|---|---|---|---|---|
| CX1 | 5 | 0.550 | 0.377 | 0.447 |
| CX2 | 8 | 0.560 | 0.690 | 0.620 |
Table 4.
Experiments summary of PCA as inputs for a logistic regression classifier.
| Experiment | Components | Precision | Recall | Score |
|---|---|---|---|---|
| CZ1 | 4 | 0.461 | 0.610 | 0.513 |
| CZ2 | 7 | 0.728 | 0.750 | 0.760 |
| CZ3 | 4 | 0.502 | 0.602 | 0.543 |
| CZ4 | 7 | 0.734 | 0.787 | 0.776 |
Table 5.
MSE results for training and validation process.
| Experiment | Components | Training MSE | Validation MSE |
|---|---|---|---|
| CX1 | 5 | 0.4591 | 0.3518 |
| CX2 | 8 | 0.4565 | 0.3333 |
| CZ1 | 4 | 0.4697 | 0.4635 |
| CZ2 | 7 | 0.4120 | 0.3129 |
| CZ3 | 4 | 0.4608 | 0.4404 |
| CZ4 | 7 | 0.4107 | 0.3095 |
Publisher’s Note: MDPI stays neutral with regard to jurisdictional claims in published maps and institutional affiliations. |
© 2021 by the authors. Licensee MDPI, Basel, Switzerland. This article is an open access article distributed under the terms and conditions of the Creative Commons Attribution (CC BY) license (https://creativecommons.org/licenses/by/4.0/).
Share and Cite
MDPI and ACS Style
Guerrero, M.C.; Parada, J.S.; Espitia, H.E. Principal Components Analysis of EEG Signals for Epileptic Patient Identification. Computation 2021, 9, 133. https://0-doi-org.brum.beds.ac.uk/10.3390/computation9120133
AMA Style
Guerrero MC, Parada JS, Espitia HE. Principal Components Analysis of EEG Signals for Epileptic Patient Identification. Computation. 2021; 9(12):133. https://0-doi-org.brum.beds.ac.uk/10.3390/computation9120133
Chicago/Turabian StyleGuerrero, Maria Camila, Juan Sebastián Parada, and Helbert Eduardo Espitia. 2021. "Principal Components Analysis of EEG Signals for Epileptic Patient Identification" Computation 9, no. 12: 133. https://0-doi-org.brum.beds.ac.uk/10.3390/computation9120133
Note that from the first issue of 2016, this journal uses article numbers instead of page numbers. See further details here.