Performance Optimization of MANET Networks through Routing Protocol Analysis


Department of Computer Science and Electronics, Universitas Gadjah Mada, Yogyakarta 55281, Indonesia
*
Author to whom correspondence should be addressed.
Computers 2021, 10(1), 2; https://0-doi-org.brum.beds.ac.uk/10.3390/computers10010002
Submission received: 9 November 2020
/
Revised: 10 December 2020
/
Accepted: 10 December 2020
/
Published: 22 December 2020
Abstract
:A Mobile Ad Hoc Network (MANET) protocol requires proper settings to perform data transmission optimally. To overcome this problem, it is necessary to select the correct routing protocol and use the routing protocol’s default parameter values. This study examined the effect of route request parameters, such as RREQ_RETRIES and MAX_RREQ_TIMOUT, on the Ad Hoc On-demand Distance Vector (AODV) protocol, which was then compared with the default AODV performance Optimized Link State Routing (OLSR) protocols. The performance metrics used for measuring performance were Packet Delivery Ratio (PDR), throughput, delay, packet loss, energy consumption, and routing overhead. The results show that the OLSR protocol has a smaller delay than the AODV protocol, while in other measurements, the AODV protocol is better than OLSR. By reducing the combination value of RREQ_RETRIES, MAX_RREQ_TIMEOUT in AODV routing to (2, 10 s) and (3, 5 s), the protocol’s performance can be improved. The two combinations result in an average increase in throughput performance of 3.09%, a decrease in delay of 17.7%, a decrease in packet loss of 27.15%, and an increase in PDR of 4.8%. For variations in the speed of movement of nodes, 20 m/s has the best performance, while 5 m/s has the worst performance.
1. Introduction
A Mobile Ad Hoc Network (MANET) is an autonomous ad hoc wireless network that consists of many nodes, in which the nodes dynamically move so that the topology changes [1]. MANET can communicate without centralized administration and is supported by wireless communication technologies such as WiFi, ZigBee, and WiMAX [2]. MANET is generally used in places where a permanent infrastructure cannot be formed, such as disaster areas, battlefields, cars, military formations, ships, and aircraft intended to form temporary networks, so that the devices can be free both in and out of network coverage [3,4,5]. Nodes in MANET in the form of communication devices are laptops, smartphones, and sensors. Their performance characteristics include dynamic topology and limited bandwidth, battery life, processing power, and storage capacity [6]. The MANET simulation’s mobility model is divided into four categories: random models, models with temporal dependency, models with spatial dependence, and models with geographic restrictions [7]. In this research, we used mobile modeling of moving nodes to avoid obstacles [8], randomly [9], in a limited simulation space on an ad hoc network.
The challenges of routing and security should be identified properly before deploying a MANET [10]. The routing protocols play an important role in ensuring reliable communication among nodes in MANET [11]. Routing is the process of transmitting packets from one network to another [12]. Routing protocols in MANET must also be able to adjust the changes in the changing network topology. Therefore, a reliable routing protocol is needed with a low overhead in managing MANET, which can be seen from the Quality of Service (QoS) parameters such as Packet Delivery Ratio (PDR), throughput, packet loss, and delay [13,14,15].
Several kinds of research have been conducted on reactive and proactive routing protocols on MANET. Among the results, studies show that the Ad Hoc On-demand Distance Vector (AODV) protocol has good throughput and end-to-end delay [5], good energy consumption [16], is suitable for application to moving nodes [17], and has a good performance with increased speed for average end-to-end metrics [18]. In contrast, the Optimized Link State Routing (OLSR) protocol is a proactive routing protocol developed based on the link state routing algorithm and is an optimal technique to extract information relating to the network topology [19]. OLSR has the advantage of the delay being relatively low because it is a routing table. Compared with AODV, OLSR has better throughput, packet loss, and delay [6]. OLSR has the advantage of average end-to-end delays, where the delay is less than other protocols [20], better in terms of dense and highly dynamic topology [21], and suitable for delay-sensitive applications [22].
Previous research using the AODV protocol has not examined the effect of the performance’s changing parameters. However, in an ad hoc network environment such as MANET, the route discovery and route maintenance process is the key concept that deals with topology changes [23]. Other than that, routing parameter values such as Active Route Timeout (ART) also play an important role in providing stable routing in a dynamic environment, where the network topology changes continuously and quickly [23,24]. Research on the performance of the default parameters has been carried out by [23,24,25,26,27]. Studies [25,27] examined the effects of route maintenance and HELLO messages parameters. The route maintenance parameters are Active Route Timeout (ART) and delete period constant (n), while HELLO messages include HELLO_INTERVAL and ALLOWED_HELLO_LOST. Both studies show that the default parameters of the AODV protocol do not always produce the best results. The best results from the two studies were generated by reducing the parameter values, such as changing the ART value to 2.5 (default value: 2.5) and the HELLO_INTERVAL value to 0.5 (default value: 1). The change in these parameters’ values can cause an increase or decrease in the routing overhead and PDR. If the parameter value changes too far from the default value, the resulting performance is strange.
Other studies of ART parameters on AODV protocols were conducted by [23,27], and research on Delete Period Constant (DPC) parameters was conducted by [24]. All three studies also show that the default values of AODV parameters do not always have optimal performance. The optimal MANET performance is produced with ART values smaller than the default values, the values of which are between 0.5 and 3. As well as DPC parameters, the best performance is produced by values of 6 for Variable Bitrate (VBR) traffic and 3 for Constant Bitrate (CBR) traffic.
This study examined the effect of route request parameters such as RREQ_RETRIES and MAX_RREQ_TIMOUT on the AODV protocol, which was then compared with the default AODV performance OLSR routing protocols. The performance metrics used in performance measurement were Packet Delivery Ratio (PDR), throughput, delay, packet loss, energy consumption, and routing overhead. Network performances are good if they have a high throughput and packet delivery ratio (PDR) and low packet loss and delay [6].
2. Materials and Methods
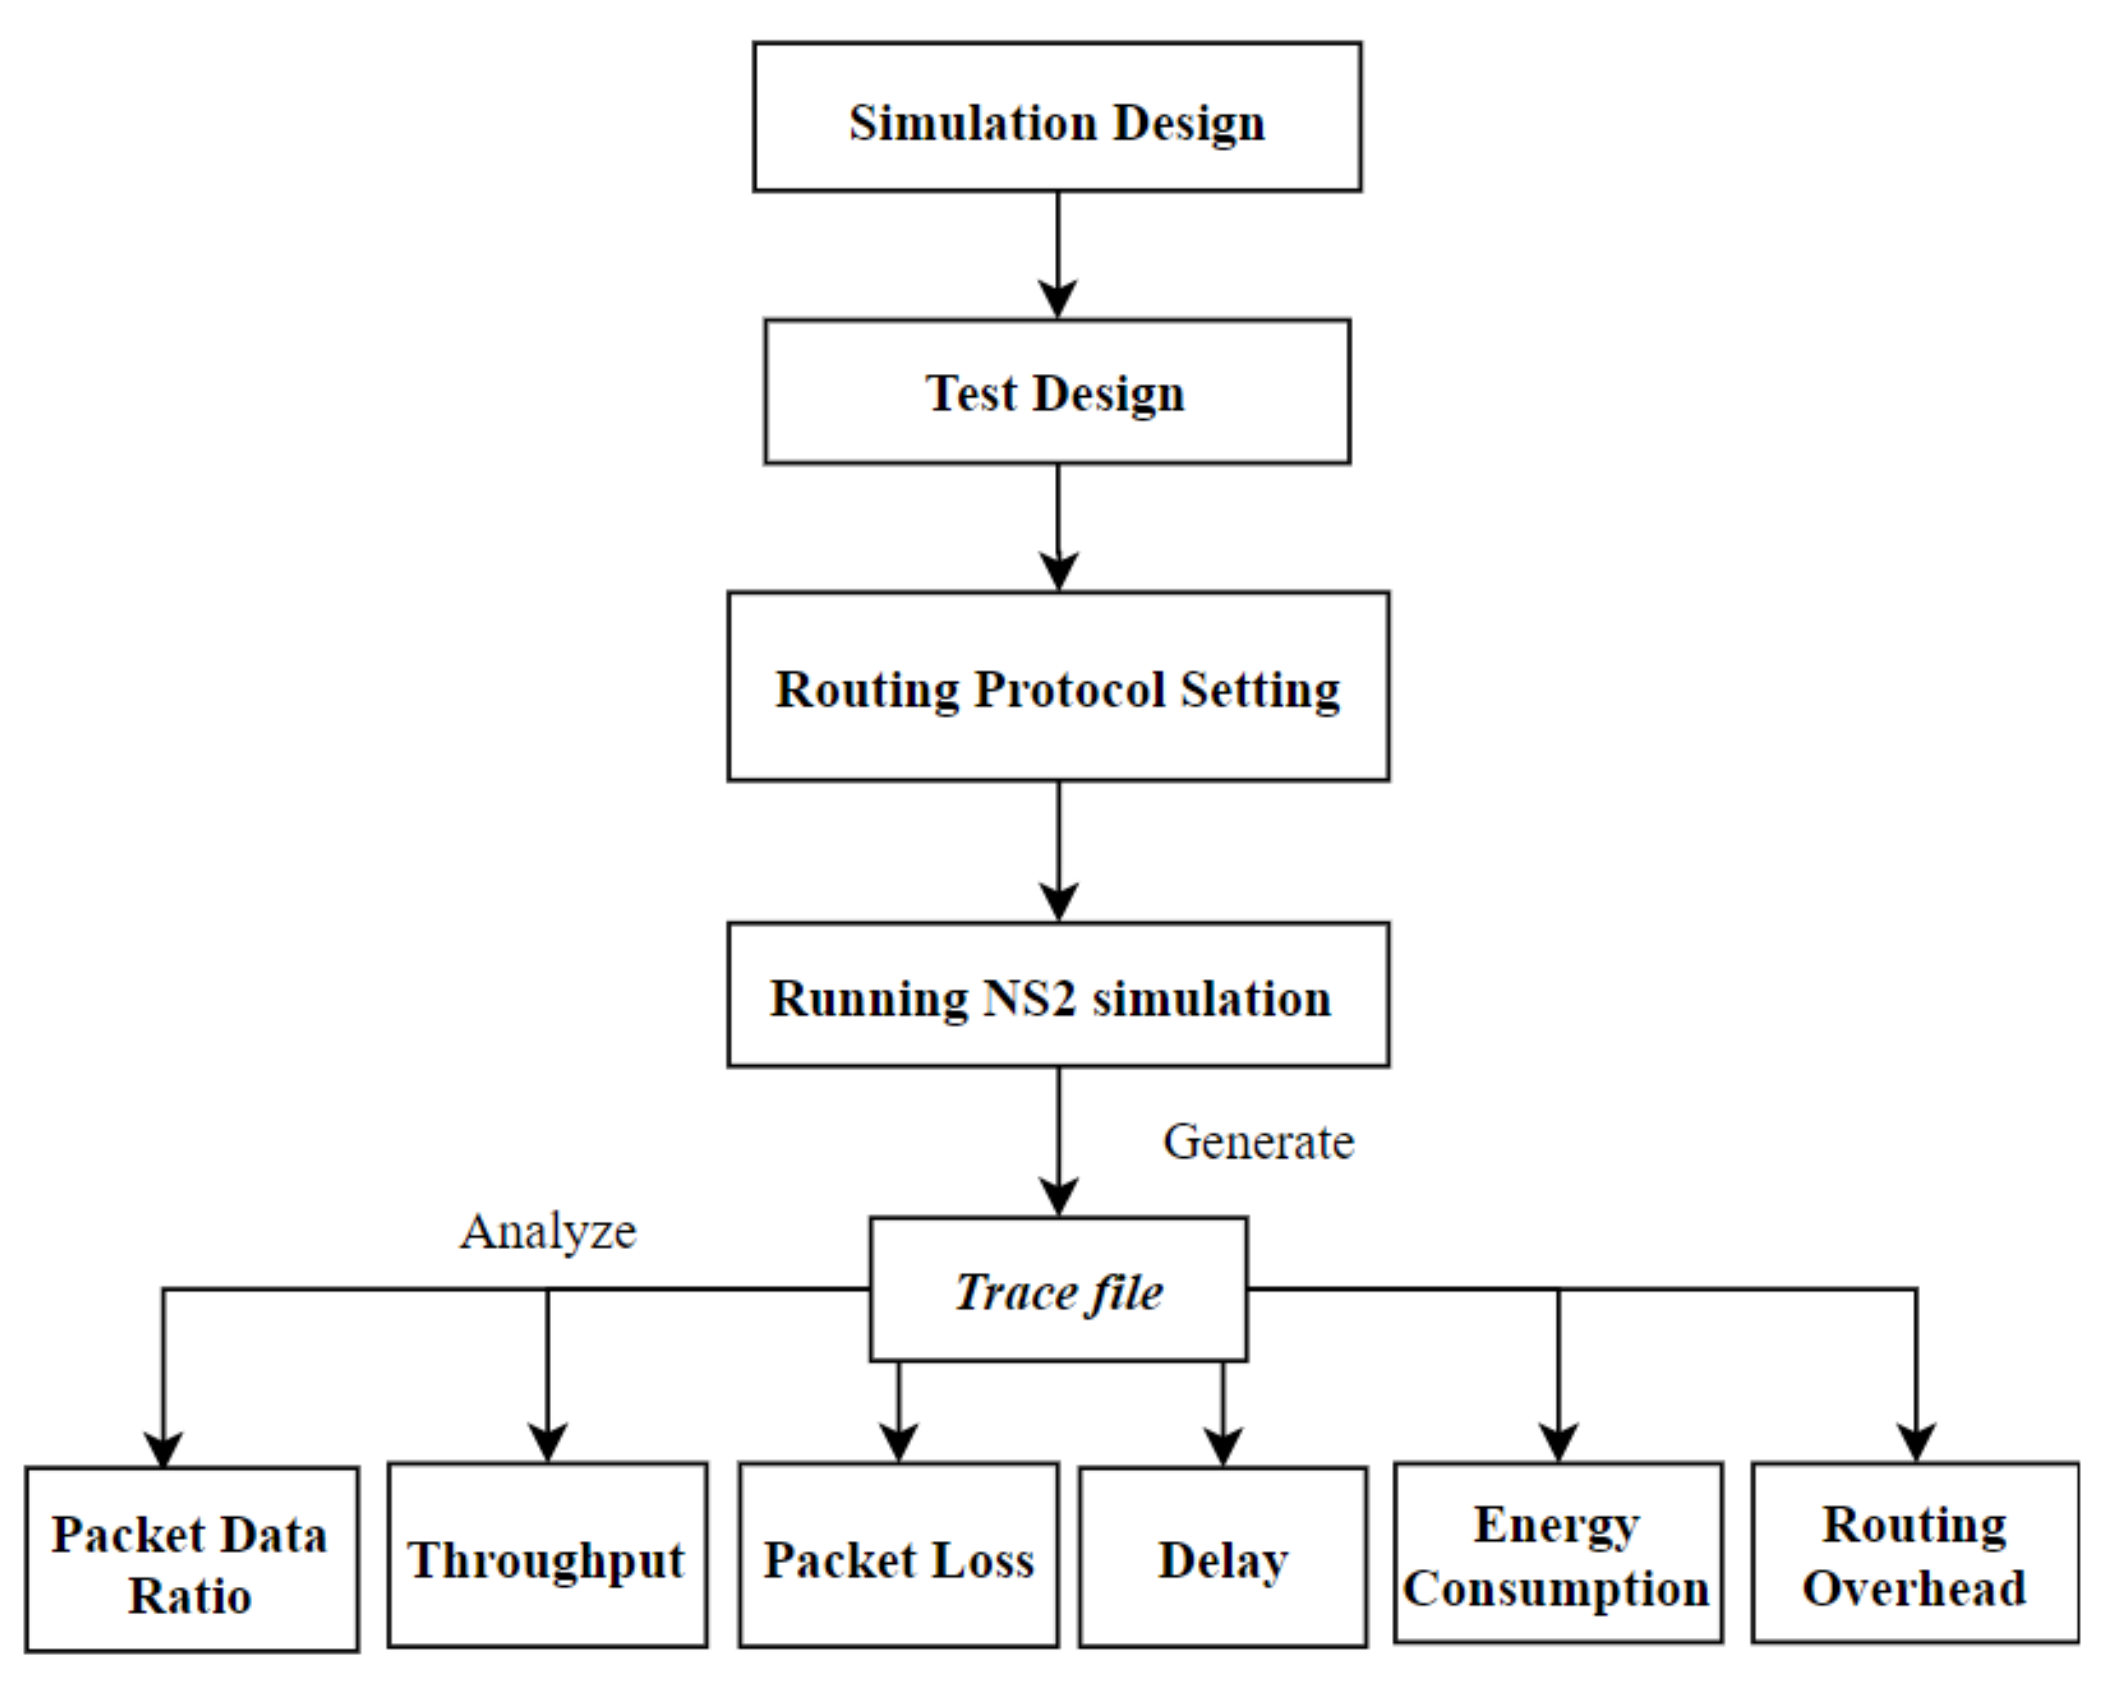
The methodology used in the present research was a simulation using the NS2 simulator. It was started by designing a simulation. The simulation design was carried out to determine the examples of cases in the real world that would be simulated to determine the simulation parameters. Next, the process continued, with the scenarios’ test design relating to the routing protocol’s performance test, designing the node positions, and the network traffic. AODV and OLSR routing protocol settings were developed to set the AODV routing parameters and install the OLSR routing protocols. Next, the simulation was run, and it produced a trace file used to analyze the values of PDR, throughput, packet loss, delay, energy consumption, and routing overhead. A general description of the research methodology is shown in Figure 1.
2.1. Simulation Design
The case selection in the present research was significant because it would affect the design of the simulation scenarios. MANET can be used in real applications on mobile communication devices such as notebooks, smartphones, and data exchange sensors. In this study, the chosen case involved a smartphone or sensor attached to a vehicle; therefore, it could send packet data to other devices or base stations. To support this scenario, we used a simulation area of 1000 × 1000 m, the UDP transport protocol, and a packet size of 512 bytes with delivery every 10 times in 1 min with a maximum number of packets of 1000 on each connection. Table 1 shows the parameters and values used during the research.
2.2. Test Design
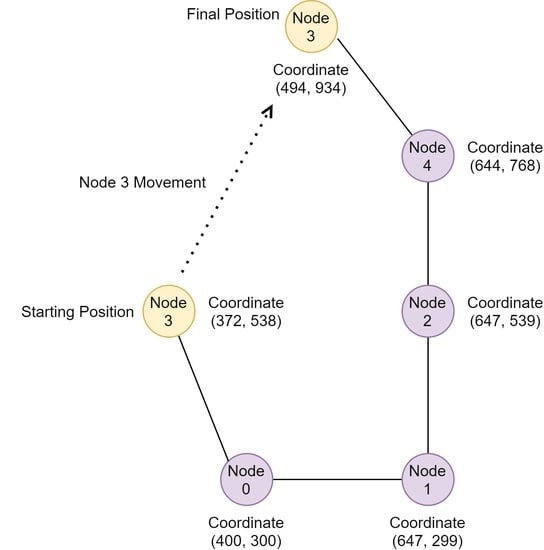
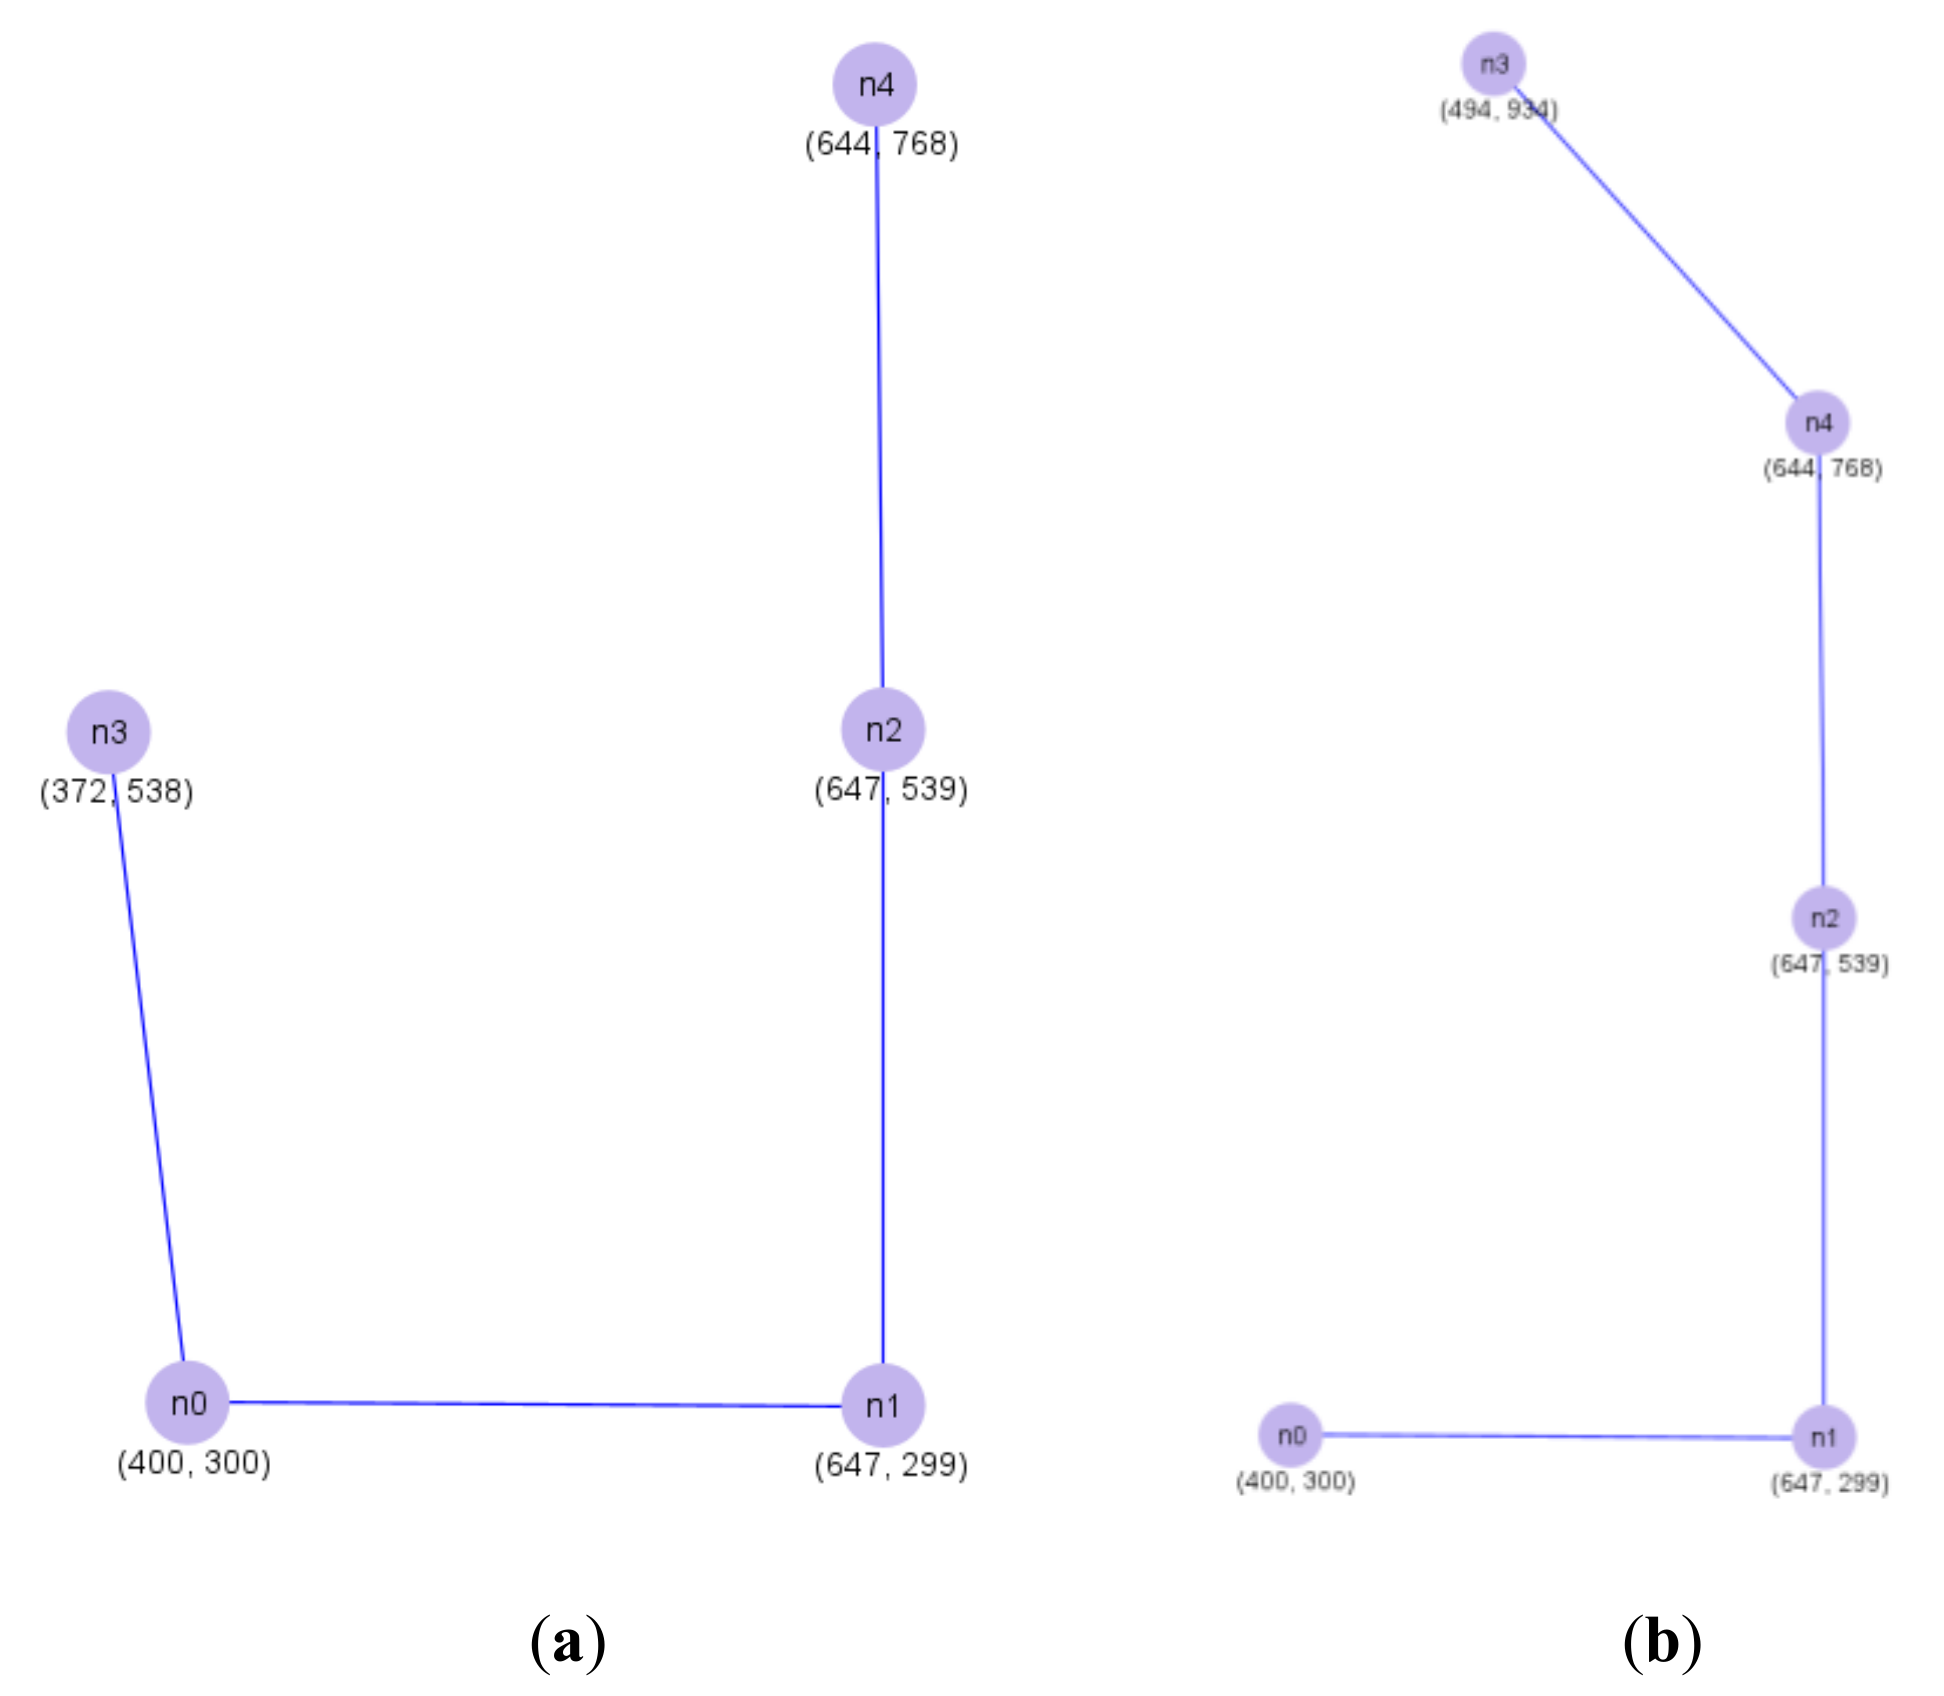
The simulation scenarios’ design was used to compare the performance of variations of the AODV routing protocol and the default OLSR routing protocol. Here, we used a scenario that consisted of five nodes containing one moving node and four motionless nodes. The amount of network traffic occurred for only one connection with one source and one destination node, as shown in Table 2. This destination node would move away from the source node, resulting in changes in the routing path. It was used to test the changes of the parameters RREQ_RETRIES and MAX_RREQ_TIMEOUT on the AODV protocol. Figure 2a,b shows the test scenario’s start position and end position. These two images show that node 3 moved away from node 0 and approached node 4. There were four variations in node speed—5 m/s (18 km/h), 8 m/s (28.8 km/h), 11 m/s (39.6 km/h), and 20 m/s (72 km/h)—which show the condition of the vehicle speed at different crowd levels. There was also a condition where the connection between the source and destination nodes was disconnected in order to perform a more detailed analysis of the effect of the RREQ_RETRIES and MAX_RREQ_TIMEOUT parameters on the AODV protocol on the formation of new network paths.
2.3. Routing Protocol Configuration
The process of configuration was carried out by combining the values of the RREQ_RETRIES and MAX_RREQ_TIMEOUT AODV routing protocol. A list of the combinations of the two values is shown in Table 3. From that, the values were simulated by using a test design. The value selection aimed to compare the change in the RREQ_RETRIES value to the MAX_RREQ_TIMEOUT value and vice versa. The simulator determined the default values for both parameters: 3 for RREQ_RETRIES and 10 s for MAX_RREQ_TIMEOUT. RREQ_RETRIES and MAX_RREQ_TIMEOUT parameters do not exist in the OLSR protocol because it is categorized as proactive routing. This study’s OLSR routing protocol had HELLO values and Topology Control (TC) Intervals of 2 and 5 s.
2.4. Performance Metrics
2.4.1. PDR
PDR compares the number of packets successfully received by the destination node () with the total number of packages sent by the source node (). PDR serves to measure the success of the delivery ratio. The higher the PDR value, the better the network performance [28,29]. PDR is one of the QoS parameters. It indicates the success rate of a routing protocol and can be calculated using Equation (1).
2.4.2. Throughput
Throughput is the data’s effective transfer rate, whereas, in this paper, it is measured in bytes per second (Bps). Throughput is the total number of successful packet arrivals observed on the destination device over a certain time interval divided by the duration of the time interval [28,29]. The main aspect of throughput is knowing the availability of sufficient bandwidth for the application. This determines the amount of traffic an application can receive when it passes through the network. This throughput can be measured after the data transmission occurs and can be calculated using Equation (2):
2.4.3. Packet Loss
The percentage of packets lost is the total number of packets sent over the network in proportion to time [6]. If packet loss occurs in the TCP protocol, it will send the lost packet again, resulting in increased overhead in terms of energy wasted to forward a dropped packet [13]. The UDP protocol, however, does not resend a lost packet, which causes packet loss. Several things cause the loss of packets on the network, including network overload, corruption of the packet, errors in physical media problems, and the failure of the receiver’s transmission (i.e., buffer overload) [30]. Packet loss can be calculated using Equation (3).
2.4.4. Delay
Delay is the time to transfer packets from the source packet to its destination that passes through a series of nodes [29]. Because the delay is related to time, it is stated in millisecond units. Several factors support this delay, namely, network congestion, overutilized servers, and distance between connection points on the network. A more excessive load on a network, with the connection distance being far away allows for a high delay value. Delay is one parameter for assessing QoS. The smaller the delay value, the better the quality of a network. The average delay can be calculated using Equation (4).
2.4.5. Average Energy Consumption
According to [31], MANET’s energy consumption can be calculated using Equation (5). Energy consumption calculation for each node is done by subtracting the initial value (i) of energy at each node with the remaining energy (r); then, the value is divided by the total number of nodes (N).
2.4.6. Routing Overhead (RO)
Routing overhead shows the number of routing packets transmitted during a simulation [32]. The routing packages in the AODV protocol are Route Request (RREQ), Route Reply (RREP), and Route Error (RRER), as shown in Equation (6). Meanwhile, in OLSR, there are HELLO routing packages and Topology Control (TC), as shown in Equation (7). In general, an increase in TC messages may cause congestion, collision, and additional energy consumption, which may decrease network performance [33]:
3. Results
This section contains the research results based on PDR, throughput, packet loss, delay, energy consumption, and routing overhead. For each result, we compare the AODV and OLSR protocols with a default parameter. Then, we compare the impact of RREQ_RETRIES and MAX_RREQ_TIMEOUT in the AODV protocol.
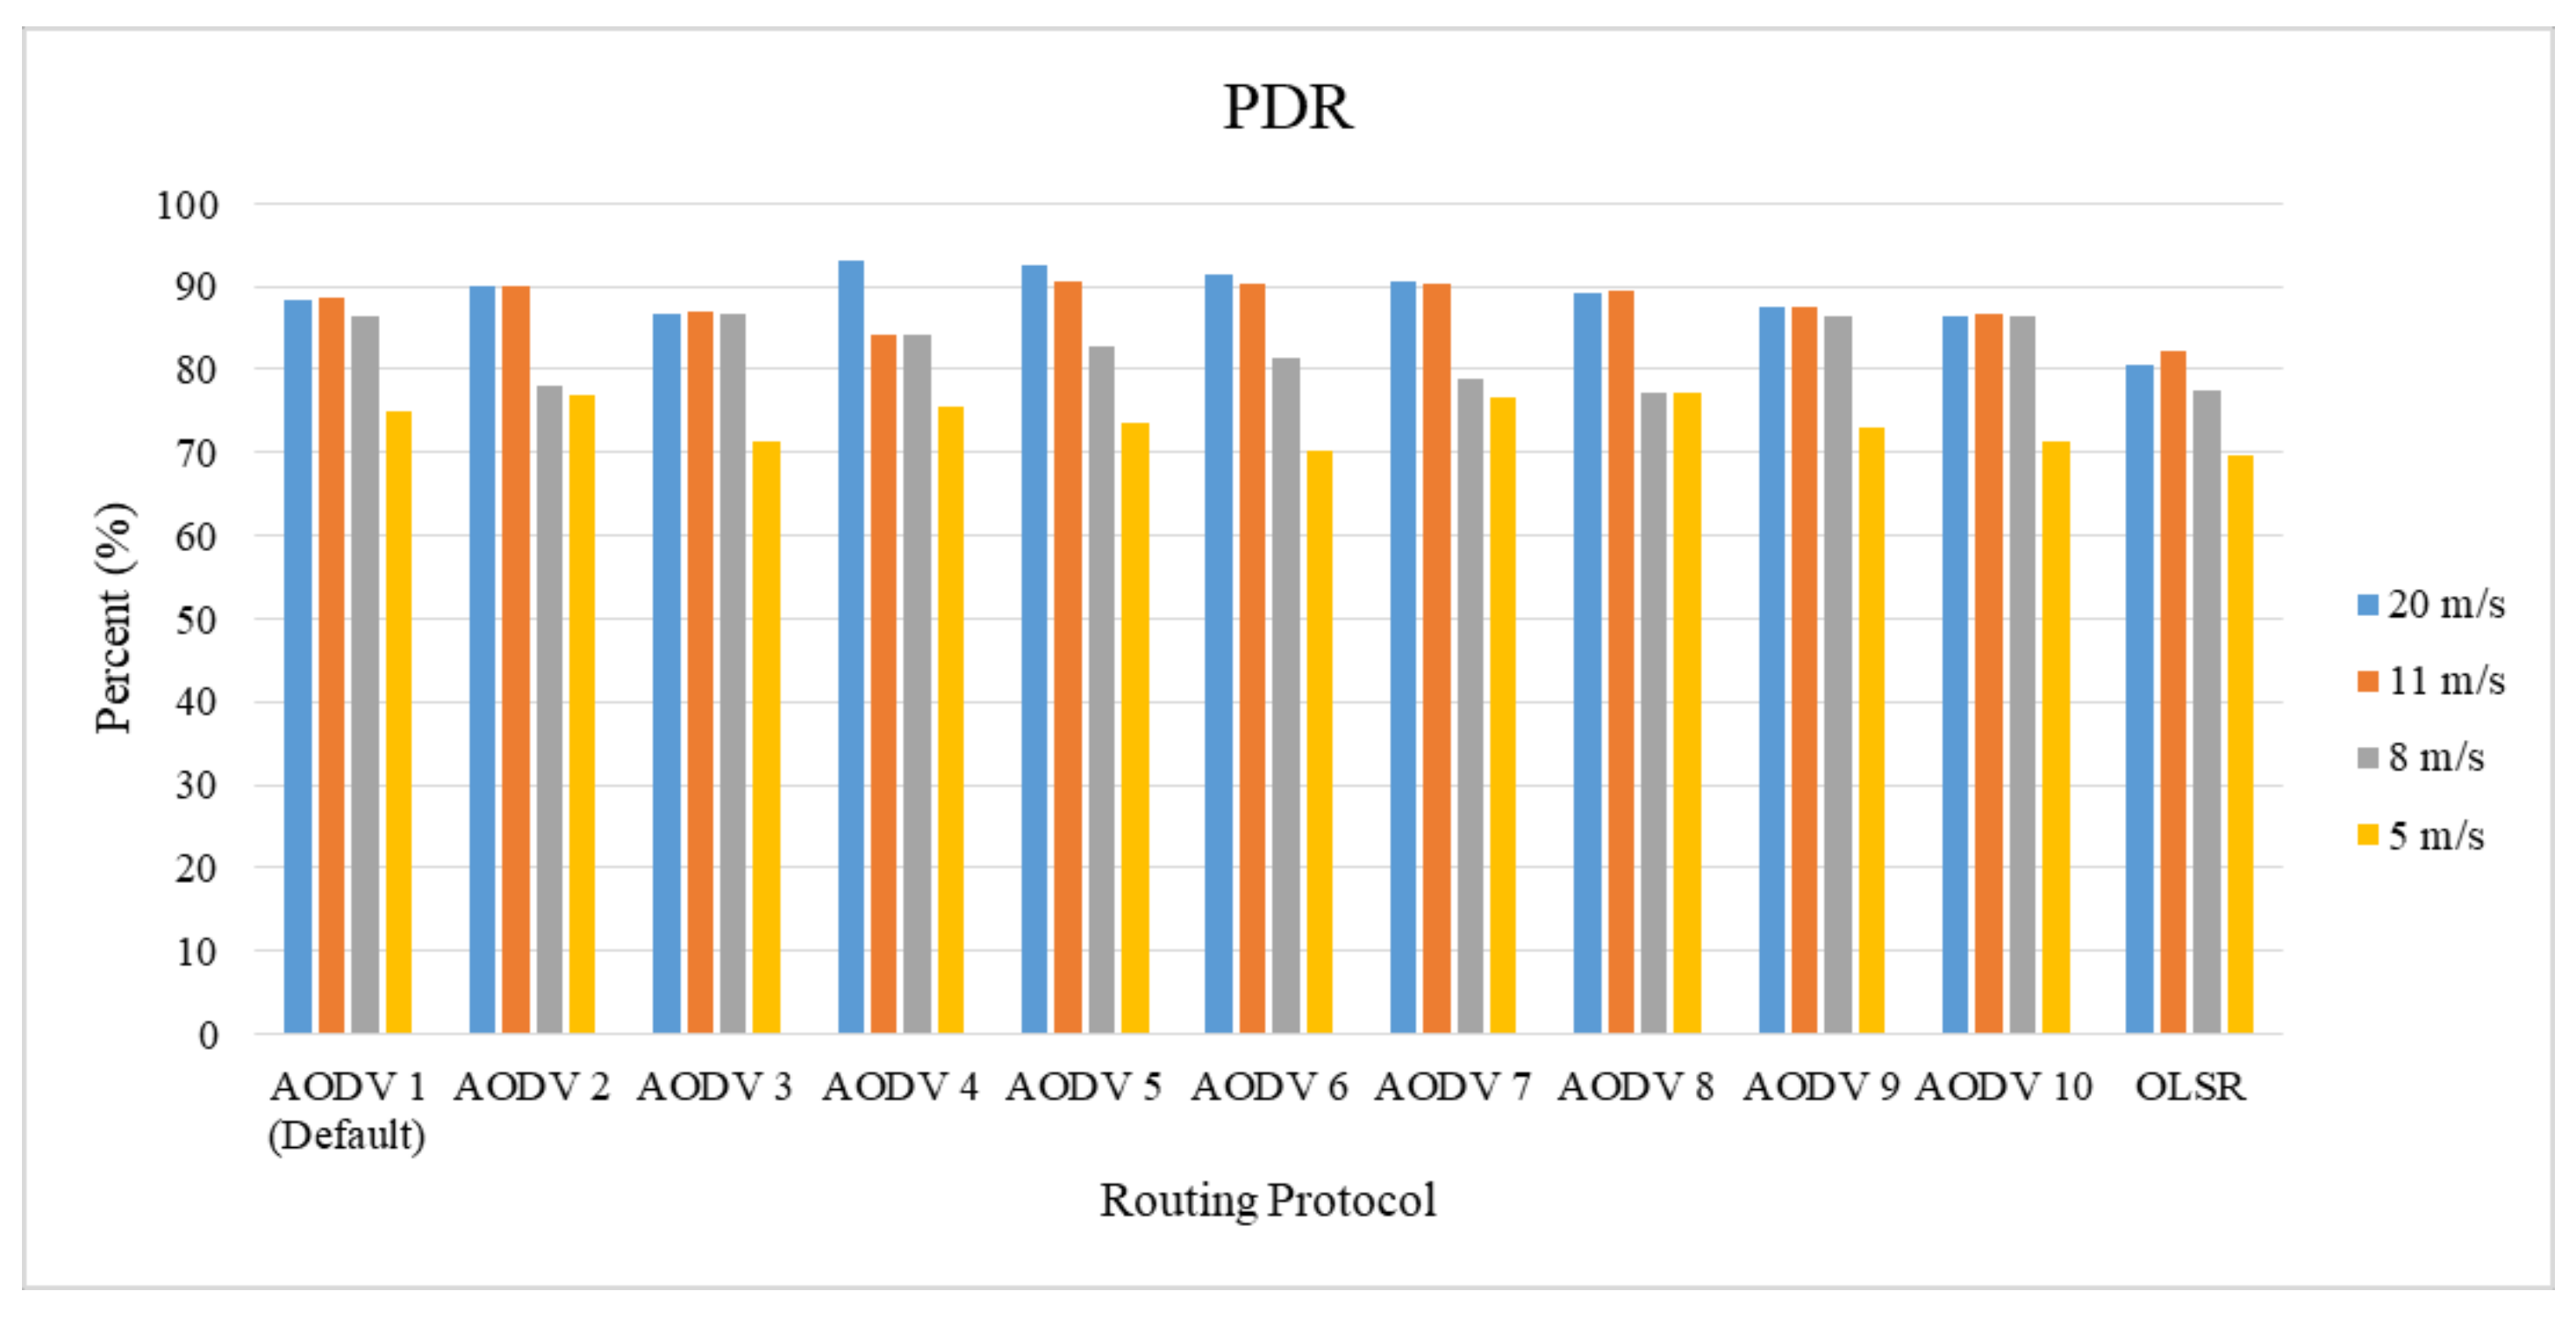
3.1. PDR
The PDR results of the OLSR and AODV protocols are shown in Figure 3. The PDR of the default AODV protocol has an average value of 84.6%, while that of the OLSR protocol is 77.45%. This result shows that the AODV protocol is better than the OLSR protocol in the moving node scenario. While reducing the RREQ_RETRIES value to 2 (AODV 2) increases the PDR performance by 1.8%, increasing the RREQ_RETRIES value to 4 (AODV 3) decreases the PDR performance by 1.9%. These results also apply to the reduction in the value MAX_RREQ_TIMEOUT, which increases PDR performance. By decreasing the MAX_RREQ_TIMEOUT value of 5 s (AODV 4), this increases the PDR performance by 5.3%, while increasing the MAX_RREQ_TIMEOUT value of 12 s (AODV 10) decreases the PDR performance by 2.1%.
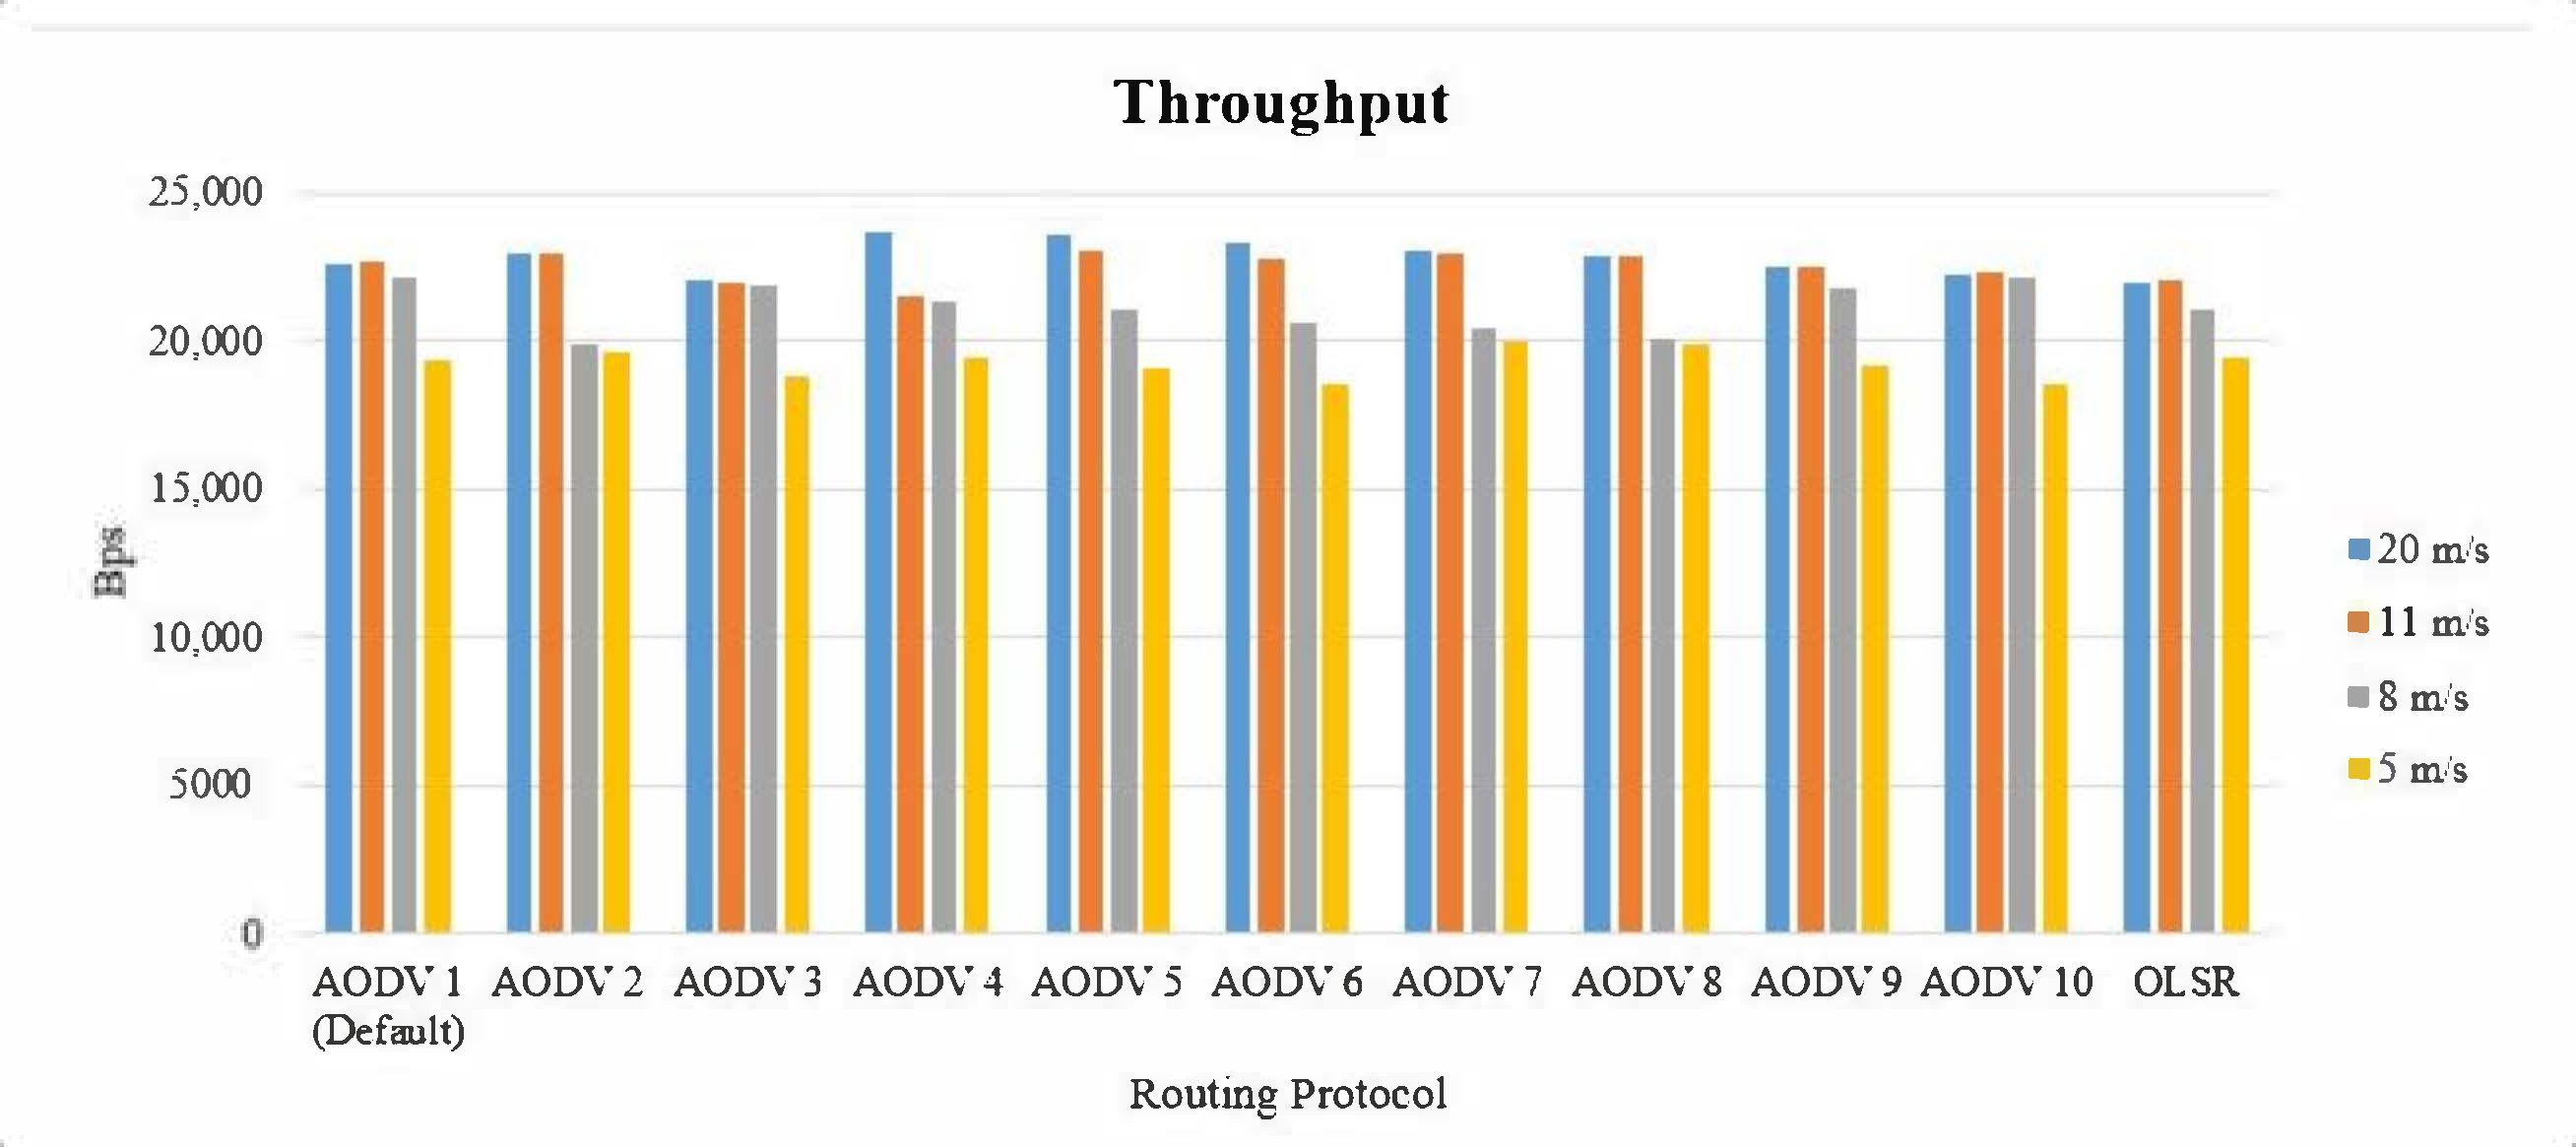
3.2. Throughput
The throughput results of the OLSR and AODV protocols are shown in Figure 4. The figure shows that default AODV has a higher throughput value than OLSR. The default AODV protocol throughput has an average value of 21,684.532 Bps, while that of the OLSR protocol is 21,120.34 Bps. Hence, reducing the value of RREQ_RETRIES to 2 (AODV 2) increases the throughput performance by 1.6%. Next, increasing the value of RREQ_RETRIES to 4 (AODV 3) reduces throughput to 2.6%. These results also apply to reducing the value of MAX_RREQ_TIMEOUT, which increases throughput performance. By decreasing the MAX_RREQ_TIMEOUT value of 5 s (AODV 4), this increases the performance throughput to 4.57%, while increasing the MAX_RREQ_TIMEOUT value of 12 s (AODV 10) decreases the performance of throughput by 1.8%.
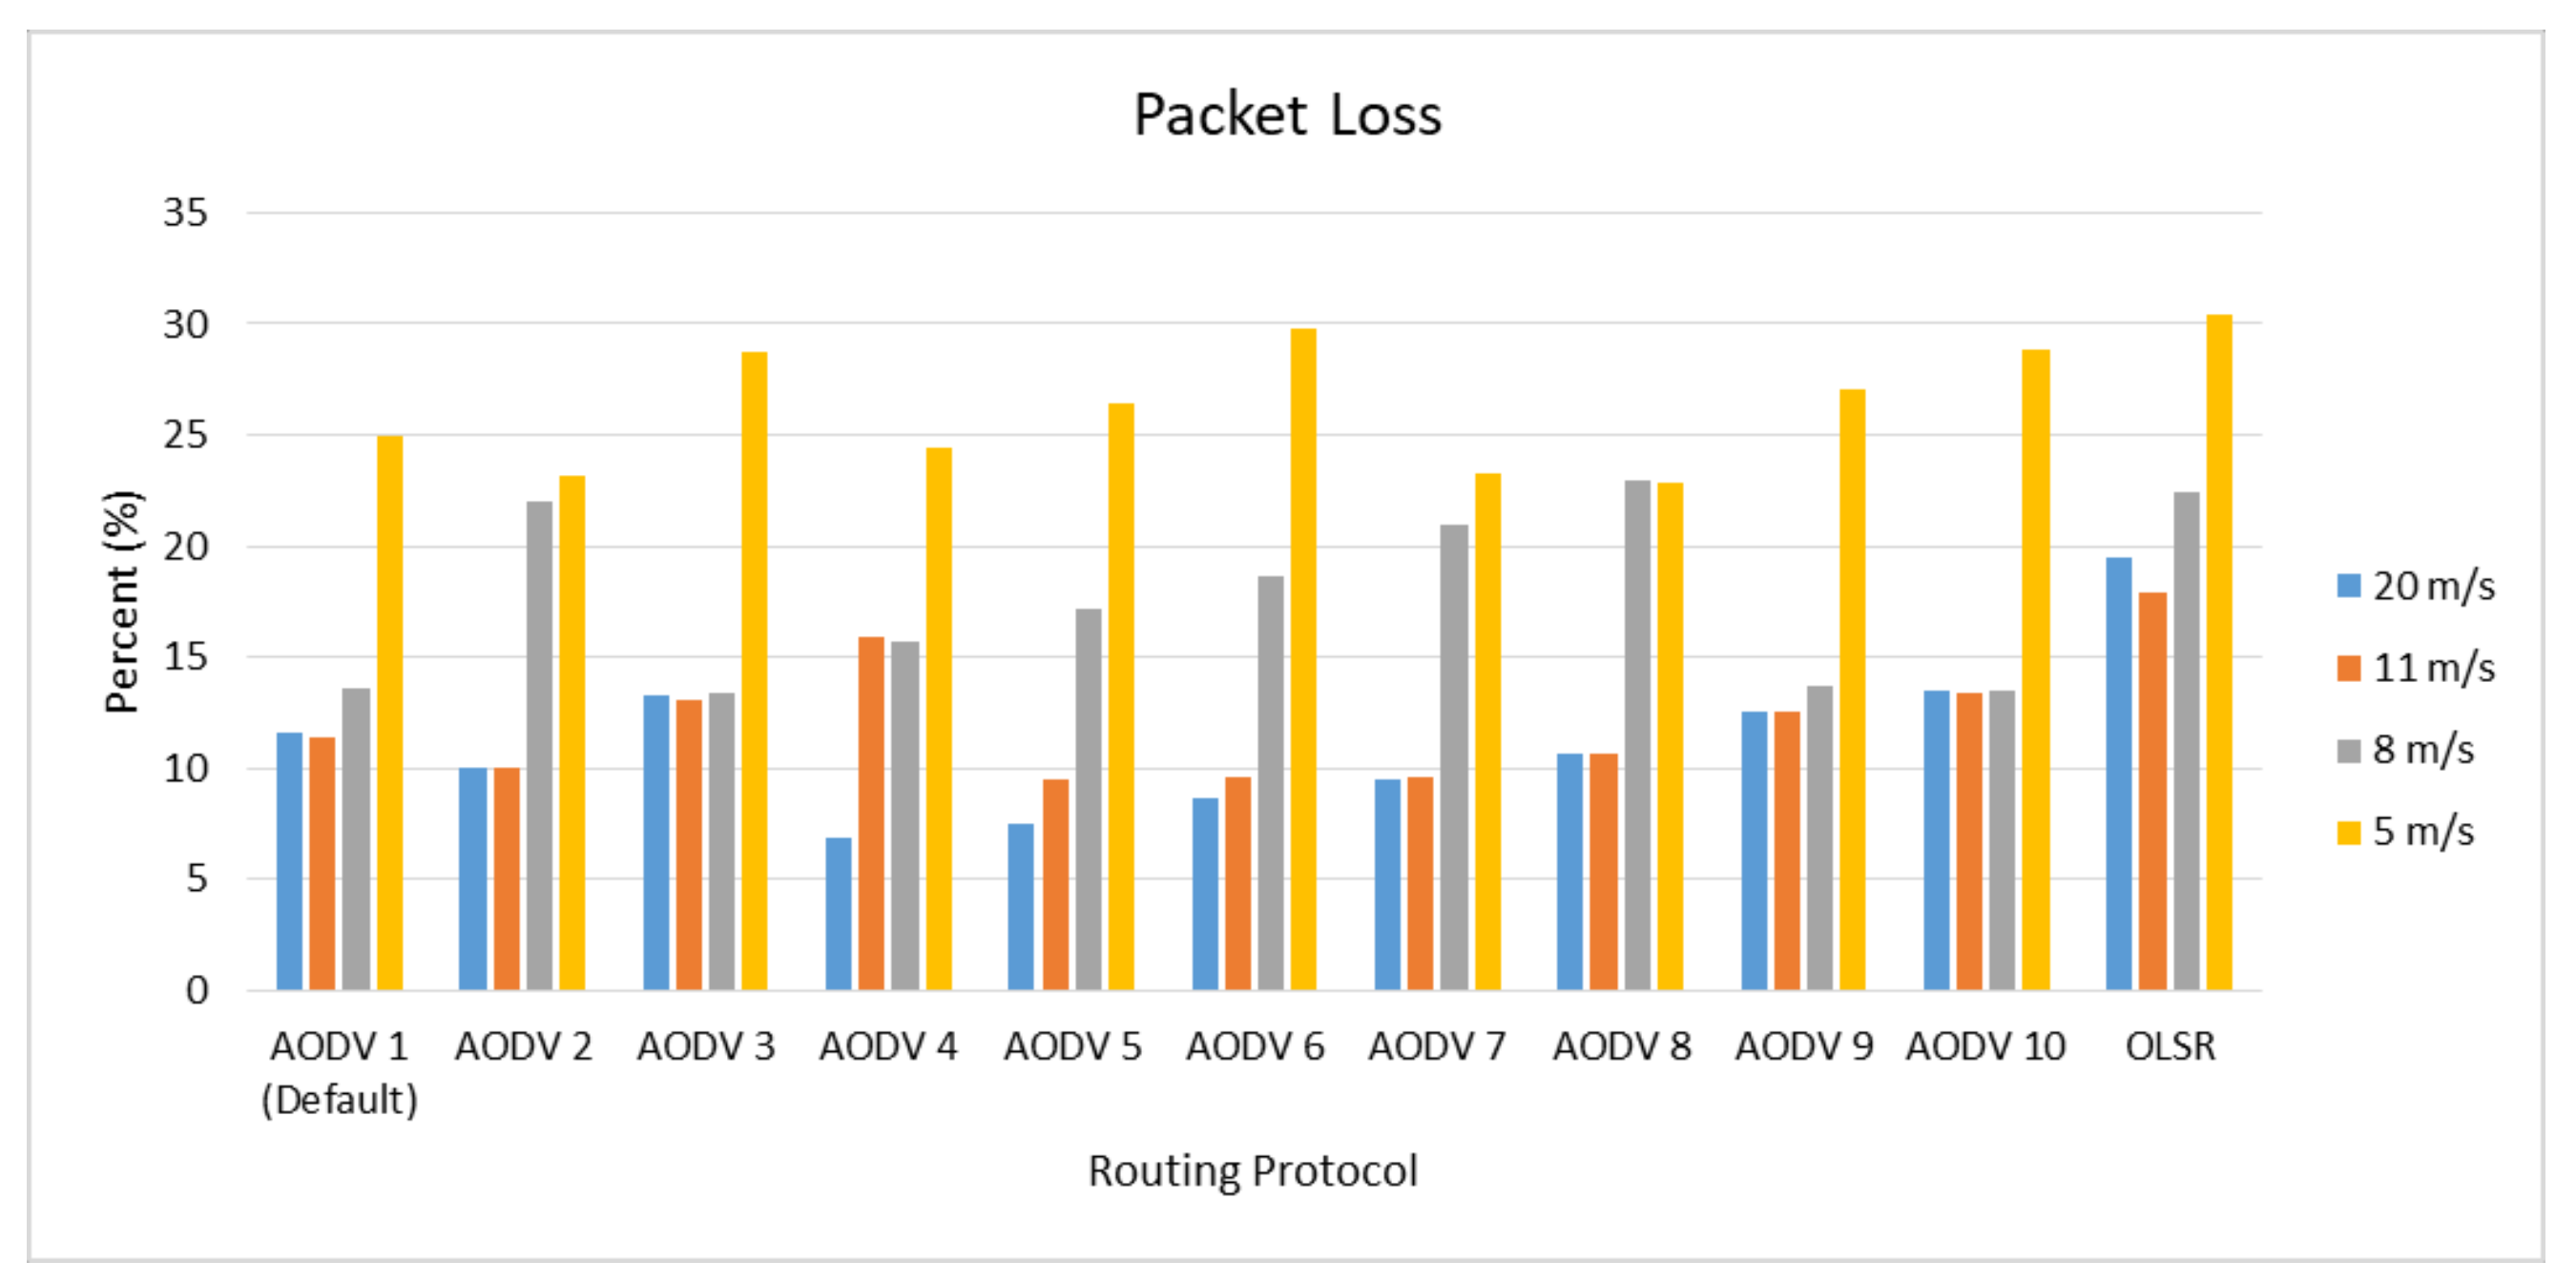
3.3. Packet Loss
The packet loss results from the OLSR and AODV protocols are shown in Figure 5. The figure depicts that OLSR has a packet loss value higher than that of AODV. The default AODV packet loss protocol has an average value of 10.4%, while that of the OLSR protocol is 19.50%. While reducing the value of RREQ_RETRIES to 2 (AODV 2) reduces the packet loss by 13.8%, increasing RREQ_RETRIES to 4 (AODV 3) increases the packet loss by 14.66%. These results also apply to a reduction in the value of MAX_RREQ_TIMEOUT, which results in a decrease in packet loss. By decreasing the value of MAX_RREQ_TIMEOUT 5 s (AODV 4), this reduces packet loss by 40.5%, while increasing the MAX_RREQ_TIMOUT value of 12 s (AODV 10) increases the packet loss by 35%.
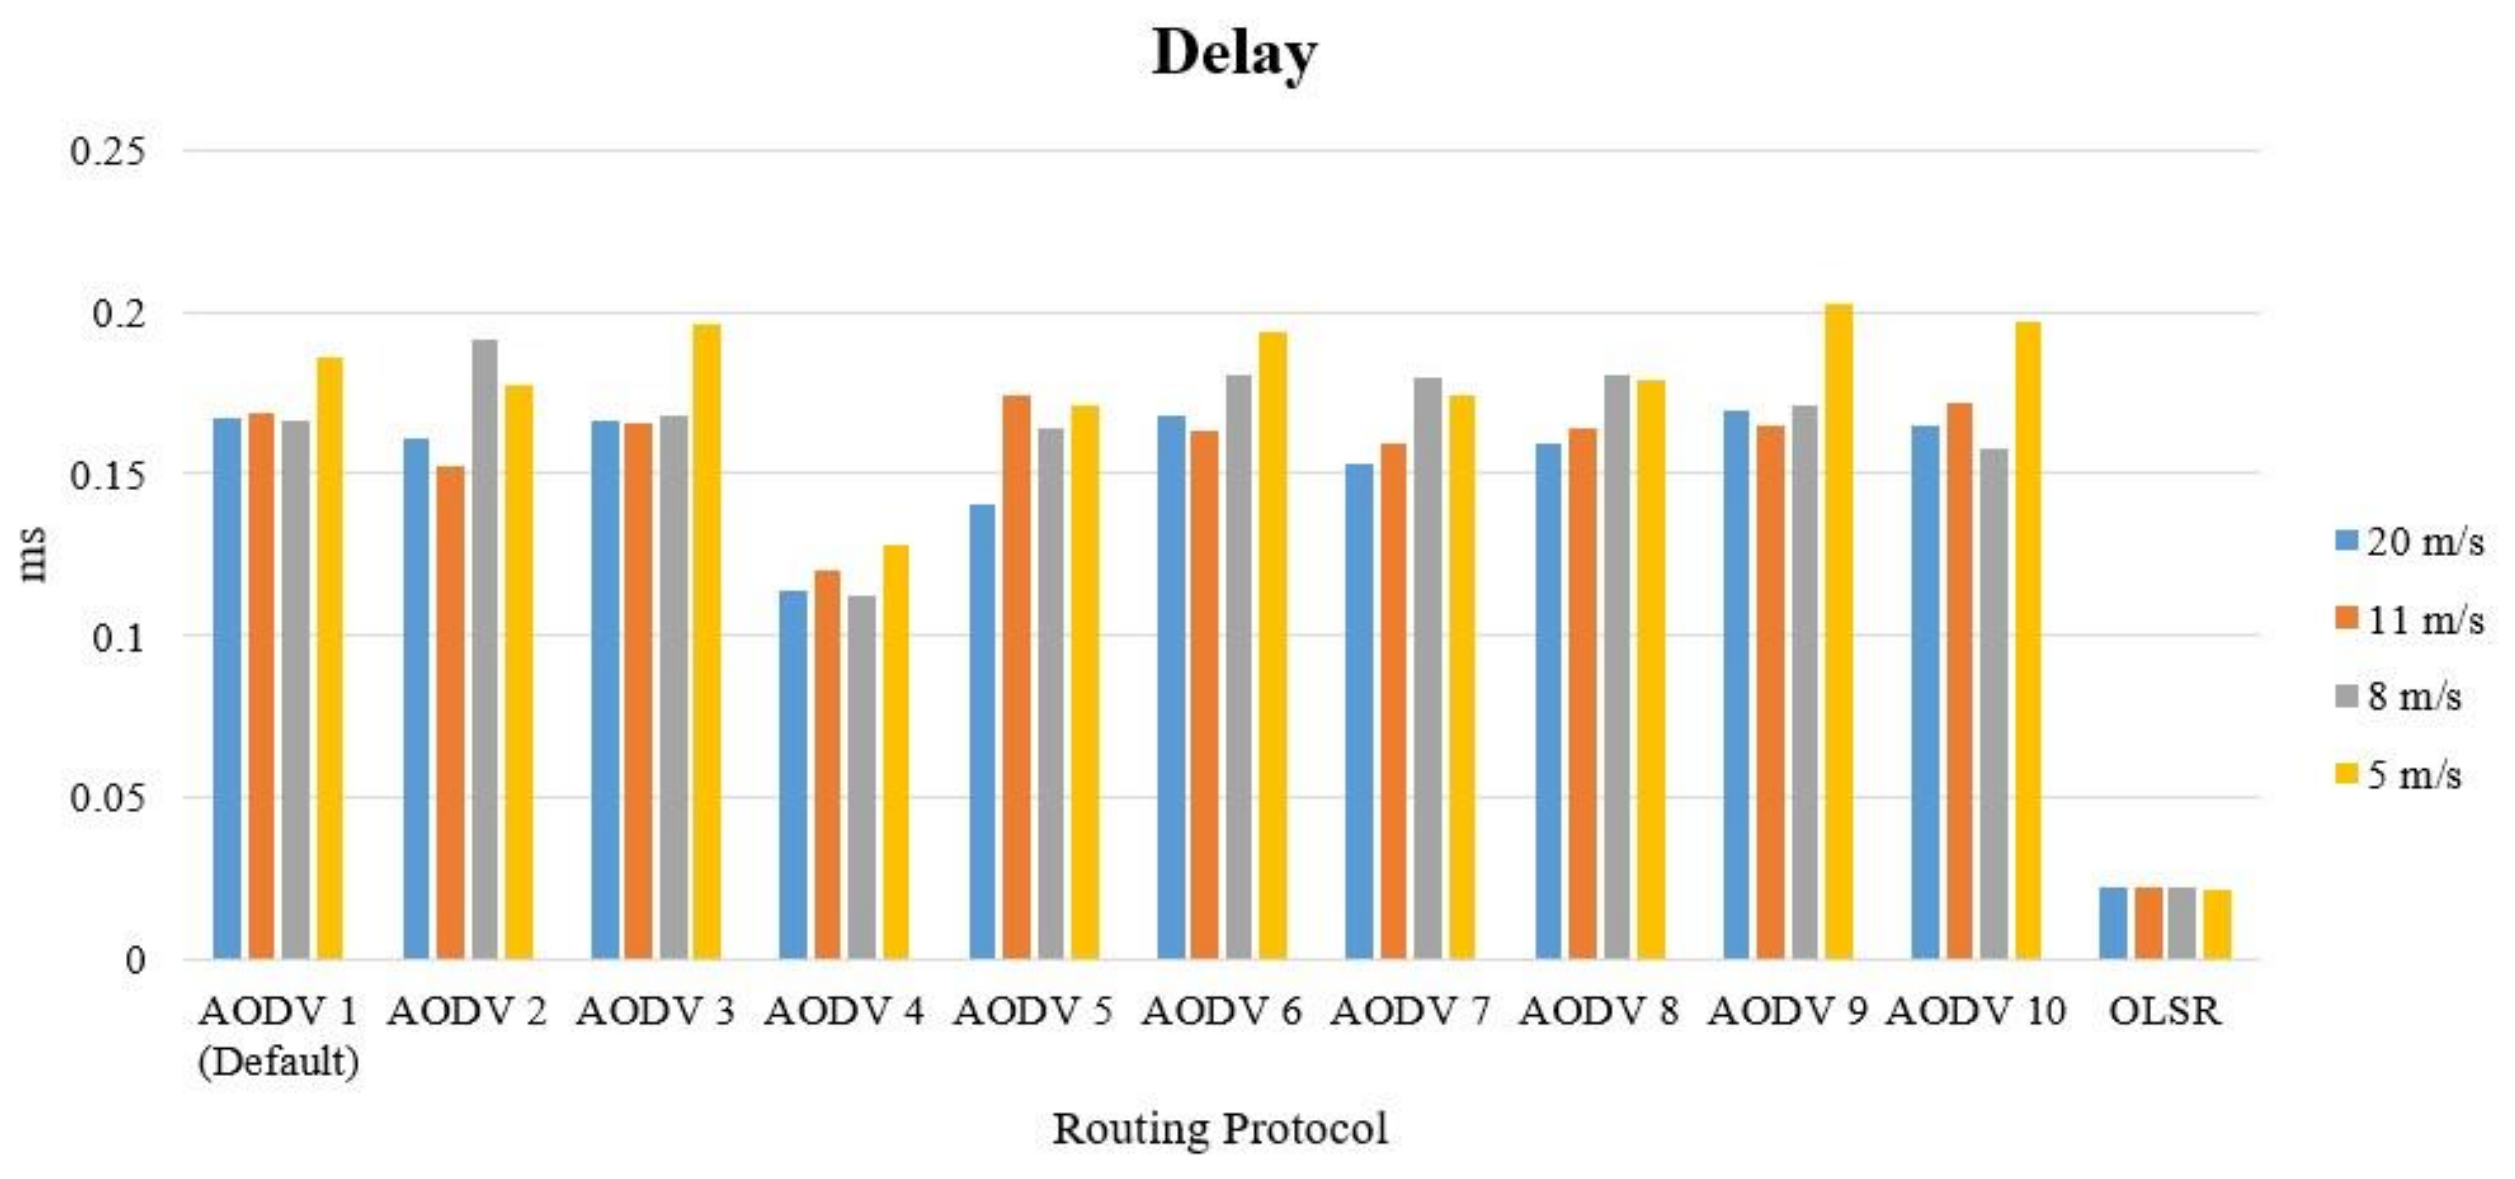
3.4. Delay
Delay results from the OLSR and AODV protocols are shown in Figure 6. The results show that OLSR has a better delay than AODV. The default AODV protocol delay has an average value of 0.1722 ms, while that of the OLSR protocol is 0.022 ms. Meanwhile, reducing the value of RREQ_RETRIES to 2 (AODV 2) and increasing it to 4 (AODV 3) reduce delay. When the value of RREQ_RETRIES is 2, the delay value is reduced by 3.4%, while when the value of RREQ_RETRIES is 4, the delay value is reduced by 0.2%. Regarding the decrease and increase in the value, MAX_RREQ_TIMEOUT does not always reduce the delay value. For the value of MAX_RREQ_TIMEOUT, 7 s (AODV 6) causes an increase in delay of 0.7%, while increasing the MAX_RREQ_TIMEOUT value to 12 s (AODV 10) decreases the delay by 0.96%. The lowest delay value is obtained with the MAX_RREQ_TIMEOUT value of 5 s (AODV 4).
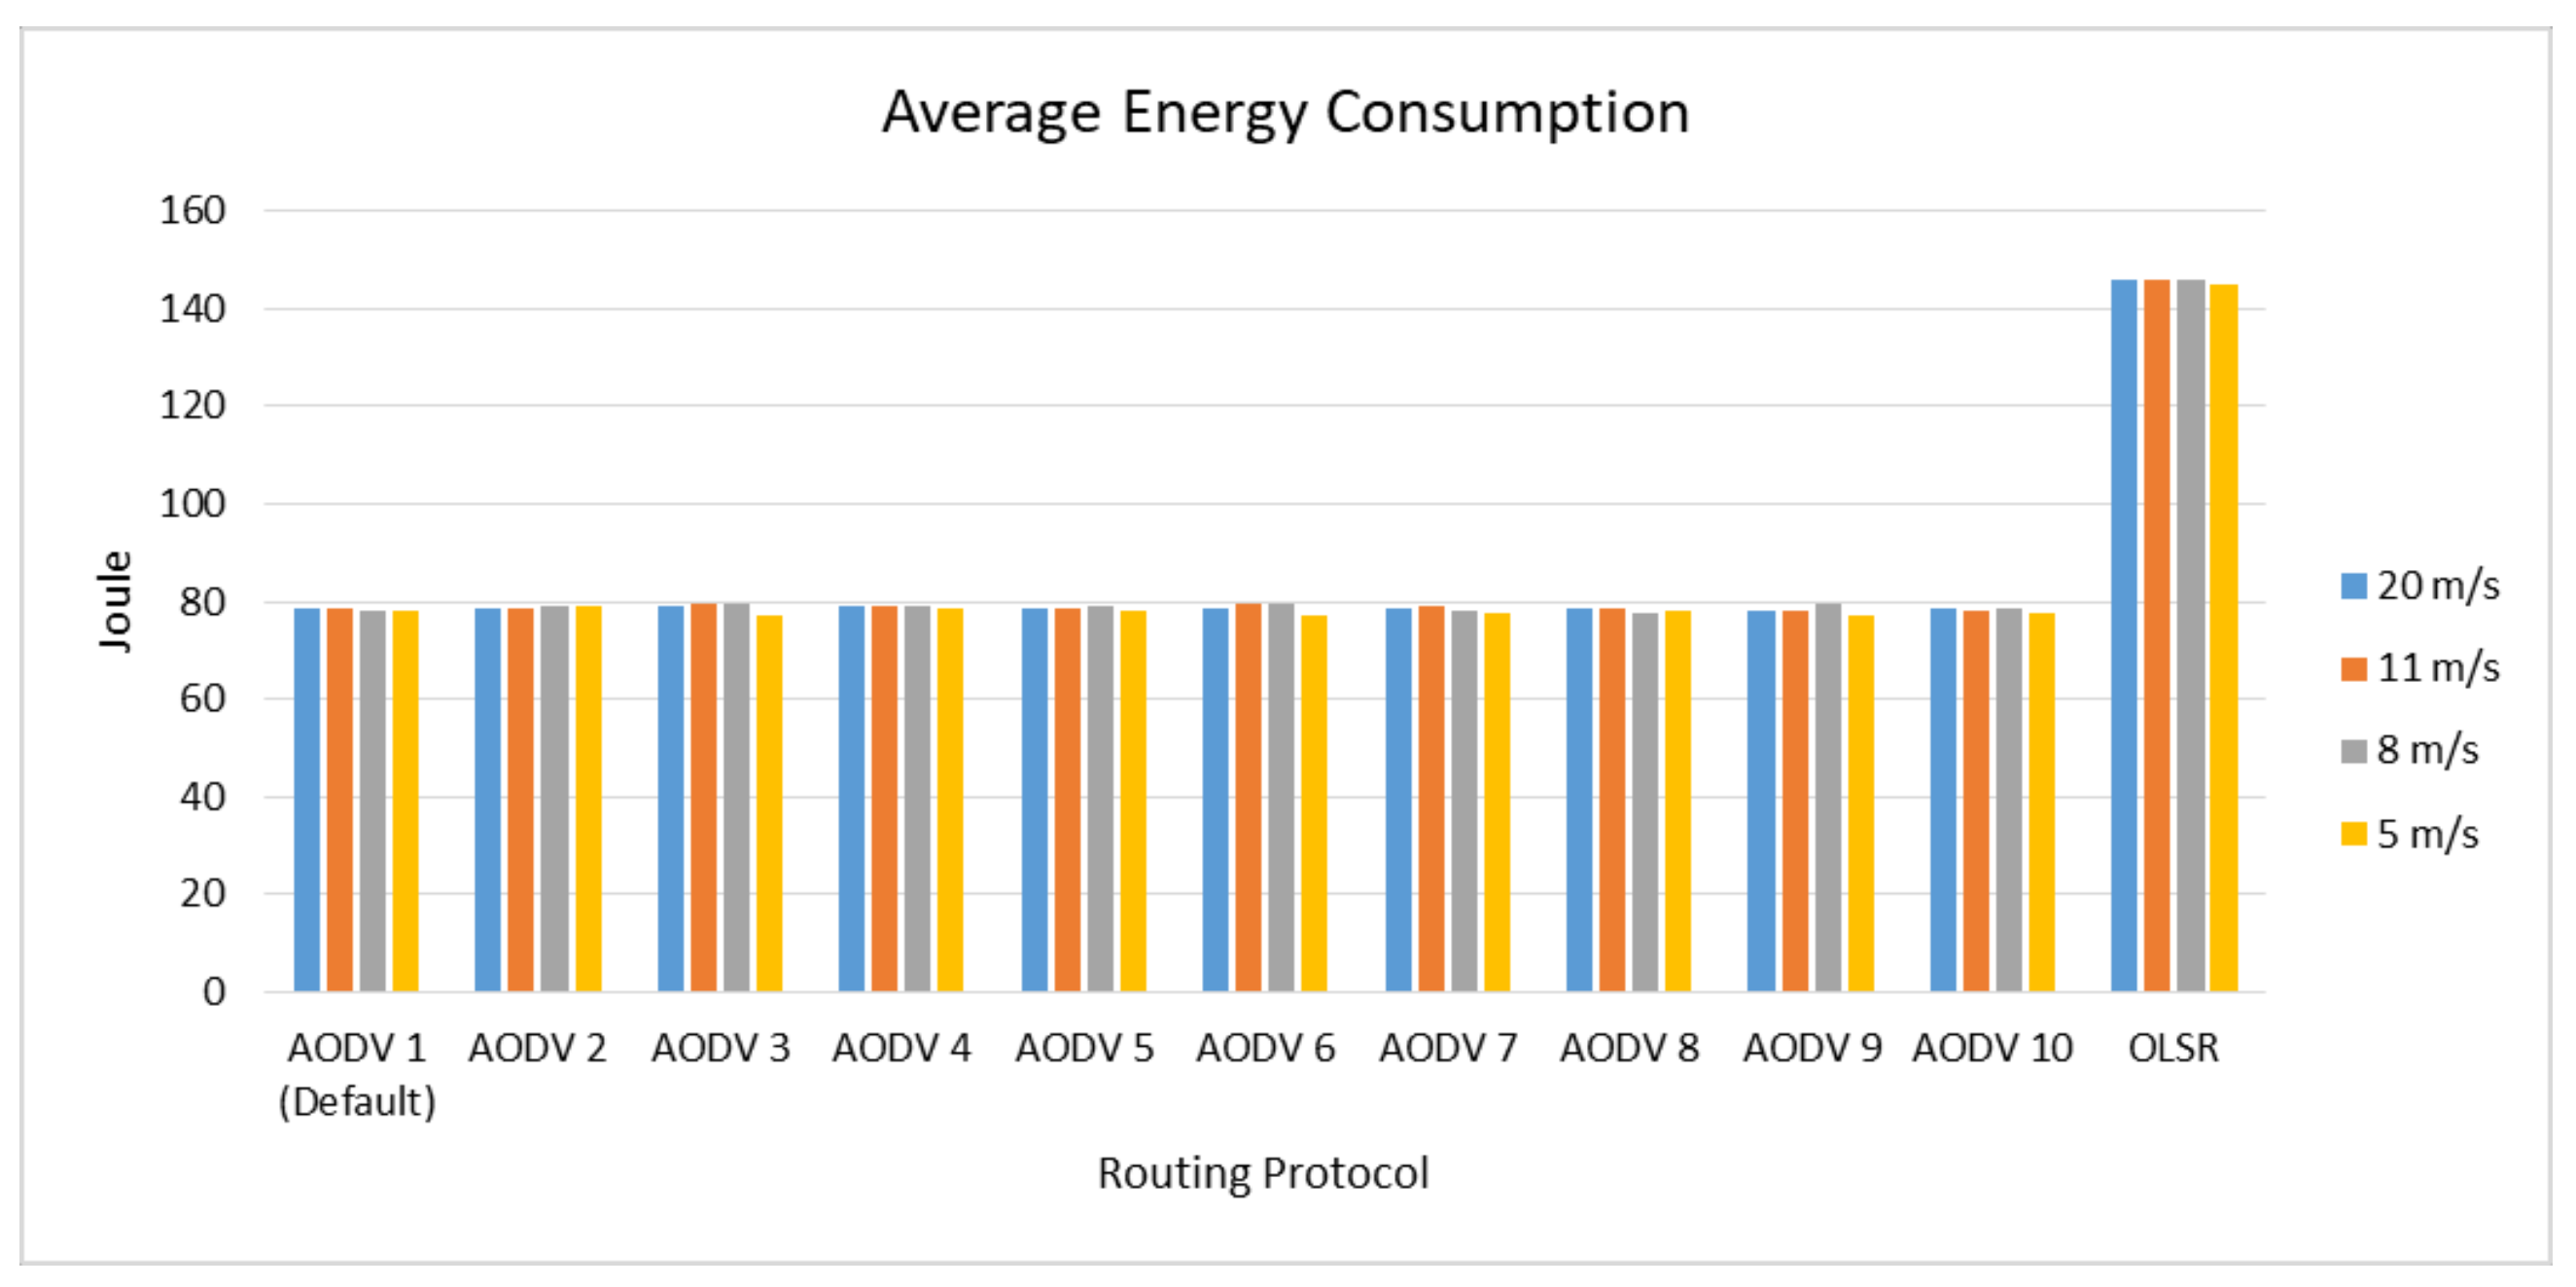
3.5. Average Energy Consumption
The average energy consumption from the OLSR and AODV protocols is shown in Figure 7. The results show that OLSR has a higher average energy consumption than AODV. The default AODV protocol’s energy consumption has an average value of 78.38 J, while that of the OLSR protocol is 145.82 joules. Hence, increasing the value of RREQ_RETRIES to 4 (AODV 3) increases the average energy consumption by 0.83%. Regarding reducing and adding up to the value, MAX_RREQ_TIMEOUT does not always reduce the average energy consumption. The reduction in the value of MAX_RREQ_TIMOUT to 6, 8, and 9 s increases the average energy consumption to 0.24%, 0.26%, and 0.004%, respectively, whereas increasing the MAX_RREQ_TIMEOUT value to 11 and 12 s reduces the average energy consumption to 0.39% and 0.17%, respectively. The lowest average energy consumption is obtained with the RREQ_RETRIES value of 2 s (AODV 2).
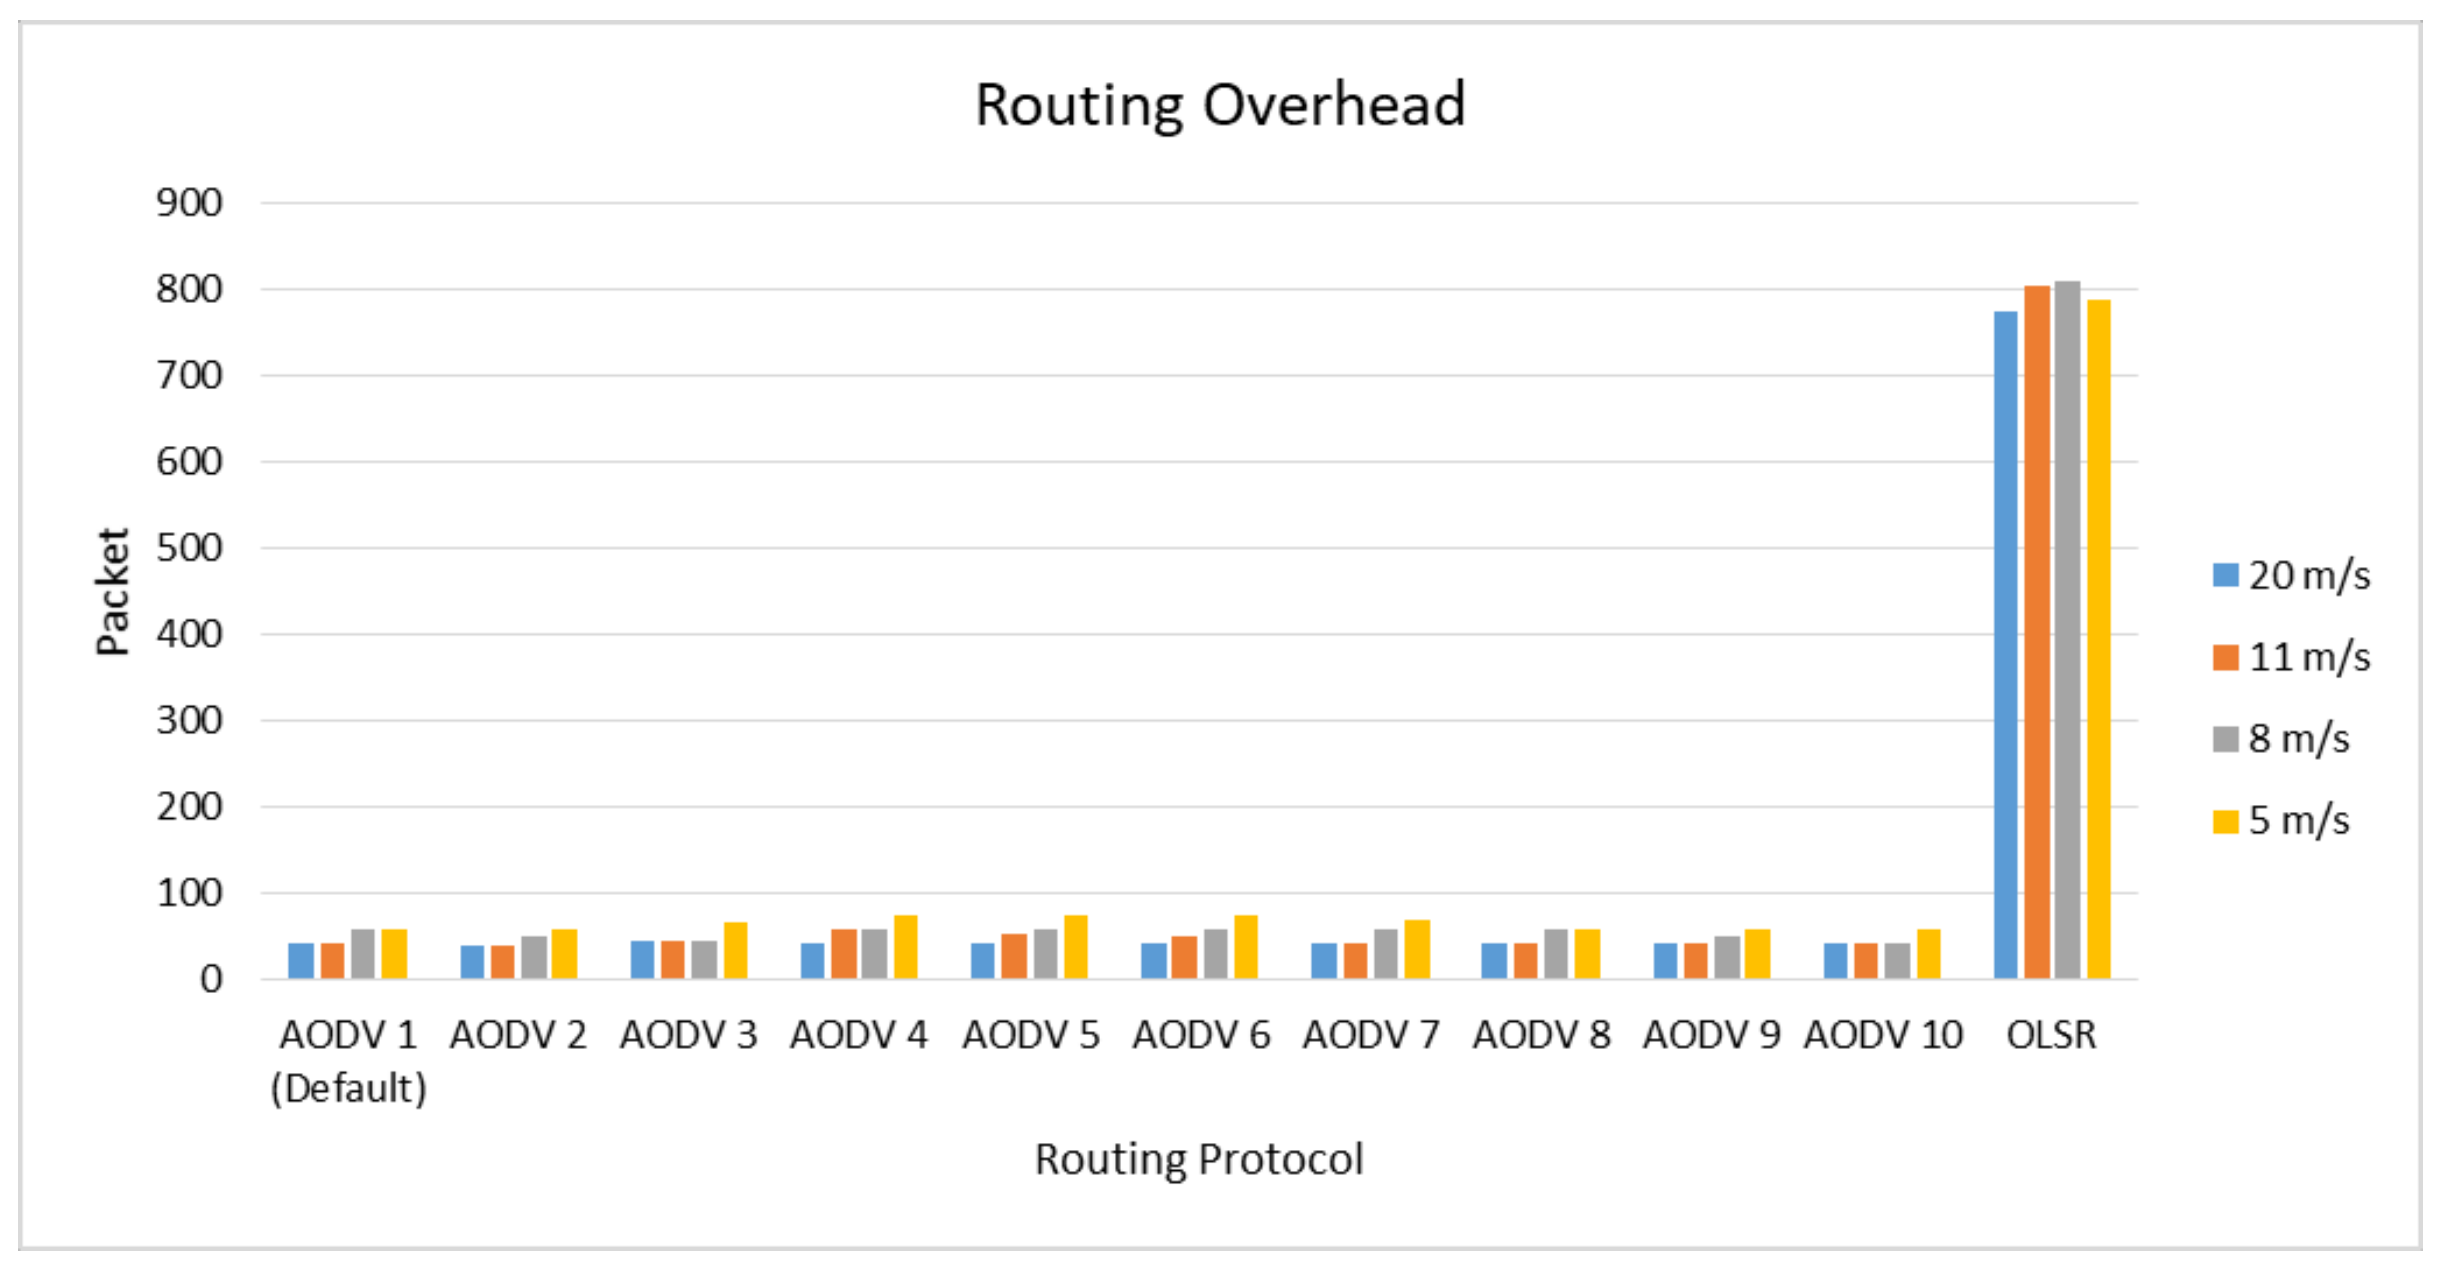
3.6. Routing Overhead
The routing overhead results from the OLSR and AODV protocols are shown in Figure 8. The results show that OLSR has a higher routing overhead than the default AODV protocol. The AODV protocol overhead routing has an average value of 41, while the OLSR protocol has a value of 774. On the other hand, regarding the variation in RREQ_RETRIES and MAX_RREQ_TIMEOUT values in the AODV protocol, decreasing RREQ_RETRIES to 2 (AODV 2) reduces the routing overhead by 10.8%, while increasing RREQ_RETRIES to 4 (AODV 3) increases the routing overhead by 9.75%. Regarding the decrease and increase in the value, MAX_RREQ_TIMEOUT does not indicate changes in the value of routing overhead.
4. Discussion
The comparison between the AODV and OLSR routing protocols with the test scenarios used in this research shows that the OLSR protocol is only superior in terms of the delay metrics, whereas for other metrics, such as PDR, throughput, packet loss, energy consumption, and routing overhead, the AODV protocol is superior. This is due to the high overhead of the OLSR routing protocol because it is continuously sending routing packets at a certain interval [6]. OLSR has a lower delay than the AODV protocol due to its nature, which stores routing information on each node, so packets are sent faster [6,17]. However, this causes OLSR to send many routing packets to control the network topology, causing energy consumption and routing overhead to be very high. This impacts network congestion so that the OLSR routing protocol has a low PDR and throughput. The number of routing packages on the AODV and OLSR routing protocols, based on observation times, is shown in Table 4. In this part of the discussion, we refer to the results at the velocity of 20 m/s, which shows the best results. Other speeds show poor performance, which may be due to the lack of movement of nodes to form new routes after the path is interrupted, resulting in many packets being dropped, thus increasing routing packets because the destination node is not immediately within the range of the source node, which causes a decrease in PDR and throughput.
The results presented in Table 5 indicate that the number of routing packets on the AODV protocol does not change after reaching 41. This is due to there being no route changes at 10–200 s. The AODV routing protocol does not send routing packets. Unlike the OLSR routing protocol, although there is no route change on the network, the protocol will still send routing packets for a certain period of time to maintain the routing tables on each node, so the number of generated routing packages increases. Many of these routing packets cause the network traffic to become dense, causing a decrease in the OLSR routing protocols’ performance in terms of PDR, throughput, packet loss, delay, and energy consumption.
The effect of the parameters RREQ_RETRIES and MAX_RREQ_TIMEOUT on the AODV protocol shows that reducing the value of RREQ_RETRIES and MAX_RREQ_TIMEOUT improves the routing performance, as seen from PDR, throughput, and packet loss. This is because by reducing, in particular, the MAX_RREQ_TIMEOUT value, the route search can be made faster when a route change occurs. A route change occurs once in the test scenario to send a packet from node 0 to node 3. The first route that is formed directly connects node 0 to node 3, which is one hop away. This route lasts until node 0 propagates the RRER message due to node 3, moving away from node 0 and approaching node 2, causing node 3 to be outside the node’s reach.
In the movement of node 3, previously formed routes cannot be used, so that packets cannot be sent. The route is reformed after node 3 is within reach of node 2. In the formation of the new route, it is necessary to resend the RREQ. The length of time for an RREQ packet depends on the RREQ_RETRIES and MAX_RREQ_TIMEOUT values.
When there is a delay between sending RRER packets and new RREQ packets, node 0 tries to improve the route by sending RREQ packets, but because the destination of node 3 is still beyond the reach of all member nodes, the routing table is not formed, resulting in a delay in sending RREQ packets because the RREQ packet delivery limit has been reached according to the RREQ_RETRIES and MAX_RREQ_TIMEOUT values. Table 5 shows the time at which the routing table was formed at node 0, according to the RREQ_RETRIES and MAX_RREQ_TIMEOUT values.
Table 4 shows that reducing RREQ_RETRIES and MAX_RREQ_TIMEOUT values can speed up the delivery of RREQ packets to speed up route formation. The faster the route is formed, the faster data packets can be sent to increase PDR, throughout, and packet loss.
In the case of delay, the effects of the RREQ_RETRIES and MAX_RREQ_TIMEOUT parameters do not have a pattern. This is because of the generated delay value from when the packet was sent after the route was formed. The average energy consumption shows that an increase in the value of MAX_RREQ_TIMEOUT reduces energy consumption. This is because when there is a higher MAX_RREQ_TIMEOUT value, there is a long delay in packet delivery caused by route changes. Hence, the number of sent packets decreases. The lowest average consumption is generated by the MAX_RREQ_TIMEOUT value of 11 s. It decreases energy consumption by 0.399%. The routing overhead shows that changes of MAX_RREQ_TIMEOUT do not affect performance. This is because MAX_RREQ_TIMEOUT only delays sending RREQ packets and does not reduce the number of RREQ packets sent. What affects routing overhead is the value of RREQ_RETRIES, which can reduce the number of packets sent and increase the number of packets that can be sent. The optimal RREQ_RETRIES parameter obtained from this research is 2, while the optimal MAX_RREQ_RETRIES value is 5 s. The results are in good agreement with studies conducted by [25,26], which show that the default parameter values of the AODV protocol do not always produce the best results.
5. Conclusions
The results of this study show that the OLSR protocol has a shorter delay than the AODV protocol. The OLSR protocol has a delay of 0.02 s compared with that of the AODV protocol of 0.156 s, while, for other performance metrics, the AODV protocol is better than OLSR at every speed variation. OLSR has 11% lower PDR, 8% lower throughput, 46% higher packet loss, 49% higher energy consumption, and 94% higher routing overhead. This result shows that the AODV protocol can adapt better to topology change than the OLSR protocol.
In the AODV routing algorithm, by reducing the combination value of RREQ_RETRIES, MAX_RREQ_TIMEOUT to (2, 10 s) and (3, 5 s), this can improve protocol performance. The two combinations resulted in an average increase in throughput performance of 3.09%, a decrease in delay of 17.7%, a decrease in packet loss of 27.15%, a decrease in energy consumption of 19%, a decrease in routing overhead of 4.8%, and an increase in PDR of 4.8%. From these results, it can be concluded that reducing the combined value of RREQ_RETRIES and MAX_RREQ_TIMEOUT can improve the AODV protocol’s performance; the AODV protocol performs better than OLSR due to the low number of generated routing packets.
Regarding variations in node movement speed, performance increases as the speed increases and decreases as the node speed decreases. A speed of 20 m/s has the best performance, while 5 m/s has the worst performance. These results apply to all performance metrics, including PDR, throughput, packet loss, delay, and energy consumption. These results indicate that node movement speed affects the formation of new routes after the path is cut off. These results may not be valid under different scenarios, so further research is needed.
Author Contributions
T.K.P. contributed to conceptualization, validation, resources, writing—review and editing, supervision, project administration, and funding acquisition. D.W. contributed to conceptualization, methodology, software, formal analysis, data curation, writing—original draft preparation. M.S.G. contributed to validation, resources, and visualization. All authors have read and agreed to the published version of the manuscript.
Funding
This research was funded by the Rekognisi Tugas Akhir (RTA) project in 2020 by Lembaga Penelitian dan Pengabdian kepada Masyarakat (LPPM), Universitas Gadjah Mada (UGM) (LOA number 2488/UN1.P.III/DIT-LIT/PT/2020, subnumber 213).
Acknowledgments
This research was funded by the Rekognisi Tugas Akhir (RTA) project in 2020 by Lembaga Penelitian dan Pengabdian kepada Masyarakat (LPPM), Universitas Gadjah Mada (UGM) (LOA number 2488/UN1.P.III/DIT-LIT/PT/2020, subnumber 213).
Conflicts of Interest
The authors declare no conflict of interest.
References
- Roy, R.R. Handbook of Mobile Ad Hoc Networks for Mobility Models; Springer: New York, NY, USA, 2011; ISBN 978-1-4419-6048-1. [Google Scholar]
- Zemrane, H.; Baddi, Y.; Hasbi, A. Mobile AdHoc networks for intelligent transportation system: Comparative analysis of the routing protocols. Procedia Comput. Sci. 2019, 160, 758–765. [Google Scholar] [CrossRef]
- Hama Aziz, R.H.; Abdullah, A.M. The impact of reactive routing protocols for transferring multimedia data over MANET. JZS-A 2014, 16, 9–24. [Google Scholar]
- Er-Rouidi, M.; Moudni, H.; Mouncif, H.; Merbouha, A. An energy consumption evaluation of reactive and proactive routing protocols in mobile ad-hoc network. In Proceedings of the 2016 13th International Conference on Computer Graphics, Imaging and Visualization (CGiV), Beni Mellal, Morocco, 29 March–1 April 2016; pp. 437–441. [Google Scholar]
- Bai, Y.; Mai, Y.; Wang, D.N. Performance comparison and evaluation of the proactive and reactive routing protocols for MANETs. In Proceedings of the Wireless Telecommunications Symposium (WTS), Chicago, IL, USA, 26–28 April 2017; pp. 1–5. [Google Scholar]
- Alamsyah, A.; Setijadi, E.; Purnama, I.K.E.; Purnomo, M.H. Analisis kinerja protokol routing reaktif dan proaktif pada MANET menggunakan NS2. J. Nas. Tek. Elektro Teknol. Inf. (JNTETI) 2018, 7, 138–143. [Google Scholar] [CrossRef]
- Bai, F.; Helmy, A. A survey of mobility models. In Wireless Ad Hoc Network; Kluwer Academic Publishers: Dordrecht, The Netherlands, 2004; pp. 1–30. [Google Scholar]
- Papageorgiou, C.; Birkos, K.; Dagiuklas, T.; Kotsopoulos, S. An obstacle-aware human mobility model for ad hoc networks. In Proceedings of the 2009 IEEE International Symposium on Modeling, Analysis & Simulation of Computer and Telecommunication Systems, London, UK, 21–23 September 2009; pp. 1–9. [Google Scholar]
- Wu, D.; Li, J.; Liu, J. A random obstacle-based mobility model for delay-tolerant networking: A random obstacle-based mobility model for delay-tolerant networking. Int. J. Netw. Manag. 2011, 21, 326–339. [Google Scholar] [CrossRef]
- Hinds, A.; Ngulube, M.; Zhu, S.; Al-Aqrabi, H. A review of routing protocols for mobile ad-hoc networks (MANET). IJIET 2013, 1–5. [Google Scholar] [CrossRef] [Green Version]
- Abdullah, A.M.; Ozen, E.; Bayramoglu, H. Investigating the impact of mobility models on MANET routing protocols. IJACSA 2019, 10. [Google Scholar] [CrossRef] [Green Version]
- Desai, R.; Patil, B.P. Analysis of reinforcement based adaptive routing in MANET. IJEECS 2016, 2, 648. [Google Scholar] [CrossRef]
- Kumar, K.D.; Ramya, I.; Masillamani, M.R. Queue management in mobile adhoc networks (Manets). In Proceedings of the 2010 IEEE/ACM Int’l Conference on Green Computing and Communications & Int’l Conference on Cyber, Physical and Social Computing, Hangzhou, China, 18–20 December 2010; pp. 943–946. [Google Scholar]
- Aamir, M.; Zaidi, M.A. A buffer management scheme for packet queues in MANET. Tinshhua Sci. Technol. 2013, 18, 543–553. [Google Scholar] [CrossRef] [Green Version]
- Andriyanto, E.; Diafari Djuni, H.I.G.A.K.; Wirastuti, N.M.A.E.D. Pengaruh buffer size pada sistem MANET dengan menggunakan metode scheduling FIFO. SPEKTRUM 2019, 6, 40. [Google Scholar] [CrossRef]
- Abushiba, W.; Johnson, P. Performance comparison of reactive routing protocols for Ad Hoc network. In Proceedings of the 2015 Forth International Conference on e-Technologies and Networks for Development (ICeND), Lodz, Poland, 21–23 September 2015; pp. 1–5. [Google Scholar]
- Lei, D.; Wang, T.; Li, J. Performance analysis and comparison of routing protocols in mobile ad hoc network. In Proceedings of the 2015 Fifth International Conference on Instrumentation and Measurement, Computer, Communication and Control (IMCCC), Qinhuangdao, China, 18–20 September 2015; pp. 1533–1536. [Google Scholar]
- Saudi, N.A.M.; Arshad, M.A.; Buja, A.G.; Fadzil, A.F.A.; Saidi, R.M. Mobile ad-hoc network (MANET) routing protocols: A performance assessment. In Proceedings of the Third International Conference on Computing, Mathematics and Statistics (iCMS2017), Langkawi, Kedah, Malaysia, 7–8 November 2017; Kor, L.-K., Ahmad, A.-R., Idrus, Z., Mansor, K.A., Eds.; Springer Singapore: Singapore, 2019; pp. 53–59. ISBN 9789811372780. [Google Scholar]
- Jacquet, P.; Muhlethaler, P.; Clausen, T.; Laouiti, A.; Qayyum, A.; Viennot, L. Optimized link state routing protocol for ad hoc networks. In Proceedings of the IEEE International Multi Topic Conference, 2001. IEEE INMIC 2001. Technology for the 21st Century, Lahore, Pakistan, 30 December 2001; pp. 62–68. [Google Scholar]
- Kurniawan, A.; Kristalina, P.; Hadi, M.Z.S. Performance analysis of routing protocols AODV, OLSR and DSDV on MANET using NS3. In Proceedings of the 2020 International Electronics Symposium (IES), Surabaya, Indonesia, 29–30 September 2020; pp. 199–206. [Google Scholar]
- Ahmed, D.E.M.; Ebrahim, H.A.; Khalifa, O.O. Performance evaluation of AODV, OLSR, and GRP for transmitting video conferencing over MANETs. Int. J. Comput. Sci. Inf. Secur. (IJCSIS) 2020, 18, 7. [Google Scholar]
- Hashim, A.-A.; Farhan, M.M.; Alshybani, S. Performance evaluation of OLSR and AODV routing protocols over mobile ad-hoc networks. In Proceedings of the 2019 First International Conference of Intelligent Computing and Engineering (ICOICE), Hadhramout, Yemen, 15–16 December 2019; pp. 1–8. [Google Scholar]
- Gupta, S.K.; Saket, R.K. Observation of AODV routing protocol’s performance at variation in ART value for various node’s mobility. In Proceedings of the First International Conference on Information and Communication Technology for Intelligent Systems: Volume 1, Ahmedabad, India, 28–29 November 2015; Satapathy, S.C., Das, S., Eds.; Springer International Publishing: Cham, Switzerland, 2016; Volume 50, pp. 419–427. [Google Scholar]
- Gupta, S.K.; Alsamhi, S.H.; Saket, R.K. Comparative performance analysis of AODV for CBR & VBR traffic under influence of ART & DPC. In Proceedings of the 2016 11th International Conference on Industrial and Information Systems (ICIIS), Roorkee, India, 3–4 December 2016; pp. 112–117. [Google Scholar]
- Gupta, S.K.; Sharma, R.; Saket, R.K. Effect of variation in active route timeout and delete period constant on the performance of AODV protocol. IJMC 2014, 12, 177. [Google Scholar] [CrossRef]
- Azzuhri, S.R.; Mhd Noor, M.B.; Jamaludin, J.; Ahmedy, I.; Md Noor, R. Towards a better approach for link breaks detection and route repairs strategy in AODV protocol. Wirel. Commun. Mob. Comput. 2018, 2018, 1–9. [Google Scholar] [CrossRef] [Green Version]
- Gupta, S.K.; Alsamhi, S.H.; Saket, R.K. Optimal relation between ART and mobility & transmission range at default QualNet & calculated transmission powers. In Proceedings of the 6th International Conference on Advances in Engineering Sciences and Applied Mathematics (ICAESAM-2016), Kuala Lumpur, Malaysia, 21–22 December 2016. [Google Scholar]
- Rishiwal, V.; Kush, A.; Verma, S. Stable and energy efficient routing for mobile adhoc networks. In Proceedings of the Fifth International Conference on Information Technology: New Generations (ITNG 2008), Las Vegas, NV, USA, 7–9 April 2008; pp. 1028–1033. [Google Scholar]
- Sisodia, D.S.; Singhal, R.; Khandal, V. A performance review of intra and inter-group MANET routing protocols under varying speed of nodes. IJECE 2017, 7, 2721. [Google Scholar] [CrossRef] [Green Version]
- Kiran, K.; Kaushik, N.P.; Sharath, S.; Shenoy, P.D.; Venugopal, K.R.; Prabhu, V.T. Experimental evaluation of BATMAN and BATMAN-Adv routing protocols in a mobile testbed. In Proceedings of the TENCON 2018—2018 IEEE Region 10 Conference, Jeju, Korea, 28–31 October 2018; pp. 1538–1543. [Google Scholar]
- Mafirabadza, C.; Khatri, P. Energy analysis of AODV routing protocol in MANET. In Proceedings of the 2016 International Conference on Communication and Signal Processing (ICCSP), Melmaruvathur, Tamilnadu, India, 6–8 April 2016; pp. 1125–1129. [Google Scholar]
- Desai, R.; Patil, B.P. Analysis of routing protocols for ad hoc networks. In Proceedings of the 2014 International Conference on Circuits, Systems, Communication, and Information Technology Applications (CSCITA), Mumbai, Maharashtra, India, 4–5 April 2014; pp. 111–115. [Google Scholar]
- Boushaba, A.; Benabbou, A.; Benabbou, R.; Zahi, A.; Oumsis, M. Optimization on OLSR protocol for reducing topology control packets. In Proceedings of the 2012 International Conference on Multimedia Computing and Systems, Tangiers, Morocco, 10–12 May 2012; pp. 539–544. [Google Scholar]
Figure 1.
Research steps.

Figure 2.
(a) Node starting position; (b) node final position.

Figure 3.
PDR results.

Figure 4.
Throughput results.

Figure 5.
Packet loss results.

Figure 6.
Delay Results.

Figure 7.
Average Energy Consumption Results.

Figure 8.
Routing overhead results.


Table 1.
Simulation parameter.
| Parameter | Value |
|---|---|
| Simulation time | 200 s |
| Area of simulation | 1000 × 1000 m |
| Transportation protocol | UDP |
| Packet type | CBR |
| Packet size | 512 bytes |
| Rate of packets | 10 packets/second |
| Maximum packets | 1000 packets |
| Propagation model | Two Ray Ground |
| Initial energy | 1000 J |
| TxPower | 1.3 W |
| RxPower | 1.4 W |
| Idle power | 0.7 W |
| Sleep power | 0.01 W |
| RREQ_RETRIES AODV | 2, 3 (default), 4 |
| MAX_RREQ_TIMEOUT AODV | 5, 6, 7, 8, 9, 10 (default), 11, 12 s |
Table 2.
Scenario details.
| Parameter | Value |
|---|---|
| Number of nodes | 5 |
| Amount of traffic | 1 |
| Node movement | One moving node |
| Node speed | 5, 8, 11, and 20 m/s |
Table 3.
RREQ_RETRIES and MAX_RREQ_TIMEOUT variation of AODV protocol.
| No. | Code | RREQ_RETRIES Value | MAX_RREQ_TIMEOUT Value |
|---|---|---|---|
| 1 | AODV 1 | 3 (default) | 10 (default) |
| 2 | AODV 2 | 2 | 10 |
| 3 | AODV 3 | 4 | 10 |
| 4 | AODV 4 | 3 | 5 |
| 5 | AODV 5 | 3 | 6 |
| 6 | AODV 6 | 3 | 7 |
| 7 | AODV 7 | 3 | 8 |
| 8 | AODV 8 | 3 | 9 |
| 9 | AODV 9 | 3 | 11 |
| 10 | AODV 10 | 3 | 12 |
Table 4.
Total routing packets generated from AODV and OLSR protocols at node speed of 20 m/s.
| Timestamp (Second) | AODV Routing | OLSR Routing |
|---|---|---|
| 5 | 5 | 15 |
| 50 | 41 | 181 |
| 100 | 41 | 370 |
| 150 | 41 | 576 |
| 200 | 41 | 774 |
Table 5.
Time differences in the formation of routes in AODV protocol variations.
| Routing Protocol | Time for Forming Routes (Seconds) |
|---|---|
| AODV 1 | 24.930899 |
| AODV 2 | 23.355387 |
| AODV 3 | 26.801093 |
| AODV 4 | 19.912302 |
| AODV 5 | 20.864071 |
| AODV 6 | 21.907193 |
| AODV 7 | 22.844083 |
| AODV 8 | 23.931910 |
| AODV 9 | 25.913372 |
| AODV 10 | 26.927788 |
Publisher’s Note: MDPI stays neutral with regard to jurisdictional claims in published maps and institutional affiliations. |
© 2020 by the authors. Licensee MDPI, Basel, Switzerland. This article is an open access article distributed under the terms and conditions of the Creative Commons Attribution (CC BY) license (http://creativecommons.org/licenses/by/4.0/).
Share and Cite
MDPI and ACS Style
Priyambodo, T.K.; Wijayanto, D.; Gitakarma, M.S. Performance Optimization of MANET Networks through Routing Protocol Analysis. Computers 2021, 10, 2. https://0-doi-org.brum.beds.ac.uk/10.3390/computers10010002
AMA Style
Priyambodo TK, Wijayanto D, Gitakarma MS. Performance Optimization of MANET Networks through Routing Protocol Analysis. Computers. 2021; 10(1):2. https://0-doi-org.brum.beds.ac.uk/10.3390/computers10010002
Chicago/Turabian StylePriyambodo, Tri Kuntoro, Danur Wijayanto, and Made Santo Gitakarma. 2021. "Performance Optimization of MANET Networks through Routing Protocol Analysis" Computers 10, no. 1: 2. https://0-doi-org.brum.beds.ac.uk/10.3390/computers10010002
Note that from the first issue of 2016, this journal uses article numbers instead of page numbers. See further details here.