
Performance Evaluation of Massively Parallel Systems Using SPEC OMP Suite


Department of Computer Engineering, Faculty of Engineering, The Hashemite University, Zarqa 13133, Jordan
Computers 2022, 11(5), 75; https://0-doi-org.brum.beds.ac.uk/10.3390/computers11050075
Submission received: 16 April 2022
/
Revised: 2 May 2022
/
Accepted: 3 May 2022
/
Published: 5 May 2022
(This article belongs to the Topic Innovation of Applied System)
Abstract
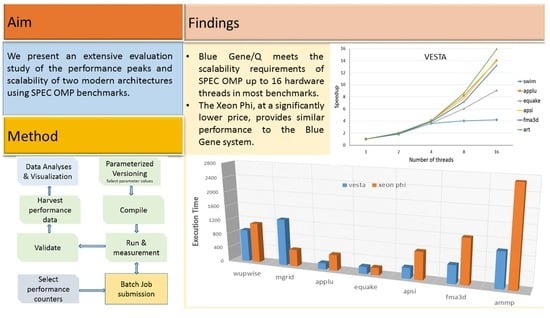
:Performance analysis plays an essential role in achieving a scalable performance of applications on massively parallel supercomputers equipped with thousands of processors. This paper is an empirical investigation to study, in depth, the performance of two of the most common High-Performance Computing architectures in the world. IBM has developed three generations of Blue Gene supercomputers—Blue Gene/L, P, and Q—that use, at a large scale, low-power processors to achieve high performance. Better CPU core efficiency has been empowered by a higher level of integration to gain more parallelism per processing element. On the other hand, the Intel Xeon Phi coprocessor armed with 61 on-chip x86 cores, provides high theoretical peak performance, as well as software development flexibility with existing high-level programming tools. We present an extensive evaluation study of the performance peaks and scalability of these two modern architectures using SPEC OMP benchmarks.
1. Introduction
Over the years, different massively parallel computing technologies have been proposed, ranging from SIMD-based array processors, MIMD-based shared-memory multiprocessors, to MIMD-based scalable distributed clusters. Supercomputers today are based on GPUs and coprocessors. Hence, an essential high-performance computing (HPC) research activity is to analyze the performance and features of these current technologies.
Based on X86 multicore, the Xeon-Phi coprocessor is a many integrated Core (MIC) architecture system with low power consumption. It is designed specifically for HPC applications that seek to decrease execution time across different industries, such as healthcare, aerodynamics, climate simulation, oil exploration, space research, and finance and business among many other parallel applications. Achieving a theoretical performance of one TeraFlops, the Xeon-Phi coprocessor has 61 real cores integrated on a single die, two levels of cache memory, and a high bandwidth ring interconnection [1]. The first product, codenamed Knights Corner (KNC), was built on a 22-nanometer manufacturing process.
The Xeon-Phi coprocessor programming flexibility provides software developers with a significant asset; it supports traditional, well-established programming models and libraries. Programming scientific applications using CUDA (for GPUs) or OpenCL requires much higher effort as compared to OpenMP programming for multicore and many integrated cores [2]. That is because OpenMP is based on directives, while CUDA requires programming low-level kernels. Previous studies showed that porting scientific applications to the Xeon-Phi coprocessor is moderately straightforward, which makes it a piece of favorable equipment for HPC software [3].
Xeon Phi, similar to other accelerators (i.e., GPUs), achieves an excellent performance relying on the high level of concurrency, provided by many cores with wide vector-processing units on. Its on-chip high-bandwidth interconnect can significantly increase the performance of memory-intensive applications that fit in 8 GB of local memory space. Xeon Phi shares several features with shared memory systems and GPUs, such as the SIMT programming model, vectorization, high throughput, and high bandwidth [1]. However, the Xeon Phi coprocessor has many architectural differences from GPUs and multicore [4]; GPUs do not support the overall cache coherency available on Xeon Phi. Furthermore, multi-core CPUs and GPUs are not equipped with ring interconnect.
Parallel platforms can be developed using high-performing and well-known Intel Xeon processors and coprocessors, offering operating speeds in the TFLOPS range. In the past few years, many supercomputers, powered by Xeon-Phi, have been on the TOP 500 list. With the magnificent performance peaks offered by GPU-based systems, business interest focused on GPGPUs, and Intel discontinued the Xeon Phi project. However, we believe that Xeon-Phi, as either the main processing unit or the coprocessor, will continue to be an essential element of HPC systems.
The massively parallel system of the IBM Blue Gene is designed to have high energy efficiency and high levels of scalability, approaching high throughput in the Petaflops range. To achieve this, it utilizes system-on-a-chip (SOC) technology to integrate high-bandwidth networks with the CPUs onto a single die. IBM Blue Gene includes three families of massively parallel systems, Blue Gene/L, Blue Gene/P, and Blue Gene/Q [5,6,7,8]. Blue Gene supercomputers have been among the most high-performance systems with low power consumption for several years; as they have consistently scored top rankings on the TOP500, Green500, and Graph500 lists [9,10,11]. The Blue Gene System won the 2008 National Medal of Technology and Innovation.
The main objective of this paper is to conduct a comparative study of the performance of scientific applications and benchmarks on Blue Gene RISC-based supercomputers developed by IBM, and Intel MIC CISC architectures. Both architectures have a simple programming model compared to GPUs. Moreover, ironically both architectures have been discontinued by their developers. To the best of our knowledge, no previous study has compared the performance of both architectures using the SPEC OpenMP suite. The study will help understand the behavior of supercomputers; lessons will be learned to produce more efficient scientific code. This paper makes the following contributions:
- Conducting A comparative study of the scalability and performance peaks of modern architectures, including IBM Blue Gene and Intel Xeon Phi architectures as representatives of modern multicore systems using a wide set of parallel benchmarks.
- Porting SPEC OMP suite to the incompatible Blue Gene systems software architecture.
- Developing an evaluation methodology that utilizes performance-analysis tools and simplifies experiment setup, data harvesting, and mining.
The rest of the paper is organized as follows. The next section briefly discusses the Blue Gene supercomputing systems under study. Section 3 presents Intel MIC architecture. Section 4 describes the benchmarks we have been using in the study. Results are presented and discussed in Section 5. Related work is discussed in Section 6. Finally, conclusions are discussed in Section 7.
2. Blue Gene System Overview
The Blue Gene supercomputers use SOC technology [12] to integrate high-bandwidth networks with the processors onto a single die. To achieve high levels of scalability, the Blue Gene system uses a novel software architecture [13].
Blue Gene systems have comparably low power consumption and moderate performance processors. Therefore, accelerating a scientific application on Blue Gene normally requires more processors as compared to traditional massive parallel systems that use powerful CPUs, both in terms of energy dissipated and throughput delivered. It is necessary to investigate Blue Gene systems’ scalability extremely to effectively use their massive computation power. Reaching such high levels of parallel scalability and performance is generally a challenging and tedious process, but can be steered with performance analysis tools. Several studies have found that an enormous number of essential real-world scientific programs can be efficiently scaled to tens of thousands of Blue Gene/L processors [14].
The Blue gene includes three families of supercomputers, Blue Gene/L, Blue Gene/P, and Blue Gene/Q. in this paper, we conducted experiments on Blue Gene/P and Blue Gene/Q systems. The following subsections introduce the main hardware and software characteristics of these systems.
2.1. Blue Gene/Q (VESTA)
IBM, in cooperation with Lawrence Livermore National Laboratory (LLNL), has developed the Blue Gene/Q: the third and the last generation of Blue Gene supercomputers. The VESTA system is composed of one compute rack of a massively parallel Blue Gene/Q system. A compute rack is configured with either one or two midplanes. Each midplane has 16 node boards with 32 compute cards plugging into each node board. Each compute card includes 16 core processors from IBM PowerPC A2 and 16 GB of memory. The system is capable of running 64 K hardware threads and can be scaled to 512 racks [15].
In summary, the VESTA machine includes one rack of Blue Gene/Q with 1024 nodes and 82.19 KW power. Each node has a 16-core Power BQC processor and 32 GB of RAM. Each core has a frequency of 1.6 GHz and handles 4 hardware threads. VESTA system can support up to 64 K hardware threads with 16,384 cores and 32 terabytes of RAM, achieving a peak performance of 209 teraflops. It has an overall storage capacity of 7.6 PB, with 88 GB/s bandwidth, and 640 I/O nodes.
2.2. Blue Gene/P (SURVEYOR)
Surveyor is an IBM Blue Gene/P system installed at Argonne National Lab with 4096 processors. It delivers peak performance up to 13.9 TeraFlops, depending on its mode of operation [16]. In summary, Surveyor Machine is one rack of Blue Gene/P with 1024 quad-core nodes. Each node has an 850 MHz quad-core CPU and 2 GB RAM (2 terabytes of RAM per rack). It is used for software development and optimization, and porting tools and applications.
2.3. Blue Gene/L
The Blue Gene/L system, located at the LLNL site, contains 700 MHz 64 K dual-core PowerPC computational nodes. Blue Gene/L, with 131,072 cores, offers a theoretical peak performance of 360 TeraFlops.
2.4. IBM XL Compilers
IBM XL compilers on PowerPC architecture-based systems have several code optimizations specific to their architecture. For example, they generate fast-executing code that maximizes double floating-point unit utilization. Moreover, they provide memory-cache optimization, loop optimization, instruction scheduling, and fast scalar math routines. We used IBM XL C/C++ v 12.1, and Fortran version 14.1 in the experiments [17].
2.5. Performance Tools
Early software efforts were initiated to port extensively used performance tools, debuggers, and libraries to the Blue Gene/Q system. The list includes Blue Gene Performance Measurement (BGPM), GNU Profiler (GPROF), Tuning and Analysis Utilities (TAU), High-Performance Computing Toolkit (HPCT), and Performance Application Programming Interface (PAPI), and more.
In this paper, we use IBM HPCT which provides both MPI metrics and single-node hardware counters. The HPCT API is straightforward. The only drawback is that we have to manually annotate the source code sections with the instrumentation call. Furthermore, we change OpenMP programs into MPI programs by simply wrapping the program with MPI_INIT and MPI_FIINALIZE function calls to make the code compatible with the IBM MPI compilers that can trigger sampling.
Blue Gene/Q system provides hundreds of hardware performance counters to facilitate quantifying the performance of several components. This includes events related to core, caches (L1\L2), memory, prefetcher, network, message unit, PCIe, and kernel. The main performance metrics used in this study are execution time, CPU cycles count, instructions count, memory traffic (B/s), and cache hits/misses.
2.6. Batch Job Submission Tool
Cobalt is a tool developed by IBM to facilitate job submission to the Blue Gene Machines. The latest version is updated to have a close interface to the Portable Batch System. Using this tool, the user can control the layout of threads across the cores, and memory mapping to each core. Moreover, it allows users to control job dependencies, job maximum execution time, environment variables, and the number of nodes and processes [18].
3. Intel Xeon Phi System Overview Discussion
This section is dedicated to briefly describing the Intel Xeon Phi coprocessor with its innovative architectural characteristics and standard programming models.
3.1. Many Integrated Cores (MIC) Architecture
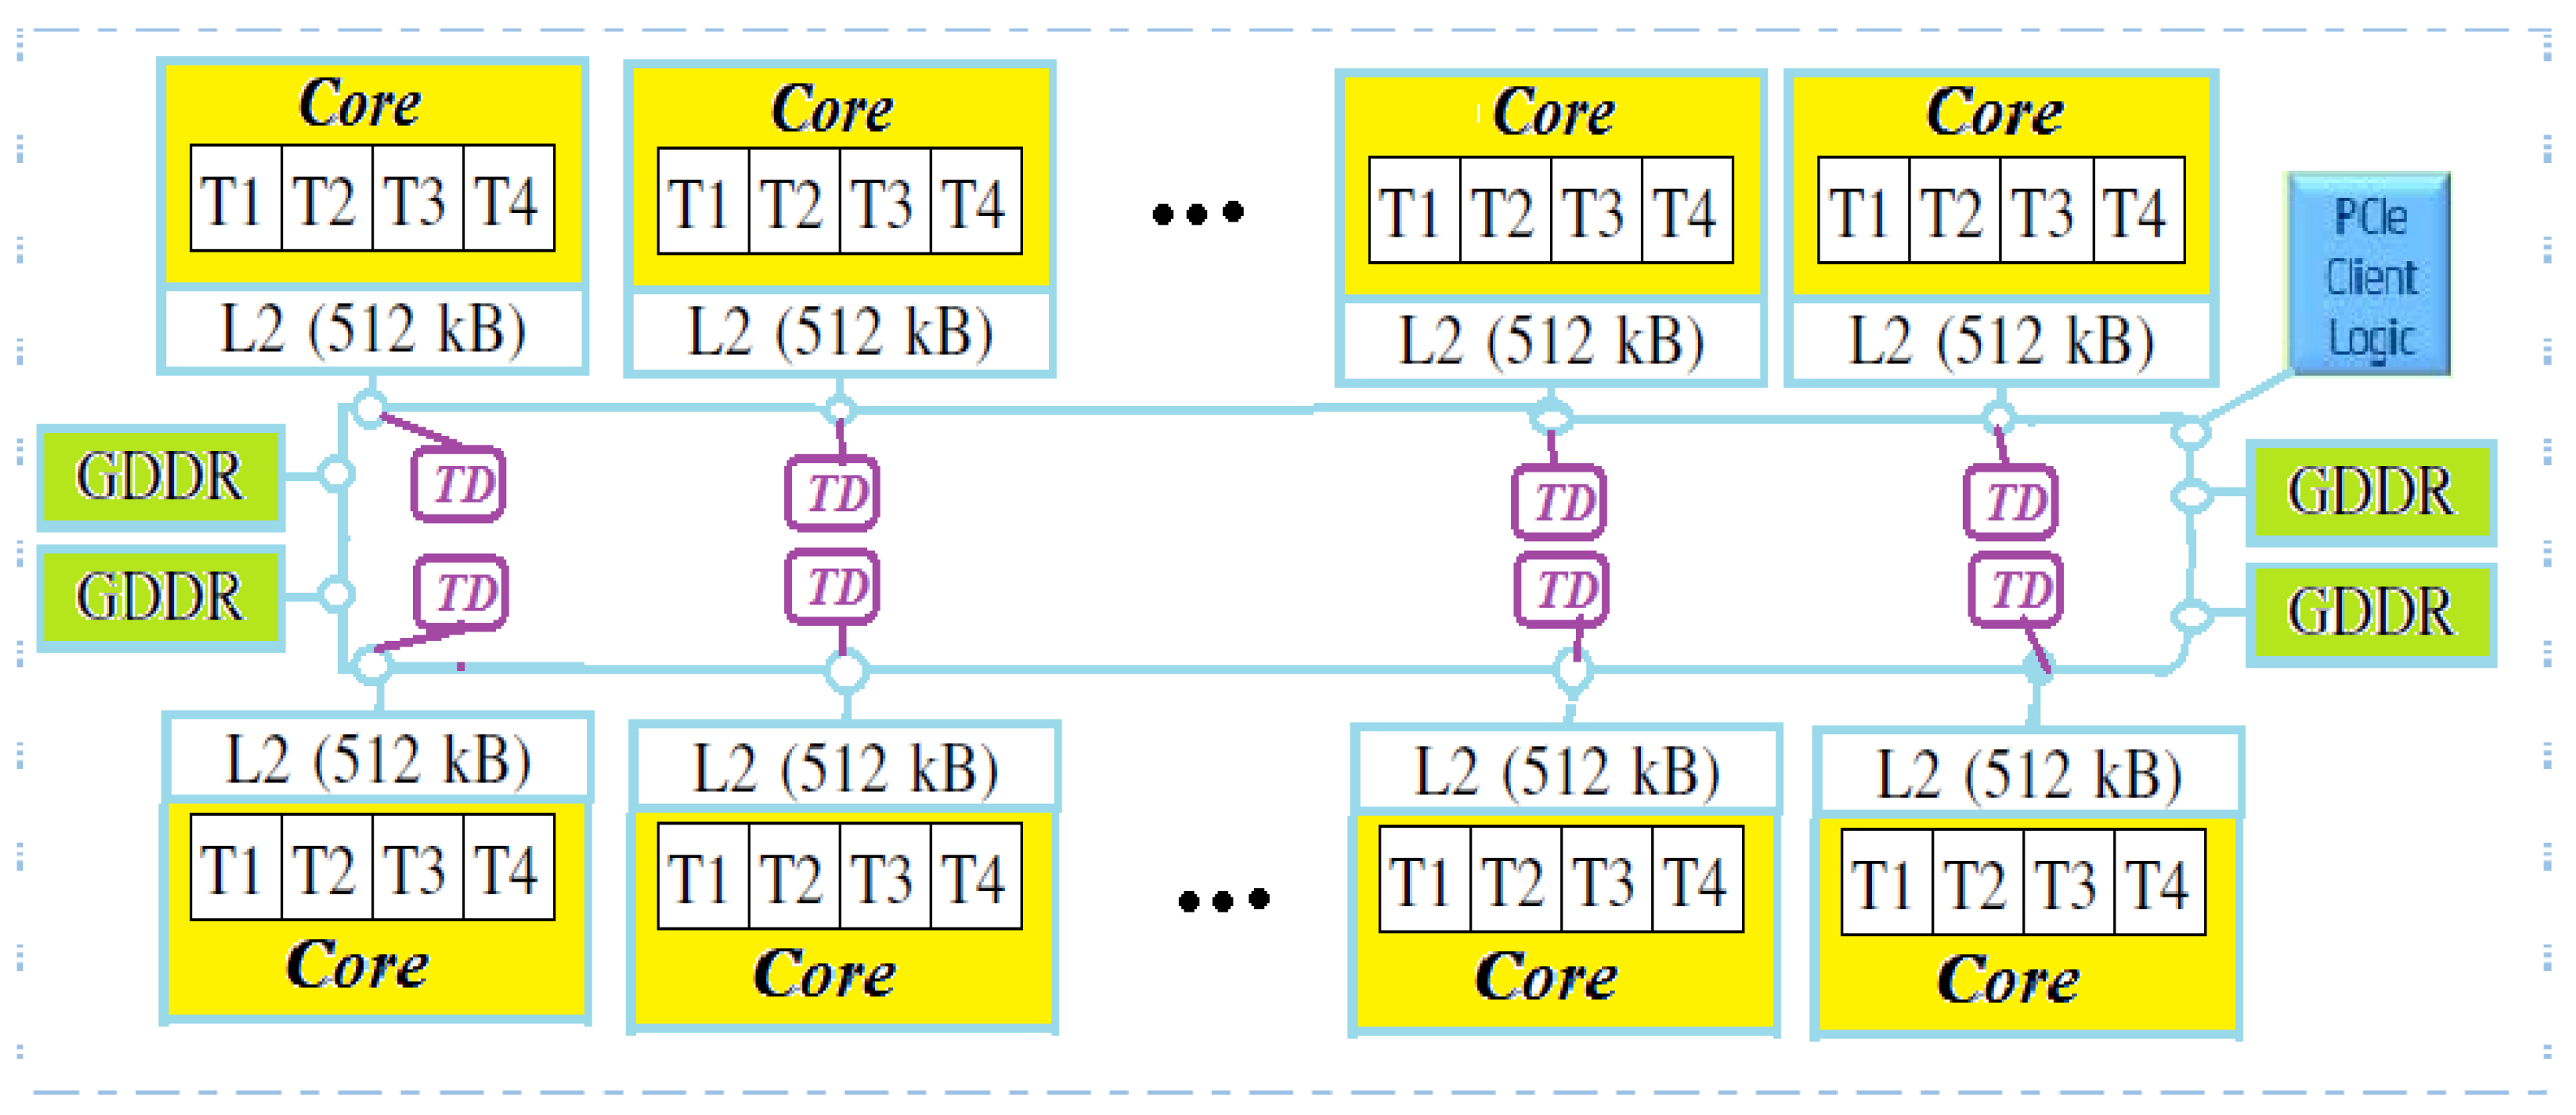
Intel MIC architecture was introduced as an alternative technology to GPUs. It is a multicore in-order Intel Architecture (IA) engine with hardware multithreading, multiple cores, and wide vector units. The in-order cores run at a relatively low frequency (around 1.2 GHz). The first product, Xeon Phi, was codenamed the Knights Corner and built on a 22 nm chip. Xeon Phi has over 50 × 86 Pentium architecture-based cores and 16 memory channels on-chip. An on-chip bidirectional interconnect provides high-performance communication to these cores, as depicted in Figure 1. The memory channels can offer 5.0 GT/s bandwidth, with the support of memory controllers [4].
The Intel Xeon Phi coprocessor, as an accelerator, and GPUs are connected to a host (i.e., Intel Xeon processor) via a PCI Express (PCIe) system interface, which makes them look physically similar. Xeon Phi runs a special-purpose embedded OS, and is managed by the host; it obtains power and communication from the host motherboard.
Each core supports four hardware threads, which gives rise to approximately 240 logical cores per card, enabling maximum instruction issue rate. Every core has: (1) a 512-bit wide Vector Processing Unit (VPU), which supports 512-bit SIMD vectors, and the Intel Initial Many-Core Instructions (2) 32 512-bit wide vector registers per thread context, (3) 32 KB L1 data and instruction caches only accessible locally, and (4) a core-private 512 KB coherent unified L2 cache. In all, each 60-core coprocessor has over 30 MB of coherent L2 cache available on the die.
The ring network model offers on-chip interconnection among all cores. This network allows each core to access the L2 caches for all other cores. The hardware maintains L2 cache coherency using non-centralized distributed tag directories (DTDs). The address space is equally portioned, and then each partition’s coherency is maintained globally by a DTD assigned to it. Xeon Phi contains up to 16 GB of GDDR5 RAM delivering bandwidth of about 170 GB/s.
3.2. Programming Model
The Intel Xeon Phi coprocessor has many Intel x86 cores integrated (MC) onto a single chip. Therefore, Xeon Phi provides the full capacity to take advantage of the same regular Intel Xeon processor’s programming languages, tools, and programming models. It supports Pthreads [19], MPI, and OpenMP [20] programming models, which are familiar and well-established in the HPC community. Intel Cilk Plus [21] and OpenCL [22] tools are also available. In other words, one can compile and run source code written for Intel MIC architecture using the Intel ICC compiler unaltered on Intel Xeon processors [23].
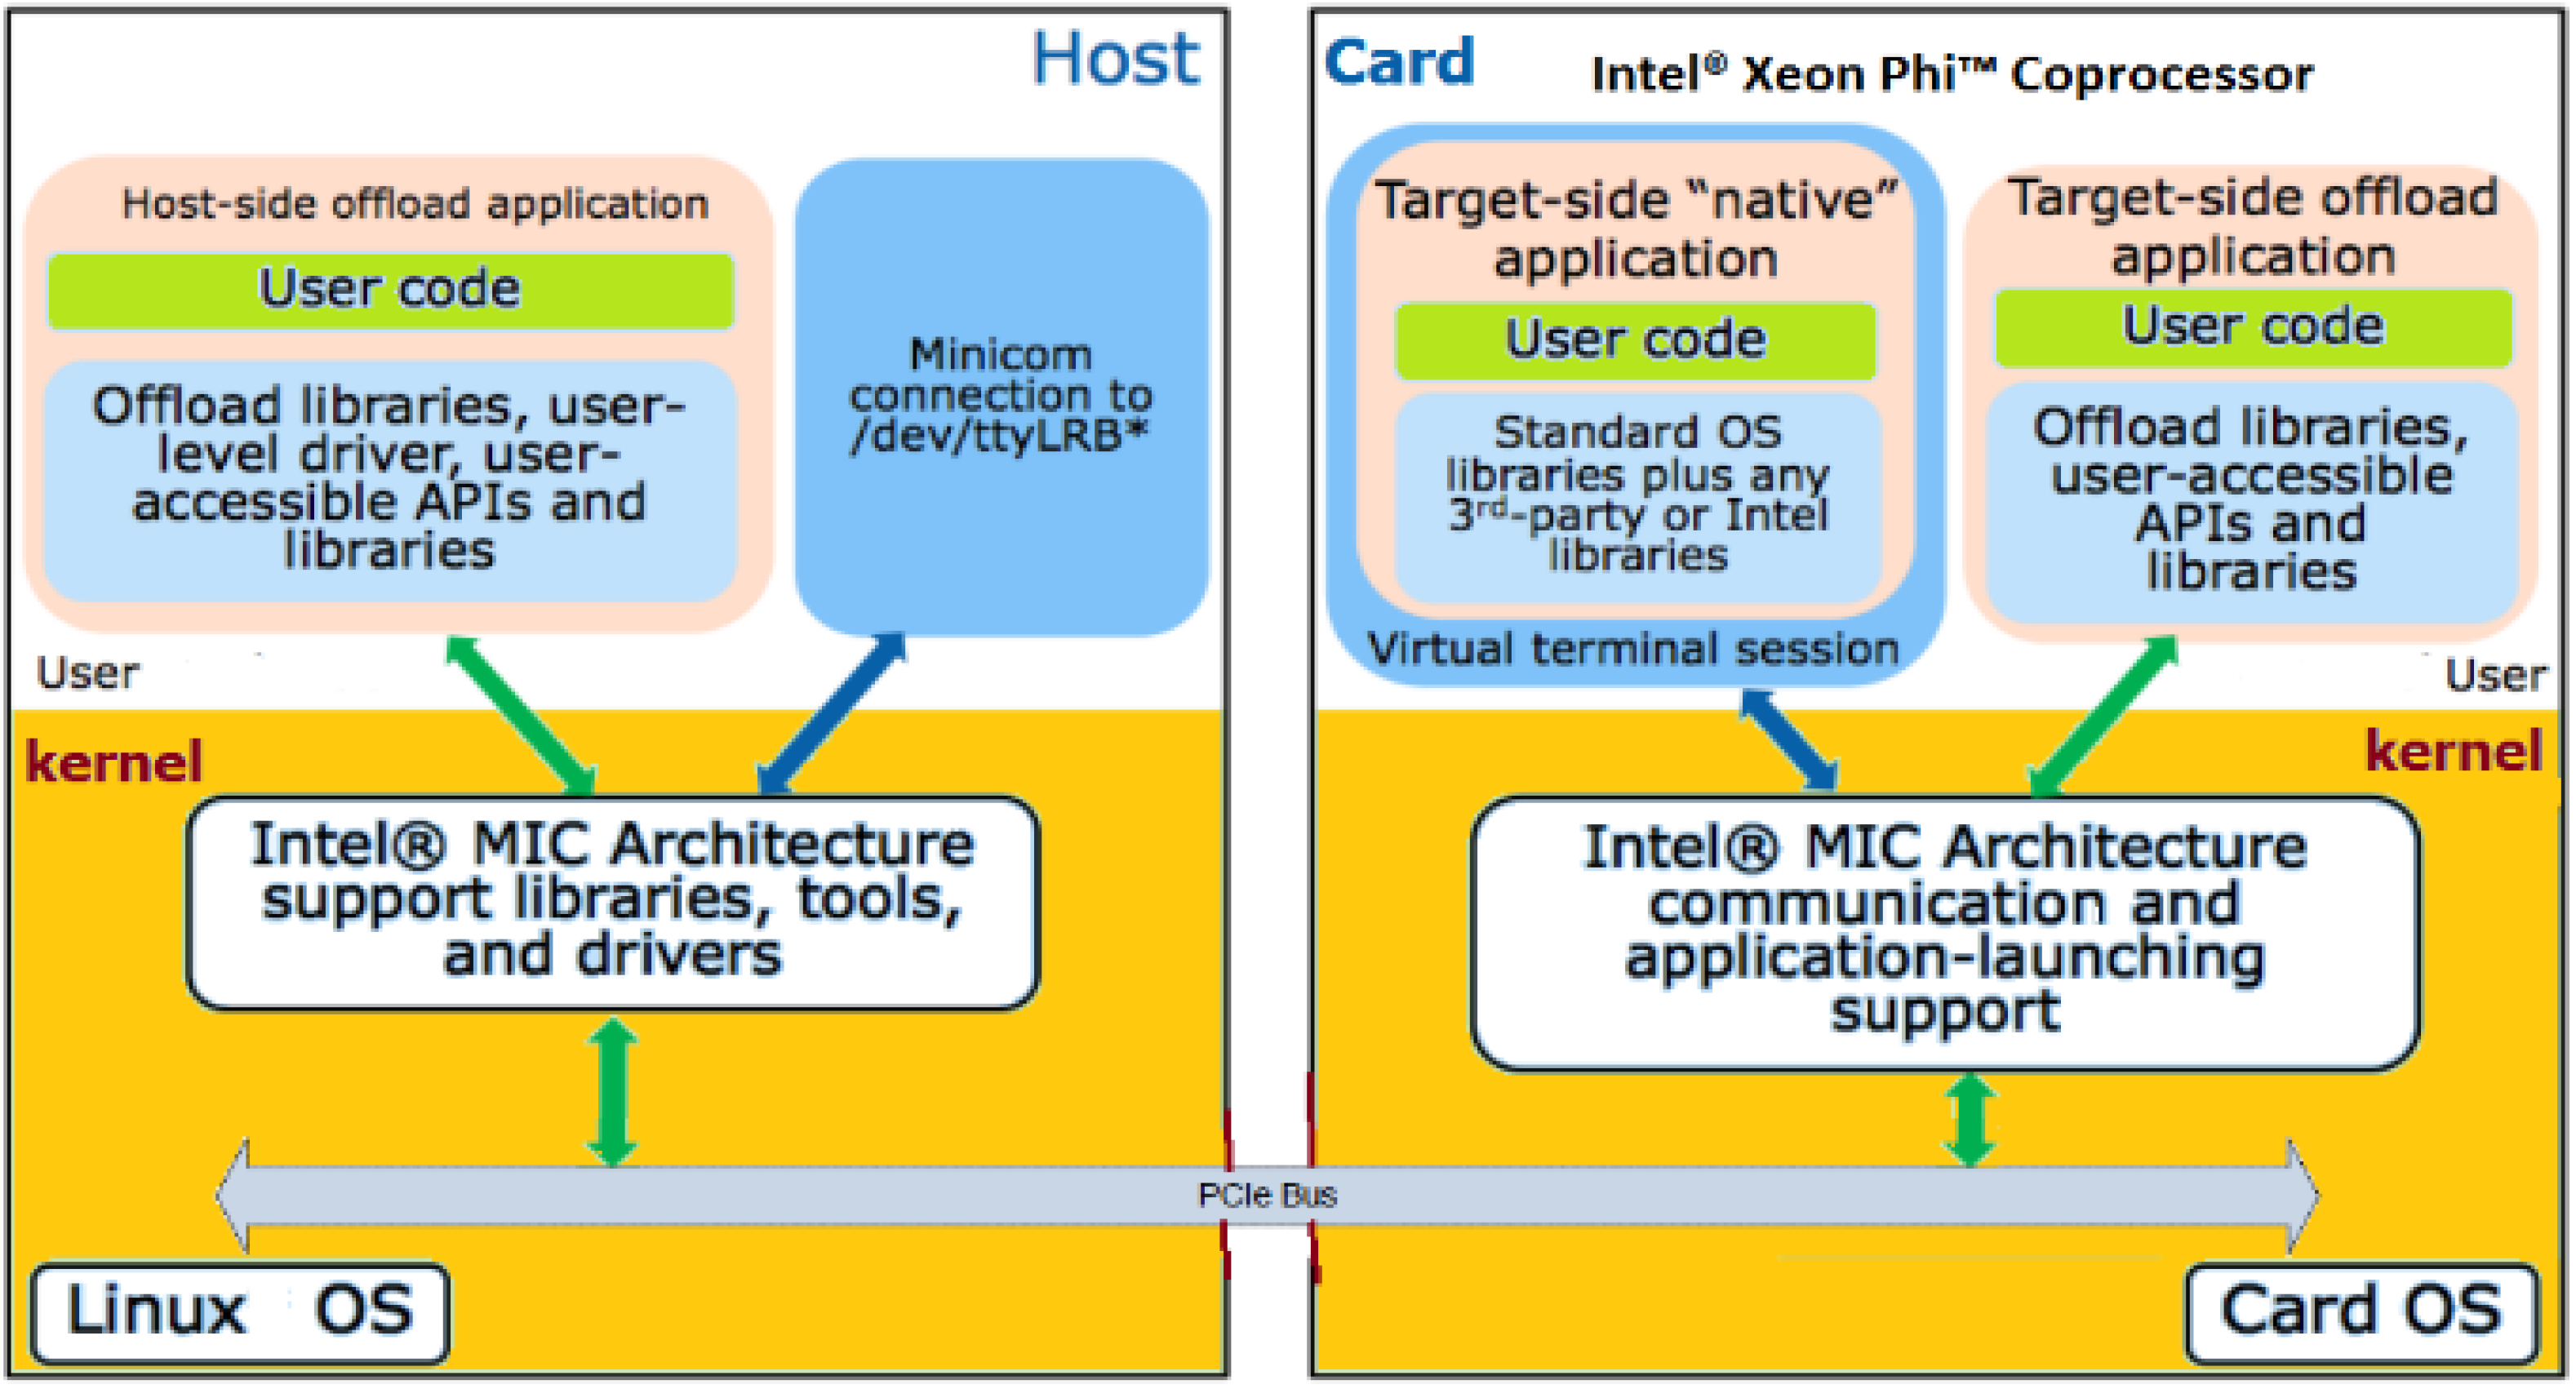
Using Xeon Phi coprocessors rather than GPUs has key advantages: (1) software developers can write code, using C, C++, or Fortran standard programming languages, that targets Xeon Phi coprocessor; (2) refactoring code using accelerator-specific programming paradigms is not needed; (3) developer-training barriers are eliminated. On the other side, porting CPU application code to a GPU using CUDA needs alterations in algorithm and syntax by software developers, investing efforts in software engineering rather than problems. Figure 2 illustrates Intel’s MIC software architecture.
The powerful Xeon-Phi supports two operating modes: offload mode as an accelerator (or coprocessor); or native mode as a stand-alone machine that executes code independently from the host or other coprocessors. Comparing it to a standard Xeon-based system, the Xeon Phi offers at least 7× more logical cores. With offload mode, the host executes the main code, while the computationally intensive portion of the code is offloaded to the device. Although performance is similar for both modes, the offload mode permits more programming flexibility [24].
4. Overview of the SPEC OMP Benchmarks
SPEC (The Standard Performance Evaluation Corporation) created the SPEC OpenMP (OMP) benchmark suites to measure the performance of modern shared-memory multiprocessor systems based on objective and representative OpenMP applications. There are two generations of the SPEC OMP benchmarks suite: SPEC OMP2001 and SPEC OMP2012 [25].
SPEC OMP2001 Medium (<2 GB) was developed for -C programs and eight FORTRAN programs, while OMP2001 Large (>8 GB) includes two C programs and seven FORTRAN programs. SPEC OMP2012 includes five C programs, one C++ program, and seven FORTRAN programs. Table 1 shows an overview of the benchmarks. The following subsections explain porting these programs to Blue Gene systems. Major difficulties faced during the study were related to deciphering the SPEC OMP execution process to facilitate running a single benchmark as a job with full user control of its behavior. Running the full SPEC suite on Blue Gene machines is difficult due to system administrator limitations such as the limited number of jobs and the limited job maximum execution time. The user is allowed to submit a job via the cobalt submission system with a job runtime of no more than 2 h. Moreover, the SPEC OMP suite does not support Blue Gene architecture.
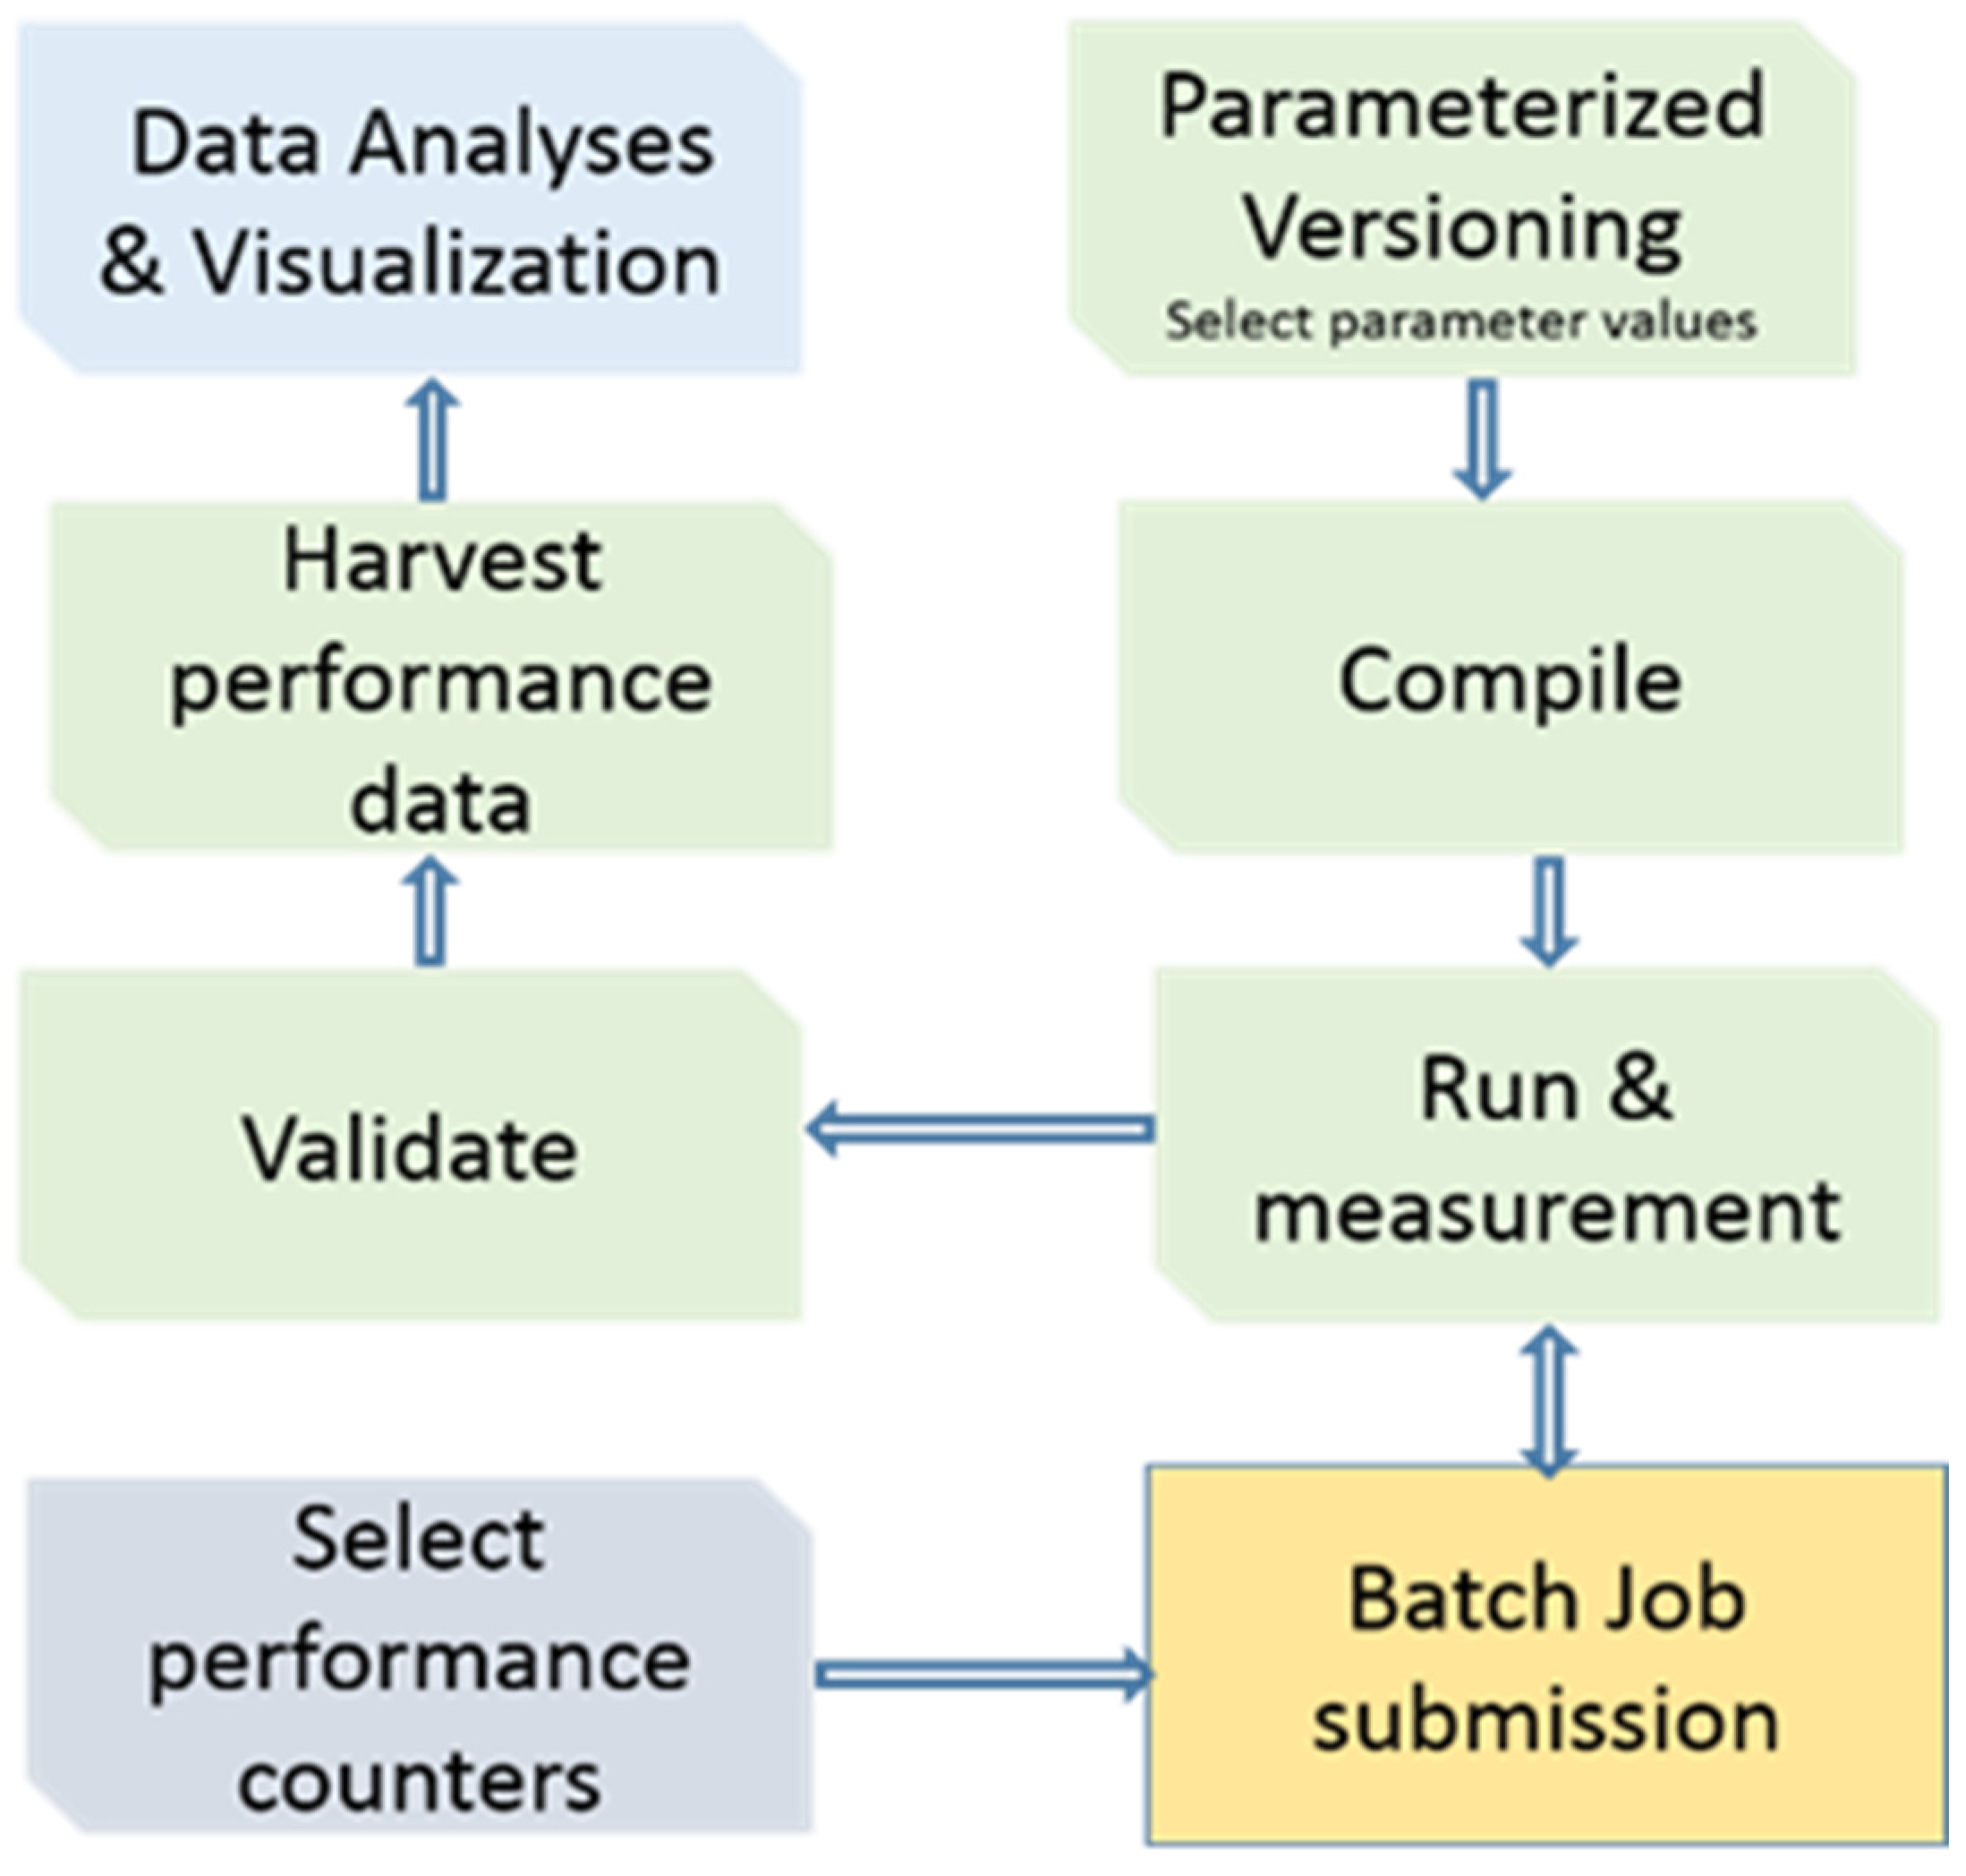
To facilitate compiling and submitting jobs for each benchmark, we have developed an execution environment that allows users to control the benchmark compilation, execution, and validation process. The environment archives binaries, results, and logs for every run. The performance evaluation workflow is depicted in Figure 3.
This subsection serves as a user guide to our ported version of the SPEC OMP suite to the Blue Gene machines. Each benchmark is represented by a directory that has a “Number.Name” name format. The main script, named “runtest”, written in bash, drives compile, execute, and validate cycle for each benchmark. It is controlled by various sets of environment variables. Users can set variables in the commvars file in the root directory, or inside the runtest script, or passed as an argument to the main script as follows:
where data = ref defines the dataset size used in this run, threads = 16 sets the number of threads triggered in this run, and threshold = 60 defines the maximum execution time allowed before terminating the program. 320.equake is the name of the benchmark used.
spec data = ref threads = 16 threshold = 60.
/runtest 320.equake
The compile step invokes the make command and passes a set of environment variables to the Makefile. All Makefiles include “Makefile.default”, distributed with SPEC OMP suite. Compiler, as well as its flags environment variables default values, can be overwritten using the “Makefile.spec” configuration file, which usually includes settings specific to a benchmark (i.e., Compiler and flags).
Run phase generates cobalt command based on speccmd.cmd and creates run-directory that includes binaries, and input files. The speccmd.cmd is written based on the object.pm script shipped with the SPEC OMP suite distribution. Validation compares output files generated by the benchmark with the pre-shipped output from the SPEC OMP suite distribution. To add a new benchmark, the user must maintain the directory structure and writes the speccmd.cmd commands for each dataset.
5. Results and Discussion
This section provides an extensive empirical evaluation study and discusses the results. First of all, we compare both architectures’ understudies—Intel Xeon Phi and IBM Blue Gene—in terms of their architectural characteristics, such as number of cores, number of hardware threads supported by each core, vector-processing unit width, frequency, and memory size. We also highlight the differences between both systems in the size and cost per rack. Table 2 summarizes the comparison between both systems.
For several months, a couple of thousands of experiments took place, producing more than 50 GB of run logs, results, and binaries archives. Analyzing such a huge amount of data is not trivial. We even ran more experiments to gain a deeper understanding of mysterious results. The following subsections present and discuss the results for each system.
5.1. Experiment Setup
One main strength of Blue Gene systems is their number of nodes and power scalability. To justify the comparison between both systems, we ran experiments on a single node of the Blue Gene system and a single node equipped with a Xeon Phi card. To measure single node performance scalability in terms of the number of hardware threads, we measure performance while varying the number of OpenMP threads on one node. We also measured the performance of the two threads’ layout policies: one that schedules processes to free cores first, which optimizes the number of active hardware threads per core and hence increases memory share for each thread; while the other policy fills the current core up to the maximum number of threads (also known as execution contexts) that a single core can handle before it moves to the next one.
5.2. SURVEYOR Blue Gene
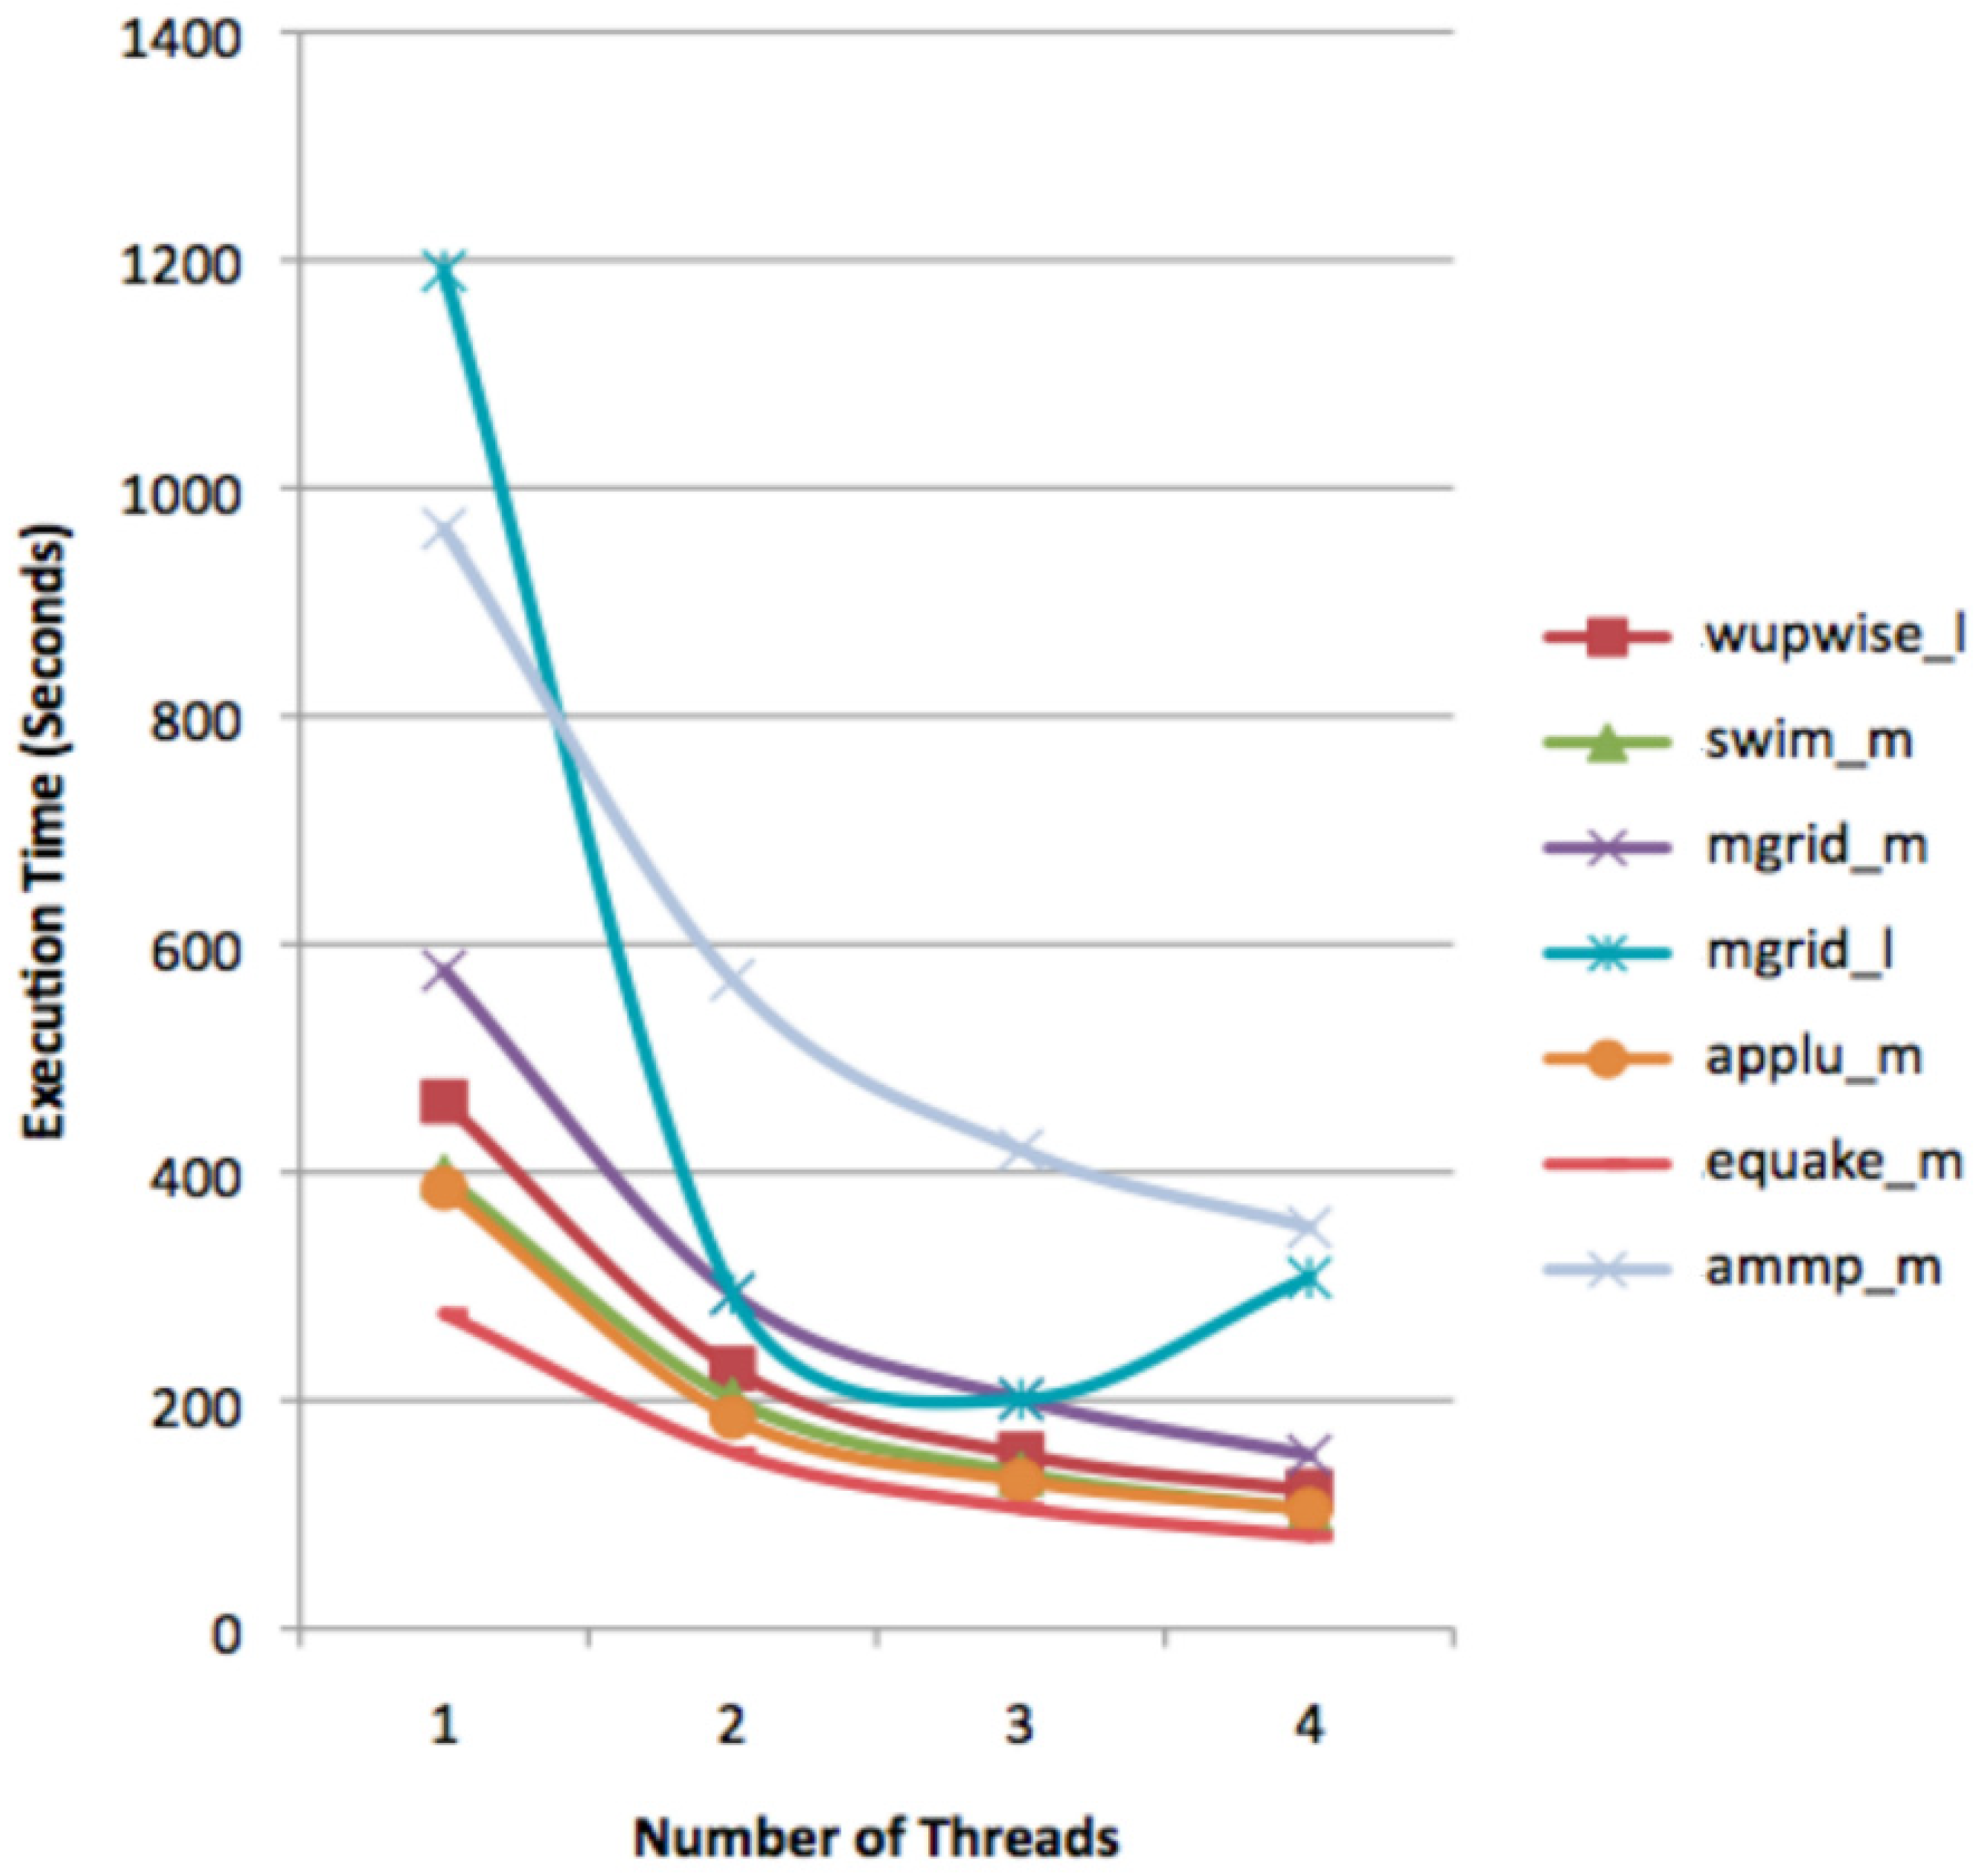
As described earlier, each node in the surveyor system has four cores; each one can run four hardware threads. We exhaustively experimented with the number of OpenMP threads from one to four on three datasets: test, train, and ref. Some benchmarks failed execution due to system administrative constraints on resources such as CPU cycles, and memory footprint. For example, major benchmarks execution, using the ref dataset, failed due to either runtime or compile-time errors related to memory outage. Each node in the surveyor system has 2 GB of memory. Other benchmarks failed because they exceeded the maximum execution time of 1 h. Some dataset workloads are very small and outdated as compared to these powerful parallel machines, which makes parallelization overhead (also known as fork-join overhead) much more than benchmark execution time. For illustration, Figure 4 presents the execution time of benchmarks using the training dataset after excluding benchmarks that failed execution, as well as those with a serial execution time of fewer than 100 s.
In summary, while the training dataset does not provide a sufficient workload for HPC evaluation, it is useful in developing and testing the evaluation framework, such as checking for execution failures and highlighting interesting cases for further investigation. Mgrid showed a performance degradation on four threads, caused by traffic on memory.
5.3. VESTA Blue Gene
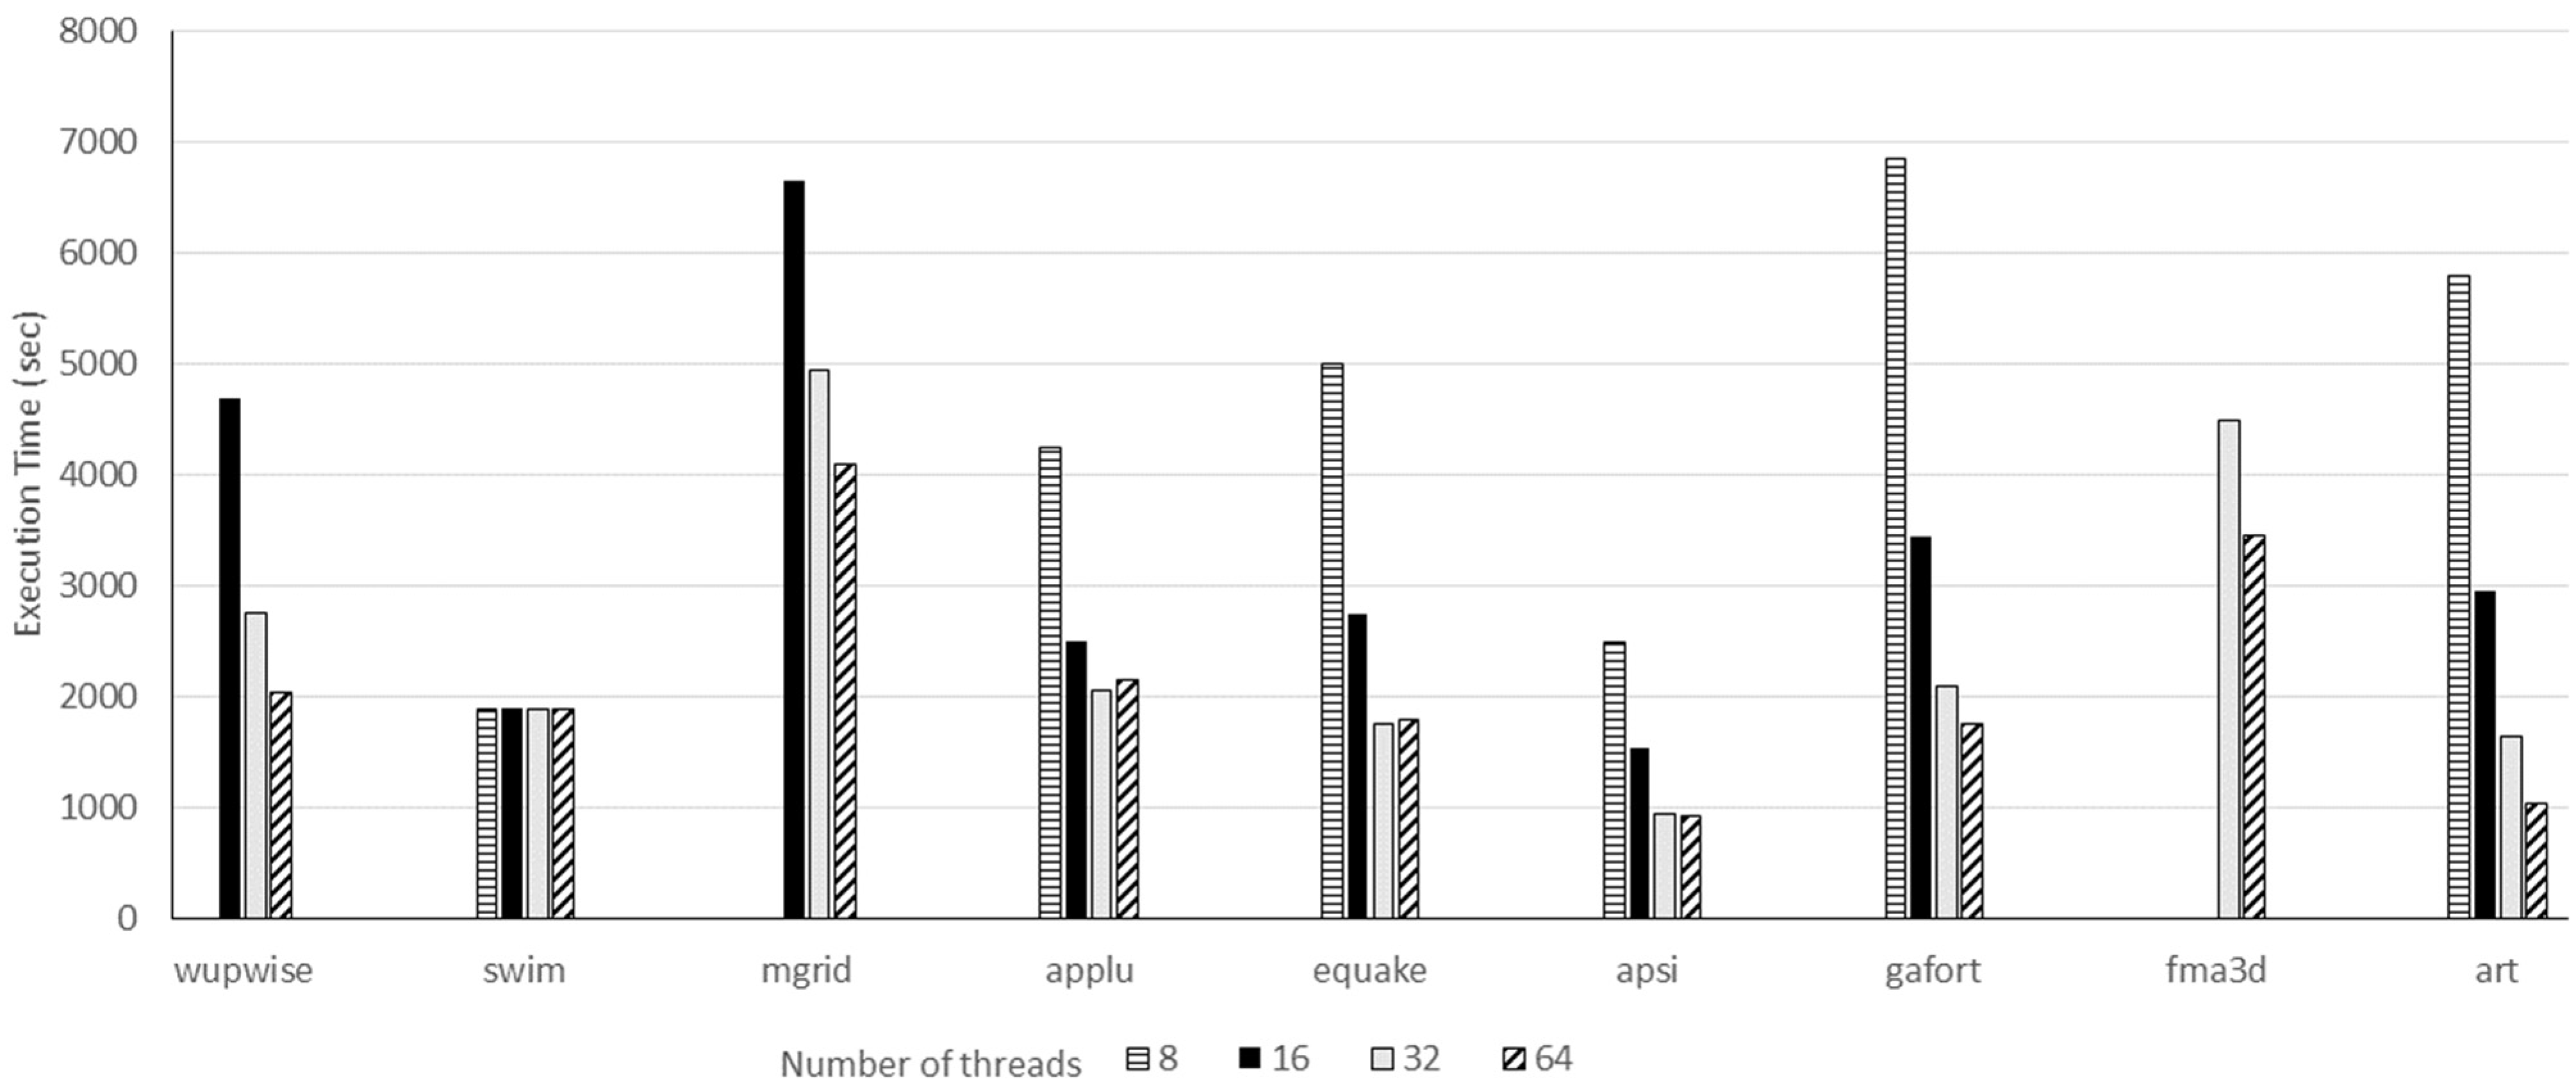
Each node in VESTA has 16 cores and can handle 64 hardware threads. Saving time and effort, we tried varying the number of OpenMP threads from 1, 2, 3, 4, 8, 16, 32, and 64. Figure 5 shows the execution time of the SPEC OMP2001 suite using the large ref dataset over 8, 16, 32, and 64 threads for the VESTA machine.
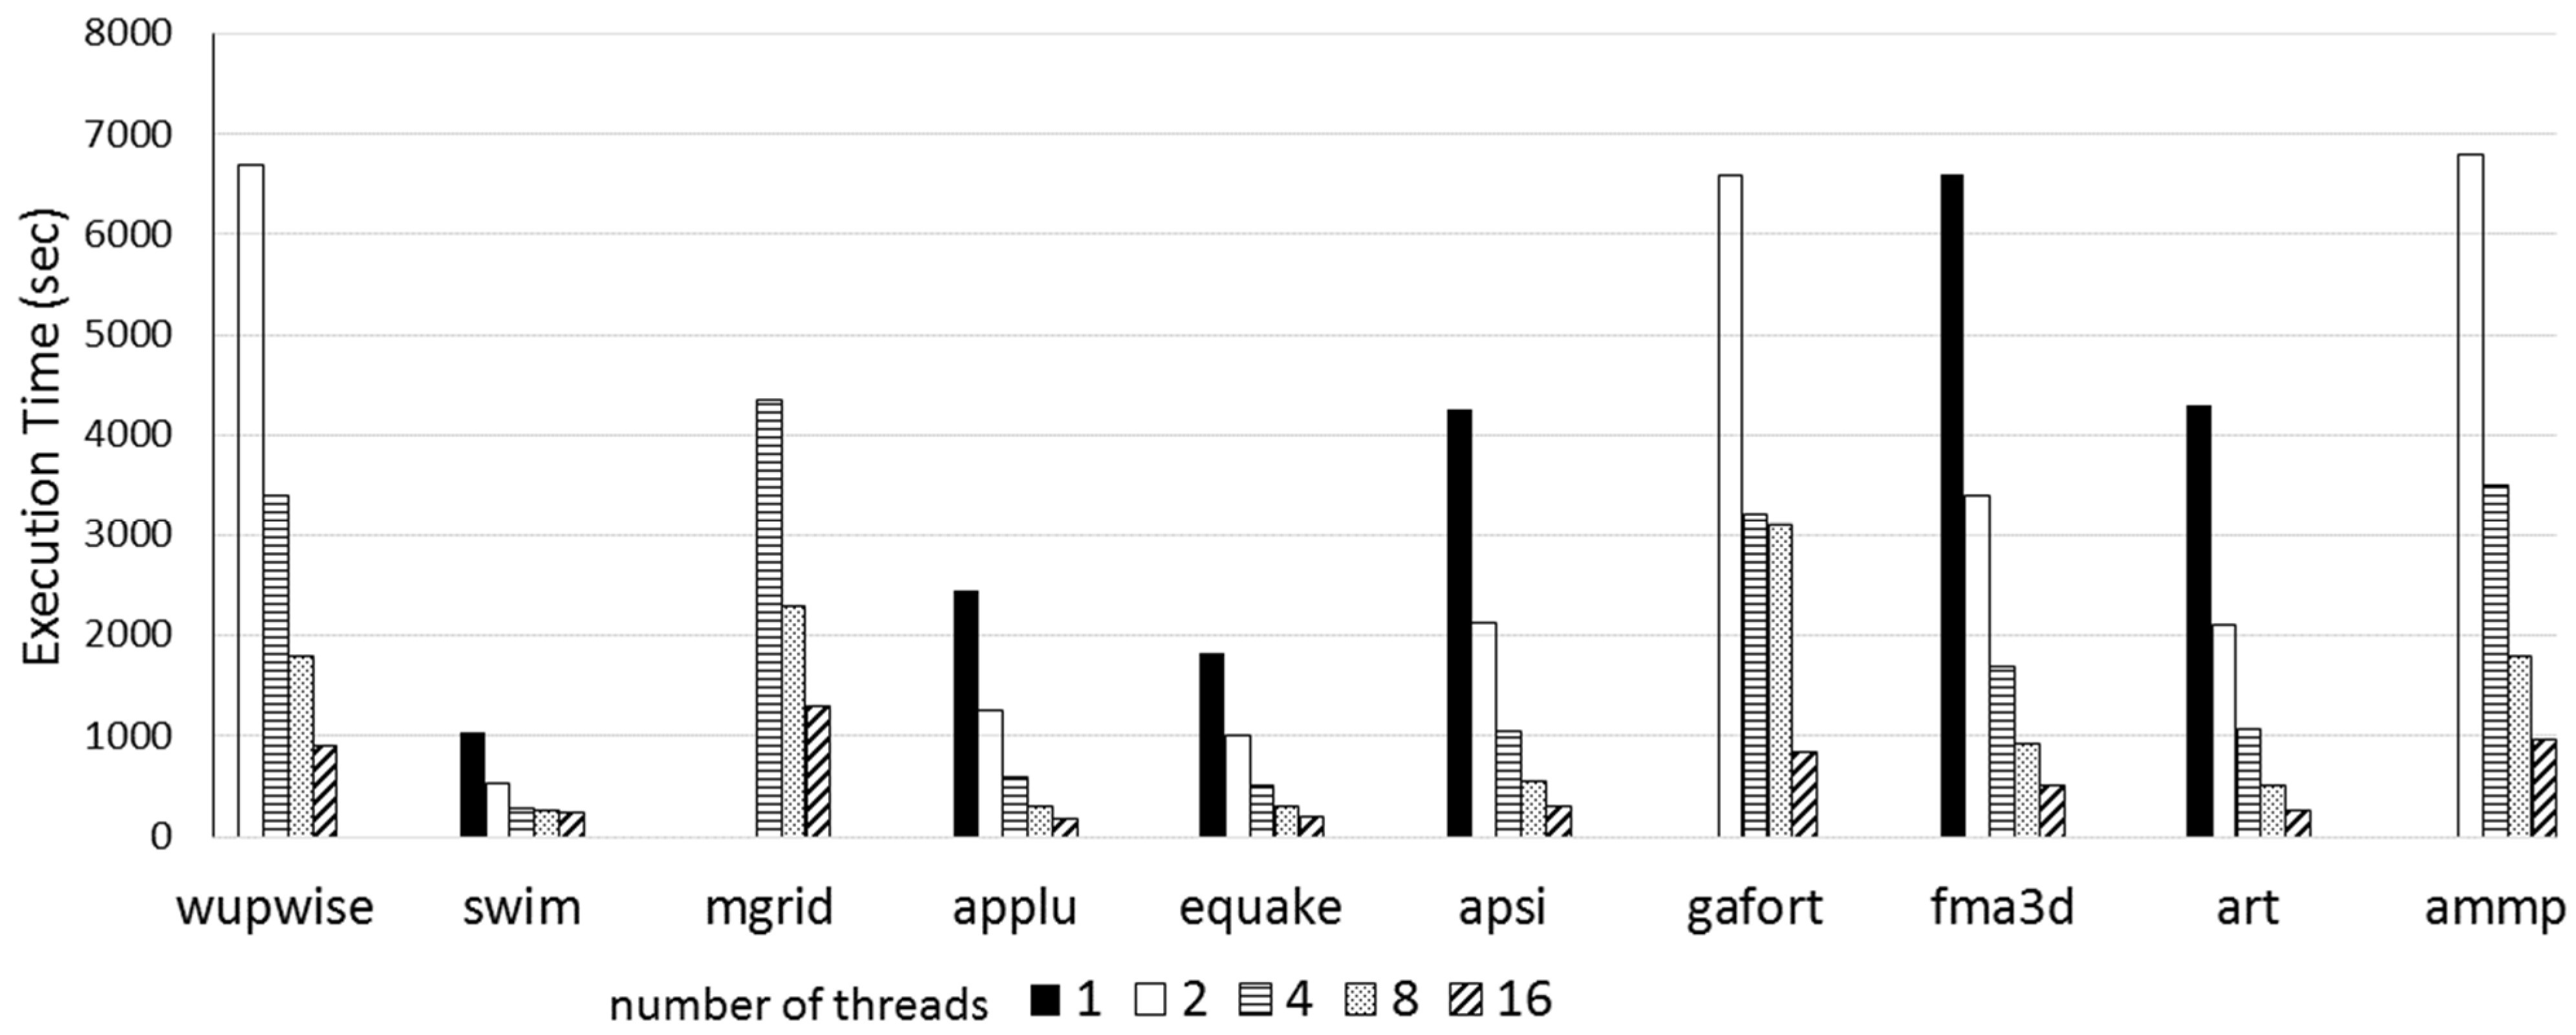
The performance scalability factor is computed for (8/16), (16/32), and (32/64) threads as depicted in Table 3. The super linearity rule expects a scalability factor of (2×). Practically, a good system achieves a scalability factor of (1.5×). Most benchmarks scale very well, with one interesting exception; the SWIM benchmark case is thoroughly studied later. VESTA scales very well, up to 32 threads. With 64 hardware threads, performance is improved only by 15%; mainly because of memory bandwidth limitation. Assigning only one thread to a core, VESTA achieves a scalability factor of (1.77) on average. Figure 6 shows the execution time of the SPEC OMP2001 suite with a medium ref dataset using 1, 2, 4, 8, and 16 threads on the same machine.
The VESTA machine SPEC score is 114502. Compared to the published results on the SPEC.org website, VESTA performs better than AMD Supermicro X7QC3, and HP server PA-8700. Specifications for these systems are shown in Table 4.
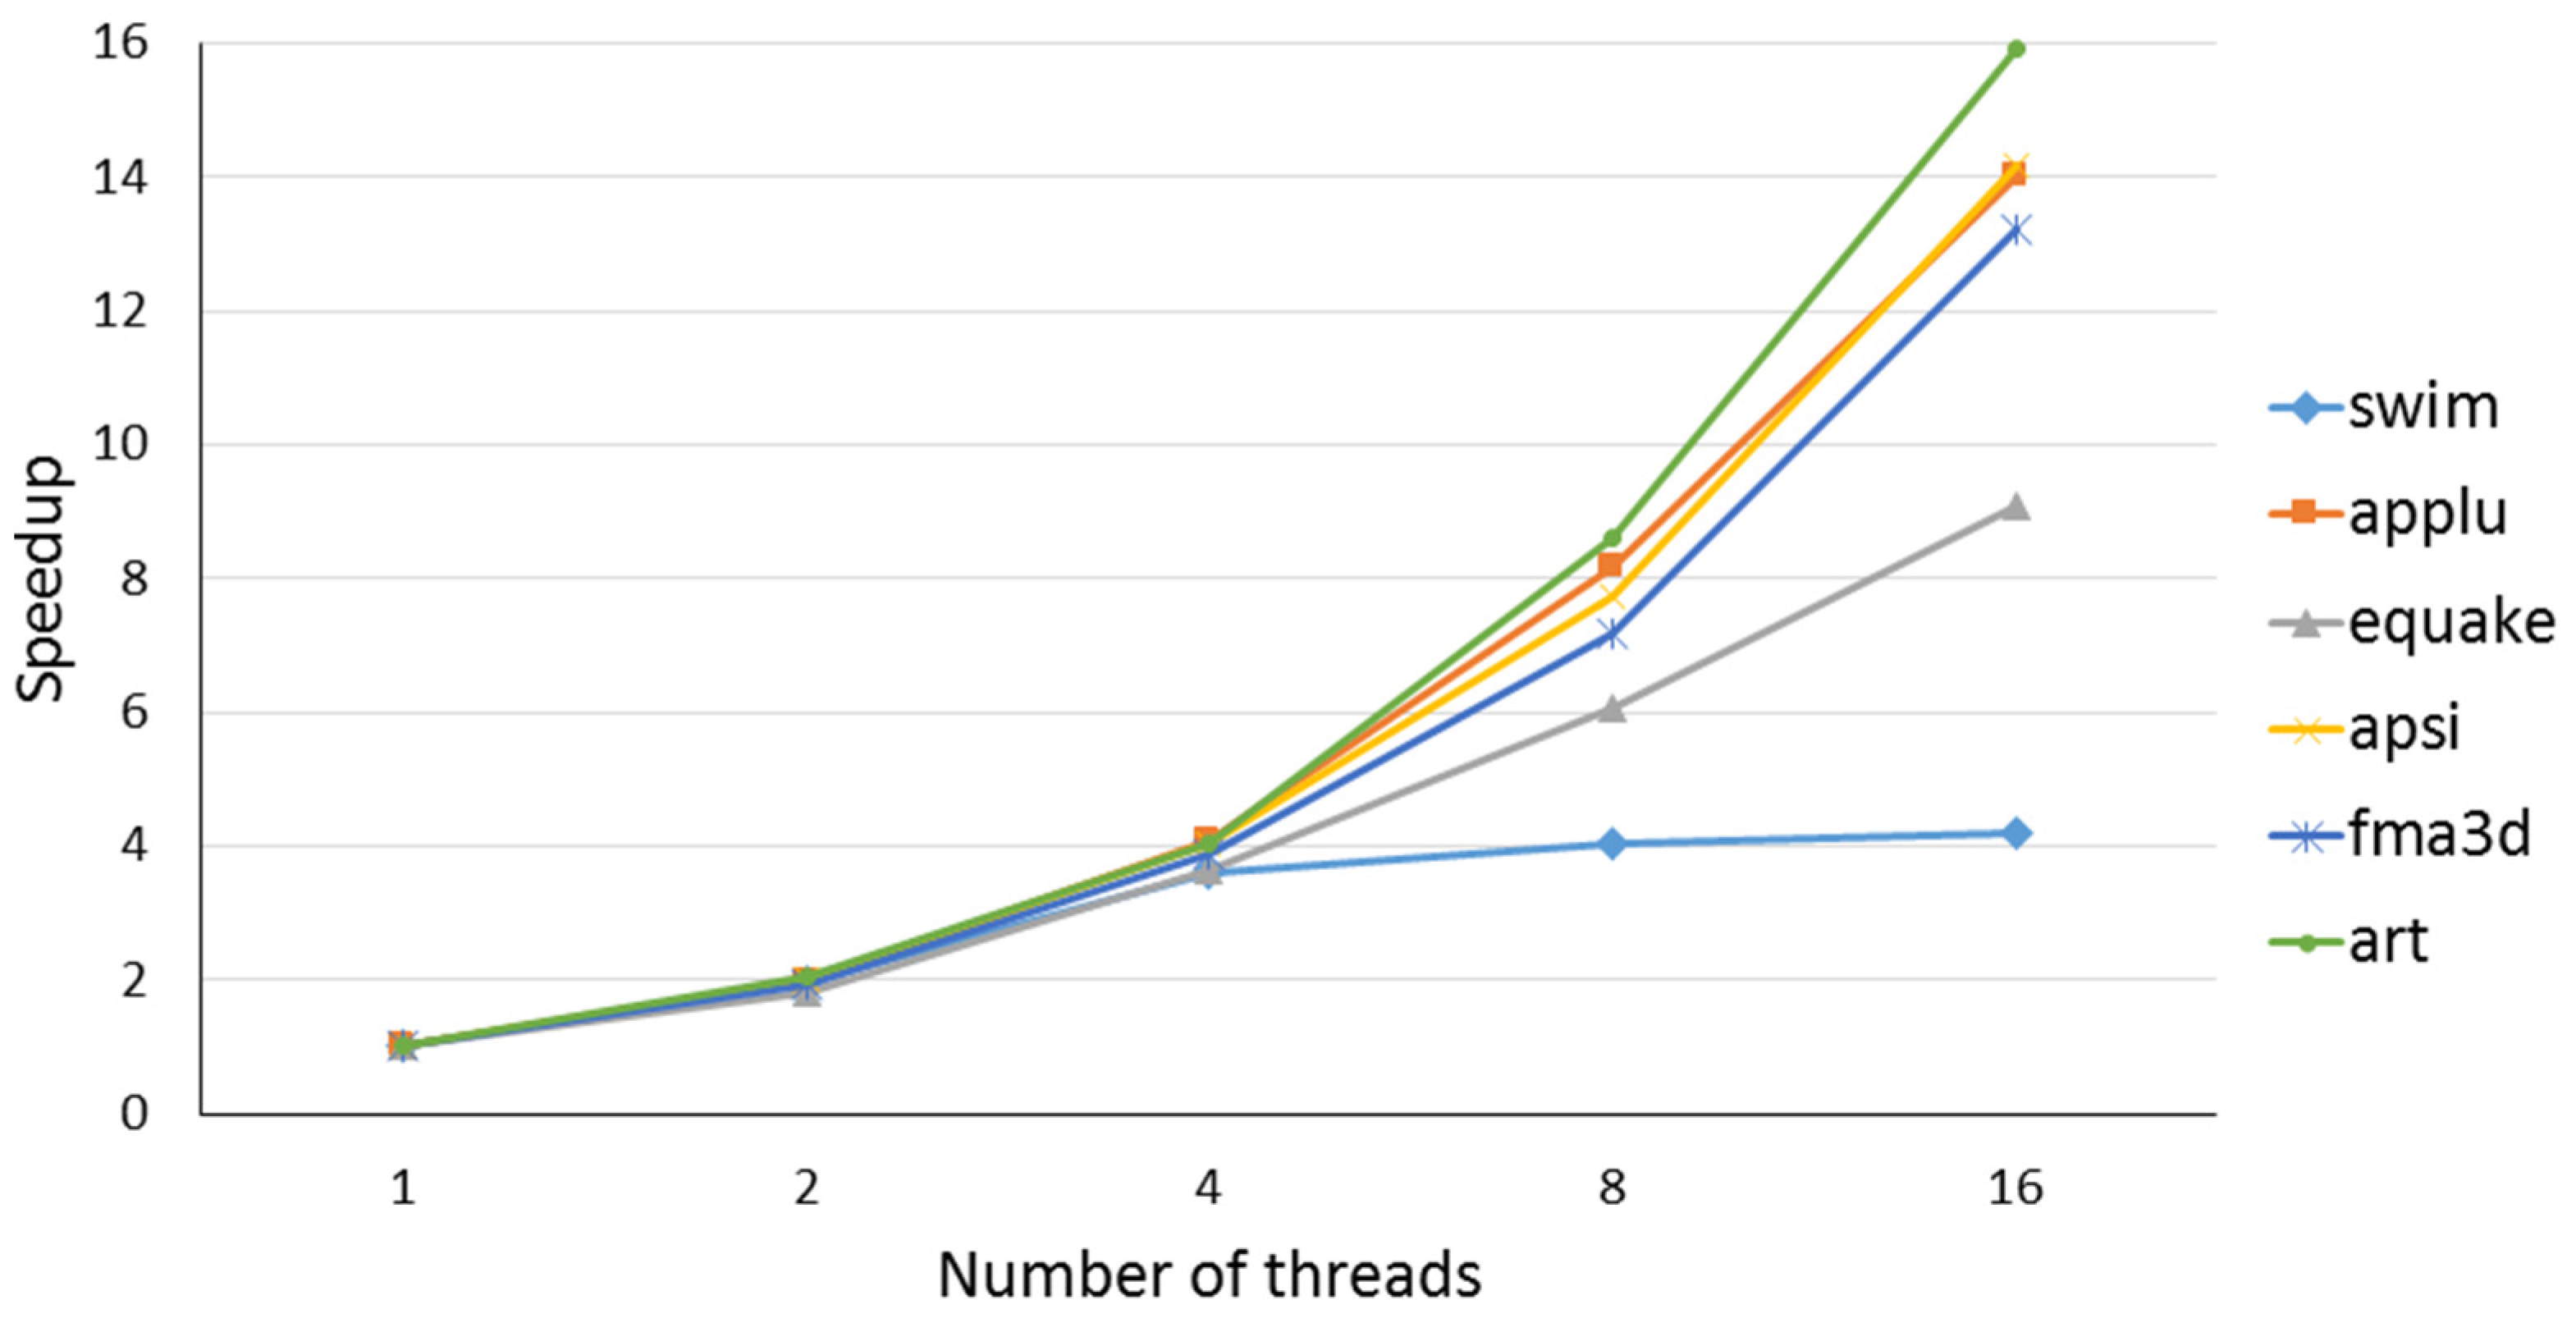
Speedups of the SPEC OMP2001 benchmarks using a medium reference dataset are depicted in Figure 7. It shows only those benchmarks that successfully ran with the 2 h job limit.
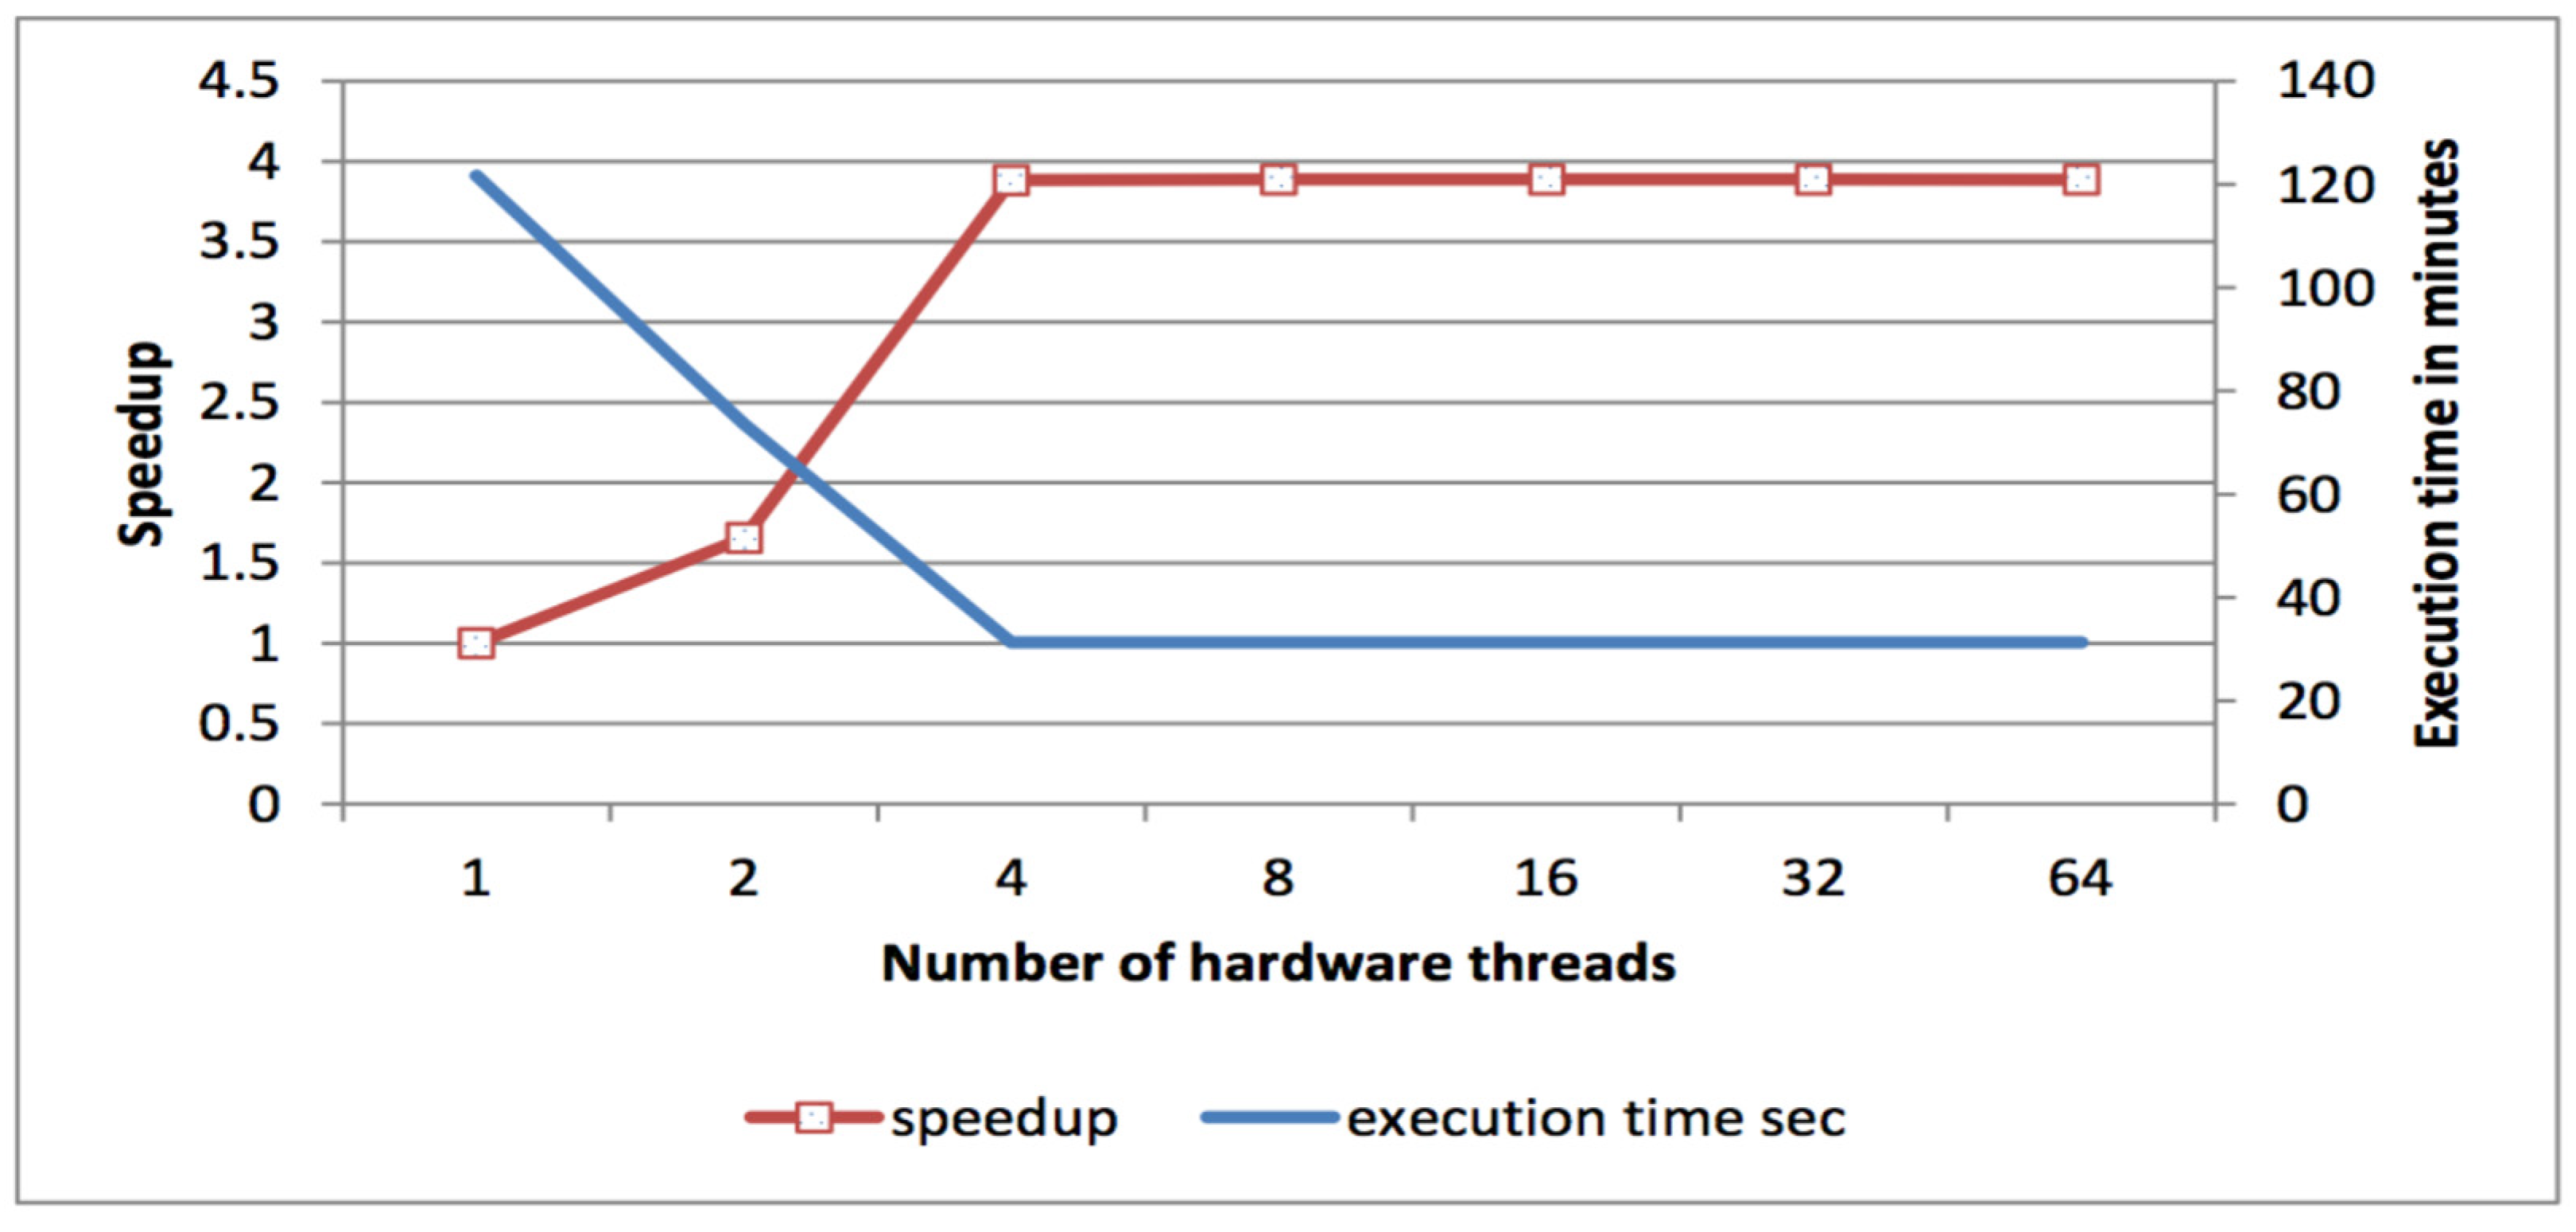
5.4. Case Study: 313.SWIM Scalability
SWIM shows superlinear speedup from 2 to 4 threads. However, earlier measurements showed that the SWIM benchmark does not scale after four threads. We designed a detailed experiment using profiling and the HPT performance toolkit to study the behavior of the SWIM program. Figure 8 plots execution time and speedup, while Table 5 shows the detailed hardware counters values for the SWIM benchmark. We found that changing the number of threads from 4 to 8 led to a significant increase in memory traffic to 17.4 bytes/cycle, which almost hits the memory bandwidth upper bound (i.e., 18 byte/cycle). Swim coding style tends to increase data reuse distance when using more than 4 threads.
5.5. Intel MIC Results
The Intel MIC architecture is equipped with numerous cores and fast vector units. Table 6 describes the specifications of the Intel Xeon Phi device and the host used in the experiment. To best utilize these powerful hardware characteristics, two demanding code optimizations are necessary: Vectorization and Parallelization. With vectorization, loops are accelerated using hardware vector units. To maximize instruction issue rate, at least two threads per core are needed; and multiple threads indicate a parallel program.
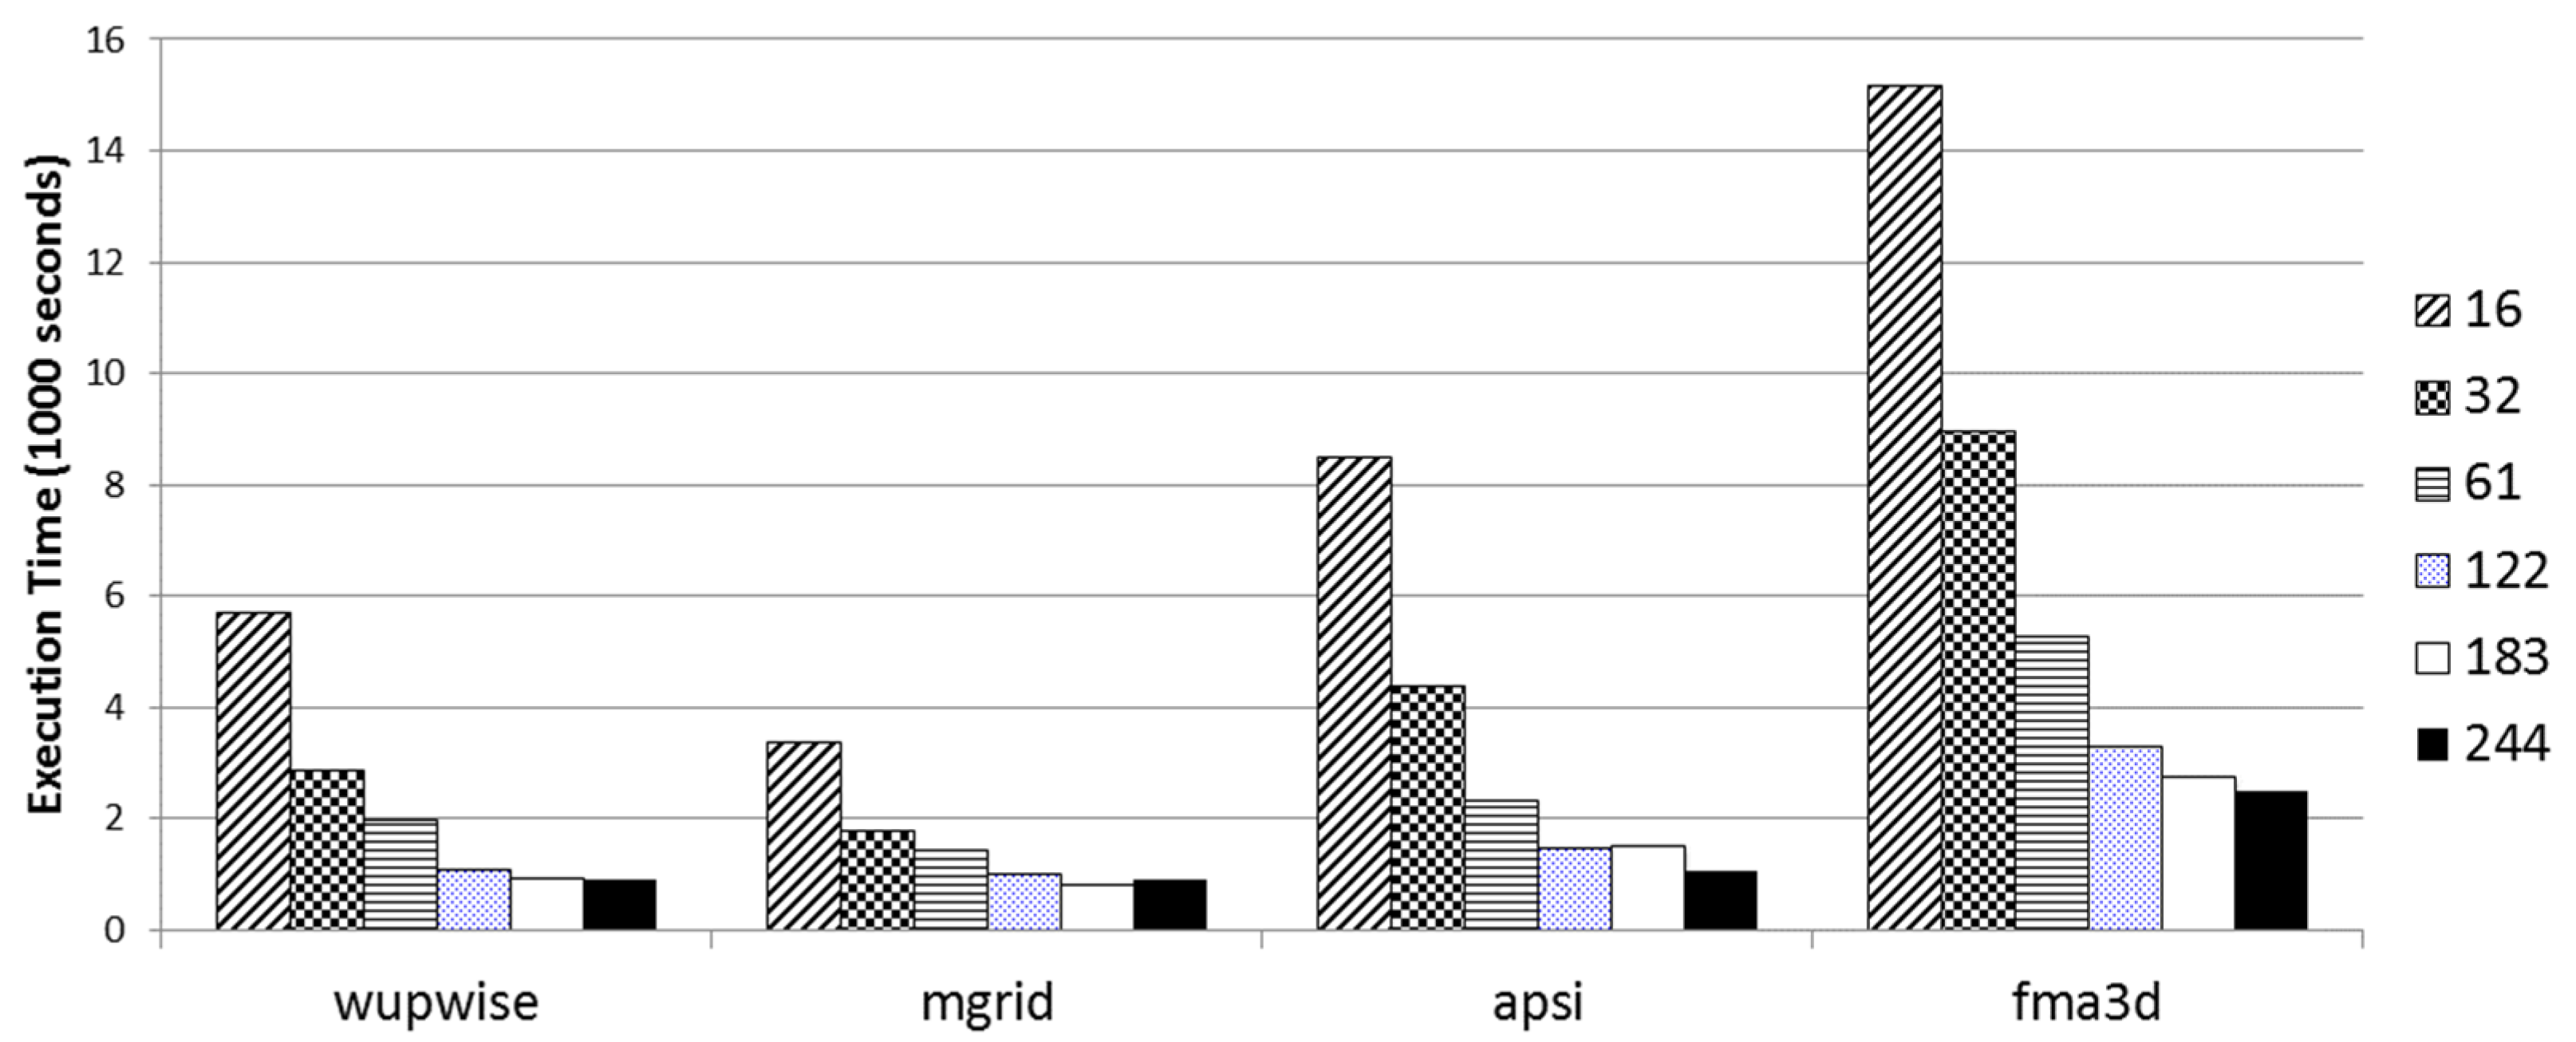
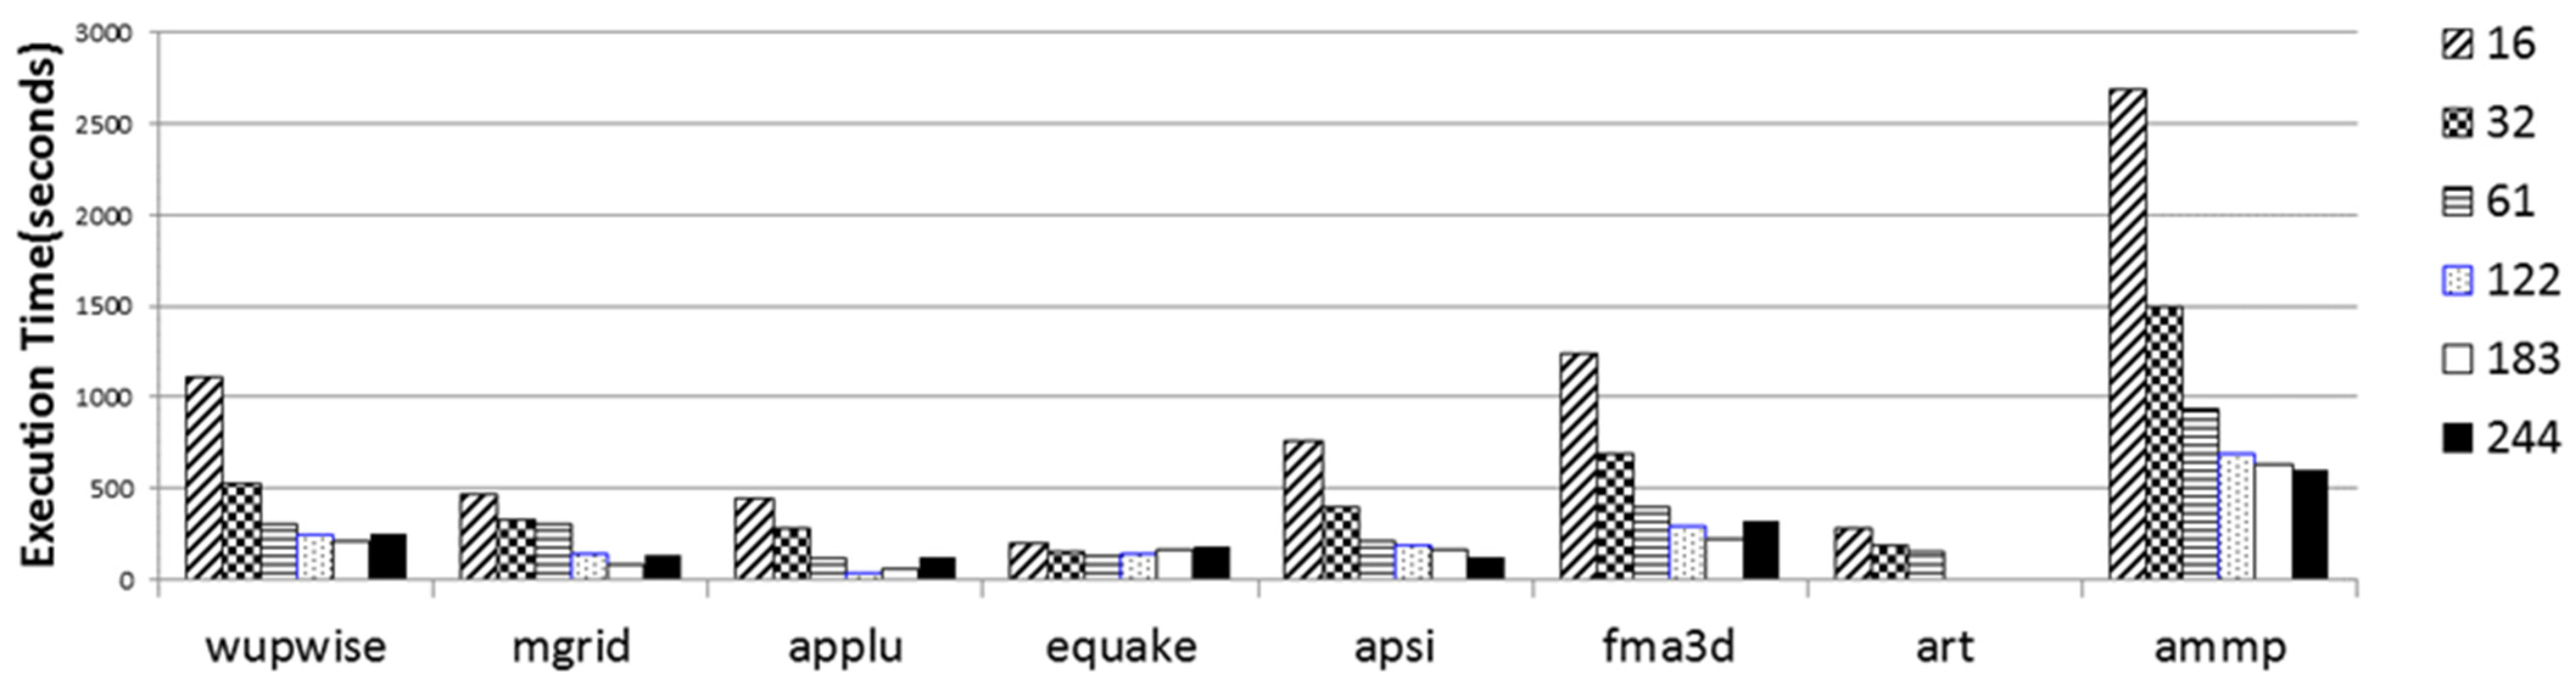
MIC supports two modes of execution: offload mode, where MIC serves as a coprocessor to the host; and Native mode, where MIC runs as an independent multicore machine. Intel ICC compiler provides offload, and mmic options to support these modes, respectively. Intel MIC architecture performance scalability is studied; SPEC OMP execution time is measured on Intel Xeon Phi, varying the number of launched threads using a large dataset. The results are shown in Figure 9.
Xeon Phi architecture includes a high bandwidth bi-directional ring, to interconnect all the cores and memory controllers. Performance bottlenecks can be caused by shared ring interconnect or coherency logic, when multiple threads are requesting data simultaneously (i.e., Speedup is limited by bandwidth to memory). To quantify the potential performance impact of different thread-to-core assignment modes, we use thread affinity to map threads to cores, and we run the SPEC OMP benchmarks.
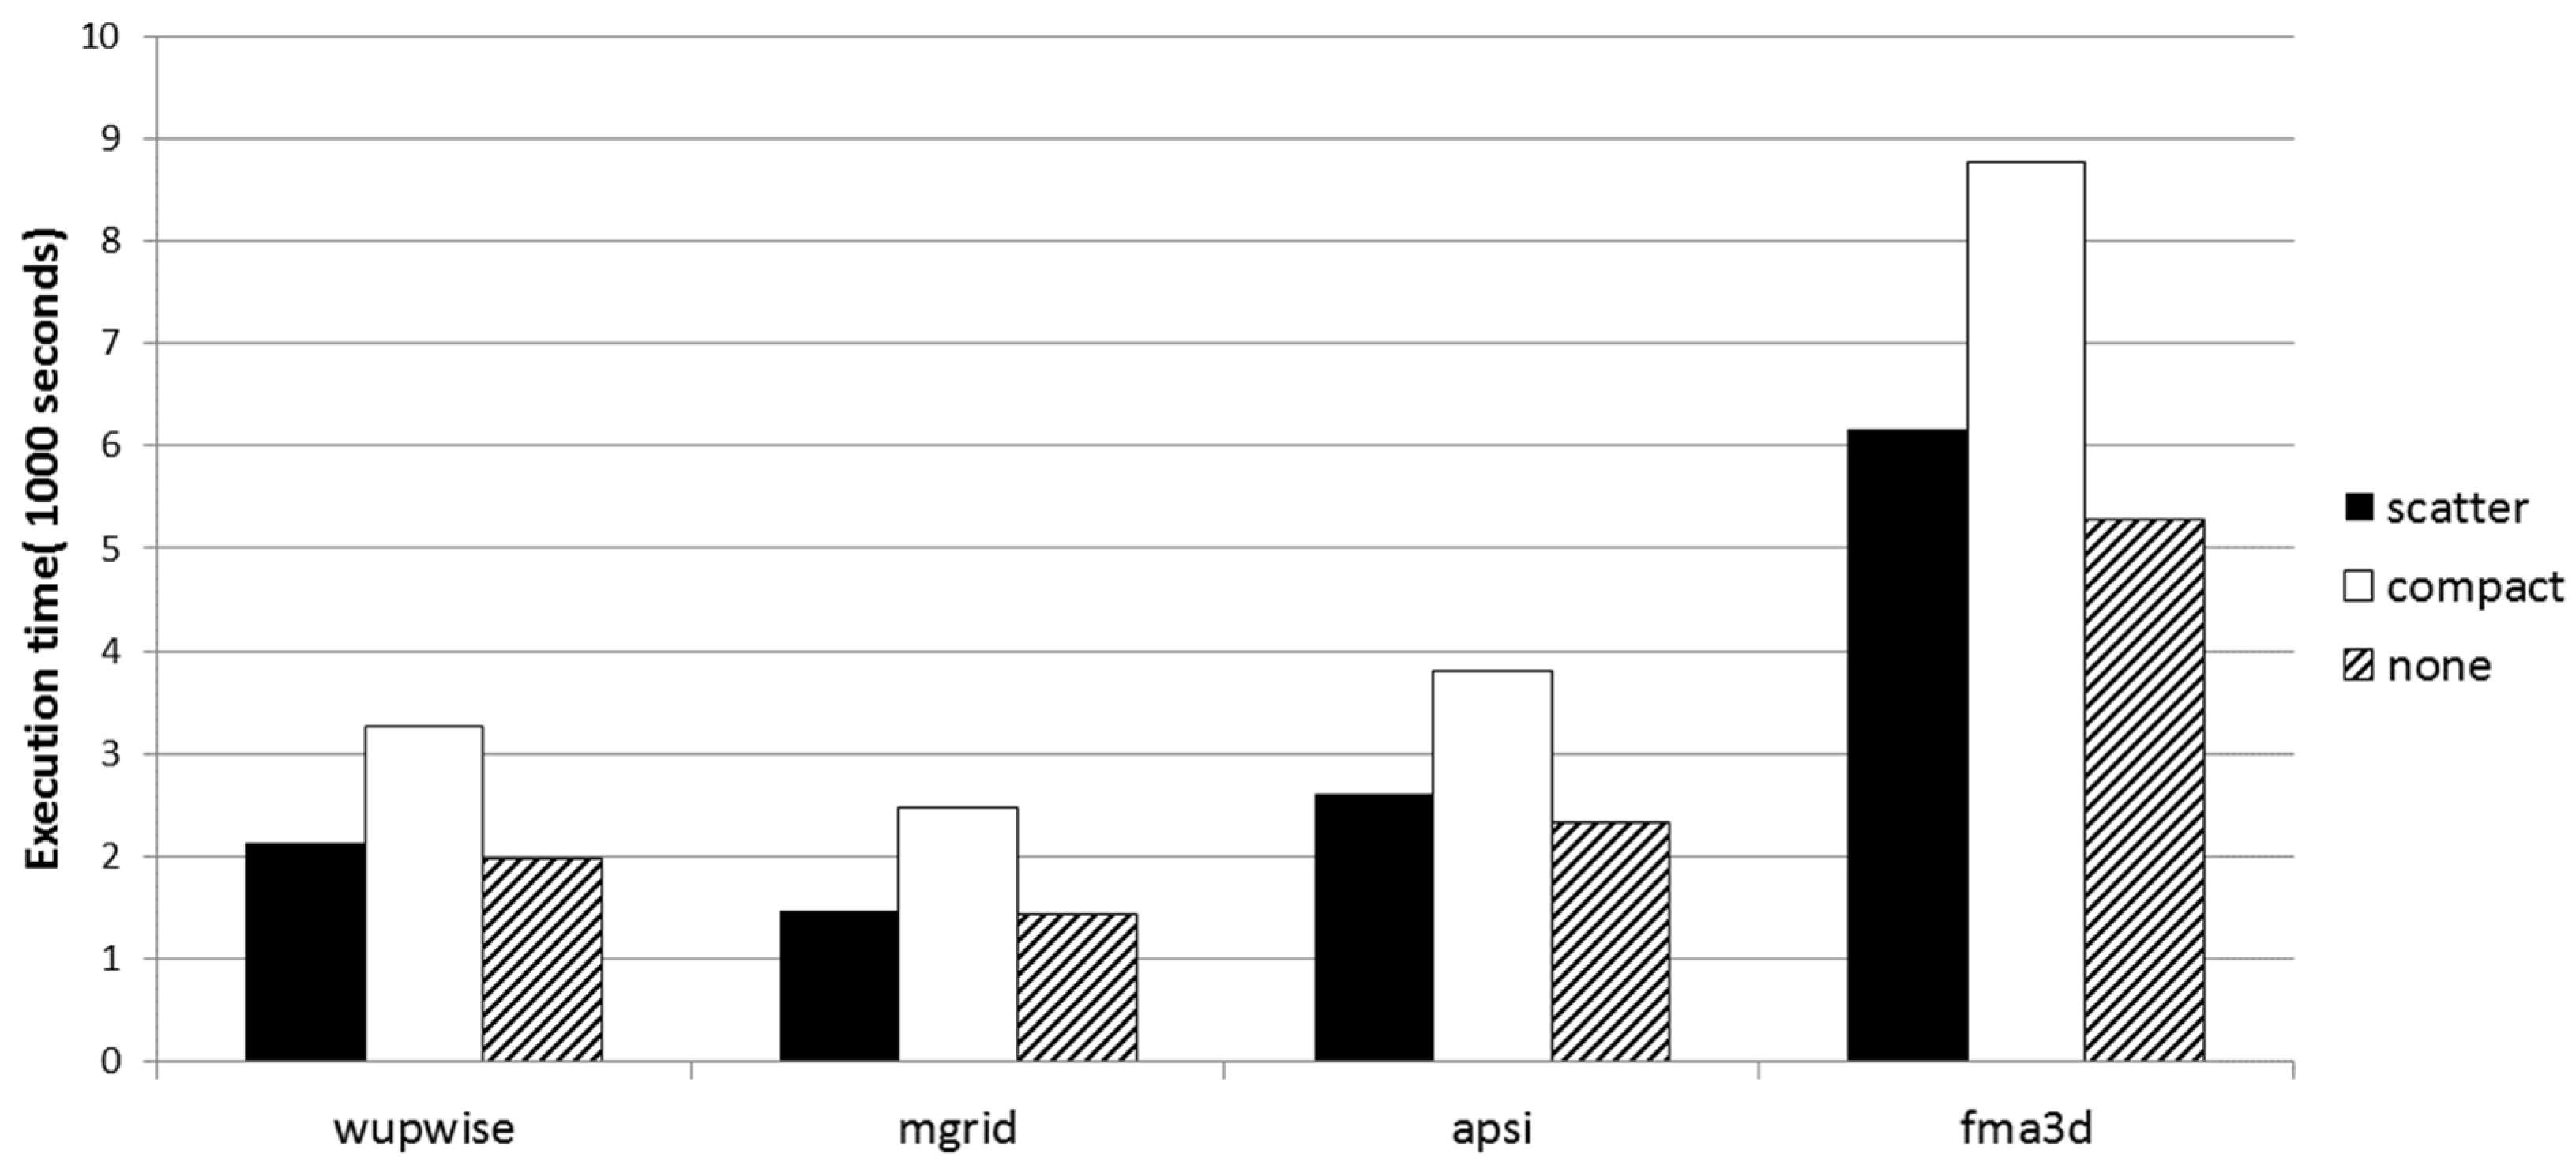
The Intel Xeon Phi software tools permit the user to configure predefined thread affinity, and to add a newly customized one as well. We measured the thread-to-core assignment effect on performance due to increased use of memory bandwidth. We studied three different predefined threads assignment modes in MIC (compact, balanced, scatter). Distributing Threads to cores can be either scattered, where threads are assigned as far as possible from each other to maintain even distribution around the ring, or compact, where threads are assigned to the closest cores. The default is none, where threads are dynamically assigned (i.e., the core IDs are randomly selected without repeating). We measured the execution times with 2, 4, 8, and 16 threads. The results are depicted in Figure 10 and Figure 11.
The effect of threads affinity on MIC performance is depicted in Figure 12. We used the SPEC OMP suite with a large dataset.
Export KMPAFFINITY = “verbose, granularity = fine, compact”
We used the stream benchmark to explore MIC memory design and performance. Table 7 shows the results for triad and add kernels in scatter native execution mode. We repeated the experiment in compact mode for four threads. Both rate and time scale very well with the number of active cores. Rates in scatter mode are four times the rates in compact mode when using 4 OpenMP threads. Furthermore, execution time in scatter mode is four times faster than execution time in compact mode when using four OpenMP threads.
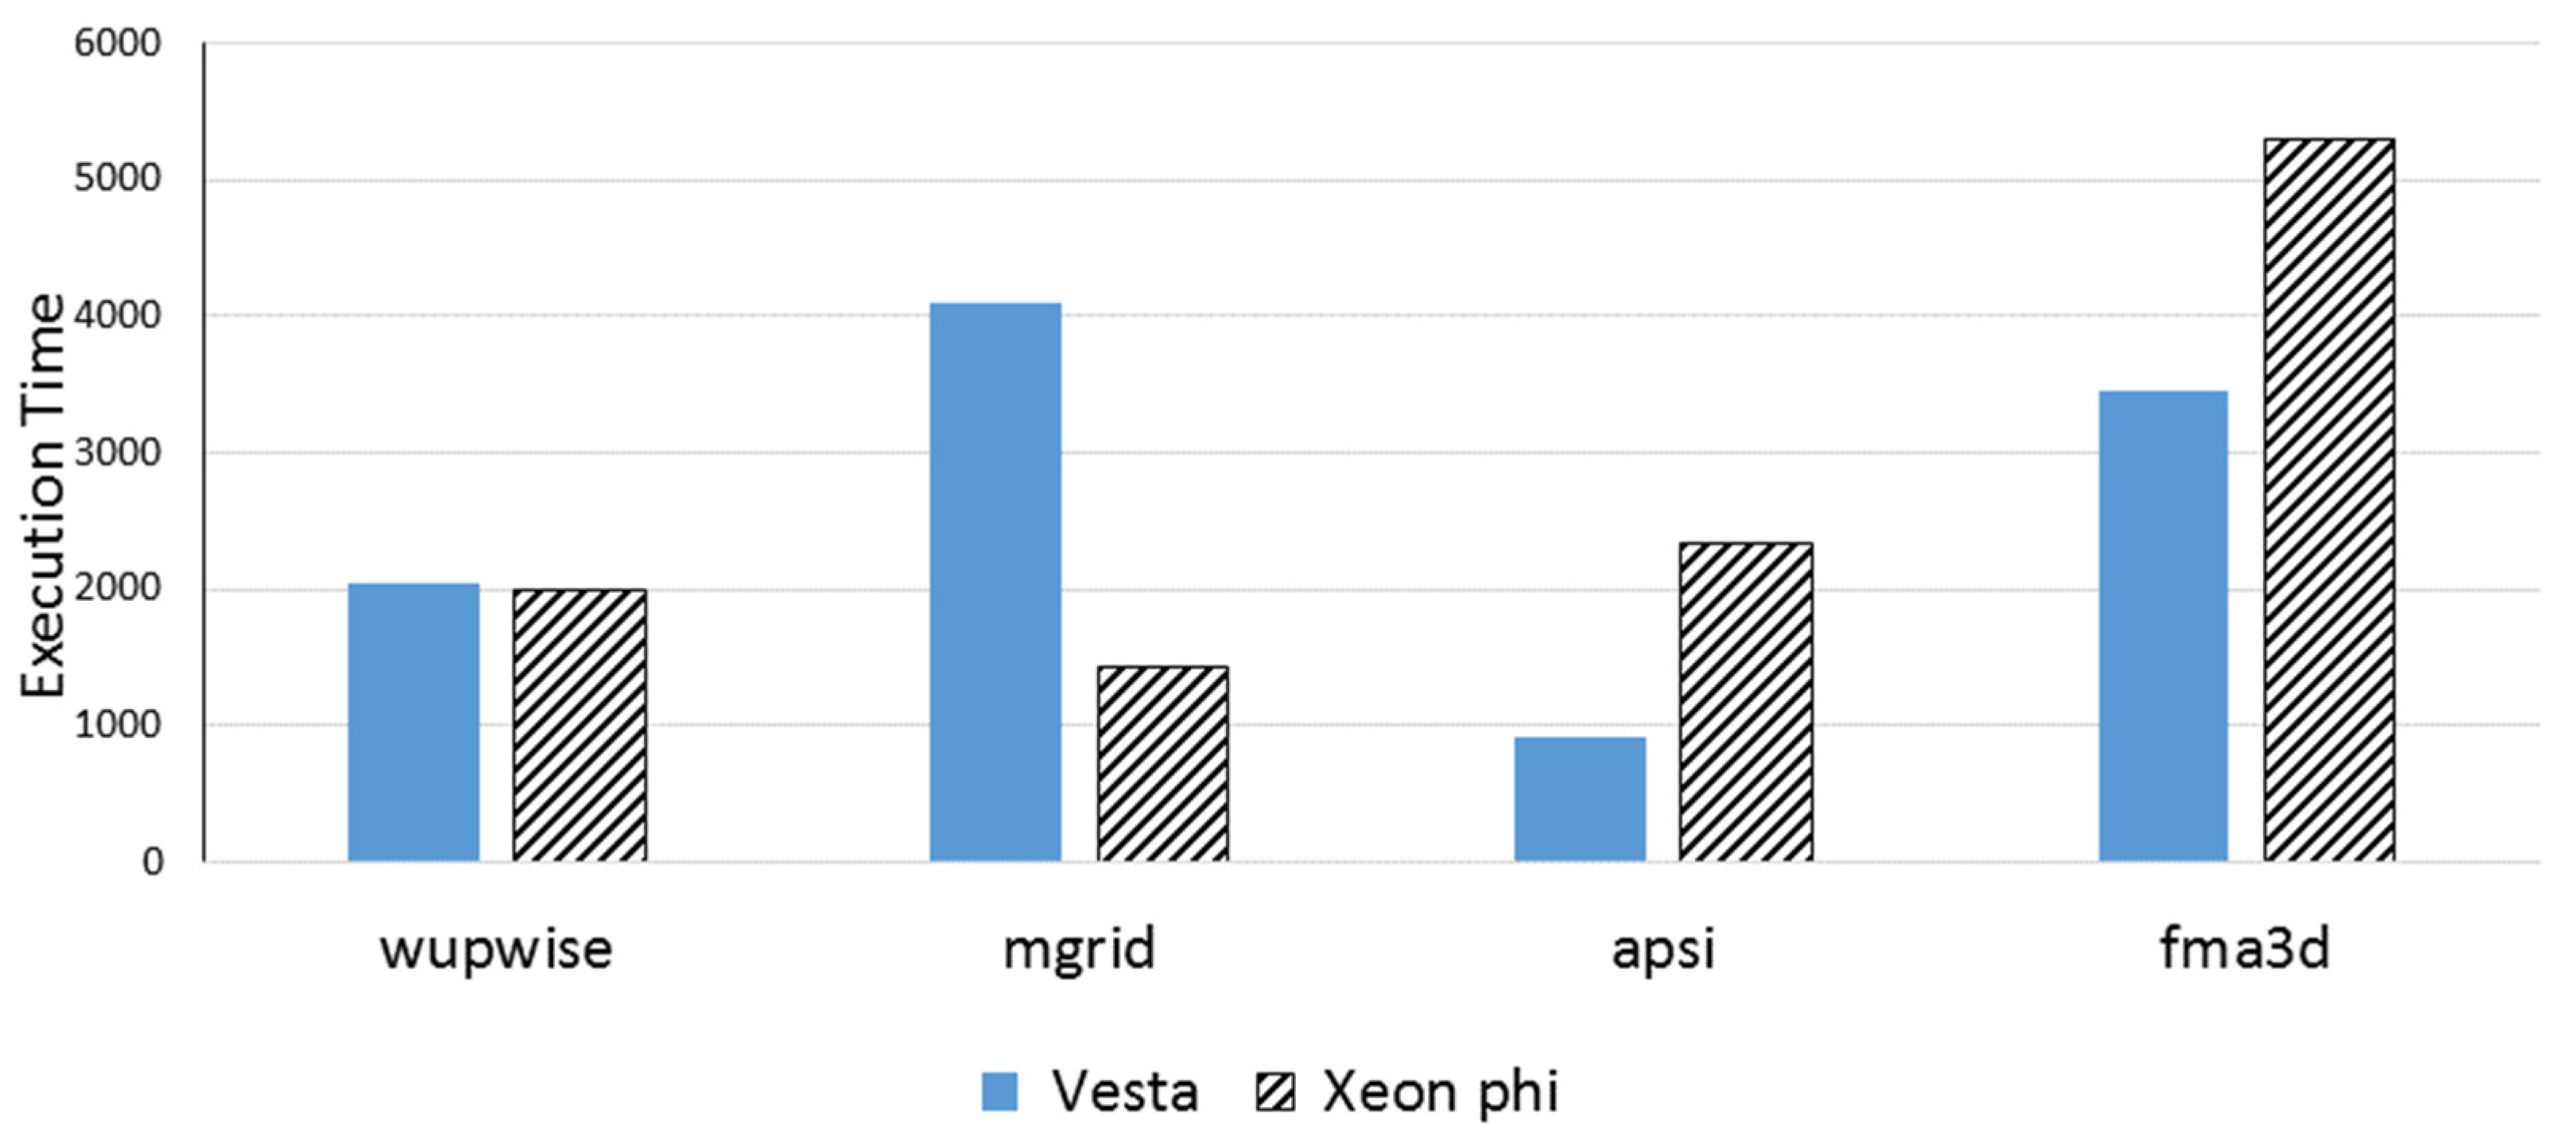
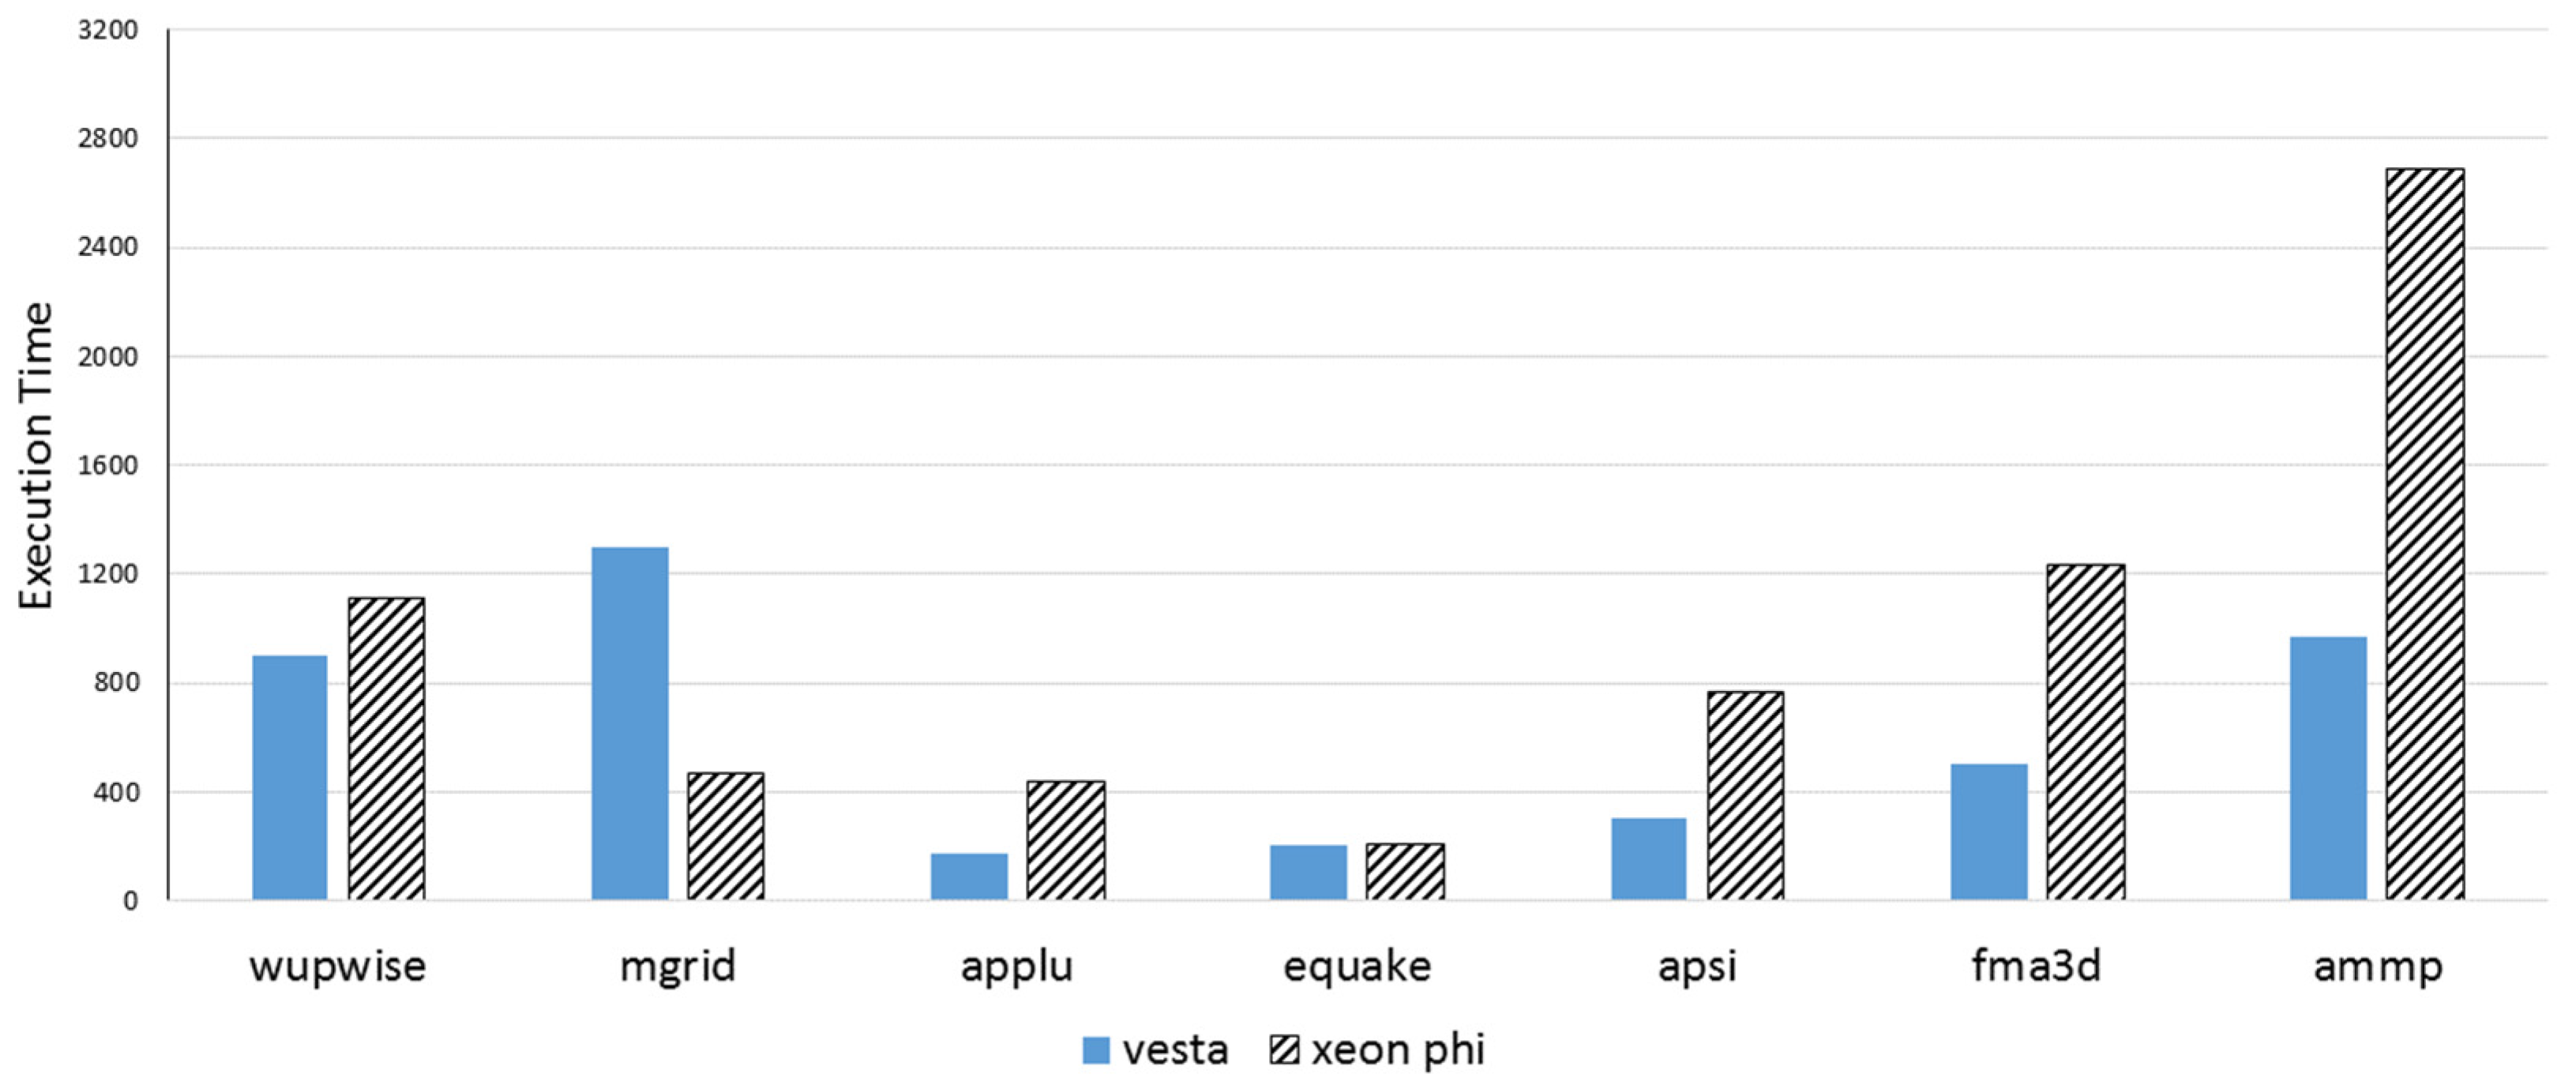
Figure 13 and Figure 14 compare Xeon Phi and Vest using large and medium benchmarks, respectively. We included only benchmarks that successfully finished execution on both architectures. Intel Xeon Phi, on many moderate cores, provides comparable performance to the Blue Gene system at a much-reduced price. One reason could be that the MIC clock frequency is barely higher than the Blue Gene frequency, but the key benefit is gained from the Xeon Phi’s ability to cope with multi-core as well as SIMD concurrency, maintaining low synchronization overhead.
6. Related Work
There are various existing studies on performance analysis of either Blue Gene or Xeon Phi parallel systems. However, few studies considered both platforms in their evaluations, and they concentrated on one specific application [26,27,28]. In our evaluation, we used a full suite of applications, with several datasets on both Xeon Phi and Blue Gene platforms. To the best of our knowledge, no previous study used the SPEC OpenMP suite in their evaluation of both platforms.
The performance of OpenMP on Xeon Phi was early evaluated by Cramer et al. [29]. They compared the standard OpenMP constructs overhead on Xeon Phi versus big SMP machines. The OpenMP runtime overhead on Blue Gene/Q was measured by Eichenberger and O’Brien [30]. Iwainsky et al. used empirical performance models to study the scalability of OpenMP constructs on several machines, including IBM Blue Gene/Q and Intel Xeon Phi [31]. In [32], the authors studied the performance and scalability of OpenMP programs on Xeon Phi in stand-alone mode, and they compared it with a two-socket Xeon-based system.
Several studies concentrated on one specific application [33,34,35], while others focused on smaller compute kernels as well as NAS parallel benchmarks [32,36,37]. recent performance studies of HPC architectures, more specifically Blue Genes and Xeon Phi, concentrated on specific compute-intensive applications, such as drug discovery [26], lattice QCD [27], molecular dynamics [28], DNA sequence aligner [38], pseudospectral ultrasound simulations [39], and Alpha magnetic spectrometer [40].
Chimeh and Cockshott compared the performance of Intel Xeon Phi, GPUs, and IBM Blue Gene supercomputer based on their ability to accelerate digital logic simulation applications [37]. They have shown that Xeon Phi, with considerably lower cost, gives similar logic-simulation performance to the IBM Blue Gene system, and is comparable with GPUs performance, with the advantage of processing considerably greater logic circuits.
In [35], the authors used a parallel semi-global matching algorithm to compare the performance of several platforms (Xeon Phi, general-purpose processor, Freescale P4080, Tensilica). Wylie et al. used the Scalasca toolset to conduct a performance analysis of a Blue Gene/P system with thousands of cores [41]. The MPI performance analysis tools’ overheads, as well as the scalability efficiency on Blue Gene/L, were discussed by Chung et al. [42].
Due to the traditional programming model, porting scientific codes to Intel Xeon Phi coprocessors can be relatively easier than porting them to other accelerators [3]. However, several studies revealed that architecture-specific optimizations are necessary to reach reasonable performance, such as vectorization, SIMD intrinsic, hardware-supported gather, large TLB tables software prefetching, or memory alignment and padding. For example, Park et al. [33] found that a radar computation program implementation without optimization can moderately perform better on Xeon Phi as compared to a Xeon processor. However, this compute-intensive application, with optimizations, can achieve 2x speedup. Williams et al. [34] achieved allied performance for iterative solvers that use multigrid procedures. They showed that the program implementation benefits from the Xeon Phi after specific optimizations. Without optimization, the performance of the code is degrading on the coprocessor in comparison to a dual-core Xeon processor.
Kang et. al. evaluated several scientific applications on the intel Xeon Phi arch [43]. Sparsh Mittal surveyed studies of the Phi architecture and use it as an accelerator for a broad range of applications [44]. None of these studies used the spec omp benchmark suite. Furthermore, none of these studies compared Xeon Phi with the Blue Gene. Mittal concluded that GPU provides higher performance than Phi which, in turn, provides higher performance than CPU.
7. Conclusions
We have studied the performance behavior of the SPEC OMP2001 suite, on Blue Gene/Q&L machines and Intel Xeon Phi coprocessor as representatives of modern non-trivial multicore and manycore architectures. We measured the scalability of both aforementioned architectures. We also measured Xeon Phi memory as well as thread affinity impact on performance. We evaluated the performance of memory using the spec omp suite. We found that Blue Gene/Q meets the scalability requirements of SPEC OMP up to 16 hardware threads in most benchmarks. The evaluation results discussed in this paper showed that the Xeon Phi, at a significantly lower price, provides similar performance to the Blue Gene system. We implemented an automatic evaluation tool that can be used as a harness to test supercomputers and manycore systems.
Funding
This research received no external funding.
Institutional Review Board Statement
Not applicable.
Informed Consent Statement
Not applicable.
Data Availability Statement
Data has been presented in the main text.
Acknowledgments
We would like to thank Argonne National Lab for allowing us to use their machines.
Conflicts of Interest
The author declares no conflict of interest.
References
- Lee, V.W.; Kim, C.; Chhugani, J.; Deisher, M.; Kim, D.; Nguyen, A.D.; Satish, N.; Smelyanskiy, M.; Chennupa, S.; Hammarlund, P.; et al. Debunking the 100X GPU vs. CPUMyth: An evaluation of throughput computing on CPU and GPU. ACM SIGARCH Comput. Archit. News 2010, 38, 451–460. [Google Scholar] [CrossRef]
- Wienke, S.; Plotnikov, D.; an Mey, D.; Bischof, C.; Hardjosuwito, A.; Gorgels, C.; Brecher, C. Simulation of bevel gear cutting with GPGPUs—Performance and productivity. Comput. Sci.-Res. Dev. 2011, 26, 165–174. [Google Scholar] [CrossRef]
- Schulz, K.W.; Ulerich, R.; Malaya, N.; Bauman, P.T.; Stogner, R.; Simmons, C. Early experiences porting scientific applications to the many integrated core (mic) platform. In Proceedings of the TACC-Intel Highly Parallel Computing Symposium, Austin, TX, USA, 10–11 April 2012. [Google Scholar]
- Intel. Intel Xeon Phi Coprocessor System Software Development Guide; Intel: Santa Clara, CA, USA, 2012. [Google Scholar]
- Chen, D.; Eisley, N.A.; Heidelberger, P.; Senger, R.M.; Sugawara, Y.; Kumar, S.; Salapura, V.; Satterfield, D.L.; Steinmacher-Burow, B.; Parker, J.J. The IBM Blue Gene/Q: Interconnection network and message unit. In Proceedings of the 2011 International Conference for High-Performance Computing, Networking, Storage and Analysis, SC ’11, Seatle, WA, USA, 12–18 November 2011; pp. 1–10. [Google Scholar]
- Gara, A.; Blumrich, M.A.; Chen, D.; Chiu, G.L.-T.; Coteus, P.; Giampapa, M.E.; Haring, R.A.; Heidelberger, P.; Hoenicke, D.; Kopcsay, G.V.; et al. Overview of the Blue Gene/L system architecture. IBM J. Res. Dev. 2005, 49, 195–212. [Google Scholar] [CrossRef] [Green Version]
- Almasi, G.; Chatterjee, S.; Gara, A.; Gunnels, J.; Gupta, M.; Henning, A.; Moreira, J.E.; Walkup, B. Unlocking the Performance of the BlueGene/L Supercomputer. In Proceedings of the 2004 ACM/IEEE Conference on Supercomputing, SC ’04, Pittsburgh, PA, USA, 6–12 November 2004; p. 57. [Google Scholar]
- IBM Journal of Research and Development Staff. Overview of the IBM Blue Gene/P project. IBM J. Res. Dev. 2008, 52, 199–220. [Google Scholar] [CrossRef] [Green Version]
- Meuer, J.D.H.; Strohmaier, E.; Simon, H. Top 500 Supercomputers List Sites. Available online: https://www.top500.org/ (accessed on 1 April 2022).
- The Green 500 List. Available online: www.green500.org (accessed on 19 July 2012).
- The Graph 500 List. Available online: www.graph500.org (accessed on 19 July 2012).
- Almasi, G.; Almasi, G.S.; Beece, D.; Bellofatto, R.; Bhanot, G.; Bickford, R.; Blumrich, M.; Bright, A.A.; Brunheroto, J.; Cascaval, C.; et al. Cellular Supercomputing with System-on-a-Chip. In Proceedings of the IEEE International Solid-State Circuits Conference (ISSCC), San Francisco, CA, USA, 7 February 2002; pp. 152–153. [Google Scholar]
- Adiga, N.R.; Almasi, G.; Almasi, G.S.; Aridor, Y.; Barik, R.; Beece, D.; Bellofatto, R.; Bhanot, G.; Bickford, R.; Blumrich, M.; et al. An Overview of the Blue Gene/L Supercomputer. In Proceedings of the 2002 ACM/IEEE Conference on Supercomputing, Baltimore, MD, USA, 16–22 November 2002; pp. 1–22. [Google Scholar]
- Almasi, G.; Bhanot, G.; Gara, A.; Gupta, M.; Sexton, J.; Walkup, B.; Bulatov, V.V.; Cook, A.W.; de Supinski, B.R.; Glosli, J.N.; et al. Scaling physics and material science applications on a massively parallel Blue Gene/l system. In Proceedings of the ICS’05: Proceedings of the 19th Annual International Conference on Supercomputing, Cambridge, MA, USA, 20–22 June 2005; ACM Press: New York, NY, USA, 2005; pp. 246–252. [Google Scholar]
- Sosa, C.; Knudson, B. IBM System Blue Gene/P Solution: Blue Gene/Q System Administration; IBM Redbooks: New York, NY, USA, 2012. [Google Scholar]
- Sosa, C.; Knudson, B. IBM System Blue Gene/P Application Development; IBM Redbooks: New York, NY, USA, 2009. [Google Scholar]
- IBM Corporation. IBM XL C/C++ Programming Guide; IBM: Armonk, NY, USA, 2005. [Google Scholar]
- Desai, N.; Bradshaw, R. Cobalt Manual. 2006. Available online: https://ftp.mcs.anl.gov/pub/cobalt/archive/cobalt-0.95.2-manual.pdf (accessed on 5 February 2022).
- Butenhof, D. Programming with POSIX Threads; Addison-Wesley Professional: Boston, MA, USA, 1997. [Google Scholar]
- OpenMP Architecture Review Board. OpenMP Application Program Interface (Version 4.0); Techical Report; OpenMP: Beaverton, OR, USA, 2013. [Google Scholar]
- Blumofe, R.D.; Joerg, C.F.; Kuszmaul, B.C.; Leiserson, C.E.; Randall, K.H.; Zhou, Y. Cilk: An efficient multithreaded runtime system. In Proceedings of the PPoPP95: Principles & Practices of Parallel Programming, Santa Barbara, CA, USA, 19–21 July 1995; Volume 30, pp. 207–216. [Google Scholar]
- Stone, J.E.; Gohara, D.; Shi, G. OpenCL: A parallel programming standard for heterogeneous computing systems. Comput. Sci. Eng. 2010, 12, 66–72. [Google Scholar] [CrossRef] [PubMed] [Green Version]
- Chimeh, M.; Cockshott, P.; Oehler, S.B.; Tousimojarad, A.; Xu, T. Compiling Vector Pascal to the XeonPhi. Concurr. Comput. Pract. Exp. 2015, 27, 5060–5075. [Google Scholar] [CrossRef] [Green Version]
- Reinders, J. An Overview of Programming for Intel Xeon Processors and Intel Xeon Phi Coprocessors; Intel Corporation: Santa Clara, CA, USA, 2012. [Google Scholar]
- SPEC OMP Benchmark Suite. 2011R. Available online: www.spec.org/omp (accessed on 19 July 2012).
- Murugan, N.A.; Podobas, A.; Vitali, E.; Gadioli, D.; Palermo, G.; Markidis, S. A Review on Parallel Virtual Screening Softwares for High-Performance Computers. Pharmaceuticals 2022, 15, 63. [Google Scholar] [CrossRef] [PubMed]
- Akahoshi, Y.; Aoki, S.; Aoyama, T.; Kanamori, I.; Kanaya, K.; Matsufuru, H.; Namekawa, Y.; Nemura, H.; Taniguchi, Y. General purpose lattice QCD code set Bridge++ 2.0 for high performance computing. J. Phys. Conf. Ser. 2022, 2207, 012053. [Google Scholar] [CrossRef]
- Aktulga, H.M.; Knight, C.; Coffman, P.; O’Hearn, K.A.; Shan, T.-R.; Jiang, W. Optimizing the performance of reactive molecular dynamics simulations for many-core architectures. Int. J. High Perform. Comput. Appl. 2019, 33, 304–321. [Google Scholar] [CrossRef]
- Cramer, T.; Schmidl, D.; Klemm, M.; an Mey, D. OpenMP programming on Intel Xeon Phi coprocessors: An early performance comparison. In Proceedings of the Many-Core Applications Research Community (MARC) Symposium, Aachen, Germany, 29–30 November 2012; pp. 38–44. [Google Scholar]
- Eichenberger, A.E.; O’Brien, K. Experimenting with low-overhead OpenMP runtime on IBM Blue Gene/Q. IBM J. Res. Dev. 2013, 57, 1–8. [Google Scholar] [CrossRef]
- Iwainsky, C.; Shudler, S.; Calotoiu, A.; Strube, A.; Knobloch, M.; Bischof, C.; Wolf, F. How many threads will be too many? On the scalability of OpenMP implementations. In Euro-Par 2015: Parallel Processing, Proceedings of the 21st International Conference on Parallel and Distributed Computing, Vienna, Austria, 24–28 August 2015; Springer: Berlin/Heidelberg, Germany, 2015; pp. 451–463. [Google Scholar]
- Schmidl, D.; Cramer, T.; Wienke, S.; Terboven, C.; Müller, M.S. Assessing the performance of openmp programs on the intel xeon phi. In European Conference on Parallel Processing; Springer: Berlin/Heidelberg, Germany, 2013; pp. 547–558. [Google Scholar]
- Park, J.; Tang, P.T.P.; Smelyanskiy, M.; Kim, D.; Benson, T. Efficient backprojection-based synthetic aperture radar computation with many-core processors. In Proceedings of the International Conference on High Performance Computing, Networking, Storage and Analysis, Salt Lake City, UT, USA, 10–16 November 2012; IEEE Computer Society Press: Los Alamitos, CA, USA, 2012; pp. 1–11. [Google Scholar]
- Williams, S.; Kalamkar, D.D.; Singh, A.; Deshpande, A.M.; Van Straalen, B.; Smelyanskiy, M.; Almgren, A.; Dubey, P.; Shalf, J.; Oliker, L. Optimization of geometric multigrid for emerging multi- and manycore processors. In Proceedings of the International Conference on High Performance Computing, Networking, Storage and Analysis, Salt Lake City, UT, USA, 10–16 November 2012. [Google Scholar]
- Arndt, O.J.; Becker, D.; Giesemann, F.; Payá-Vayá, G.; Bartels, C.; Blume, H. Performance evaluation of the Intel Xeon Phi manycore architecture using parallel video-based driver assistance algorithms. In Proceedings of the 2014 International Conference on Embedded Computer Systems: Architectures, Modeling, and Simulation (SAMOS XIV), Agios Konstantinos, Greece, 14–17 July 2014; pp. 125–132. [Google Scholar]
- Ramachandran, A.; Vienne, J.; Van Der Wijngaart, R.; Koesterke, L.; Sharapov, I. Performance evaluation of NAS parallel benchmarks on Intel Xeon Phi. In Proceedings of the 2013 42nd International Conference on Parallel Processing, Lyon, France, 1–4 October 2016; pp. 736–743. [Google Scholar]
- Chimeh, M.K.; Cockshott, P. Optimising simulation data structures for the Xeon Phi. In Proceedings of the 2016 International Conference on High Performance Computing & Simulation (HPCS), Innsbruck, Austria, 18–22 July 2016; pp. 364–371. [Google Scholar]
- Costa, E.B.; Silva, G.P.; Teixeira, M.G. DALIGNER Performance Evaluation on the Xeon Phi Architecture. In Proceedings of the 11th International Conference on Bioinformatics and Computational Biology, Honolulu, HI, USA, 18–20 March 2019; Volume 60, pp. 36–47. [Google Scholar]
- Vaverka, F.; Treeby, B.E.; Jaros, J. Performance Evaluation of Pseudospectral Ultrasound Simulations on a Cluster of Xeon Phi Accelerators. In High Performance Computing in Science and Engineering, Proceedings of the 4th International Conference, HPCSE 2019, Karolinka, Czech Republic, 20–23 May 2019; Springer: Cham, Switzerland, 2019; pp. 99–115. [Google Scholar]
- Choutko, V.; Egorov, A.; Eline, A.; Shan, B. Performance of the AMS Offline Software at National Energy Research Scientific Computing Centre and Argonne Leadership Computing Facility. EPJ Web Conf. 2019, 214, 03022. [Google Scholar] [CrossRef] [Green Version]
- Wylie, B.J.N.; Böhme, D.; Mohr, B.; Szebenyi, Z.; Wolf, F. Performance analysis of Sweep3D on Blue Gene/P with the Scalasca toolset. In Proceedings of the International Parallel & Distributed Processing Symposium, Workshop on Large-Scale Parallel Processing, IPDPS–LSPP, Atlanta, GA, USA, 19–23 April 2010. [Google Scholar]
- Chung, I.H.; Walkup, R.E.; Wen, H.F.; Yu, H. MPI performance analysis tools on Blue Gene/L. In Proceedings of the SC’06: Proceedings of the 2006 ACM/IEEE Conference on Supercomputing, Tampa, FL, USA, 11–17 November 2006; p. 16.
- Kang, J.H.; Kwon, O.K.; Ryu, H.; Jeong, J.; Lim, K. Performance evaluation of scientific applications on Intel Xeon Phi Knights Landing clusters. In Proceedings of the 2018 International Conference on High Performance Computing & Simulation (HPCS), Orleans, France, 16–20 July 2018; pp. 338–341. [Google Scholar]
- Mittal, S. A survey on evaluating and optimizing performance of Intel Xeon Phi. Concurr. Comput. Pract. Exp. 2020, 32, e5742. [Google Scholar] [CrossRef]
Figure 1.
Intel Xeon Phi Architecture.

Figure 2.
The Intel MIC Software Architecture.

Figure 3.
Performance evaluation workflow.

Figure 4.
SURVEYOR Execution time of a subset of SPEC OMP2001 suite, both Medium and Large, using Train dataset. Benchmarks that failed execution, as well as those with an insufficient workload, were excluded.
Figure 4.
SURVEYOR Execution time of a subset of SPEC OMP2001 suite, both Medium and Large, using Train dataset. Benchmarks that failed execution, as well as those with an insufficient workload, were excluded.

Figure 5.
SPEC OMP2001 large datasets’ execution time on VESTA Blue Gene Machine for 8, 16, 32, and 64 threads. Missing columns means the corresponding measurements are unavailable.
Figure 5.
SPEC OMP2001 large datasets’ execution time on VESTA Blue Gene Machine for 8, 16, 32, and 64 threads. Missing columns means the corresponding measurements are unavailable.

Figure 6.
SPEC OMP200 1 medium dataset results on VESTA Blue Gene machine.

Figure 7.
Speedup of SPEC OMP benchmarks relative to the number of threads using ref dataset on the Blue Gene/Q VESTA machine.
Figure 7.
Speedup of SPEC OMP benchmarks relative to the number of threads using ref dataset on the Blue Gene/Q VESTA machine.

Figure 8.
Scalability of Swim benchmark on VESTA Blue Gene; the effect OF a varying number of threads on execution time and speedup.
Figure 8.
Scalability of Swim benchmark on VESTA Blue Gene; the effect OF a varying number of threads on execution time and speedup.

Figure 9.
Performance scalability on threads. SPEC OMP execution time is measured on Xeon Phi varying the number of launched threads using a large dataset.
Figure 9.
Performance scalability on threads. SPEC OMP execution time is measured on Xeon Phi varying the number of launched threads using a large dataset.

Figure 10.
SPEC OMP results in MIC using a medium dataset.

Figure 11.
Effect of threads affinity on performance. SPEC OMP execution time is measured on Intel Xeon Phi with different modes (scatter\compact) using the medium dataset.
Figure 11.
Effect of threads affinity on performance. SPEC OMP execution time is measured on Intel Xeon Phi with different modes (scatter\compact) using the medium dataset.

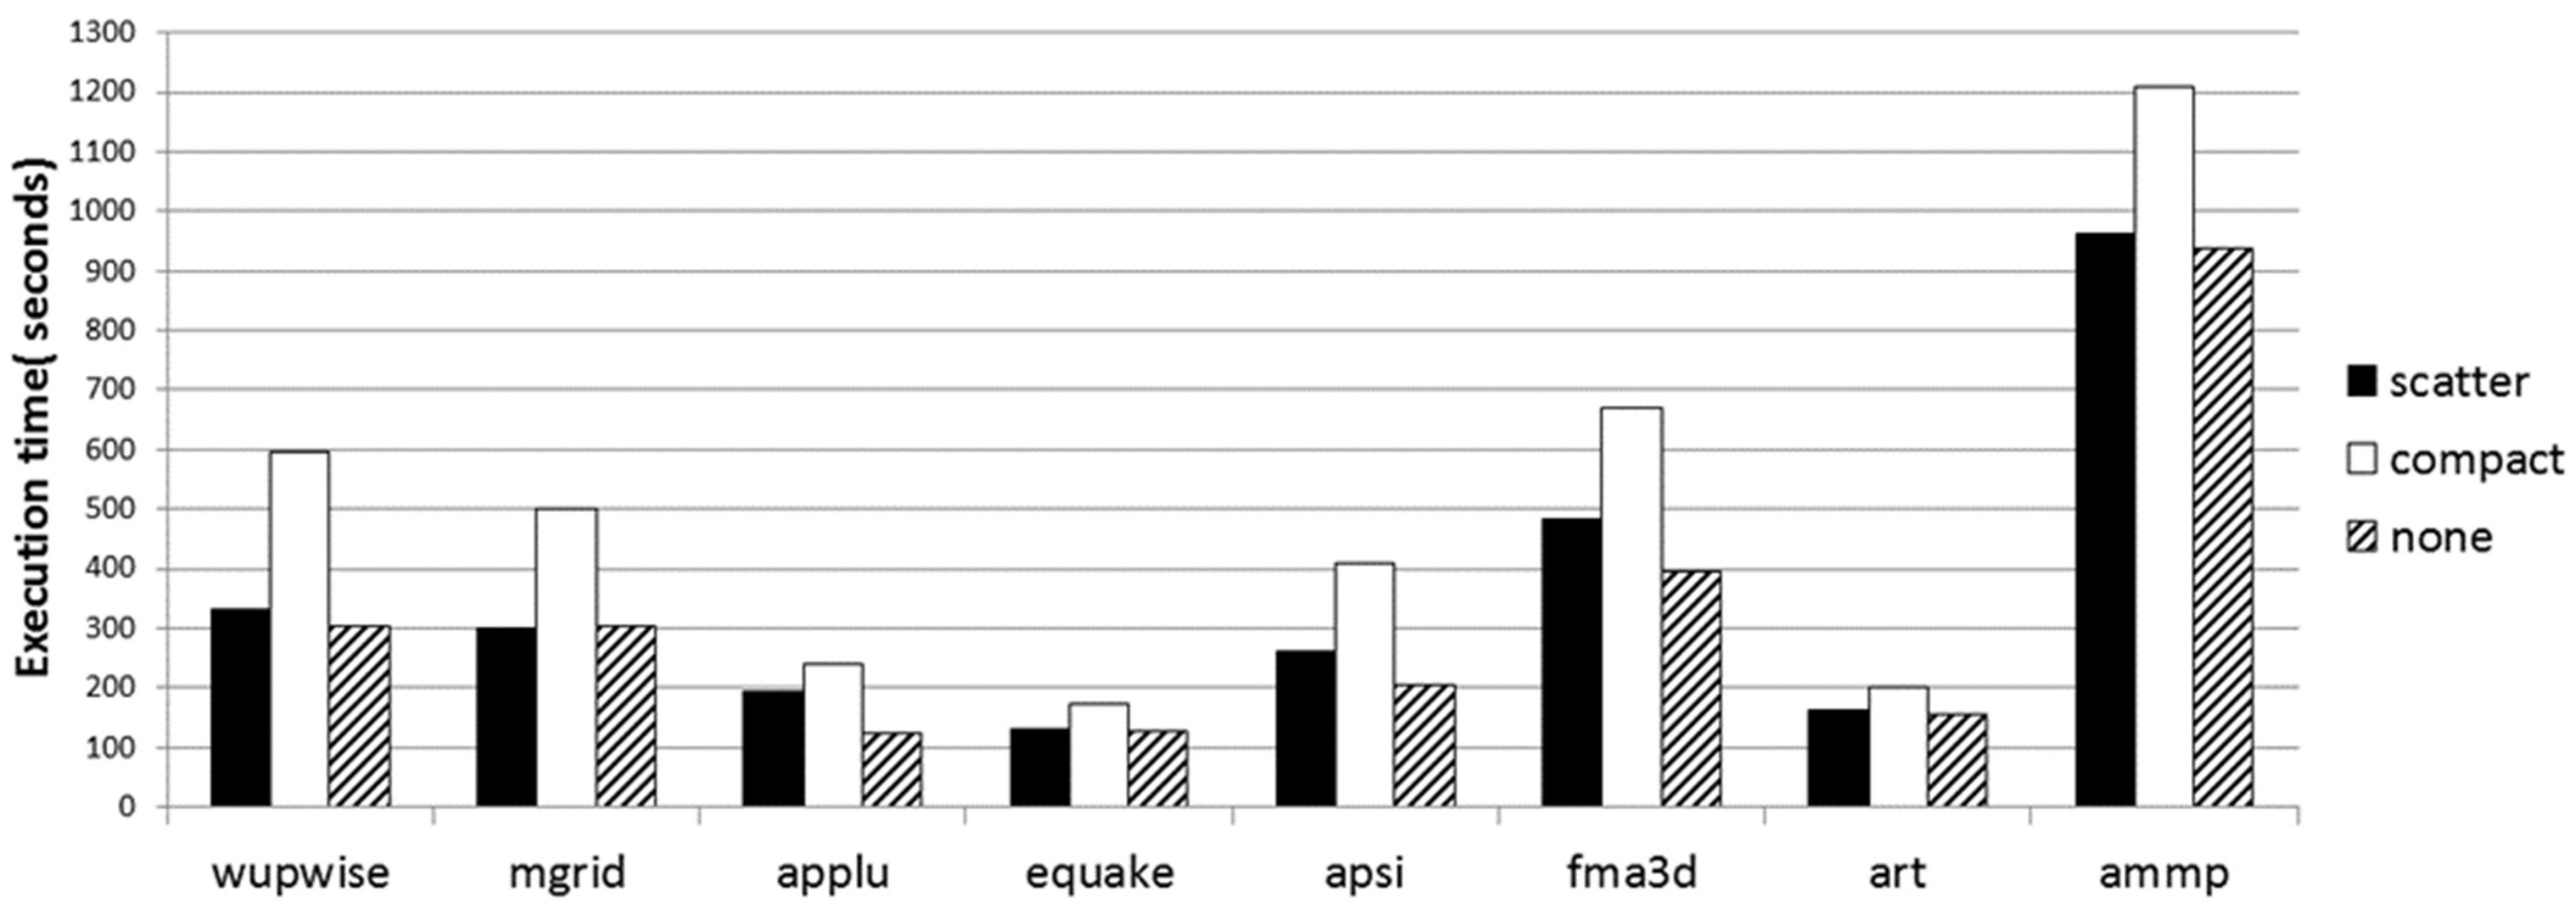
Figure 12.
Effect of threads affinity on performance. SPEC OMP execution time is measured on Intel Xeon Phi with different modes (scatter\compact) using a large dataset.
Figure 12.
Effect of threads affinity on performance. SPEC OMP execution time is measured on Intel Xeon Phi with different modes (scatter\compact) using a large dataset.

Figure 13.
Performance comparison of Xeon Phi and Vesta using large benchmarks and 64 cores.

Figure 14.
Performance of Xeon Phi and Vesta using medium benchmarks and 16 cores.


Table 1.
Summary of the SPEC OMP2001 Benchmarks suite.
| Benchmark | Applications | Language | Number of Lines |
|---|---|---|---|
| Ammp | Chemistry/biology | C | 13,500 |
| Applu | Fluid dynamics/physics | F | 4000 |
| Apsi | Air pollution | F | 7500 |
| Art | Image Recognition/neural networks | C | 1300 |
| Fma3d | Crash simulation | F | 60,000 |
| Gafort | Genetic algorithm | F | 1500 |
| Galgel | Fluid dynamics | F | 15,300 |
| Equake | Earthquake | C | 1500 |
| Mgrid | Multigrid solver | F | 500 |
| Swim | Shallow water modeling | F | 400 |
| Wupwise | Quantum chromodynamics | F | 2200 |
Table 2.
The Characteristics of IBM Blue Gene and INTEL Xeon Phi.
| Specification | Blue Gene\L | Xeon Phi |
|---|---|---|
| Number of Cores | 1024 | 61 |
| Number of HW threads/core | 4 | 4 |
| Vector width (Double Precision (64 bits) | 4 | 8 |
| Clock Speed | 700 Mhz/cr | 1.1 Ghz/core |
| Cost | $1 m–$1.5 m | $1500–$2700 |
| Theoretical peak Double Precision | 2.8 TFLOPS | 1.073 TERAFLOPS |
| GDDR/DRAM size | 2 GB/node | 8 GB |
| Size height × width | 2 m × 1 m | 24.61 cm × 11.12 cm × 3.86 cm |
Table 3.
SPEC OMP 2001 scalability factors for 8/16, 61/32, and 32/64 threads using a large dataset.
Table 3.
SPEC OMP 2001 scalability factors for 8/16, 61/32, and 32/64 threads using a large dataset.
| Benchmark | Scalability Factor | ||
|---|---|---|---|
| 8/16 | 16/32 | 32/64 | |
| Ammp | NA | NA | NA |
| Applu | 1.71 | 1.21 | 0.97 |
| Apsi | 1.87 | 1.42 | 1.02 |
| Art | 1.99 | 1.77 | 1.52 |
| Fma3d | NA | NA | 1.31 |
| Gafort | 1.96 | 1.66 | 1.21 |
| Galgel | NA | NA | NA |
| Equake | 1.84 | 1.56 | 0.96 |
| Mgrid | NA | 1.36 | 1.18 |
| Swim | 1 | 1 | 1 |
| Wupwise | NA | 1.7 | 135 |
Table 4.
A Comparison between several systems in terms of their SPEC OMP base score.
| Attribute | Blue Gene VESTA | AMD Supermicro | Sun Fire X4600 | HP Server PA8700 |
|---|---|---|---|---|
| SPEC Score | 114,502 | 82,487 | 106,552 | 77,787 |
| Frequency | 1.6 GHz | 2.92 GHz | 2.8 GHz | 876 MHz |
| # Cores | 16 | 16 | 8 | 32 |
| CacheL1(KB) | 32 | 32 | 64 | 768 |
| CacheL2 | NA | 8096 KB | 1024 KB | NA |
| RAM | 32 GB | 32 GB | 32 GB | 128 GB |
Table 5.
Swim detailed performance hardware counter-measurements on Vesta Blue Gene.
| Numofthreads | 4 | 8 | 16 | 32 | 64 |
|---|---|---|---|---|---|
| threads/core | 1 | 1 | 1 | 2 | 4 |
| Exe time (min) | 31.32 | 29.65 | 31.29 | 31.29 | 31.3 |
| PXU Primary Execution unit for Integer/Load/Store % | 57 | 57.2 | 57.2 | 57.2 | 57.2 |
| XU Auxiliary Execution unit for Floating-Point % | 42.7 | 42.7 | 42.7 | 42.7 | 42.7 |
| Issue rate inst/cyc/core | 0.151 | 0.151 | 0.151 | 0.151 | 0.151 |
| GFLOPS | 6.8 | 6.8 | 6.8 | 6.8 | 6.8 |
| DDRtraffic (B/cyc) | 17.2 | 17.2 | 17.2 | 17.2 | 17.2 |
| L1 cache hits % | 73.8 | 73.8 | 73.8 | 73.8 | 73.8 |
| L1 prefetch buffer % | 17.7 | 17.7 | 17.7 | 17.7 | 17.7 |
| L2 Cache% | 0.0 | 0.0 | 0.0 | 0.0 | 0.0 |
| Memory (MB) | 275.8 | 275.8 | 275.8 | 275.8 | 275.8 |
Table 6.
MIC host and device architecture specifications.
| Part Component | Specifications |
|---|---|
| Device | Two Knights Corner (KNC) B0 cards |
| OS | Linux |
| Host Physical Memory | 20,403 MB |
| Host CPU | Genuine Intel Family 6 Modell 44 |
| Host Frequency | 3192 Mhz |
| MIC No. of active cores | 61, 4 hardware threads each |
| MIC core Frequency | 1.2 GHz |
| MIC Memory (GDDR5) | 7936 MB, 5.5 GT/s, 5.5 GHz |
Table 7.
Stream results in MIC using scatter native mode.
| Threads | Triad | Add | ||
|---|---|---|---|---|
| Rate MB/s | Average Time (s) | Rate MB/s | Average Time (s) | |
| 2 | 783.9 | 2.07 | 770.00 | 2.1 |
| 4 | 1562.9 | 1.037 | 1555.00 | 1.04 |
| 8 | 3110.73 | 0.518 | 3099.00 | 0.52 |
| 16 | 6107.50 | 0.265 | 6092.00 | 0.267 |
| 32 | 11,984.44 | 0.1347 | 11,945.18 | 0.1351 |
| 61 | 21,513.43 | 0.0752 | 21,394.01 | 0.0754 |
| 122 | 21,431.68 | 0.0752 | 21,374.75 | 0.0755 |
| 183 | 22,684.95 | 0.0715 | 22,831.47 | 0.071 |
| 244 | 22,167.70 | 0.0731 | 21,948.91 | 0.0738 |
Publisher’s Note: MDPI stays neutral with regard to jurisdictional claims in published maps and institutional affiliations. |
© 2022 by the author. Licensee MDPI, Basel, Switzerland. This article is an open access article distributed under the terms and conditions of the Creative Commons Attribution (CC BY) license (https://creativecommons.org/licenses/by/4.0/).
Share and Cite
MDPI and ACS Style
Mustafa, D. Performance Evaluation of Massively Parallel Systems Using SPEC OMP Suite. Computers 2022, 11, 75. https://0-doi-org.brum.beds.ac.uk/10.3390/computers11050075
AMA Style
Mustafa D. Performance Evaluation of Massively Parallel Systems Using SPEC OMP Suite. Computers. 2022; 11(5):75. https://0-doi-org.brum.beds.ac.uk/10.3390/computers11050075
Chicago/Turabian StyleMustafa, Dheya. 2022. "Performance Evaluation of Massively Parallel Systems Using SPEC OMP Suite" Computers 11, no. 5: 75. https://0-doi-org.brum.beds.ac.uk/10.3390/computers11050075
Note that from the first issue of 2016, this journal uses article numbers instead of page numbers. See further details here.