Article

Automated Detection of Left Bundle Branch Block from ECG Signal Utilizing the Maximal Overlap Discrete Wavelet Transform with ANFIS

1
Department of Biomedical Engineering, Faculty of Engineering, The Hashemite University, P.O. Box 330127, Zarqa 13133, Jordan
2
Department of Electrical Engineering, Al-Ahliyya Amman University, Amman 19328, Jordan
3
Department of Medical Engineering, Al-Ahliyya Amman University, Amman 19328, Jordan
4
Department of Medical Engineering, Dr. Soliman Fakeeh Hospital, Jeddah 23323, Saudi Arabia
5
Department of Innovation Engineering, University of Salento, 73100 Lecce, Italy
*
Authors to whom correspondence should be addressed.
Submission received: 21 May 2022 / Revised: 5 June 2022 / Accepted: 8 June 2022 / Published: 10 June 2022
(This article belongs to the Special Issue Advances of Machine and Deep Learning in the Health Domain)

Abstract

:
Left bundle branch block (LBBB) is a common disorder in the heart’s electrical conduction system that leads to the ventricles’ uncoordinated contraction. The complete LBBB is usually associated with underlying heart failure and other cardiac diseases. Therefore, early automated detection is vital. This work aimed to detect the LBBB through the QRS electrocardiogram (ECG) complex segments taken from the MIT-BIH arrhythmia database. The used data contain 2655 LBBB (abnormal) and 1470 normal signals (i.e., 4125 total signals). The proposed method was employed in the following steps: (i) QRS segmentation and filtration, (ii) application of the Maximal Overlapped Discrete Wavelet Transform (MODWT) on the ECG R wave, (iii) selection of the detailed coefficients of the MODWT (D2, D3, D4), kurtosis, and skewness as extracted features to be fed into the Adaptive Neuro-Fuzzy Inference System (ANFIS) classifier. The obtained results proved that the proposed method performed well based on the achieved sensitivity, specificity, and classification accuracies of 99.81%, 100%, and 99.88%, respectively (F-Score is equal to 0.9990). Our results showed that the proposed method was robust and effective and could be used in real clinical situations.

1. Introduction

Left bundle branch block (LBBB) is a common cardiovascular disease (CVD) that leads to high mortality. The World Health Organization (WHO) have reported that 17.9 million lives are lost each year to CVD [1]. This was estimated to be 32% of all deaths worldwide, with more than 75% of these from low- and middle-income countries, while 85% of all CVD deaths are from heart attacks and strokes [1].
LBBB is linked with other cardiac conditions; therefore, its early and timely prediction are extremely important. The bundle branch nerve is the only pathway to distribute electrical impulses to the lower heart parts (left and right ventricles). It begins from the atrioventricular node and then goes down to produce left and right bundle branches that perform the main function of simultaneously activating (i.e., contracting) the left and right ventricles, respectively. The blockage of the left bundle branch delays the occurrence of the contraction in the left ventricle (LV); on the other hand, the right ventricle (RV) depolarizes before the LV. This delay may cause a small uncoordinated heart contraction and, consequently, less blood pumping efficiency.
LBBB is characterized by other conditions: coronary artery disease, high blood pressure, heart valve disease, an enlarged or weakened heart muscle (cardiomyopathy), heart infection (myocarditis), heart attack, congenital heart defects, and certain heart rhythm medicines.
Physicians rely on understanding the electrocardiogram (ECG) signal to diagnose LBBB, considering the following criteria:
(1)
A QRS duration greater than 120 milliseconds (complete LBBB) (the combination of the Q, R, and S waves represents the ventricular depolarization, i.e., the QRS complex). The form of the QRS is widened and downwardly deflected in lead V1. If the QRS duration is 100 to 119 ms, the presence of LBBB is known as incomplete. Right bundle branch block (RBBB) presents if the QRS is widened and upwardly deflected in lead V1.
(2)
The absence of the Q wave in leads I, V5, and V6.
(3)
A monomorphic R wave in I, V5, and V6.
(4)
ST and T wave displacement opposite to the major deflection of the QRS [2].
Researchers in the cardiology field (physicians and clinical engineers) studied the QRS complex regardless of the lead of recorded ECG (I–III, aVL, aVR, and V1–V6). The target was to detect the time duration or extract features from the QRS complex whether the LBBB was complete or incomplete. Lately, all developed algorithms have been conducted by machine learning classifiers. It can be seen from the reported works that the extracted features from the QRS complex are more reliable. In [3], fifteen heartbeat types from MIT-BIH arrhythmia [4] were pre-processed, and a set of morphological parameters were extracted after the Sym8-DWT (Discrete Wavelet Transform), used to decompose the ECG waveform. Then the KSMAX (KNN–SVM–MLP–AdaBoost–XGBoost) classifier was employed to ensure an accuracy equal to 98.6%. In another attempt in [5], 10 s of ECG segments from MIT-BIH arrhythmia were converted to an image of a time-frequency spectrogram using the short-time Fourier transform (STFT). The spectrograms were used as input to the two-dimensional convolutional neural networks (2D-CNN) classifier to achieve an average accuracy of 99%.
Borui Hou et al. [6] implemented a novel deep learning-based algorithm that integrates a long short-term memory (LSTM)-based auto-encoder (AE) network. The LSTM-AE is integrated with a support vector machine (SVM) for ECG MIT-BIH arrhythmias’ classification. The average accuracy was 99.45%. The in-depth features are extracted by a deep neural network (DNN) on multi-lead ECG signals [7]. This work proposed a novel method to extract deep features combined with several expert features to detect the LBBB and RBBB on multi-lead ECG signals (the accuracy was 98.76%).
Some reported studies focused on a combination of ECG morphological features such as parameters of QRS complex duration, slope, area, length of the curve, heart rate variability (HRV), amplitude, PP interval, PR interval, and P-wave duration [8,9,10,11,12,13,14,15]. However, morphological features almost depend on the time domain spectrum, where the average accuracy reported by Zhang et al. [10] did not exceed 86.66%. Other statistical features proposed by Sharma et al. [16], such as the mean, variance, standard deviation, skewness, and kurtosis, achieved an accuracy of 99.05%. These statistical features were extracted from the QRS complex downloaded from the standard MIT-BIH database. Even though morphological parameters have an advantage, they are common for physicians.
On the other hand, the wavelet domain spectrum was a valuable source of extracted features and served as a reliable denoising tool [17]. Thus, the QRS complex has been detected by various algorithms’ wavelet-based approaches combined with machine learning techniques. For example, the QRS detection algorithm and the wavelet neural network (Mexican hat wavelet function) were proposed by Özbay et al. [18]. In reference [19], the authors attempted to use a wavelet-based delineator to detect individual QRS waves (Q, R, S), QRS onsets and ends, and to identify the morphological QRS pattern on each standard lead, with an accuracy achieved of 79.5%. Next, the wavelet decomposition (Daubechies 4) was employed via the Pan–Tompkins algorithm. There were 25 extracted features from each beat, namely: the mean, variance, standard deviation, minimum and maximum detail coefficients, and approximation coefficients, to achieve an accuracy of 98.46% [20]. Another successful trial for QRS wave detection using Gaussian mixture and wavelet features was presented in [21]. Principal component analysis for feature set reduction was applied. The classification process utilizes two classifier techniques, the probabilistic neural network (PNN) algorithm and the Random Forest (RF) algorithm. In addition, a Multiresolution Discrete Wavelet Transform (MRDWT) and Multilayer Probabilistic Neural Network (MPNN) classifier were used for the detection of cardiac arrhythmia from ECG signals, where features were extracted from big data ECG of MIT-BIH to gain an accuracy equal to 99.01% [22]. The hidden Markov model (HMM) was used for cardiac arrhythmia (LBBB) detection. The main features are extracted from the ECG MIT-BIH, in which the proposed model has an overall accuracy of 99.7% [23].
The MIT-BIH database was first established in the 1980s as a standard material for evaluating arrhythmia detectors and providing scientific research in cardiac dynamics in long-term ECGs [4]. However, some drawbacks and limitations related to this database were reported by Moody et al. [4]. The limitations can be:
(i)
The flutter arrhythmic condition should be considered carefully during the variation in recording and playback speeds.
(ii)
Some morphologic parameters within frequency domain artefacts were present due to specific mechanical components of the recorder and playback unit.
(iii)
Another drawback appeared if two signals were recorded at slow tape speed on parallel tracks; minute differences between the orientations of the two-channel record and playback heads led to as great as 40 ms of fixed skew between signals. This problem is generic to analogue multi-track tape recorders and appears in the American Heart Association (AHA) and European databases [4]. The internal signal skew must be considered in algorithms intended to analyze such arrhythmic signals. However, some of these drawbacks were overcome and determined carefully after establishing PhysioNet in 1999.
Variations in the recorded signals, emphasizing the annotation performed on the recordings by physicians, reveal the spread of the electrical impulse in the case of LBBB that takes an irregular propagation through the LV and RV muscle. However, different electrodes recorded the LBBB segments in different locations, and some problems related to the artifacts and noises associated with data recording need to be addressed. According to the previously discussed issues that countered biosignal processing, two concerns should be pointed out in this research work:
(i)
How efficiently can the ECG signal be denoised, especially the part of the QRS complex responsible for LBBB occurrence?
(ii)
Which of the following criteria may be selected appropriately for the QRS complex to positively impact the arrhythmic disease diagnosis?
(iii)
Do the extracted features and the selected machine learning achieve the highest accuracy?
Ultimately, this work aimed to automate the detection of LBBB as an arrhythmic cardiac disease underlying many other cardiac failure conditions. After the signal pre-processing, the R wave was segmented from the ECG signals of the MIT-BIH database. The segmentation of the signal is based on the fact that LBBB can appear clearly if the duration of the QRS complex exceeds the 120 ms window. The signal is converted to the scale frequency wavelet domain, where the Maximal Overlap Discrete Wavelet Transform (MODWT) with different detail coefficients is employed on the segmented QRS complex interval. The detailed coefficients that were statistically significant (D2, D3, and D4) and kurtosis and skewness are fed into the Adaptive Neuro-Fuzzy Inference System (ANFIS) classifier to perform the highest classification to the best of our knowledge. This work has the following contributions: the width of the QRS complex duration is 180 ms, and MODWT is first employed on the LBBB detection with ANFIS application.
The workflow in this article is structured as follows: Section 1 is the Introduction, where the background of the LBBB, limitations, and the novelty of the proposed method are presented. Section 2 analyzes the scientific literature relating to the specific topic with a summary table showing the main parameters and specifications of the scientific contributions analyzed. All the ECG recordings, signal pre-processing and QRS segmentation, application of MODWT to select the extracted features, and ANFIS classifier description are discussed in Section 3, Materials and Methods. The result of signal processing, QRS decomposition by MODWT, feature extraction, and ANFIS training–testing scores are listed in Section 4. In Section 5, the interconnections between the theories, results, and the comparison study with other published works are carefully discussed. Finally, a conclusion on the approach’s benefits and novelty is given in Section 6.

2. Related Works

In the literature, many researchers consider LBBB an important arrhythmic cardiac disease linked to many other dynamic disorders of the LV and RV. The most published works were considered the standard set of the MIT-BIH database. Nevertheless, the theme of the reported works has affirmed a concentration on the segmentation techniques used for the QRS complex and the best selection for the extracted parameters. Moreover, the selected machine learning (ML) was essentially determined. For example, Engin et al. [24] presented their approach to ECG beat classification based on the Hamming window with 160 samples of length to extract three types of feature sets. Features were extracted using the autoregressive (AR) model coefficients, third-order cumulant, and the Discrete Wavelet Transform (DWT) variance. The classifier used the fuzzy-hybrid neural network (F-HNN) to achieve an accuracy of 93.5%. In reference [11], features were extracted utilizing the RR interval, Gaussian mixture modelling (GMM), and expectation maximization (EM) higher-order statistics (HOS), and were classified by a decision tree.
There are several algorithms that have been successfully tested on the LBBB signals. In detail, the researchers developed a genetic algorithm–neural network wrapper approach [25], an ECG R-peak detection algorithm with wavelet-based multi-resolution analysis (WMRA) enhancement [26], and a detection technique using a rank score algorithm [27]. Sharma et al. [16] demonstrated several statistical features of the QRS complex of LBBB combined with the K Nearest Neighbor (KNN) classifier.
Table 1 shows some reported studies investigating various heartbeat types [28,29]. It contains details about the classification method, feature extraction, database name, duration of the segmented signal, and accuracy. As seen in Table 1, all studied records of ECGs were taken from one source, the MIT-BIH or PhysioNet database (since 1999). This common factor makes the challenge of LBBB and other cardiac arrhythmias detection approaches for physicians’ observations of ventricular arrhythmia lead to more satisfying results. This outcome applies to the high sensitivity (True Positive) reported in References [11,16,24,25,29].
Although the MIT-BIH database was established in the 1980s, it has been noticed that most researchers started to pay attention to the features selection from 2016 to 2019. This outcome can be identified by the high accuracy achieved, between 98% and 99.7%, as reported in References. [11,16,25,27,28,29]. As mentioned before in this work, the best feature selection was the statistically-based selection. For example, in Reference [11], the RR interval, Gaussian mixture modelling (GMM), and expectation maximization (EM) higher-order statistics (HOS) represent the statistical feature selection belonging to the time–frequency domain.
The third outcome is the successful choice for features extracted that impact on the state of the art method for the used machine learning classifier. This outcome can be applied to Reference [11] as reported in Table 1. In the best statistically significant feature extraction, the greatest accuracy ranged from 99.05% to 99.7% [11,28,29], where overfitting phenomena were not reported.

3. Materials and Methods

A block diagram illustrating the proposed approach for LBBB detection is shown in Figure 1. The system includes signal pre-processing, R wave segmentation, signal enhancement by MODWT and feature extraction being performed. Then an ANFIS classifier was applied to distinguish the LBBB from the normal heartbeat.

3.1. Data Specifications

The ECG signals of the arrhythmic LBBB used in this research work were downloaded from the files of the MIT-BIH database [4]. It contains 48 two-channel recordings of approximately 30 min each at a 360 Hz sampling rate. All data were recorded from 47 patients and tested/examined at the BIH arrhythmia laboratory to be sorted into normal or pathological heartbeats between 1975 and 1979. The subjects included 25 men, aged from 32 to 89 years, and 22 women, ranging from 23 to 89 years, with approximately 60% of the subjects being inpatients. Although bandpass filters of 0.1–100 Hz were applied to the analogue signals from the playback unit, the recorders were battery-powered, and most of the 60 Hz noise in recordings was introduced in playback. This noise appears at the multiples of 30 Hz relative to real time in the recordings [4].

3.2. ECG Record Selection

In this study, we have used LBBB-ECG records (files) numbers 109, 111, and 207 from the dataset (Physio Bank: https://archive.physionet.org/physiobank/database/, accessed on 1 September 2021), while file number 121 was used for the normal ECGs. Each half-hour recording was divided into 30 records of one-minute duration. One thousand four hundred seventy (1470) normal beats were selected. The first and last beats of each minute recorded were excluded due to an error in identifying the R wave peaks during the QRS complex extraction process. On the other hand, forty minutes of LBBB beat recordings were selected with 2655 beats. The first and last beats of each minute recorded were excluded due to the same reason. The lead V1 was adopted in this method because the S wave in the LBBB beats is much deeper than the normal beats.

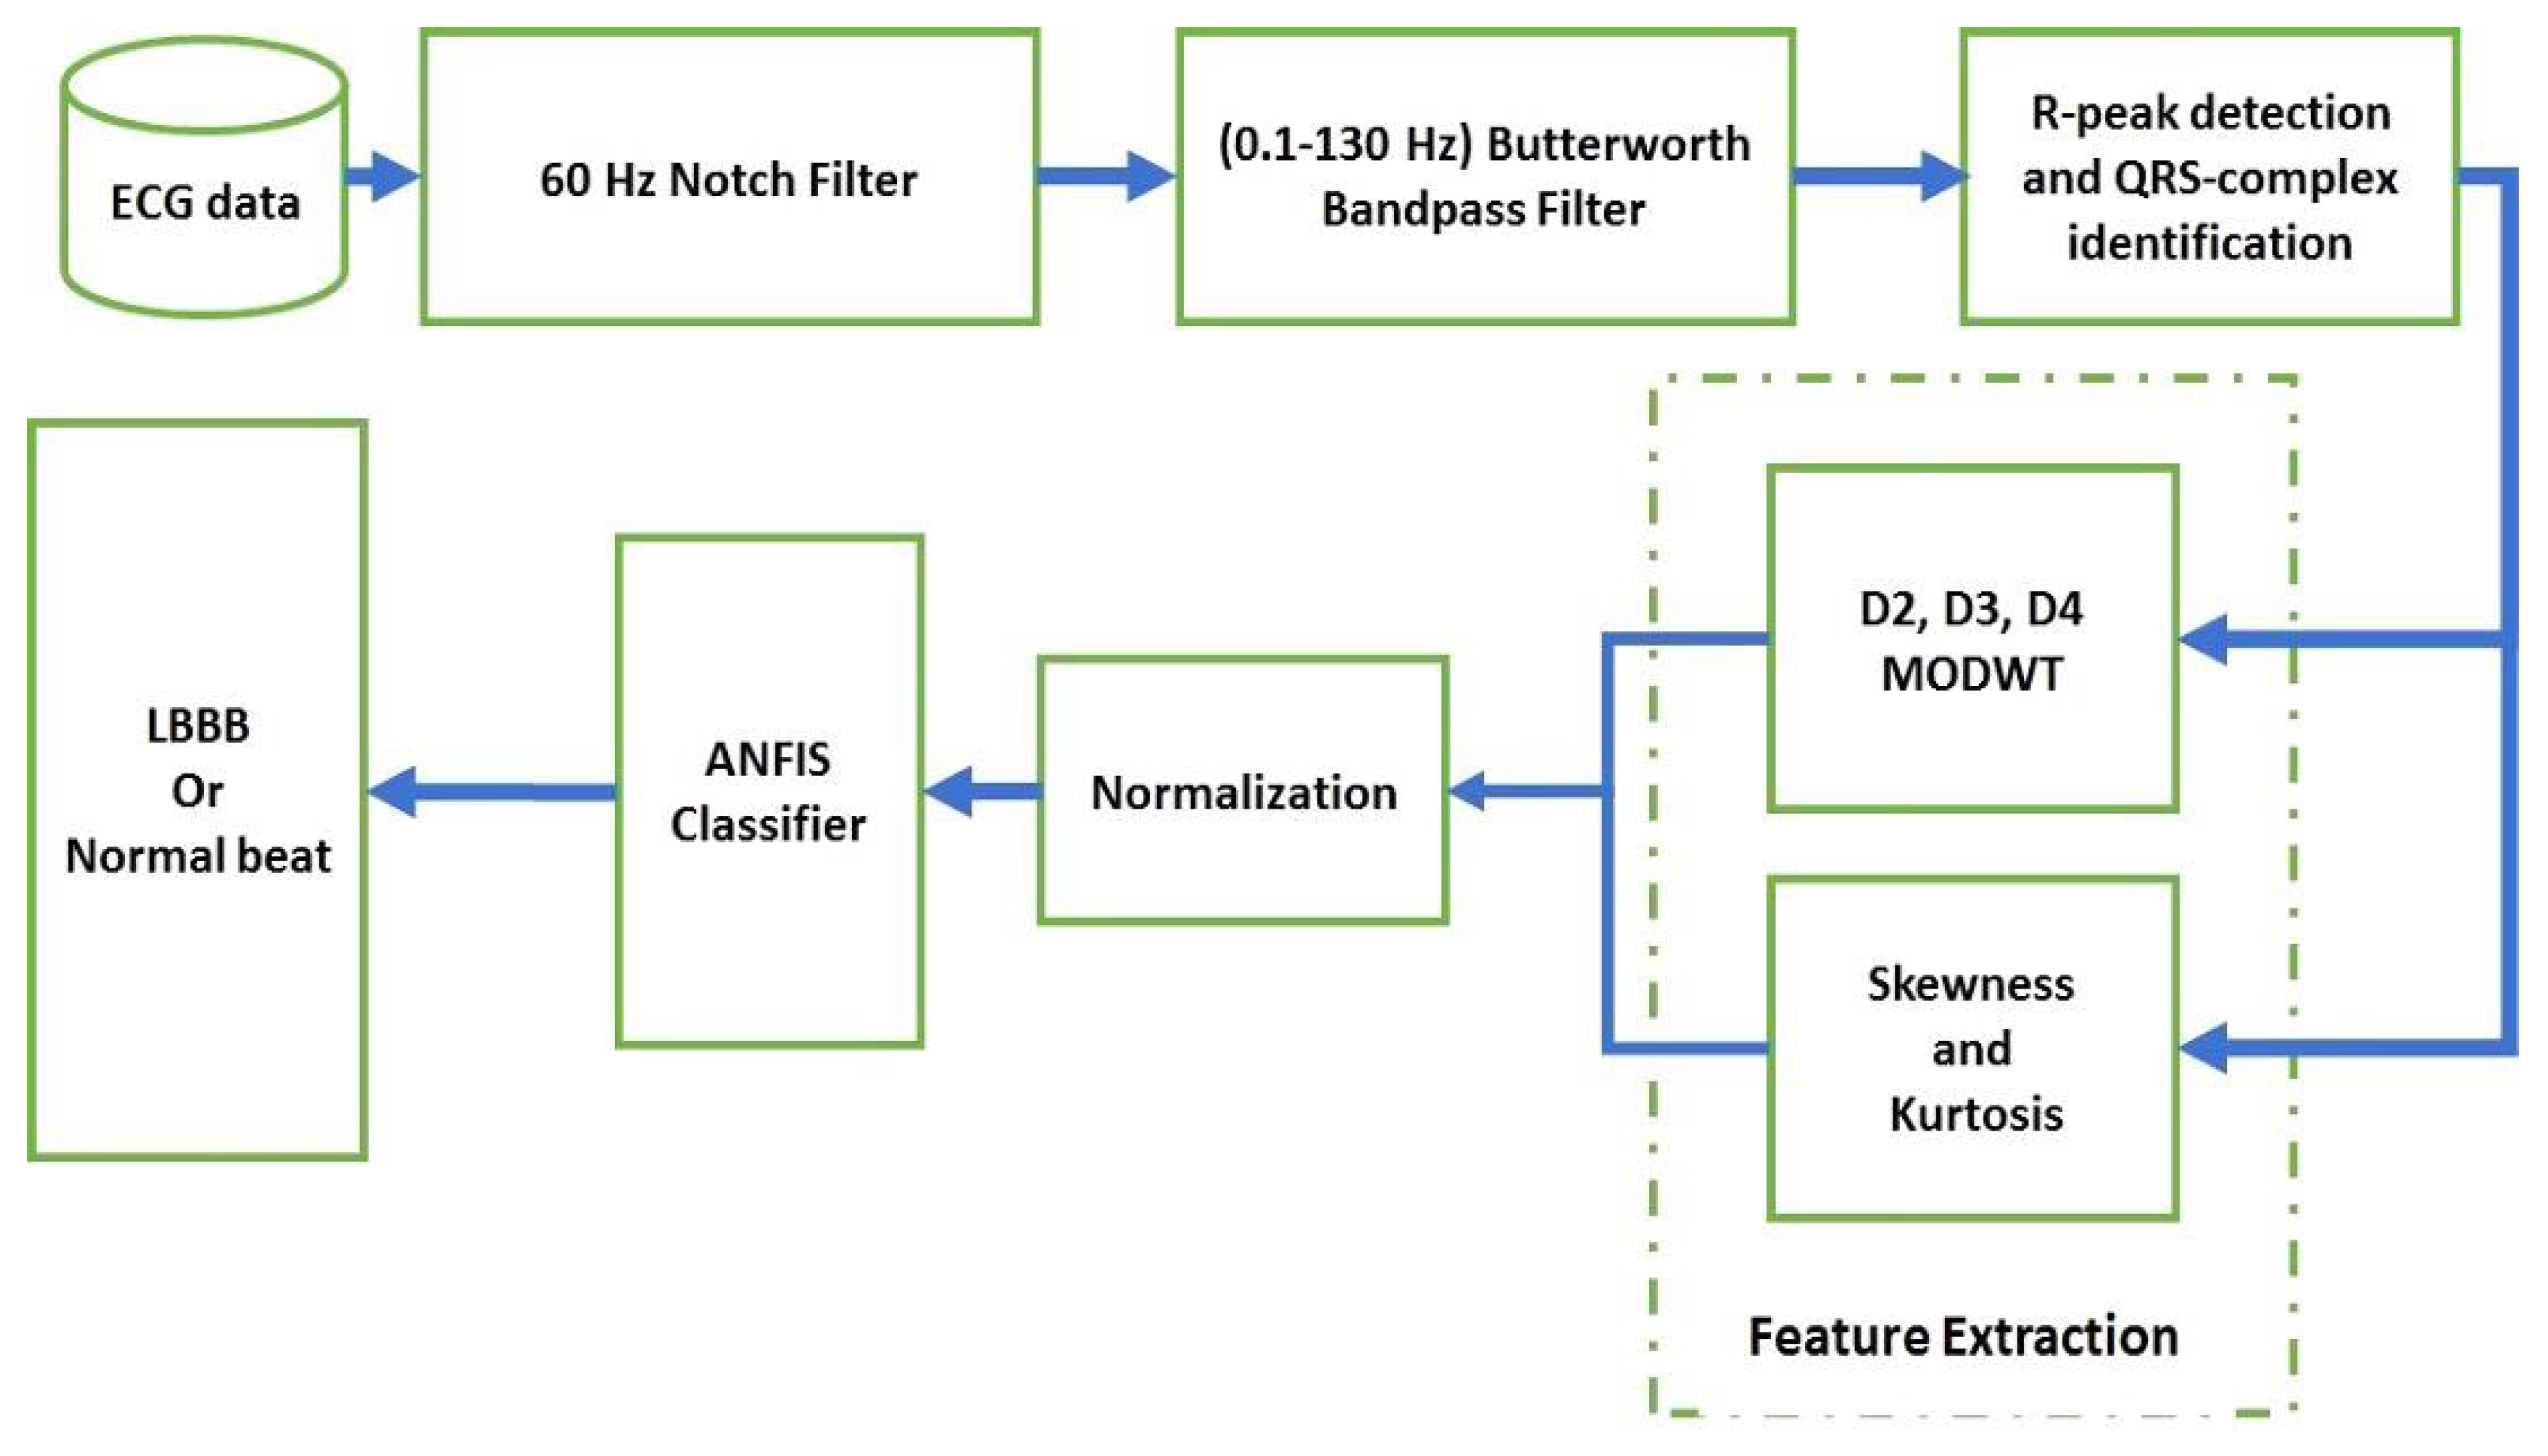
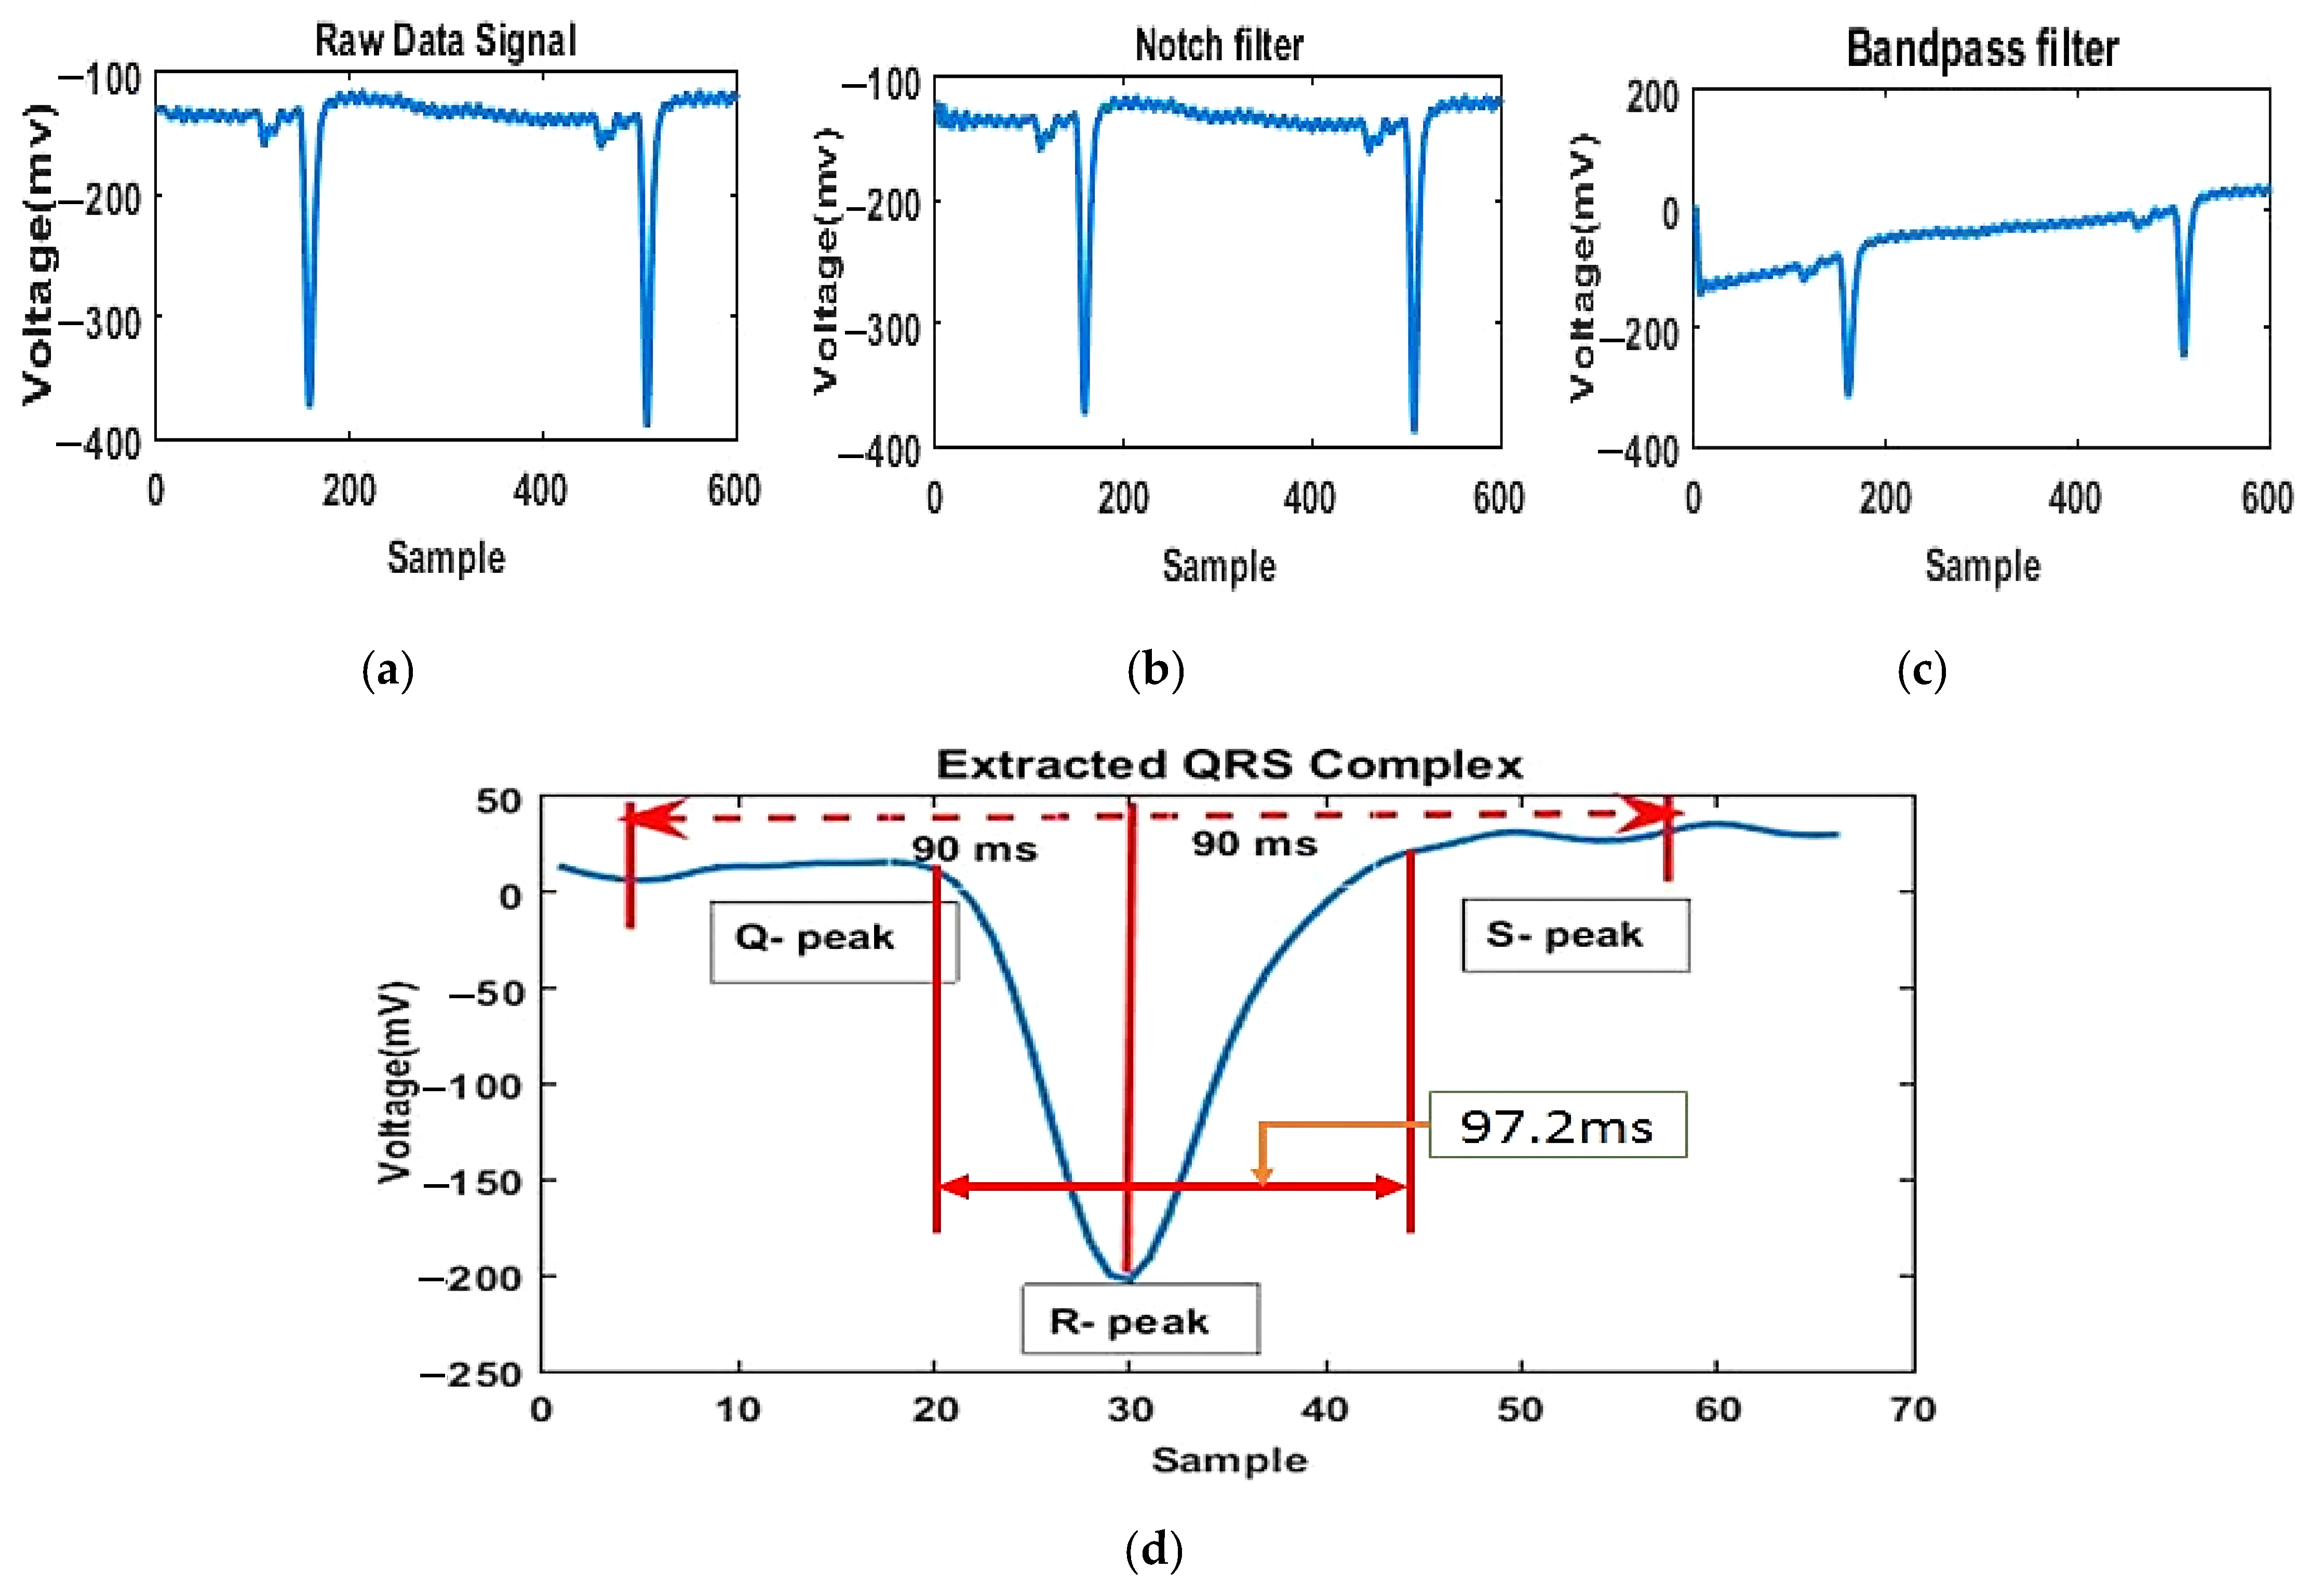
3.3. ECG Pre-Processing and QRS Complex Extraction

The 60 Hz notch filter was employed to eliminate the noise caused by the battery-powered records, and (0.1–130 Hz) Butterworth bandpass filter was applied to the records to denoise the ECG signals [30]. Thus, the QRS complex was extracted by identifying the peak of the R wave when a 90 ms to the left and right of the detected R-peak was segmented, resulting in a 180 ms QRS complex window. This window was selected since QRS duration is between 80–120 ms in normal beat (i.e., 97.2 ms in Figure 2), but it can extend beyond 120 ms in the bundle branch block case, as seen in Figure 3 (i.e., 138.2 ms). Figure 2 and Figure 3 show the steps of ECG filtering and QRS complex extraction of normal and LBBB beats.

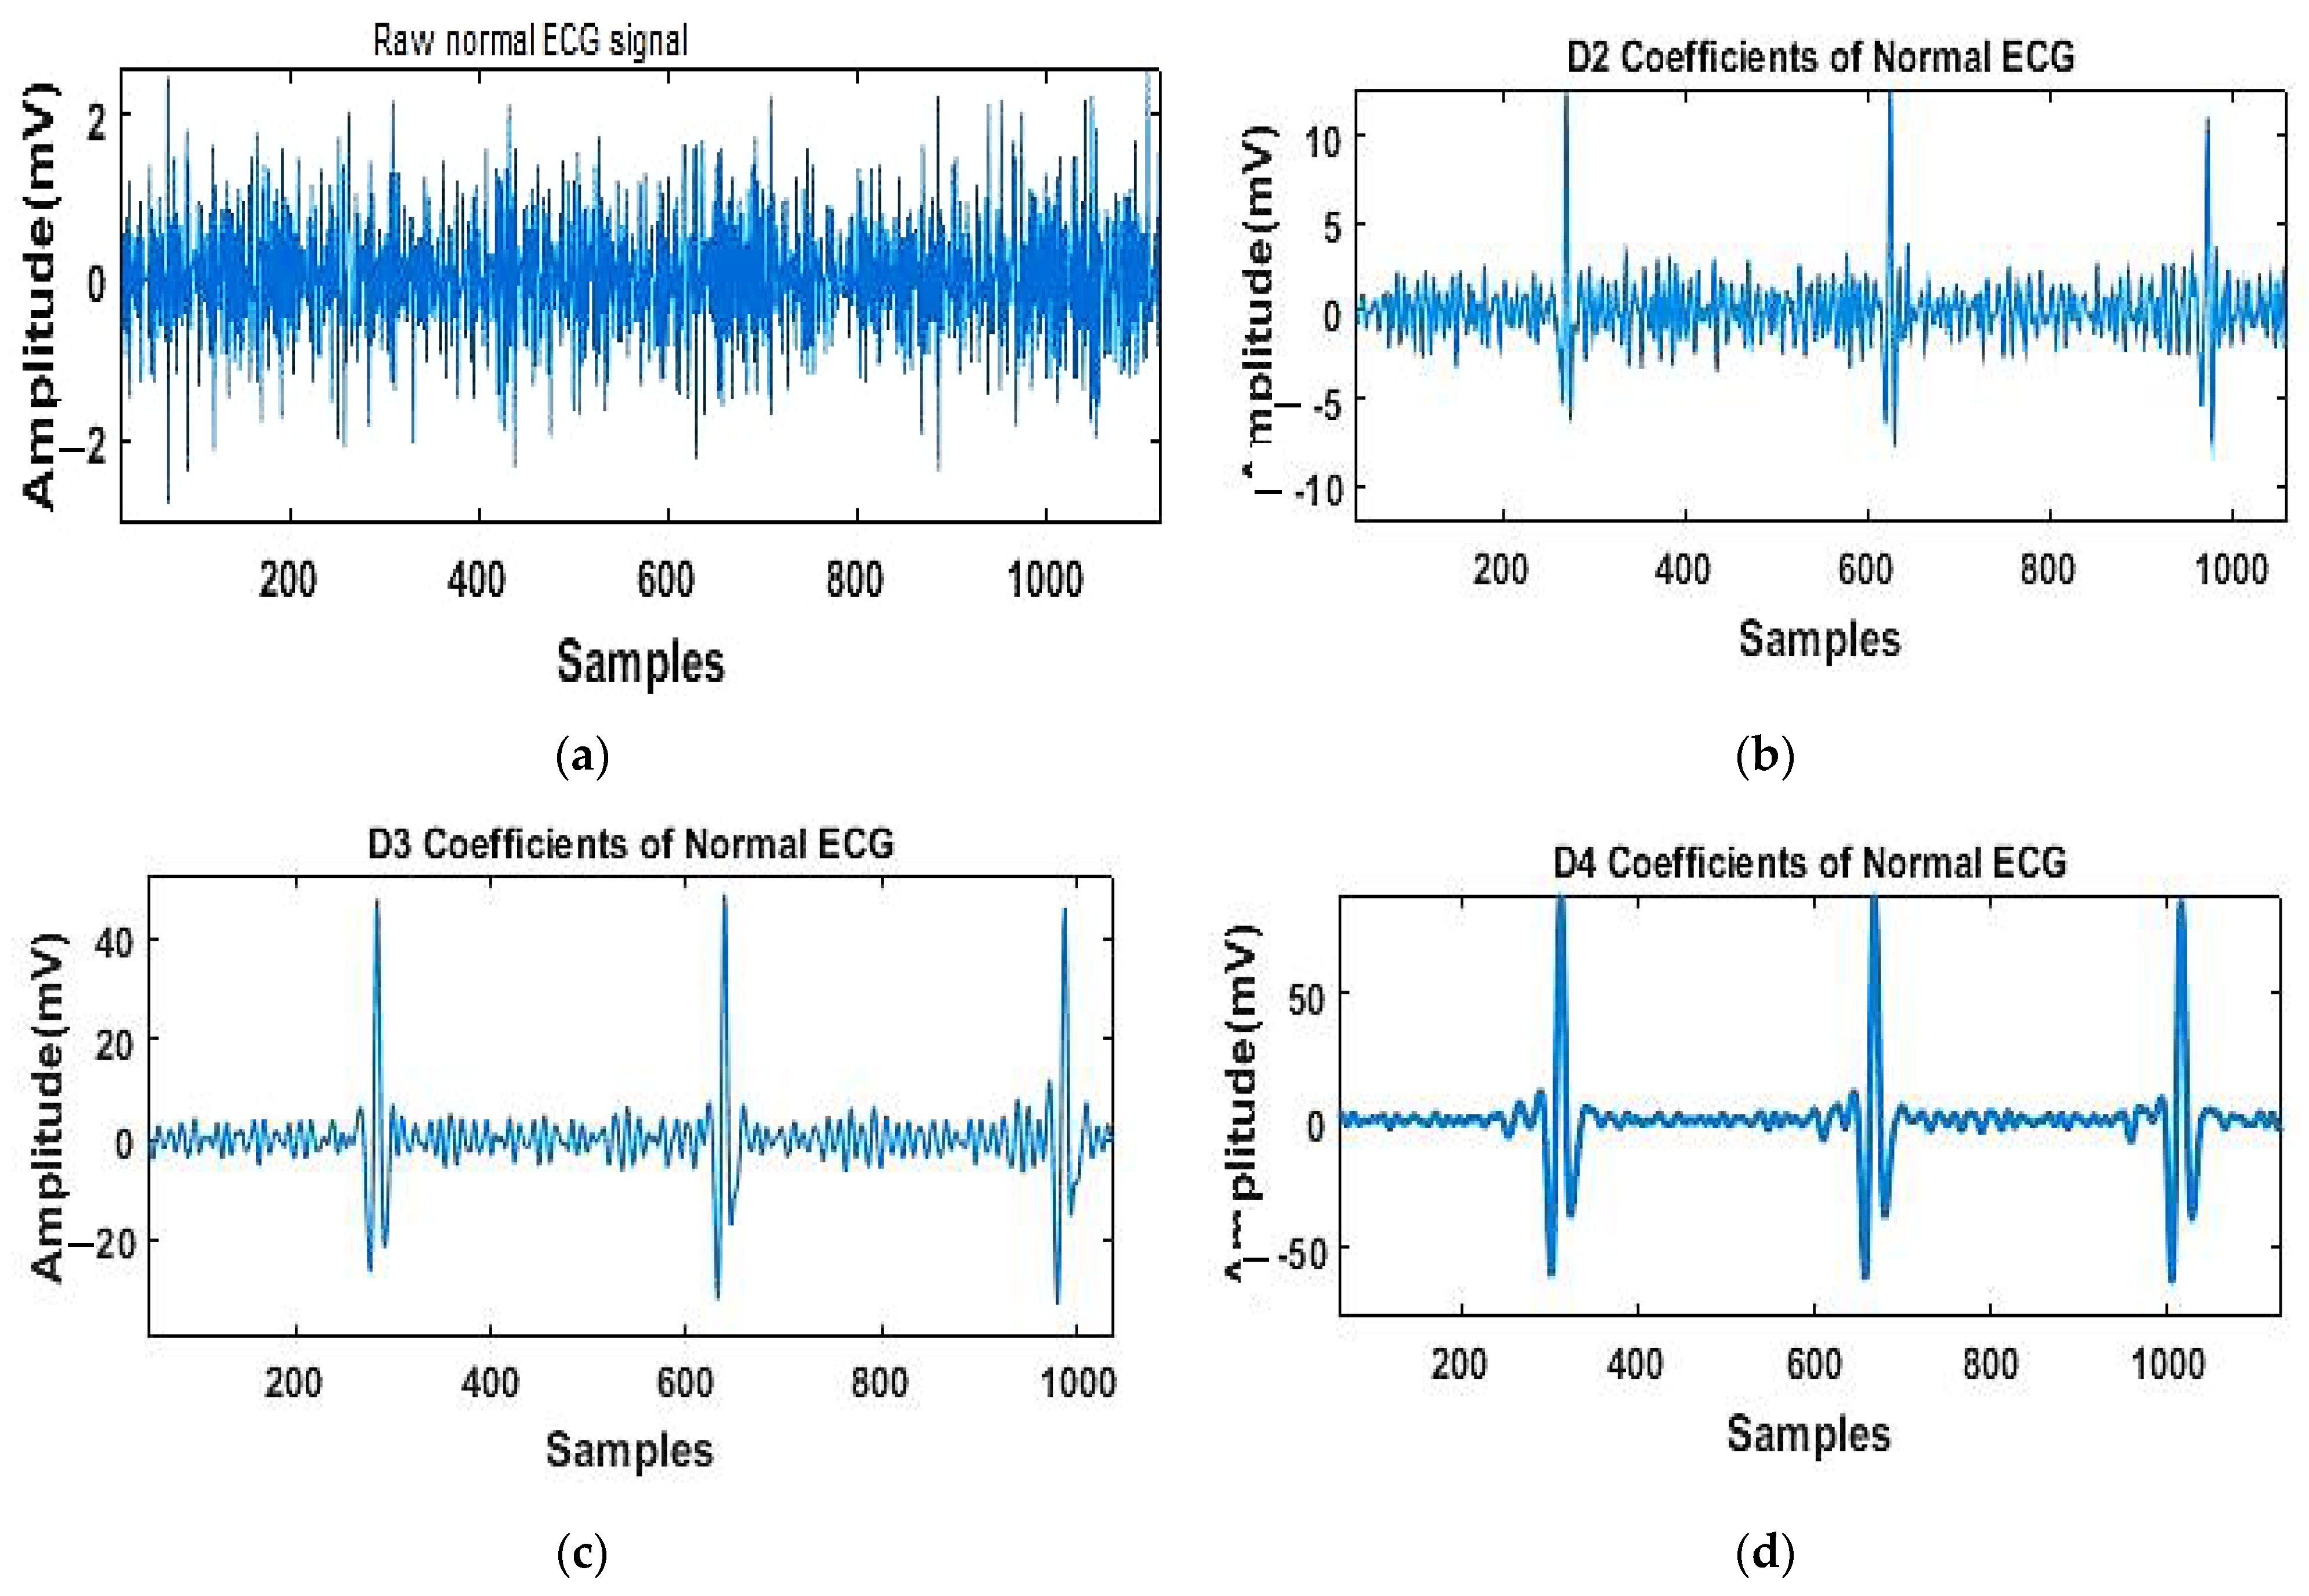
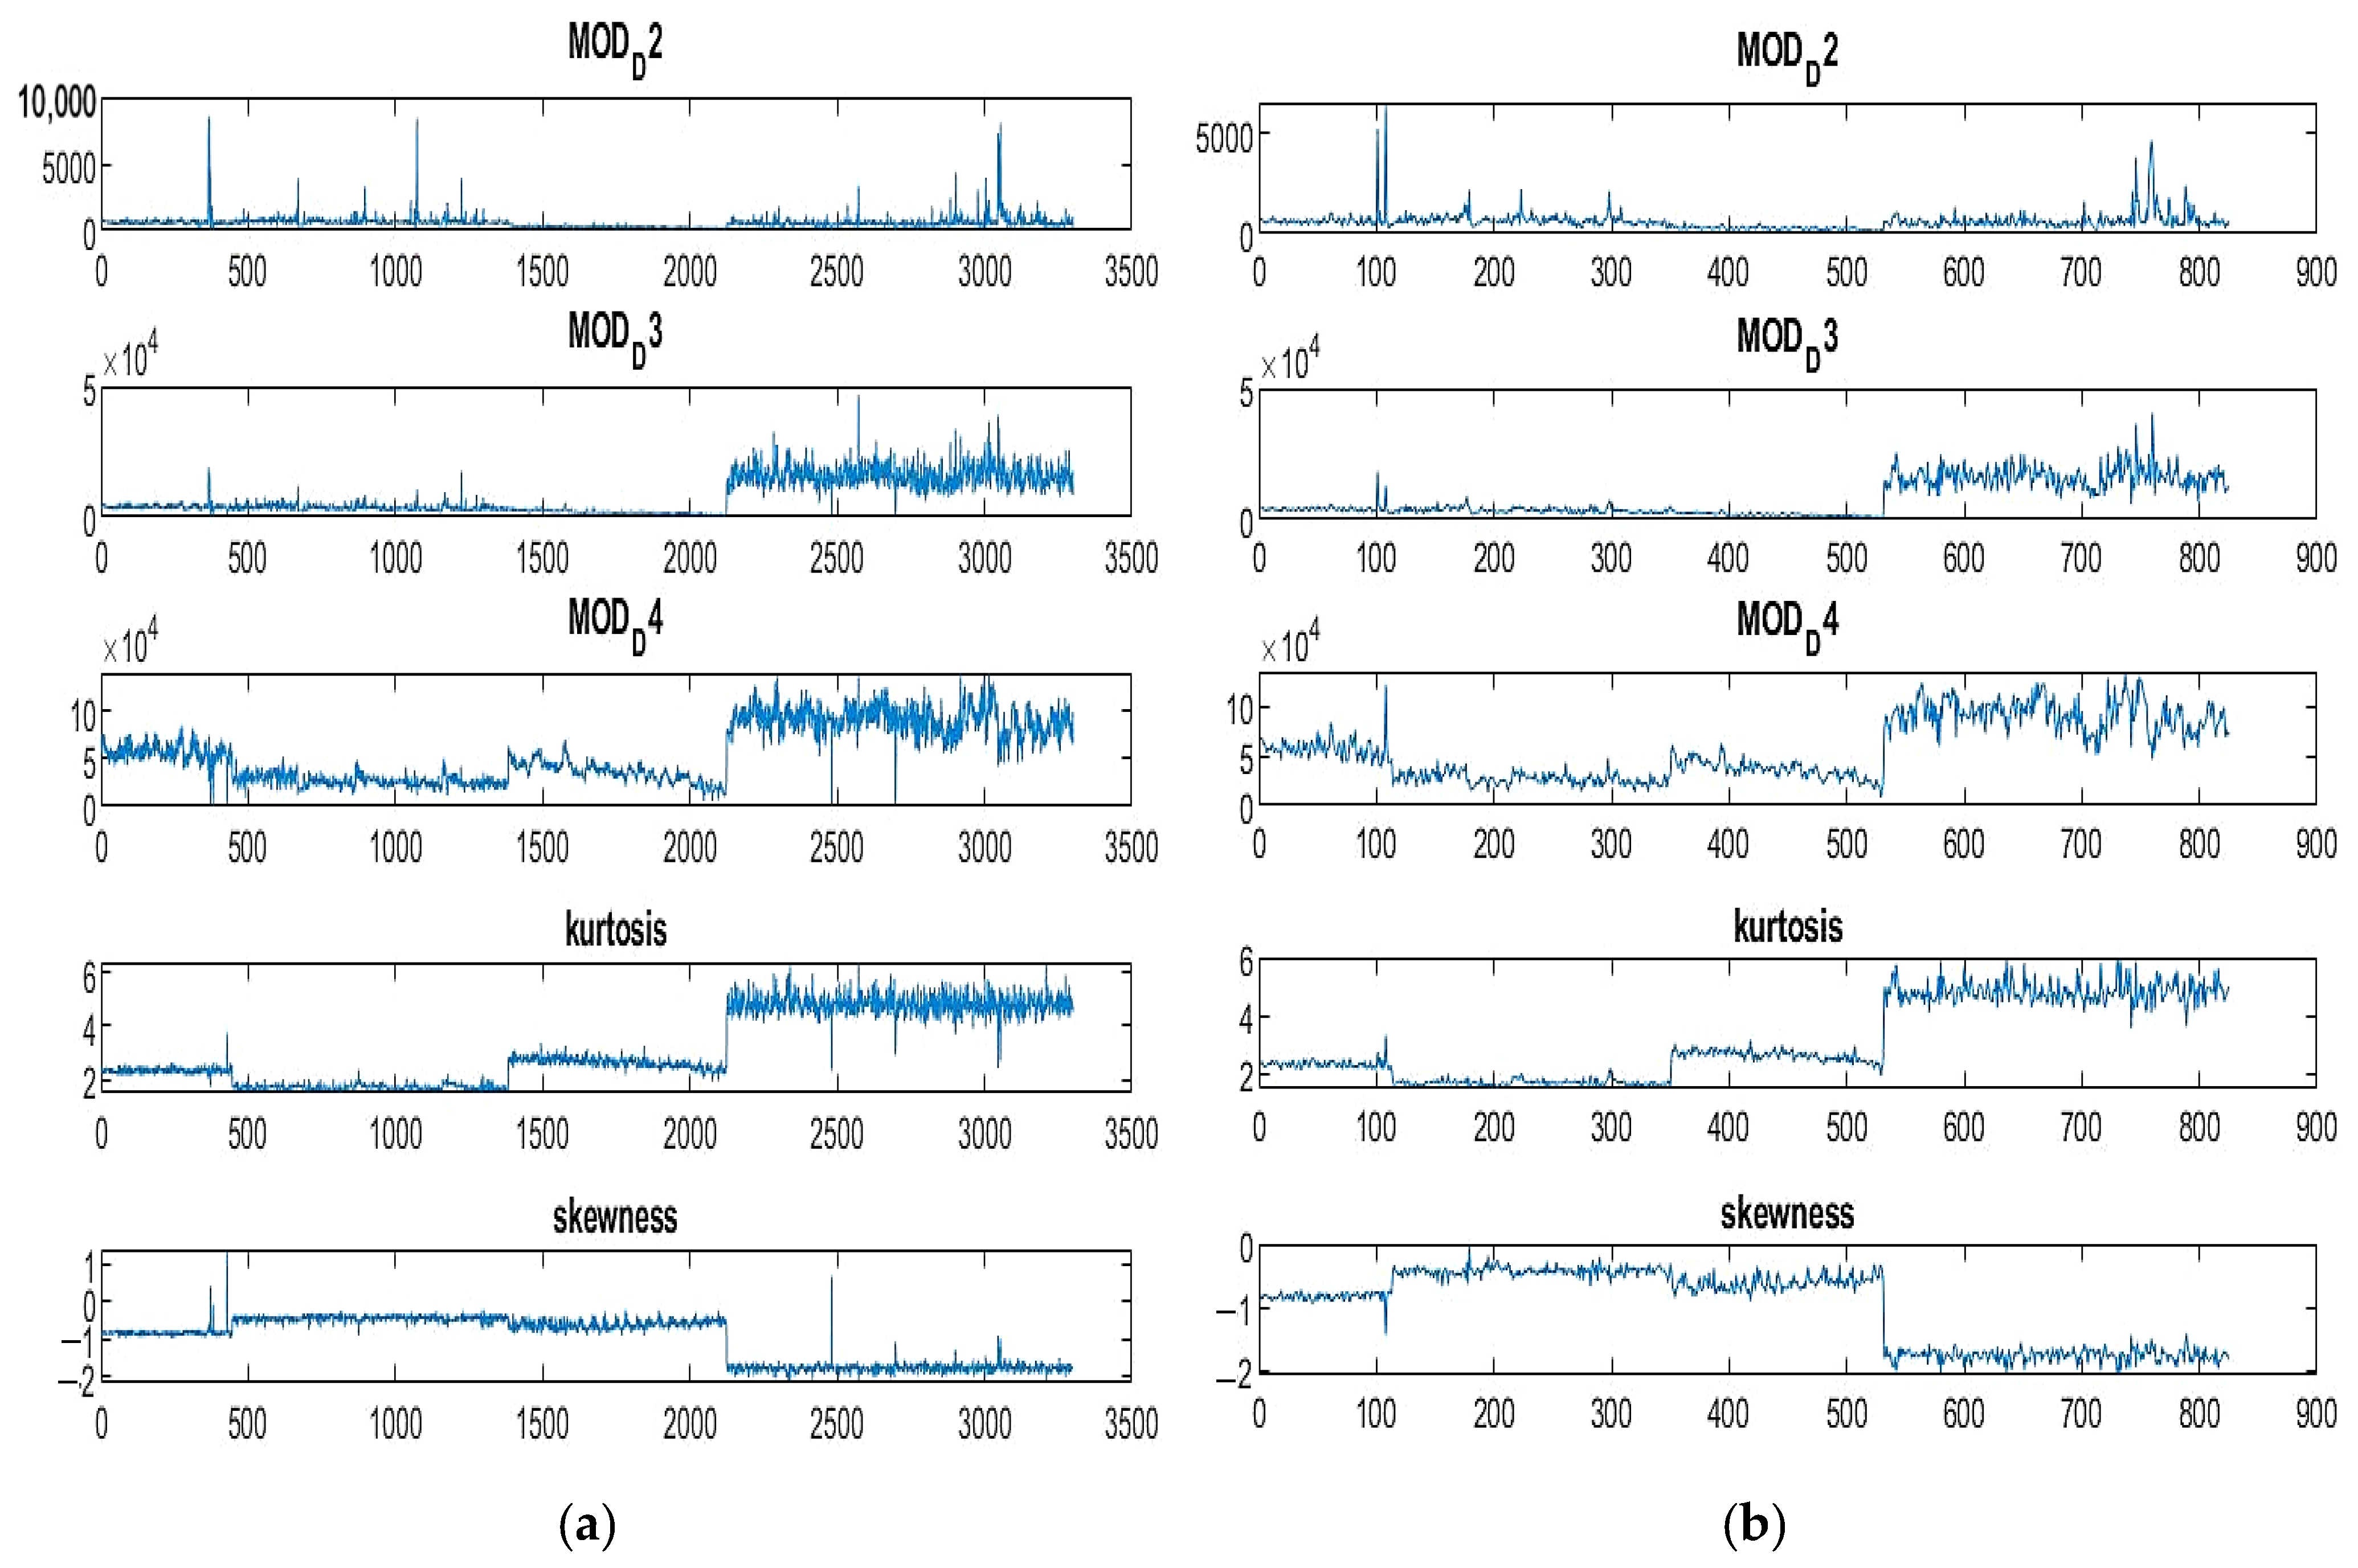
3.4. ECG Feature Extraction from MODWT

Selection of the best fitting features for an achievable classifier is an important step. To the best of our knowledge, this could be the first attempt to use the MODWT in LBBB detection. The MODWT has several advantages over the traditional DWT [31,32]:
(1)
MODWT is a highly redundant, non-orthogonal transform, distinguishing it from DWT. At each level of the decomposition, MODWT keeps down-sampled data that DWT would otherwise discard;
(2)
DWT is orthonormal, while MODWT is not; DWT is used for samples of size 2 n , where n > 1 , while MODWT can be used for any sample size;
(3)
Both transforms have multi-resolution analysis (MRA), but MODWT benefits from transforming invariant, i.e., details and smooth coefficients that shift along with signal X.
In our case, the input signal of LBBB (QRS) is samples of a function f x   evaluated at N-many time points. The function can be expressed as a linear combination of the scaling function ϕ(x) and wavelet ψ(x) at varying scales and translations [33,34].
f x = k = 0 N 1 c k 2 J 0 2   Φ 2 J 0 x k + j = 1 J 0 f j x
where
f j x = k = 0 N 1 d j , k 2 j 2 ψ 2 j x k  
In Equation (1), J 0 represents the number of levels of the wavelet decomposition. The first sum is the coarse-scale approximation of the signal and f j x contains the details at successive scales. MODWT returns the N-many coefficients {ck} and the (J0 × N)-many detail coefficients { d j , k } of the expansion. The number of decomposition levels for a signal of length N can be calculated by the following calculation floor log 2 N . Detail coefficients are produced at each level, while the scaling coefficients are applied only at the final level. In this study, if N = 2048, J 0 = floor log 2 2048 = 11 , and the number of rows in the QRS segment equals J0 + 1 = 11 + 1 = 12.
These levels are D1, D2, D3, D4, D7, D8, D9, D10, D11, and A11, where D1–D11 denote the detail coefficients, while A11 is the scale coefficient (approximate).
In this work, each ECG signal was divided into one-minute duration with an average of 65 heartbeats (QRS complex). Next, each QRS interval was segmented based on the maximum amplitude of the R-peak with 90 ms cut off on the left and right side of the R-peak. Consequently, the width of the QRS wave is 180 ms, considered an input to the MODWT. Then, each QRS segment was decomposed into D1–D11 and A11 coefficients.
In this work, first of all it must be considered that statistical significance does not imply significance clinically; therefore, all parameters for normal and abnormal (LBBB) QRS signals must be checked out by observation clinically and then by a statistical tool. In other words, we first compared all parameters (i.e., D1–D11, A11, kurtosis, and skewness) by plotting each parameter as normal vs. LBBB. Next, the statistical hypothesis testing was employed to test the null hypothesis and determine statistical significance. By comparing the mean of two groups (normal vs. LBBB), then the t-test was determined. The probability of making a type I error is denoted by Alpha (α).
α = P (type I error) = P (reject H0 when H0 is true)
where P stands for significance level and Ho for rejecting the null hypothesis. However, P < α means significance statistically. Usually, α equal to 5% is most commonly used in medicine by a consensus of researchers [35,36]. If a p-value reported from a t-test is less than 0.05, then that result is said to be statistically significant, and the hypothesis is true.
All coefficients were tested for normal and LBBB signals by t-test criterion, which found that only D2, D3, and D4 are statistically significant (   p < 0.05   ).
In the quality of the statistical features, the kurtosis (KSQI) was extracted from the QRS directly, which measures the spikiness of signals [37]. It is defined by
k = E x μ x 4 σ 4  
Skewness (S) provided a measure of the asymmetry of intrinsic heart activity [38]. It is defined by
S = E x μ x 3 σ 3  
where E is the mean value.

3.5. Adaptive Neuro-Fuzzy Inference System

The ANFIS is a machine learning (ML) rule-based classifier algorithm applied to many biosignal processing applications [39]. The ANFIS has the ability of ANN ML, which exploits a fuzzy inference system to deduce decisions by a fuzzy logic method that considers the membership degree of input–output variables [40]. The ANFIS architecture has two fuzzy if–then rules based on the Sugeno model. It has two sets of input rules applied to generate one output. The connection between the two input rules and the Sugeno fuzzy output is reconstructed in five layers of nodes; two layers are adaptive with flexibility, while the other three are fixed.
The selected five features (parameters) of D2, D3, D4, skewness, and kurtosis (Table 2), were normalized between 0 and 1 prior to being applied for the ANFIS using Equation (5) adapted from a previous study [39]
F j ,   normalized = ( F j F j , min ) / F j , max F j , min  
where F j   and F j , normalized are the original and normalized j-th features, respectively; F j , min and F j , max are the minimum and the maximum values of the j -th feature, calculated for all the 4125 samples (i.e., QRS), respectively. In other words, the n-th feature (for j = 1 to 5) for n samples (for n = 1 to 4125) was normalized between 0 and 1 values.
The ANFIS structure should first be rehearsed using the training set to derive the optimum performance before evaluating the test sets. Therefore, we applied the ANFIS to all QRS recordings in the training sets in Table 3. The ANFIS training optimum parameters are illustrated in Table 4. After that, the ANFIS was evaluated on the test sets reported in Table 3.
The training–test procedure was repeated five times (i.e., 5-fold cross-validation procedure) by repeating the 20–80% ANN protocol five times to each class of the QRS dataset (Table 3); this operating method leads to better ANFIS performance accuracy.

4. Results

In this framework of LBBB detection, the signal passed through filtration and denoising from the 60 Hz and the environmental noise. The next step was segmenting the QRS peak with a time window of 180 ms for both arrhythmic disease and normal conditions, as demonstrated in Figure 2 and Figure 3. In Figure 4, an example of the MODWT performance is shown. Table 2 shows the extracted features after applying the MODWT to the QRS segments. The decomposed levels produced the 12 coefficient details, where only D2, D3, and D4 were statistically significant, in addition to the kurtosis and skewness. These five features were fed into the ANFIS classifier.

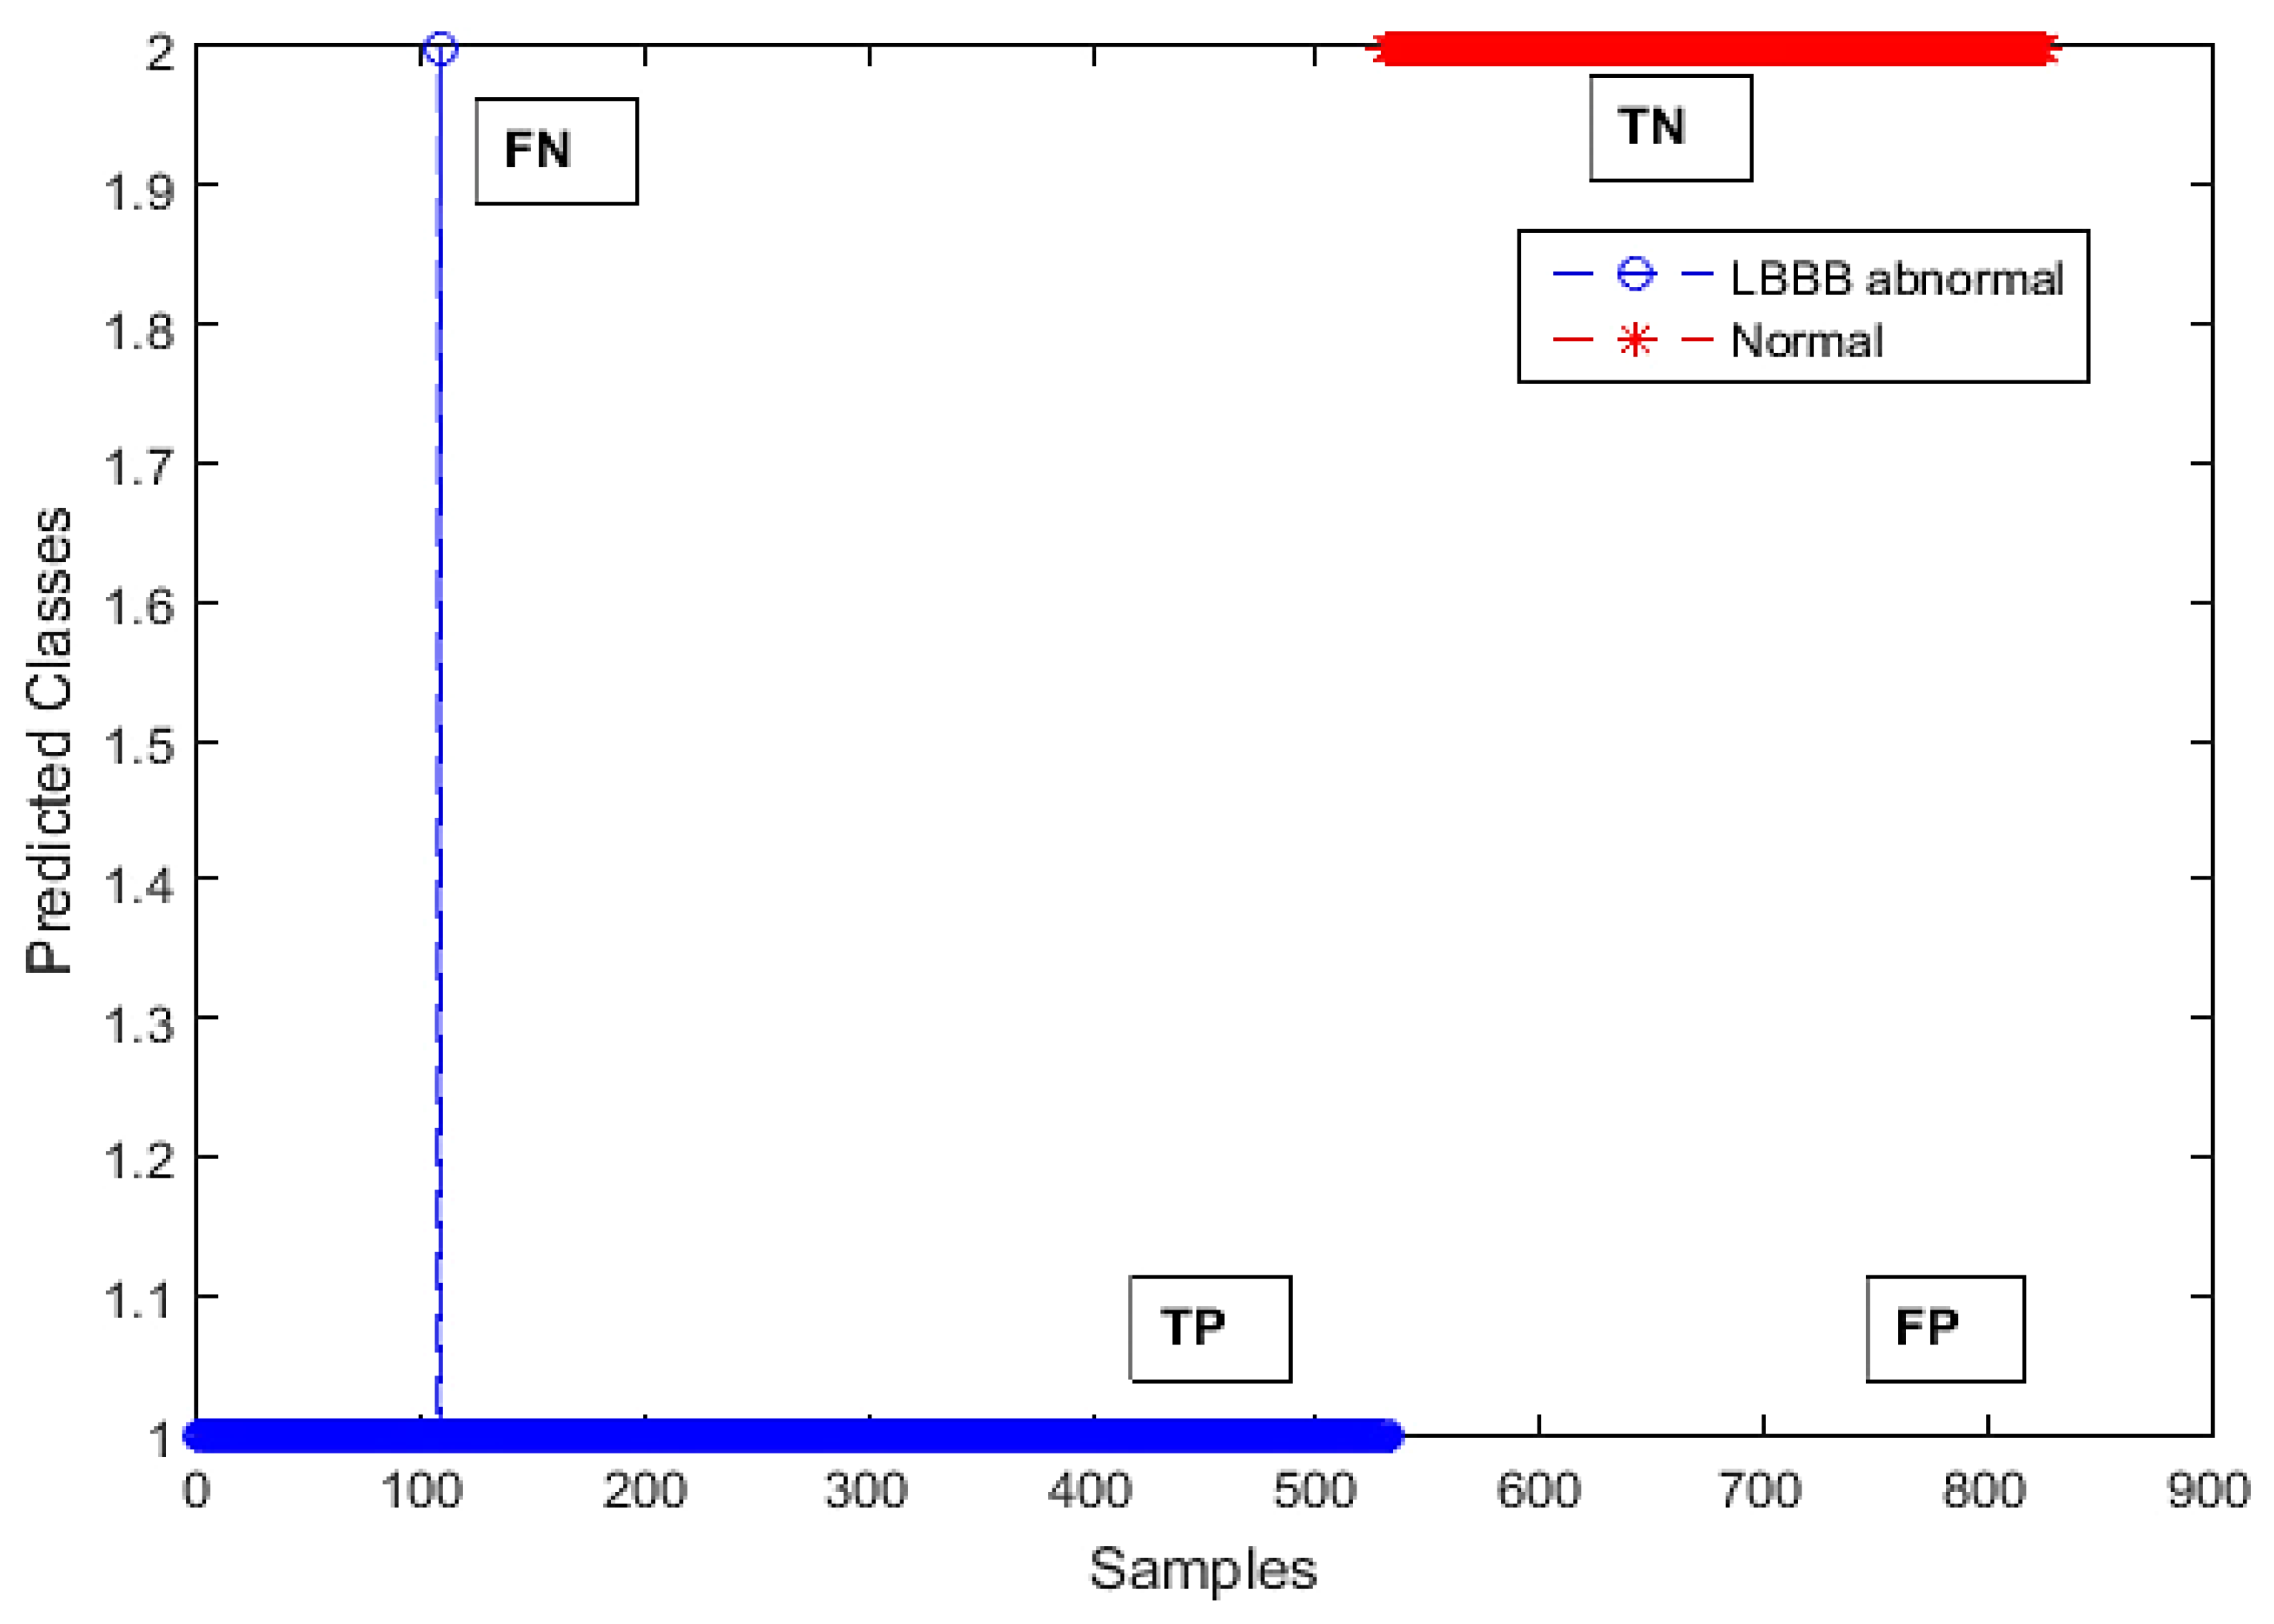
Results of the ANFIS Analysis

Our research allowed us to build a database of ECG beats with the extracted features of D2, D3, D4, kurtosis, and skewness. The database contains 2655 × 5 LBBB (abnormal) and 1470 × 5 normal = 4125, the total number of signals (Table 3). Figure 5 shows the ANFIS training process on 80% of the dataset, including LBBB and normal heartbeats, and the response on 20% of the testing mode, where the x-axis represents the number of QRS studied signals. Figure 6 shows ANFIS outputs on the test set of 20% of LBBB and normal QRS complexes according to Table 3 (LBBB = 531 and normal = 294). The blue color indicates LBBB signals, while the red indicates normal ECG signals. The ANFIS output was set to either one if pathology was predicted or two for a normal ECG. Finally, the ANFIS performances were assessed by calculating the F-score, precision (or sensitivity), and recall (or positive predictivity) presented in Table 5 using Equations (6)–(10), respectively.
P r e c i s i o n = T P T P + F P
R e c a l l   S e n . = T P T P + F N
F S c o r e = 2 × P r e c i s i o n × R e c a l l P r e c i s i o n + R e c a l l
S p e c i f i c i t y = T N T N + F P
A c c u r a c y = T P + T N T P + T N + F P + F N
All values of the True Positive (TP), True Negative (TN), False Positive (FP), and False Negative (FN) were taken from Figure 6.

5. Discussion

The detection of LBBB is highly considered by many researchers and medical health industrial personnel. The standard MIT-BIH and PhysioNet databases were used to focus on the process of developing signal processing algorithms to achieve very high accuracy that was close to total perfection. In other words, the average accuracy of 99% becomes a fact. It is concluded that this competitive accuracy is dependent on three steps offered in this work. Before the pre-processing step was completed, the 30-min recordings were divided into one-minute durations; then, we studied the first five QRS peaks from each signal (i.e., minute). The second pre-processing step is well demonstrated in Figure 2 and Figure 3, where the notch filter and Butterworth filter maintain a cut frequency of 60 Hz and 0.1–130 Hz, respectively. We were keen to segment the QRS correctly with a time window of 180 ms (i.e., 90 ms left and 90 ms right to the central point of the R-peak) during the workflow. In this way, the QRS length of abnormal cases in the right or left block can be detected smoothly because the abnormal (cardiac block) result occurs if the QRS peak exceeds 120 ms (Figure 2b and Figure 3b). The total QRS segments numbered 4125, including the LBBB and normal peaks.
Notably, the MODWT effectively participated as a powerful denoising technique that assisted QRS enhancement, as illustrated in Figure 4. In response to the first and second concerns mentioned in the introduction, the advantages of MODWT among DWT would facilitate acquiring features/parameters that statistically fit the classifiers’ purposes. This means these parameters can be employed to distinguish the LBBB signal correctly. The detail coefficients obtained during the decomposition process were statistically tested to optimize only three level coefficients (D2, D3, and D4). Moreover, other statistical parameters such as kurtosis and skewness were calculated, to leave five extracted parameters that were fed into the ANFIS classifier later on. Figure 5 demonstrates the ability of ANFIS to communicate with the two classes of the inputs (LBBB and normal) during the training and testing procedures.
The robustness of classification is seen through the ANFIS performance on the 20% testing samples. The high score of the accuracy and the F-score of 99.878% and 99.909%, respectively, make the proposed method a very competitive approach against those ever tested on the MIT-BIH database. A few research works in the literature reported an accuracy close to our approach, as reported in the comparative summary in Table 6. It is worth mentioning that the highest accuracy of LBBB detection is directly related to the feature extraction statistical-based approach, and then features obtained from DWTs after ECG signal enhancement. Moreover, the algorithms that utilized the QRS segment were likely to achieve higher accuracy than those using the entire ECG, including the whole R-R or the P-P intervals. However, on the MIT-BIH dataset, MODWT has not yet been tested as a high-resolution transform and reliable noise removal tool that works with ANFIS.

6. Conclusions

Arrhythmias are a crucial CVD that is linked to many other cardiac complications. The bundle branch block is intensively being investigated by many research institutions worldwide. In this work, we focused on the LBBB condition due to the importance of understanding the electrical impulse propagation through the bundle of HIS (i.e., through ventricles muscles). Therefore, in this work, we proposed a new effective approach to detect abnormalities in the uncoordinated propagation of the electrical impulses through the left bundle branch toward the LV muscle. If the nerve conduction is blocked, it may lead to heart failure; this arrhythmia disease is known as LBB block (LBBB). The developed method focused on the QRS peak segmentation and features extraction. The obtained QRS waves (4125 signal) were denoised by the MODWT, serving as a high-resolution analyzer. The MODWT can produce maximum detail coefficients with a series of decomposed levels. The selected detail coefficients (D2, D3, D4, kurtosis, and skewness) were statistically significant. To the best of our knowledge, this is the first application of the MODWT, collaborating with ANFIS, to the LBBB MIT-BIH signals. The achieved classification accuracy of 99.88% reveals a promising future for using ML algorithms in clinical applications such as LBBB automated detection.
In conclusion, the proposed method has contributed to:
-
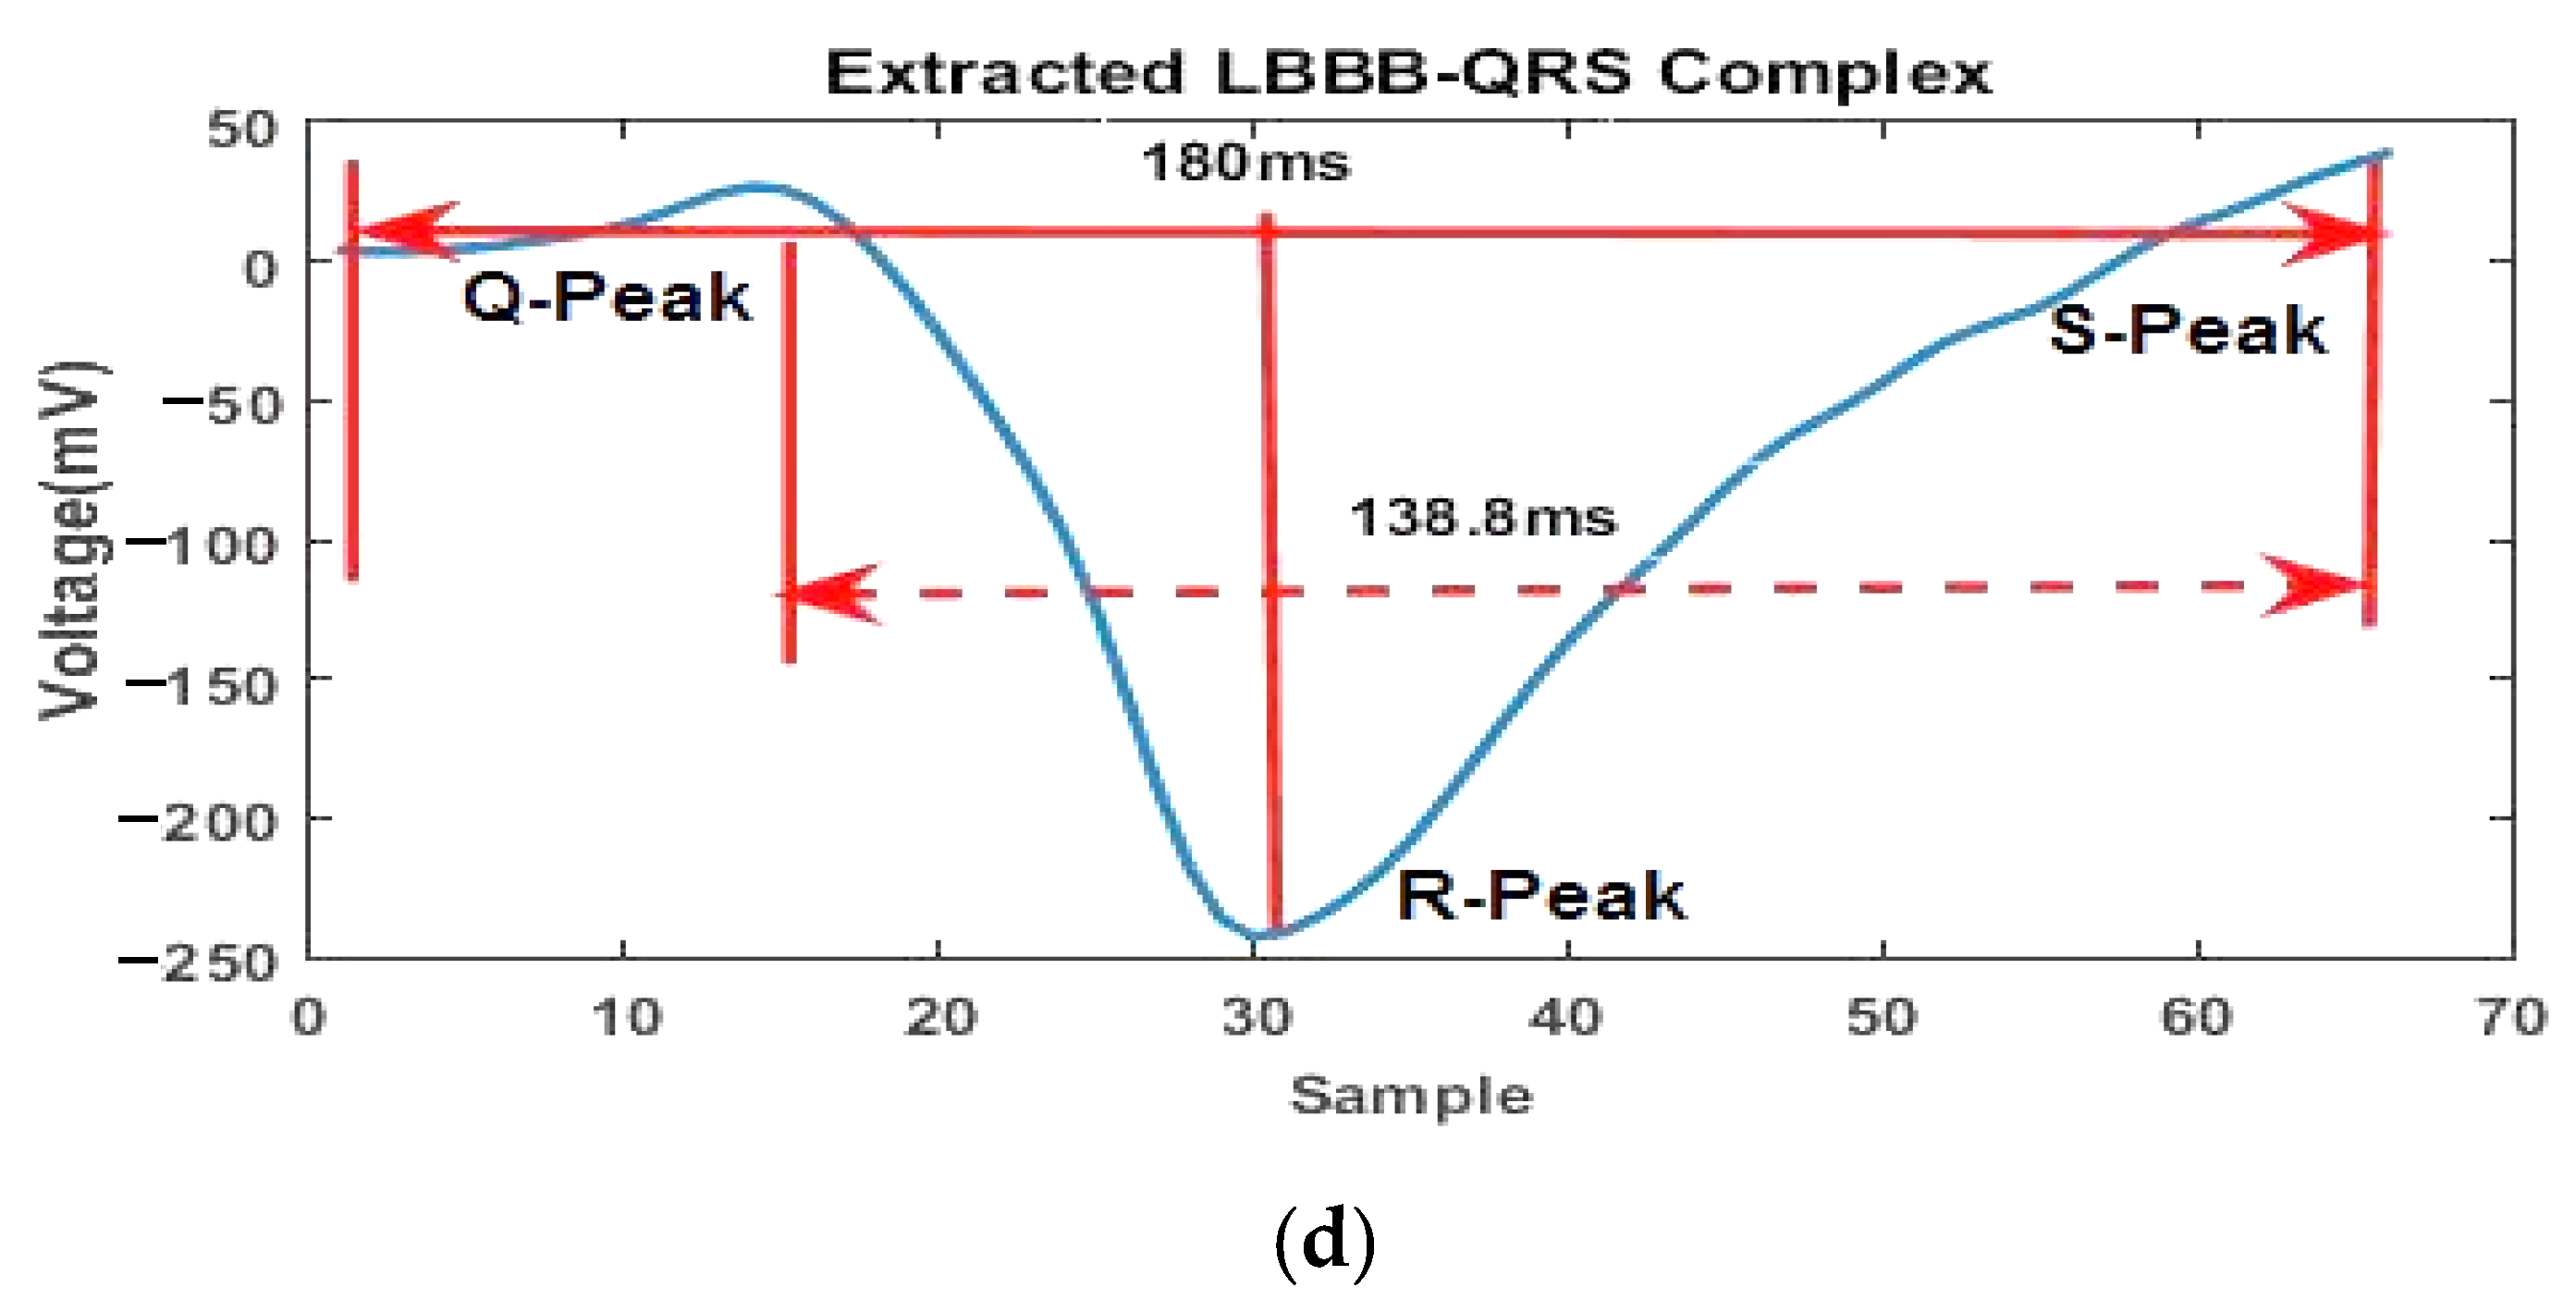
the effective QRS segmentation. It is common for physicians to look directly at the largest amplitude ignoring the small peaks of the ECGs. Therefore, we have tried to cut a larger segment than the one used in another peer published work [16]. The length of the QRS peak is 180 ms, so we could cover more cardiac information between P-P intervals.
-
the successful selection of the five parameters of D2, D3, D4, kurtosis, and skewness can be interpreted by the ability of MODWT to overcome the DWT drawbacks.
-
the increasing ability of ANFIS to perform adequately with each vector of D2, D3, D4, kurtosis, and skewness. The lengths of each vector range from 294 to 2124 QRS samples.
-
the new classification accuracy being highly ranked at 99.878% compared to the best accuracy achieved in the literature; this performance is promising as a way to validate the algorithm on another dataset to increase the robustness and validity.
In the future, this research can be extended by considering:
(i)
increasing the datasets to cover different cardiac arrhythmia, including the LBBB and RBBB. Sometimes, it is worth considering the local aspects that CVD may affect. In other words, the newly collected data can be segregated into various classes independently of the selected factors and aspects.
(ii)
testing new ML algorithms, especially deep learning to achieve more accuracy with fewer extracted features.
(iii)
designing an easy software platform to facilitate the physician’s interaction with LBBB detection.
(iv)
integrating the developed software with Cardiac Holter recording systems to distinguish between LBBB and other cardiac diseases.
(v)
testing the developed algorithm by means of embedded systems such as Xilinx or FPGA modules.

Author Contributions

Conceptualization, B.A.-N. and P.V.; methodology, B.A.-N., H.A.O., R.D.F. and H.F.; software, B.A.-N., H.F., K.A.-H. and R.D.F.; validation, B.A.-N., H.A.O. and P.V.; formal analysis, B.A.-N.; investigation, B.A.-N. and H.A.O.; resources, B.A.-N. and R.D.F.; data curation, B.A.-N. and R.D.F.; writing—original draft preparation, B.A.-N., H.A.O. and R.D.F.; writing—review and editing, B.A.-N., H.A.O. and P.V.; visualization, B.A.-N. and P.V.; supervision, B.A.-N. and P.V.; project administration, B.A.-N.; funding acquisition, P.V. All authors have read and agreed to the published version of the manuscript.

Funding

This research received no external funding.

Institutional Review Board Statement

Not applicable.

Informed Consent Statement

Informed consent was obtained from all subjects involved in the study.

Data Availability Statement

Data of our study are available upon request.

Acknowledgments

We thank our students, Diya’ Hasan, Abdallah Shammout, and Rama Al-Hinde, for the effort made in data downloading and supporting this work.

Conflicts of Interest

The authors declare no conflict of interest.

Abbreviations

AcronymsExtended Meaning of the Acronym
LBBBLeft bundle branch block
MODWTMaximal Overlapped Discrete Wavelet
ECGElectrocardiogram
QRSPart of the ECG
ANFISAdaptive Neuro-Fuzzy Inference System
CVDCardiovascular disease
WHOWorld Health Organization
LVLeft ventricle
RVRight ventricle
SeSensitivity
SpSpecificity
AccAccuracy
ANNArtificial neural network
KNNK-Nearest Neighbor
GAGenetic algorithm
DTDecision tree
LS-SVMLeast square—support vector machine
RFRandom Forest
NVNaïve Bayes
AMSOMArtificial Metaplasticity Self Organizing Maps
ARAutoregressive
DWTDiscrete Wavelet Transform
F-HNNFuzzy-hybrid neural network
MLMachine learning
D1-D11Wavelet detail coefficients
A11Wavelet approximate coefficient
KKurtosis
SSkewness
TPTrue Positive
TNTrue Negative
FPFalse Positive
FNFalse Negative
αalpha
PSignificance
HoNull hypothesis

References

  1. World Health Organization (WHO). World Health Statistics 2018: Monitoring Health for the SDGs, Sustainable Development Goals; WHO: Geneva, Switzerland, 2018; ISBN 978-9241565586. Available online: https://www.who.int/docs/default-source/gho-documents/world-health-statistic-reports/6-june-18108-world-health-statistics-2018.pdf (accessed on 20 January 2022).
  2. Saunders, W.B. Left Bundle Branch Block. Chapter 4. In Chou’s Electrocardiography in Clinical Practice, 6th ed.; Surawicz, B., Knilans, T.K., Eds.; Elsevier: Amsterdam, The Netherlands, 2008; pp. 75–94. ISBN 9781416037743. [Google Scholar] [CrossRef]
  3. Yang, H.; Wei, Z. A Novel Approach for Heart Ventricular and Atrial Abnormalities Detection via an Ensemble Classification Algorithm Based on Ecg Morphological Features. IEEE Access 2021, 9, 54757–54774. [Google Scholar] [CrossRef]
  4. Moody, G.B.; Mark, R.G. The Impact of the MIT-BIH Arrhythmia Database. IEEE Eng. Med. Biol. Mag. 2001, 20, 45–50. [Google Scholar] [CrossRef] [PubMed]
  5. Huang, J.; Chen, B.; Yao, B.; He, W. ECG Arrhythmia Classification Using STFT-Based Spectrogram and Convolutional Neural Network. IEEE Access 2019, 7, 92871–92880. [Google Scholar] [CrossRef]
  6. Hou, B.; Yang, J.; Wang, P.; Yan, R. LSTM-Based Auto-Encoder Model for ECG Arrhythmias Classification. IEEE Trans. Instrum. Meas. 2020, 69, 1232–1240. [Google Scholar] [CrossRef]
  7. Hu, J.; Zhao, W.; Jia, D.; Yan, C.; Wang, H.; Li, Z.; You, T. A Novel Detection Method of Bundle Branch Block from Multi-Lead ECG. In Proceedings of the 2019 41st Annual International Conference of the IEEE Engineering in Medicine and Biology Society (EMBC), Berlin, Germany, 23–27 July 2019; pp. 79–82. [Google Scholar]
  8. He, T.; Clifford, G.; Tarassenko, L. Application of Independent Component Analysis in Removing Artefacts from the Electrocardiogram. Neural Comput. Appl. 2006, 15, 105–116. [Google Scholar] [CrossRef]
  9. Tsipouras, M.G.; Fotiadis, D.I. Automatic Arrhythmia Detection Based on Time and Time–Frequency Analysis of Heart Rate Variability. Comput. Methods Programs Biomed. 2004, 74, 95–108. [Google Scholar] [CrossRef]
  10. Zhang, Z.; Dong, J.; Luo, X.; Choi, K.S.; Wu, X. Heartbeat Classification Using Disease-Specific Feature Selection. Comput. Biol. Med. 2014, 46, 79–89. [Google Scholar] [CrossRef]
  11. Ghorbani Afkhami, R.; Azarnia, G.; Tinati, M.A. Cardiac Arrhythmia Classification Using Statistical and Mixture Modeling Features of ECG Signals. Pattern Recognit. Lett. 2016, 70, 45–51. [Google Scholar] [CrossRef]
  12. Korürek, M.; Doǧan, B. ECG Beat Classification Using Particle Swarm Optimization and Radial Basis Function Neural Network. Expert Syst. Appl. 2010, 37, 7563–7569. [Google Scholar] [CrossRef]
  13. Naseri, E.; Ghaffari, A.; Abdollahzade, M. A Novel ICA-Based Clustering Algorithm for Heart Arrhythmia Diagnosis. Pattern Anal. Appl. 2019, 22, 285–297. [Google Scholar] [CrossRef]
  14. Özbay, Y.; Tezel, G. A New Method for Classification of ECG Arrhythmias Using Neural Network with Adaptive Activation Function. Digit. Signal Process. 2010, 20, 1040–1049. [Google Scholar] [CrossRef]
  15. Marinho, L.B.; Nascimento, N.M.M.; Souza, J.W.M.; Gurgel, M.V.; Rebouças Filho, P.P.; de Albuquerque, V.H.C. A Novel Electrocardiogram Feature Extraction Approach for Cardiac Arrhythmia Classification. Futur. Gener. Comput. Syst. 2019, 97, 564–577. [Google Scholar] [CrossRef]
  16. Dev Sharma, L.; Sunkaria, R.K.; Kumar, A. Bundle Branch Block Detection Using Statistical Features of QRS-Complex and k-Nearest Neighbors. In Proceedings of the 2017 Conference on Information and Communication Technology (CICT), Gwalior, India, 3–5 November 2017. [Google Scholar] [CrossRef]
  17. Sahoo, S.; Kanungo, B.; Behera, S.; Sabut, S. Multiresolution Wavelet Transform Based Feature Extraction and ECG Classification to Detect Cardiac Abnormalities. Measurement 2017, 108, 55–66. [Google Scholar] [CrossRef]
  18. Ceylan, R.; Özbay, Y. Wavelet Neural Network for Classification of Bundle Branch Blocks. In Proceedings of the World Congress on Engineering 2011, London, UK, 6–8 July 2011; pp. 1003–1007. [Google Scholar]
  19. Martín-Yebra, A.; Martínez, J.P. Automatic Diagnosis of Strict Left Bundle Branch Block Using a Wavelet-Based Approach. PLoS ONE 2019, 14, e0212971. [Google Scholar] [CrossRef]
  20. Faziludeen, S.; Sabiq, P.V. ECG Beat Classification Using Wavelets and SVM. In Proceedings of the 2013 IEEE Conference on Information & Communication Technologies ICT, Thuckalay, India, 11–12 April 2013; pp. 815–818. [Google Scholar] [CrossRef]
  21. Alqudah, A.M.; Albadarneh, A.; Abu-Qasmieh, I.; Alquran, H. Developing of Robust and High Accurate ECG Beat Classification by Combining Gaussian Mixtures and Wavelets Features. Australas. Phys. Eng. Sci. Med. 2019, 42, 149–157. [Google Scholar] [CrossRef]
  22. Rai, H.M.; Chatterjee, K. A Novel Adaptive Feature Extraction for Detection of Cardiac Arrhythmias Using Hybrid Technique MRDWT & MPNN Classifier from ECG Big Data. Big Data Res. 2018, 12, 13–22. [Google Scholar] [CrossRef]
  23. Sangaiah, A.K.; Arumugam, M.; Bian, G. Bin An Intelligent Learning Approach for Improving ECG Signal Classification and Arrhythmia Analysis. Artif. Intell. Med. 2020, 103, 101788. [Google Scholar] [CrossRef]
  24. Engin, M. ECG Beat Classification Using Neuro-Fuzzy Network. Pattern Recognit. Lett. 2004, 25, 1715–1722. [Google Scholar] [CrossRef]
  25. Allami, R.; Stranieri, A.; Balasubramanian, V.; Jelinek, F.H. A Genetic Algorithm-Neural Network Wrapper Approach for Bundle Branch Block Detection. In Proceedings of the 2016 Computing in Cardiology Conference (CinC), Vancouver, BC, Canada, 11–14 September 2016; pp. 461–464. [Google Scholar]
  26. Qin, Q.; Li, J.; Yue, Y.; Liu, C. An Adaptive and Time-Efficient ECG R-Peak Detection Algorithm. J. Healthc. Eng. 2017, 2017, 5980541. [Google Scholar] [CrossRef]
  27. Karnan, H.; Sivakumaran, N.; Manivel, R. An Efficient Cardiac Arrhythmia Onset Detection Technique Using a Novel Feature Rank Score Algorithm. J. Med. Syst. 2019, 43, 167. [Google Scholar] [CrossRef]
  28. Singh, V.; Tewary, S.; Sardana, V.; Sardana, H.K. Arrhythmia Detection—A Machine Learning Based Comparative Analysis with MIT-BIH ECG Data. In Proceedings of the 2019 IEEE 5th International Conference for Convergence in Technology (I2CT), Bombay, India, 29–31 March 2019. [Google Scholar] [CrossRef]
  29. Torres-Alegre, S.; Fombellida, J.; Piñuela-Izquierdo, J.A.; Andina, D. AMSOM: Artificial Metaplasticity in SOM Neural Networks—Application to MIT-BIH Arrhythmias Database. Neural Comput. Appl. 2020, 32, 13213–13220. [Google Scholar] [CrossRef]
  30. Poungponsri, S.; Yu, X.H. An Adaptive Filtering Approach for Electrocardiogram (ECG) Signal Noise Reduction Using Neural Networks. Neurocomputing 2013, 117, 206–213. [Google Scholar] [CrossRef]
  31. Ali, H.H.S.M.; Sharif, S.M. Comparison Between Discrete Wavelet Transform and Maximal Overlap Discrete Wavelet Transform as an Analysis Tool for H.264/AVC Video. In Proceedings of the 2018 International Conference on Computer, Control, Electrical, and Electronics Engineering (ICCCEEE), Khartoum, Sudan, 12–14 August 2018. [Google Scholar] [CrossRef]
  32. Cornish, C.R.; Bretherton, C.S.; Percival, D.B. Maximal Overlap Wavelet Statistical Analysis With Application to Atmospheric Turbulence. Bound.-Layer Meteorol. 2006, 119, 339–374. [Google Scholar] [CrossRef]
  33. Percival, D.B.; Walden, A.T. Wavelet Methods for Time Series Analysis; Cambridge Series in Statistical and Probabilistic Mathematics; Cambridge University Press: Cambridge, UK, 2000; pp. 159–205. ISBN 9780511841040. [Google Scholar] [CrossRef]
  34. Percival, D.B.; Mofjeld, H.O. Analysis of Subtidal Coastal Sea Level Fluctuations Using Wavelets. J. Am. Stat. Assoc. 1997, 92, 868–880. [Google Scholar] [CrossRef]
  35. Wu, M.; Lu, Y.; Yang, W.; Wong, S.Y. A Study on Arrhythmia via ECG Signal Classification Using the Convolutional Neural Network. Front. Comput. Neurosci. 2021, 14, 564015. [Google Scholar] [CrossRef]
  36. Chen, T.M.; Huang, C.H.; Shih, E.S.C.; Hu, Y.F.; Hwang, M.J. Detection and Classification of Cardiac Arrhythmias by a Challenge-Best Deep Learning Neural Network Model. iScience 2020, 23, 100886. [Google Scholar] [CrossRef]
  37. Zhao, Z.; Zhang, Y. SQI Quality Evaluation Mechanism of Single-Lead ECG Signal Based on Simple Heuristic Fusion and Fuzzy Comprehensive Evaluation. Front. Physiol. 2018, 9, 727. [Google Scholar] [CrossRef]
  38. Xiang, J.; Maue, E.; Fan, Y.; Qi, L.; Mangano, F.T.; Greiner, H.; Tenney, J. Kurtosis and Skewness of High-Frequency Brain Signals Are Altered in Paediatric Epilepsy. Brain Commun. 2020, 2, fcaa036. [Google Scholar] [CrossRef]
  39. Al-Naami, B.; Fraihat, H.; Al-Nabulsi, J.; Gharaibeh, N.Y.; Visconti, P.; Al-Hinnawi, A.R. Assessment of Dual-Tree Complex Wavelet Transform to Improve SNR in Collaboration with Neuro-Fuzzy System for Heart-Sound Identification. Electronics 2022, 11, 938. [Google Scholar] [CrossRef]
  40. Jang, J.S.R. ANFIS: Adaptive-Network-Based Fuzzy Inference System. IEEE Trans. Syst. Man Cybern. 1993, 23, 665–685. [Google Scholar] [CrossRef]
Figure 1. Block diagram for the proposed method.
Computers 11 00093 g001
Figure 2. Processing steps for normal R-R interval (a), after notch filter (b), after BPF (c), and the segmented QRS complex (d).
Computers 11 00093 g002
Figure 3. Processing steps for the LBBB R-R interval (a), after notch filter (b), after BPF (c), and the segmented QRS complex (d).
Computers 11 00093 g003aComputers 11 00093 g003b
Figure 4. The raw ECG signal (a) was decomposed into the selected detail coefficients of D2 (b), D3 (c), and D4 (d).
Computers 11 00093 g004
Figure 5. Training results of ANFIS on 80% for LBBB and normal cases (a) while testing ANFIS on 20% in figure (b).
Computers 11 00093 g005
Figure 6. ANFIS output on 825 ECG beats test samples (Class 1 = LBBB, Class 2 = normal).
Computers 11 00093 g006
Table 1. Summary of literature examples on heartbeat types’ detection.
ResearchClassification MethodFeature ExtractionSource of Data SamplesSignal DurationResults
M. Engin,
[24]
F-HNNAR + DWT + 3rd Order CumulantRecords (102,106,118) from MIT-BIH dataset-99.6% Se
95.3% Sp
93.5% Acc
R. Ghorbani Afkhami et al.
[11]
DTRR interval + GMM + HOSAll classes in MIT-BIH dataset-100% Se
99.7% Acc
100% PPV
R. Allami et al.
[25]
ANN-GAGenetic algorithm/feature reductionLBBB, RBBB, and NOR records from the MIT-BIH dataset-98% Se, Sp and Acc
H. Karnan et al.
[27]
LS-SVMSignal DecompositionMIT-BIH dataset-96.42% Se
94.69% Sp
98.21% Acc
L. Dev Sharma et al. [16]KNNQRS complex features of mean, variance, stdev, skewness, and kurtosisLBBB, RBBB, and NOR records from the MIT-BIH dataset160 ms window of each beat98.48% Se
99.3% Sp
98.48% P+
93.5% Acc
V. Singh et al.
[28]
SVM/DT/RFNV/ANN (Comparative Study)3 different feature extraction methodsNormal, Paced, RBBB, LBBB, and PVC records from MIT-BIH dataset-ANN performed best with 99.59% Acc
S. Torres-Alegre et al. [29]AMSOM11 different features extractedNormal, PVC, RBBB, and LBBB records from the MIT-BIH dataset-98.84% Se
99.60% Sp
99.04% Acc
Se: sensitivity, Sp: specificity, Acc: accuracy, ANN: artificial neural network, KNN: K-Nearest Neighbor, GA: genetic algorithm, DT: decision tree, LS-SVM: least square—support vector machine, RF: Random Forest, NV: Naïve Bayes, AMSOM: Artificial Metaplasticity Self Organizing Maps, AR: autoregressive, DWT: Discrete Wavelet Transform, F-HNN: fuzzy-hybrid neural network.
Table 2. Extracted parameters.
ParametersAccuracy
Inputs extracted from QRS complex by MODWTD2, D3, and D4p < 0.05
D1, D5–D11p > 0.05
A11p > 0.05
Statistical parameters from QRS complexKurtosisp < 0.05
Skewnessp < 0.05
Table 3. Training and testing datasets (80–20%).
LBBB (Abnormal)Normal
Training2124 × 51176 × 5
Testing531 × 5294 × 5
Note: Each QRS signal has 5 extracted features (i.e., ×5).
Table 4. The training parameters of the ANFIS classifier.
NameFIS
TypeSugeno
And-MethodProd:
Or-MethodProbor
Defuzz-MethodWtaver (Weighted average of all rule outputs)
Imp-MethodProd
Agg-MethodSum
Inputs5
Outputs1 (Normal or LBBB)
Rules5
Epoch200
Ranges of influence0.2
Table 5. Obtained performance on the testing dataset.
PNSensitivitySpecificityAccuracyF-Score
T53029499.811%100%99.878%99.905
F01
Table 6. The closed examples, in terms of obtained performance, from literature performed on the MIT-BIH database.
ResearchClassification
Method
Feature
Extraction
Source of Data SamplesSignal DurationResults
R. Allami et al. [25]ANNGenetic algorithm/feature reductionLBBB, RBBB, and NOR records from the MIT-BIH datasetEntire ECG beat98% Se, Sp, and Acc
L. Dev Sharma et al. [16]KNNQRS complex features of mean, variance, stdev, skewness, and kurtosisLBBB, RBBB, and NOR records from MIT-BIH dataset160 ms QRS complex window98.48% Se
99.3% Sp
98.48% P+
93.5% Acc
S. Torres-Alegre et al. [29]AMSOM11 different features were extractedNormal, PVC, RBBB, and LBBB records from MIT-BIH datasetEntire ECG beat98.84% Se
99.60% Sp
99.04% Acc
Our WorkANFISD2, D3, D4, Skewness, KurtosisNormal and LBBB records from the MIT-BIH dataset180 ms QRS complex window99.81% Se
100% Sp
99.87% Acc
Publisher’s Note: MDPI stays neutral with regard to jurisdictional claims in published maps and institutional affiliations.

