
Assisting Educational Analytics with AutoML Functionalities


1
Department of Computer Engineering and Informatics, University of Patras, 26331 Patras, Greece
2
Department of Informatics, Ionian University, 49100 Corfu, Greece
3
Department of Management Science and Technology, University of Patras, 26331 Patras, Greece
*
Author to whom correspondence should be addressed.
Computers 2022, 11(6), 97; https://0-doi-org.brum.beds.ac.uk/10.3390/computers11060097
Submission received: 31 May 2022
/
Revised: 11 June 2022
/
Accepted: 13 June 2022
/
Published: 15 June 2022
(This article belongs to the Special Issue Social and Semantic Models, Tools and Applications in Science and Technology)
Abstract
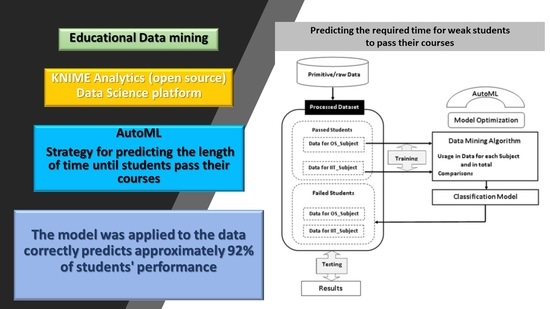
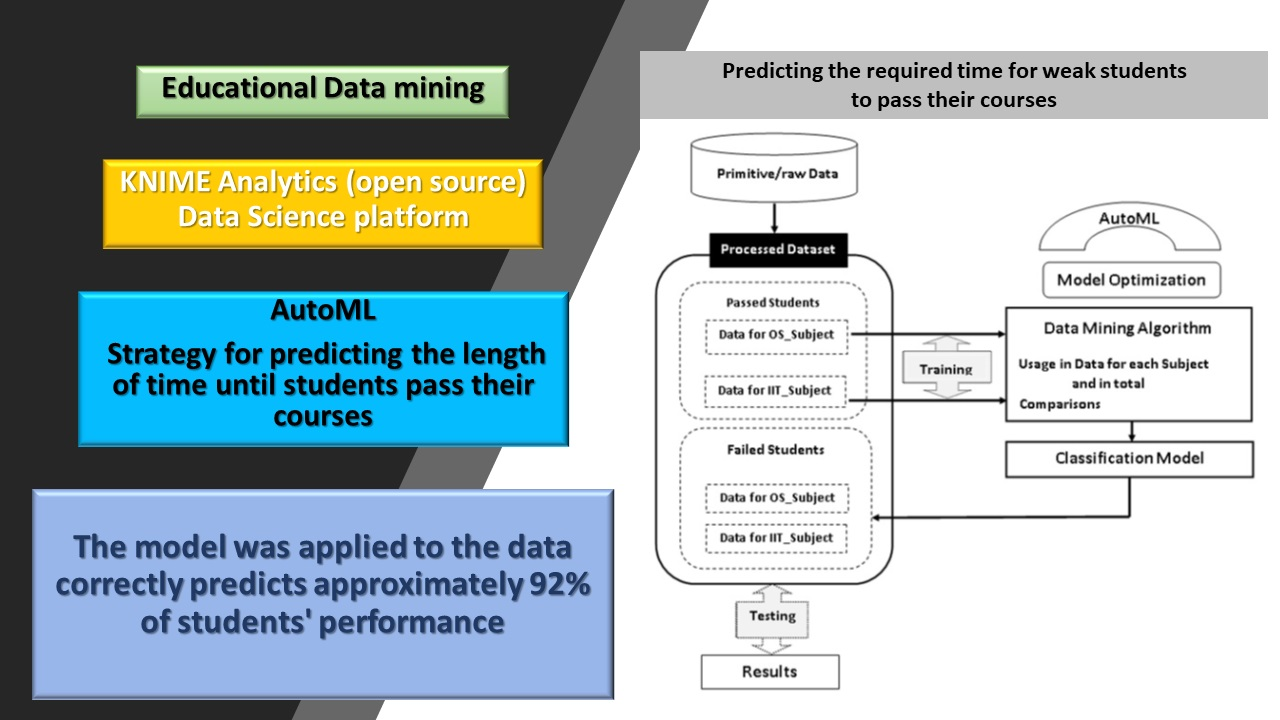
:The plethora of changes that have taken place in policy formulations on higher education in recent years in Greece has led to unification, the abolition of departments or technological educational institutions (TEI) and mergers at universities. As a result, many students are required to complete their studies in departments of the abolished TEI. Dropout or a delay in graduation is a significant problem that results from newly joined students at the university, in addition to the provision of studies. There are various reasons for this, with student performance during studies being one of the major contributing factors. This study was aimed at predicting the time required for weak students to pass their courses so as to allow the university to develop strategic programs that will help them improve performance and graduate in time. This paper presents various components of educational data mining incorporating a new state-of-the-art strategy, called AutoML, which is used to find the best models and parameters and is capable of predicting the length of time required for students to pass their courses using their past course performance and academic information. A dataset of 23,687 “Computer Networking” module students was used to train and evaluate the classification of a model developed in the KNIME Analytics (open source) data science platform. The accuracy of the model was measured using well-known evaluation criteria, such as precision, recall, and F-measure. The model was applied to data related to three basic courses and correctly predicted approximately 92% of students’ performance and, specifically, students who are likely to drop out or experience a delay before graduating.
1. Introduction
Educational data mining (EDM) is an innovative emerging scientific field concerned with analyzing and studying data from educational databases to predict student performance and provide services to improve the instructional process [1]. Research efforts for educational data mining, described in extensive literature reviews, such as Romero and Ventura [2] or Baker and Yacef [3], have focused mainly on the management of academic needs related to human resources (students, graduates, part-time instructors, and staff), aiming to improve the quality, efficiency, and reputation of universities.
The literature that supports the problem statement of this study consists of the following papers.
Student performance was analyzed from data collected for two years’ intake that contained students’ previous academic records by applying the classification technique for the prediction in the Rapid Miner tool [4]. In accordance with another study, a fuzzy C-means clustering algorithm using 2D and 3D clustering to evaluate student performance based on their examination results can help educators to better understand student performance so as to build a pedagogical basis for decisions [5]. A study investigated the effectiveness of transfer learning from deep neural networks for the task of student performance prediction in higher education [6]. In another work, researchers introduced Deep Online Performance Evaluation (DOPE), which first models the student course relations in an online system and then utilizes an advanced deep neural network architecture to extract course and student embeddings while predicting a student’s performance in a given course [7].
Predictive analytics may have the potential to support the broader science of learning and guide pedagogical practices in learning and instruction. A lot of studies have been carried out that revealed the efficiency of methods for the accurate prediction of students at risk of failure, such as (a) fuzzy-based active learning methods for predicting students’ academic performance, which combines, in a modular way, AutoML (Automated Machine Learning Algorithms) practices [8]; (b) semi-supervised classification tasks for student performance or student dropout prediction [9]; and (c) the comparison of the co-training method with semi-supervised and supervised methods [10].
This paper focuses on the processing, manipulation, and analysis of educational data and the extraction of information related to shortening the graduation time of students who are forced to complete their studies in departments of the abolished TEI, a situation that is quite rare. The use of the above results led to the production of a prediction model by taking into account recent papers that are related to our research aim and are referenced in this paper. The contribution of the present work can assist the administrations of universities in reformulating the educational strategy regarding the budget, scheduling, teaching, and learning strategies.
The changes and reforms that have taken place during the last years in higher education in Greece have led to the abolition of technological educational institutes (TEI), resulting in many departments being abolished or merged and joined at universities. A significant problem in TEI, mainly the peripherals, was the low grade for entrance and the poor results of students after admission. Due to a low cognitive background for several students, it takes them additional years to graduate, with some dropping out. Dropouts and delayed graduation are significant problems that were produced by the newly joined students of TEI at the university, in addition to the provision of studies. There are various reasons for this, and student performance during studies is one of the major contributing factors.
In our case, the former TEI departments of “Business administration” (BA), “Applied informatics in management and economy” (AIME), and “Management of social cooperative business and organizations” (MSCBO) were merged and integrated into the department of “Management science and technology” (MST) of the University of Patras (Greece). As a result, the students of the abolished ΤΕΙ departments are required to complete their academic obligations, although many of them have completed the typical cycle of studies (eight semesters) that leads to a bachelor’s degree. These obligations concern the courses that they have failed in previous semesters, which do not have compulsory attendance, and the elaboration of dissertations. Since the abolition of TEI departments, the trend that has prevailed in the university towards TEI students who have not completed their studies is to grade them with leniency, since the goal is the acceleration of their graduation. In this study, the possibility of predicting the time required for successful students to pass their courses was explored.
The main aim was to develop a model based on data mining in education that is capable of predicting the time required for students to pass two basic courses of the curriculum. The model was developed through the combination of two variables, taking values from two datasets, respectively: (a) the scores of students who have passed these two courses (separately or both) and (b) the number of attempts that they made to pass courses [11]. The first variable was chosen based on similar studies [12,13], which used the GPA instead of student scores for each examination process. The reason for this differentiation was to exploit all available information on student scores. Subsequently, the feasibility of adopting the model to generalize the conclusion was explored by using other courses in the curriculum.
In this study, the possibility of predicting the time required for successful students to pass their courses was explored. The findings of the present work can be summarized as follows: the model can (a) assist the management of universities in improving the yearly educational strategy, budget, and scheduling by “knowing” in advance the needs of teaching staff, teaching hours, extra course instructors of universities, and costs for student residence (accommodation and feeding) and (b) cause teachers to dialogue about teaching and learning strategies to implement, increasing the motivation of indifferent students to learn.
For this research, two common courses in the three TEI departments’ curriculums were selected: the “Introduction Information Technology” (ΙΙΤ) course in the first semester and the “Operating Systems” (OS) course in the fourth semester, which are both compulsory. An anonymized dataset of 23,687 students (active and graduated) of all enrolled students in the three TEI departments from their inception until recently, namely, the period from 1999 to 2020, was collected.
2. Literature Review
The algorithms and techniques for the analysis, data processing, and prediction of results used by EDM are as follows:
(a) Statistics and visualization
An illustrative example is the research that assessed the role of student gender on success rates of educational completion in Australia [14] or the study that analyzed how the LiMS “event capture model” collects detailed real-time data on learner behavior in self-directed online learning environments and interprets these data by drawing on behavioral research [15]. Other research showed open-source educational platforms that process enhanced usage analytics from a shared Amazon Web Services (AWS) account [16] or chronicled recent EDM advances and processed the content of the review based on the outcomes produced by a data mining (DM) approach [17].
(b) Classification
According to Timbal [18], a decision tree was used to forecast who among enrolled students would be a dropout based on an intelligent predictive model. As predicting student failure is an important task, the research predicted the students who would not complete their assignment tasks using real data collected by their university’s educational platform based on appropriate algorithms [19]. Another study included a comprehensive analysis and comparison of state-of-the-art supervised machine learning techniques applied for solving the task of predicting students’ final exam scores, with artificial neural networks obtaining the highest precision [20]
(c) Clustering
Inspired by previous attempts, some researchers established the clustering approach as a practical guideline to explore student categories and characteristics, using an example of a real dataset to illustrate analytical procedures and results [4,21]. The purpose of another study was to support the procedure for the acquisition of scientific skills by offering researchers learning analytics in each stage of the investigative process based on the actions and interactions that EDM supervisors implemented during this investigative process [22].
(d) Association rules
A paper investigated the association rules using educational data and various clustering and classification methods to compare them and determine the suitable one for the dataset [23]. In another project, students’ data were analyzed with the data mining technique using the Apriori algorithm, and the output data from the data mining technique were presented visually [24], while other researchers applied a decision tree using the course grades and job data of graduated students to predict their jobs after graduation [25].
(e) Sequential pattern
A study used a range of machine learning techniques with aggregated and sequential representations of student behavior in a Massive Open Online Course (MOOC) to predict their readiness for assessment tasks. Additionally, sequential pattern mining to investigate which sequences of behavior differed between high or low levels of performance in the assessments was applied [26], and in a similar study, researchers employed a sequential pattern mining algorithm, Sequential Pattern Discovery using Equivalence classes (cSPADE), on gathered log data to explore whether differences exist between learners who viewed the SRL-prompt videos and those who did not [27]. Another study developed a theoretical method of sequential pattern mining specialized for learning histories in a programming exercise [28].
(f) Text mining
One paper explored the question of how the analysis and visualization of cognitive information can be supported by automatic mechanisms, and its effect in the classroom was researched [29], while an overview of the current status of the educational text mining field was analyzed in another work [30]. A predictive system for learners’ cognitive engagement based on their online discussion forums was proposed in a study. First, the ontology OWL and the LSA method were used to perform a semantic classification system of the threads according to a specific context, and then text mining, as a predictive method, was applied to the classified threads and learners’ participation in the forums [23,31].
(g) Correlation analysis
Some researchers examined the learning behaviors and characteristics of students in a mobile application computer programming class that adopted a “flipped” learning style [20,32].
(h) Neural network
Neural networks and deep learning were applied for the prediction of employee behavior in terms of punctuality at the workplace in a research work [33]. A university’s goal is to improve education quality. One way to improve such quality is by predicting student performance and applying early interventions, aiming to improve teaching quality and, consequently, student performance. The vast, growing availability of data in the educational environment has enabled many researchers to exploit various data mining algorithms to extract hidden knowledge and useful insights. The most widely used software tools in EDM for this purpose are listed below:
KNIME is a software tool that can help a university department to predict and observe student performance to prevent drawbacks and failures in the results of students in the future [34], and it can help agencies and students see early graduation predictions and help managers to see the progress and predictions of active student graduation [35].
WEKA is used by researchers for predicting poor student performance that might lead to dropout or a delay in graduation so as to allow the institution to develop strategic programs that will help improve student performance and enable the student to graduate in time without any problems [12], as well as for revealing the high potential of data mining applications for university management [36].
Rapid Miner is used to compare naive Bayes, decision tree, and k-nearest neighbor algorithms and implement feature selection and parameter optimization to identify which combination of algorithms and optimization can achieve the highest accuracy in predicting student grades [37].
Dataiku is a platform for Artificial Intelligence (AI), systemizing the use of data for exceptional business results [38].
Orange software was used in a study to identify the relationship between the admission criteria scores and the graduation grades and to examine the influence of ethnicity using the geopolitical zone of origin of the student on the predictive accuracy of the models developed [39].
D3js is a JavaScript library for manipulating documents based on data. D3 supports data analysis using HTML, SVG, and CSS [40].
KEEL (Knowledge Extraction based on Evolutionary Learning) is a research and educational software tool to assess evolutionary algorithms for data mining problems of various kinds, including regression, classification, unsupervised learning, etc. It includes evolutionary learning algorithms, as well as the integration of evolutionary learning techniques with different preprocessing techniques [41].
SPMF is an open-source data mining library specialized in pattern mining. It has been used in a wide range of domains, from authorship attribution to restaurant recommendation, and it has been integrated into several data analysis software programs [42].
Python is a high-level programming language suitable for EDM researchers who are investigating the prediction of student performance and proposes methods to help the teacher as well as the student to enhance the quality of learning [43].
Rattle (which uses R statistics programming language) is suitable for the selection of an educational data mining model, such as in a study that dealt with individual differences in performance between female and male candidates in an examination process of the university [44].
SPSS (Statistical Package for the Social Sciences) is a widely used software package that helps researchers in many projects related to data mining [45].
Wongkhamdi and Seresangtakul [46] studied the effectiveness of artificial neural networks in forecasting graduate student outcomes, proving that artificial neural networks are able to significantly improve student graduation outcome predictions with 93.3% accuracy compared to a discriminant analysis with 81.5%. The dataset of this study was analyzed by using the KNIME software application as the analysis platform. KNIME is a free and open-source data analytics, reporting, and integration platform that integrates various components for machine learning and data mining. It is a user-friendly tool that is suitable for data preprocessing, modeling, and visualization and aims to make data science approachable to everyone [47].
3. Methodology: Research Model
3.1. Data Acquisition and Preprocessing
For this study, a student dataset for the academic years from 1999 to 2020 was obtained through the department of networking and system security at the University of Patras according to the necessary legal procedures, adhering to all protocols concerning the protection of personal data of students and teachers. The research was performed in accordance with the General Data Protection Regulation (GDPR) (EU). The dataset consisted of 23,687 student records (anonymous and encrypted data) with 8 features in total, including the students’ grades achieved in two courses. These grades were given by a professor, who was the only one who had taught these courses within the above-referenced period of 20 years. This fact demonstrates the objectivity of the evaluation results.
More specifically, the courses that were chosen from the curriculum were IIT and OS, which are both compulsory and are taken in the 1st and 4th semesters of study, respectively. These are common in the curriculums for each version and for the three merged departments (AIME, BA, and MSCBO) and are examined at the end of each semester (January and June), sometimes repeated two times, and once in September. Student performance is evaluated on a scale from 0.0 to 10.0, where 0.0 indicates a student’s non-participation in the examination process.
The academic data were carefully reviewed, preprocessed, and organized in an MS-Excel flat file suitable for workflow import into KNIME software. Students’ personal data, information about their place of residence, and incomplete and irrelevant data, such as data for students who dropped out of their studies, were eliminated. Upon preprocessing, the dataset comprised 23,687 records of computer-networked student information, while the variables were defined as: (a) “Subject”, “Curriculum Year”, “Exam_Semester”, “Department”, and “Student_status” as nominal variables and (b) “Grade” and “Exam_Year” as numeric variables.
A new categorical target variable, “Evaluation Score”, was constructed based on the grades achieved by the students during their studies. The predicted variable has four distinct values, corresponding to the four ranges into which the students are classified—Poor, Fail, Pass, and Excellent. Student grades in each course separately or a grade point average under 3.5 are classified as Poor, and they will need strong intervention; students with grades between 3.5 and 5.0 are classified as Fail, and they need less support or none at all; students with grades between 5.0 and 8.0 are classified as Pass, while students with a grade point average above 8.0 are classified as Excellent. It makes sense that student performance increases progressively when they are examined multiple times under the same conditions (professor; course requirements). The opposite occurs when students are indifferent and will possibly drop out, as well as when they do not participate in final exams and are systematically absent. Since the objective is to predict the length of time required for students to pass the two courses and potentially graduate as soon as possible, the counting of presences and absences in exams is quite important. In correlation with the values of the variable “Evaluation Score”, the total number of absences per student will possibly reinforce a conclusion related to the amount of student interest or indifference in completing their studies. The data mining model satisfaction needs a new variable (Attempts) that represents the number of attempts that the students made to pass the courses.
The final dataset for the study contained 23,687 instances and 10 attributes (including the predicted class variables); 6 of them are numeric variables, and the remaining 5 attributes are nominal variables with a certain number of distinct values, as shown in Table 1.
The KNIME data analytics tool was used for the implementation of this study. The processed dataset of student performance in the two courses was imported from an Excel spreadsheet into a file reader that reads the file and builds a workflow, which produced the obtained results.
3.2. Exploratory Data Analysis
Exploratory data analysis (EDA) was used to analyze and investigate the datasets and summarize their main characteristics by employing data visualization methods. It helped to determine how to best manipulate data sources, making it easier to discover patterns and spot anomalies.
Through EDA, a check was performed to better understand the role of variables (e.g., student scores and number of attempts) and the relationships between them, helping to determine whether the statistical techniques examined for data analysis were appropriate.
The statistical data analyses, utilizing data mining through KNIME software capabilities, are described below.
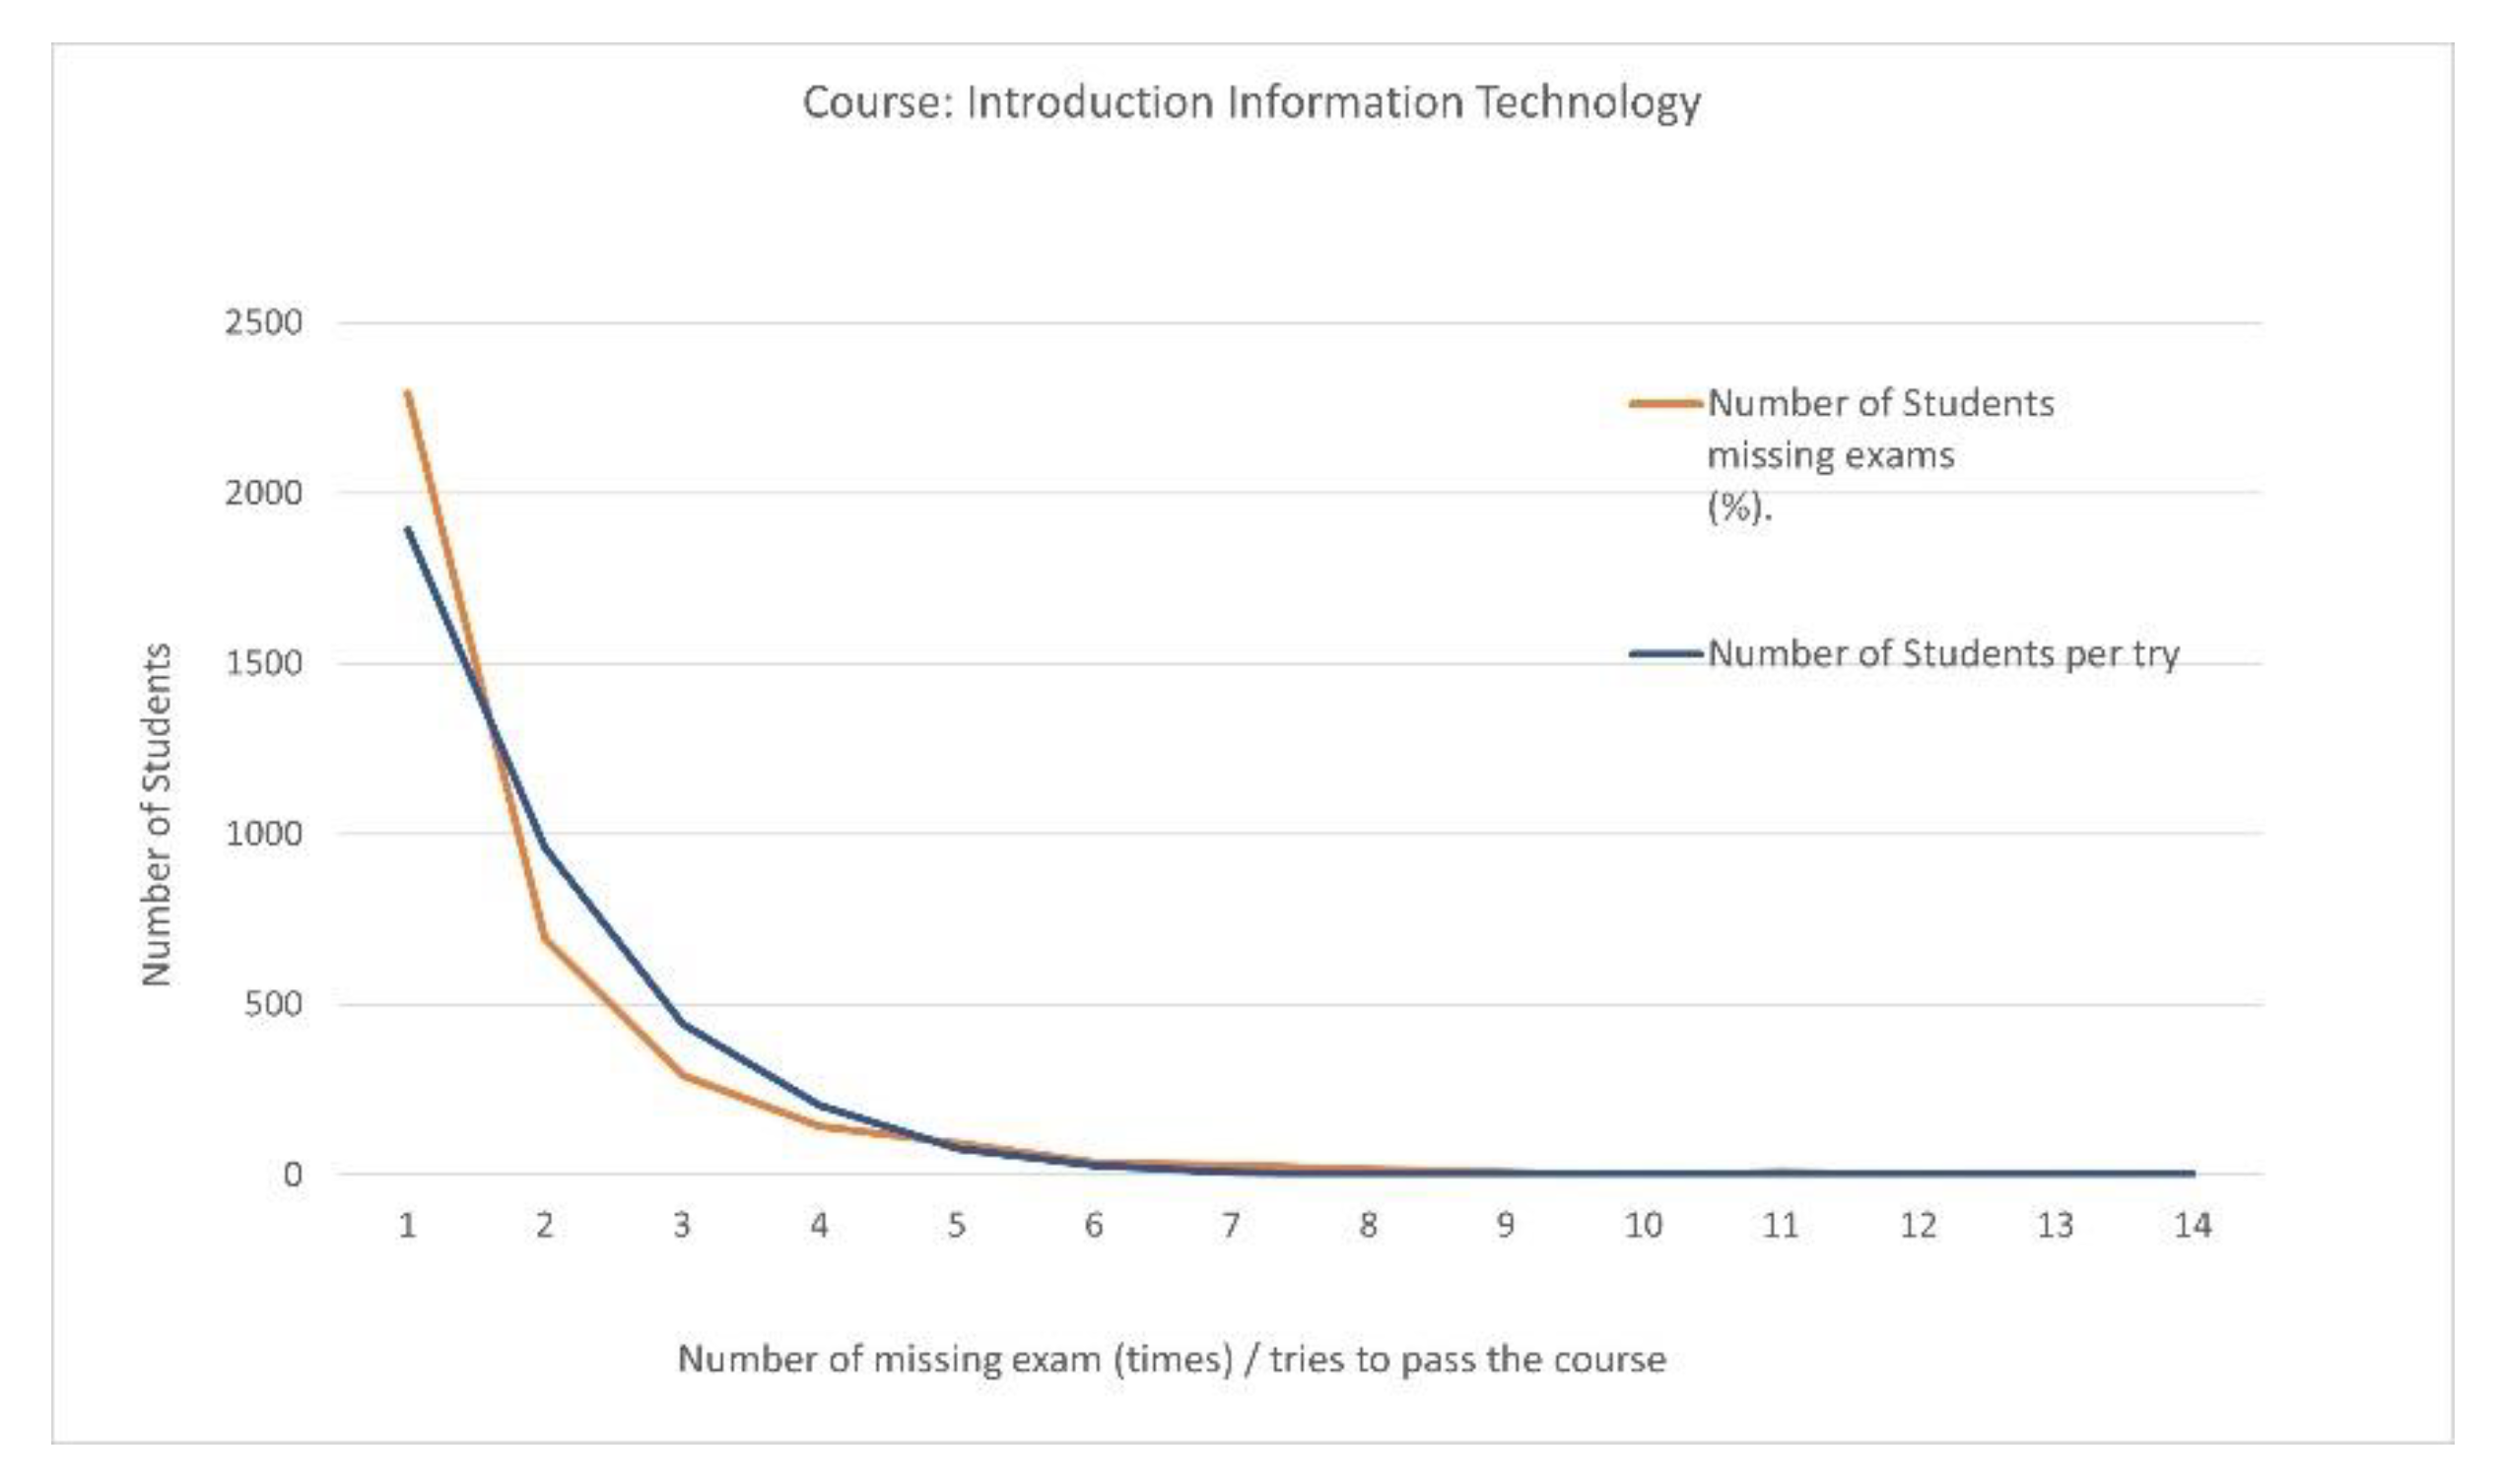
Course title: “Introduction Information Technology”
Of the 3613 passing students, 2291 (63.409%) participated in all scheduled semester examination processes without any omissions, and 693 (19.181%) missed one.
The number of students who missed exams in the IIT course and the number of attempts to pass are shown for each category in Table 2.
The correlation coefficient value (0.97833) between the number of students who did not participate in exams and the number of attempts until students passed the IIT course reveals that the strength of the relationship is quite strong (Scheme 1).
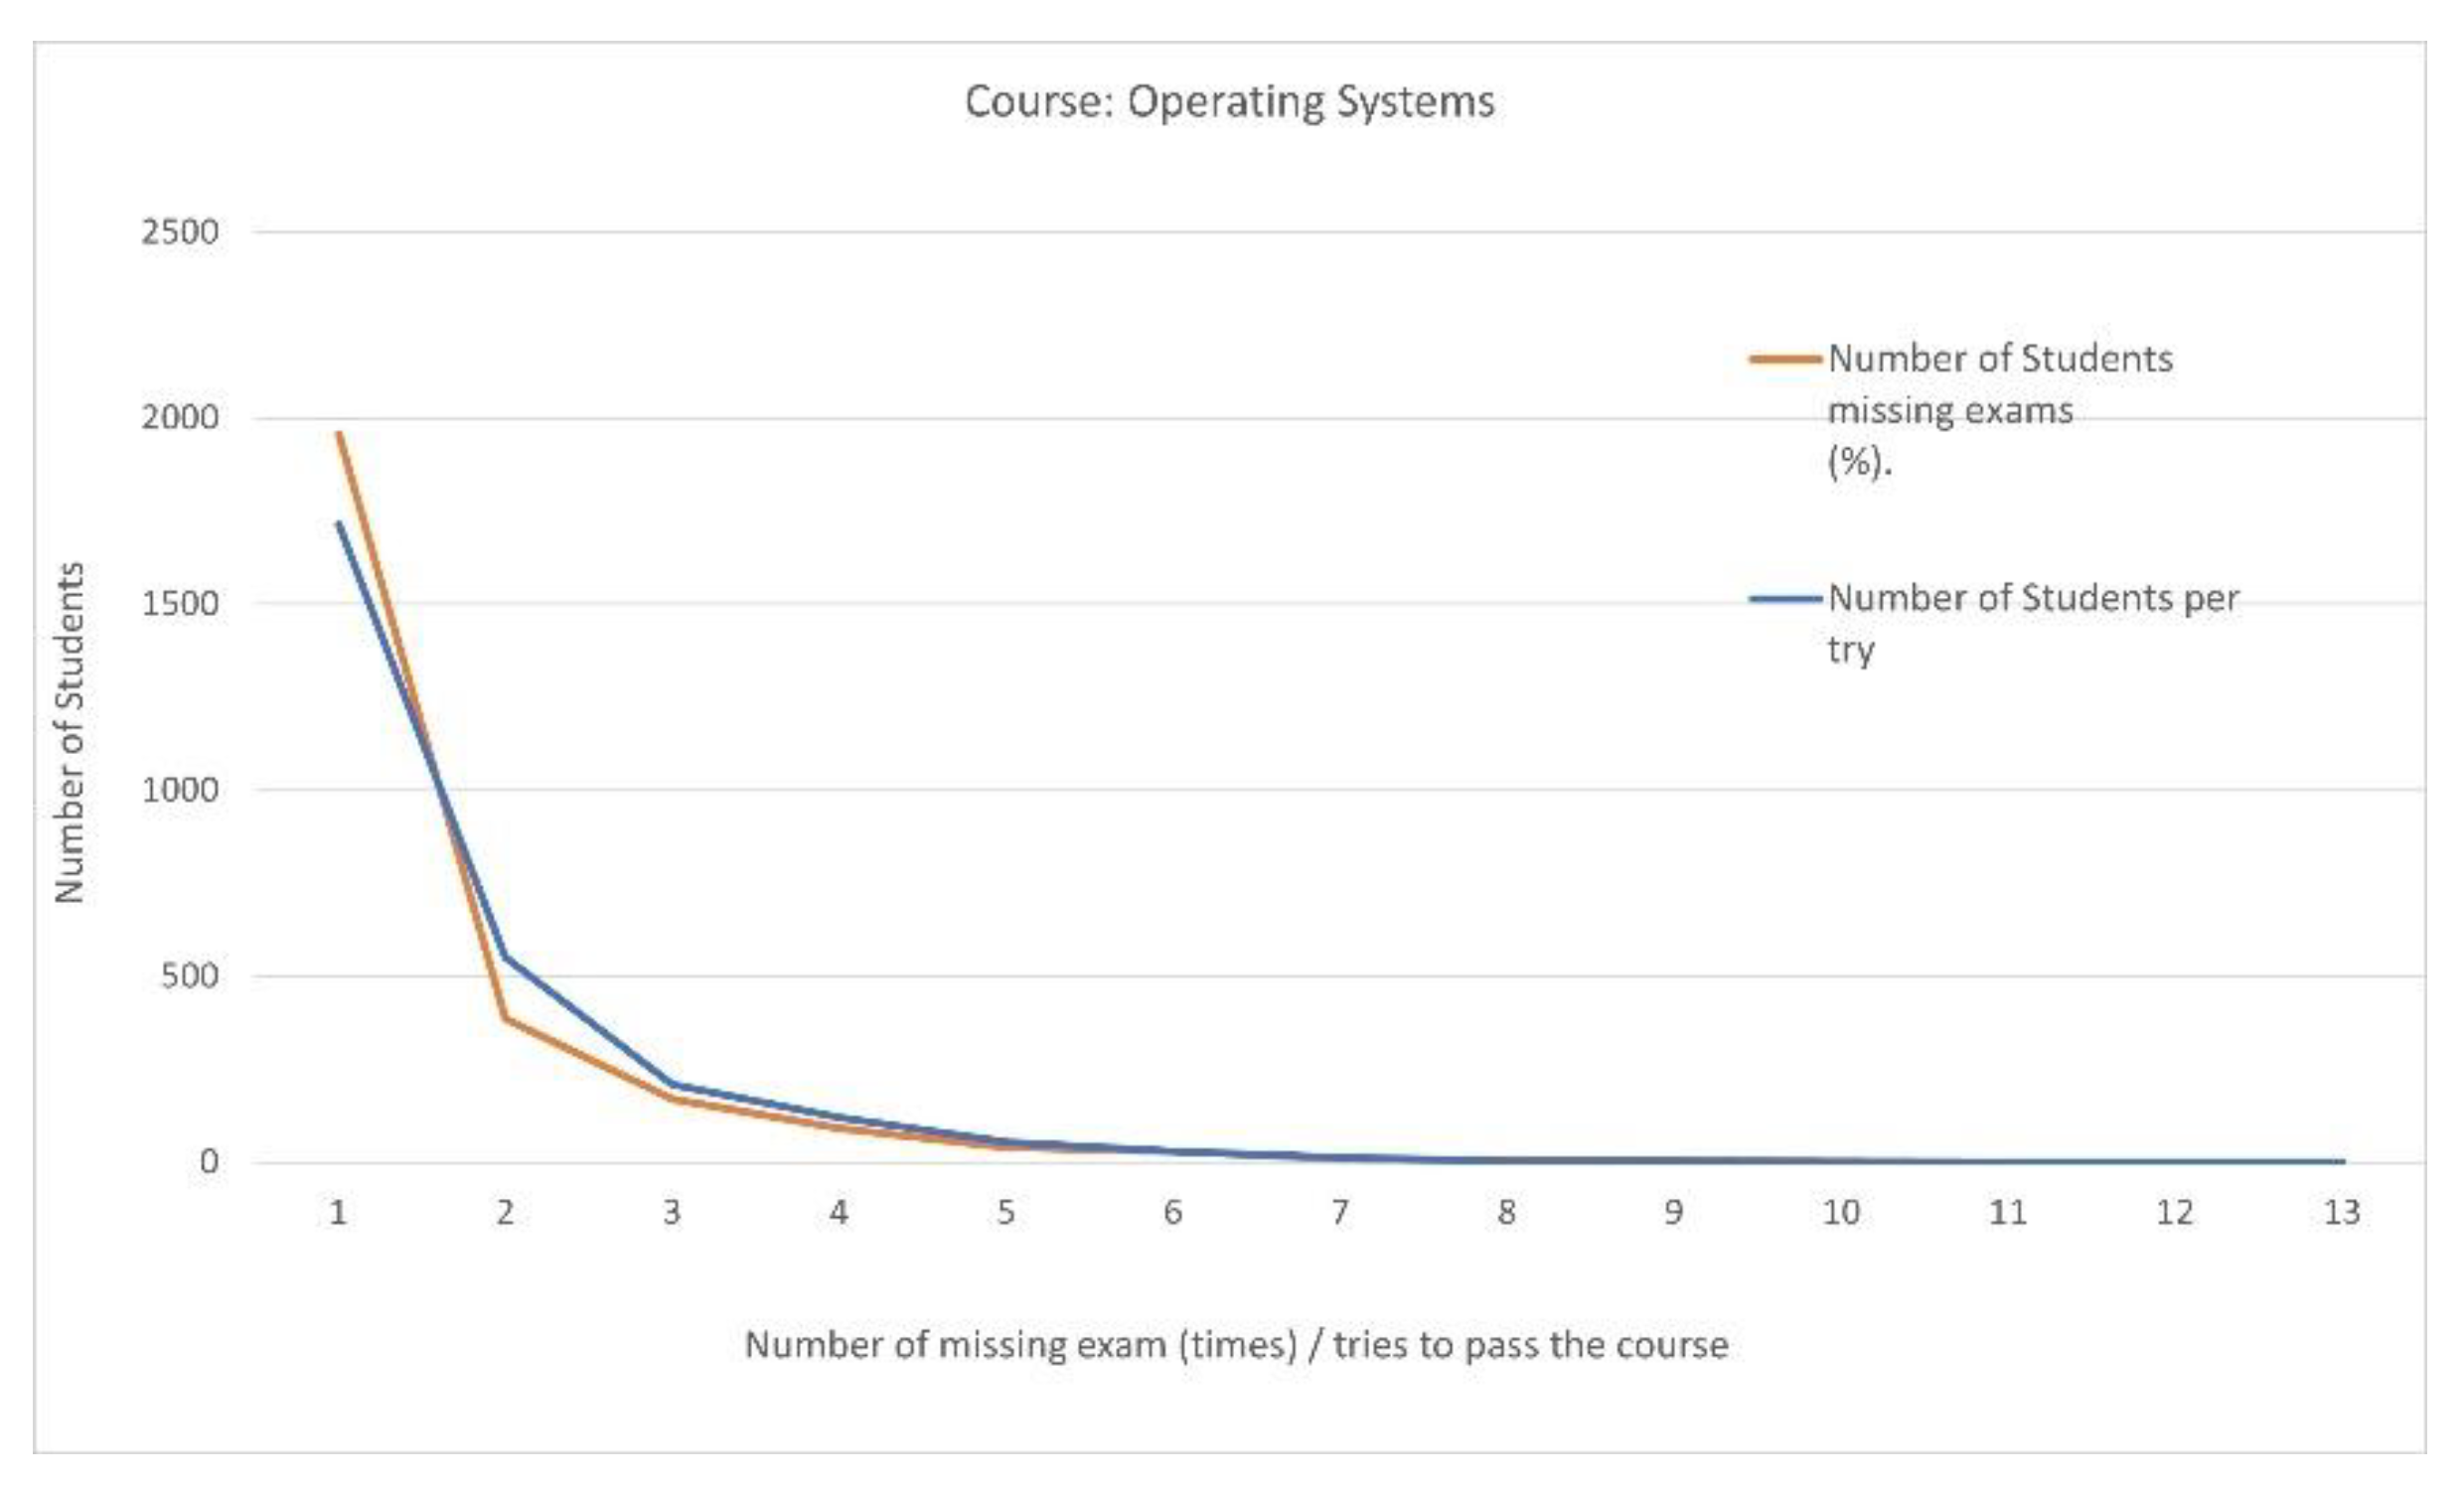
Course title: “Operating Systems”
Of the 2695 passing students, 1956 (72.579%) participated in all scheduled semester examination processes without any omissions, and 385 (14.286%) missed one.
The number of students who missed exams in the OS course and the number of attempts to pass are shown for each category in Table 3.
The correlation coefficient value (0. 992304) between the number of students who did not participate in the exams and the number of attempts until students passed the OS course reveals that the strength of the relationship is quite strong (Scheme 2).
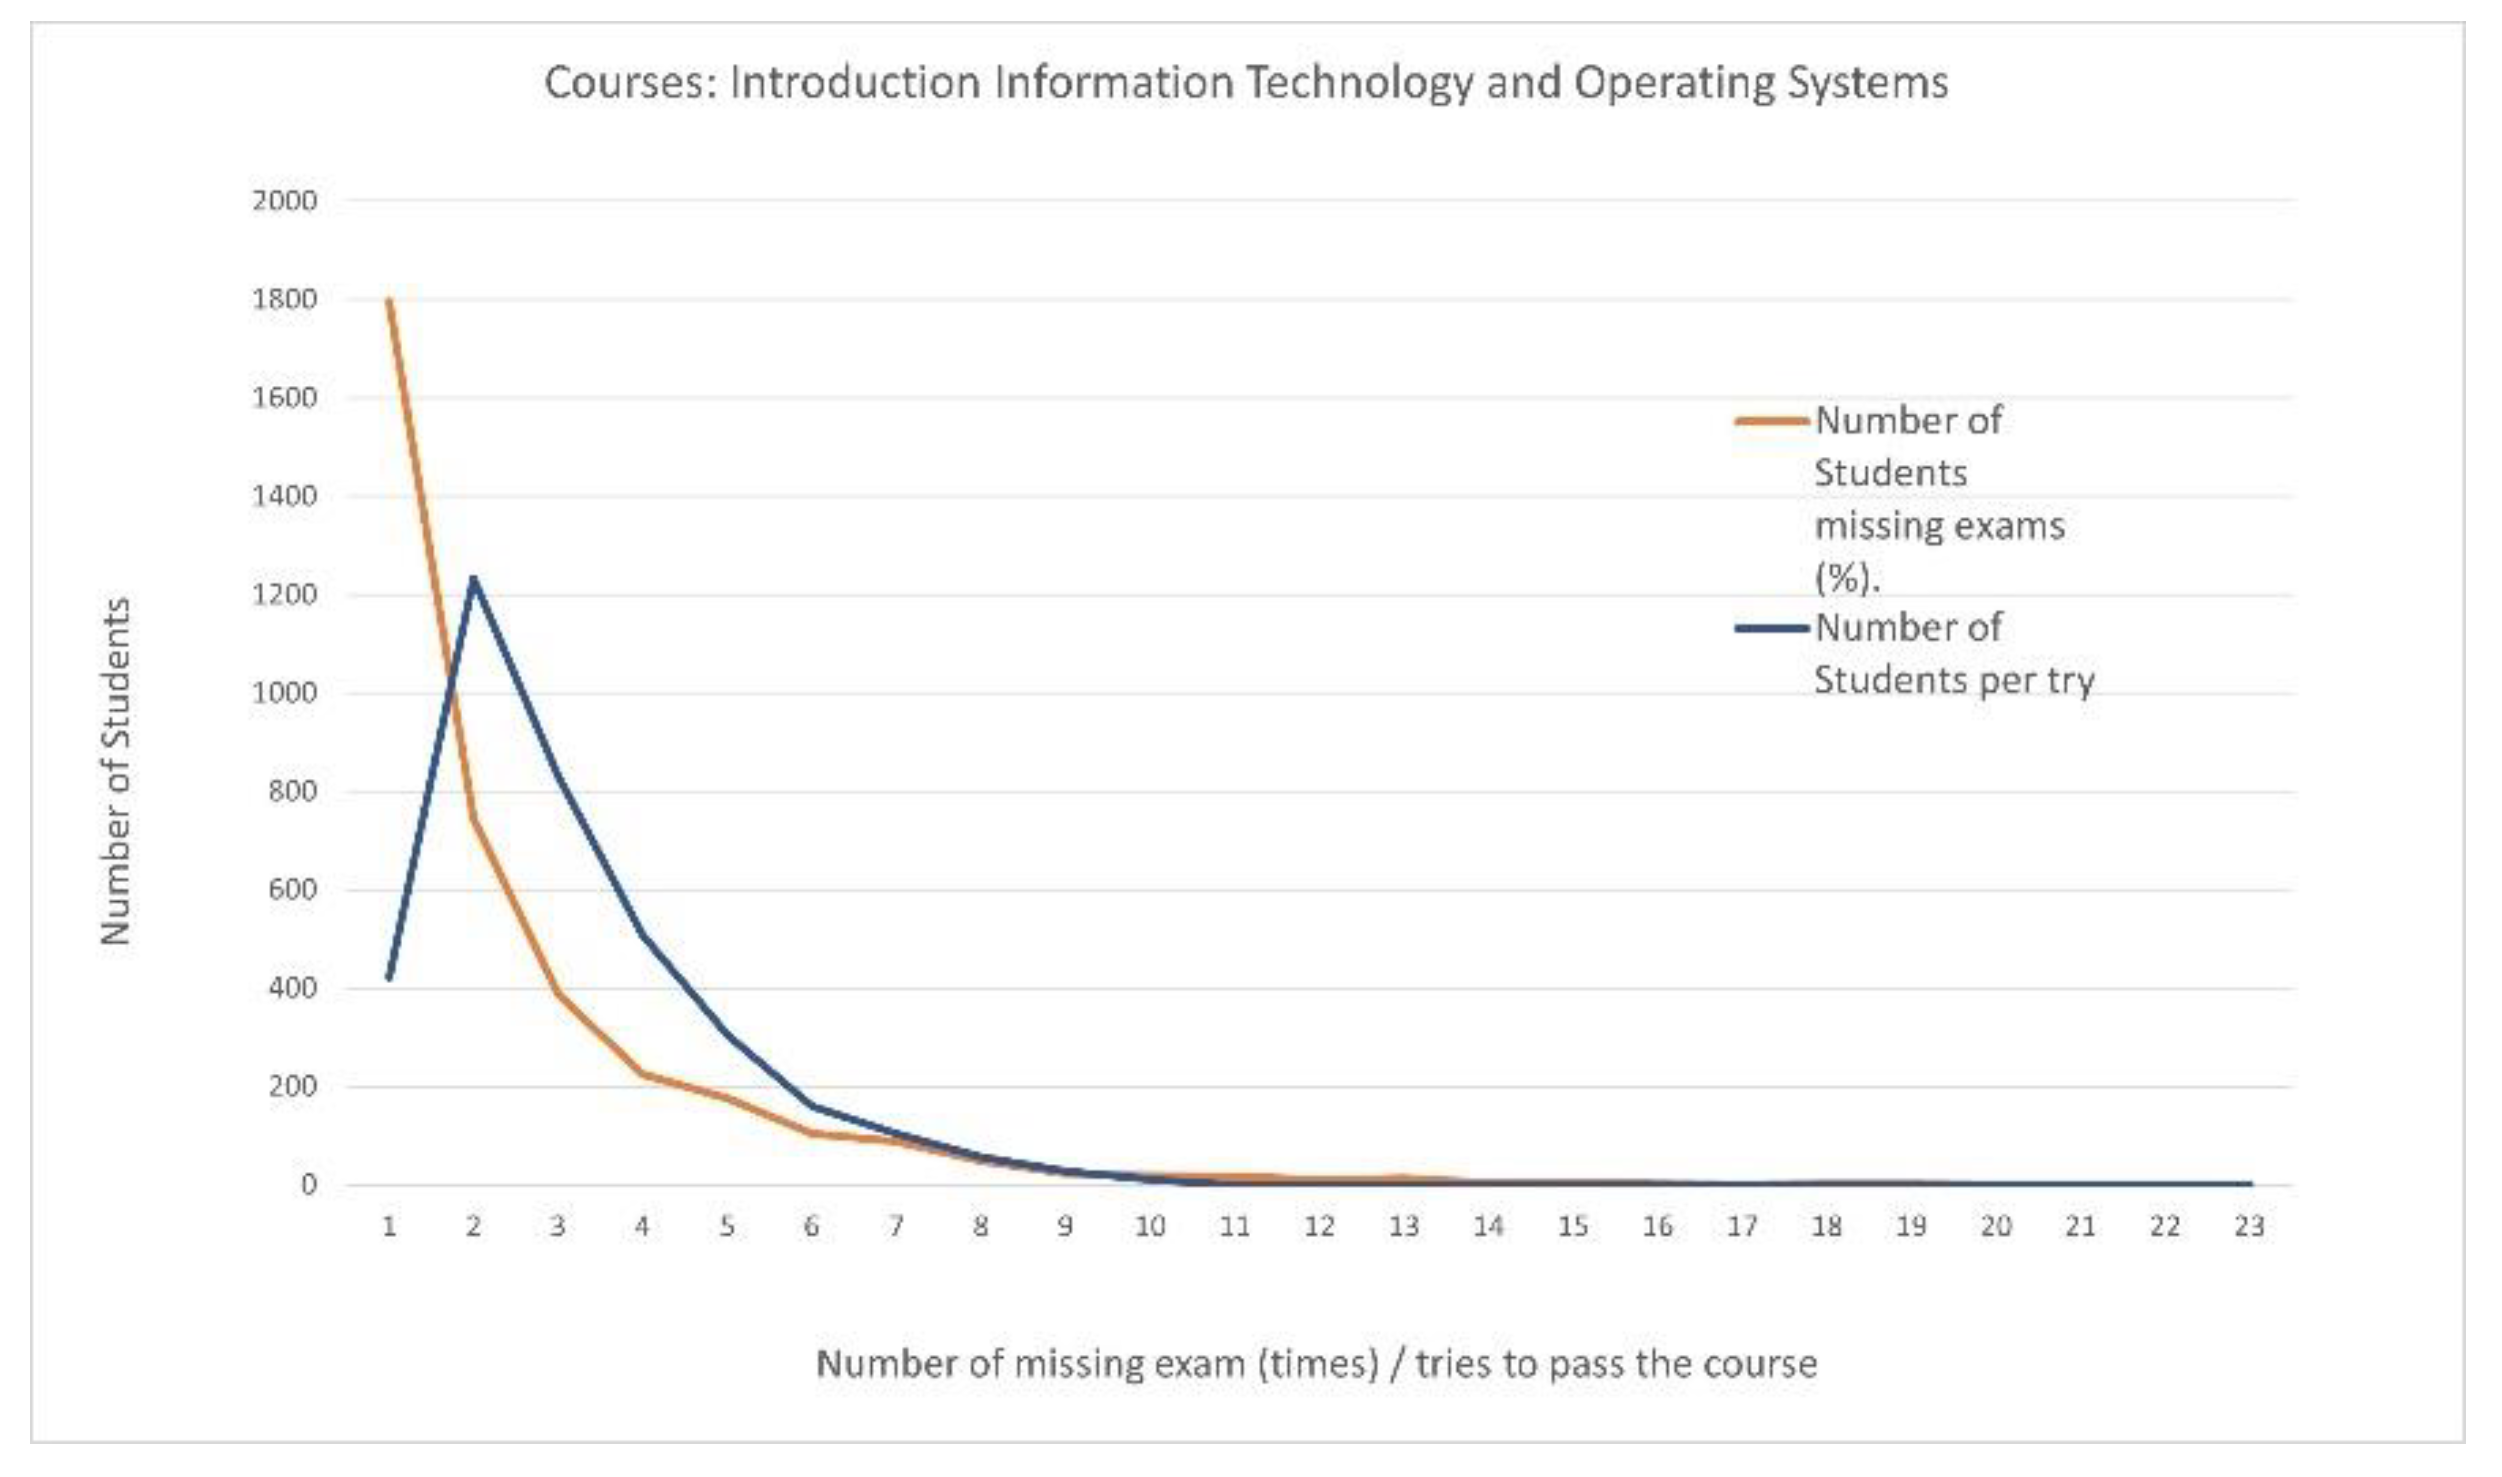
Courses: “Introduction Information Technology” and “Operating Systems”
Of the 3678 passing students, 1797 (48.858%) participated in all scheduled semester examination processes without any omissions, and 744 (20.228%) missed one.
The number of students who missed exams in both the IIT and OS courses and the number of attempts to pass are shown in Table 4.
The correlation coefficient value (0.992304) between the number of students who did not participate in exams and the number of attempts until students passed both the IIT and OS courses reveals that the strength of the relationship is quite strong (Scheme 3).
The highest percentage of students who participated in the exams passed each course (separately) on the first or second try (Table 1 and Table 2). Looking at the two courses (Table 3), the percentage of students who passed on the first try decreased significantly, and students needed many more attempts to pass both courses, which were distributed nearly equally within the range of 1 to 7 attempts. In this case, the highest percentage is shown for two attempts (33.5%), while the value of the correlation between student participation in exams (interest) and the number of attempts to pass their courses (effectiveness) weakens.
The great indifference of many students to participate in exams is noteworthy: 80.7% of students who failed both courses did not participate in the exams at all, while the corresponding percentages for each course are 51.2% in OS and 80.19% in IIT.
The findings of data mining through KNIME software capabilities are presented in the Appendix A.
It is crucial that the university or at least the educators involved start discussions to comprehend common problems and solutions, with particular attention to teaching strategies enabling the promotion of student motivation and increasing student participation in exams.
In this work, we did not consider information on study methodologies or the time that students dedicated to studying in each course. In future work, it will be interesting and important to explore questions concerning teaching and learning approaches and relate them to student motivation for participation in exams.
3.3. Model Design and Setup
The dataset was divided into two sets using a KNIME node called the Resample filter: training data comprised approximately 90% of the data, and testing data comprised the remaining 10%. The former dataset was used to train the machine learning model, and the latter dataset was applied to test and evaluate the model. To ensure the validity of experimental results, the above process was repeated 10 times using different parts of the initial data for training and testing, keeping the ratio of 90% to 10%, respectively. This process is well-known in data science and called “10-fold, cross validation” [48]. Since student data are time-dependent, the random splitting of training and test sets could lead to “future-looking” when training the model, meaning that it makes no sense to have values from the future to predict values from the past. Therefore, we utilized time-series split cross-validation, so at each iteration, there is a condition that the validation set is always ahead of the training set.
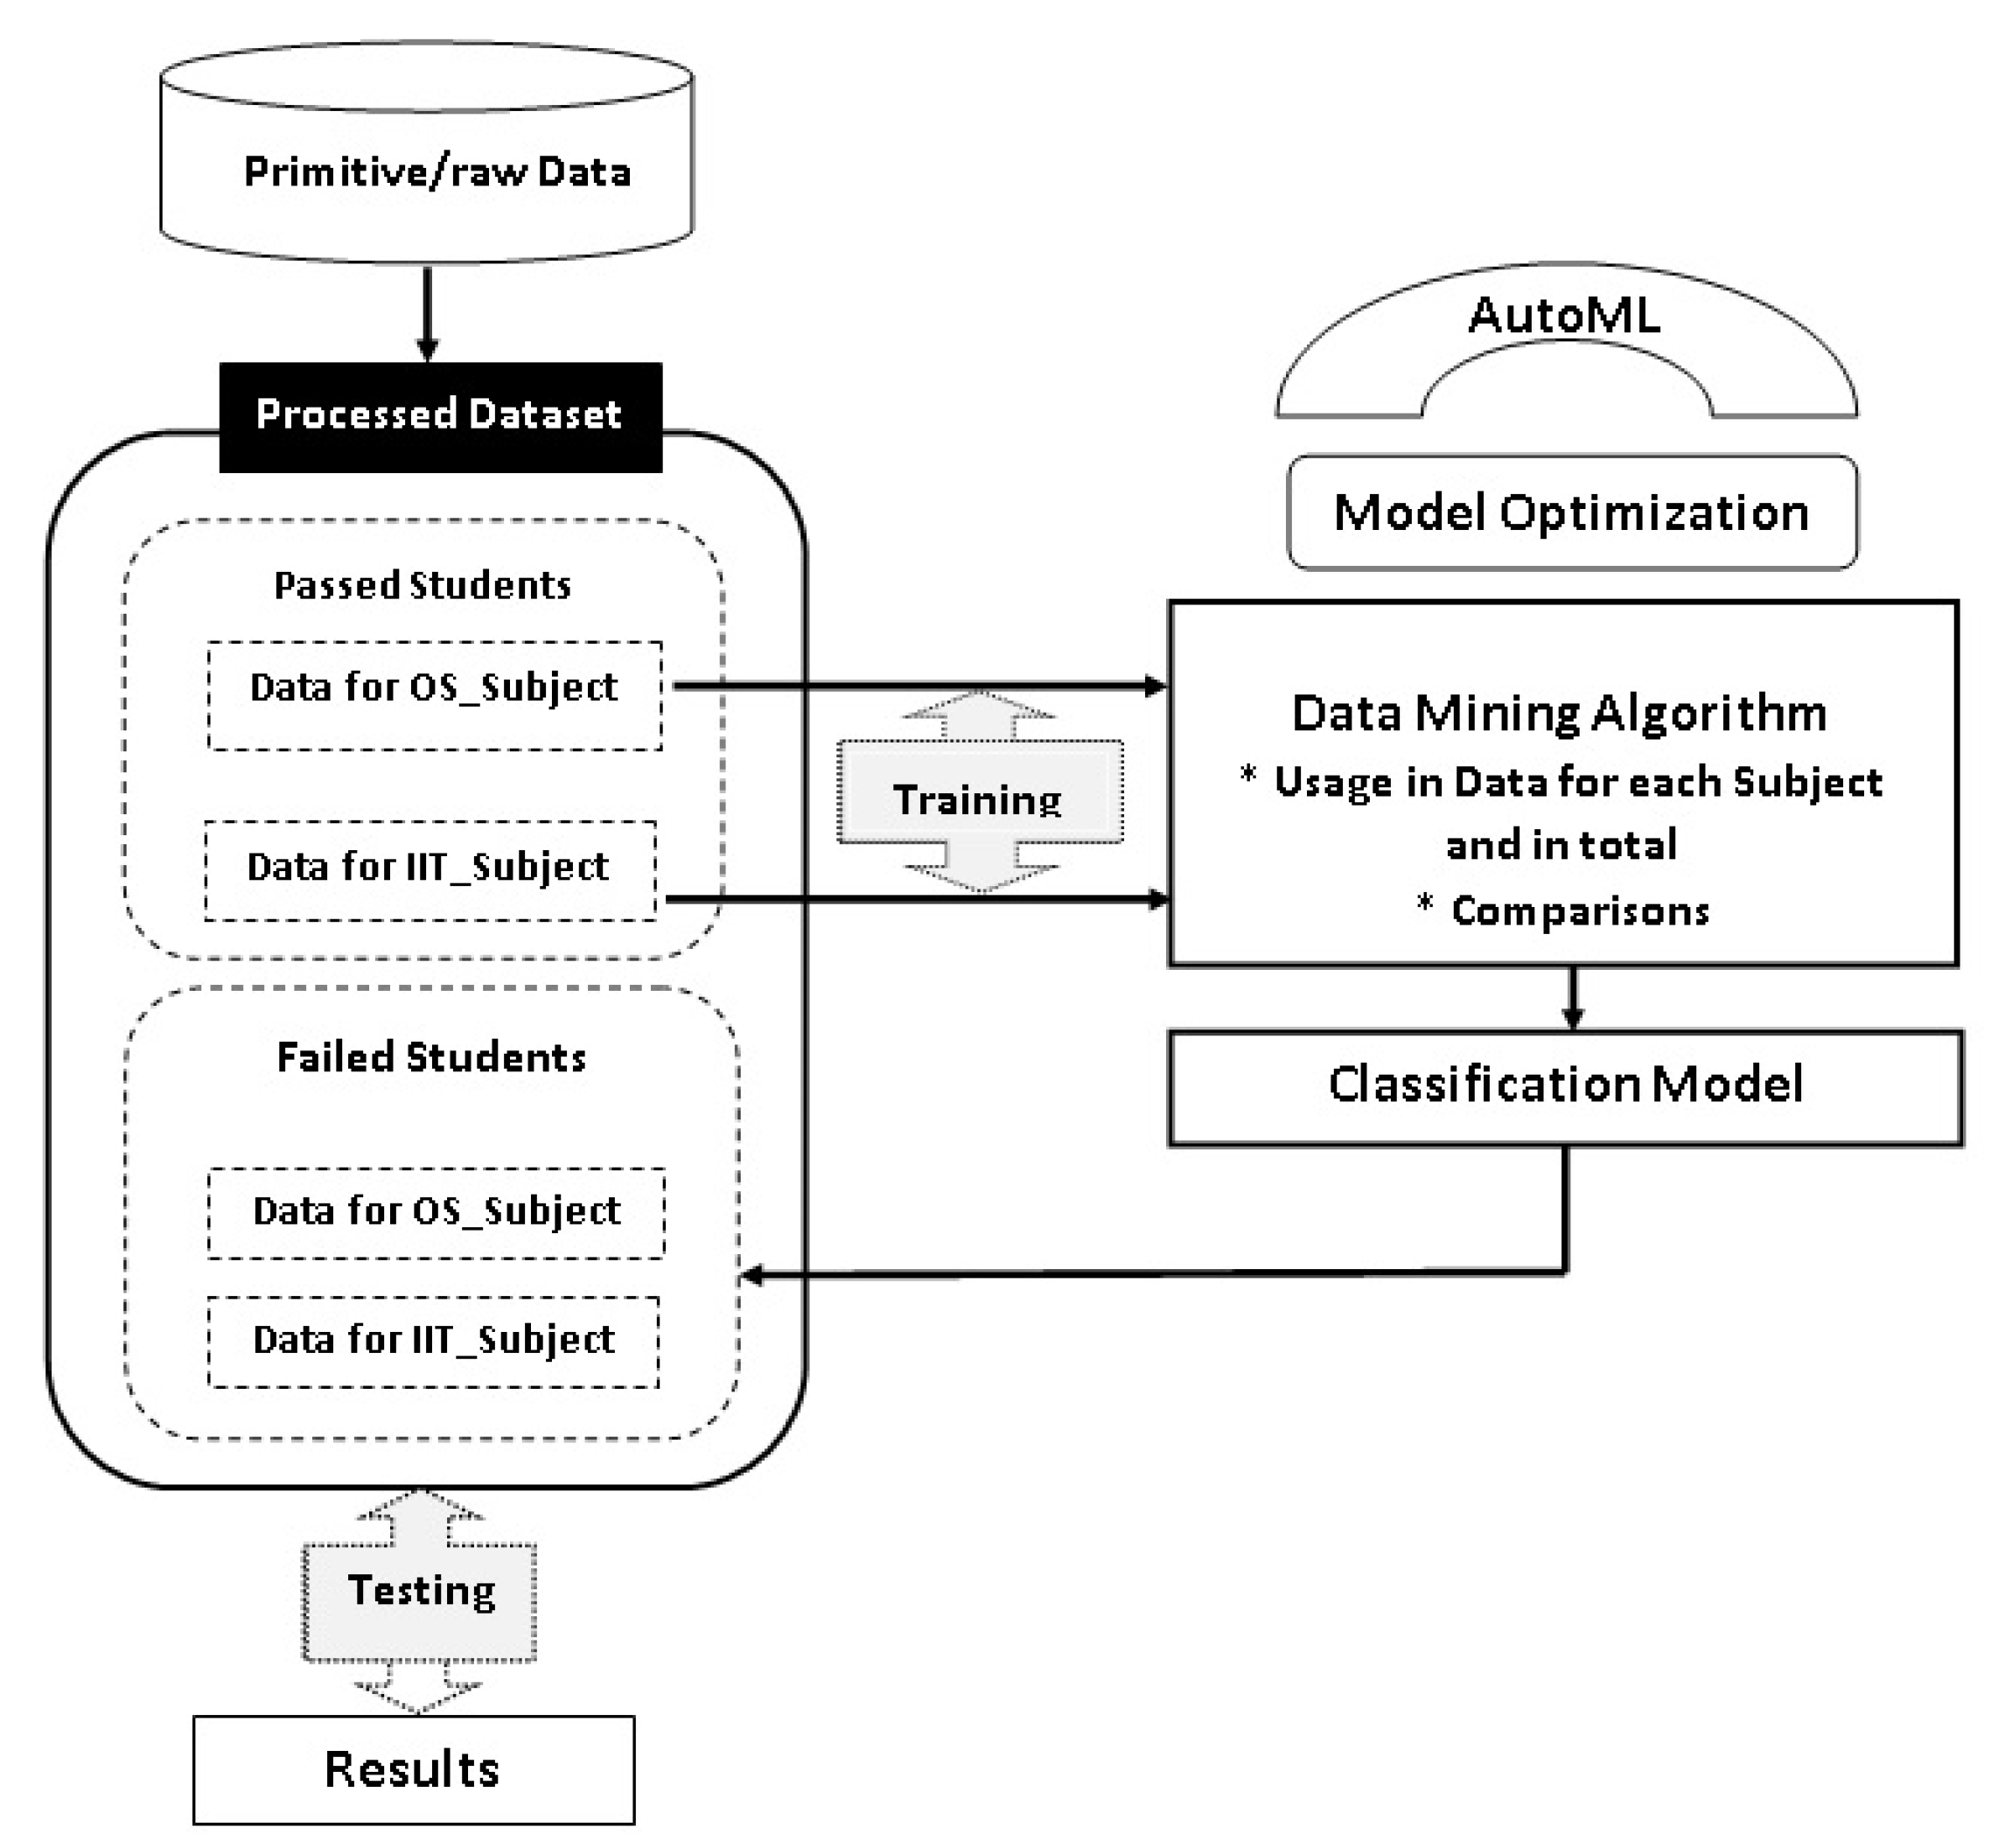
The model training and testing processes are depicted in Figure 1.
3.4. KNIME Workflow for Analyzing Educational Data
As mentioned in the introductory section, the KNIME data analytics tool was used for the implementation of this work. The main reasons for choosing this platform over the other software suites for data mining are the following:
- It has been recognized as a leader by Gartner in the domains of data science and machine learning platforms and has been placed in their magic quadrant for 8 consecutive years.
- It has an integrative nature, while its open-source model ensures all capabilities required of an individual data scientist, which are available for free and with no restrictions; it is a working model that suits the academic environment.
- It has a very active community of more than 200,000 users who exchange ideas and reusable components amongst them.
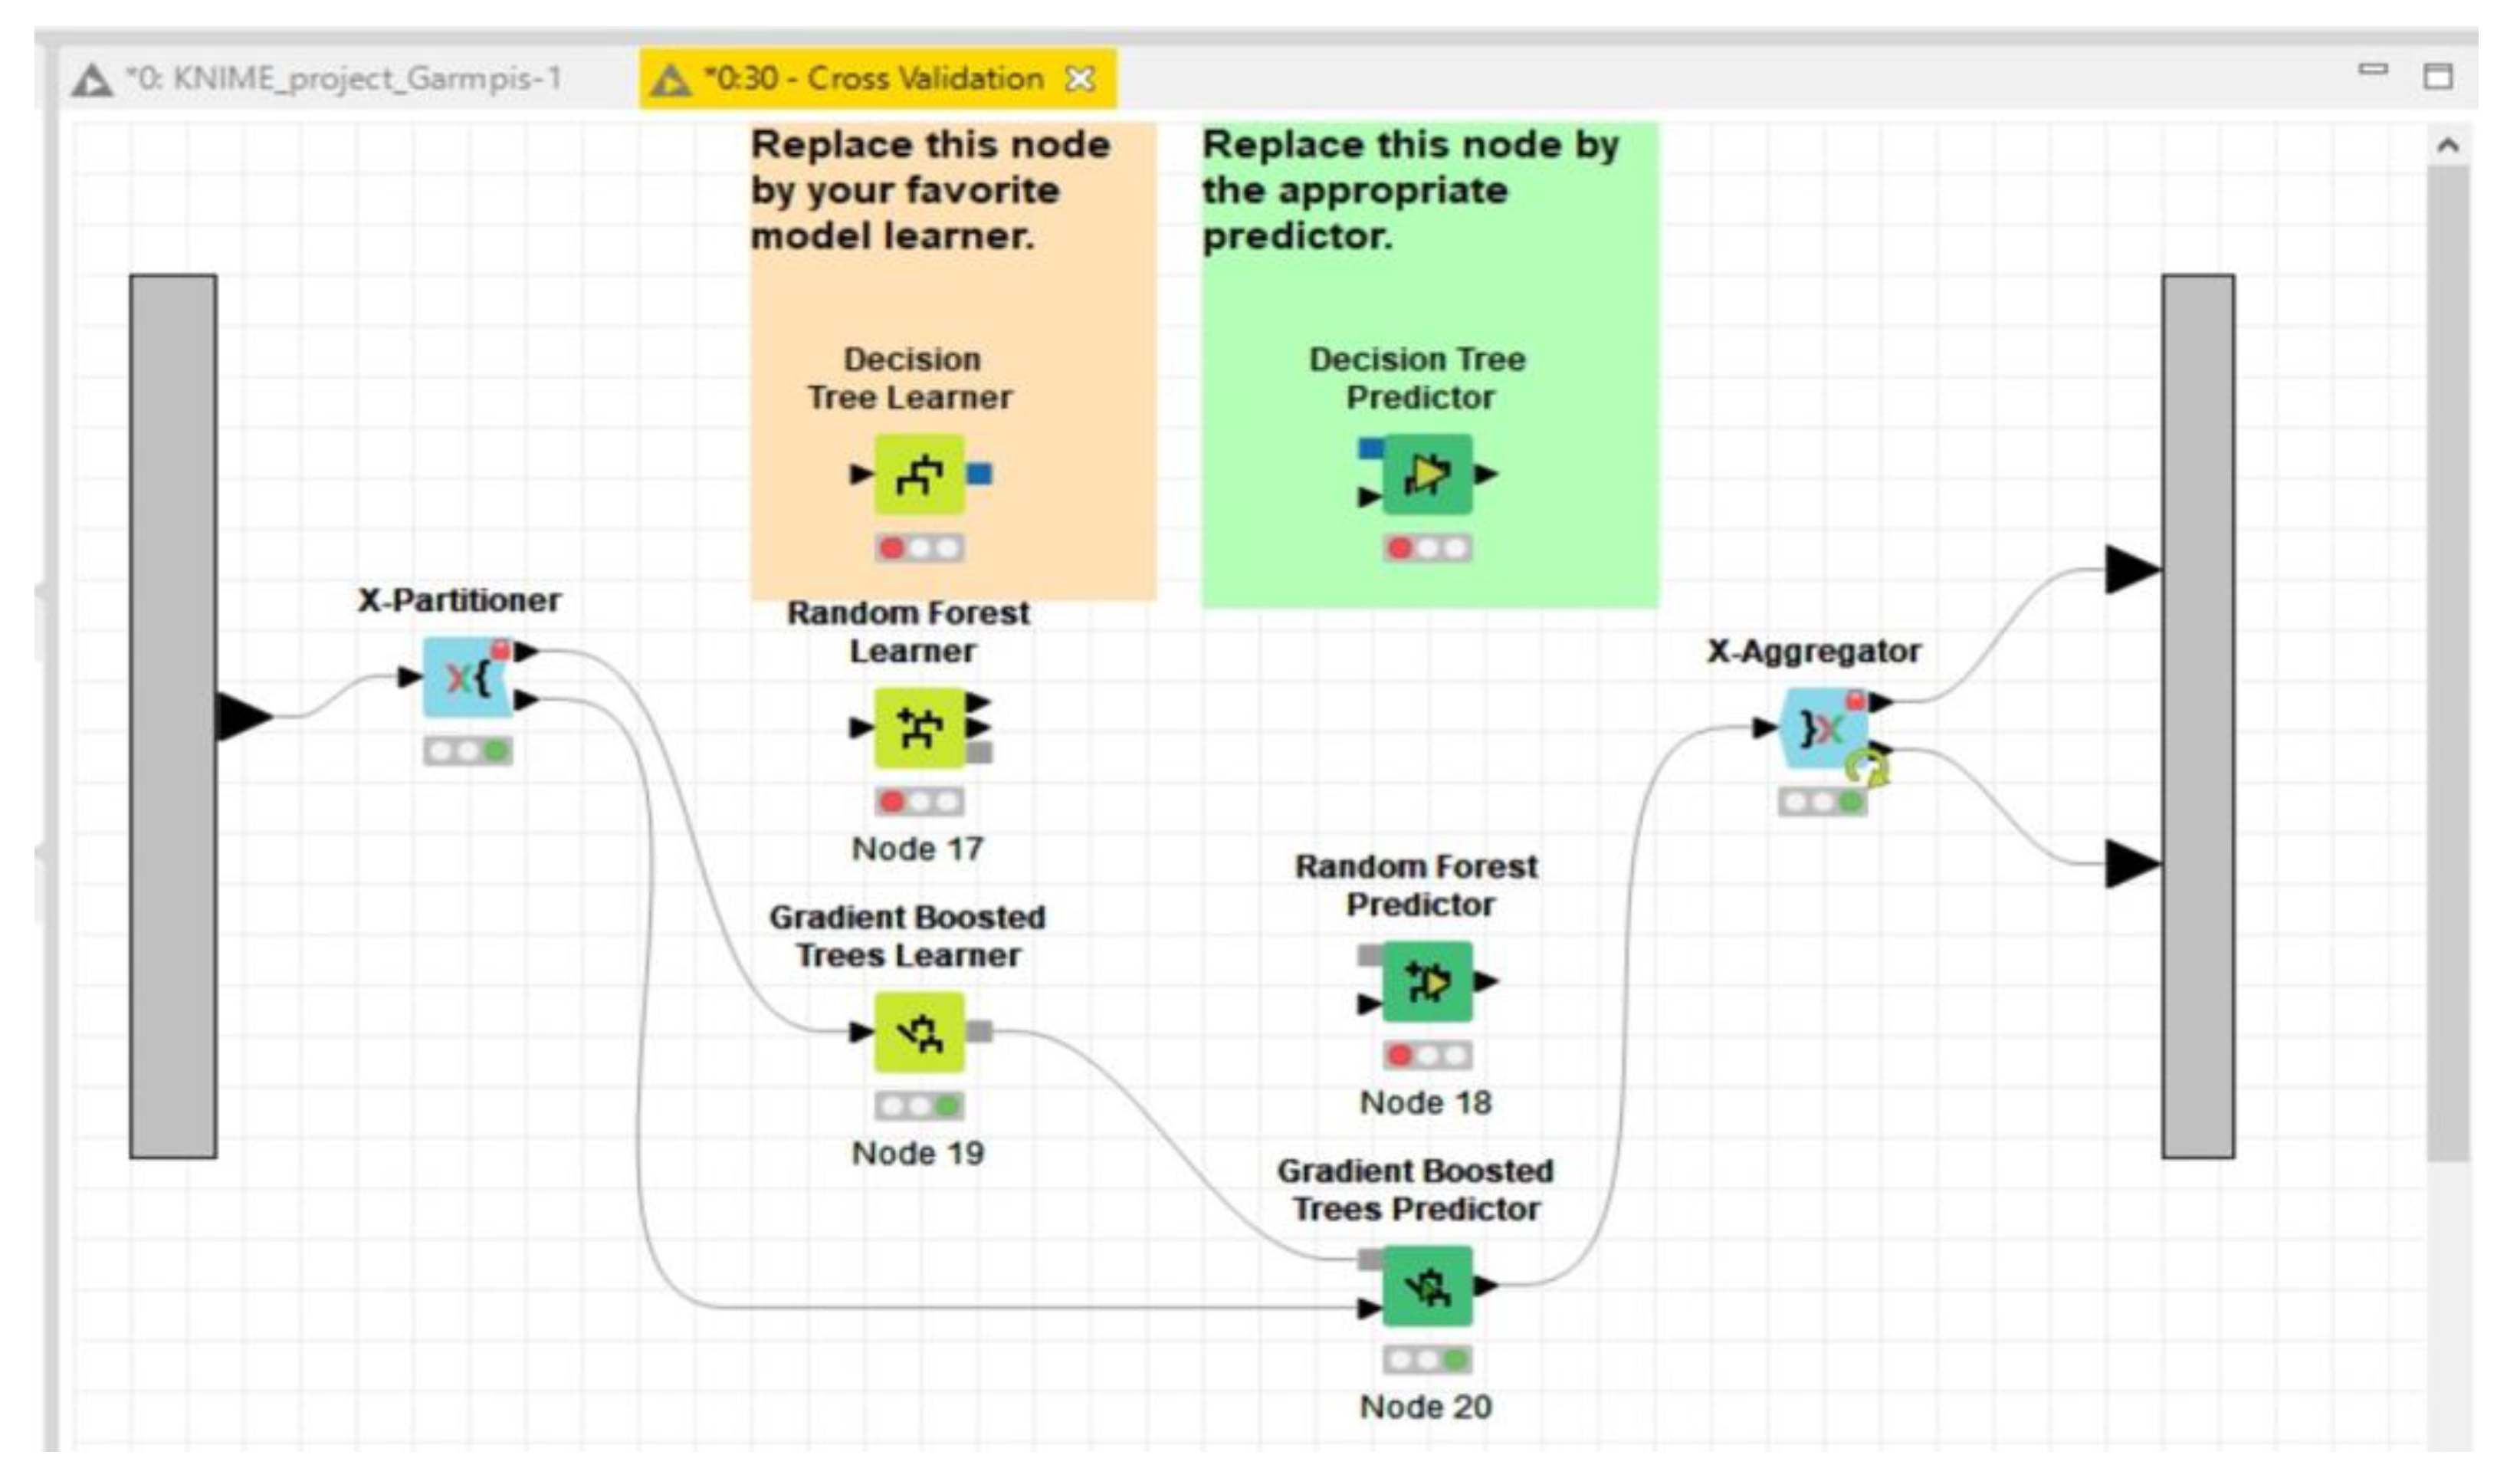
For the reasons explained above, the main components that were selected from the set of available KNIME extensions and modules included AutoML, Visualization and Reporting. KNIME makes it very simple for an analyst to train the best classification model from the available data and deploy the model to a reporting/dashboarding service (already available within KNIME and accessible via the Web browser), and it allows policy makers to visually inspect forecasts for each educational course. A part of the workflow model built for this analysis is shown in the figures below. The screenshots of CSV Reader and AutoML (Figure 2) and the Cross Validation nodes are provided below (Figure 3).
3.5. Automated Machine Learning Algorithms—AutoML
In recent years, machine learning (ML) has achieved significant milestones in a plethora of application domains, fueling a growing demand for intelligent systems that can be used effectively by people who are not necessarily advanced data analysts or skilled with programming languages [49]. Towards that end, there has been a growing number of commercial companies with tools and products that attempt to satisfy this demand. Examples of such tools include KNIME, BigML, Wise, H2O, RapidMiner, Dataiku, Prediction, DataRobot, Microsoft’s Azure Machine Learning, Google’s Cloud Machine Learning Engine, and Amazon Machine Learning. At its core, every effective data analytics service needs to solve the fundamental issue of deciding which ML algorithm performs better given a specific dataset, whether and how to preprocess its features, and how to set all or a subset of the algorithm’s hyperparameters. This process is frequently called “AutoML” [50].
We consider the formalization of AutoML to be a Combined Algorithm Selection and Hyperparameter optimization (CASH) problem [51]. Two important problems in AutoML are that (1) no single ML method performs best on all datasets, and (2) some machine learning methods (e.g., non-linear SVMs) crucially rely on hyperparameter optimization. The latter problem has been successfully attacked using Bayesian optimization, which today forms a core component of many AutoML systems. The former problem is intertwined with the latter since the rankings of algorithms depend on whether their hyperparameters are tuned properly [52]. For the present work, the use of KNIME’s AutoML workflow was taken into account, encompassing well-known ML algorithms from the following list:
- A neural network is a computational learning system that uses a network of functions to understand and translate a data input of one form into a desired output, usually in another form. The concept of the artificial neural network was inspired by human biology and the way that neurons of the human brain function together to understand inputs from human senses.
- Logistic regression is an ML algorithm that falls under the supervised learning technique and is used for predicting the categorical dependent variable using a given set of independent variables. It can provide probabilities and classify new data using continuous and discrete datasets.
- Decision tree is a supervised learning technique that can be used for both classification and regression problems. It is a tree-structured classifier, where internal nodes represent the features of a dataset, branches represent the decision rules, and each leaf node represents the outcome. The decisions or the test are performed based on features of the given dataset. It is a graphical representation for realizing all possible solutions to a problem/decision based on given conditions.
- XG Boost is an ensemble learning technique that combines the predictive power of several learners and is implemented over the Gradient Boosted Trees algorithm. The result is a single model that provides the aggregated output from several models. Bagging and Boosting are two widely used ensemble learners with the most predominant usage with decision trees.
- Random forest is an ensemble learning technique that provides predictions by combining multiple classifiers and improves the performance of the model. It contains multiple decision trees for subsets of the given dataset and finds the average to improve the predictive accuracy of the model. Random forest is a fast algorithm and can efficiently deal with missing and incorrect data.
- Gradient-Boosted Trees (GBT) is a tree-based ML algorithm that works for both regression and classification types of data mining problems. This model produces a prediction model in the form of an ensemble of weak prediction models, which are typically decision trees.
- Generalized linear models (GLMs) estimate regression models for outcomes following exponential distributions and include Gaussian, Poisson, binomial, and gamma distributions. Each serves a different purpose and, depending on the distribution and link function choice, can be used for either prediction or classification.
- The naive Bayes algorithm is a supervised learning algorithm that is based on Bayes’ theorem and is used to solve classification problems. It is a probabilistic classifier, which helps in building fast machine learning models that can make quick predictions.
The above list contains some of the most important algorithms that any AutoML system takes into account when trying to fit a classification model to the available training dataset. Similar to KNIME, other data analysis platforms offer AutoML execution in an attempt to reduce the manual effort of the expert to set up various hyperparameters of each classifier.
4. Results and Discussion
We considered standard classification performance metrics, namely, “accuracy”, “precision”, “recall”, and “F-measure”. In order to clarify the meaning of the aforementioned metrics, we use a well-known table that tabulates the predicted class from the classification model in relation to the real one, as provided in the test set. The table is known as a “confusion matrix”. Table 5 provides an example of a confusion matrix.
The metrics are defined as follows:
As one can observe from the results, the harmonic mean of precision and recall, two measures of performance that are most commonly used together with accuracy in the literature, called the F-measure, demonstrates the robust performance of the AutoML component. An ANOVA (ANalysis Of Variance) was not applied due to the fact that homogeneity of variances was not satisfied amongst the data instances. More specifically, the best classification performance was achieved using neural networks, reaching a figure above 90%, with all the other algorithms portraying slightly worse behavior. This fact allows us to deduce that the features selected for this task were the correct ones, and from a practical perspective, a higher education institution stakeholder, such as the head of department or the head of a bachelor’s or master’s program, could rely on the predictions of any model to advise on how to help students pass their courses without long delays.
Table 6 presents the performance metrics of the AutoML process described above.
Based on the current institutional framework for higher education, there is no deadline for the completion of studies in Greece. This fact creates several problems for the university administration, such as the significant additional burden on the budget and an increase in teachers’ work burden due to the accumulation of a large number of students who have failed.
The results shown in Table 7 depict the performance in the OS course. The best classification performance of the F-measure for all algorithms was achieved using XGBoost Trees, reaching a figure above 75.5%, with all other algorithms portraying slightly worse behavior. The naive Bayes algorithm is an exception with 40.0%. In this course, the performance of all algorithms portrayed worse behavior and deviated significantly from those relating to the IIT course. This may be due to two main reasons, the first being that the data processed were far less, as this course is not provided in the curriculum of one out of three merged departments. The second potential reason is that the OS course is taken by students in a higher semester (fourth) and therefore is more difficult.
By observing the results in Table 8, which depicts the consolidated performance of both courses, the statistical difference in the F-measure for all algorithms is not important enough to denote a clear advantage of one over another. All of them are within the range of 91%-92%, except for naive Bayes, which can be justified by the fact that it is an algorithm that is based on an oversimplified assumption, that is, the assumption of the statistical independence of all input features, given the class. The prediction accuracy that was achieved in our study is very close to that of artificial neural networks, as Wongkhamdi and Seresangtakul [46] found, as mentioned above (93.3% accuracy).
The research methodology for the prediction of the time required for students to pass two basic courses of the curriculum based on two variables (student scores and number of attempts) is described below.
Firstly, the data were processed, and through EDA, a check was performed to better understand the role of variables and the statistical techniques examined. Secondly, the model was designed, and the dataset was divided into two sets using KNIME’s software capabilities. Thirdly, the formalization of AutoML was considered to be a Combined Algorithm Selection and Hyperparameter optimization (CASH) problem. Finally, by using KNIME’s AutoML workflow, which includes all well-known ML algorithms, a classification model was fit to the available training dataset. “Class” was the output variable (dependent), which had two categories, “pass” and “fail”.
The results support our initial claim that AutoML is a new trend in data science that can accurately train a robust classification model, can be used by data analysts and data scientists without the need for special programming language skills, and can support educational decisions that can lead higher education institutions towards modernizing their modules and help students fulfill their programs in a more straightforward manner.
The trained model from AutoML can be explained in various aspects. Apart from the confusion matrix outcome, in which the performance can be checked, recent advances in AutoML can provide additional explainable features that can assist domain experts in making better decisions. Such features include: (a) variable importance, in which the effect of each independent variable is measured against the dependent one and (b) SHAP (Shapley Additive exPlanations), a game-theory approach that explains the output of any machine learning model by connecting optimal credit allocation with local explanations using the traditional Shapley metric from game theory’s [53] Partial Dependence and Individual Conditional Expectation plots, which portray the functional relationship between input variables and predictions.
The optimal parameters of each classifier (where applicable) returned from the AutoML module are tabulated in Table 9 below.
The experimental findings demonstrate that the early prognosis of students at risk of failure can be achieved using AutoML techniques, even for a small amount of initially collected data concerning the two courses. The extension of this research to all other courses will lead to more accurately determining the prediction of the required graduation time and will be addressed in our future studies. Finally, the results of our research are in accordance with those of earlier research findings [11,12,13]. This statement indicates that machine learning tools can predict the graduation performance of students and enable universities to manage their resources in a better way [4,5,6,7,37].
5. Conclusions
In an attempt to define the contribution of the present work using AutoML for educational data analysis, we can claim that the trained model can robustly identify whether a new student will follow a trajectory that is similar to that of past students who successfully passed the course(s) of interest. AutoML provides us not only with the most robust model and the optimal associated variables but also with the most informative features from the initial dataset. In complex educational platforms such as Moodle, where project assignments, exercises, quizzes, and other intermediate factors can be measured, this functionality could prove helpful in the early identification of reasons why a student is prone to fail and what supportive actions could be made to help alleviate such problems.
The prediction of the time required for students to pass their courses will motivate universities to develop educational mechanisms (summer courses and other reinforcing teaching strategies) to decrease graduation time. The result will be a reduction in (a) students who stagnate for several years (usually unemployed or underemployed in jobs that are unrelated to their field of studies), (b) unemployment, and (c) the financial burden of studies (such as student loans, sponsorships from parents, or other resources). The labor market (firms, corporations, or industrial units), knowing the length of time required for students to pass their courses and consequently the graduation time, can prepare their schedules of hiring procedures in advance. In machine learning, most algorithms come with a pre-defined set of parameters that cannot fit in all domains with optimal results. Τhe use of AutoML can exploit that weakness effectively and provide domains like the task at hand with the best parameter set. Our plans for future research include the use of hardware-accelerated AutoML characteristics in order to deal with Big Data concerning the full curriculum of a school rather than a subset of courses.
Author Contributions
Conceptualization, A.G.; data curation, S.G.; formal analysis, S.G.; methodology, S.G. and M.M.; project administration, A.G.; resources, A.G.; software, S.G., M.M. and A.G.; supervision, M.M.; validation, M.M.; writing—original draft, A.G.; writing—review and editing, S.G., M.M. and A.G. All authors have read and agreed to the published version of the manuscript.
Funding
This research received no external funding.
Institutional Review Board Statement
Not applicable.
Informed Consent Statement
Not applicable.
Data Availability Statement
All data were presented in main text.
Conflicts of Interest
The authors declare no conflict of interest.
Appendix A
The findings from data mining through KNIME software capabilities for the courses are described below.
Course title: Introduction Information Technology
Out of 5683 students in total, 3613 students passed this course, and 2070 did not. Additionally, 1660 students never participated in the final exam (i.e., 80.2% out of the 2070 students who did not pass this course were inactive), while 4023 students participated at least once (active).
Of the 2070 failing students, 1660 were inactive, and 410 (=4023 – 3613) were active.
- Out of 410 active students, 270 (66%) obtained marks within the range [3.5, 5.0), with a grade point average of 4.0, and 139 (34%) were within the range (0.0, 3.0], with a grade point average of 2.0.
Of the 3613 passing students:
- 1892 passed on the 1st try (52%), 959 passed on the 2nd try (27%), 443 passed on the 3rd try (12%), 203 passed on the 4th try (5.70%), 78 passed on the 5th try (2.20%), 27 passed on the 6th try (0.76%), 6 passed on the 7th try (0.17%), 2 passed on the 8th try (0.05%), 0 passed on the 9th try (0%), and 3 passed on the 10th try (0.08%).
- 2204 (61%) students obtained marks within the range [8.0, 10.0], with a grade point average of 8.5, and 1409 (39%) students were within the range [5.0, 8.0), with a grade point average of 5.4.
Out of 4023 students who participated in the final exam at least once, 3613 students (i.e., 89.8%) passed, with a grade point average of 5.6, and 410 students (i.e., 10.2%) failed, with a grade point average of 2.0.
Course title: Operating Systems
Out of 3369 students in total, 2695 students passed this course, and 674 did not.
In addition, 345 students never participated in the final exam (i.e., 51.2% out of the 674 students who did not pass this course were inactive), while 3024 students participated at least once (active).
Of the 674 failing students, 345 were inactive, and 329 (=3024 − 2695) were active.
- Out of 329 active students, 224 (69%) obtained marks within the range [3.5, 5.0), with a grade point average of 4.0, and 100 (31%) were within the range (0.0, 3.0], with a grade point average of 1.8.
Of the 2695 passing students:
- 1714 passed on the 1st try (64%), 550 passed on the 2nd try (20%), 208 passed on the 3rd try (8%), 120 passed on the 4th try (4.45%), 54 passed on the 5th try (2.09%), 29 passed on the 6th try (1.15%), 13 passed on the 7th try (0.55%), 3 passed on the 8th try (0.15%), 3 passed on the 9th (0.15%), and 1 passed on the 10th try (0.04%).
- 2204 (61%) students obtained marks within the range [8.0, 10.0], with a grade point average of 8.6, and 1409 (39%) students were within the range [5.0, 8.0), with a grade point average of 5.6.
Out of 3024 students who participated in the final exam at least once, 2695 (i.e., 89.1%) passed, with a grade point average of 5.8, and 329 (i.e., 10.9%) failed, with a grade point average of 1.8.
Courses titles: Introduction Information Technology and Operating Systems
Out of 5751 students in total, 3678 students passed both courses, and 2073 did not. Additionally, 1673 students never participated in the final exam (i.e., 80.7% out of the 2073 students who did not pass both courses were inactive), while 4078 students participated at least once (active).
Of the 2073 failing students, 1673 were inactive, and 400 (=4078 − 3678) were active.
- Out of 400 active students, 264 (66%) obtained marks within the range [3.5, 5.0), with a grade point average of 4.0, and 136 (34%) were within the range (0.0, 3.0], with a grade point average of 2.0.
Of the 3678 passing students:
- 422 passed on the 1st try (11.5%), 1233 passed on the 2nd try (33.5%), 830 passed on the 3rd try (22.6%), 507 passed on the 4th try (13.8%), 305 passed on the 5th try (8.35%), 160 passed on the 6th try (4.35%), 105 on the 7th try (2.9%), 56 on the 8th try (1.55%), 28 on the 9th (0.85%), 11 passed on the 10th try (0.4%), and 21 values were missing (0.3%).
- 2207 (60%) students obtained marks within the range [8.0, 10.0], with a grade point average of 8.6, and 1471 (40%) students were within the range [5.0, 8.0), with a grade point average of 5.7.
Out of 4078 students who participated in final exams for both courses at least once, 3678 (i.e., 90.2%) passed, with a grade point average of 5.9, and 400 (i.e., 9.8%) failed, with a grade point average of 2.12.
References
- International Educational Data Mining Society. Available online: http://educationaldatamining.org/ (accessed on 19 January 2021).
- Romero, C.; Ventura, S. Educational Data Mining: A Survey from 1995 to 2005. Expert Syst. Appl. 2007, 33, 135–146. [Google Scholar] [CrossRef]
- Baker, R.; Yacef, K. The State of Educational Data Mining in 2009: A Review and Future Visions. J. Educ. Data Min. 2009, 1, 3–17. [Google Scholar]
- Salisu, S.; Usman, B. Data Mining: Predicting of Student Performance Using Classification Technique. Int. J. Inf. Processing Commun. 2020, 8, 92–101. [Google Scholar]
- Li, Y.; Gou, J.; Fan, Z. Educational data mining for students’ performance based on fuzzy C-means clustering. J. Eng. 2019, 2019, 8245–8250. [Google Scholar] [CrossRef]
- Tsiakmaki, M.; Kostopoulos, G.; Kotsiantis, S.; Ragos, O. Transfer Learning from Deep Neural Networks for Predicting Student Performance. Appl. Sci. 2020, 10, 2145. [Google Scholar] [CrossRef] [Green Version]
- Karimi, H.; Derr, T.; Huang, J.; Tang, J. Online Academic Course Performance Prediction using Relational Graph Convolutional Neural Network. In Proceedings of the 13th International Conference on Educational Data Mining, Fully Virtual Conference, 10–13 July 2020. [Google Scholar]
- Tsiakmaki, M.; Kostopoulos, G.; Kotsiantis, S.; Ragos, O. Fuzzy-based active learning for predicting student academic performance using autoML: A step-wise approach. J. Comput. High. Educ. 2021, 33, 635–667. [Google Scholar] [CrossRef]
- Karlos, S.; Kostopoulos, G.; Kotsiantis, S. Predicting and Interpreting Students’ Grades in Distance Higher Education through a Semi-Regression Method. Appl. Sci. 2020, 10, 8413. [Google Scholar] [CrossRef]
- Kostopoulos, G.; Karlos, S.; Kotsiantis, S. Multiview Learning for Early Prognosis of Academic Performance: A Case Study. IEEE Trans. Learn. Technol. 2019, 12, 212–224. [Google Scholar] [CrossRef]
- Uylaş, N. Semi-Supervised Classification in Educational Data Mining: Students’ Performance Case Study. Int. J. Comput. Appl. 2018, 179, 13–17. [Google Scholar] [CrossRef]
- Umar, M.A. Student Academic Performance Prediction using Artificial Neural Networks: A Case Study. Int. J. Comput. Appl. 2019, 178, 24–29. [Google Scholar]
- Sana Siddiqui, I.F.; Arain, Q.A. Analyzing Students’ Academic Performance through Educational Data Mining. 3c Tecnol. Glosas Innov. Apl. Pyme. 2019, 29, 402–421. [Google Scholar]
- Alom, B.M.; Courtney, M. Educational Data Mining: A Case Study Perspectives from Primary to University Education in Australia. Int. J. Inf. Technol. Comput. Sci. 2018, 10, 1–9. [Google Scholar] [CrossRef] [Green Version]
- Sorenson, P.; Macfadyen, L. Learner Interaction Monitoring System (LiMS): Capturing the Behaviors of Online Learners and Evaluating Online Training Courses. In Proceedings of the 2010 International Conference on Data Mining, DMIN 2010, Las Vegas, NV, USA, 12–15 July 2010. [Google Scholar]
- Naranjo, D.M.; Prieto, J.R.; Moltó, G.; Calatrava, A. A Visual Dashboard to Track Learning Analytics for Educational Cloud Computing. Sensors 2019, 19, 2952. [Google Scholar] [CrossRef] [PubMed] [Green Version]
- Peña-Ayala, A. Educational data mining: A survey and a data mining-based analysis of recent works. Expert Syst. Appl. 2014, 41, 1432–1462. [Google Scholar] [CrossRef]
- Timbal, M.A. Analysis of Student-at-Risk of Dropping out (SARDO) Using Decision Tree: An Intelligent Predictive Model for Reduction. Int. J. Mach. Learn. Comput. 2019, 9, 3. [Google Scholar] [CrossRef] [Green Version]
- Drăgulescu, B.; Bucos, M.; Vasiu, R. Predicting Assignment Submissions in a Multi- class Classification Problem. TEM J. 2015, 4, 244–254, ISSN 2217-8309, e-ISSN 2217-8333. [Google Scholar]
- Tomasevic, N.; Gvozdenovic, N.; Vranes, S. An overview and comparison of supervised data mining techniques for student exam performance prediction. Comput. Educ. 2019, 143, 103676. [Google Scholar] [CrossRef]
- Iam-On, N.; Boongoen, T. Generating descriptive model for student dropout: A review of clustering approach. Human-Centric Comput. Inf. Sci. 2017, 7, 1. [Google Scholar] [CrossRef] [Green Version]
- Salas, D.J.; Baldiris, S.; Fabregat, R.; Graf, S. Supporting the Acquisition of Scientific Skills by the Use of Learning Analytics. In International Conference on Web-Based Learning; Springer: Berlin/Heidelberg, Germany, 2016; pp. 281–293. [Google Scholar]
- Hussain, S.; Atallah, R.; Kamsin, A.; Hazarika, J. Classification, Clustering and Association Rule Mining in Educational Datasets Using Data Mining Tools: A Case Study. In Computer Science On-line Conference; Springer: Cham, Germany, 2018; pp. 196–211. [Google Scholar] [CrossRef]
- Suganya, D.; Kumar, K.; Ramesh, P.S.; Suganthan, C. Student performance dashboard using mining approach. Int. J. Pure Appl. Math. 2018, 119, 409–421. [Google Scholar]
- Rojanavasu, P. Educational Data Analytics using Association Rule Mining and Classification. In Proceedings of the 2019 Joint International Conference on Digital Arts, Media and Technology with ECTI Northern Section Conference on Electrical, Electronics, Computer and Telecommunications Engineering, Nan, Thailand, 30 January–2 February 2019; pp. 142–145. [Google Scholar] [CrossRef]
- Malekian, D.; Bailey, J.; Kennedy, G. Prediction of Students’ Assessment Readiness in Online Learning Environments: The Sequence Matters. In Proceedings of the Tenth International Conference on Learning Analytics & Knowledge, Frankfurt, Germany, 23–27 March 2020. [Google Scholar]
- Wong, J.; Khalil, M.; Baars, M.; de Koning, B.B.; Paas, F. Exploring sequences of learner activities in relation to self-regulated learning in a massive open online course. Comput. Educ. 2019, 140, 103595. [Google Scholar] [CrossRef]
- Nakamura, S.; Nozaki, K.; Nakayama, H.; Morimoto, Y.; Miyadera, Y. Sequential Pattern Mining System for Analysis of Programming Learning History. In Proceedings of the IEEE International Conference on Data Science and Data Intensive Systems IEEE, Sydney, Australia, 11–13 December 2015; pp. 69–74. [Google Scholar]
- Erkens, M.; Bodemer, D.; Hoppe, H.U. Improving collaborative learning in the classroom: Text mining based grouping and representing. Int. J. Comput. Collab. Learn. 2016, 11, 387–415. [Google Scholar] [CrossRef]
- Ferreira-Mello, R.; André, M.; Pinheiro, A.; Costa, E.; Romero, C. Text mining in education. Wiley Interdiscip. Rev. Data Min. Knowl. Discov. 2019, 9, e1332. [Google Scholar] [CrossRef]
- Hind, H.; Idrissi, M.K.; Bennani, S. Applying Text Mining to Predict Learners’ Cognitive Engagement. In Proceedings of the Mediterranean Symposium on Smart City Application, Tangier, Morocco, 25–27 October 2017; p. 2. [Google Scholar] [CrossRef]
- Aljarrah, A.; Thomas, M.K.; Shehab, M. Investigating temporal access in a flipped classroom: Procrastination persists. Int. J. Educ. Technol. High. Educ. 2018, 15, 1. [Google Scholar] [CrossRef]
- Shah, S.A.A.; Uddin, I.; Aziz, F.; Ahmad, S.; Al-Khasawneh, M.; Sharaf, M. An Enhanced Deep Neural Network for Predicting Workplace Absenteeism. Complexity 2020, 2020, 1–12. [Google Scholar] [CrossRef] [Green Version]
- Alkadhwi, A.H.O.; Adelaja, O.A. Data Mining Application Using Clus-tering Techniques (K-Means Algorithm) In the Analysis of Student’s Result. J. Multi-Discip. Eng. Sci. Stud. 2019, 5, 2587–2593. [Google Scholar]
- Hartatik; Kusrini, K.; Prasetio, A.B. Prediction of Student Graduation with Naive Bayes Algorithm. In Proceedings of the Fifth International Conference on Informatics and Computing (ICIC), Gorontalo, Indonesia, 3–4 November 2020; pp. 1–5. [Google Scholar] [CrossRef]
- Kabakchieva, D. Predicting Student Performance by Using Data Mining Methods for Classification. Cybern. Inf. Technol. 2013, 13, 61–72. [Google Scholar] [CrossRef]
- Damopolii, W.W.; Priyasadie, N.; Zahra, A. Educational Data Mining in Predicting Student Final Grades. Int. J. Adv. Trends Comput. Sci. Eng. 2021, 10, 366–371. [Google Scholar]
- Dataiku Software. Version 10.0—November 2021. Available online: http://www.dataiku.com (accessed on 1 May 2022).
- Adekitan, A.I.; Salau, O. Toward an improved learning process: The relevance of ethnicity to data mining prediction of students’ performance. SN Appl. Sci. 2019, 2, 8. [Google Scholar] [CrossRef] [Green Version]
- Bostock, S.M. D3JS Data Driven Documents. 2014. Available online: http://d3js.org (accessed on 1 May 2022).
- Alcalá-Fdez, J.; Sánchez, L.; García, S.; Del Jesus, M.J.; Ventura, S.; Garrell, J.M.; Otero, J.; Romero, C.; Bacardit, J.; Rivas, V.M.; et al. KEEL: A software tool to assess evolutionary algorithms for data mining problems. Soft Comput. 2008, 13, 307–318. [Google Scholar] [CrossRef]
- Fournier-Viger, P.; Gomariz, A.; Gueniche, Τ.; Soltani, A.; Wu, C.-W.; Tseng, V.S. SPMF: Open-Source Data Mining Library. 2013. Available online: http://www.philippe-fournier-viger.com/spmf/ (accessed on 1 May 2022).
- Rai, S.; Shastry, K.A.; Pratap, S.; Kishore, S.; Mishra, P.; Sanjay, H.A. Machine Learning Approach for Student Academic Performance Prediction. In Evolution in Computational Intelligence. Advances in Intelligent Systems and Computing; Bhateja, V., Peng, S.L., Satapathy, S.C., Zhang, Y.D., Eds.; Springer: Singapore, 2020; pp. 611–618. [Google Scholar] [CrossRef]
- Hussain, S.; Hazarika, G.C. Educational Data Mining Model Using Rattle. Int. J. Adv. Comput. Sci. Appl. 2014, 5, 22–27. [Google Scholar] [CrossRef]
- Harwati, A.P.A.; Wulandari, F.A. Mapping Student’s Performance Based on Data Mining Approach (A Case Study). In Agriculture and Agricultural Science Procedia; Elsevier: Amsterdam, The Netherlands, 2015; Volume 3, pp. 173–177. [Google Scholar]
- Wongkhamdi, T.; Seresangtakul, P. A Comparison of Classical Discriminant Analysis and Artificial Neural Networks in Predicting Student Graduation Outcomes. In Proceedings of the Second International Conference on Knowledge and Smart Technologies 2010, Dortmund, Germany, 24–25 July 2010; pp. 29–34. [Google Scholar]
- KNIME Software. 2021. Available online: https://www.knime.com/knime-software/ (accessed on 1 May 2022).
- Riley, R.D.; Ahmed, I.; Debray, T.P.A.; Willis, B.H.; Noordzij, J.P.; Higgins, J.P.; Deeks, J.J. Summarising and validating test accuracy results across multiple studies for use in clinical practice. Stat. Med. 2015, 34, 2081–2103. [Google Scholar] [CrossRef] [PubMed] [Green Version]
- Bergstra, J.; Bengio, Y. Random search for hyper-parameter optimization. J. Mach. Learn. Res. 2012, 13, 281–305. [Google Scholar]
- Guyon, I.; Saffari, A.; Dror, G.; Cawley, G. Model selection: Beyond the Bayesian/Frequentist divide. J. Mach. Learn. Res. 2010, 11, 61–87. [Google Scholar]
- Thornton, C.; Hutter, F.; Hoos, H.; Leyton-Brown, K. Auto-WEKA: Combined Selection and Hyperparameter Optimization of Classification Algorithms. In Proceedings of the 19th ACM SIGKDD International Conference on Knowledge Discovery and Data Mining, Chicago, IL, USA, 11–14 August 2013; pp. 847–855. [Google Scholar]
- Bardenet, R.; Brendel, M.; Kégl, B.; Sebag, M. Collaborative Hyperparameter Tuning. In Proceedings of the International Conference on Machine Learning, Beijing, China, 21–26 June 2014; pp. 199–207. [Google Scholar]
- Štrumbelj, E.; Kononenko, I. Explaining prediction models and individual predictions with feature contributions. Knowl. Inf. Syst. 2013, 41, 647–665. [Google Scholar] [CrossRef]
Scheme 1.
Missed exams and attempts to pass the IIT course.

Scheme 2.
Missed exams and attempts to pass the OS course.

Scheme 3.
Missed exams and attempts to pass both courses, IIT and OS.

Figure 1.
Model Training and Testing Processes.

Figure 2.
AutoML execution after reading the csv file for: IIS, OS and both courses.

Figure 3.
Cross Validation: Provides a skeleton of nodes necessary for cross-validation.


Table 1.
Final Dataset Used.
| Variable Name | Variable Type | Values |
|---|---|---|
| Student_id | Numeric | Any Integer * |
| Subject | Nominal | Operating_Systems (OS), Introduction_Information_Technology (IIT) |
| Curriculum_Year | Numeric | Curriculum_Year_1999, Curriculum_Year_2007, Curriculum_Year_2013 |
| Grade | Numeric | One decimal number |
| Evaluation_Score | Nominal | (0) “Do not attend”, (1.0–3.5), (3.50–5.0), (5.0–8.0), (8.0–10.0) “Excellent mark” |
| Exam_Year | Numeric | 1999 to 2020 |
| Exam_Semester | Nominal | A and A’ (January) or B and B’ (June) or C (September) ** |
| Department | Nominal | Applied_Informatics_Management_Economy, Business_Administration, Management_social_cooperative_business_organizations |
| Student_status | Nominal | Graduate, Active |
| Attempts | Numeric | Natural number—Categorical target variable |
Keys. * Encrypted unique number. ** Semester exams are usually in January (A), June (B), and September (C); extra semester exams in January (A’) and June (B’) occasionally.
Table 2.
Missed exams and attempts to pass the IIT course.
| Passing Students 3613 | Number of Missed Exams (Times) | Number of Students Missing Exams (%) | Number of Students Per Try | Number of Attempts to Pass the Course |
|---|---|---|---|---|
| 0 | 2291 (63.409%) | 1892 | 1 | |
| 1 | 693 (19.181%) | 959 | 2 | |
| 2 | 292 (8.081%) | 443 | 3 | |
| 3 | 143 (3.958%) | 203 | 4 | |
| 4 | 92 (2.546%) | 78 | 5 | |
| 5 | 36 (0.99%) | 27 | 6 | |
| 6 | 27 (0.747%) | 6 | 7 | |
| 7 | 17 (0.47%) | 2 | 8 | |
| 8 | 6 (0.166%) | 0 | 9 | |
| 9 | 1 (0.028%) | 3 | 10 | |
| 10 | 6 (0.17%) | 0 | 11 | |
| 11 | 3 (0.08%) | 0 | 12 | |
| 12 | 4 (0.111%) | 0 | 13 | |
| 15 | 2 (0.055%) | 0 | 14 |
Correlation 0.97833.
Table 3.
Missed exams and attempts to pass the OS course.
| Passing Students 2695 | Number of Missed Exams (Times) | Number of Students Missing Exams (%). | Number of Students Per Attempt | Number of Attempts to Pass the Course |
|---|---|---|---|---|
| 0 | 1956 (72.579%) | 1714 | 1 | |
| 1 | 385 (14.286%) | 550 | 2 | |
| 2 | 169 (6.271%) | 208 | 3 | |
| 3 | 91 (3.377%) | 120 | 4 | |
| 4 | 40 (1.484%) | 54 | 5 | |
| 5 | 29 (1.076%) | 29 | 6 | |
| 6 | 9 (0.334%) | 13 | 7 | |
| 7 | 6 (0.223%) | 3 | 8 | |
| 8 | 4 (0.148%) | 3 | 9 | |
| 9 | 3 (0.111%) | 1 | 10 | |
| 11 | 1 (0.037%) | 0 | 11 | |
| 12 | 1 (0.037%) | 0 | 12 | |
| 13 | 1 (0%) | 0 | 13 |
Correlation 0.992304.
Table 4.
Missed exams and attempts to pass both courses, IIT and OS.
| Passing Students 3678 | Number of Missed Exams (Times) | Number of Students Missing Exams (%) | Number of Students Per Attempt | Number of Attempts to Pass the Course |
|---|---|---|---|---|
| 0 | 1797 (48.858%) | 422 | 1 | |
| 1 | 744 (20.228%) | 1233 | 2 | |
| 2 | 387 (10.522%) | 830 | 3 | |
| 3 | 225 (6.117%) | 507 | 4 | |
| 4 | 175 (4.758%) | 305 | 5 | |
| 5 | 105 (2.855%) | 160 | 6 | |
| 6 | 89 (2.420%) | 105 | 7 | |
| 7 | 49 (1.332%) | 56 | 8 | |
| 8 | 24 (0.653%) | 28 | 9 | |
| 9 | 18 (0.489%) | 11 | 10 | |
| 10 | 17 (0.462%) | 0 | 11 | |
| 11 | 10 (0.272%) | 0 | 12 | |
| 12 | 14 (0.381%) | 0 | 13 | |
| 13 | 4 (0.109%) | 0 | 14 | |
| 14 | 6 (0.163%) | 0 | 15 | |
| 15 | 3 (0.082%) | 0 | 16 | |
| 16 | 1 (0.027%) | 0 | 17 | |
| 17 | 3 (0.082%) | 0 | 18 | |
| 18 | 3 (0.082%) | 0 | 19 | |
| 20 | 1 (0.027%) | 0 | 20 | |
| 22 | 1 (0.027%) | 0 | 21 | |
| 26 | 1 (0.027%) | 0 | 22 | |
| 31 | 1 (0.027%) | 0 | 23 |
Correlation 0.584724.
Table 5.
Confusion matrix example.
| Predicted as: | |||
|---|---|---|---|
| Positive | Negative | ||
| Actual class | Positive | True Positive (TP) | False Negative (FN) |
| Negative | False Positive (FP) | True Negative (TN) | |
Table 6.
Performance metrics for the IIT course.
| Course: Introduction Information Technology | ||||
|---|---|---|---|---|
| Accuracy | Recall | Precision | F-Measure | |
| Neural Network | 93.3% | 83.6% | 97.7% | 90.1% |
| Logistic Regression | 92.8% | 85.5% | 94.1% | 89.6% |
| Decision Tree | 92.6% | 84.5% | 94.6% | 89.3% |
| XGBoost Trees | 92.6% | 84.3% | 94.8% | 89.3% |
| Random Forest | 92.4% | 84.1% | 94.6% | 89.0% |
| Gradient Boosted Trees | 92.3% | 83.8% | 94.6% | 88.9% |
| Generalized Linear Model (H2O) | 92.2% | 83.6% | 94.3% | 88.6% |
| Naïve Bayes | 92.0% | 85.7% | 91.7% | 88.6% |
Table 7.
Performance metrics for the OS course.
| Course: Operating Systems | ||||
|---|---|---|---|---|
| Accuracy | Recall | Precision | F-Measure | |
| Neural Network | 91.1% | 63.0% | 89.5% | 73.9% |
| Logistic Regression | 88.9% | 59.3% | 80.0% | 68.1% |
| Decision Tree | 91.1% | 68.1% | 84.4% | 75.4% |
| XGBoost Trees | 91.1% | 69.6% | 83.2% | 75.8% |
| Random Forest | 90.1% | 52.6% | 100.0% | 68.9% |
| Gradient Boosted Trees | 91.1% | 64.4% | 87.9% | 74.4% |
| Generalized Linear Model (H2O) | 90.2% | 74.1% | 76.3% | 75.2% |
| Naïve Bayes | 81.3% | 31.1% | 56.0% | 40.0% |
Table 8.
Performance metrics for IIT and OS courses.
| Courses: Introduction Information Technology and Operating Systems | ||||
|---|---|---|---|---|
| Accuracy | Recall | Precision | F-Measure | |
| Neural Network | 94.4% | 88.9% | 95.1% | 91.9% |
| Logistic Regression | 94.0% | 91.1% | 92.2% | 91.6% |
| Decision Tree | 94.6% | 88.9% | 95.8% | 92.2% |
| XGBoost Trees | 94.8% | 89.2% | 96.1% | 92.5% |
| Random Forest | 94.6% | 88.9% | 95.8% | 92.2% |
| Gradient Boosted Trees | 94.8% | 89.2% | 96.1% | 92.5% |
| Generalized Linear Model (H2O) | 94.4% | 88.9% | 95.3% | 92.0% |
| Naïve Bayes | 90.3% | 94.2% | 81.6% | 87.5% |
Table 9.
AutoML’s optimal parameters.
| Algorithm | Optimal Parameters |
|---|---|
| Decision Tree | Quality measure: Gini index Maximal Depth: 8 Pruning: Yes, MDL |
| XGBoost Trees | Updater: Shotgun Feature Selection: Cyclic Lambda: 0.01 Alpha: 0.004 Top k: 5 |
| Random Forest | Number of Trees: 100 Maximal Depth: 4 |
| Gradient Boosted Trees | Number of Trees: 90 Maximal Depth: 7 Learning Rate: 0.03 |
Publisher’s Note: MDPI stays neutral with regard to jurisdictional claims in published maps and institutional affiliations. |
© 2022 by the authors. Licensee MDPI, Basel, Switzerland. This article is an open access article distributed under the terms and conditions of the Creative Commons Attribution (CC BY) license (https://creativecommons.org/licenses/by/4.0/).
Share and Cite
MDPI and ACS Style
Garmpis, S.; Maragoudakis, M.; Garmpis, A. Assisting Educational Analytics with AutoML Functionalities. Computers 2022, 11, 97. https://0-doi-org.brum.beds.ac.uk/10.3390/computers11060097
AMA Style
Garmpis S, Maragoudakis M, Garmpis A. Assisting Educational Analytics with AutoML Functionalities. Computers. 2022; 11(6):97. https://0-doi-org.brum.beds.ac.uk/10.3390/computers11060097
Chicago/Turabian StyleGarmpis, Spyridon, Manolis Maragoudakis, and Aristogiannis Garmpis. 2022. "Assisting Educational Analytics with AutoML Functionalities" Computers 11, no. 6: 97. https://0-doi-org.brum.beds.ac.uk/10.3390/computers11060097
Note that from the first issue of 2016, this journal uses article numbers instead of page numbers. See further details here.