Possibilities of Electromagnetic Penetration of Displays of Multifunction Devices


Department of Electromagnetic Compatibility, Military Communication Institute, Warszawska 22A St., 05-130 Zegrze Poludniowe, Poland
*
Author to whom correspondence should be addressed.
Computers 2020, 9(3), 62; https://0-doi-org.brum.beds.ac.uk/10.3390/computers9030062
Submission received: 15 July 2020
/
Revised: 5 August 2020
/
Accepted: 6 August 2020
/
Published: 8 August 2020
(This article belongs to the Special Issue Feature Paper in Computers)
Abstract
:A protection of information against electromagnetic penetration is very often considered in the aspect of the possibility of obtaining data contained in printed documents or displayed on screen monitors. However, many printing devices are equipped with screens based on LED technology or liquid crystal displays. Options enabling the selection of parameters of the printed document, technical settings of the device (e.g., screen activity time) are the most frequently displayed information. For more extensive displays, more detailed information appears, which may contain data that are not always irrelevant to third parties. Such data can be: names of printed documents (or documents registered and available on the internal media), service password access, user names or regular printer user activity. The printer display can be treated as a source of revealing emissions, like a typical screen monitor. The emissions correlated with the displayed data may allow us to obtain the abovementioned information. The article includes analyses of various types of computer printer displays. The tests results of the existing threat are presented in the form of reconstructed images that show the possibility of reading the text data contained in them.
1. Introduction
Constant technical progress means that more and more advanced electronic devices are present in every area of our lives. We stop paying attention to them, treating them as natural elements of our environment. We gladly use the functions which they offer, using them both at work and outside of it.
Most of us are aware that valuable information should be protected from accidental disclosure [1,2,3]. This applies to monitors, keyboards, printers and so on. Each device is a source of valuable emissions which allow to reconstruct primary information. The information become visible, readable and intelligible ([4,5,6,7], Figure 1). It is possible because information is processed in graphic form. Such sources of electromagnetic emissions are known and popular; therefore, they are protected. In these cases, both hard and soft solutions are used. Electromagnetic shielding, electromagnetic gaskets, power and signal filters, and ferrites are the most popular technical solutions to limit levels of electromagnetic emissions [8,9]. To counteract the electromagnetic eavesdropping process, a software solution can be used [3]. The solution does not limit levels of electromagnetic emissions, but it eliminates the distinctive features of the emissions which would allow the reconstruction of primary information (Figure 2). There are also additional proposed sources of noises which can “cover” the valuable emissions [10]. However, in this case, the noise levels have to be higher than levels of valuable emissions. This is not a good solution in terms of protecting the electromagnetic environment.
However, new technologies are used not only to process typical classified information. Technologies such as monitors—both smaller and bigger—are applied in various electronic devices. They exist in medicine and communication. Displayed information can be important for us [11,12]. The above applies to medical devices and biometric identification, which are used commonly. Parameters of our state of health very often are displayed in graphic form on screens [13,14]. However, we entrust all our secrets to electronic devices, forgetting that they can be valuable not only for us. Especially in large companies, where very extensive systems are used by many users, during the personalization of tasks, leakage of seemingly irrelevant data may occur. Modern copying or printing devices are equipped with advanced touch displays that not only allow to a configuration of the devices, but also allow to view tasks, e.g., printing, previewing the content of documents, user names. This information may be disclosed by electromagnetic emission [15,16,17,18,19]. Then they may pose a threat to the interests of companies.
2. Materials and Methods
There is a lot of talk about typical sources of unwanted emissions in the form of computers, scanners, printers, computer monitors. However, there are many other devices that process data in graphic form. These are not always textual data. These are not always typical documents. Often these are graphical data on the functions provided by printers or the state of monitoring our health. In any case, these are data that should be protected.
This article presents the analysis of printer displays as sources of unwanted emissions.
2.1. Printer Displays
Currently, even the cheapest printers are equipped with displays that facilitate their operation and execution of printing tasks (Figure 3). The menu of such a display is not extensive and contains only basic information about the configuration of the device.
The displays of multifunctional business devices can turn out to be a real mine of knowledge. By their nature, they are autonomous centers of small printing, enabling scanning, duplication, faxing, storage, and printing of documents by many users.
Data scanned or stored on the device can be sent to other users via Ethernet. Devices of this type are equipped with extensive control panels, the main elements of which are touch panels.
Of course, cooperation with the device is possible from the level of computer applications of users connected to the device via the Ethernet, but a lot of important information can also be obtained by monitoring the touch screen. The screen can display usernames, contact details of contractors, and even entered passwords, titles or contents of processed documents.
2.2. LVDS Interface
The touch screen consists of two “layers”, the first (internal) is a traditional LCD screen displaying information, the second (external) is a transparent touch panel enabling the user to interact with the device, usually by simply touching selected specific area using a finger. In this way, it is possible to: “click” icons, expand the menu, and finally enter text. An interface using Low Voltage Differential Signaling (LVDS) is usually used to illustrate information on an LCD screen, i.e., serial, differential data transmission dominating not only in the world of liquid crystal displays, which can be a source of unwanted emissions [24,25,26,27]. The Flat Panel Display Link (FPD-Link) standard is an implementation of this technique in the internal transmission of video data in television sets, monitors or laptops.
2.3. Serializer FPD-Link—Color Mapping
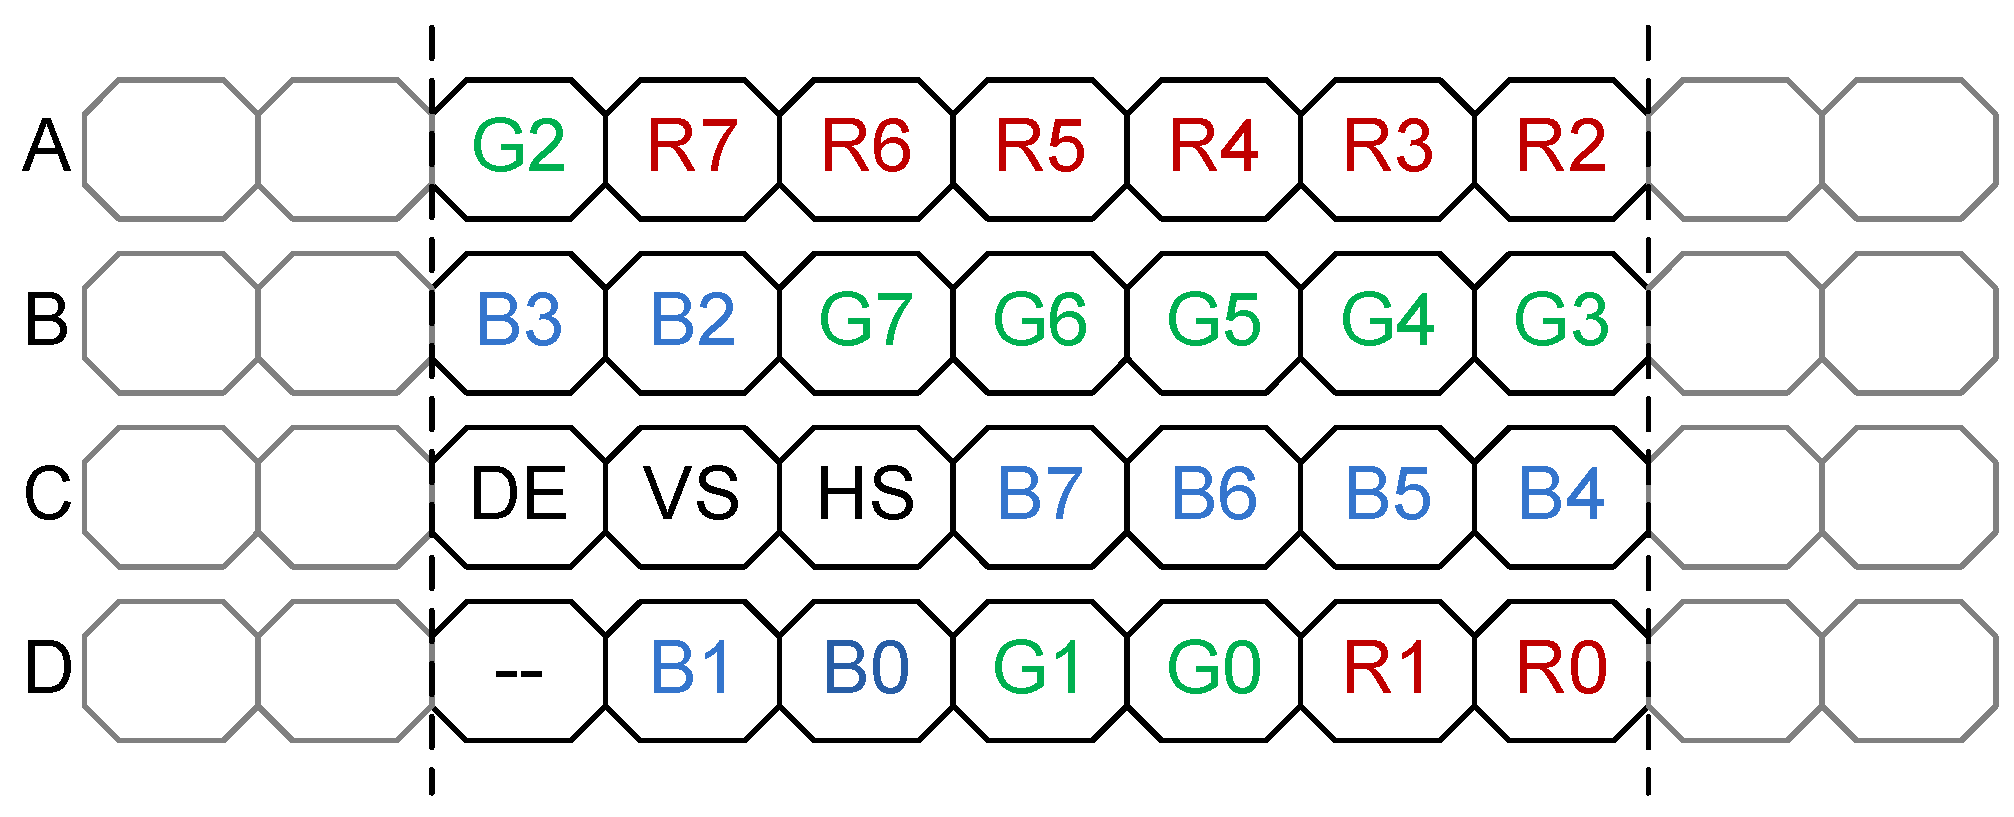
FPD-link was developed by National Semiconductor as an open standard for video data transmission between GPUs and LCD displays. It is a relatively simple transmission protocol, it lacks sophisticated mechanisms for grouping data bits or synchronization. In the transport layer, it uses the LVDS technique (each pair of wires is accompanied by a separate grounding wire). The main executive element on the transmitting side is the serializer converting parallel RGB data streams into serial data strings. The FPD-Link protocol serializer converts RGB video data, vertical (VS) and horizontal (HS) synchronization signals, as well as control data (DE) into serial data streams consisting of groups of 7 bits per one clock cycle. In the case of a typical video interface mapping the colors of pixels using 18 bits, 21 bits are converted in one clock cycle, forming 4 LVDS channels.
The FPD-Link interface can map both 6, 8 and 10-bit RGB color coding (Table 1) and send them in “single-mapping” or “dual-mapping” mode. In the “single-mapping” mode, the color data of all pixels of the image are processed sequentially, in the “dual-mapping” mode, these data are divided into two groups: even pixels and odd pixels. As mentioned above, the synchronization and control bits are additionally transmitted on the lines. The bit mapping in LVDS lines for the “single-mapping” mode is illustrated in the Table 1. In the “dual-mapping” mode, two separate maps are created, one for even pixels and the other for odd ones. Figure 4 shows the data serialization process in case of 8-bit coding. This section may be divided by subheadings. It should provide a concise and precise description of the experimental results and their interpretation, as well as the experimental conclusions that can be drawn.
3. Test Results
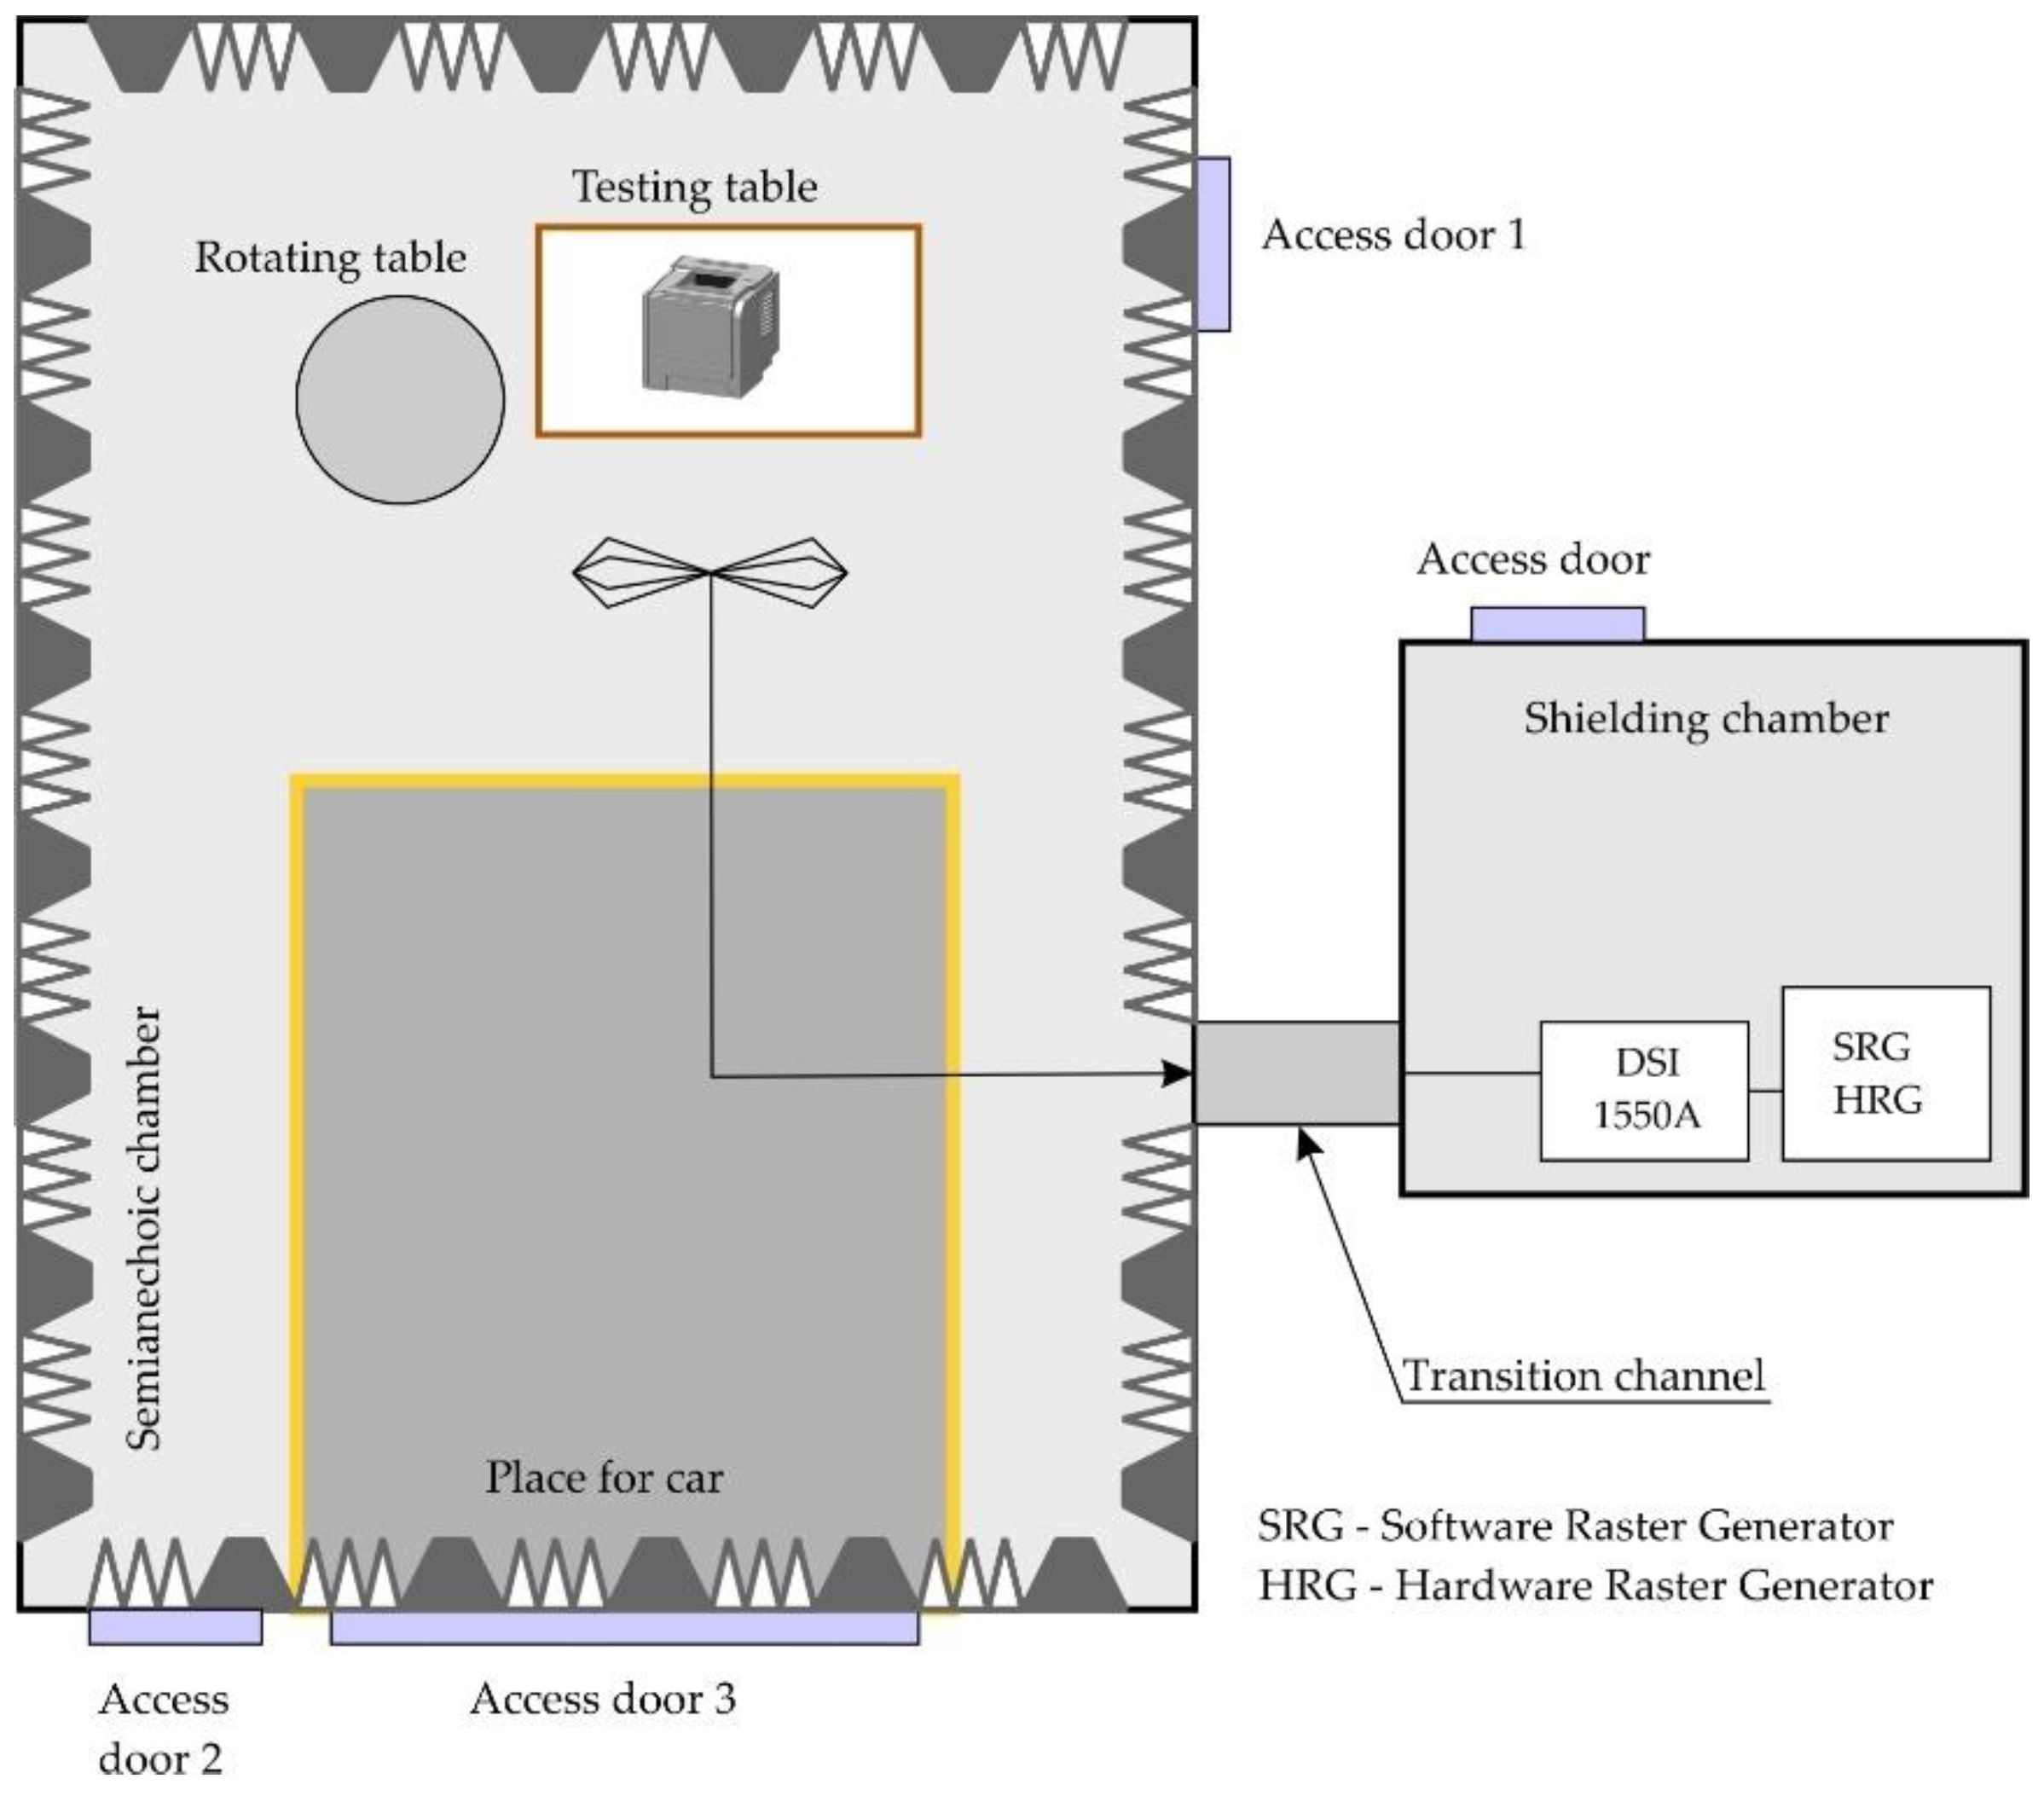
Practical tests were conducted in an anechoic chamber (Figure 5), which attenuation parameter within the scope of the tests, i.e., from 1 MHz to 10 GHz was not lower than 100 dB. Compromising emanations were recorded by using the DSI-1550-A receiver, Microwave Downconverter DSI-1580-A (up to 22 GHz) and a set of R&S antennas: a rod antenna HE525 (100 Hz ÷ 30 MHz), a biconical antenna HE526 (30 MHz ÷ 200 MHz), a dipole antenna HE527 (200 MHz ÷ 1 GHz) and a double ridge horn antenna (EMCO, 1 GHz ÷ 18 GHz, Figure 6). The measurement bandwidths (BW) used for measurements include 5 MHz, 10 MHz, 20 MHz and 100 MHz [28].
A Software Raster Generator (SRG) [29,30] and a Signatec PDA1000 data acquisition card fitted with an 8-bit ADC converter were used correspondingly to generate the image of measured emissions correlated with data processed and to record the analyzed radiated emissions. The card allows users to take signal samples at a throughput of up to 1 GB/s. The SRG has implemented algorithms of digital processes of images and signals, e.g., median filters, histogram transformations, thresholding of the amplitude value of images, Gaussian filters, low pass filters, high pass filters, Laplacian filters, and smoothing edges (Roberts, Prewitt, Sobel). The use of SRG allows us to reconstruct primary information in form of images by the rasterization method [31].
To reconstruct primary information from a printer display, a rasterization method was used (SRG). For this process, the parameters of a displayed image have to be known: a length of the image line and a number of lines in the image. The length of the image line can be also determined by an autocorrelation function for the analyzed emission. Additionally, a Hardware Raster Generator (HRG) [30,32] was used in real time to generate the image of measured emissions correlated with the processed data. This is an external source for the vertical and horizontal sync signals of the measurement monitor image.
The recorded revealing emissions that were subject to further analyses occurred on frequencies: 235 MHz (Color Laser Jet Pro MFP M477fdn), 1177 MHz (HP 507), 411 MHz (Color Laser Jet Pro MFP M277dw) and 5 MHz (Lexmark MS610DE).
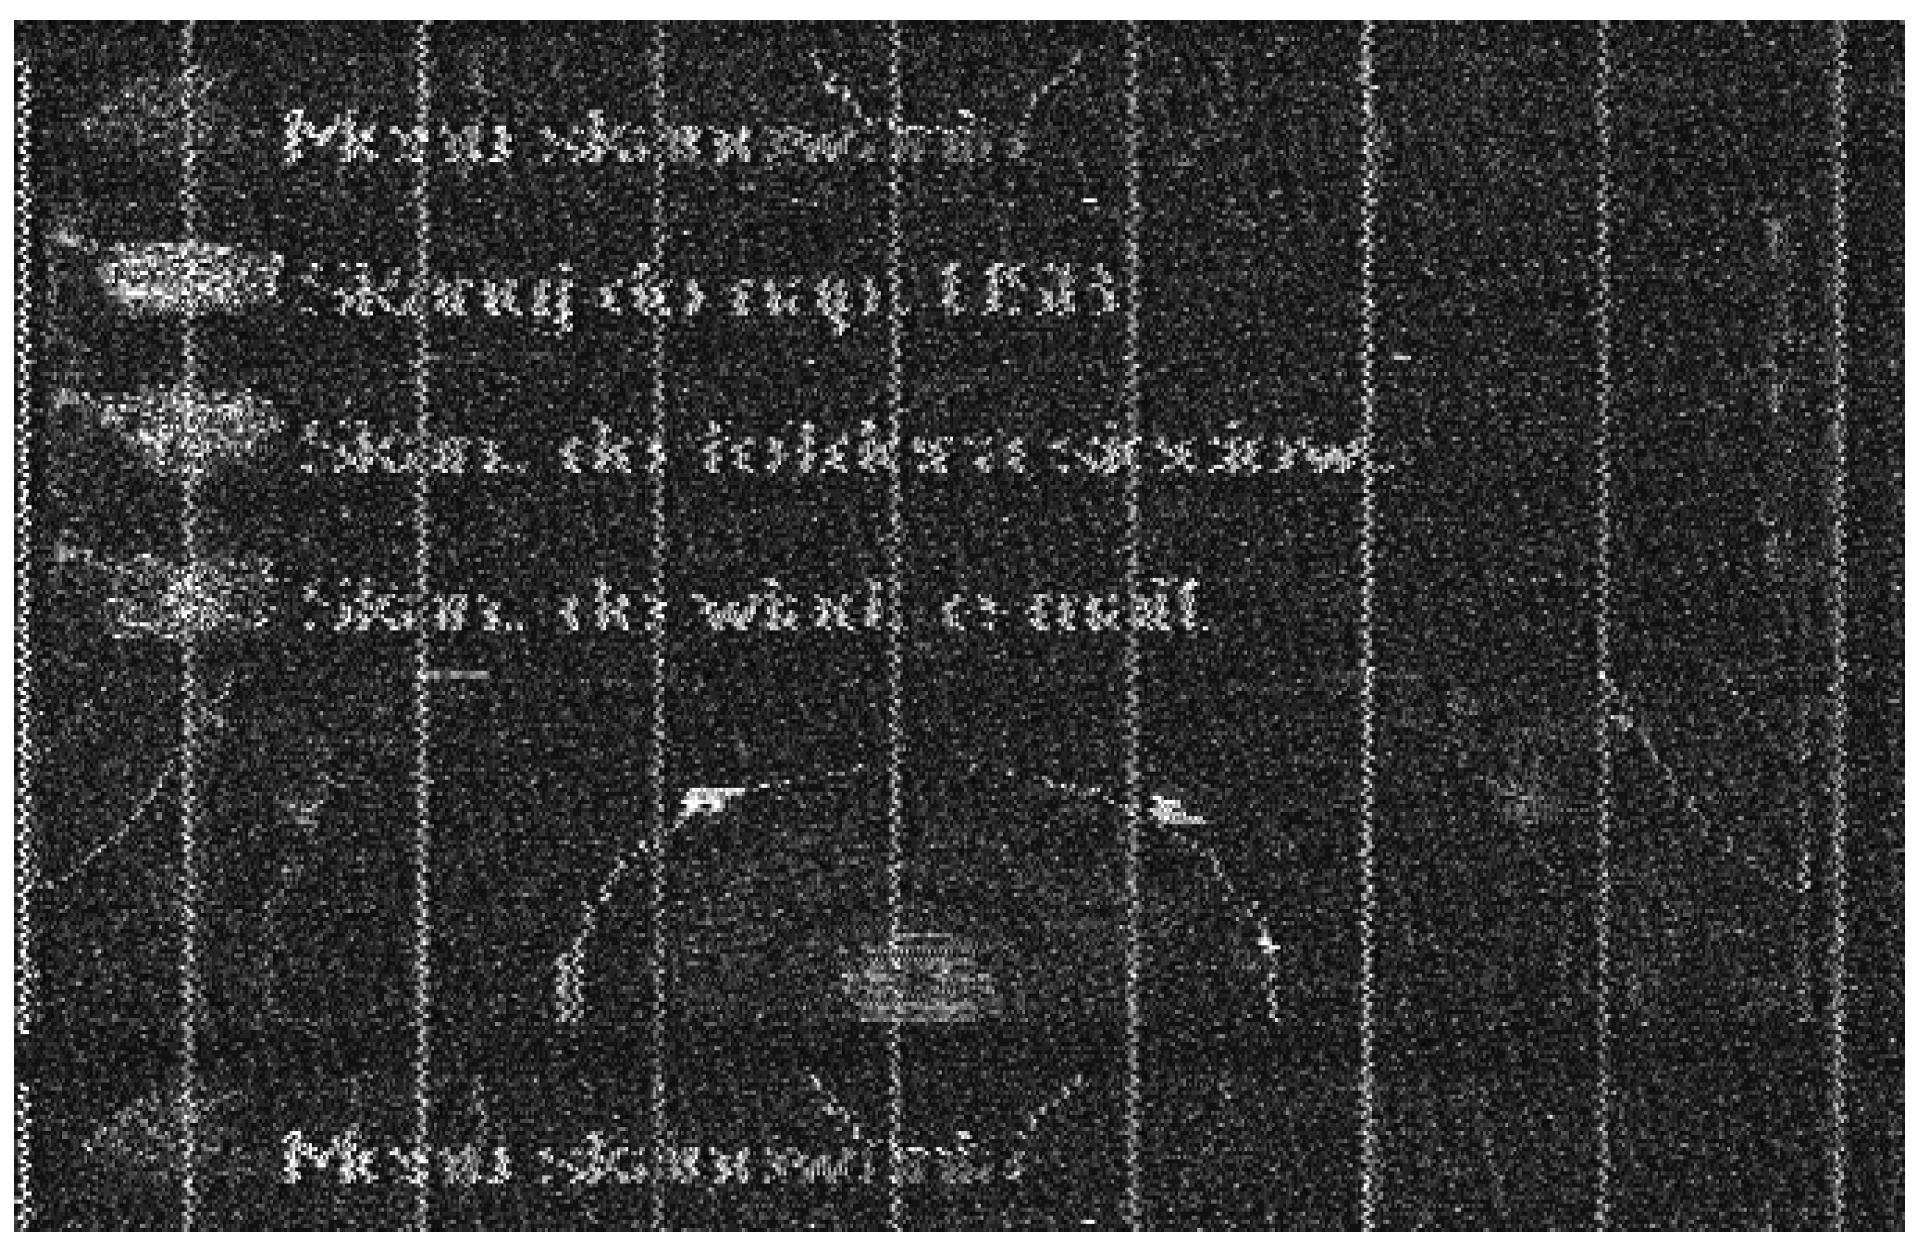
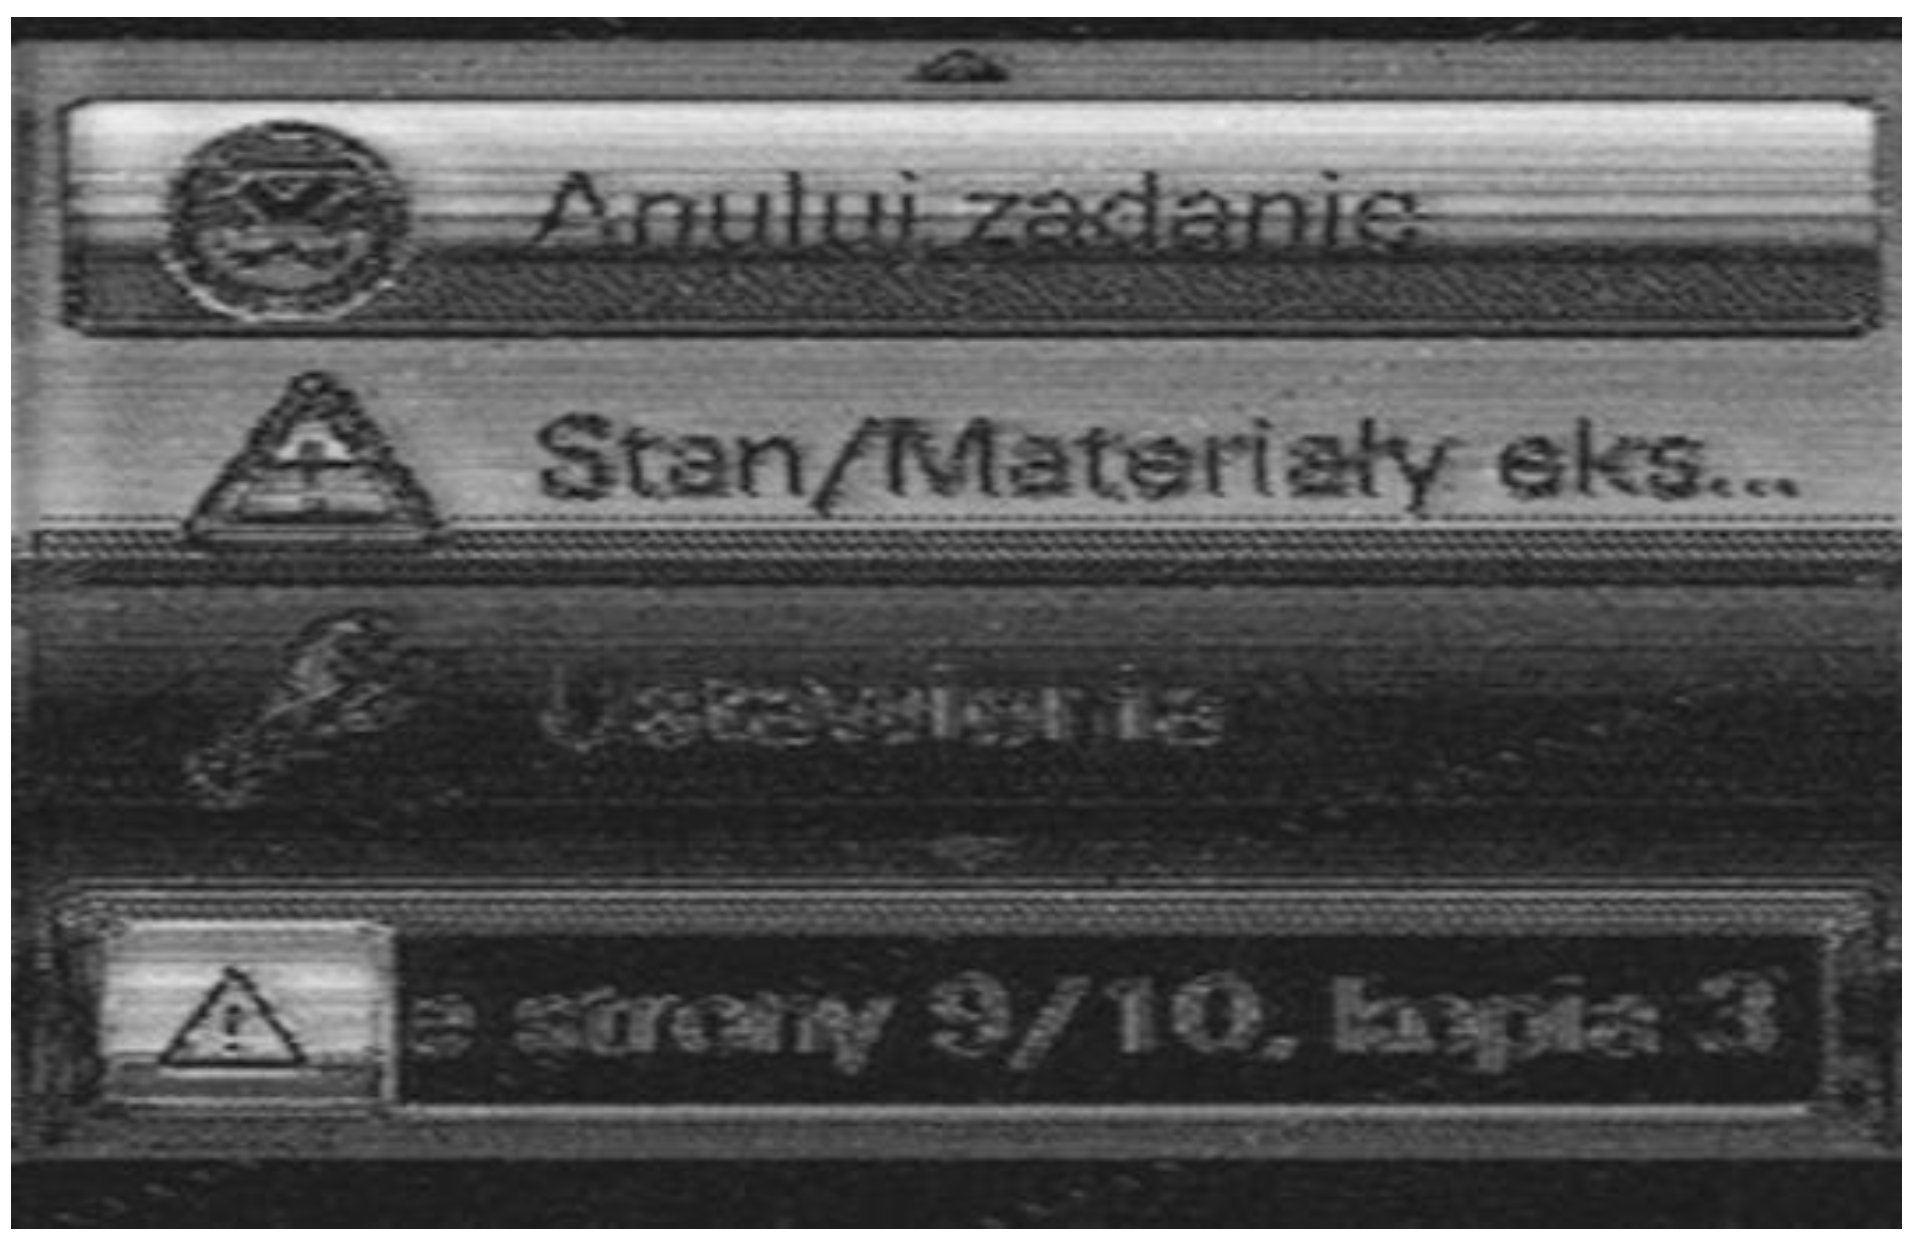
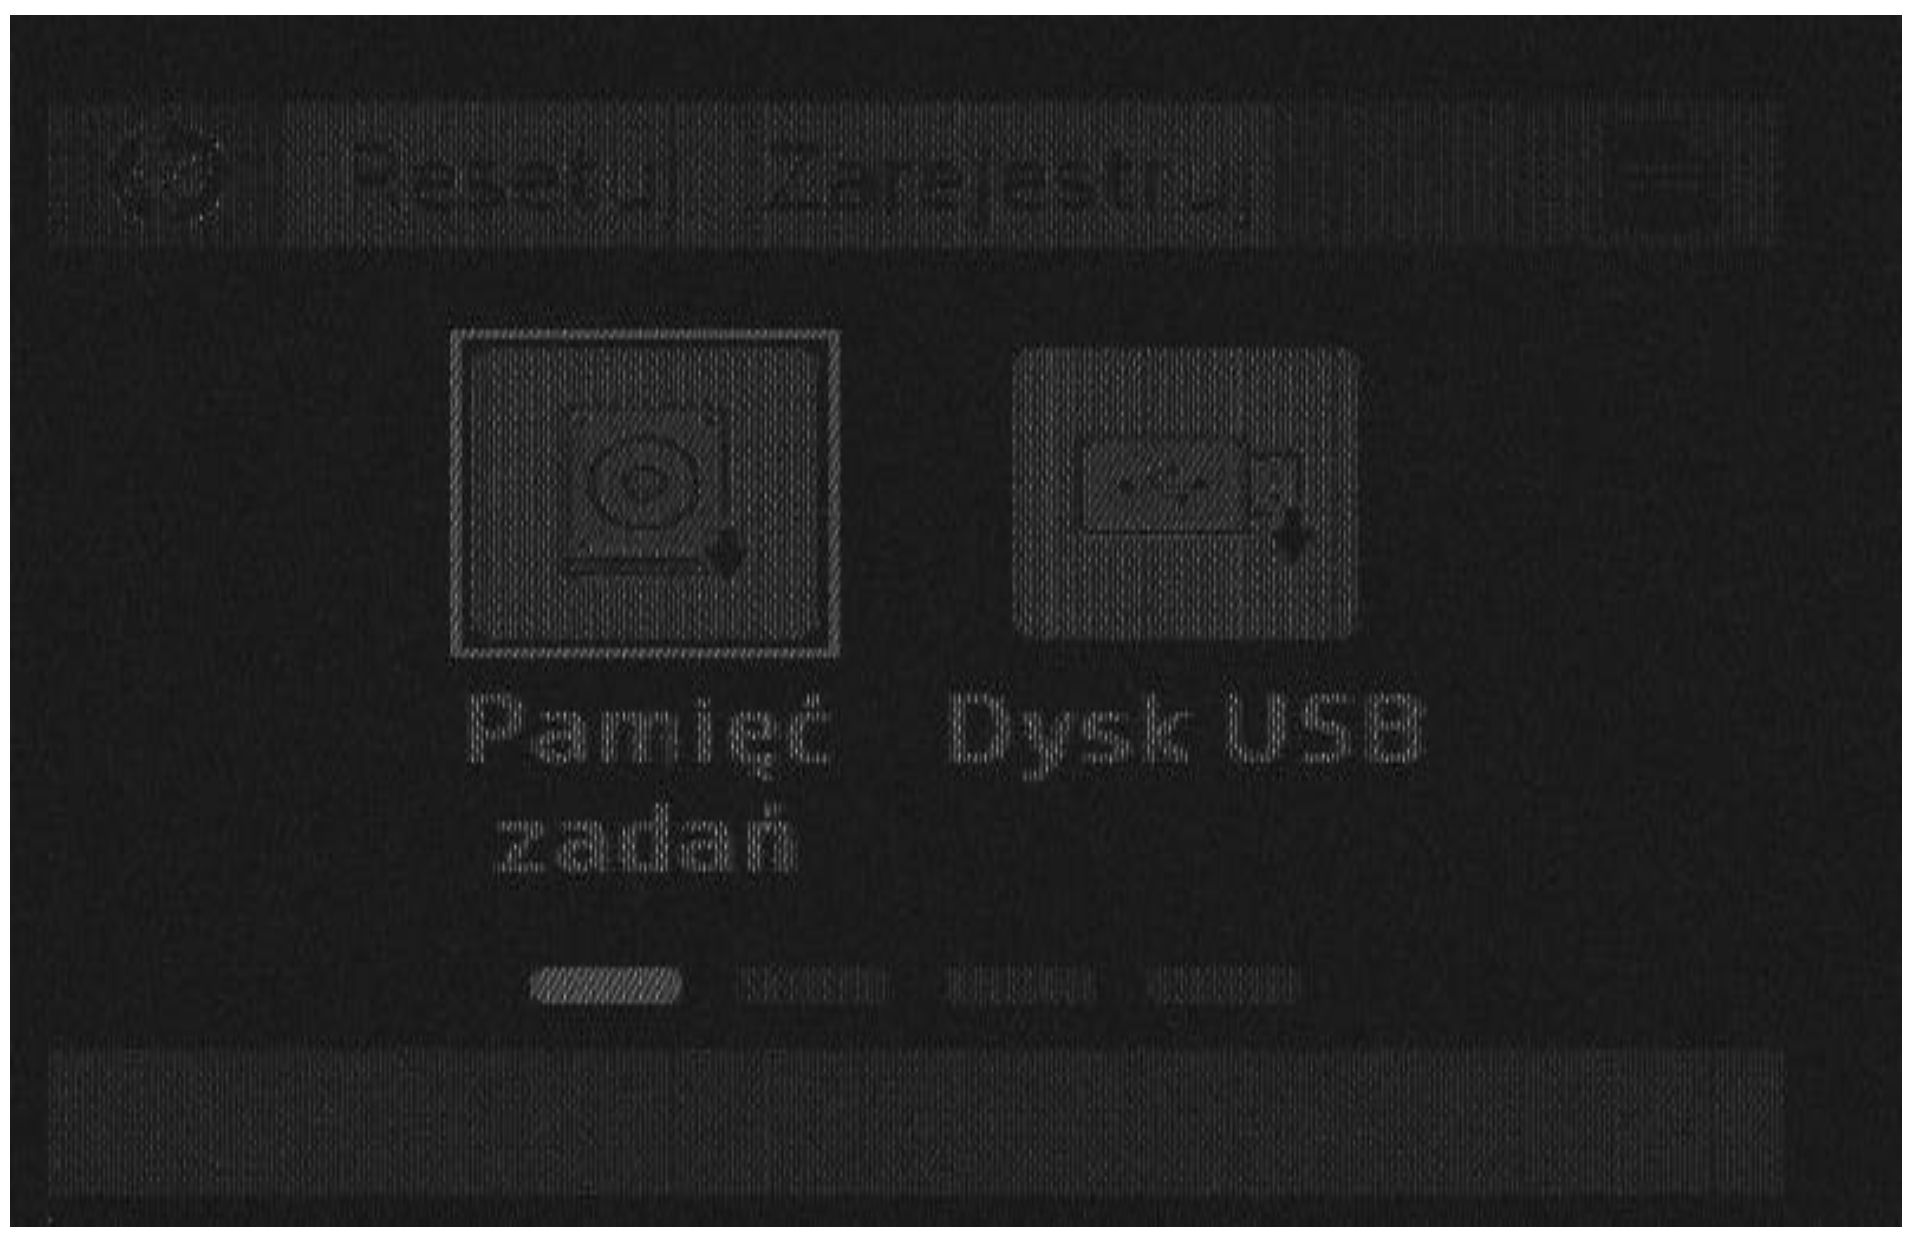
Based on the identified emissions correlated with the information displayed on the printer display images were reconstructed (Figure 7, Figure 8, Figure 9 and Figure 10). The images show that these types of emission sources are also valuable sources in the electromagnetic infiltration process [6,33,34,35,36].
4. Conclusions
The article presents the analysis of threats coming from sources of revealing emissions in the form of laser printer displays. Usually, such sources are considered harmless. However, they may contain important information related to the administrator’s data, username, name of the printed document, or content of the printed document. Often, the content of the document can be viewed by the user before printing. Large-scale displays allow this.
The tests were carried out for the selected printers. These printers worked in standby mode, which enabled displaying data on the tested display. During the tests, a main menu of the printer associated with graphic icons was displayed.
The reproduced images from the recorded revealing emissions show the sensitivity of this type of source to electromagnetic eavesdropping. All menu commands as well as the corresponding graphic images (icon) are legible.
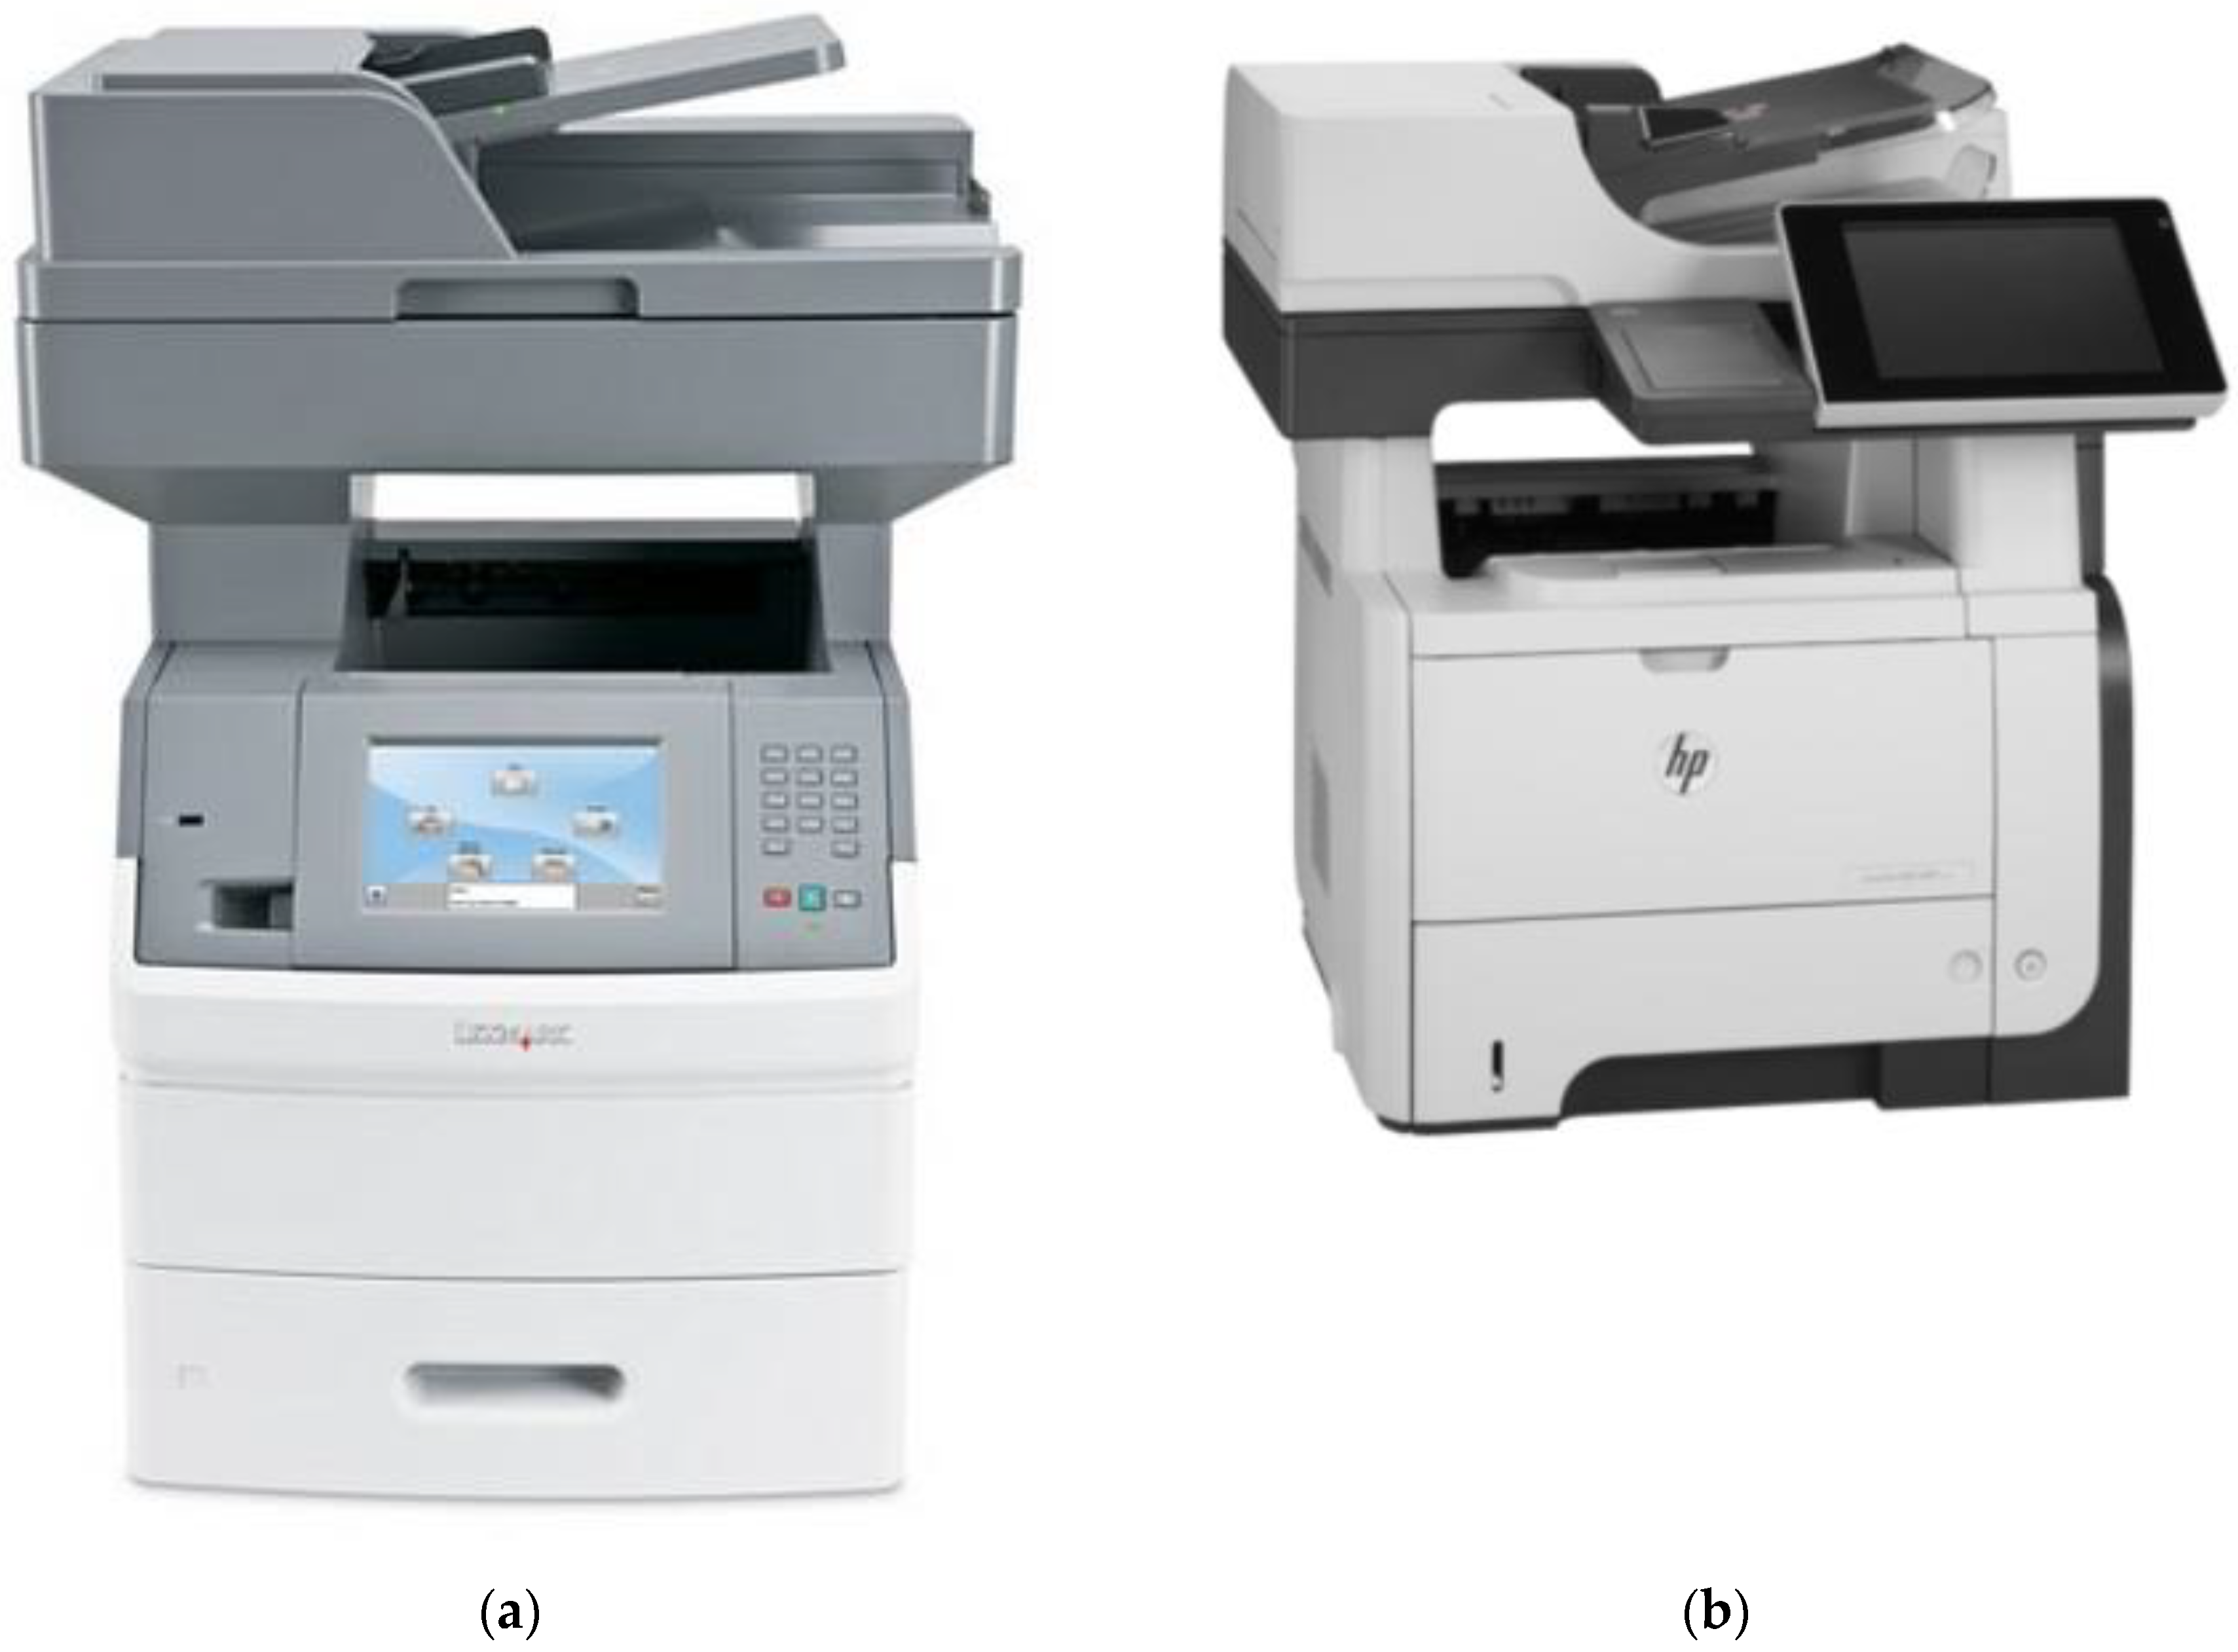
In the further stage of the study, multifunctional devices that are equipped with large size displays will be analyzed (Figure 11). Attempts at reading access passwords by measuring the revealing emissions arising during the touch of selected characters on the touch keyboard will be made. Not without significance, from the viewpoint of electromagnetic infiltration, is the ability to display a graphic image (preview) of pages of a document before printing [10,37,38,39]. This property of displays will also be the object of research and analysis in terms of the possibility of obtaining data by non-invasive methods.
Author Contributions
Conceptualization, A.P. and I.K.; methodology, A.P.; validation, A.P., I.K. and S.M.; formal analysis, A.P., I.K. and S.M.; investigation, A.P. and I.K.; data curation, A.P.; writing—original draft preparation, A.P. and I.K.; writing—review and editing, A.P., I.K. and S.M.; visualization, A.P. and I.K.; supervision, I.K.; project administration, I.K. All authors have read and agreed to the published version of the manuscript.
Funding
This research received no external funding
Conflicts of Interest
The authors declare no conflict of interest.
References
- Loughry, J.; Umphress, D.A. Information Leakage from Optical Emanations. ACM Trans. Inf. Syst. Secur. 2002, 5, 262–289. [Google Scholar] [CrossRef] [Green Version]
- Mahshid, Z.; Saeedeh, H.T.; Ayaz, G. Security limits for Electromagnetic Radiation from CRT Display. In Proceedings of the Second International Conference on Computer and Electrical Engineering, Dubai, United Arab Emirates, 28–30 January 2009; pp. 452–456. [Google Scholar]
- Kubiak, I.; Boitan, A.; Halunga, S. Assessing the Security of TEMPEST Fonts against Electromagnetic Eavesdropping by Using Different Specialized Receivers. Appl. Sci. 2020, 10, 2828. [Google Scholar] [CrossRef] [Green Version]
- Vuagnoux, M.; Pasini, S. Compromising Electromagnetic Emanations of Wired and Wireless Keyboards. In Proceedings of the 18th Conference on USENIX Security Symposium SSYM’09, Montreal, QC, Canada, 10–14 August 2009; pp. 1–16. [Google Scholar]
- Boitan, A.; Bartusica, R.; Halunga, S.; Popescu, M.; Ionuta, I. Compromising Electromagnetic Emanations of Wired USB Keyboards. In Proceedings of the Third International Conference on Future Access Enablers for Ubiquitous and Intelligent Infrastructures (FABULOUS), Bucharest, Romania, 12–14 October 2017. [Google Scholar]
- Zhang, N.; Lu, Y.; Cui, Q.; Wang, Y. Investigation of Unintentional Video Emanations from a VGA Connector in the Desktop Computers. IEEE Trans. Electromagn. Compat. 2017, 59, 1826–1834. [Google Scholar] [CrossRef]
- Macovei, A.; Butnariu, V.; Boitan, A.; Rosu, G.; Trip, B.; Halunga, S. Detection of Electromagnetic Emissions Transmitted on the Power Line Through Electrical Conduction. In Proceedings of the International Conference on Applied and Theoretical Electricity (ICATE), Craiova, Romania, 4–6 October 2018. [Google Scholar]
- Idita, A.; Butnariu, V.; Rosu, G.; Trip, B.; Boitan, A.; Baltag, O. Study of Shielding Effectiveness on Spurious Emissions of Information Systems by Means of Metallic and Carbon Powder Screens. In Proceedings of the International Conference on Applied and Theoretical Electricity (ICATE), Craiova, Romania, 4–6 October 2018. [Google Scholar]
- Lee, H.K.; Kim, J.H.; Kim, Y.H.; Kim, S.C. Emission Security Limits for Compromising Emanations Using Electromagnetic Emanation Security Channel Analysis. IEICE Trans. Commun. 2013, 96, 2639–2649. [Google Scholar] [CrossRef]
- Tajima, K.; Ishikawa, R.; Mori, T.; Suzuki, Y.; Takaya, K. A study on risk evaluation of countermeasure technique for preventing electromagnetic information leakage from ITE. Int. Symp. Electromagn. Compat. 2017, 1, 1–4. [Google Scholar]
- Zagan, I.; Gaitan, V.G.; Petrariu, A.I.; Iuga, N.; Brezulianu, A. Design, Fabrication, and Testing of an IoT Healthcare Cardiac Monitoring Device. Computers 2020, 9, 15. [Google Scholar] [CrossRef] [Green Version]
- Alamri, A. Ontology Middleware for Integration of IoT Healthcare Information Systems in EHR Systems. Computers 2018, 7, 51. [Google Scholar] [CrossRef] [Green Version]
- Miranda, J.; Memon, M.; Cabral, J.; Ravelo, B.; Wagner, S.; Pedersen, C.F.; Mathiesen, M.; Nielsen, C. Eye on Patient Care: Continuous Health Monitoring: Design and Implementation of a Wireless Platform for Healthcare Applications. IEEE Microwav. Mag. 2017, 18, 83–94. [Google Scholar] [CrossRef]
- Miranda, J.; Cabral, J.; Wagner, S.; Pedersen, C.F.; Ravelo, B.; Memon, M.; Mathiesen, M. Open Platform for Seamless Sensor Support in Healthcare for the Internet of Things. Sensors 2016, 16, 2089. [Google Scholar] [CrossRef] [PubMed] [Green Version]
- Jun, S.; Yongacoglu, A.; Sun, D.; Zhang, M.; Dong, W. Computer LCD recognition based on the compromising emanations in cyclic frequency domain. In Proceedings of the IEEE International Symposium on Electromagnetic Compatibility, Ottawa, ON, Canada, 25–29 July 2016; pp. 164–169. [Google Scholar]
- Lee, H.S.; Yook, J.G.; Sim, K. Analysis of information leakage from display devices with LCD. In Proceedings of the URSI Asia-Pacific Radio Science Conference, Seoul, Korea, 21–25 August 2016. [Google Scholar]
- Przybysz, A. Emission security of DVI and HDMI interfaces. Telecommun. Rev. Telecommun. News. 2014, 7, 669–673. [Google Scholar]
- Kubiak, I. The Influence of the Structure of Useful Signal on the Efficacy of Sensitive Emission of Laser Printers. Measurement. 2018, 119, 63–76. [Google Scholar] [CrossRef]
- Kubiak, I. Font Design—Shape Processing of Text Information Structures in the Process of Non-Invasive Data Acquisition. Computers 2019, 8, 70. [Google Scholar] [CrossRef] [Green Version]
- Song, T.L.; Yook, J.G. Study of jamming countermeasure for electromagnetically leaked digital video signals. In Proceedings of the IEEE International Symposium on Electromagnetic Compatibility, Gothenburg, Sweden, 1–4 September 2014. [Google Scholar]
- Kubiak, I. Influence of the method of colors on levels of electromagnetic emissions from video standards. IEEE Trans. Electromagn. Compat. 2018, 61, 1129–1137. [Google Scholar] [CrossRef]
- MIL-STD-461G, Requirements for the Control of Electromagnetic Interference Characteristics of Subsystems and Equipment. 2015. Available online: https://www.atecorp.com/atecorp/media/pdfs/data-sheets/mil-std-461g.pdf (accessed on 11 December 2015).
- Sim, D.; Lee, H.S.; Yook, J.G.; Sim, K. Measurement and Analysis of the Compromising Electromagnetic Emanations from USB Keyboard. In Proceedings of the Digests 7th Asia-Pacific International Symposium on Electromagnetic Compatibility (APEMC), Shenzhen, China, 17–21 May 2016. [Google Scholar]
- Prvulovic, M.; Zajic, A.; Callan, R.L.; Wang, C.J. A Method for Finding Frequency-Modulated and Amplitude-Modulated Electromagnetic Emanations in Computer Systems. IEEE Trans. Electromagn. Compat. 2017, 59, 34–42. [Google Scholar] [CrossRef]
- Guri, M.; Elovici, Y. Exfiltration of information from air-gapped machines using monitor’s LED indicator. In Proceedings of the 2014 IEEE Joint Intelligence and Security Informatics Conference, Hague, The Netherlands, 24–26 September 2014; pp. 264–267. [Google Scholar]
- Maneki, S.; Maneki, S.A. Learning from the Enemy: The GUNMAN Project; United States Cryptologic History: Fort Meade, MD, USA, 2007.
- Birukawa, R.; Hayashi, Y.; Mizuki, T.; Sone, H. A study on an Effective Evaluation Method for EM Information Leakage without Reconstructing Screen. In Proceedings of the International Symposium and Exhibition on Electromagnetic Compatibility (EMC Europe 2019), Barcelona, Spain, 2–6 September 2019. [Google Scholar]
- Kubiak, I.; Przybysz, A. DVI (HDMI) and DisplayPort digital video interfaces in electromagnetic eavesdropping process. In Proceedings of the 2019 International Symposium on Electromagnetic Compatibility (EMC Europe 2019), Barcelona, Spain, 2–6 September 2019. [Google Scholar]
- Kubiak, I. Digital processing methods of images and signals in electromagnetic infiltration process. Image Process. Commun. 2014, 18, 5–14. [Google Scholar] [CrossRef] [Green Version]
- Kubiak, I.; Grzesiak, K.; Musiał, S.; Przybysz, A. A Raster Generator in an Electromagnetic Infiltration Process, Monograph; Publishing House of Military University of Technology: Bucharest, Romania, 2012. [Google Scholar]
- Kubiak, I. Methods of Analysis and Digital Processing of Images in the Electromagnetic Infiltration Process, Monograph; Publishing House of Military University of Technology: Warsaw, Poland, 2013. [Google Scholar]
- Kubiak, I.; Musiał, S. Hardware Raster Generator as a tool supporting of an electromagnetic infiltration. Telecommun. Rev. Telecommun. News 2011, 11, 1601–1607. [Google Scholar]
- Kobayashi, A. DisplayPort Ver.1.2 Overview. Available online: http://www.vesa.org/wp-content/uploads/2010/12/DisplayPort-DevCon-Presentation-DP-1.2-Dec-2010-rev-2b.pdf. (accessed on 6 December 2010).
- Balzarotti, D.; Cova, M.; Vigna, G. ClearShot: Eavesdropping on keyboard input from video. In Proceedings of the 2008 IEEE Symposium on Security and Privacy, Oakland, CA, USA, 18–21 May 2008. [Google Scholar]
- Loughry, J. (“Oops! Had the silly thing in reverse”)—Optical injection attacks in through LED status indicators. In Proceedings of the International Symposium and Exhibition on Electromagnetic Compatibility (EMC Europe 2019), Barcelona, Spain, 2–6 September 2019. [Google Scholar]
- Loughry, J. Optical TEMPEST. In Proceedings of the International Symposium and Exhibition on Electromagnetic Compatibility (EMC Europe 2018), Amsterdam, The Netherlands, 27–30 August 2018. [Google Scholar]
- Kubiak, I. Impact of IT Devices Production Quality on the Level of Protection of Processed Information against the Electromagnetic Infiltration Process. Electronics 2019, 8, 1054. [Google Scholar] [CrossRef] [Green Version]
- Kubiak, I.; Loughry, J. LED Arrays of Laser Printers as sources of Valuable Emissions for Electromagnetic Penetration Process. Electronics 2019, 8, 1078. [Google Scholar] [CrossRef] [Green Version]
- Ulas, C.; Asik, U.; Karadeniz, C. Analysis and reconstruction of laser printer information leakages in the media of electromagnetic radiation, power, and signal lines. Comput. Secur. 2016, 58, 250–267. [Google Scholar] [CrossRef]
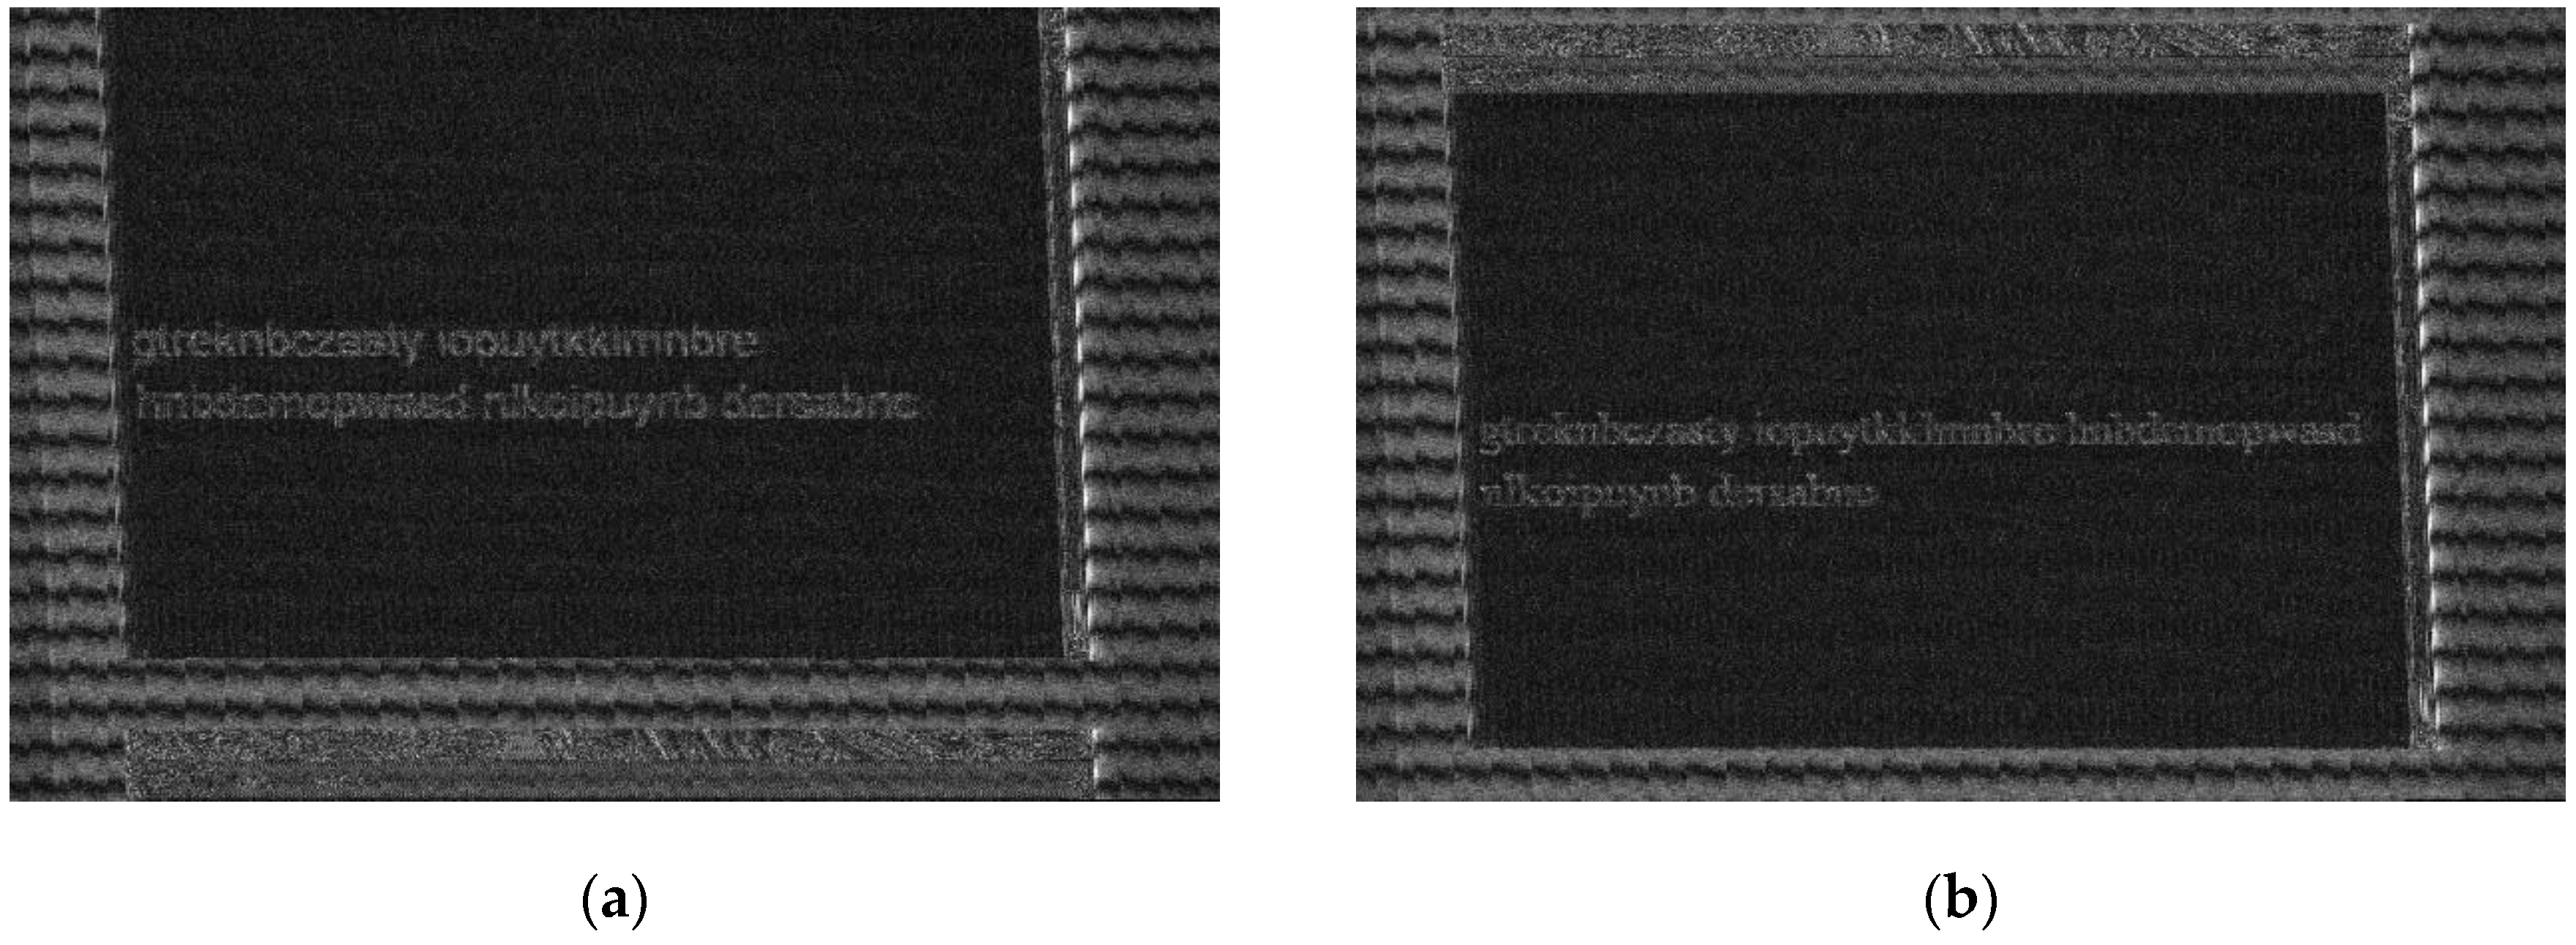
Figure 1.
Image obtained on the basis of revealing emission measured on frequency fo = 365 MHz (BW = 50 MHz) for the source in form of DVI standard (resolution 800 × 600, 60 Hz): (a) Arial font, (b) Times New Roman font.
Figure 1.
Image obtained on the basis of revealing emission measured on frequency fo = 365 MHz (BW = 50 MHz) for the source in form of DVI standard (resolution 800 × 600, 60 Hz): (a) Arial font, (b) Times New Roman font.

Figure 2.
Image obtained on the basis of revealing emission measured on frequency fo = 365 MHz (BW = 50 MHz) for the source in form of DVI standard (resolution 800 × 600, 60 Hz), from the top: Secure Symmetrical font (first and second lines), Secure Asymmetrical font (third and fourth lines), Secure Simple font (fifth and sixth lines).

Figure 3.
Four different laser printers used during tests of valuable emissions from displays: (a) Color Laser Jet Pro MFP M477fdn, (b) Color Laser Jet Pro MFP M277dw, (c) Lexmark MS610DE (a source: https://www.lexmark.com/pl_pl/printer/7693/Lexmark-MS610dn), (d) HP 507 (a source: https://www8.hp.com/pl_pl/printers/product-details/19203858).

Figure 4.
Data serialization process in case of 8-bit coding.

Figure 5.
Measuring system.

Figure 6.
A real measuring system.

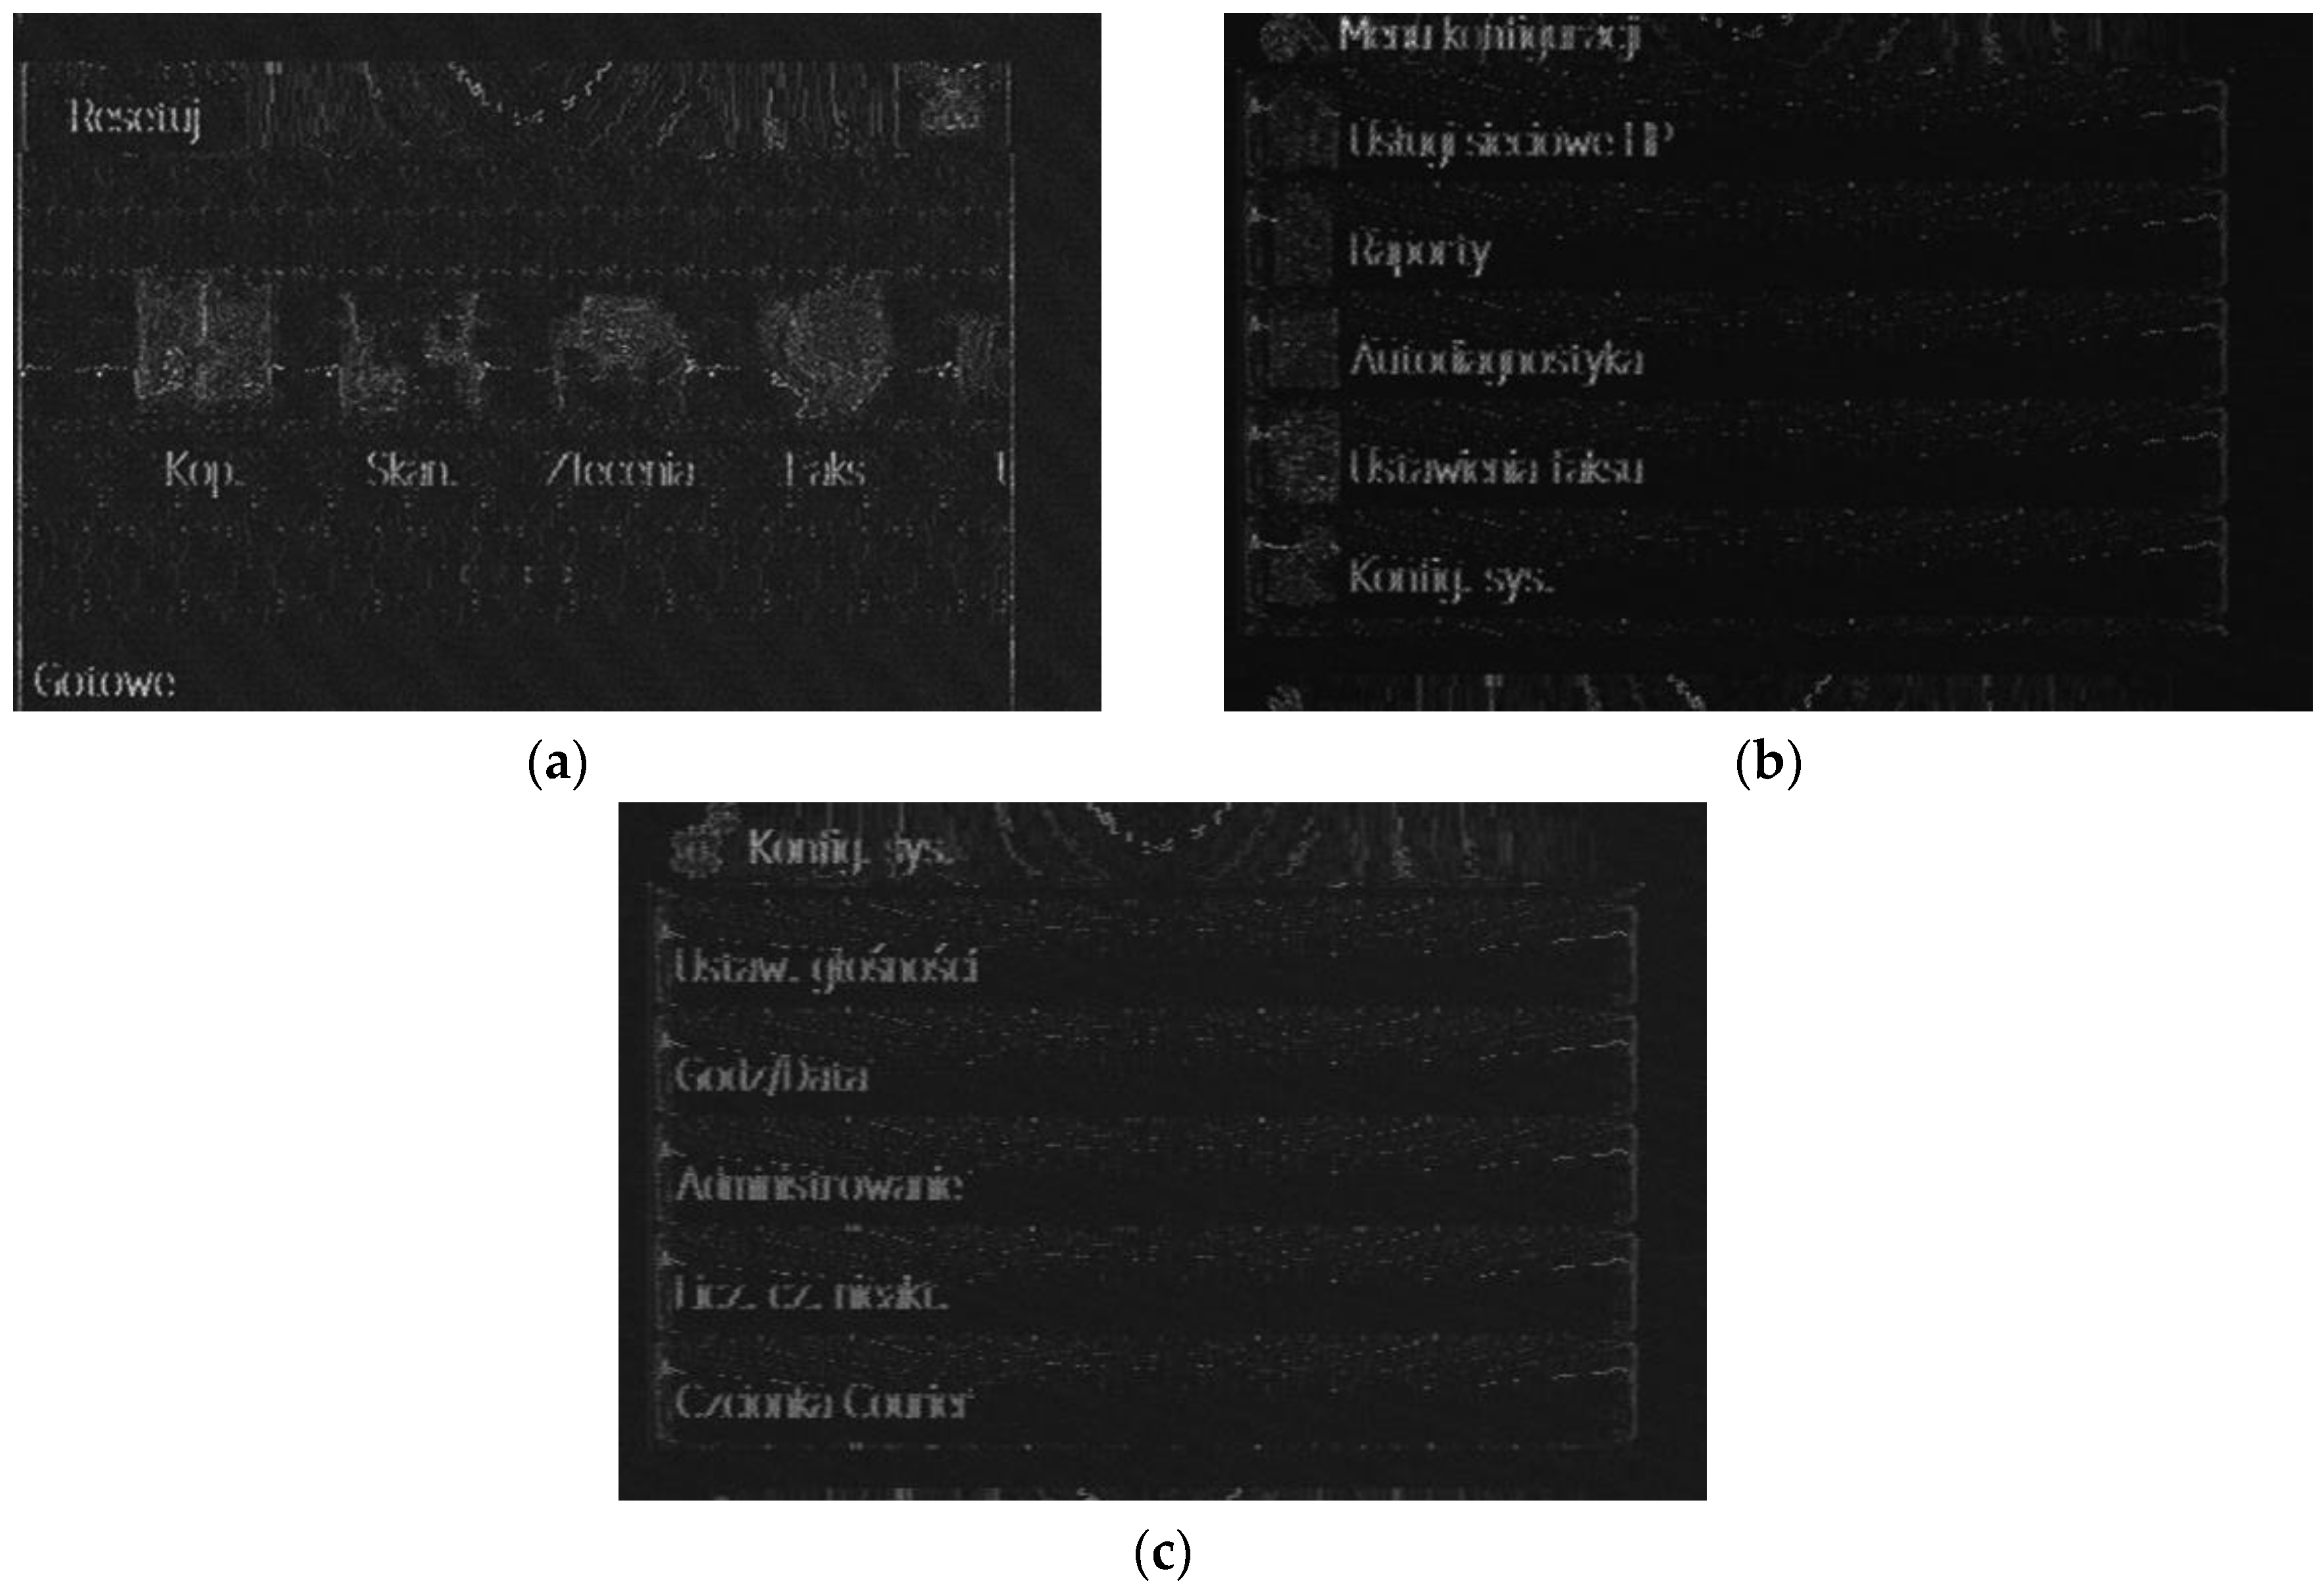
Figure 7.
Images obtained on the basis of revealing emissions (fo = 235 MHz, BW = 20 MHz (a), 10 MHz (b), 5 MHz (c)) for the sources in form of printer displays (Figure 3a).
Figure 7.
Images obtained on the basis of revealing emissions (fo = 235 MHz, BW = 20 MHz (a), 10 MHz (b), 5 MHz (c)) for the sources in form of printer displays (Figure 3a).

Figure 8.
Image obtained on the basis of revealing emissions measured on frequency fo = 411 MHz (BW = 10 MHz) for the source in form of printer display (Figure 3b).
Figure 8.
Image obtained on the basis of revealing emissions measured on frequency fo = 411 MHz (BW = 10 MHz) for the source in form of printer display (Figure 3b).

Figure 9.
Image obtained on the basis of revealing emission measured on frequency fo = 15 MHz (BW = 5 MHz) for the source in form of printer display (Figure 3c).
Figure 9.
Image obtained on the basis of revealing emission measured on frequency fo = 15 MHz (BW = 5 MHz) for the source in form of printer display (Figure 3c).

Figure 10.
Image obtained on the basis of revealing emission measured on frequency fo = 1177 MHz (BW = 100 MHz) for the source in form of printer display (Figure 3d).
Figure 10.
Image obtained on the basis of revealing emission measured on frequency fo = 1177 MHz (BW = 100 MHz) for the source in form of printer display (Figure 3d).

Figure 11.
Examples of multifunctional devices equipped with large size displays: (a) Lexmark X651DE (https://www.lexmark.com/pl_pl/printer/4831/Lexmark-X651de), (b) HP M525f MFP (source: https://sklephp.pl/drukarki/urzadzenie-wielofunkcyjne-hp-laserjet-enterprise-500-mfp-m525dn).
Figure 11.
Examples of multifunctional devices equipped with large size displays: (a) Lexmark X651DE (https://www.lexmark.com/pl_pl/printer/4831/Lexmark-X651de), (b) HP M525f MFP (source: https://sklephp.pl/drukarki/urzadzenie-wielofunkcyjne-hp-laserjet-enterprise-500-mfp-m525dn).


Table 1.
Mapping of a parallel RGB data stream into a serial LVDS stream (6, 8 and 10 bit color depth).
Table 1.
Mapping of a parallel RGB data stream into a serial LVDS stream (6, 8 and 10 bit color depth).
| 6-bit | 8-bit | b-bit (Alter) | 10-bit | |
|---|---|---|---|---|
| A0 | R0 | R2 | R0 | R4 |
| A1 | R1 | R3 | R1 | R5 |
| A2 | R2 | R4 | R2 | R6 |
| A3 | R3 | R5 | R3 | R7 |
| A4 | R4 | R6 | R4 | R8 |
| A5 | R5 | R7 | R5 | R9 |
| A6 | G0 | G2 | G0 | G4 |
| B0 | G1 | G3 | G1 | G5 |
| B1 | G2 | G4 | G2 | G6 |
| B2 | G3 | G5 | G3 | G7 |
| B3 | G4 | G6 | G4 | G8 |
| B4 | G5 | G7 | G5 | G9 |
| B5 | B0 | B2 | B0 | B4 |
| B6 | B1 | B3 | B1 | B5 |
| C0 | B2 | B4 | B2 | B6 |
| C1 | B3 | B5 | B3 | B7 |
| C2 | B4 | B6 | B4 | B8 |
| C3 | B5 | B7 | B5 | B9 |
| C4 | HS | HS | HS | HS |
| C5 | VS | VS | VS | VS |
| C6 | DE | DE | DE | DE |
| D0 | R0 | R0 | R2 | |
| D1 | R1 | R1 | R3 | |
| D2 | G0 | G0 | G2 | |
| D3 | G1 | G1 | G3 | |
| D4 | B0 | B0 | B2 | |
| D5 | B1 | B1 | B3 | |
| D6 | N/A | N/A | N/A | |
| E0 | R0 | |||
| E1 | R1 | |||
| E2 | G0 | |||
| E3 | G1 | |||
| E4 | B0 | |||
| E5 | B1 | |||
| E6 | N/A |
© 2020 by the authors. Licensee MDPI, Basel, Switzerland. This article is an open access article distributed under the terms and conditions of the Creative Commons Attribution (CC BY) license (http://creativecommons.org/licenses/by/4.0/).
Share and Cite
MDPI and ACS Style
Kubiak, I.; Przybysz, A.; Musial, S. Possibilities of Electromagnetic Penetration of Displays of Multifunction Devices. Computers 2020, 9, 62. https://0-doi-org.brum.beds.ac.uk/10.3390/computers9030062
AMA Style
Kubiak I, Przybysz A, Musial S. Possibilities of Electromagnetic Penetration of Displays of Multifunction Devices. Computers. 2020; 9(3):62. https://0-doi-org.brum.beds.ac.uk/10.3390/computers9030062
Chicago/Turabian StyleKubiak, Ireneusz, Artur Przybysz, and Slawomir Musial. 2020. "Possibilities of Electromagnetic Penetration of Displays of Multifunction Devices" Computers 9, no. 3: 62. https://0-doi-org.brum.beds.ac.uk/10.3390/computers9030062
Note that from the first issue of 2016, this journal uses article numbers instead of page numbers. See further details here.