Article

Delineating Functional Corridors Linking Leopard Habitat in the Eastern and Western Cape, South Africa

1
Research Deptartment Landmark Foundation, Riversdale 6670, South Africa
2
Biodiversity and Conservation Biology Department, University of the Western Cape, Bellville 7535, South Africa
*
Author to whom correspondence should be addressed.
Submission received: 11 December 2021 / Revised: 25 January 2022 / Accepted: 26 January 2022 / Published: 23 February 2022
(This article belongs to the Special Issue Ecological Connectivity Analysis and Management)

Abstract

:
Natural landscapes are increasingly fragmented due to human activity. This contributes to isolation and inadequate gene flow among wildlife populations. These threats intensify where populations are already low, and gene flow is compromised. Ensuring habitat connectivity despite transformed landscapes can mitigate these risks. Leopards are associated with high levels of biodiversity and are the last widely occurring, free-roaming apex predator in South Africa. Although highly adaptable, leopard survival is reduced by human-caused mortality and habitat destruction. We aimed to assess the connectivity of leopard habitat in the Eastern Cape and Western Cape, South Africa. We predicted leopard habitat by correlating GPS data from 31 leopards to environmental features that included human-associated and natural landscapes. We used circuit theory to delineate corridors linking known leopard populations. Finally, using camera traps, we tested whether five predicted corridors were used by leopards. Leopard habitat was strongly correlated to moderate slopes and areas of natural land-cover and plantations, highlighting mountainous areas as important habitat with high connectivity probability. While most habitat patches showed some level of connectivity, leopards avoided highly transformed landscapes, potentially isolating some populations. Where corridors are not functional, active conservation measures for species connectivity becomes important.

1. Introduction

Major threats to ecosystem functioning include the loss of biodiversity and habitat fragmentation due to human activities [1]. As a result, wildlife populations may become increasingly isolated from one another [2,3,4], increasing the likelihood of inbreeding and genetic drift-induced differentiation [2,4,5]. Broader ecological impacts of isolation include higher levels of intra- and interspecific competition in isolated habitat patches [6,7], and a resulting displacement of individuals into high-risk areas with increased anthropogenic effects [8,9].
Ensuring inter-patch connectivity in fragmented environments is paramount to mitigating the effects of isolation and improving species survival [3]. Two broad definitions of connectivity exist: structural and functional [10]. A structural corridor describes the physical environment and excludes the behavioural response of individuals [10]. Alternatively, a corridor becomes functional when it enables individuals to move along these corridors, promoting inter-path connectivity and enhancing genetic exchange [10,11,12]. Therefore, the ability of individuals to move across the landscape depends on complex interactions. For example, human-associated landscapes often contain barriers to animal movement such as linear transport lines [13], transformed landscapes (e.g., cultivated areas [14]) and human-caused mortality, either accidentally (e.g., vehicle collisions) or intentionally (e.g., hunting, human–wildlife conflict; [15,16]). Similarly, natural landscapes can also contain barriers (e.g., steep ravines, large lakes [17]), while prey availability and distribution also contribute to species distribution (e.g., resource dispersion hypothesis, [18]).
Understanding the factors driving habitat selection provides opportunities to predict species distribution, and to identify potential functional corridors linking populations [19]. We used a multivariate approach, maximum entropy (Maxent), to correlate species presence data and environmental covariates to predict habitat distribution of species across the landscape [20]. The isolation by resistance hypothesis (IBR) [21] predicts a positive correlation between the isolation of populations and the level of resistance separating these populations. Low-quality habitat and non-habitat may have scarce resources and a high mortality risk, resulting in landscapes with higher resistance, while high-quality habitat contains abundant resources and low mortality risk, providing a permeable landscape. By incorporating species habitat distribution, derived using data from the target species, as a resistance landscape into corridor modelling, functional corridors can be delineated using circuit theory [21,22]. Circuit theory considers movement based on random walk algorithms and assumes the individual has no insight into landscape heterogeneity, thereby predicting many potential routes for current flow where there is the least resistance [21,22]. Incorporating spatial heterogeneity of landscapes along with random walk considerations gives IBR a strong theoretical foundation for predicting functional corridors [19,23,24].
Their large spatial requirements, low reproductive rates, strong association with high species richness, and their regularity roles in terrestrial ecosystems make large carnivores a useful focal species to predict landscape connectivity at regional scale for sympatric species [25,26,27]. Despite being highly adaptable and able to occupy a wide range of environments, leopard (Panthera pardus) survival is threatened by habitat loss and fragmentation [15,25]. These threats are further compounded by human-caused mortality due to human-carnivore conflict, and hunting [15,28,
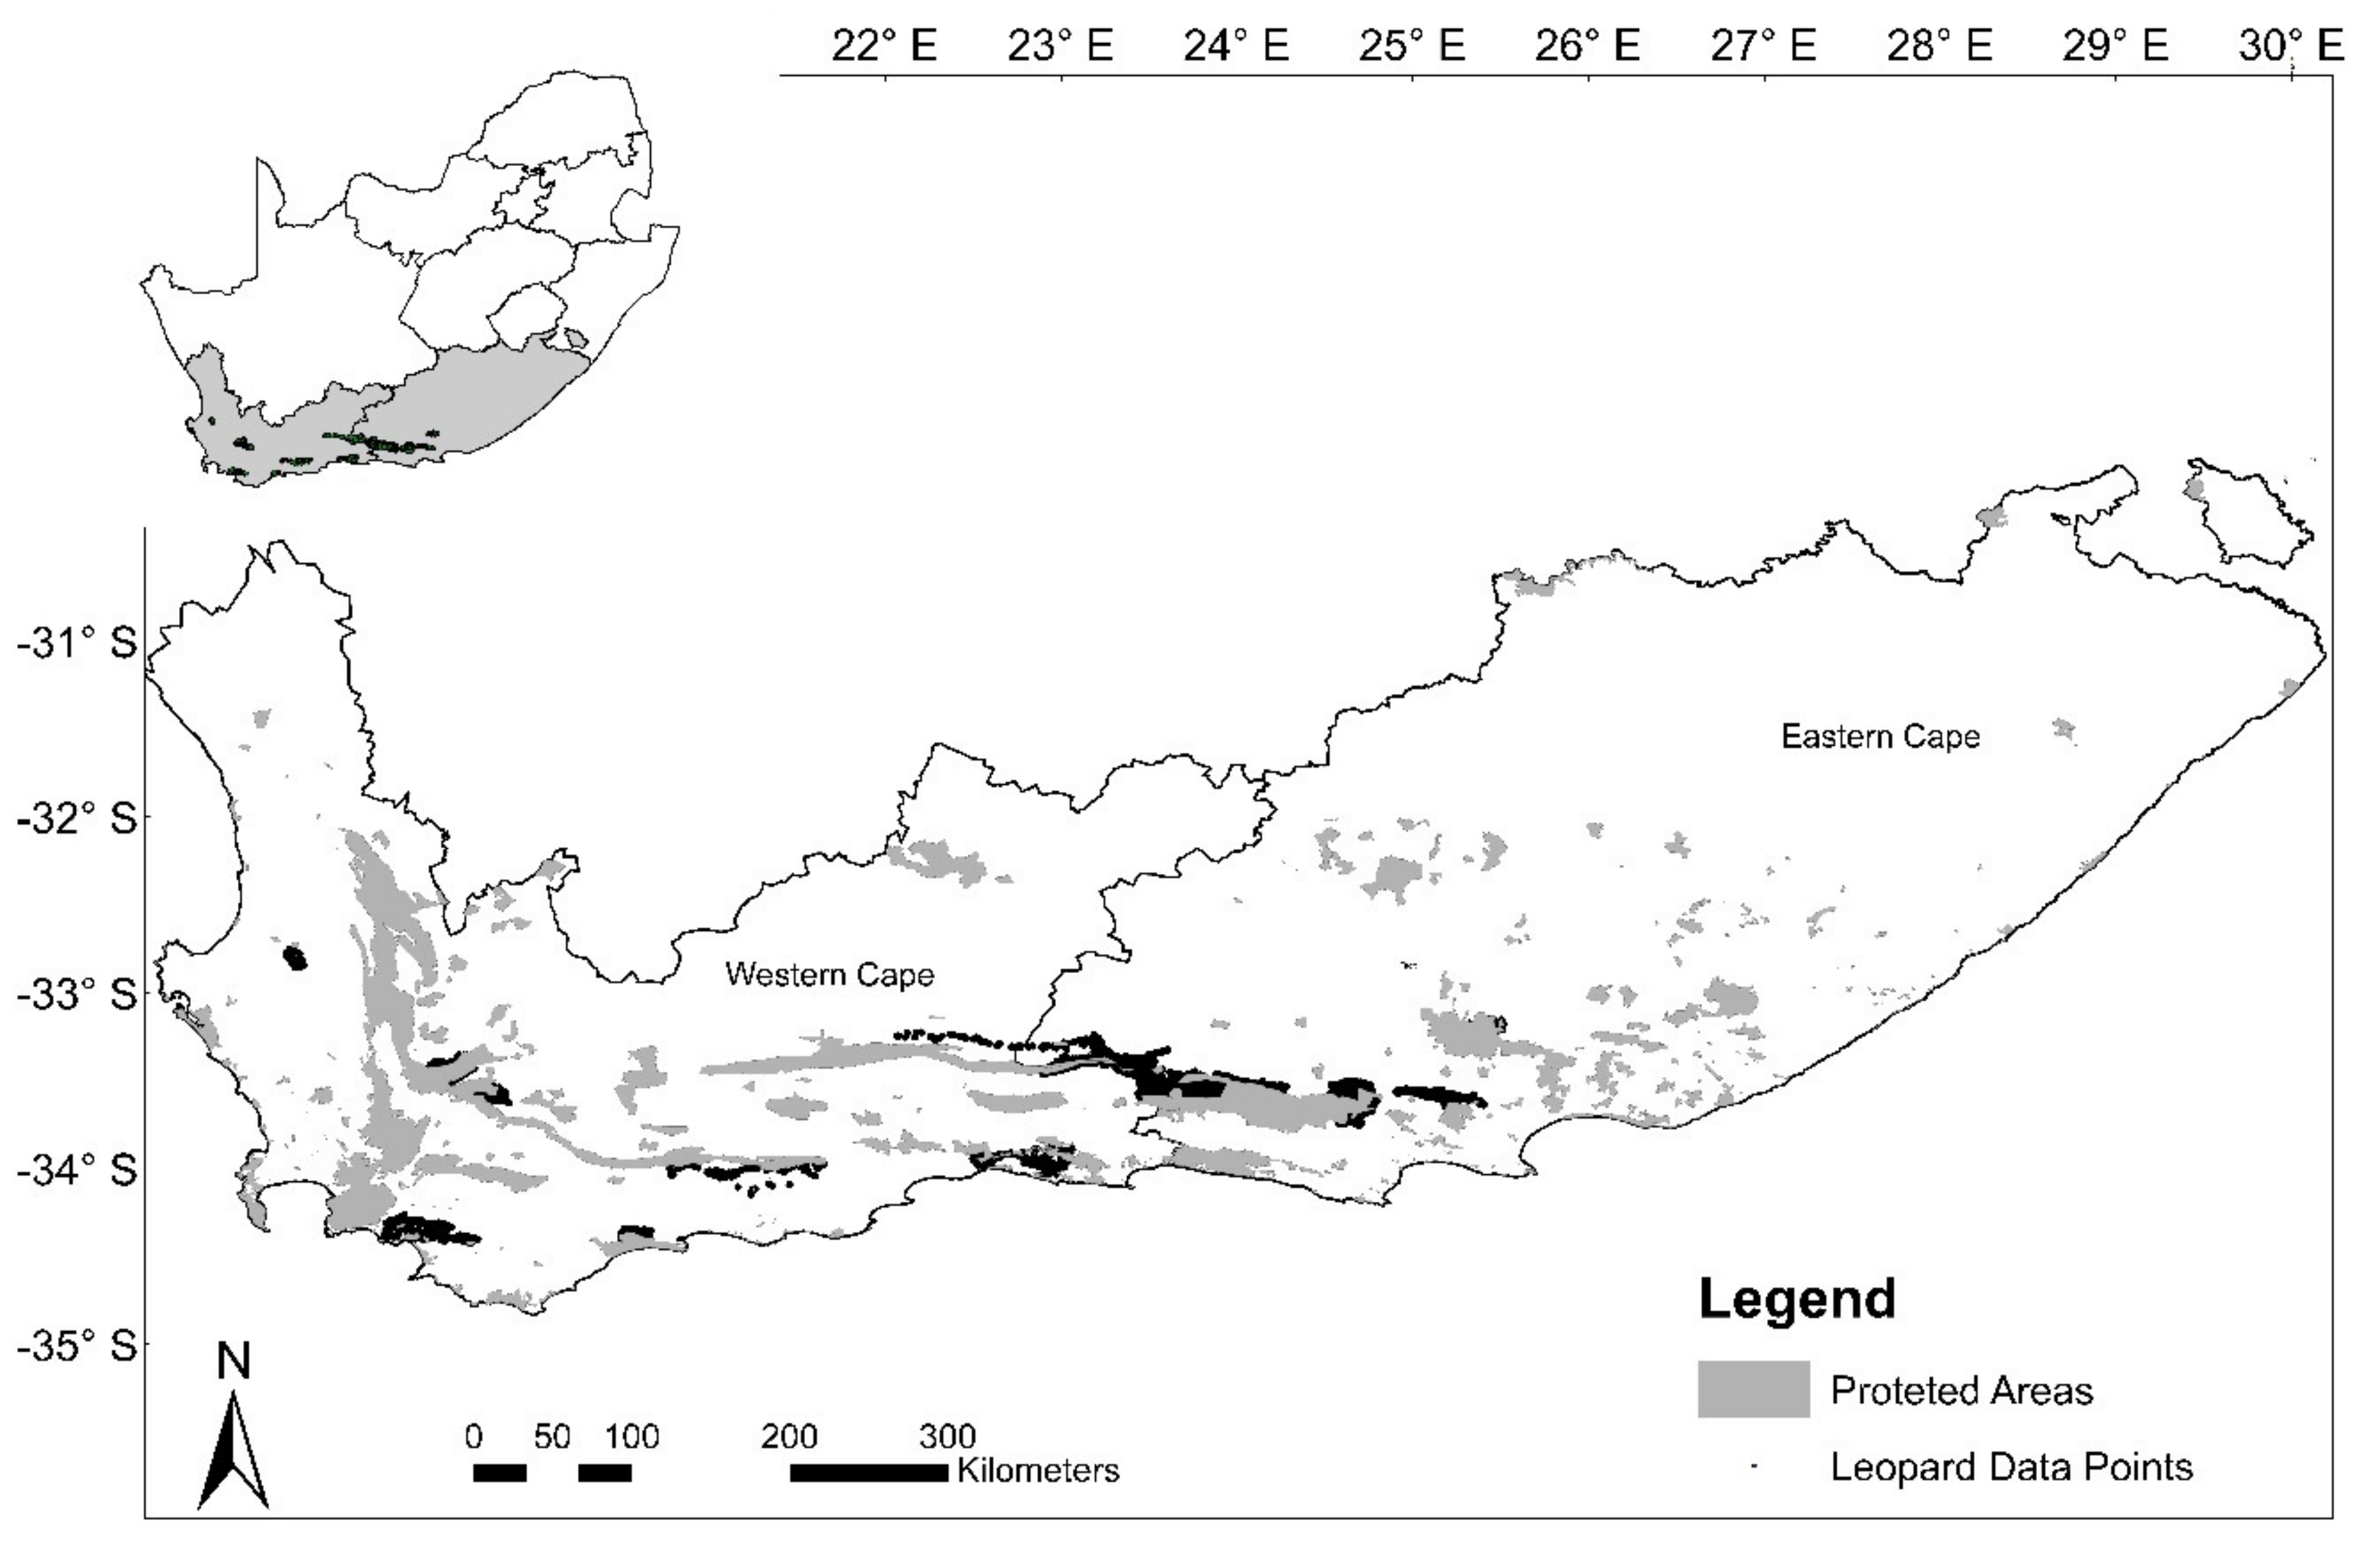
29]. Leopards in the Eastern and Western Cape provinces of South Africa are reported to have a discrete population structure, low population densities, and are persecuted due to high levels of human-carnivore conflict [4,30,31,32]. In the face of these threats, identifying corridors connecting habitat patches and reducing human–carnivore conflict can promote gene flow and the long-term survival of the leopard and sympatric species. In this study, we aim to identify leopard habitat, predict potential landscape corridors linking habitat patches, and test functionality between predicted habitat patches to determine whether leopard populations in the region can connect despite modified landscapes. First, we evaluate the relationship between leopard presence and anthropogenic and natural covariates, and use the model with the best fit to predict leopard habitat. Second, we employ circuit theory [33], to predict potential corridors linking 14 known leopard populations using the modelled leopard habitat distribution as a surface layer. Finally, while incorporating leopard occurrence data to random walk algorithms using circuit theory improves the identification of functional corridors [21], we used camera trap surveys to validate and test the functionality of five predicted corridors linking potentially isolated leopard populations in the Western Cape.

2. Materials and Methods

2.1. Study Area

Located in South Africa, our study took place in the Eastern and Western Cape provinces (Figure 1). The two provinces together make up approximately 298,428 km2 and host heterogeneous land uses, including dense urban zones, agriculture (e.g., cultivated, rangeland livestock, game farms), protected areas, and forestry. Vegetation biomes vary throughout the area and include Fynbos, Succulent Karoo, Nama Karoo, Albany Thicket, and Forest [34]. Elevation ranges from sea level and low valleys less than 500 m above sea level, to tall mountain peaks reaching over 1600 m along the Cape Fold Mountain range. The climate is moderate with annual rainfall ranging from 208 mm to 943 mm between the arid northern reaches and mesic southern regions [35]. Predominantly winter rainfall patterns occur in the west, becoming increasingly summer rainfall toward the east and north [34].

2.2. Leopard Occurrence Data

We used GPS data from 31 free-roaming adult leopards (19 males and 12 females; Table 1) collared (GPS collars, Vectronic aerospace, Berlin, Germany; Satellite collars, AWT, Johannesburg, South Africa; Followit AB, Lindesberg, Sweden) between 2007 and 2021 in the Eastern Cape and Western Cape (Table 1; Figure 1). Each leopard was monitored for an average of 259 (±160) days, with males monitored for 253 (±149) days, and females 269 (±182) days on average (Table 1). Collars were set to obtain fixes between 4 and 6 h intervals. Leopards were captured in walk-in, fall-door traps.
Using telemetry data in species distribution modelling can cause severe spatial bias in the results, with some areas being over-represented due to spatial data clusters such as kill sites, or resting sites [36]. To limit spatial autocorrelation, we spatially filtered the leopard occurrence data [36,37]. We first created a 1 km2 fish-net grid using the Data Management Tool in ArcGIS 10.4 software (ESRI, 2016) for the extent of the Eastern Cape and Western Cape. We then used the Spatial Join function in ArcGIS 10.4 to join the 1 km2 grid cells to the leopard occurrence points, thereby reducing the GPS points per grid cell. We used the spatially filtered leopard occurrence points (4149), where 3219 occurrence points represented 19 male leopards and 930 points represented 12 female leopards, to generate the leopard distribution map (Figure 1).

2.3. Habitat Covariates

We selected factors known to influence leopard habitat selection as covariates in our statistical models [29,32,38,39,40]. We obtained environmental covariates from various sources (Table 2). These included human-associated covariates (distance to roads, land-cover, human population density) and natural covariates (distance to rivers, slope, elevation, and land-cover; Figure 2; Table 2). We used the South African Level 2 land-cover classes of 2018 (a categorical variable) [41], so that similar environments were grouped together resulting in reduced fragmentation of the results. The static variables such as land cover of 2018 and road infrastructure covariate from 1998 were appropriate to use for our temporal leopard location data collection between 2007 and 2021 (Table 1), as there were no major road developments during this time, and the land cover appeared to adequately represent landcover for the period of data collection. We estimated the distance to rivers and roads as the Euclidian distance to the respective covariates using QGIS 3.12.1 (QGIS.org, 2021. QGIS Geographic Information System. QGIS Association. http://www.qgis.org, last accessed on 1 November 2021). While natural prey density and availability influence predator habitat predictions [42], such data do not exist at regional scale in South Africa. Therefore, we created a potential prey species distribution layer using camera trap data from published [26,30,31] and unpublished data (Appendix A). Potential prey included free-roaming ungulate species found to contribute to the broad dietary niche of leopard in the region [43,44,45] including bushbuck (Tragelaphus scriptus), steenbok (Raphicerus campestris), common duiker (Sylvicapra grimmia), Cape grysbok (Raphicerus melanotis) and grey rhebok (Pelea capreolus), along with smaller species, including hares (Lepus sp.), rock hyrax (Procavia capensis) and Cape porcupine (Hystrix africaeaustralis) (Table A1; Appendix A). We detected potential prey species at 244 of the 258 camera trap stations set across five survey areas (Appendix A). As carnivores are generally associated with high mammalian species diversity [26], we used the same habitat variables to determine both the prey species distribution modelling and the leopard habitat distribution modelling (Appendix A). Following Swanepoel et al. [39], we did not restrict the extent of the subsampled background region because both leopard and the prey species we focused on occur widely throughout the two provinces and are not specifically restricted across the region [31,32,38,39].
We converted all environmental covariates to the same extent and resolution, approximately 1 km2, using QGIS 3.12.1, to predict a fine-scale resolution habitat suitability map. Mapping was performed using the Albers Conical Equal Area projection system. All covariates were masked by the Eastern Cape and Western Cape for the modelling process. We tested the collinearity of the environmental covariates using the variance inflation factor (VIF, [46]) before including them in the models.

2.4. Modelling

We modelled leopard habitat and the potential prey distribution using Maxent (version 3.4.4, [47]). We used the following parameters in our leopard habitat models: random seed, write plot data, regularized multiplier (0.1), 41,500 maximum number of background points, and ran 10-fold cross-validated model replicates with the maximum iterations set to 5000, with a convergence threshold of 0.00001. We selected a 10:1 available: presence points ratio in selecting the maximum number of background points to ensure available points were adequately represented in our models as this improves model prediction [48]. As true absence data are difficult to obtain and known locations are limited to sampling efforts, there can be a negative impact of spatial bias in predicting species distribution [49]. However, this concern diminishes with wide-ranging species such as the leopard, spatial thinning of presence data, a relatively widely distributed sample collection across the region, and the high ratio of background to presence data selected [48,49].
A random subset of the data (430 test data points) was used for each of the ten replicate runs and compared to the trained model (3719 points). The model outputs were averaged over the ten replicate runs. To avoid overfitting, we selected linear and quadratic features [50,51]. We used the same parameters for the potential prey distribution model, but restricted background points to the default 10,000. We used the Jackknife approach to evaluate the contribution that each variable provided to the geographic distribution models. During this process, Maxent generated three models: first, each covariate was excluded in turn and a model created with the remaining variables to check which was the most informative. Second, a model was created by individually using each covariate to detect which variable had the most information not featuring in the other variables. Finally, a model was generated based on all covariates. We plotted the response curves derived from univariate models to identify how each covariate correlated to presence probability. We evaluated the model fit using the area under the receiver operating characteristic curve (AUC), based on independent test data sets for each cross-validated run [52]. The AUC assesses the ability of each model to discriminate between true and false positives. Its value ranges from 0 to 1 with values closer to one (1) indicating a better fit while values closer to 0.5 indicating a fit no better than random [53]. Each of the ten replicates produced a predicted habitat distribution raster file, of which the arithmetic mean was used to produce the final habitat distribution map. We were interested in identifying leopard habitat and potential barriers to habitat; therefore, we evaluated three models: (1) human-associated model, (2) natural features model, and (3) the full model, which included all variables.

2.5. Connectivity Model

We employed circuit theory using Circuitscape software (version 4.0, [33]) to identify potential corridors linking leopard populations. Circuit theory links populations through multiple possible pathways, with connectivity potential increasing according to the number of connected pathways [19,23,24,54]. The current-flow connectivity analyses use a resistance or conductive surface layer to assess connectivity between known resident populations. In a surface layer, each pixel is a resistor or conductor with an assigned resistance/conductance value derived from the predicted habitat modelling analyses. In addition to the surface layer, Circuitscape requires defining the core habitats or known populations (nodes), between which connectivity is measured. We identified source nodes based on known leopard presence from published and unpublished data [30,31,32,38,43,55,56]. The subjective shape of each node was guided by the shape of: (1) protected areas and (2) mountain ranges reported to host leopard [31,32,33,39,42,53], (3) leopard genetic structure [4], and (4) road networks separating nodes. We identified 14 discrete leopard habitat patches as source nodes. Connectivity among nodes was predicted to be a function of the surface layer [57]. We used the raw ASCII output of Maxents’ habitat prediction model with the best fit as the conductance surface layer for Circuitscape analyses. We ran Circuitscape in the pairwise mode, and the focal node currents were set to zero [3,58,59]. The final current-flow map was reclassified into five categories using natural breaks (Jenks method), where 1 indicates most movement constrained category for leopard movement and 5 indicates the most permeable [40,59,60]. This highlights cells where current-flow has a greater value than the 80th percentile, allowing for the identification of high-quality areas for connectivity and better identification of important areas for P. pardus movements. Furthermore, these categories offer an easily interpretable cartographic product that conservation managers may use to rank conservation zones [40,59].

2.6. Functional Corridor Assessments

We used camera traps to test corridor functionality along five potential leopard corridors. The corridors were identified based on (1) preliminary Circuitscape analyses predicting permeability (>60th percentile), (2) the presence of remnant natural vegetation linking known leopard populations [31] and (3) the surrounding habitat was characterised by highly transformed landscapes (Figure 3). This provided an opportunity to test high-quality areas for leopard connectivity, surrounded by high resistances in the surroundings that could limit the flow of individuals across the landscape [40,59]. We aimed to validate these corridors by determining whether these areas facilitate leopard movement between known populations where low gene flow and low population density have been reported [4,31] (Figure 3). Four of these corridors (the Breede, Duiwenhoks, Goukou and Gourits rivers) had a linear shape that potentially facilitated leopard movement between known leopard habitat patches from the north to the south. The fifth site (Klein Swartberg) was considered a potential ‘stepping-stone’ rather than a linear corridor between leopard habitat patches (Figure 3). The average Euclidean distance to leopard habitat patches on either side of the linear corridors was 31.2 km, with the Breede river having the longest distance between habitat patches (41 km; Table 3). We placed 294 camera stations along these corridors between May 2015 and March 2021 (Figure 3; Table 3). All cameras were placed between 40 and 60 cm high, in areas considered most likely to detect leopard. Camera trap placements along the four linear corridors were placed in a transect fashion, whereby single cameras were placed across a section of approximately 500 m wide bands across the breadth of both sides of the rivers (Figure 3; Appendix B). The stepping-stone site allowed the placement of a pair of cameras facing each other in a grid fashion (Figure 3; Appendix B). For brevity, we provide more details on camera surveys along corridors in Appendix B. We analysed all camera trap data using digiKam version 7.2.0 (www.digikam.org, last accessed on 12 December 2021). We extracted data for each image (including date, time, all applied tags, and camera-related metadata) using the R package ‘camtrapR’ [61] in R statistical software, version 4.0.2 [46].

3. Results

3.1. Habitat Prediction Model

None of the environmental variables showed strong collinearity (Appendix C) and all environmental covariates could be included in habitat prediction models. The model with the best fit explaining leopard distribution was the full model (AUC 0.90), followed by the natural model (0.88), and then the human-associated model (0.77: Table 4). While the full model had a better fit than the natural model, this difference was relatively low. Both the natural and human models had covariates with weak explanatory power when predicting leopard habitat. In the natural model, rivers had weakest explanatory power, while in the human model, human population density had the weakest explanatory power (Table 4). As each model hosted covariates that contributed to predicting leopard habitat differently, and due to the higher AUC, we employed the full model to predict leopard habitat. The covariate with the highest contribution to the full model was slope, followed by land-cover, prey distribution, elevation, and roads, while rivers and human population density had a low contribution to the model (4). Leopards appeared to select moderate slopes, land cover such as forested areas, fynbos and karoo shrublands, and planted forests, areas with higher predicted prey distribution, moderate elevation, intermediate distances to roads, areas close to rivers, and avoided areas with higher human density, (Appendix D). The modelled leopard habitat scores ranged from 0 (non-habitat) to 1 (high quality habitat) across the predicted leopard habitat (Figure 4).

3.2. Connectivity Model

The source nodes (Figure 5) corresponded to leopard habitat identified by the habitat prediction model (Figure 4). Areas with high permeability (>80th percentile) appeared along the mid-regions of the Eastern Cape and Western Cape, where the high-quality habitat along mountain ranges appears to contribute to linking east and west populations (Figure 5). Connectivity between the Langeberg–Cederberg and Hermanus–Agulhas nodes showed very limited connectivity, where the cultivated landscape known as the Overberg appeared to restrict connectivity (Figure 5). Several potential narrow corridors linking habitat patches between the Langeberg–Cederberg and Duiwenhoks–Gourits nodes were identified as having moderate permeability (>60th percentile) (Figure 5). These long, narrow corridors were represented by rivers and connectivity was limited due to the surrounding, highly transformed, cultivated landscapes (Figure 5). The eastern-most node representing the Greater Addo Elephant National Park (Addo) appeared to show no connectivity (<20 percentile) potential to the nearby Baviaanskloof node and to the Swartberg node to the west (Figure 5).

3.3. Functional Corridor Assessments

In total, the 294 cameras were placed along the five corridors and run for 99,268 camera trap nights, detecting a total of 38 wildlife mammalian species along 124 km of rivers (Table 3). In total, two leopard captures were detected along two of the five surveyed corridors (Table 3). The captures occurred at 11.0 km and 14.7 km (Euclidean distance) from the closest known leopard habitat patch to the Breede, and Duiwenhoks corridors, respectively (Figure 3). Total operational camera trap days between the two surveys (Breede-1 and Duiwenhoks) reached 37,795 days (Table 3) with Breede-1 reaching 12,821 camera trap days before a leopard was captured, and the Duiwenhoks corridor reaching 3351 camera trap days before the leopard was captured. The remaining three corridors did not record any leopard activity (Table 3).

4. Discussion

Wide-ranging mammals depend on large enough habitat patches and habitat connectivity to persist in fragmented landscapes [25,
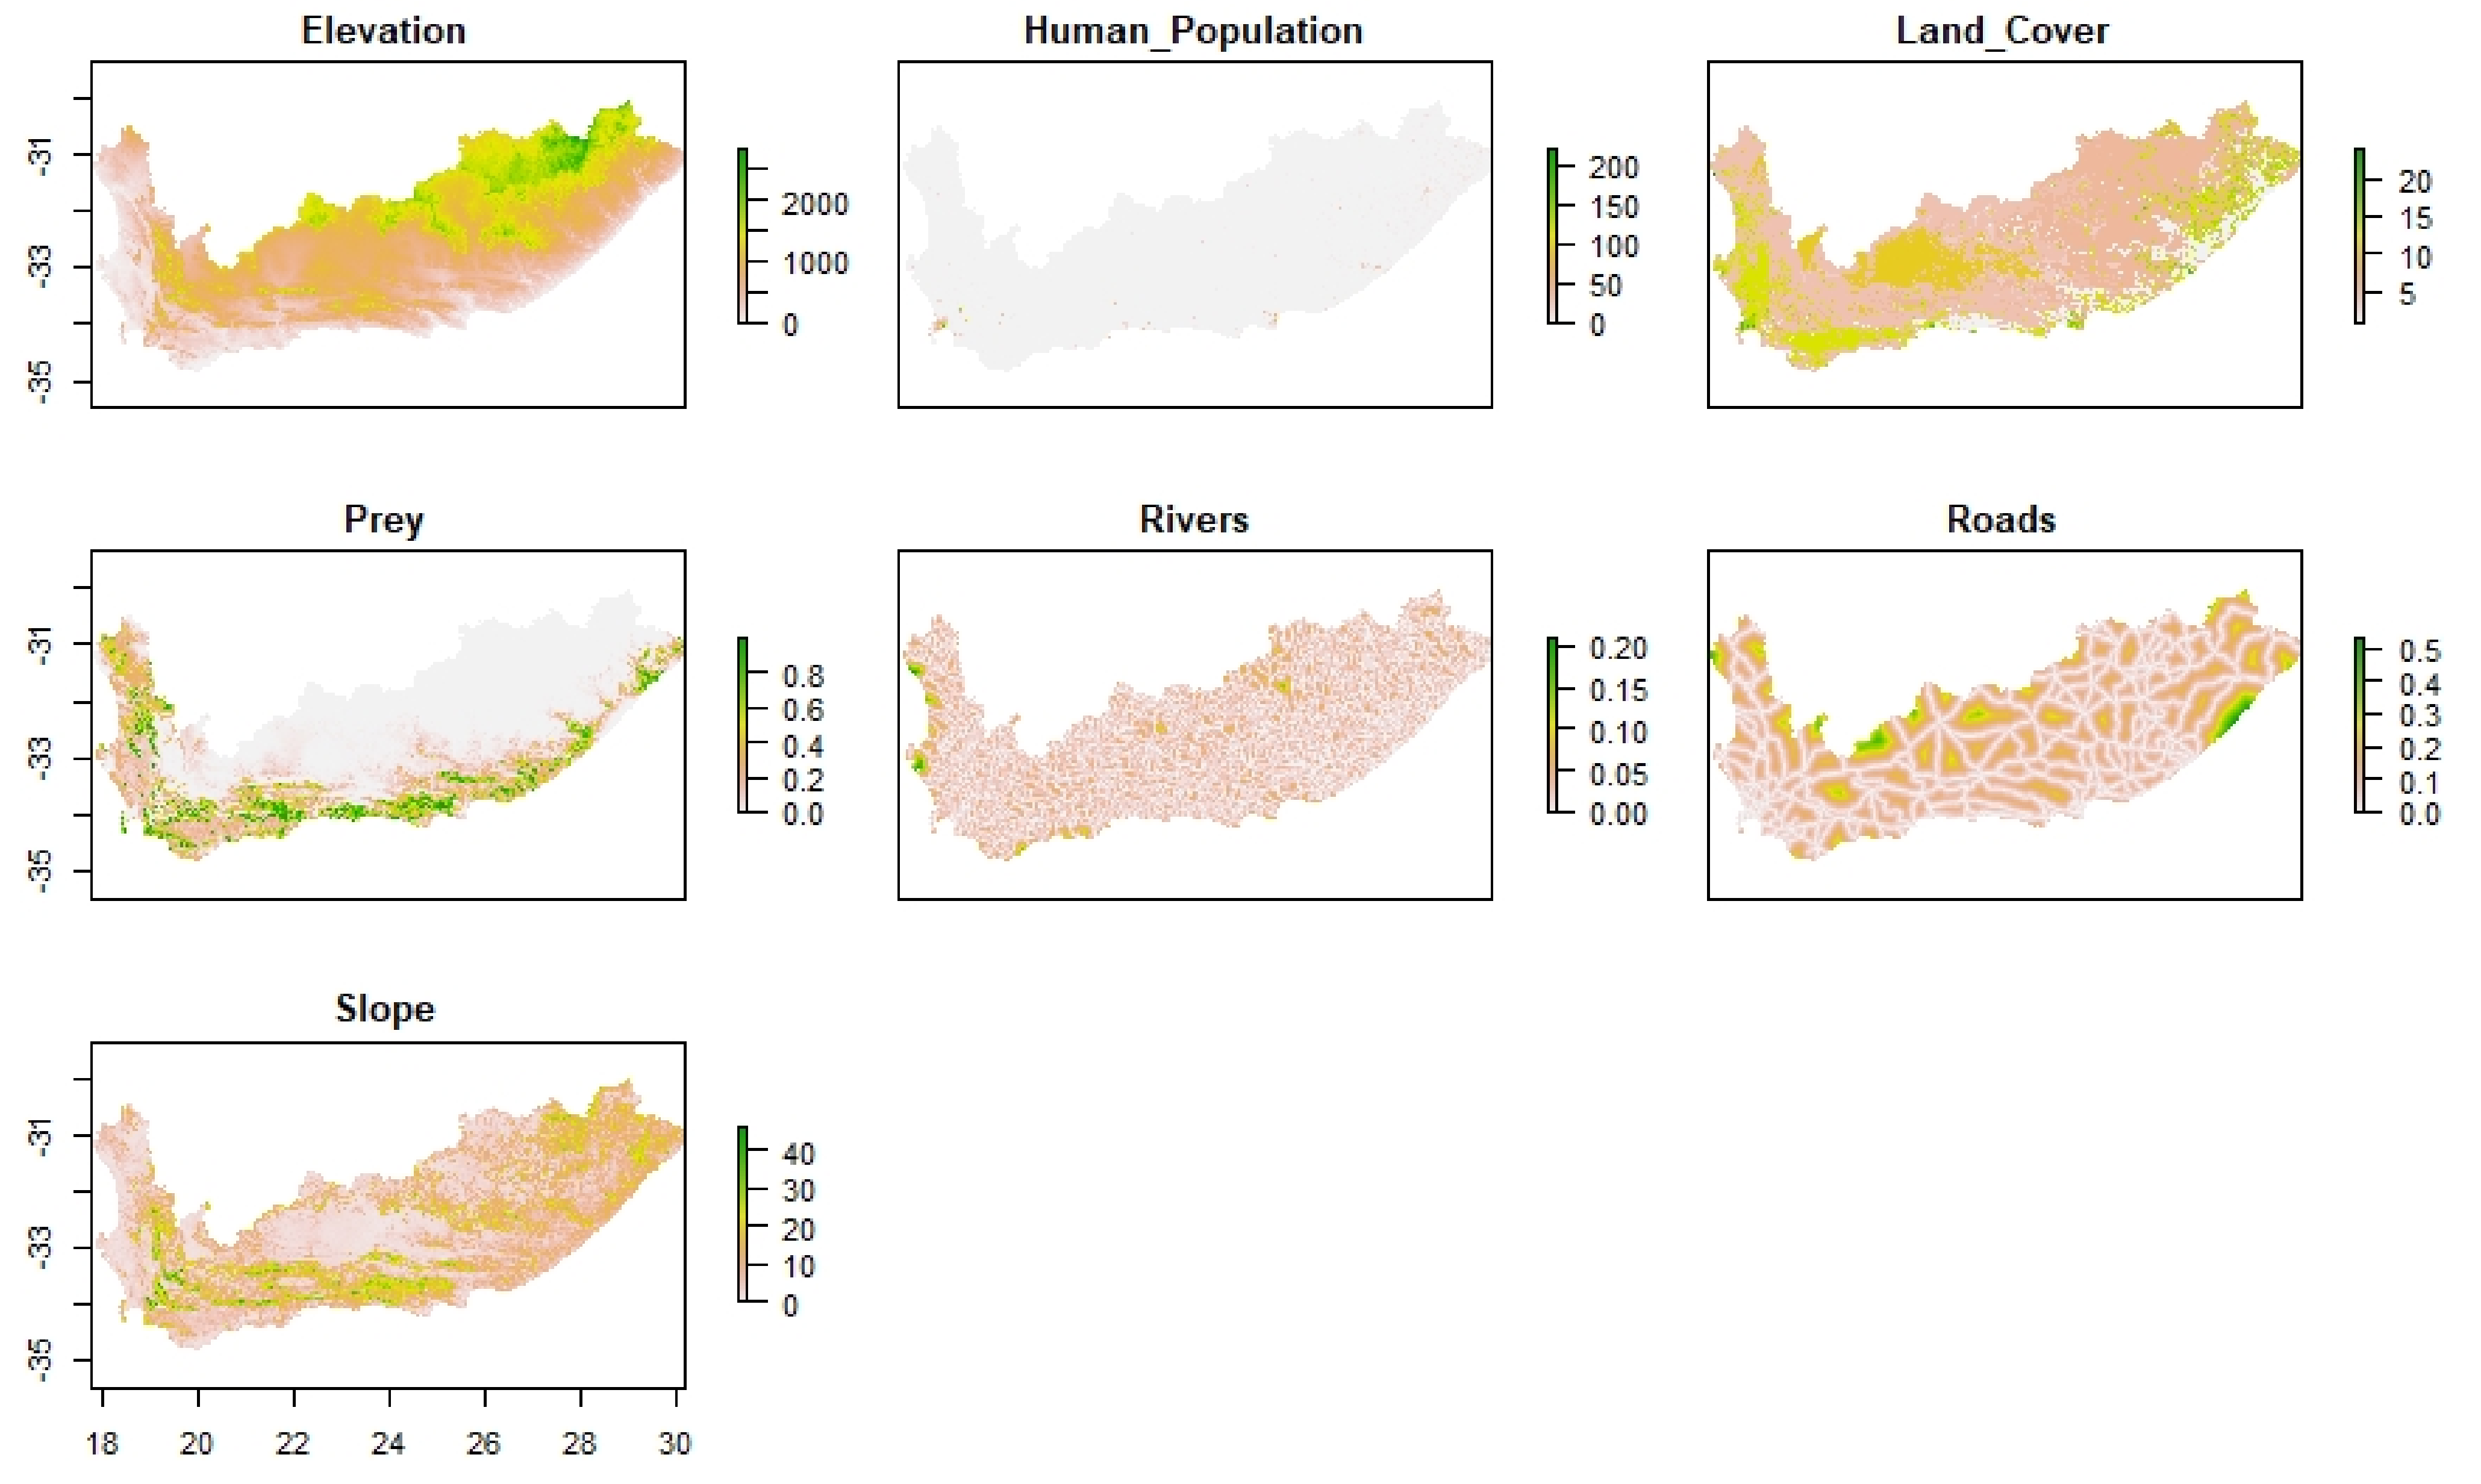
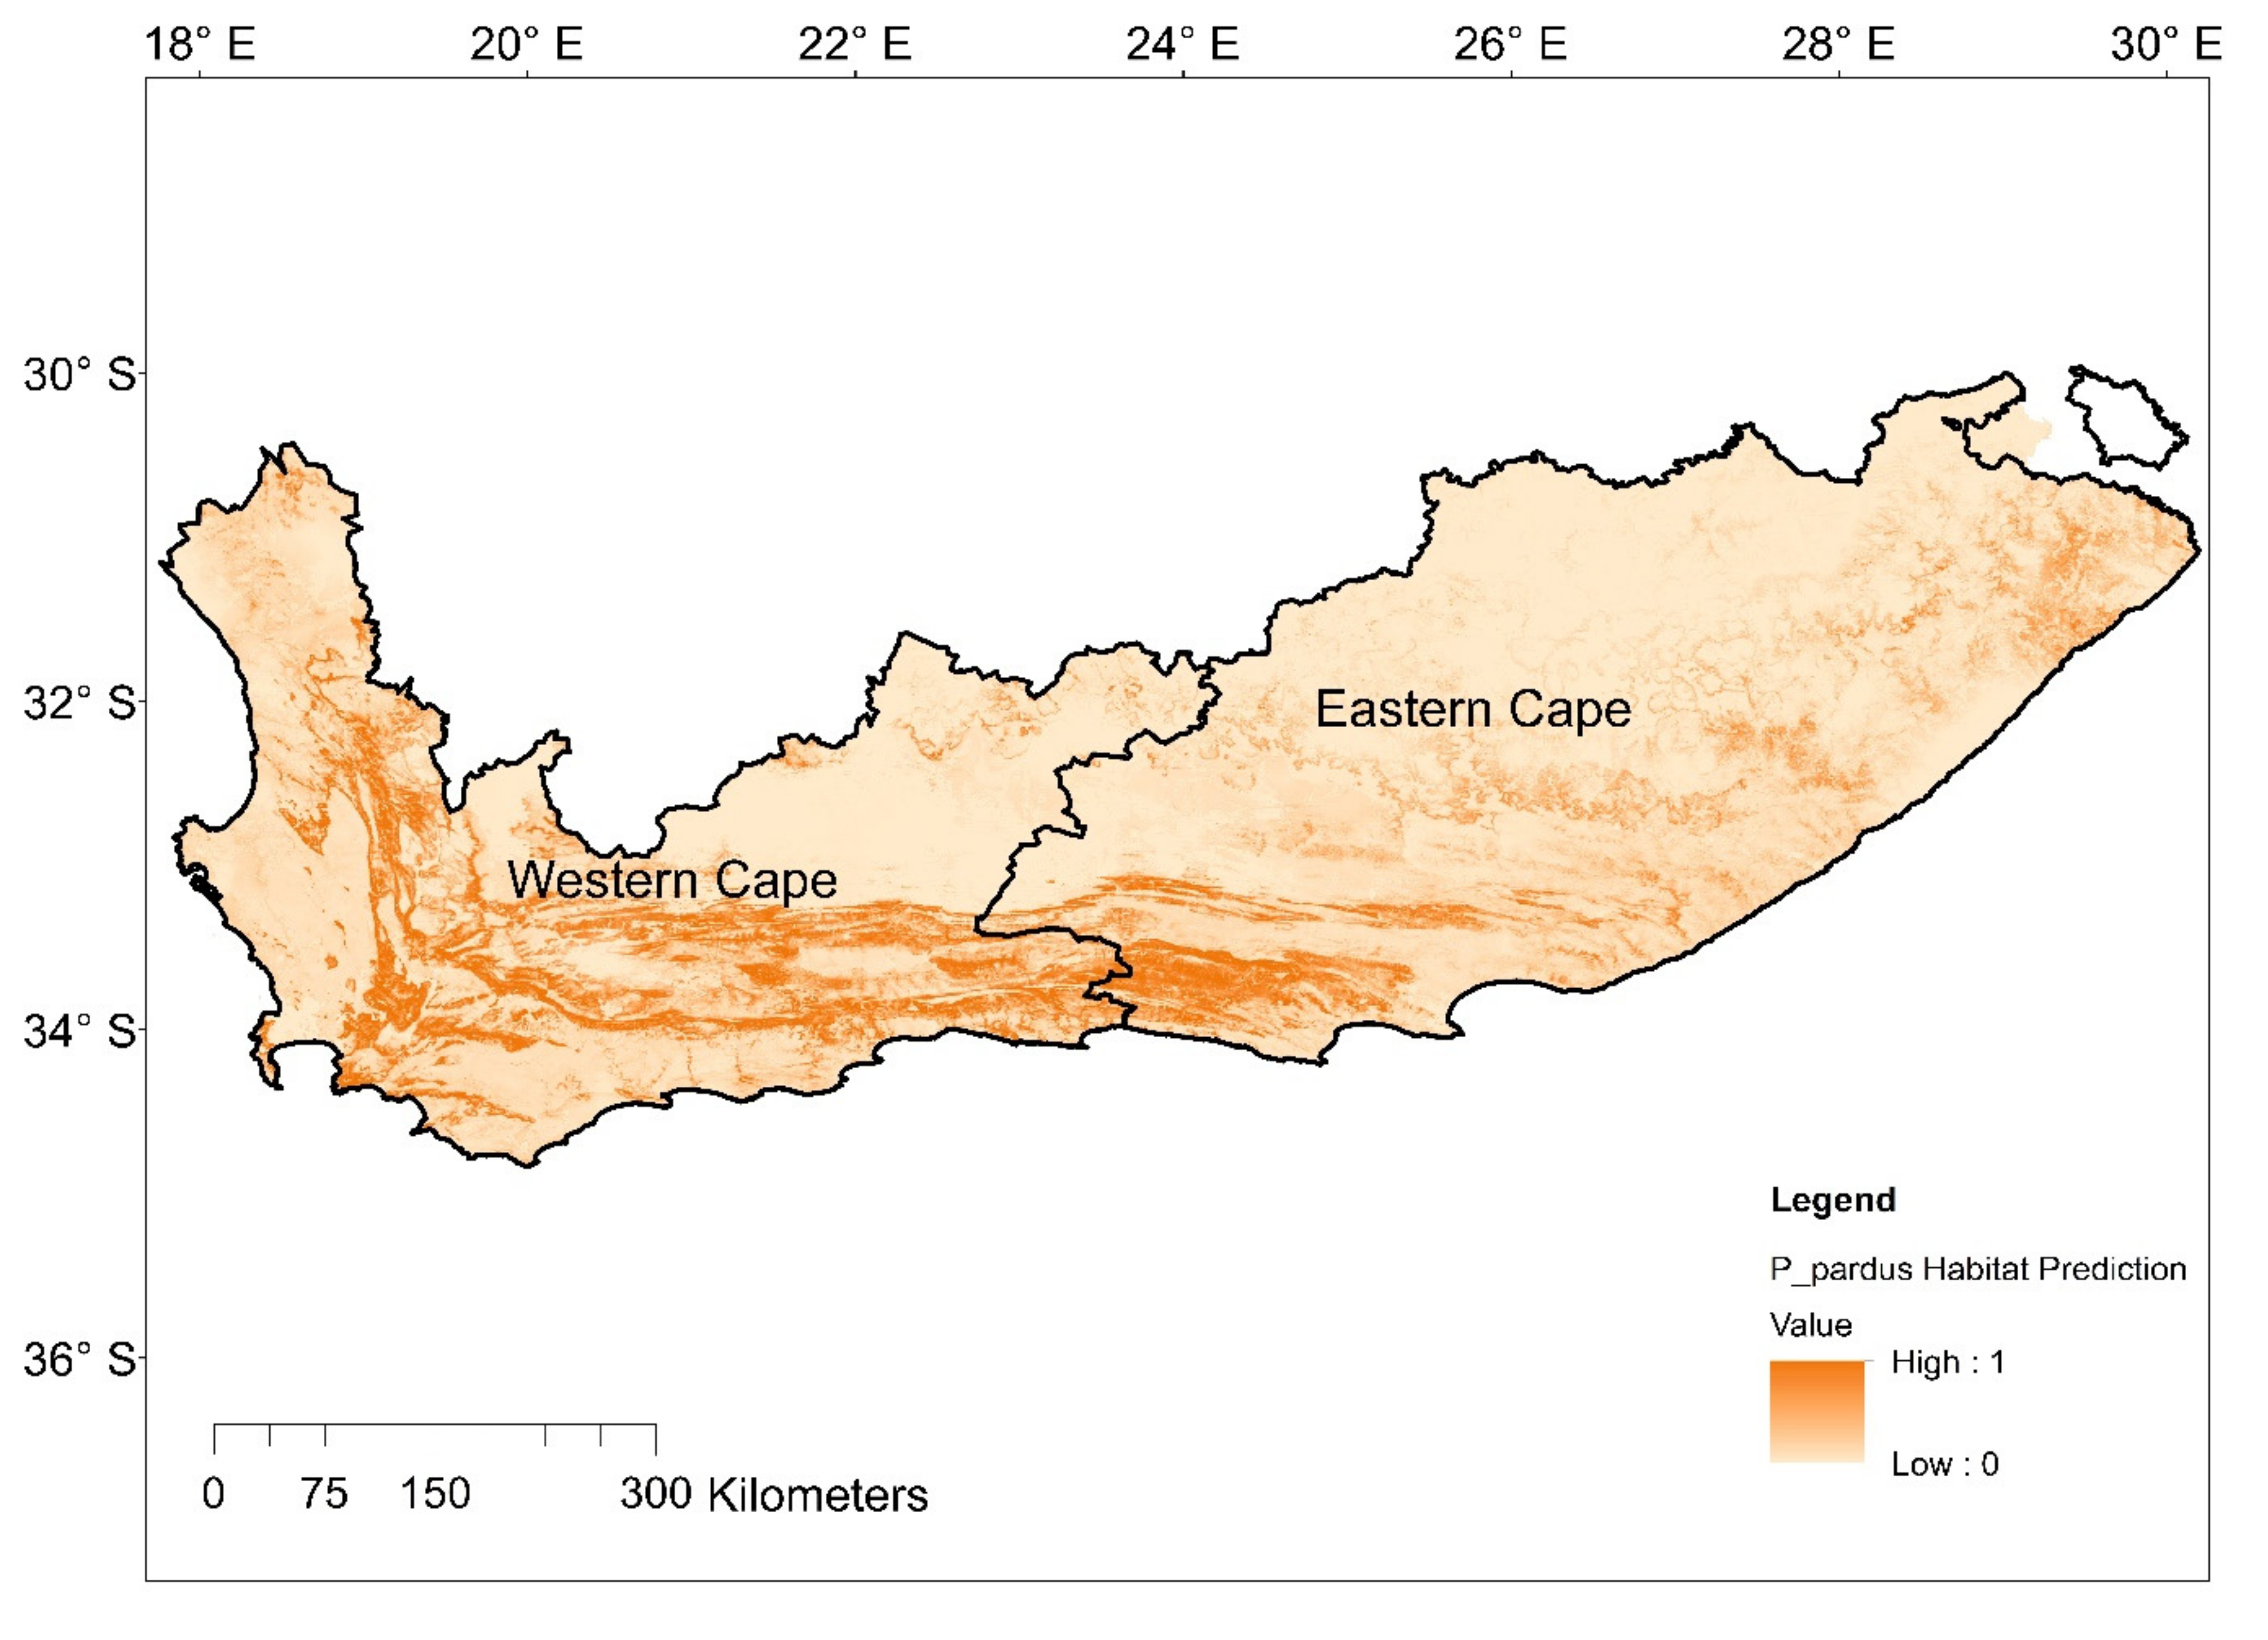
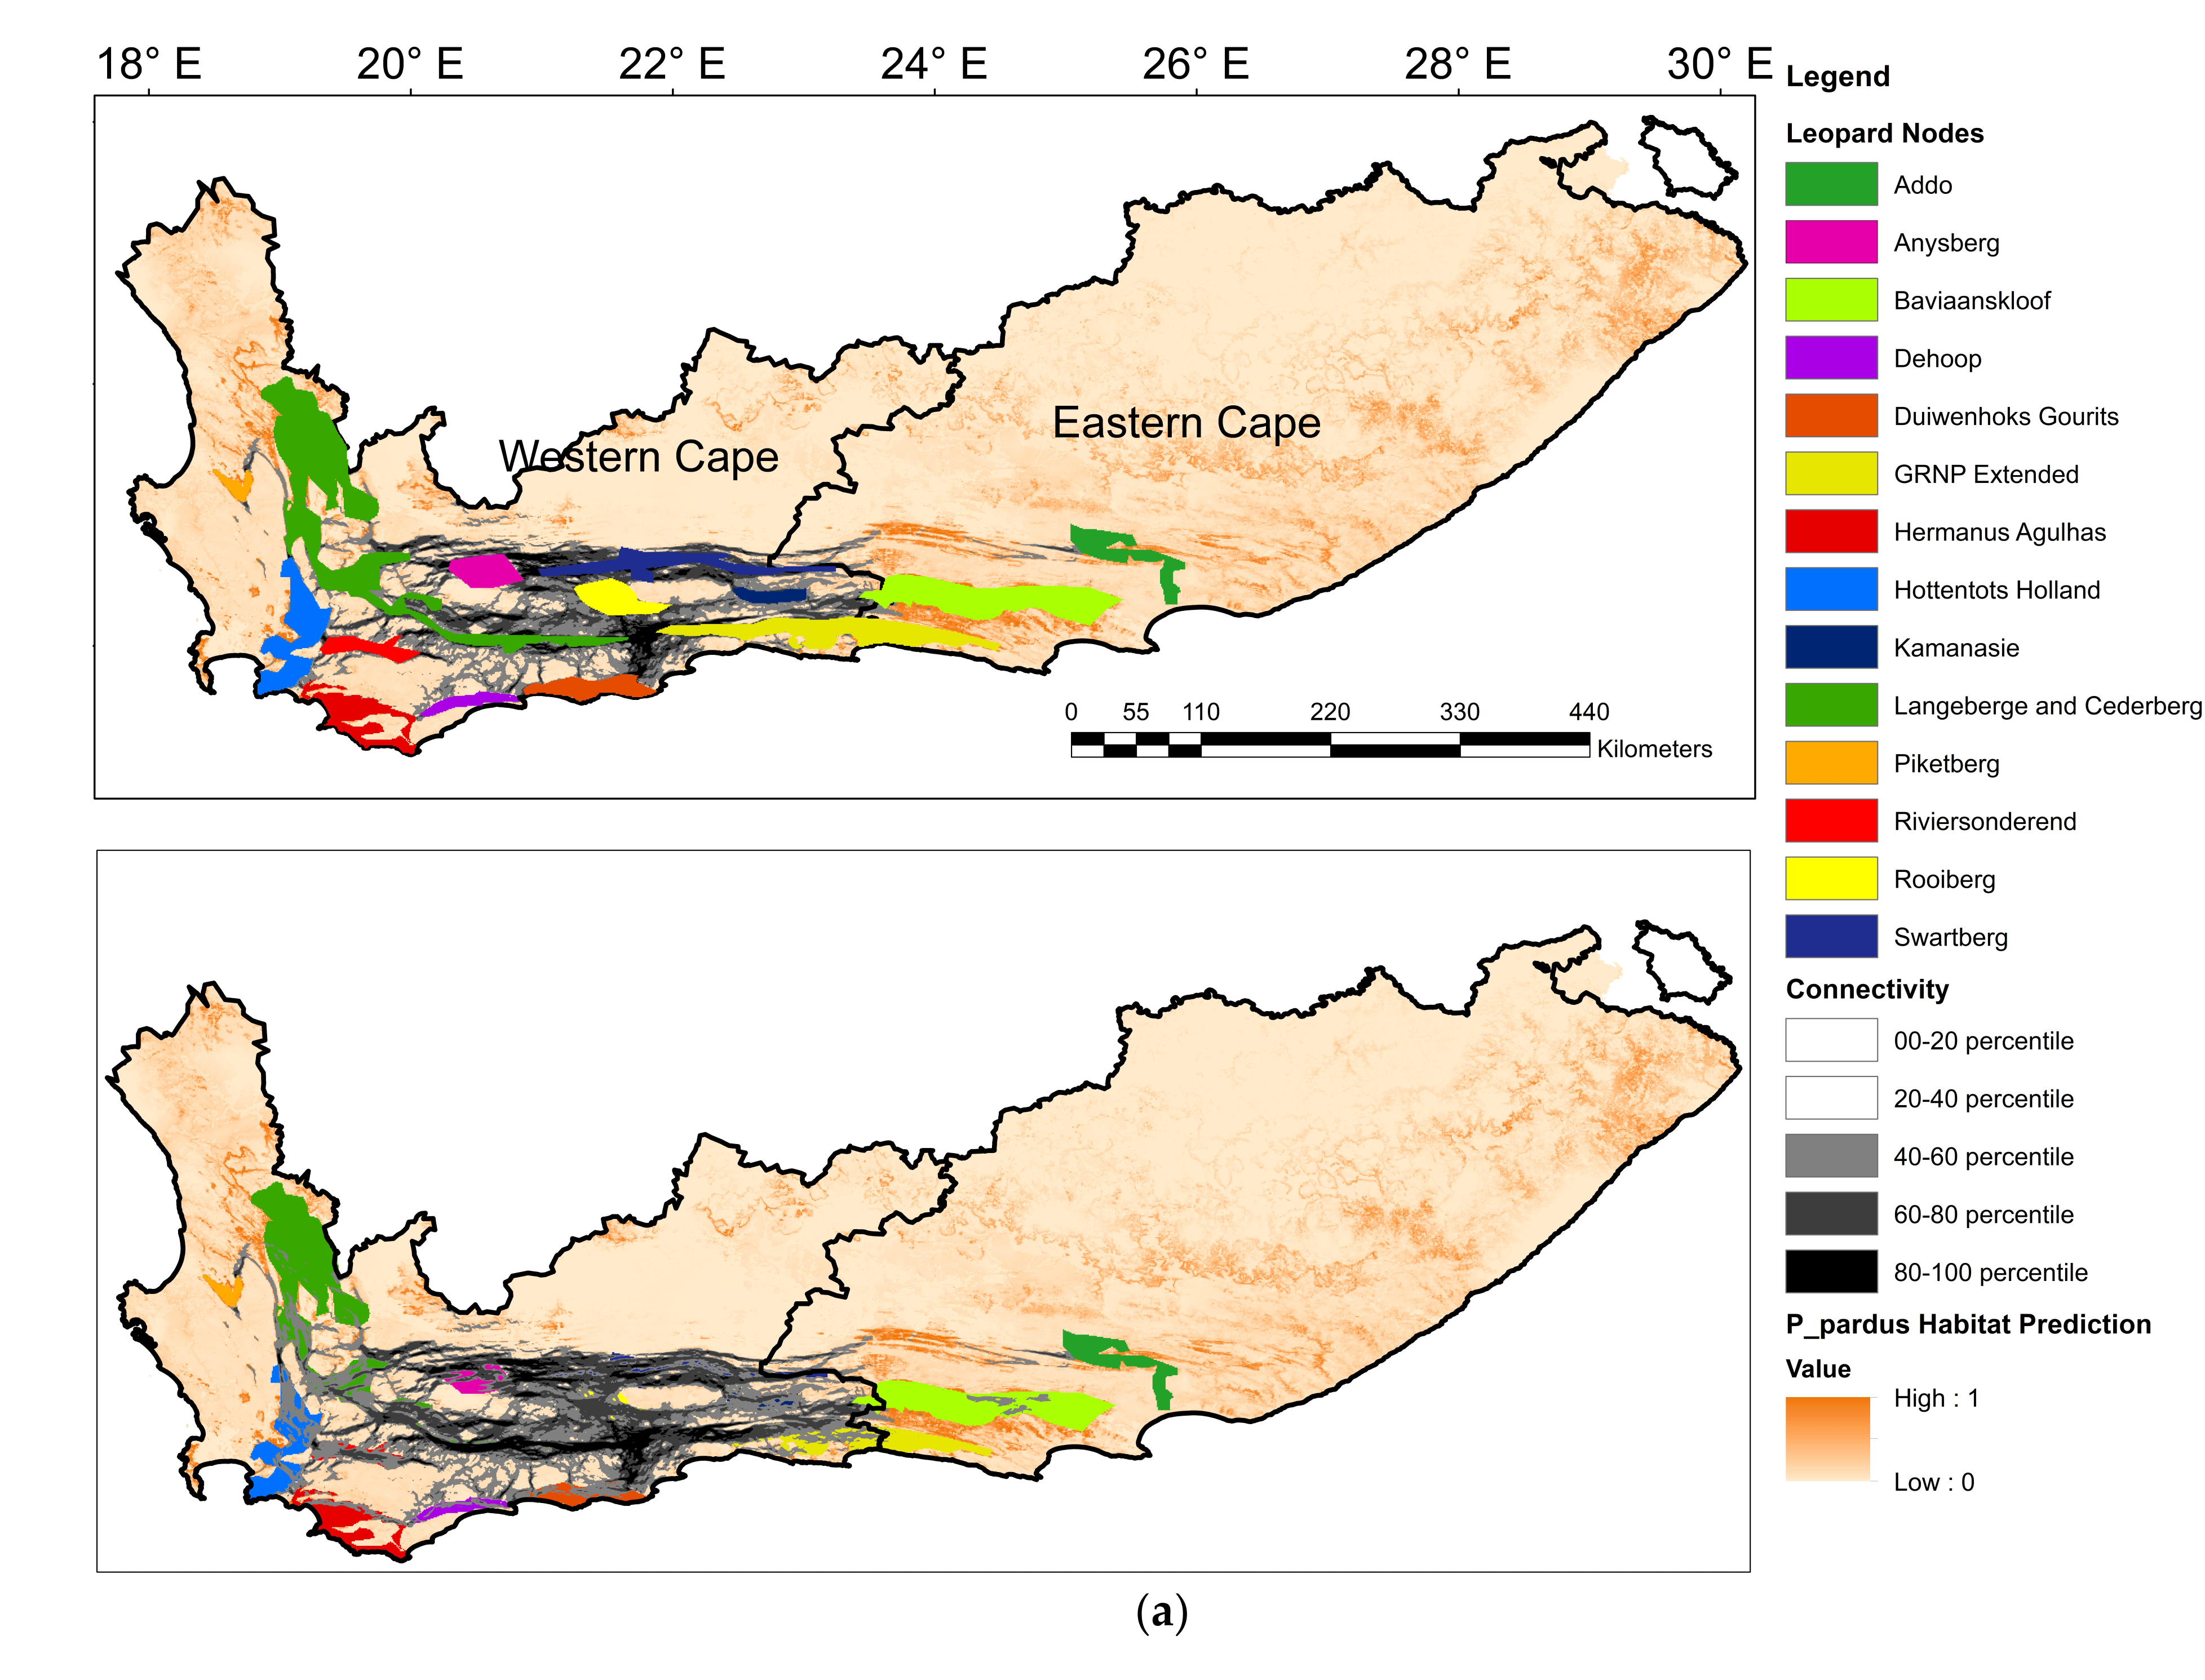
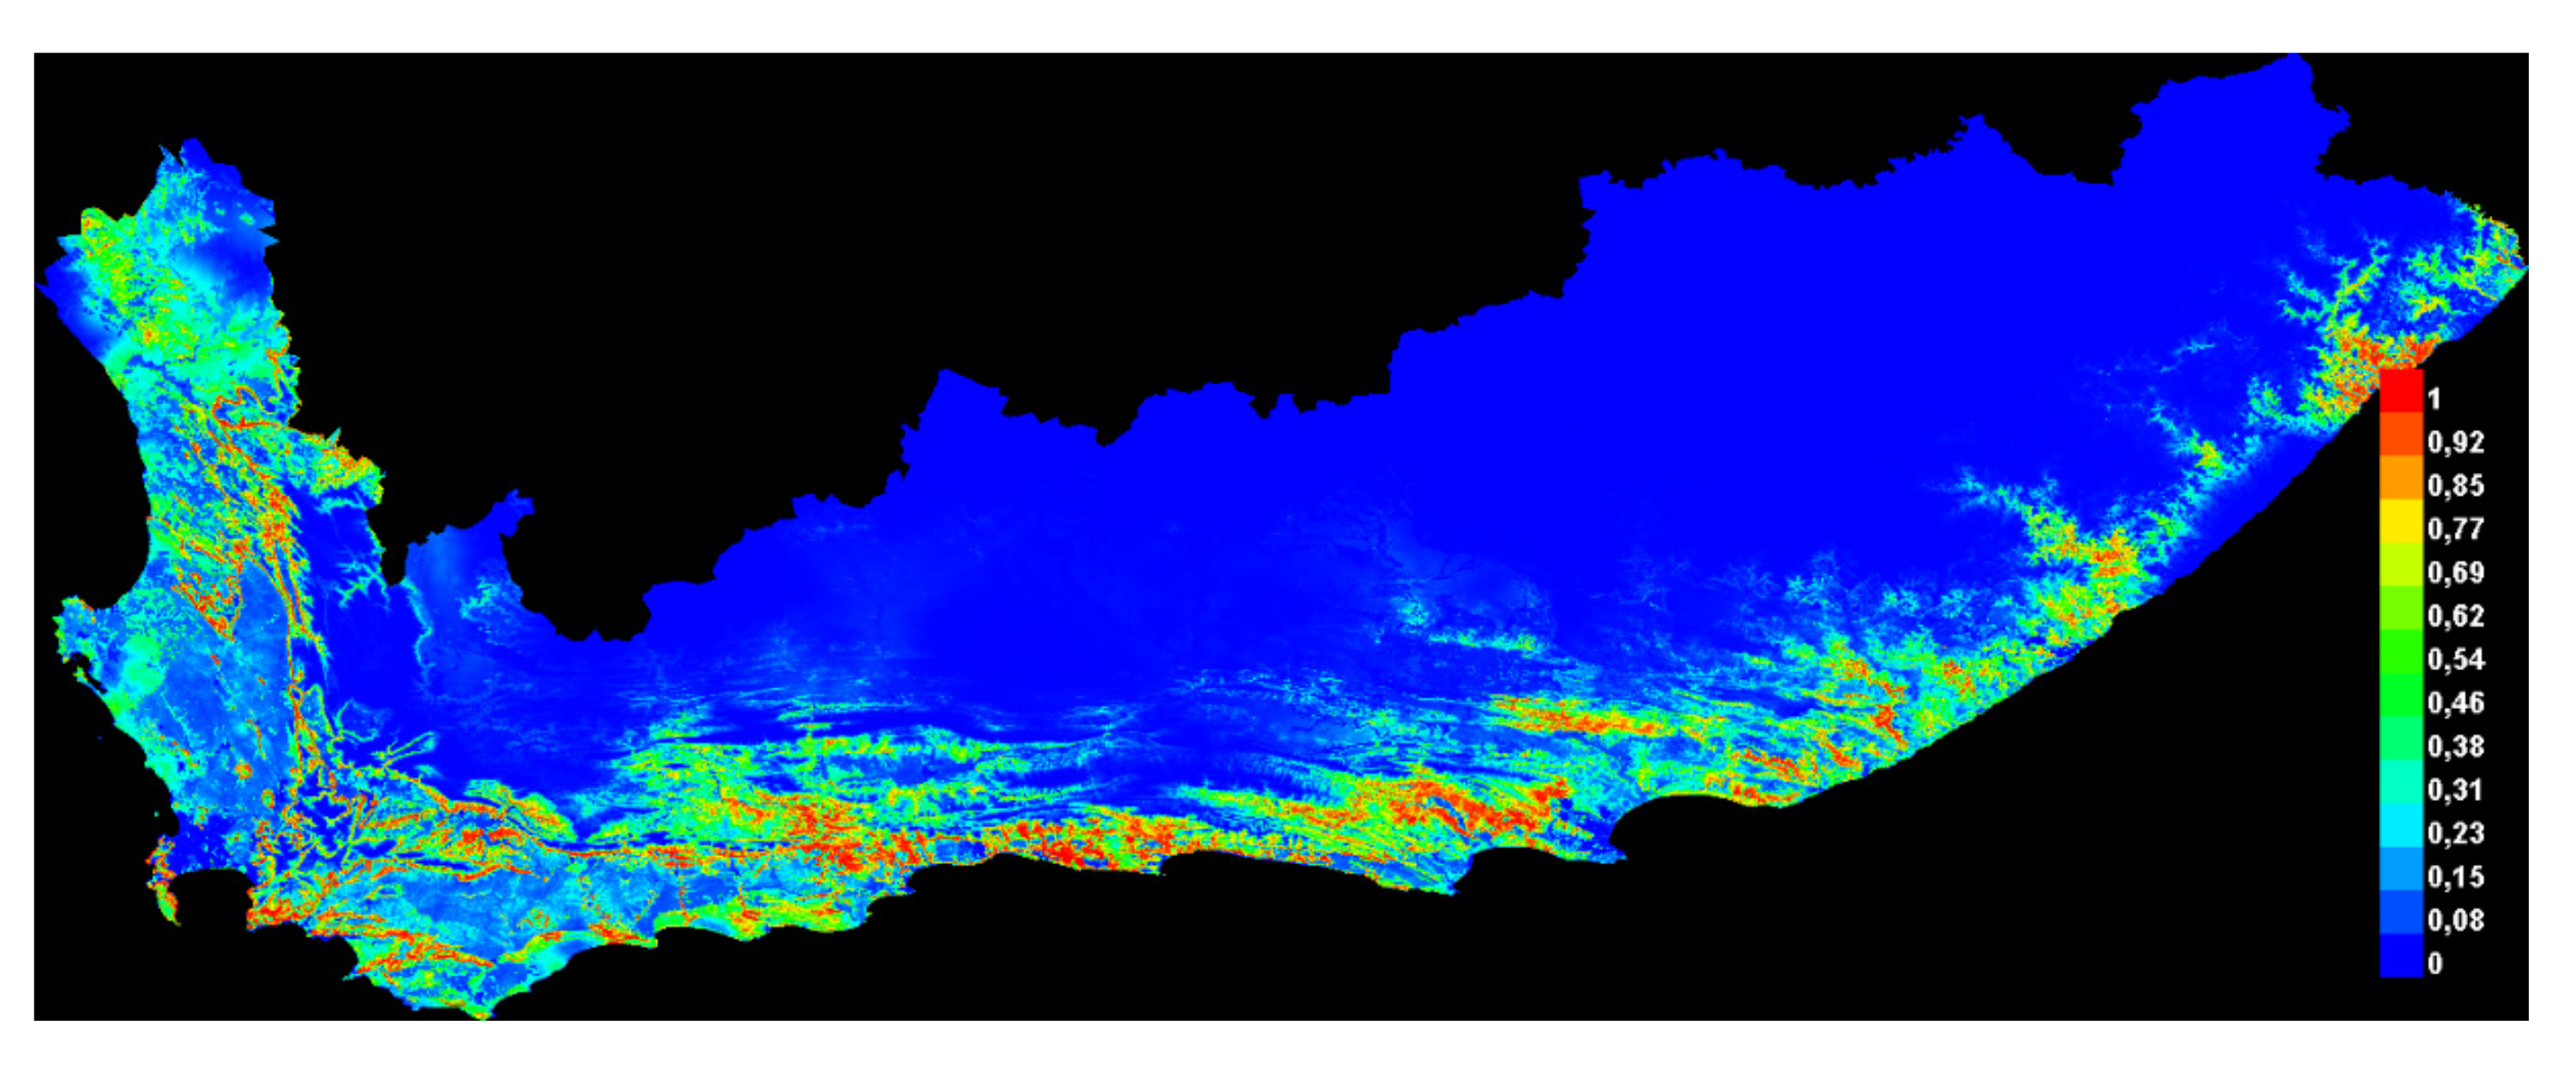
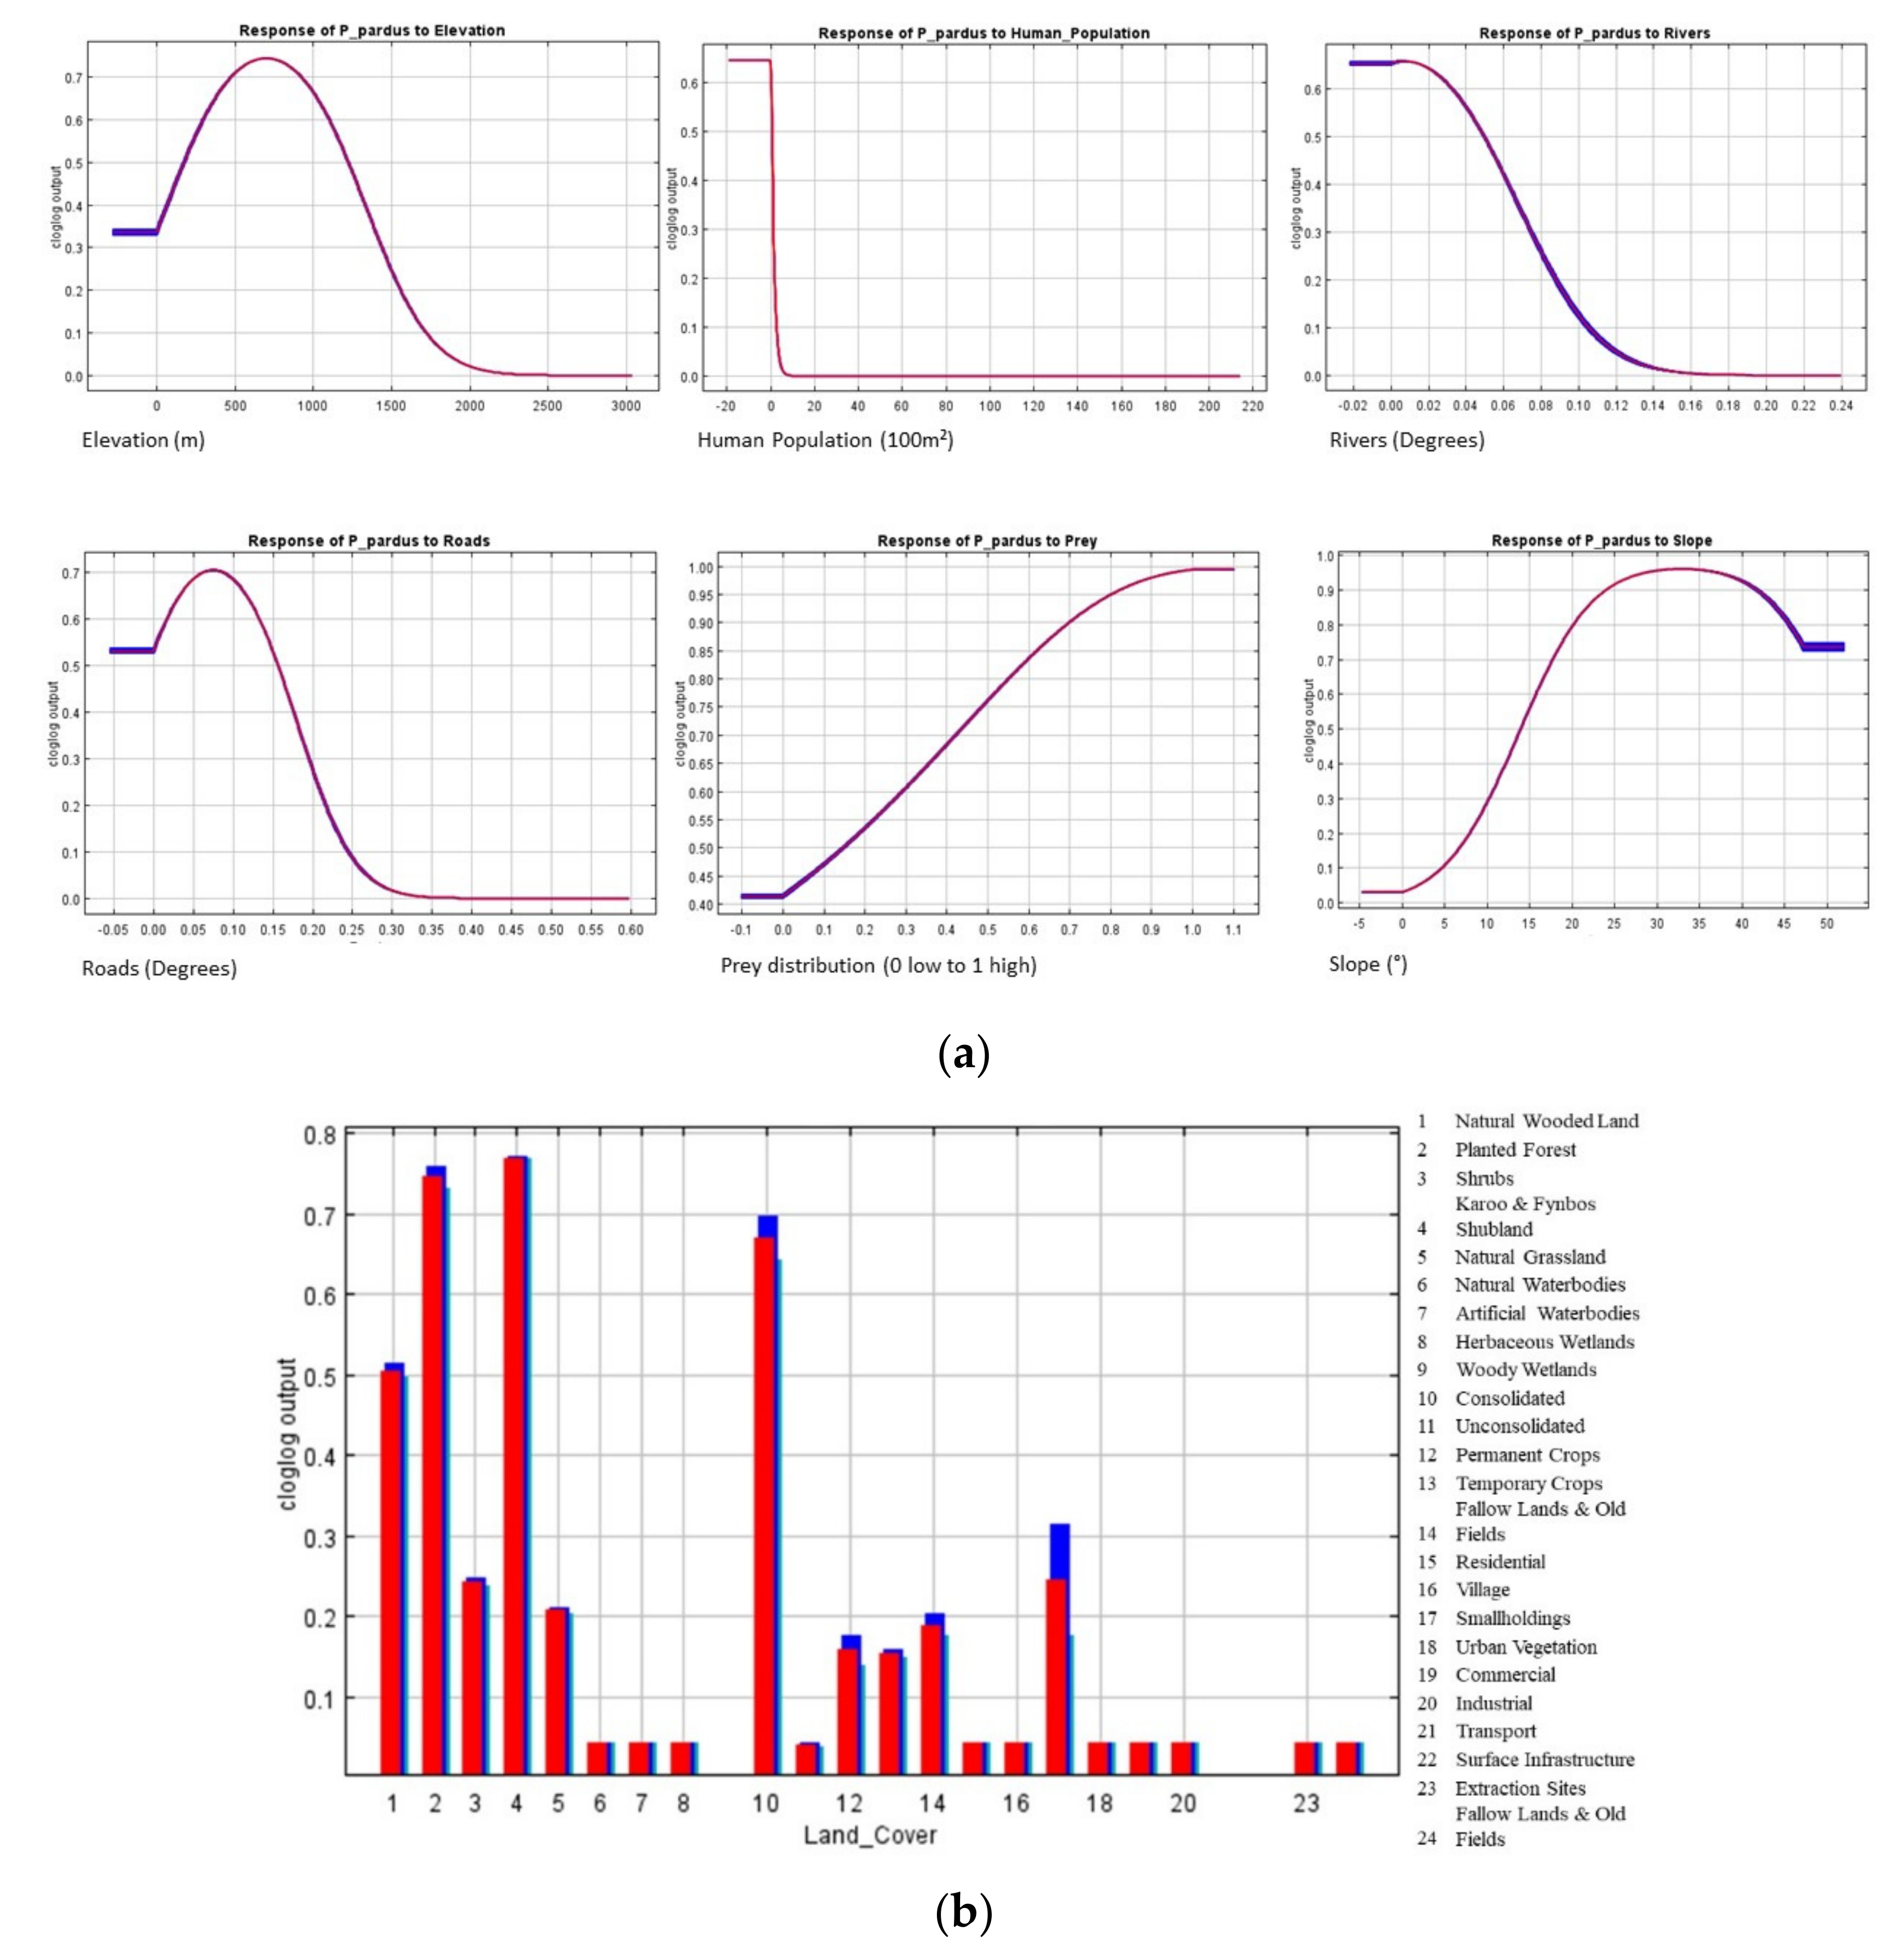
29]. We combined species data and environmental variables to predict leopard habitat distribution and delineate landscape connectivity. We found that leopard habitat in the Eastern Cape and Western Cape was strongly correlated to moderate slopes and areas of natural land-cover such as forests, shrublands as well as forest plantations. Modified landscapes, such as cultivated land, and highly human populated areas appeared to obstruct leopard presence. As a result, high-quality leopard habitat appeared to be continuous along the east and west direction of the prominent mountain ranges expanding across the two provinces and continued in a north and south directions along the Cederberg Mountain chain in the west (Figure 5). Mountainous, rugged areas offer important habitat for leopard and other large carnivores [39,62,63,64]. However, leopards occupy non-mountainous areas in regions such as Kwa-Zulu Natal, South Africa, and elsewhere in Africa [65,66]. Therefore, it is likely that mountainous areas are strongly selected because these areas offer refugia from human activity [15,39]. The distributional range estimated in this study appeared to correspond well with that described by Swanepoel et al. [39].
The connectivity model using Circuitscape is a useful addition to habitat prediction in delineating potential functional corridors linking habitat patches across complex landscapes. This allowed the identification of leopard nodes that may be in risk of isolation due to low predicted connectivity. The easternmost leopard node (Addo) appeared to have severed connectivity to neighbouring leopard habitat patches. The nearest node to Addo was the Baviaanskloof node, where potential barriers such as cultivated areas and human population density may contribute to the apparent connectivity impediment. Connectivity was also restricted between Addo and habitat in the northwest direction where connectivity to the Swartberg node also appeared to be severed, likely due to a combination of transformed landscapes and limited slopes being present in this area. The Hermanus-Agulhas and De Hoop (HA and DH) nodes showed limited connectivity potential to leopard populations along the Langeberg–Cederberg and Riviersonderend nodes.
The genetic population structure of leopards in the Eastern Cape and Western Cape is reportedly represented by three sub-structured populations [4]. One of these populations occupies the HA and DH node, where gene flow to the other two genetic populations to the north and northeast was reported to be very low [4]. This provides support of our findings of limited leopard habitat and connectivity between the HA and DH nodes to the northern nodes [4]. Human-associated landscape features are known to fragment natural landscapes and restrict mammalian connectivity [4,15,25,27]. The vast cultivated landscapes between the Langeberg–Cederberg node and the HA and DH nodes appear to fragment habitat and restrict connectivity in the region.
Identifying and promoting movement along corridors can offset the negative effects of habitat fragmentation by connecting isolated populations [24,59,67]. We identified narrow, linear corridors running through the highly transformed area between the Langeberg habitat to the coastal Duiwenhoks habitat. These areas were also identified as suitable habitat based on our prediction modelling, and were characterised by large river courses (Breede, Duiwenhoks, Goukou and Gourits), moderate slopes with some remnant riparian vegetation, surrounded by large areas of transformed, cultivated lands. In some places, these corridors become extremely narrow (<20 m) between the river and the transformed agricultural surrounds. These narrow areas caused breaks in habitat prediction, since the model evaluates suitability based on the average conditions at approximately a 1 km2 scale, but these were identified as potential corridors in the Circuitscape modelling. These corridors may play a critical role in the region, as these sites represent the last potential habitat corridors linking disjunct leopard populations in the region.
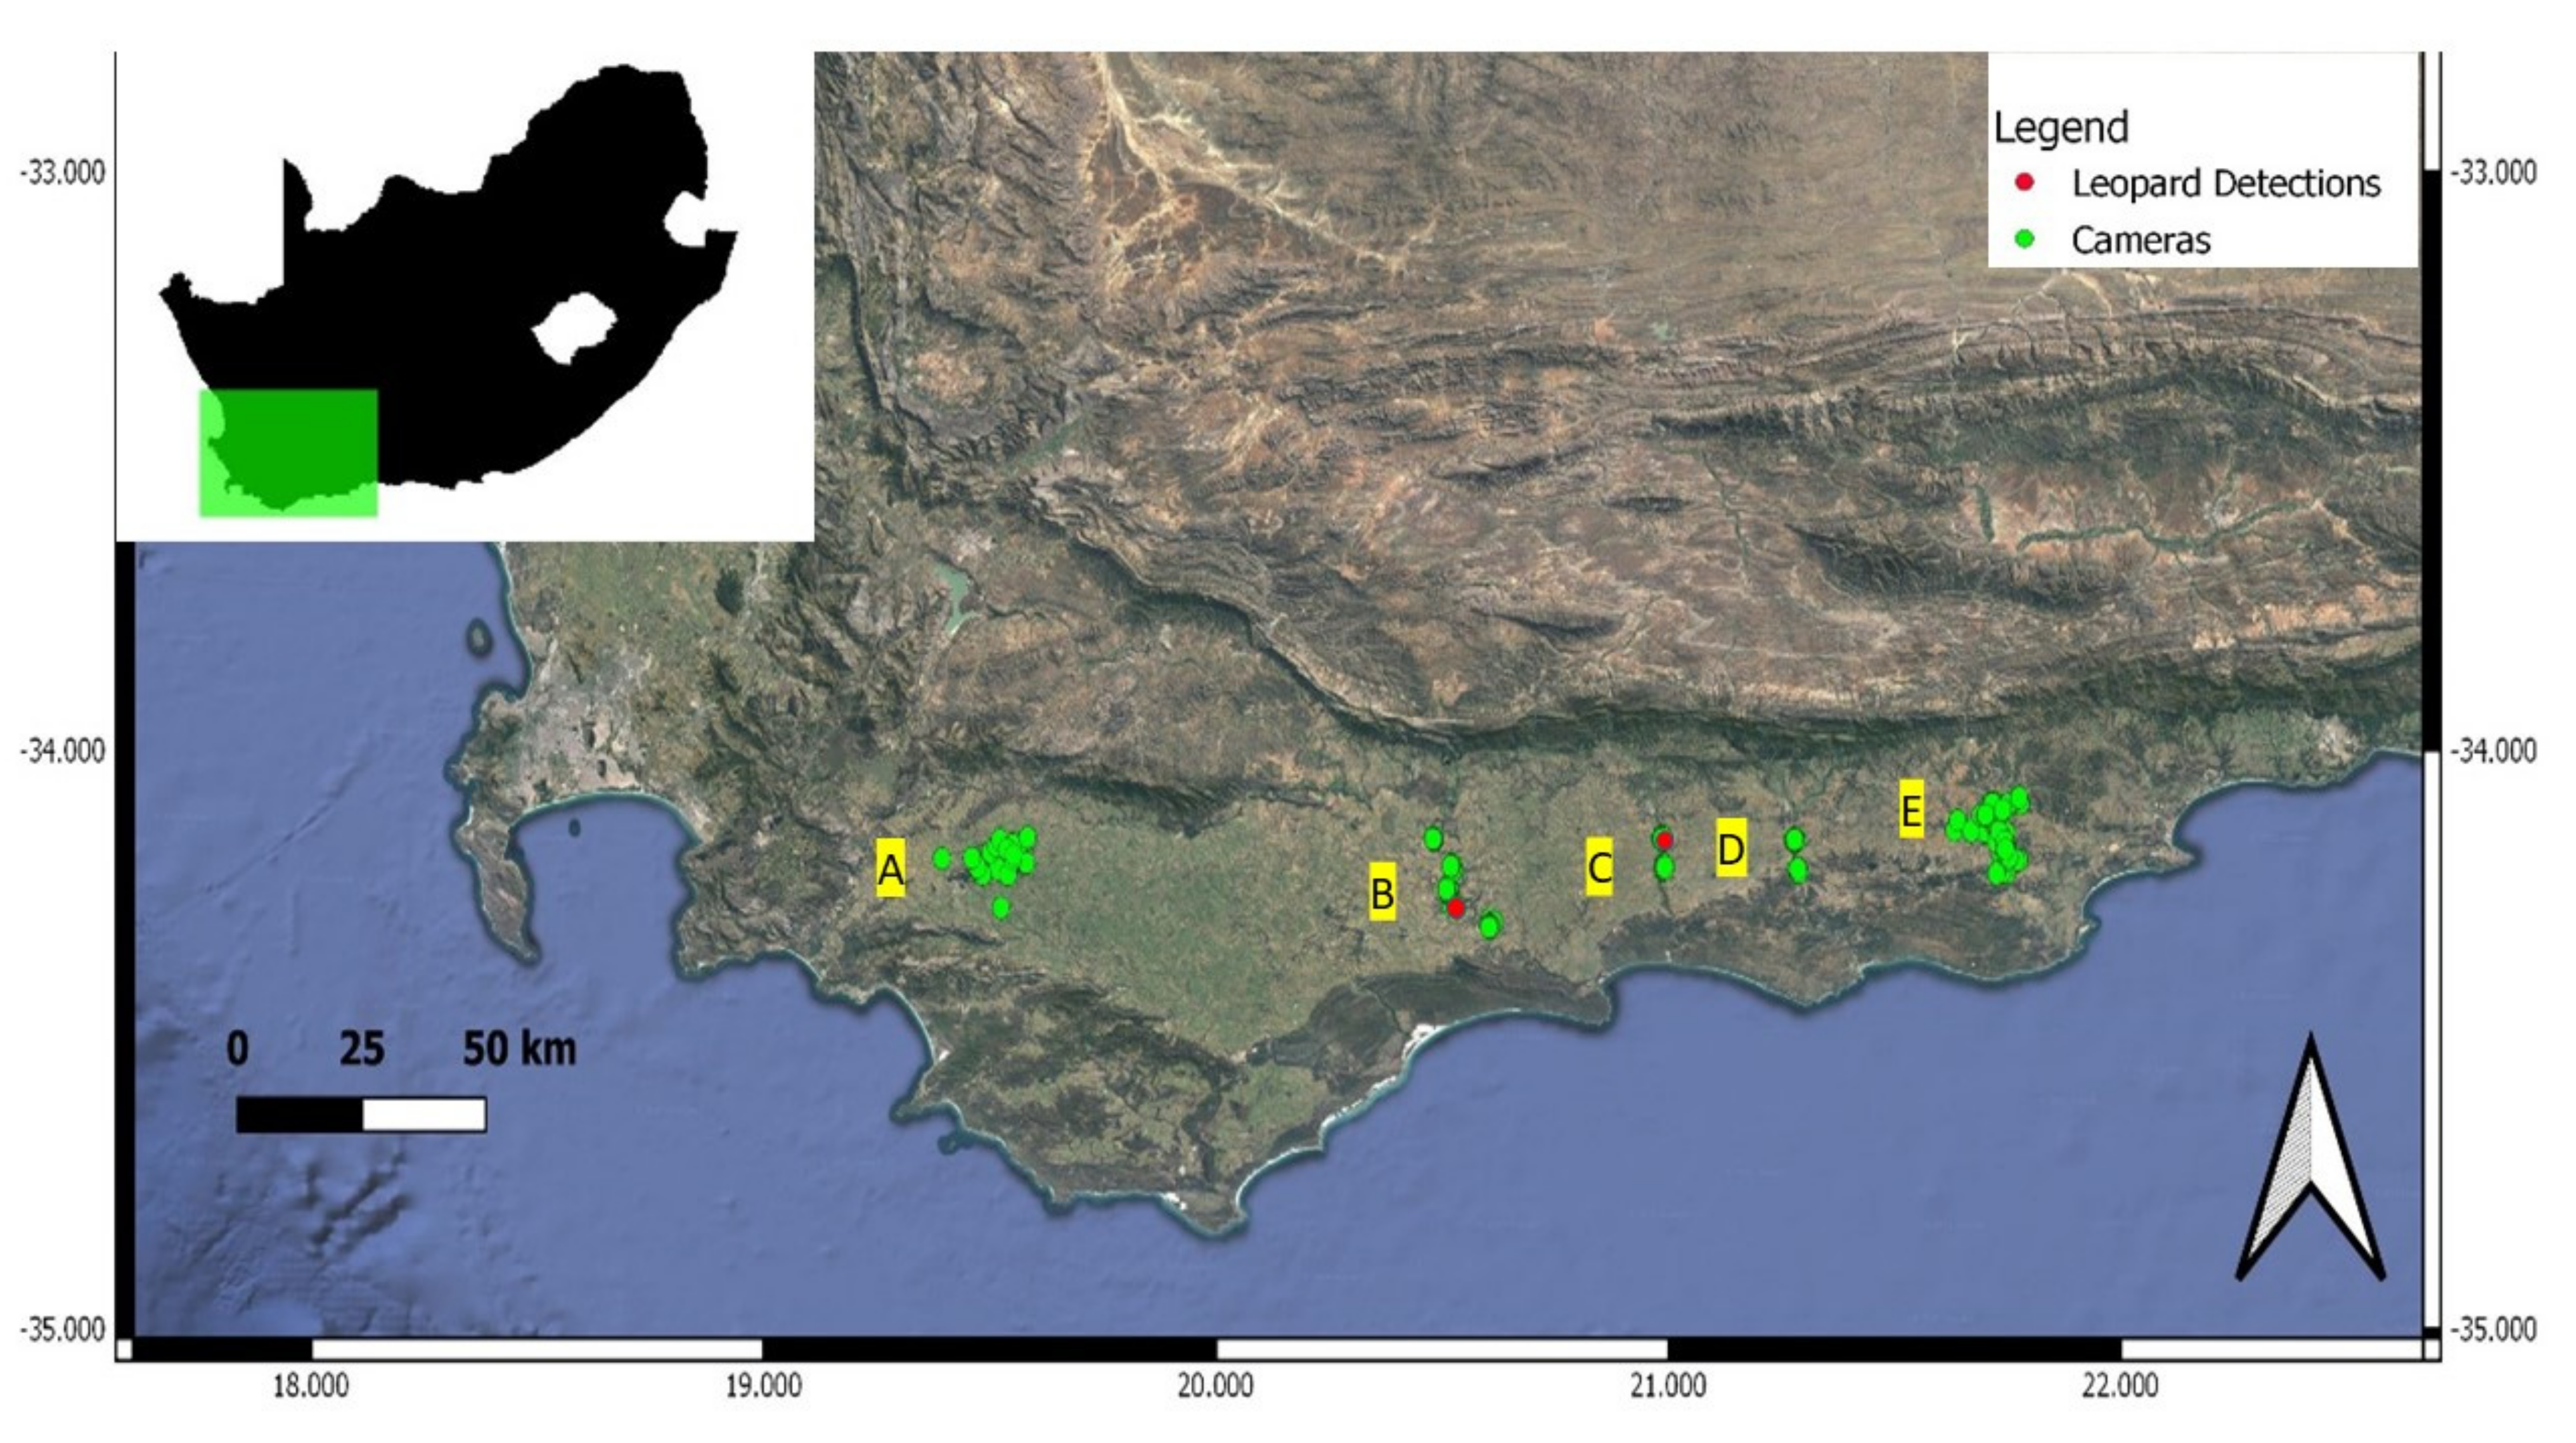
While incorporating target specific occurrence data to derive species habitat distribution improves the identification of functional corridors [21], validating corridors using independent data contributes to confirming targeted conservation management efforts [
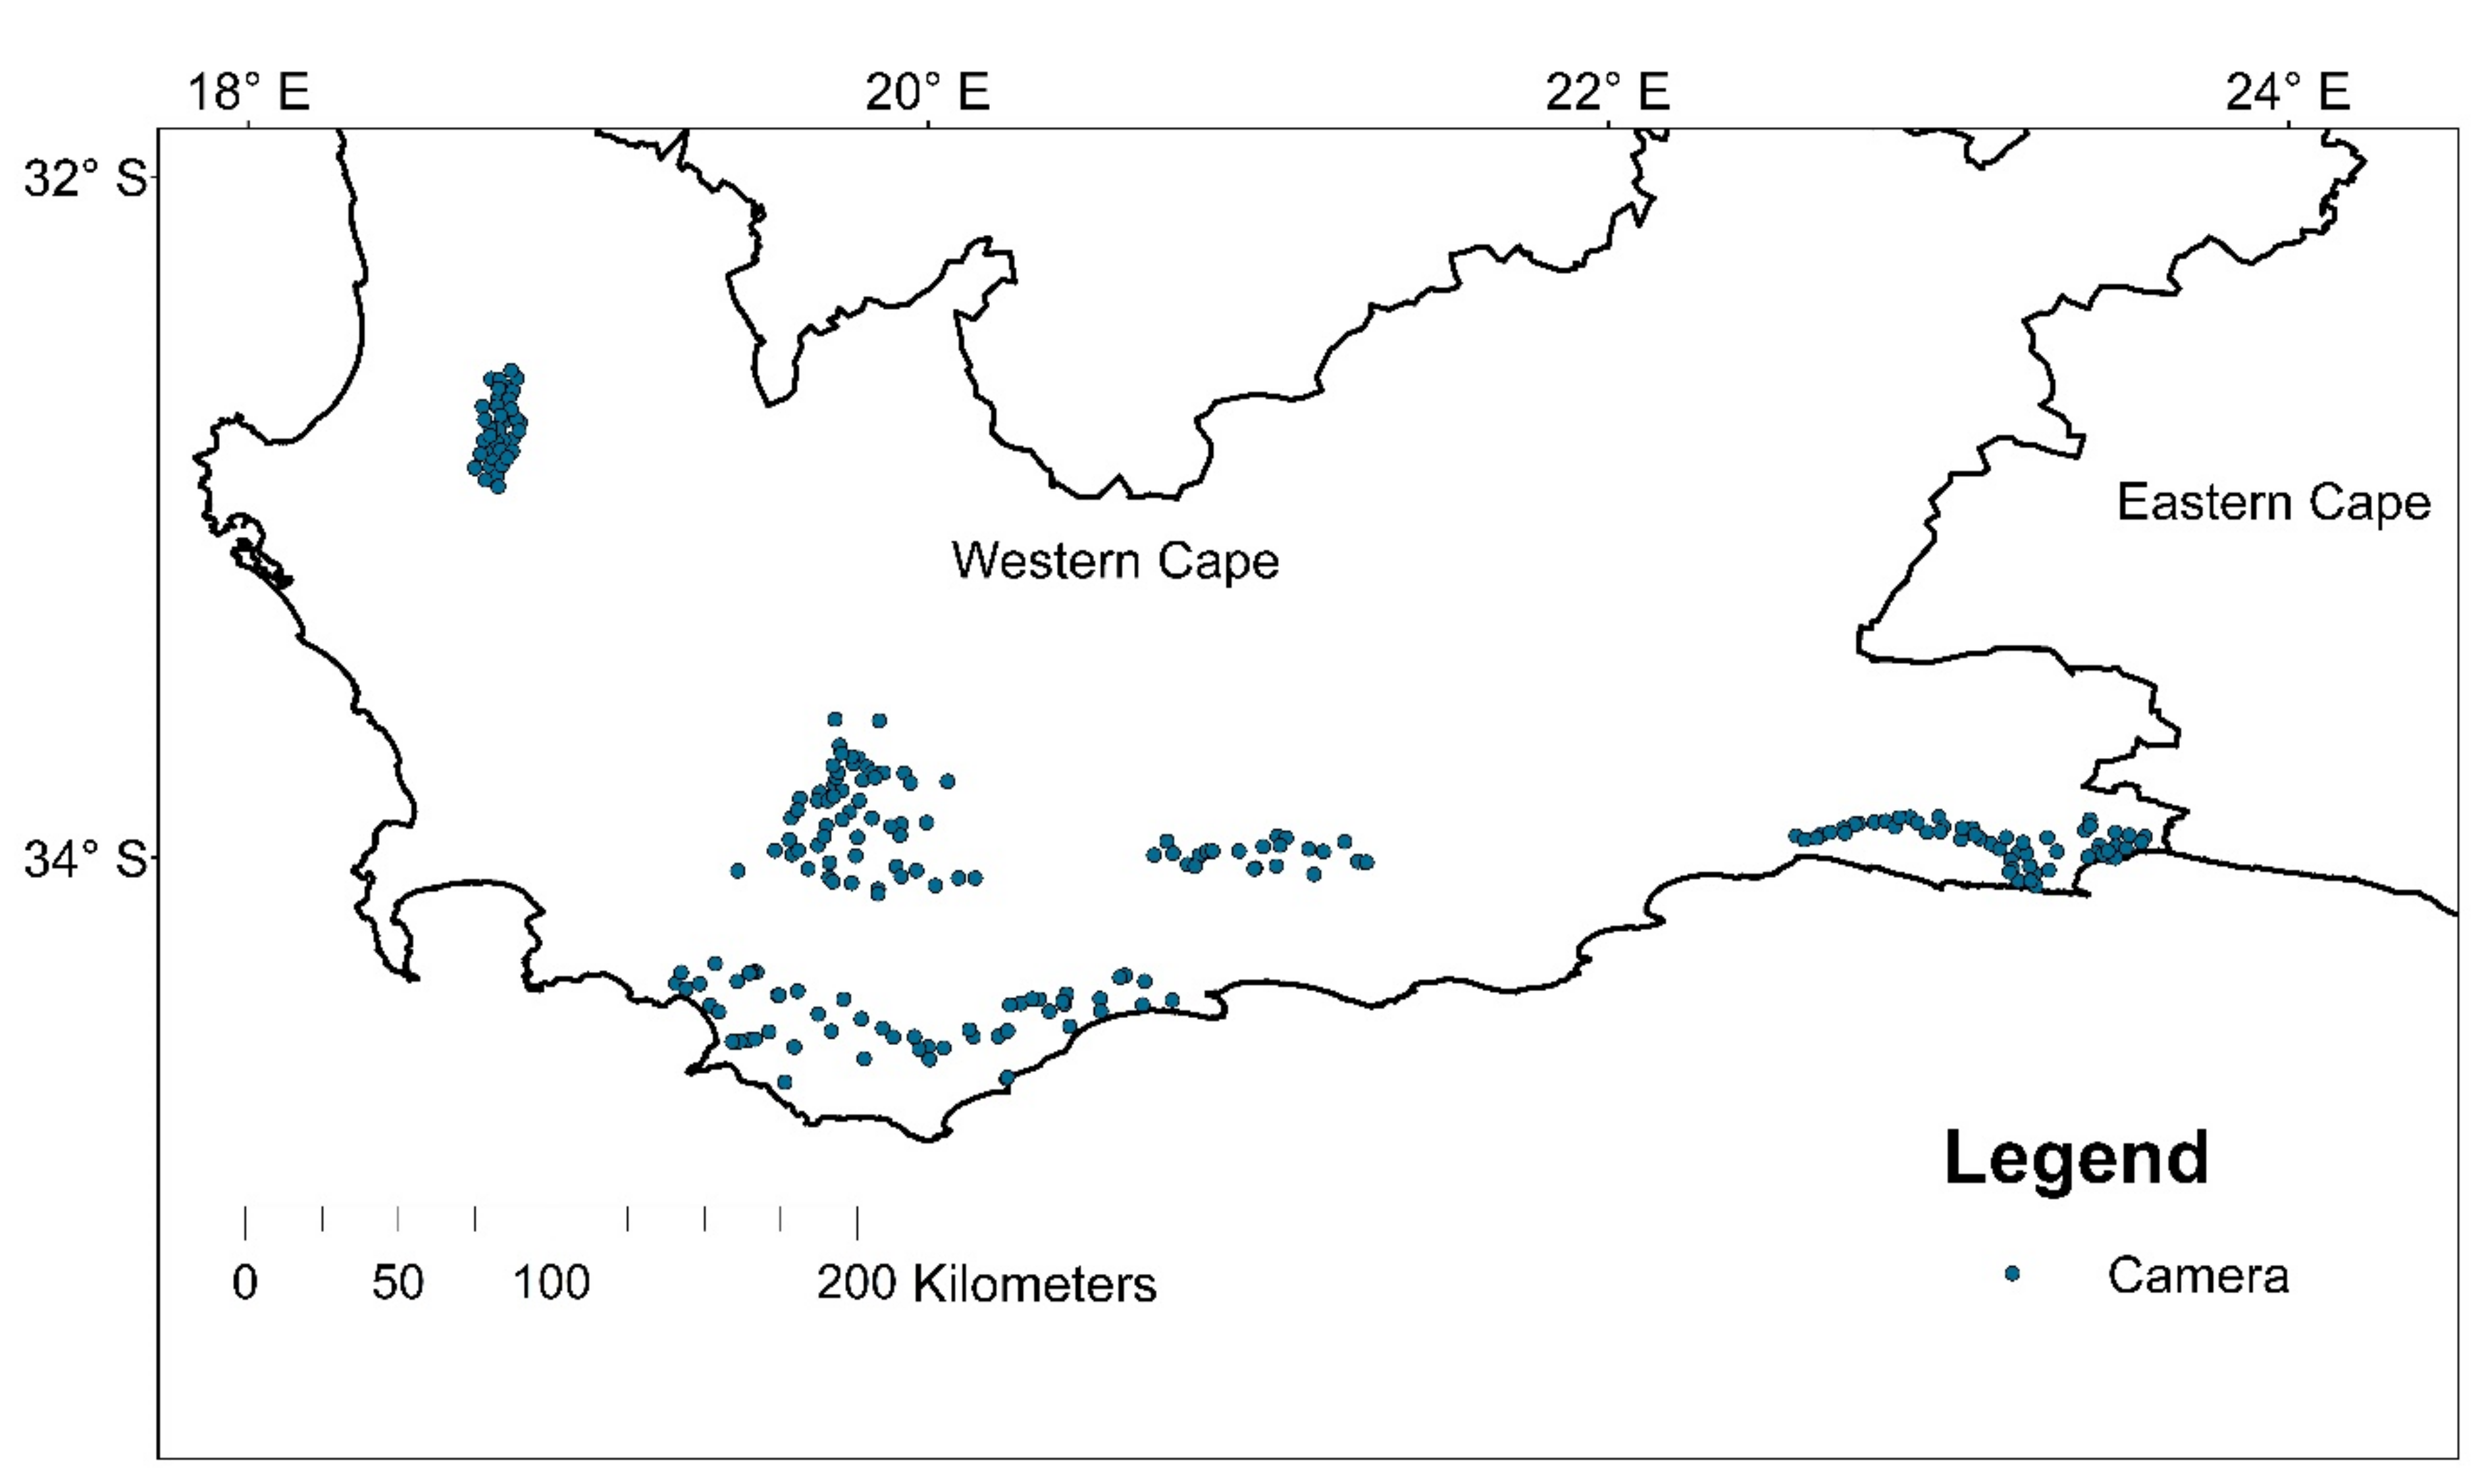
68]. Using camera traps, we detected leopard on two of the river corridors delineated by Maxent and Circuitscape, indicating their use by leopards to some degree. The low leopard detection rates along the river corridors may be expected, as gene flow from source populations in the area is reported to be low [4] and could further be compounded by the naturally low dispersal rates of leopards [69], as well as narrow strips of natural landscapes offering limited sites to place cameras to optimize leopard detection. The river corridors hosted between 23 and 32 mammalian wildlife species, confirming the high ecological value these corridors have in the region. While leopards might rarely use these corridors, these areas may contribute to the long-term genetic rigor and survival of the species in the region. This has implications for the conservation of river courses and associated riparian vegetation, particularly where the surroundings are highly modified. The existence of reduced genetic heterogeneity found for leopards in the region [4] suggests, however, that these predicted corridors do not significantly overcome the gene flow barriers to ensure populations are adequately genetically connected. Ensuring corridors facilitate the successful movement and gene flow among leopard populations is key to local population persistence. Dispersal rates are driven by complex factors such has population density [69,70]. When populations are near saturation, and no space is available for maturing animals to occupy, dispersal rates increase [69,70]. Therefore, where populations suffer from stressors that depress the population, dispersal rates would be lower [70]. Obtaining data from dispersal or the movements of translocated individuals in the area would contribute to better understanding the likelihood of corridors to contribute to leopard meta-population dynamics in the region [71].

Management Implications

Natural landscapes have diminished substantially over the past century, and the leopard is only found in 25% of its historical distribution [28]. This loss of range can be attributed to both extensive habitat transformation [72], which impacts both leopards and prey species, resulting in a loss of available prey [28,40], and to high levels of human caused mortality, principally via human–wildlife conflict and unsustainable leopard harvesting [15,73]. Protected areas are insufficient to contribute to leopard conservation in South Africa [15,39]. Therefore, species management practices have important implications in conserving meta-population dynamics, and managing the genetic viability of isolated populations may become increasingly necessary as altered habitat expands [74,75].
Connectivity is the most frequently cited recommendation to conserve species and ecosystem functioning [76,77]. Our study identified habitat permeability estimates, which highlight areas requiring focused conservation efforts where connectivity might need to be increased. We raise particular concern regarding the limited evidence of connectivity between the HA and DH populations and their counterparts along the Langeberg and Riviersonderend nodes. This may require active management interventions such as maintaining and expanding riparian zones, particularly in transformed areas. Further research is required to determine the presence of leopard populations beyond Addo to the east to predict connectivity potential eastward. However, our study also highlights the limited connectivity between Addo and populations to the west. Human-caused mortality is a major threat to leopard survival and reducing human–carnivore conflict in and around protected areas, predicted leopard habitat, and corridors will contribute to leopard conservation [15]. Therefore, we encourage conservationists and governmental institutions to advocate for non-lethal conflict mitigation strategies [78]. This can promote community tolerance and raise awareness of the regulatory-role carnivores play in ecosystems [25,26,27]. Restoring degraded landscapes through strategic land-use planning adjacent to areas such as protected areas, leopard habitat and corridors, would be a valuable conservation effort. Where connectivity is constrained and cannot be overcome with available habitat connections, and genetic structuring is apparent, and populations densities are low, active local translocations could be prudent to bolster genetic heterogeneity [74,79,80].
Over the last three decades, connectivity projects were employed at state level in the USA [81], national level in Bhutan [82] and continental scale in Europe (Natura 2000, EU Habitat Directive). However, no regional connectivity maps exist for carnivore conservation in South Africa. Coordinated planning between municipalities, provinces, and national regions with inputs from private, non-governmental and government conservation agencies should be adopted in South Africa to reduce and perhaps reverse the negative effects of habitat loss. Our models provide the first interprovincial connectivity map for leopard in South Africa. Our results can assist environmental managers in identifying sensitive and important biodiversity corridors to ensure species persistence. We recommend species management plans address the connectivity of leopard populations at provincial, national and even pan-African scales. This should be considered in transport and large development projects in South Africa to promote species conservation (e.g., Trans-Canada Highway, Banff National Park [83].

Author Contributions

Conceptualization, J.M. and B.S.; methodology, J.M. and M.P.E.S.; software, J.M. and M.P.E.S.; validation, J.M. and M.P.E.S.; formal analysis, J.M. and M.P.E.S.; investigation, J.M., M.P.E.S. and S.G.; resources, B.S.; writing, J.M., B.S., M.P.E.S., S.G., L.F., V.C., original draft preparation, J.M.; writing review and editing, J.M., M.P.E.S., S.G., L.F., V.C. and B.S.; visualization, JM; project administration, B.S.; funding acquisition, B.S. All authors have read and agreed to the published version of the manuscript.

Funding

We would like to extend our gratitude to the funders of this study: Hans Hoheisen Conservation Trust, National Department of Forestry, Fisheries and Environment, Development Bank of Southern Africa, Global Environmental Facility (GEF), Green Fund, United Nations Environmental Program, United Nations Development Program, GEF Small Grants Programme, Landmark Foundation Trust, Henry and Iris Englund Foundation, Abax Foundation, Mones Michaels Trust, Brad Banducci and Arne Hanson.

Institutional Review Board Statement

The study was conducted according to the guidelines of the Declaration of Helsinki, and approved by the Institutional Review Board (or Ethics Committee) of Rhodes University (2007-11-1, approved November 2007); University of Witwatersrand (protocol code 20110504, approved May 2011); University of the Western Cape (protocol code AREC19/2/1 approved March 2019).

Informed Consent Statement

Not applicable.

Data Availability Statement

Data used in this study can be requested from [email protected], accessed on 10 December 2021.

Acknowledgments

We sincerely thank the landowners who participated. We acknowledge CapeNature, South African National Parks, Eastern Cape Department of Economic Development and Environmental Affairs and Parks and Tourism Agency, and Northern Cape Department of Agriculture, Environmental Affairs, Rural Development and Land Reform for access to their managed areas and access to the leopards we studied. We also thank David Gaynor, Thulani Tshabalala and Kamilla Jandová for assistance with the study’s development and/or data processing. Finally, we sincerely thank two anonymous reviewers for providing valuable inputs that improved the manuscript.

Conflicts of Interest

Authors declare no conflict of interest.

Appendix A. Predicting Leopard Prey Distribution

Between 2011 and 2021 five large scale camera trap surveys (258 camera trap stations) were deployed as part of a broader leopard ecology study (Devens et al., 2018; 2021; Tshabalala et al., 2020). From this survey, we detected prey species expected to contribute to leopard diet [38,39,40] at 244 camera stations (Figure A1). We included species that are considered free roaming, occurring both in- and outside of protected areas (Table A1). We created a single predictive layer incorporating all potential prey species, as leopards are not restricted by a specific species as prey, and these species were often captured on the same camera traps.
Habitat covariates considered to influence potential prey distribution included environmental variables: land-cover, elevation, slope and human population density, distance to roads and distance to rivers (Table A2). This model indicated an excellent fit with the AUC of 0.915 (Figure A2) and the predicted distribution (Figure A3) was used in the leopard habitat suitability modelling.
Figure A1. Location of 258 camera traps used to predict potential prey species distribution model.
Conservation 02 00009 g0a1
Table A1. Number of prey species used to predict prey distribution and the number of locations each species was captured.
SpeciesNumber of Stations Captured
Bushbuck (Tragelaphus scriptus)102
Cape Grysbok (Raphicerus melanotis)147
Duiker–Common (Sylvicapra grimmia)113
Grey Rhebok (Pelea capreolus)24
Klipspringer (Oreotragus oreotragus)32
Steenbok (Raphicerus campestris)13
Rock Hyrax (Procavia capensis)24
Porcupine (Hystrix africaeaustralis)194
Red Rock Rabbit (Pronolagus rupestris)6
Scrub Hare (Lepus saxatilis)93
Table A2. The relative contributions of the environmental variables to the Maxent model in predicting prey distribution.
VariablePercent ContributionPermutation Importance
Elevation42.873.9
Land-cover29.25.2
Slope20.817.6
Roads5.62
Human Population11
Rivers0.70.2
Figure A2. (A) Receiver operating characteristic (ROC) curve averaged over the ten replicate runs. The average test AUC for the replicate runs is 0.915, and the standard deviation is 0.0022. (B) The test omission rate and predicted area as a function of the cumulative threshold, averaged over the replicate runs.
Conservation 02 00009 g0a2
Figure A3. Predicted distribution of potential prey species for leopard from low presence (0) to high presence (1).
Conservation 02 00009 g0a3

Appendix B. Camera Trap Placements along Corridors

The study was conducted along five potential corridors, identified based on (1) Circuitscape outputs where current-flow values predicted high permeability for leopard, and (2) the presence of remnant natural vegetation linking known leopard habitat patches at either end, that (3) host genetically disjunct leopard populations at low densities [4,29]. Cameras were deployed between 2015 and 2021 (Figure 3; Table 3 In text). Four of the five corridors were linear rivers and the fifth was a stepping-stone between two known leopard populations (Figure 3). The four rivers discussed below, flow in a North-South direction through the Agulhas plains between the Langeberg and Riviersonderend Mountains and the coast toward the Indian Ocean (Figure 3).

Camera Setup

Cameras used in this study consisted of CuddeBack™ E2, E3, G, and AttackIR models (Table A3). Cameras were set to detect target species leopard and small mammals at a height of 50–60 cm. Camera deployment locations differed between corridors due to the width and breadth of the corridors and are described individually below and can be seen in Figure 3.
All cameras were set for a three-minute interval between triggers. Cameras were visited on a four to six-month interval to change batteries, download memory cards and perform general site maintenance.
Klein Swartberg (Stepping-Stone)
The Klein Swartberg extends approximately 124.62 km2 and acts as a potential stepping stone between two known leopard habitat patches to the North (Riviersonderend Mountains) and the Hottentot Holland and the Hermanus Agulhas nodes (Figure 5). Due to the shape of the site, we set 18 camera trap stations (36 camera traps) in a grid fashion at ~2.2 km apart. A camera trap station consisted of two cameras facing each other in order to capture both flanks of the passing animals in attempts to identify individuals [28]. The cameras were operational for 7576 camera trap days, captured 13,861 images, detected 22 wildlife species, and no leopard were detected (Table 3).
Breede Phase-1
The Breede River was surveyed over two phases. The length of the corridor was approximately 34.9 km (Table 3). During the first phase we placed a trap-line of camera traps to act as a transect. This entailed the set-up of single cameras along the transect line, whereby cameras were placed in a straight line starting as close as possible to the river’s edge and leading away from the river in a perpendicular line to transect the natural vegetation to the edge, meeting the surrounding cultivated landscape. Cameras were spaced approximately 20 m apart, placed facing the nearest camera to detect movement along the transect. The trap-lines were located on either side of the river. The number of cameras per trap-line ranged from eight to 22 as a result of the width of the river. Initially six trap-lines were deployed, which was later reduced to five. The cameras were operational for 27,882 camera trap days, captured 44,363 images, detected 23 wildlife species, and one leopard was detected (Table 3).
Breede Phase-2
The trap-line design was modified for a densely clustered, trap-zone setup due to the poor capture rates experienced during the first phase of the Breede river (Figure 3). We focused on relocating the cameras within a 500 m² area on either side of the original trap-lines. Cameras were placed on active game trails, farm roads or paths, that would likely be used by a leopard. This resulted in a total of 68 stations distributed among five zones. During this phase the cameras were operational for 21,052 trap nights, captured 62,930 images, detected 27 wildlife species, and no leopards were detected (Table 3).
Duiwenhoks & Goukou
We used the same design to Breede river Phase-2. However, due to the shorter length of these two rivers, we restricted it to two camera trap transect lines, having 12 cameras per transect, divided equally between the two sides of the river. The cameras on the Duiwenhoks were operational for 9913 trap nights, captured 16,354, detected 23 wildlife species and one leopard was detected (Table 3). The Goukou cameras were operational for 15,506 trap nights, captured 23 wildlife species, and no leopards were detected (Table 3).
Gourits
The Gourits river offered challenges to camera placement sites and several cameras had operational failures. The wide riverbed has loose, deep sand that made it difficult to transect areas entirety due to the likelihood of stations being pushed over by cattle or driven over by vehicles. The river course had been dry for six years due to an ongoing drought and made for a good walking route for animals. We placed cameras in the riverbed allowing a more targeted area considered highly suited to leopard movements. There was also a large number of vegetated valleys branching off and large sections of natural vegetation along the river, interspersed among agricultural fields meaning that there were numerous potential routes a leopard could take (Figure 3). Therefore, cameras were more broadly placed along the length of the river, placing cameras in the riverbed as well as in the branching valleys (Figure 3). We lost several the cameras in the riverbed due to the unexpected flooding events. The project started with 55 camera placements, which were moved around as deemed necessary based on flood or theft risk, or landowner activities such as development. We placed a total number of unique camera stations utilized was 72 camera locations (Figure 3). The cameras were operational for 22,979 trap nights, captured 55,509 images of which 32 wildlife species were detected and no leopard activity was detected (Table 3).
Table A3. Collated data regarding the setup periods and setup types, and camera-related information for all the projects. * One trap-line got removed on 15 February 2018. ** This indicates the total number of cameras of each type used and includes when a camera type swapped at a station. *** Lead-acid batteries were 6V 3Ah rechargeable batteries connected to the camera via a cable.
Corridor Start DateEnd DateSetup TypeCamera Types **Battery TypeHeightDelayPicture
Breede Phase 129 April 201729 August 2018 *Trap-lineE2 (86), E3 (6)AA (x8)50–60 cm3 min1
Breede Phase 221 August 20182O ctober 2019Trap-zoneE2 (68), E3 (3)AA (x4)40–50 cm3 min1
Duiwenhoks27 January 202029 March 2021Trap-zoneE2 (1), E3 (25)Lead-acid ***40–50 cm3 min1
Goukou4 February 20202 April 2021Trap-zoneE2 (2), E3 (23)Lead-acid40–50 cm3 min1
Gourits25 October 202117 March 2021Widely distributedE2 (72), E3 (3), A (1)Lead-acid40–50 cm3 min1
Klein Swartberg15 May 201520 September 2016Widely distributedA (18x2)D-Cell 3 min1
Piketberg24 February 2020On goingGridG (70), A (4)Lead-acid40–50 cm3 min1

Appendix C. Variance Inflation Factor for Variables Used in Habitat Prediction Models

Figure A4. Variance inflation factor (VIF) for variables used in leopard and prey habitat prediction modelling.
Conservation 02 00009 g0a4

Appendix D. Leopard Habitat Prediction Modelling

Figure A5. (a) Leopard probability of selection response curves for each environmental covariate used in the full habitat prediction model: elevation (m), human population density (100 m²), distance to rivers (degrees), distance to roads (degrees), prey distribution (0 low to 1 high), slope (degrees) and (b) land-cover categories.
Conservation 02 00009 g0a5

References

  1. Haddad, N.M.; Brudvig, L.A.; Clobert, J.; Davies, K.F.; Gonzalez, A.; Holt, R.D.; Lovejoy, T.E.; Sexton, J.O.; Austin, M.P.; Collins, C.D. Habitat fragmentation and its lasting impact on Earth’s ecosystems. Sci. Adv. 2015, 1, e1500052. [Google Scholar] [CrossRef] [PubMed] [Green Version]
  2. Keyghobadi, N. The genetic implications of habitat fragmentation for animals. Can. J. Zool. 2007, 85, 1049–1064. [Google Scholar] [CrossRef]
  3. Tucker, M.A.; Böhning-Gaese, K.; Fagan, W.F.; Fryxell, J.M.; Van Moorter, B.; Alberts, S.C.; Ali, A.H.; Allen, A.M.; Attias, N.; Avgar, T. Moving in the Anthropocene: Global reductions in terrestrial mammalian movements. Science 2018, 359, 466–469. [Google Scholar] [CrossRef] [Green Version]
  4. McManus, J.S.; Dalton, D.L.; Kotzé, A.; Smuts, B.; Dickman, A.; Marshal, J.P.; Keith, M. Gene flow and population structure of a solitary top carnivore in a human-dominated landscape. Ecol. Evol. 2015, 5, 335–344. [Google Scholar] [CrossRef] [PubMed]
  5. Lino, A.; Fonseca, C.; Rojas, D.; Fischer, E.; Pereira, M.J.R. A meta-analysis of the effects of habitat loss and fragmentation on genetic diversity in mammals. Mamm. Biol. 2019, 94, 69–76. [Google Scholar] [CrossRef]
  6. Vanak, A.T.; Fortin, D.; Thaker, M.; Ogden, M.; Owen, C.; Greatwood, S.; Slotow, R. Moving to stay in place: Behavioral mechanisms for coexistence of African large carnivores. Ecology 2013, 94, 2619–2631. [Google Scholar] [CrossRef]
  7. Chanchani, P.; Gerber, B.D.; Noon, B.R. Elevated potential for intraspecific competition in territorial carnivores occupying fragmented landscapes. Biol. Conserv. 2018, 227, 275–283. [Google Scholar] [CrossRef] [Green Version]
  8. Woodroffe, R.; Ginsberg, J.R. Edge effects and the extinction of populations inside protected areas. Science 1998, 280, 2126–2128. [Google Scholar] [CrossRef] [Green Version]
  9. Wang, Y. Landscape and Land Capacity; CRC Press: Boca Raton, FL, USA, 2020; ISBN 978-0-429-81905-6. [Google Scholar]
  10. Taylor, P.D. Landscape connectivity: A return to the basics. Connect. Conserv. 2006, 29–43. [Google Scholar] [CrossRef]
  11. Resasco, J. Meta-analysis on a decade of testing corridor efficacy: What new have we learned? Curr. Landsc. Ecol. Rep. 2019, 4, 61–69. [Google Scholar] [CrossRef]
  12. Montero, B.K.; Refaly, E.; Ramanamanjato, J.-B.; Randriatafika, F.; Rakotondranary, S.J.; Wilhelm, K.; Ganzhorn, J.U.; Sommer, S. Challenges of next-generation sequencing in conservation management: Insights from long-term monitoring of corridor effects on the genetic diversity of mouse lemurs in a fragmented landscape. Evol. Appl. 2019, 12, 425–442. [Google Scholar] [CrossRef] [PubMed]
  13. Zeller, K.A.; Wattles, D.W.; Conlee, L.; Destefano, S. Response of female black bears to a high-density road network and identification of long-term road mitigation sites. Anim. Conserv. 2021, 24, 167–180. [Google Scholar] [CrossRef]
  14. Torretta, E.; Dondina, O.; Delfoco, C.; Riboldi, L.; Orioli, V.; Lapini, L.; Meriggi, A. First assessment of habitat suitability and connectivity for the golden jackal in north-eastern Italy. Mamm. Biol. 2020, 100, 631–643. [Google Scholar] [CrossRef]
  15. Swanepoel, L.H.; Somers, M.J.; Van Hoven, W.; Schiess-Meier, M.; Owen, C.; Snyman, A.; Martins, Q.; Senekal, C.; Camacho, G.; Boshoff, W. Survival rates and causes of mortality of leopards Panthera pardus in southern Africa. Oryx 2015, 49, 595–603. [Google Scholar] [CrossRef] [Green Version]
  16. LaDue, C.A.; Eranda, I.; Jayasinghe, C.; Vandercone, R.P. Mortality patterns of Asian elephants in a region of human–elephant conflict. J. Wildl. Manag. 2021, 85, 794–802. [Google Scholar] [CrossRef]
  17. Mariela, G.; Laura, C.; Belant, J.L. Planning for carnivore recolonization by mapping sex-specific landscape connectivity. Glob. Ecol. Conserv. 2020, 21, e00869. [Google Scholar] [CrossRef]
  18. Macdonald, D.W. The ecology of carnivore social behaviour. Nature 1983, 301, 379–384. [Google Scholar] [CrossRef]
  19. Beier, P.; Majka, D.R.; Spencer, W.D. Forks in the road: Choices in procedures for designing wildland linkages. Conserv. Biol. 2008, 22, 836–851. [Google Scholar] [CrossRef]
  20. Elith, J.; Phillips, S.J.; Hastie, T.; Dudík, M.; Chee, Y.E.; Yates, C.J. A statistical explanation of MaxEnt for ecologists. Divers. Distrib. 2011, 17, 43–57. [Google Scholar] [CrossRef]
  21. McRae, B.H. Isolation by Resistance. Evolution 2006, 60, 1551–1561. [Google Scholar] [CrossRef]
  22. McRae, B.H.; Dickson, B.G.; Keitt, T.H.; Shah, V.B. Using circuit theory to model connectivity in ecology, evolution, and conservation. Ecology 2008, 89, 2712–2724. [Google Scholar] [CrossRef] [PubMed]
  23. Dickson, B.G.; Albano, C.M.; Anantharaman, R.; Beier, P.; Fargione, J.; Graves, T.A.; Gray, M.E.; Hall, K.R.; Lawler, J.J.; Leonard, P.B. Circuit-theory applications to connectivity science and conservation. Conserv. Biol. 2019, 33, 239–249. [Google Scholar] [CrossRef] [PubMed]
  24. Zeller, K.A.; McGarigal, K.; Whiteley, A.R. Estimating landscape resistance to movement: A review. Landsc. Ecol. 2012, 27, 777–797. [Google Scholar] [CrossRef]
  25. Ripple, W.J.; Estes, J.A.; Beschta, R.L.; Wilmers, C.C.; Ritchie, E.G.; Hebblewhite, M.; Berger, J.; Elmhagen, B.; Letnic, M.; Nelson, M.P. Status and ecological effects of the world’s largest carnivores. Science 2014, 343, 1241484. [Google Scholar] [CrossRef] [PubMed] [Green Version]
  26. Tshabalala, T.; McManus, J.; Treves, A.; Masocha, V.; Faulconbridge, S.; Schurch, M.; Goets, S.; Smuts, B. Leopards and mesopredators as indicators of mammalian species richness across diverse landscapes of South Africa. Ecol. Indic. 2021, 121, 107201. [Google Scholar] [CrossRef]
  27. Beschta, R.L.; Ripple, W.J. Large predators and trophic cascades in terrestrial ecosystems of the western United States. Biol. Conserv. 2009, 142, 2401–2414. [Google Scholar] [CrossRef]
  28. Jacobson, A.P.; Gerngross, P.; Lemeris, J.R., Jr.; Schoonover, R.F.; Anco, C.; Breitenmoser-Würsten, C.; Durant, S.M.; Farhadinia, M.S.; Henschel, P.; Kamler, J.F. Leopard (Panthera pardus) status, distribution, and the research efforts across its range. PeerJ 2016, 4, e1974. [Google Scholar] [CrossRef] [Green Version]
  29. Swanepoel, L.H.; Balme, G.; Williams, S.; Power, R.J.; Snyman, A.; Gaigher, I.; Senekal, C.; Martins, Q.; Child, M. A conservation assessment of Panthera pardus. In The Red List of Mammals of South Africa, Swaziland and Lesotho; South African National Biodiversity Institute and Endangered Wildlife Trust: Johannesburg, South Africa, 2016. [Google Scholar]
  30. Devens, C.H.; Hayward, M.W.; Tshabalala, T.; Dickman, A.; McManus, J.S.; Smuts, B.; Somers, M.J. Estimating leopard density across the highly modified human-dominated landscape of the Western Cape, South Africa. Oryx 2021, 55, 34–45. [Google Scholar] [CrossRef] [Green Version]
  31. Devens, C.; Tshabalala, T.; McManus, J.; Smuts, B. Counting the spots: The use of a spatially explicit capture–recapture technique and GPS data to estimate leopard (Panthera pardus) density in the Eastern and Western Cape, South Africa. Afr. J. Ecol. 2018, 56, 850–859. [Google Scholar] [CrossRef] [Green Version]
  32. Mann, G.K.; O’Riain, M.J.; Parker, D.M. A leopard’s favourite spots: Habitat preference and population density of leopards in a semi-arid biodiversity hotspot. J. Arid Environ. 2020, 181, 104218. [Google Scholar] [CrossRef]
  33. McRae, B.H.; Shah, V.; Mohapatra, T. Circuitscape 4 User Guide; The Nature Conservancy: Fort Collins, CO, USA, 2013. [Google Scholar]
  34. Mucina, L.; Rutherford, M.C. The Vegetation of South Africa, Lesotho and Swaziland; South African National Biodiversity Institute: Cape Town, South Africa, 2006. [Google Scholar]
  35. Rutherford, M.C.; Mucina, L.; Powrie, L.W. Biomes and bioregions of southern Africa. Veg. S. Afr. Lesotho Swazil. 2006, 19, 30–51. [Google Scholar]
  36. Kramer-Schadt, S.; Niedballa, J.; Pilgrim, J.D.; Schröder, B.; Lindenborn, J.; Reinfelder, V.; Stillfried, M.; Heckmann, I.; Scharf, A.K.; Augeri, D.M. The importance of correcting for sampling bias in MaxEnt species distribution models. Divers. Distrib. 2013, 19, 1366–1379. [Google Scholar] [CrossRef]
  37. Boria, R.A.; Olson, L.E.; Goodman, S.M.; Anderson, R.P. Spatial filtering to reduce sampling bias can improve the performance of ecological niche models. Ecol. Model. 2014, 275, 73–77. [Google Scholar] [CrossRef]
  38. McManus, J.; Marshal, J.P.; Keith, M.; Tshabalala, T.; Smuts, B.; Treves, A. Factors predicting habitat use by leopards in human-altered landscapes. J. Mammal. 2021, 102, 1473–1483. [Google Scholar] [CrossRef]
  39. Swanepoel, L.H.; Lindsey, P.; Somers, M.J.; Van Hoven, W.; Dalerum, F. Extent and fragmentation of suitable leopard habitat in South Africa. Anim. Conserv. 2013, 16, 41–50. [Google Scholar] [CrossRef] [Green Version]
  40. Ghoddousi, A.; Bleyhl, B.; Sichau, C.; Ashayeri, D.; Moghadas, P.; Sepahvand, P.; Hamidi, A.K.; Soofi, M.; Kuemmerle, T. Mapping connectivity and conflict risk to identify safe corridors for the Persian leopard. Landsc. Ecol. 2020, 35, 1809–1825. [Google Scholar] [CrossRef]
  41. SA National Land-Cover Datasets. Available online:; https://egis.environment.gov.za/sa_national_land_cover_datasets (accessed on 24 January 2022).
  42. Karanth, K.U.; Nichols, J.D.; Kumar, N.S.; Link, W.A.; Hines, J.E. Tigers and their prey: Predicting carnivore densities from prey abundance. Proc. Natl. Acad. Sci. USA 2004, 101, 4854–4858. [Google Scholar] [CrossRef] [Green Version]
  43. Braczkowski, A.; Watson, L.; Coulson, D.; Randall, R. Diet of leopards in the southern Cape, South Africa. Afr. J. Ecol. 2012, 50, 377. [Google Scholar] [CrossRef]
  44. Ott, T.; Kerley, G.I.; Boshoff, A.F. Preliminary observations on the diet of leopards (Panthera pardus) from a conservation area and adjacent rangelands in the Baviaanskloof region, South Africa. Afr. Zool. 2007, 42, 31–37. [Google Scholar] [CrossRef]
  45. Hayward, M.W.; Henschel, P.; O’Brien, J.; Hofmeyr, M.; Balme, G.; Kerley, G.I. Prey preferences of the leopard (Panthera pardus). J. Zool. 2006, 270, 298–313. [Google Scholar] [CrossRef]
  46. R Core Team. R: A Lanuage and Environment for Statistical Computing; Version 1.4.1103; R Foundation for Statistical Computing: Vienna, Austria, 2020. [Google Scholar]
  47. Phillips, S.J.; Anderson, R.P.; Dudík, M.; Schapire, R.E.; Blair, M.E. Opening the black box: An open-source release of Maxent. Ecography 2017, 40, 887–893. [Google Scholar] [CrossRef]
  48. Carneiro, L.R.d.A.; Lima, A.P.; Machado, R.B.; Magnusson, W.E. Limitations to the use of species-distribution models for environmental-impact assessments in the Amazon. PLoS ONE 2016, 11, e0146543. [Google Scholar] [CrossRef] [PubMed] [Green Version]
  49. Gomes, V.H.; IJff, S.D.; Raes, N.; Amaral, I.L.; Salomão, R.P.; de Souza Coelho, L.; de Almeida Matos, F.D.; Castilho, C.V.; de Andrade Lima Filho, D.; López, D.C. Species Distribution Modelling: Contrasting presence-only models with plot abundance data. Sci. Rep. 2018, 8, 1003. [Google Scholar] [CrossRef] [PubMed]
  50. Phillips, S.J.; Dudík, M. Modeling of species distributions with Maxent: New extensions and a comprehensive evaluation. Ecography 2008, 31, 161–175. [Google Scholar] [CrossRef]
  51. Merow, C.; Smith, M.J.; Silander, J.A., Jr. A practical guide to MaxEnt for modeling species’ distributions: What it does, and why inputs and settings matter. Ecography 2013, 36, 1058–1069. [Google Scholar] [CrossRef]
  52. Hirzel, A.H.; Le Lay, G.; Helfer, V.; Randin, C.; Guisan, A. Evaluating the ability of habitat suitability models to predict species presences. Ecol. Model. 2006, 199, 142–152. [Google Scholar] [CrossRef]
  53. Engler, R.; Guisan, A.; Rechsteiner, L. An improved approach for predicting the distribution of rare and endangered species from occurrence and pseudo-absence data. J. Appl. Ecol. 2004, 41, 263–274. [Google Scholar] [CrossRef]
  54. Chetkiewicz, C.-L.B.; Boyce, M.S. Use of resource selection functions to identify conservation corridors. J. Appl. Ecol. 2009, 46, 1036–1047. [Google Scholar] [CrossRef]
  55. Norton, S.R. Home range and movements of male leopards in the Cedarberg Wilderness Area, Cape Province. S. Afr. J. Wildl. Res. 1987, 17, 41–48. [Google Scholar]
  56. Norton, G. Prey of leopards in four mountainous areas of the south-western Cape Province. S. Afr. J. Wildl. Res. 1986, 16, 47–52. [Google Scholar]
  57. Lehnen, S.E.; Sternberg, M.A.; Swarts, H.M.; Sesnie, S.E. Evaluating population connectivity and targeting conservation action for an endangered cat. Ecosphere 2021, 12, e03367. [Google Scholar] [CrossRef]
  58. Razgour, O.; Taggart, J.B.; Manel, S.; Juste, J.; Ibanez, C.; Rebelo, H.; Alberdi, A.; Jones, G.; Park, K. An integrated framework to identify wildlife populations under threat from climate change. Mol. Ecol. Resour. 2018, 18, 18–31. [Google Scholar] [CrossRef] [PubMed]
  59. García-Sánchez, M.P.; González-Ávila, S.; Solana-Gutiérrez, J.; Popa, M.; Jurj, R.; Ionescu, G.; Ionescu, O.; Fedorca, M.; Fedorca, A. Sex-specific connectivity modelling for brown bear conservation in the Carpathian Mountains. Landsc. Ecol. 2021, 1–19. [Google Scholar] [CrossRef]
  60. Kabir, M.; Hameed, S.; Ali, H.; Bosso, L.; Din, J.U.; Bischof, R.; Redpath, S.; Nawaz, M.A. Habitat suitability and movement corridors of grey wolf (Canis lupus) in Northern Pakistan. PLoS ONE 2017, 12, e0187027. [Google Scholar] [CrossRef] [Green Version]
  61. Niedballa, J.; Sollmann, R.; Courtiol, A.; Wilting, A. camtrapR: An R package for efficient camera trap data management. Methods Ecol. Evol. 2016, 7, 1457–1462. [Google Scholar] [CrossRef]
  62. Sanderson, E.W.; Fisher, K. Jaguar Habitat Modeling and Database Update; Wildlife Conservation Society: New York, NY, USA, 2013. [Google Scholar]
  63. Sanderson, E.W.; Beckmann, J.P.; Beier, P.; Bird, B.; Bravo, J.C.; Fisher, K.; Grigione, M.M.; Lopez Gonzalez, C.A.; Miller, J.R.; Mormorunni, C. The case for reintroduction: The jaguar (Panthera onca) in the United States as a model. Conserv. Sci. Pract. 2021, 3, e392. [Google Scholar] [CrossRef]
  64. Gavashelishvili, A.; Lukarevskiy, V. Modelling the habitat requirements of leopard Panthera pardus in west and central Asia. J. Appl. Ecol. 2008, 45, 579–588. [Google Scholar] [CrossRef]
  65. Henschel, P.; Hunter, L.T.; Coad, L.; Abernethy, K.A.; Mühlenberg, M. Leopard prey choice in the Congo Basin rainforest suggests exploitative competition with human bushmeat hunters. J. Zool. 2011, 285, 11–20. [Google Scholar] [CrossRef]
  66. Balme, G.A.; Slotow, R.O.B.; Hunter, L.T. Edge effects and the impact of non-protected areas in carnivore conservation: Leopards in the Phinda–Mkhuze Complex, South Africa. Anim. Conserv. 2010, 13, 315–323. [Google Scholar] [CrossRef]
  67. Cushman, S.A.; Lewis, J.S.; Landguth, E.L. Evaluating the intersection of a regional wildlife connectivity network with highways. Mov. Ecol. 2013, 1, 12. [Google Scholar] [CrossRef] [Green Version]
  68. LaPoint, S.; Gallery, P.; Wikelski, M.; Kays, R. Animal behavior, cost-based corridor models, and real corridors. Landsc. Ecol. 2013, 28, 1615–1630. [Google Scholar] [CrossRef] [Green Version]
  69. Fattebert, J.; Dickerson, T.; Balme, G.; Hunter, L.; Slotow, R. Long-distance natal dispersal in leopard reveals potential for a three-country metapopulation. S. Afr. J. Wildl. Res. 2013, 43, 61–67. [Google Scholar] [CrossRef]
  70. Fattebert, J.; Balme, G.; Dickerson, T.; Slotow, R.; Hunter, L. Density-dependent natal dispersal patterns in a leopard population recovering from over-harvest. PLoS ONE 2015, 10, e0122355. [Google Scholar]
  71. Jackson, C.R.; Marnewick, K.; Lindsey, P.A.; Røskaft, E.; Robertson, M.P. Evaluating habitat connectivity methodologies: A case study with endangered African wild dogs in South Africa. Landsc. Ecol. 2016, 31, 1433–1447. [Google Scholar] [CrossRef]
  72. Ray, J.C.; Hunter, L.; Zigouris, J. Setting Conservation and Research Priorities for Larger African Carnivores; Wildlife Conservation Society: New York, NY, USA, 2005; Volume 24. [Google Scholar]
  73. Packer, C.; Brink, H.; Kissui, B.M.; Maliti, H.; Kushnir, H.; Caro, T. Effects of trophy hunting on lion and leopard populations in Tanzania. Conserv. Biol. 2011, 25, 142–153. [Google Scholar] [CrossRef]
  74. Seddon, P.J. From reintroduction to assisted colonization: Moving along the conservation translocation spectrum. Restor. Ecol. 2010, 18, 796–802. [Google Scholar] [CrossRef] [Green Version]
  75. Osborne, P.E.; Seddon, P.J. Selecting suitable habitats for reintroductions: Variation, change and the role of species distribution modelling. In Reintroduction Biology: Integrating Science and Management; Wiley-Blackwell: London, UK, 2012. [Google Scholar]
  76. Heller, N.E.; Zavaleta, E.S. Biodiversity management in the face of climate change: A review of 22 years of recommendations. Biol. Conserv. 2009, 142, 14–32. [Google Scholar] [CrossRef]
  77. Hilty, J.A.; Keeley, A.T.; Merenlender, A.M.; Lidicker, W.Z., Jr. Corridor Ecology: Linking Landscapes for Biodiversity Conservation and Climate Adaptation; Island Press: Washington, DC, USA, 2019. [Google Scholar]
  78. Treves, A.; Krofel, M.; McManus, J. Predator control should not be a shot in the dark. Front. Ecol. Environ. 2016, 14, 380–388. [Google Scholar] [CrossRef] [Green Version]
  79. Weise, F.J.; Lemeris, J.; Stratford, K.J.; van Vuuren, R.J.; Munro, S.J.; Crawford, S.J.; Marker, L.L.; Stein, A.B. A home away from home: Insights from successful leopard (Panthera pardus) translocations. Biodivers. Conserv. 2015, 24, 1755–1774. [Google Scholar] [CrossRef]
  80. Berger-Tal, O.; Blumstein, D.T.; Swaisgood, R.R. Conservation translocations: A review of common difficulties and promising directions. Anim. Conserv. 2020, 23, 121–131. [Google Scholar] [CrossRef] [Green Version]
  81. Hoctor, T.S.; Carr, M.H.; Zwick, P.D. Identifying a linked reserve system using a regional landscape approach: The Florida ecological network. Conserv. Biol. 2000, 14, 984–1000. [Google Scholar] [CrossRef]
  82. Wangchuk, S. Maintaining ecological resilience by linking protected areas through biological corridors in Bhutan. Trop. Ecol. 2007, 48, 177. [Google Scholar]
  83. Sawaya, M.A.; Clevenger, A.P.; Kalinowski, S.T. Demographic connectivity for ursid populations at wildlife crossing structures in Banff National Park. Conserv. Biol. 2013, 27, 721–730. [Google Scholar] [CrossRef] [PubMed]
Figure 1. Study area and distribution of leopard occurrence data used to predict leopard habitat distribution models. The insert indicates the location of the study within South Africa.
Conservation 02 00009 g001
Figure 2. Environmental covariates used to predict leopard habitat distribution.
Conservation 02 00009 g002
Figure 3. Five potential corridors, (A) Klein Swartberg, (B) Breede 1 and 2 (C), Duiwenhoks (D), Goukou, and (E) Gourits, tested for functionality using camera traps (green). Two corridors detected leopard presence (red). The insert indicates the location of the study (green shaded area) within South Africa.
Conservation 02 00009 g003
Figure 4. Predicted leopard habitat using the full model masked to the Eastern and Western Cape. Non-leopard habitat has value of 0 with predicted leopard habitat quality increasing to 1.
Conservation 02 00009 g004
Figure 5. (a) The figure above indicates 14 nodes known to host leopard populations, connected by connectivity categories. Connectivity categories were based on natural breaks in the data (Jenks method). We display categories indicating potential permeability (40–60 percentile), moderate permeability (60–80 percentile and high permeability (80–100 percentile) overlaying predicted leopard habitat for reference. The figure below depicts connectivity categories overlaying nodes. (b,c) provides a finer scale focus on the Western Cape and Eastern Cape, respectively.
Conservation 02 00009 g005aConservation 02 00009 g005b
Table 1. Summary of GPS collar data collected from individual male and female leopards collected between 2007 and 2021 used to predict leopard habitat.
Number.Male IDGPS PointsMonitoring PeriodCollar TypeDays MonitoredFemale IDGPS PointsMonitoring PeriodCollar TypeDays Monitored
11111068 September 20178 April 2018AWT212141213217 September 20142 January 2016AWT472
211523013 June 201521 November 2015AWT16137049127 September 200710 November 2008Vectronic410
329961358 December 20067 December 2007Vectronic 3643710782 August 200711 December 2007Vectronic131
4299717015 June 200713 August 2008Vectronic 42538051857 January 200921 October 2010Vectronic652
5659612622 June 20211 October 2021Followit10167754911 April 200926 July 2009Vectronic106
6666618111 March 200917 May 2010Vectronic 43267772722 June 20091 January 2010Vectronic193
7666721431 December 200828 May 2010Vectronic 5136875681 June 20201 September 2020Vectronic92
8677315421 February 202024 June 2020Followit12468961710 February 202111 March 2021Followit29
96774561 January 202010 February 2020Followit4081834330 May 201011 June 2011Followit377
106776635 May 200913 August 2010Vectronic46582941214 March 201120 November 2011Vectronic261
11686710831 May 202027 December 2020Followit21086423624 January 201129 November 2011Vectronic309
12818214113 June 201023 February 2011Vectronic255380928321 September 20098 April 2010Vectronic199
1385783012 October 201018 August 2011Vectronic320
1486771111 May 201415 June 2014Vectronic45
15953617711 June 201124 September 2011Vectronic105
1696489527 February 201217 June 2012Vectronic111
17299711051 October 200925 July 2010Vectronic297
183805134321 September 201221 April 2013Vectronic212
198578140330 September 201414 November 2015Vectronic410
Table 2. Source of environmental variables used and methods of layer manipulation for habitat prediction modelling.
Variable NameDescriptionOriginQGIS OperationOriginal Raster Resolution (Degrees)Rescaled Resolution (Degrees)Source
ElevationDigital Elevation Model (DEM) from Shuttle Radar Topography Mission (SRTM).National Geospatial-Intelligence Agency and the NASA (National Aeronautics and Space Administration)Rescaled (average)0.00030.0083a
Human Population DensityConstrained population map of South Africa 2020WorldPop, School of Geography and Environmental Science, University of SouthamptonRescaled (average)0.000830.0083b
Land CoverSouth Africa National Landcover—Level 2 categories 2018Department of Environment, Forestry and Fisheries (DEFF), South Africa.Rescaled (mode)0.00020.0083c
PreyDistribution of potential prey (ungulates and rodents)Camera trap data (Published and Unpublished)N/A 0.0083N/A
RiversEuclidean distance to rivers 2018Council for Scientific and Industrial Research (CSIR), South Africa.Raster file of Euclidean distance to rivers created using GDAL Proximity. Rescaled (average)0.00030.0083d
RoadsEuclidean distance to all major roads 1998National Geospatial Information (NGI), South Africa, Cape Town. Department of Land Affairs, South Africa.Raster file of Euclidean distance to roads created using GDAL Proximity. Rescaled (average)0.00030.0083e
SlopeGround slope derived from DEM.Slope derived from DEM from SRTMSlope created from SRTM using GDAL Slope (z = 96405.94). Rescaled (average)0.00030.0083N/A
Table 3. Summary of the camera trap survey to assess corridor functionality.
StartEndTrap NightsLeopard CapturesTotal ImagesTotal SpeciesTotal Wildlife SpeciesTotal Distance Surveyed (km) Euclidean Distance between Closest Known Leopard Habitat
29 April 201729 August 201827,882144,363292334.941
21 August 20182 October 201921,052062,930362736.241
27 January 202029 March 20219913116,35429237.430
4 February 20202 April 20219866015,50627237.324
25 October 201917 March 202122,979055,509413239.020
15 May 201520 September 20167576013,8612922-
99,2682208,523 124.8
Table 4. Summary of model fit to predict leopard habitat distribution, estimates of variable relative contributions, and the importance training gain of the environmental variables to the Maxent model.
Model NameVariablesContributionTraining Gain (Importance)AUC
HumanLand cover27.213.70.77
Human population0.40.9
Roads3.86.5
NaturalElevation4.222.20.88
Land cover27.213.7
Rivers0.70.9
Slope 54.751.2
Prey9.14.5
FullHuman model variables 0.9
Natural model variables
Publisher’s Note: MDPI stays neutral with regard to jurisdictional claims in published maps and institutional affiliations.

