Article

A New Benchmark to Determine What Healthy Western Skin Looks Like in Terms of Biodiversity Using Standardised Methodology

by
Christopher Wallen-Russell
1,2,* and
Sam Wallen-Russell
1,3
1
Research Centre, Pavane Consultants Ltd., Suite 665, 105 London Street, Reading, Berkshire RG1 4QD, UK
2
Information Services, University College London, Gower Street, London WC1E 6BT, UK
3
Information Services, University of Notre Dame, South Bend, IN 46556, USA
*
Author to whom correspondence should be addressed.
Submission received: 27 August 2020 / Revised: 13 October 2020 / Accepted: 14 October 2020 / Published: 16 October 2020
(This article belongs to the Special Issue Feature Papers in Cosmetics in 2020)

Abstract

:
A significant loss of microbial biodiversity on the skin has been linked to an increased prevalence of skin problems in the western world. The primary objective of this study was to obtain a benchmark value for the microbial diversity found on healthy western skin, using the Chao1 index. This benchmark was used to update our 2017 skin health measuring mechanism in line with standardised methodology. It used 50 human participants from Graz in Austria and at a read depth of 6600 sequences, we found the average Chao1 diversity to be ~180, with upper and lower quartiles of ~208 and ~150, respectively. Previous work with a larger sample size was unsatisfactory to use as a benchmark because different diversity indices and evaluation methodologies were used. The Medical University of Graz used the most recent version of the Chao1 index to obtain diversity results. Because of this study, we can transfer other benchmarks of skin microbiome diversity to the methodology used in this work from our 2017 study, such as “unhealthy western skin” and “caveman/perfect skin”. This could aid with the diagnostic assessment of susceptibility to cutaneous conditions or diseases and treatment. We also investigated the effect of sex and age, which are two known skin microbiome affecting factors. Although no statistical significance is seen for sex- and age-related changes in diversity, there appear to be changes related to both. Our preliminary results (10 in each of the five age groups) show adults aged 28–37 have the highest average diversity, and adults aged 48–57 have the lowest average diversity. In future work, this could be improved by obtaining benchmark diversity values from a larger sample size for any age, sex, body site, and area of residence, to which subjects can be compared. These improvements could help to investigate the ultimate question regarding which environmental factors in the western world are the main cause of the huge rise in skin problems. This could lead to future restrictions of certain synthetic chemicals or products found to be particularly harmful to the skin.

1. Introduction

For the c. 300,000 years that Homo sapiens have inhabited the earth [1], our bodies have been host to trillions of microorganisms and recent estimates have suggested that, by cell count, we may be more microbe than human [2]. On the skin, the majority of these microorganisms are beneficial or harmless [3,4,5,6,7] and vital for defending us against infections and disease [8,9,10,11,12,13,14,15,16,17,18], immune system regulation, and lipid metabolism [19]. The skin is like any other ecosystem across nature, i.e., if healthy, the organisms within it live in peaceful mutual symbiosis with the host [5,20,21], existing commensally or symbiotically the majority of the time, and only rarely becoming pathogenic when the ecosystem balance is disturbed. Our skin microbiome is made up of viruses, fungi, archaea, and bacteria but, in this study, we focus on the latter because across all body sites, they are the most numerous [22] and there is far less compositional variation of other microbial populations such as the fungal kingdom [23,24].
Therefore, what does a healthy microbiome look like? The large variation between different people and body sites complicates the answer, as everyone has a unique ecosystem of microbes inhabiting their body [4,25,26]. As discussed in previous work, changes in skin microbial abundances have been associated with disease states, including acne [27] and psoriasis [28]. However, despite years of research and attempts at finding definitive biomarkers for skin health using species or clades, our knowledge is still limited [7,29,30,31]. Due to the complexity of ecosystems which are governed by nonlinear physics principles [32,33], and the large intra- and interpersonal variation, it may be some time before exact proportions of microbes are linked definitively to differing states of skin health. This has been explained in more detail in our previous work [34]. The variation between each person’s microbiome composition means that different proportions of microbes are healthy on one person’s skin but not necessarily on another person. For example, two people could have healthy skin but display very different microbial abundances.
It was for this reason that we searched for another method, and we found that biodiversity as a biomarker for healthy or damaged skin is more reliable. This led us to our 2017 work which described a skin health measuring mechanism collating different levels of biodiversity corresponding to different levels of skin health on one graph [34]. We noticed the same phenomenon that occurred across nature, was no different on the skin, i.e., an increase in biodiversity equated to a healthier ecosystem [35,36,37,38,39,40]. Damaged or diseased skin displays reduced diversity [31,41,42,43,44,45,46]. Studies have described that increased bacterial diversity has led to a more effective immune system [11,12,47]. Dysbiosis and decreased skin microbiome biodiversity has been linked with the majority of skin ailments, including eczema [48], psoriasis [49], dermatitis [31], skin cancer [50], and many more [44,46,51,52,53,54,55,56,57,58], but more work would need to be done to properly determine if low skin biodiversity is a cause or a symptom. For the above reasons, we focus on diversity and not analyses of community structure.
The main reason for this study is to give us the ability to transfer the remaining benchmarks from our 2017 work, such as “unhealthy western skin” or “perfect skin”, to the current skin health measuring mechanism which uses updated standardised methodology. Secondly, we take a preliminary look at how age and sex affect skin microbiome biodiversity. Previous work has described how the microbial community on human skin was influenced by sex, across all body sites [59,60,61,62], and by age [47,63]. This could prove to be critical for improving our skin health measuring mechanism for use on any human subject regardless of age or sex, and for aiding studies testing which environmental factors cause long-term damage to the skin, as an explosion in skin problems has been observed in the western world in the last 75 years [4,31,41,64,65,66,67,68,69].
We collected volar forearm swab samples from 50 human subjects with “healthy” skin, devoid of skin ailments and analysed their bacterial microbiomes using 16S rRNA sequencing. Firstly, we wanted to establish a benchmark value of diversity for healthy western skin using primarily Chao1 diversity. We note that although previous work, such as The Human Microbiome Project with 242 human subjects (https://hmpdacc.org/hmp/) [70], used larger sample sizes, different methodology meant alpha diversity analysis did not include the Chao1 index [42,52], rendering them unsatisfactory as a benchmark and incompatible with our research. Therefore, this study uses the largest sample size for Chao1 biodiversity analysis. It is crucial to mention that we are strict on using Chao1 because it currently offers the most complete evaluation of diversity of an ecosystem. Other methods, such as the entropy-based Shannon and Simpson metrics [71], can lead researchers to misinterpret the diversity of ecosystems [34]. The former does not account for the fact that some microbes are rarer than others; and the latter gives too much weight to common or dominant organisms, meaning the presence of rare types with only a few representatives will not affect diversity. Chao1 is the other end of the spectrum and uses the existence of fragile “rare” species as a sign that biodiversity is high. This concept is backed up in other areas of ecology, where it is common knowledge that rare species become extinct first as ecosystems are disrupted, weakened, and lowered in biodiversity [72,73].

2. Materials and Methods

2.1. Study Conditions and Sampling Procedure

A total of 50 human subjects were recruited from the town of Graz in Austria, and split into the following five different age groups:
  • Group 1, 18–27 years;
  • Group 2, 28–37 years;
  • Group 3, 38–47 years;
  • Group 4, 48–57 years;
  • Group 5, 58–70 years.
There were five female and five male study subjects in each group, and all participants were Caucasian. There were 25 males and 25 females in total. All participants were recruited on the criteria they were without chronic skin diseases (no serious skin conditions such as acne, eczema, psoriasis, and skin cancer, among others) and had not used antibiotics within the last three months. All participants did not shower on the day of sampling and all of them had their skin sampled once.
The skin microbiome samples were taken from the volar forearm of the nondominant arm, with sterile BBLTM CultureSwabTM EZ (Becton Dickinson), which had been premoistened with sampling buffer (50 mM Tris (pH 7.2), 1 mM EDTA, 0.5% Tween20). The swab was placed on the forearm and the whole area was swabbed with pressure under rotation in three directions (horizontal, vertical, and diagonal). After sampling, the swabs were directly transferred into DNA-free 1.5 mL reaction tubes (Eppendorf AG) and stored at −80 °C until further processing. Swabbing the skin has widely been used as a suitable sampling method when analysing the skin microbiome [7]. Sampling buffer controls were taken to control the sterility of the used buffer. We also used negative controls, including PCR and sequencing controls, DNA extraction controls, and swab controls to exclude the effect of possible contamination from laboratory reagents.
The entire project was carried out in collaboration with the Medical University of Graz in Austria, and run independently, supervised by a member of staff at the Department of Internal Medicine. All study participants were recruited by the Medical University of Graz. Human skin samples were taken noninvasively and handled with approval by and in accordance with the Ethics Commission at the Medical University of Graz, who approved the study (Ethikkommission der Medizinischen Universität Graz, approval number EK–31–110e × 18/19). Approval allowed the use of human subjects and the following procedures in this methodology. All participants provided written informed consent prior to enrolment in this study. Samples were treated anonymously, and human material was not the focus point of this study. Microbial samples or data derived cannot be linked to a certain individual. The process of the experimentation was agreed upon by the Medical University of Graz, and the Austrian Centre of Biotechnology (ACIB), a not-for-profit research organisation through whom the funding application was made.

2.2. DNA Extraction and 16S rRNA Gene Amplification

The swabs were thawed on ice and transferred into Matrix E tubes (MP Biomedicals) with flamed tweezers. The DNA extraction was performed using a FastDNA Spin Kit (MP Biomedicals), according to the manufacturer’s protocol with the following derivations: the bead beating step was done with MagNA Lyser (Roche Diagnostic GmbH) at 6400 rpm twice for 30 s, and the first centrifugation step was performed for 10 min. For every DNA extraction run, one extraction control (kit control) was processed with the samples to control the sterility of the kit system. The concentration of the DNA was determined using a Qubit ds-DNA HS Assay Kit (Invitrogen AG), according to the manufacturer’s protocol. DNA concentrations of all samples were under the detection limit. The extracted DNA was stored at −20 °C until further downstream applications.
To amplify the 16S rRNA gene V4 region of healthy skin microbial communities, PCR (polymerase chain reaction) was performed by using 1–2 µL of the extracted DNA as a template. Forward (GTG YCA GCM GCC GCG GTA) and reverse (GGG ACT ACN VGG GTW TCT ATT) primers [74] were added to a final concentration of 200 nM. The following cycling conditions were applied: initial denaturation at 94 °C for 3 min, 35 cycles of denaturation at 94 °C for 45 s, annealing at 50 °C for 60 s, and elongation at 72 °C for 90 s, followed by a final elongation at 72 °C for 10 min.
To visualise the PCR products, agarose gel electrophoresis was performed with 1.5% agarose gel for 35 min, at 70 V. We applied Roti Gel Stain (Carl Roth GmbH + Co. KG) as DNA intercalate to dye the DNA, and we used a Fastruler Low Range (Thermo Fisher Scientific Inc.) ladder to assess the size of the PCR products. PCR products were stored at −20 °C until sequencing. Library construction and Illumina sequencing (MiSeq) was performed by the Core Facility Molecular Biology at the Center for Medical Research in Graz, Austria.

2.3. Data Analysis

The obtained 16S rRNA sequences were processed using QIIME 2 (Version 2018.11.0). The data were processed and all required files were formatted as described by the QIIME developers (https://docs.qiime2.org/). First, the fastq data were imported and the sequences were filtered and denoised with DADA 2. After the quality check, the sequences were trimmed to a minimum length of 300 bp and a maximum of 350 bp. The taxonomy was assigned using 16S rRNA gene reference sequences of the Silva database (version 132).
From the OTUs, alpha and beta diversity analyses were performed using Calypso (http://cgenome.net/calypso/) [75]. All data needed to replicate the results in this paper is included in Supplementary Materials. For Calypso, the data was normalised using total sum normalisation (TSS) and transformed using square root transformation, no samples removed, no taxa removed, and no cut off for rare taxa. Chloroplast and cyanobacteria were removed. On healthy skin, cyanobacteria have been found to contaminate samples due to their similarity, sequence wise, to the DNA sequences of chloroplast which can be present after application and long-term use of herbal skin care products [76]. We did not ask the participants to complete questionnaires on their skin care regime, and therefore we do not know if this would have been applicable. The number of raw reads per sample can be seen in the raw sequence read files (fastq).
For alpha diversity analysis, samples with less than 6600 sequence reads were filtered out to calculate the diversity indices reliably. The removed samples included controls (buffer, kit, and PCR controls) and one sample of a female study subject. We analysed alpha diversity using both the Chao1 and Shannon diversity metrics. For an explanation of the Chao1 index, and how it is different from the Shannon index, see our first paper [34] or previous work [77,78]. We used the Shannon index, in this paper, to evaluate the “evenness” or spread of organisms distributed in a system. Chao1 was part of the “standardized” methodology we used for our skin health measuring mechanism. Filtering was performed, because Chao1 and Shannon analyses rarefied the number of reads to the lowest number of reads in a sample, and with too few sequences these analyses were not reliable. Additionally, sequence data from our previous study [79] was compared with the new dataset regarding their alpha and beta diversity.
Beta diversity between the samples, the overall structural similarity, and variation between the microbiomes using the variables under investigation, were also examined. For beta diversity analysis, no samples and no taxa were removed to visualize the differences between skin microbiome samples and controls. Control samples typically carry very few sequence reads. Rarefaction analyses were done to assess how well the data represented the diversity of the microbial communities, where a larger number of sequences or reads meant the potential of discovering more species or types of microbe was higher.
Within beta diversity analyses, principal coordinates analysis (PCoA) was performed, which is a statistical technique that uses clusters of samples which have similar biological communities to assess differences between them in a simple, graphical form. To perform PCoA analysis, we obtained an abundance matrix following sequencing. This contained microbial abundance information of each sample in a matrix, which was a way of describing data from multiple datasets containing multiple measurements in each. Then, it was converted into a distance or dissimilarity matrix that related each of the samples to the other samples in the groups being compared by the difference between microbial communities. This was, then, visualized as a two-dimensional representation of the results in PCoA plots [80]. The human mind finds it difficult to understand multivariate data with multiple measurements in each sample and to grasp it in more than three dimensions, therefore, this technique projects multidimensional results onto a low dimensional graphic. Each point represents a sample and the smaller the distance between points, the more similar the communities.
Redundancy analysis (RDA resulting in RDA plots) was also used to evaluate the difference in microbial community structure in response to the changing variables in this study. In a simple study with two variables, linear regression and correlation analysis would be performed to find the relationship between the two. RDA is the multivariate equivalent that is used when there are multiple variables [81,82] and is a type of “constrained ordination” that evaluates the extent to which the change in one group of variables is caused by the change in another group of variables [83,84]. The resulting RDA plots, in this study, were used to evaluate how well samples could be distinguished from one another in relation to the explanatory variables such as age and sex.
Here, the limit for statistical significance was set to a p-value of p = 0.001, due to multiple testing. This number was decided because genome-wide association studies could have many measurements per participant. The p-value threshold of p ≤ 0.05 is used for clinical studies where there are a low number of measurements per participant. If it were to be used in studies like the current one, some significant relationships found may be due to chance [85]. In addition, a review of classical and “Bayesian” methods for significance testing has shown that p-values in the region of 0.05 and 0.01 offered only moderate evidence of null hypothesis rejection (the null hypothesis states that there is no relationship between two variables being studied), but p-values around 0.005 and 0.001 showed “strong and very strong evidence”, respectively [86]. It recommends a “revised standard for statistical evidence” by setting the significance threshold at 0.005 or 0.001.

3. Results

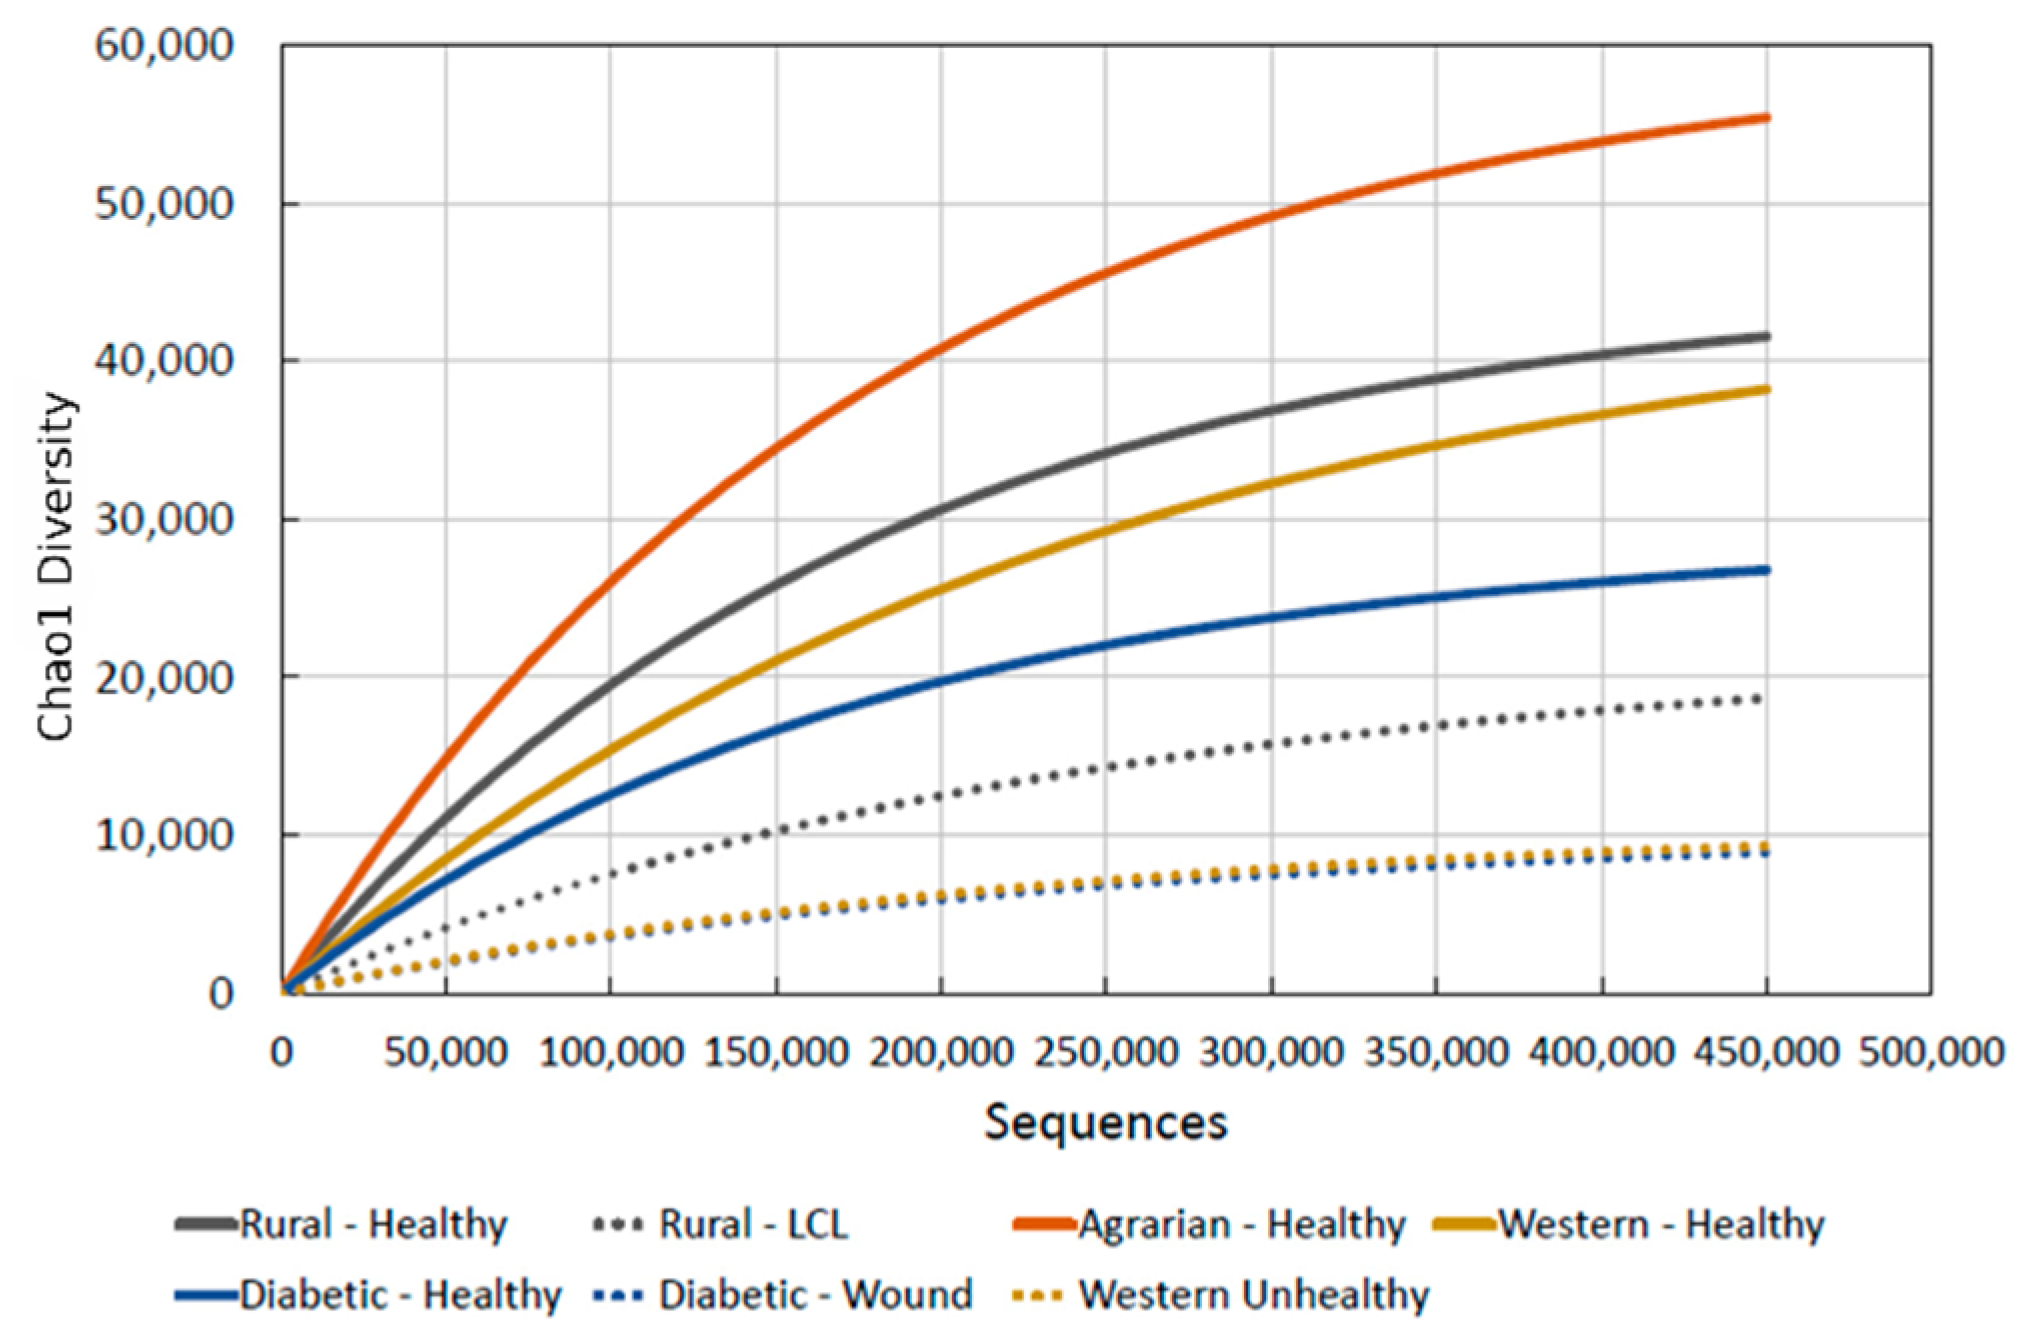
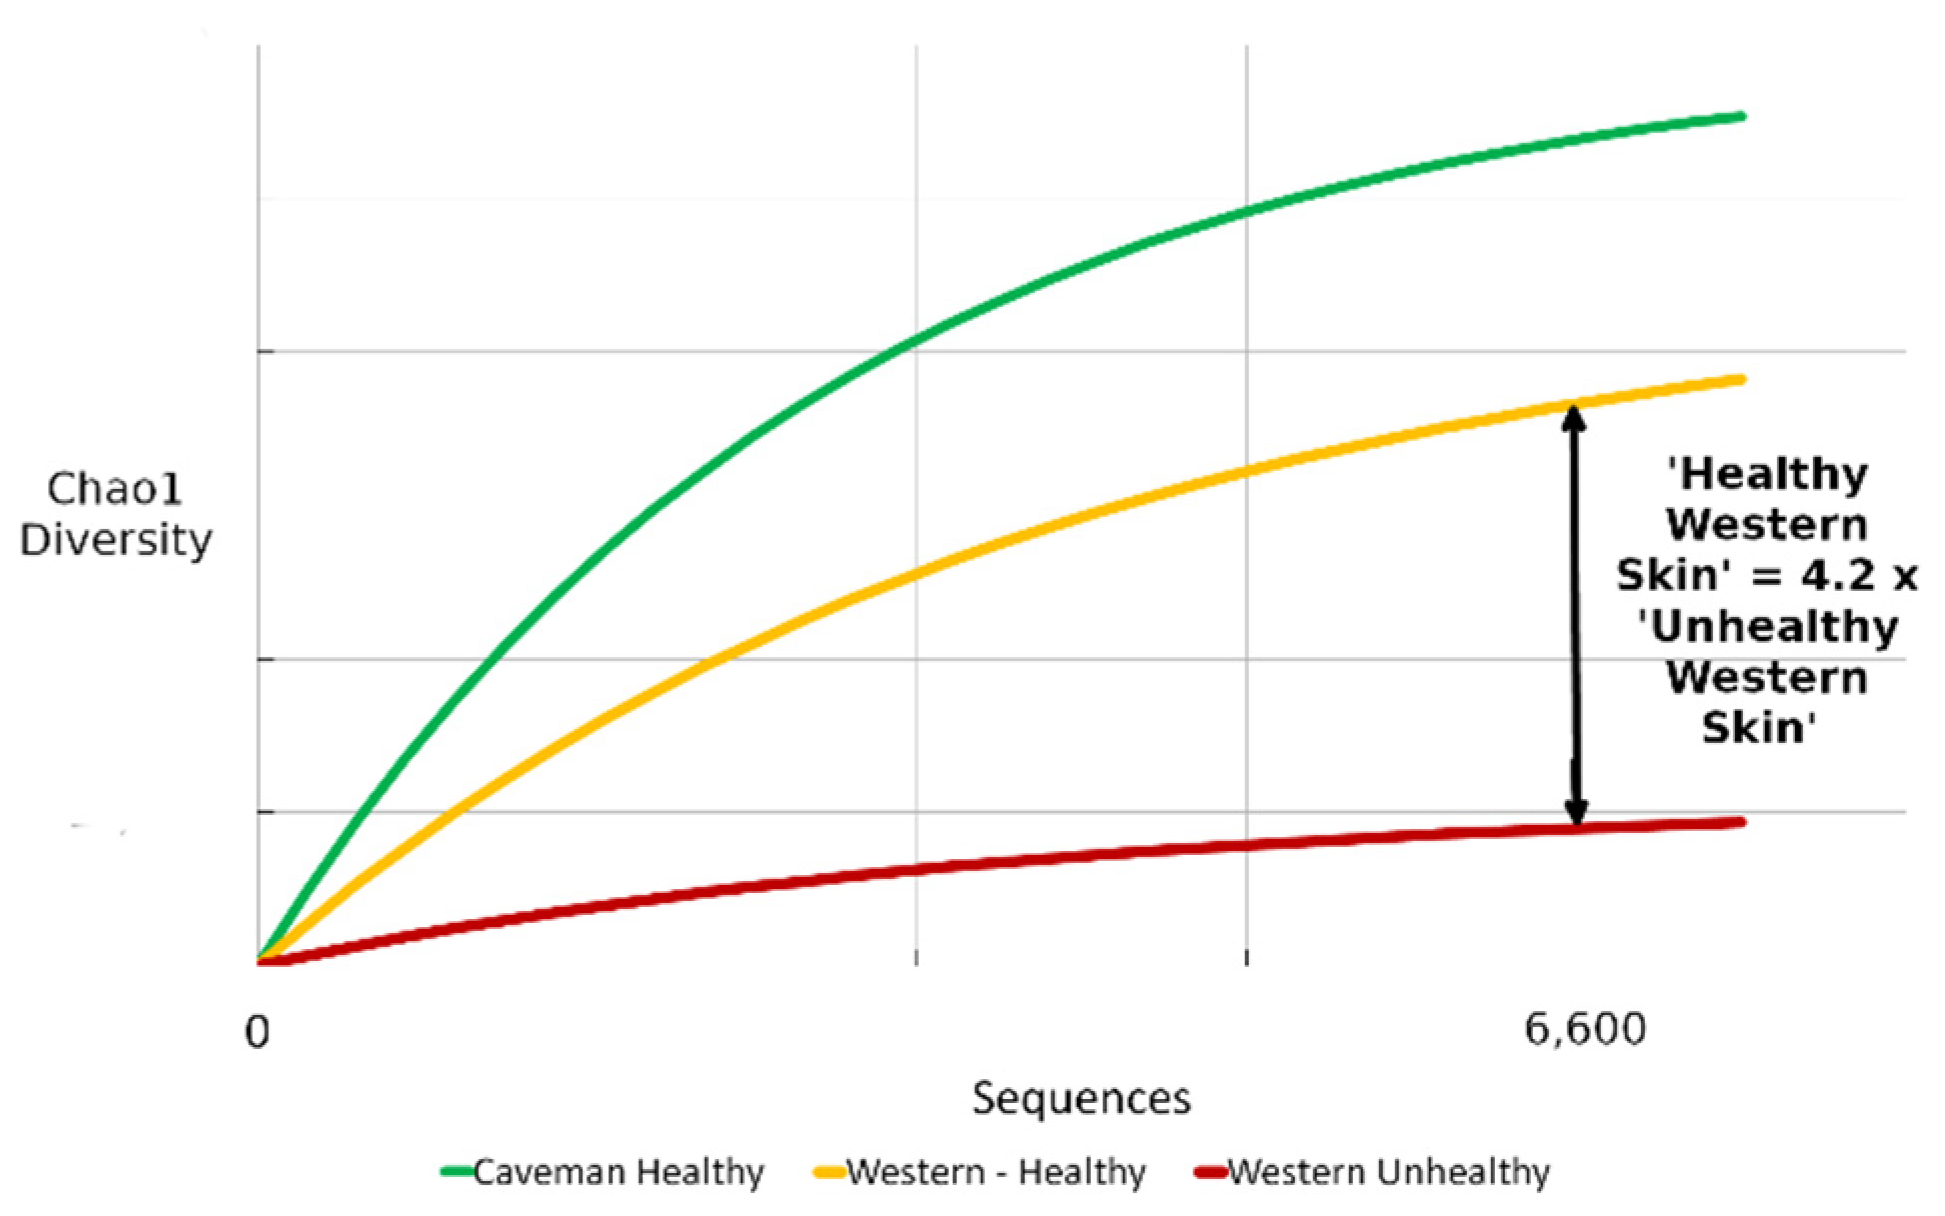
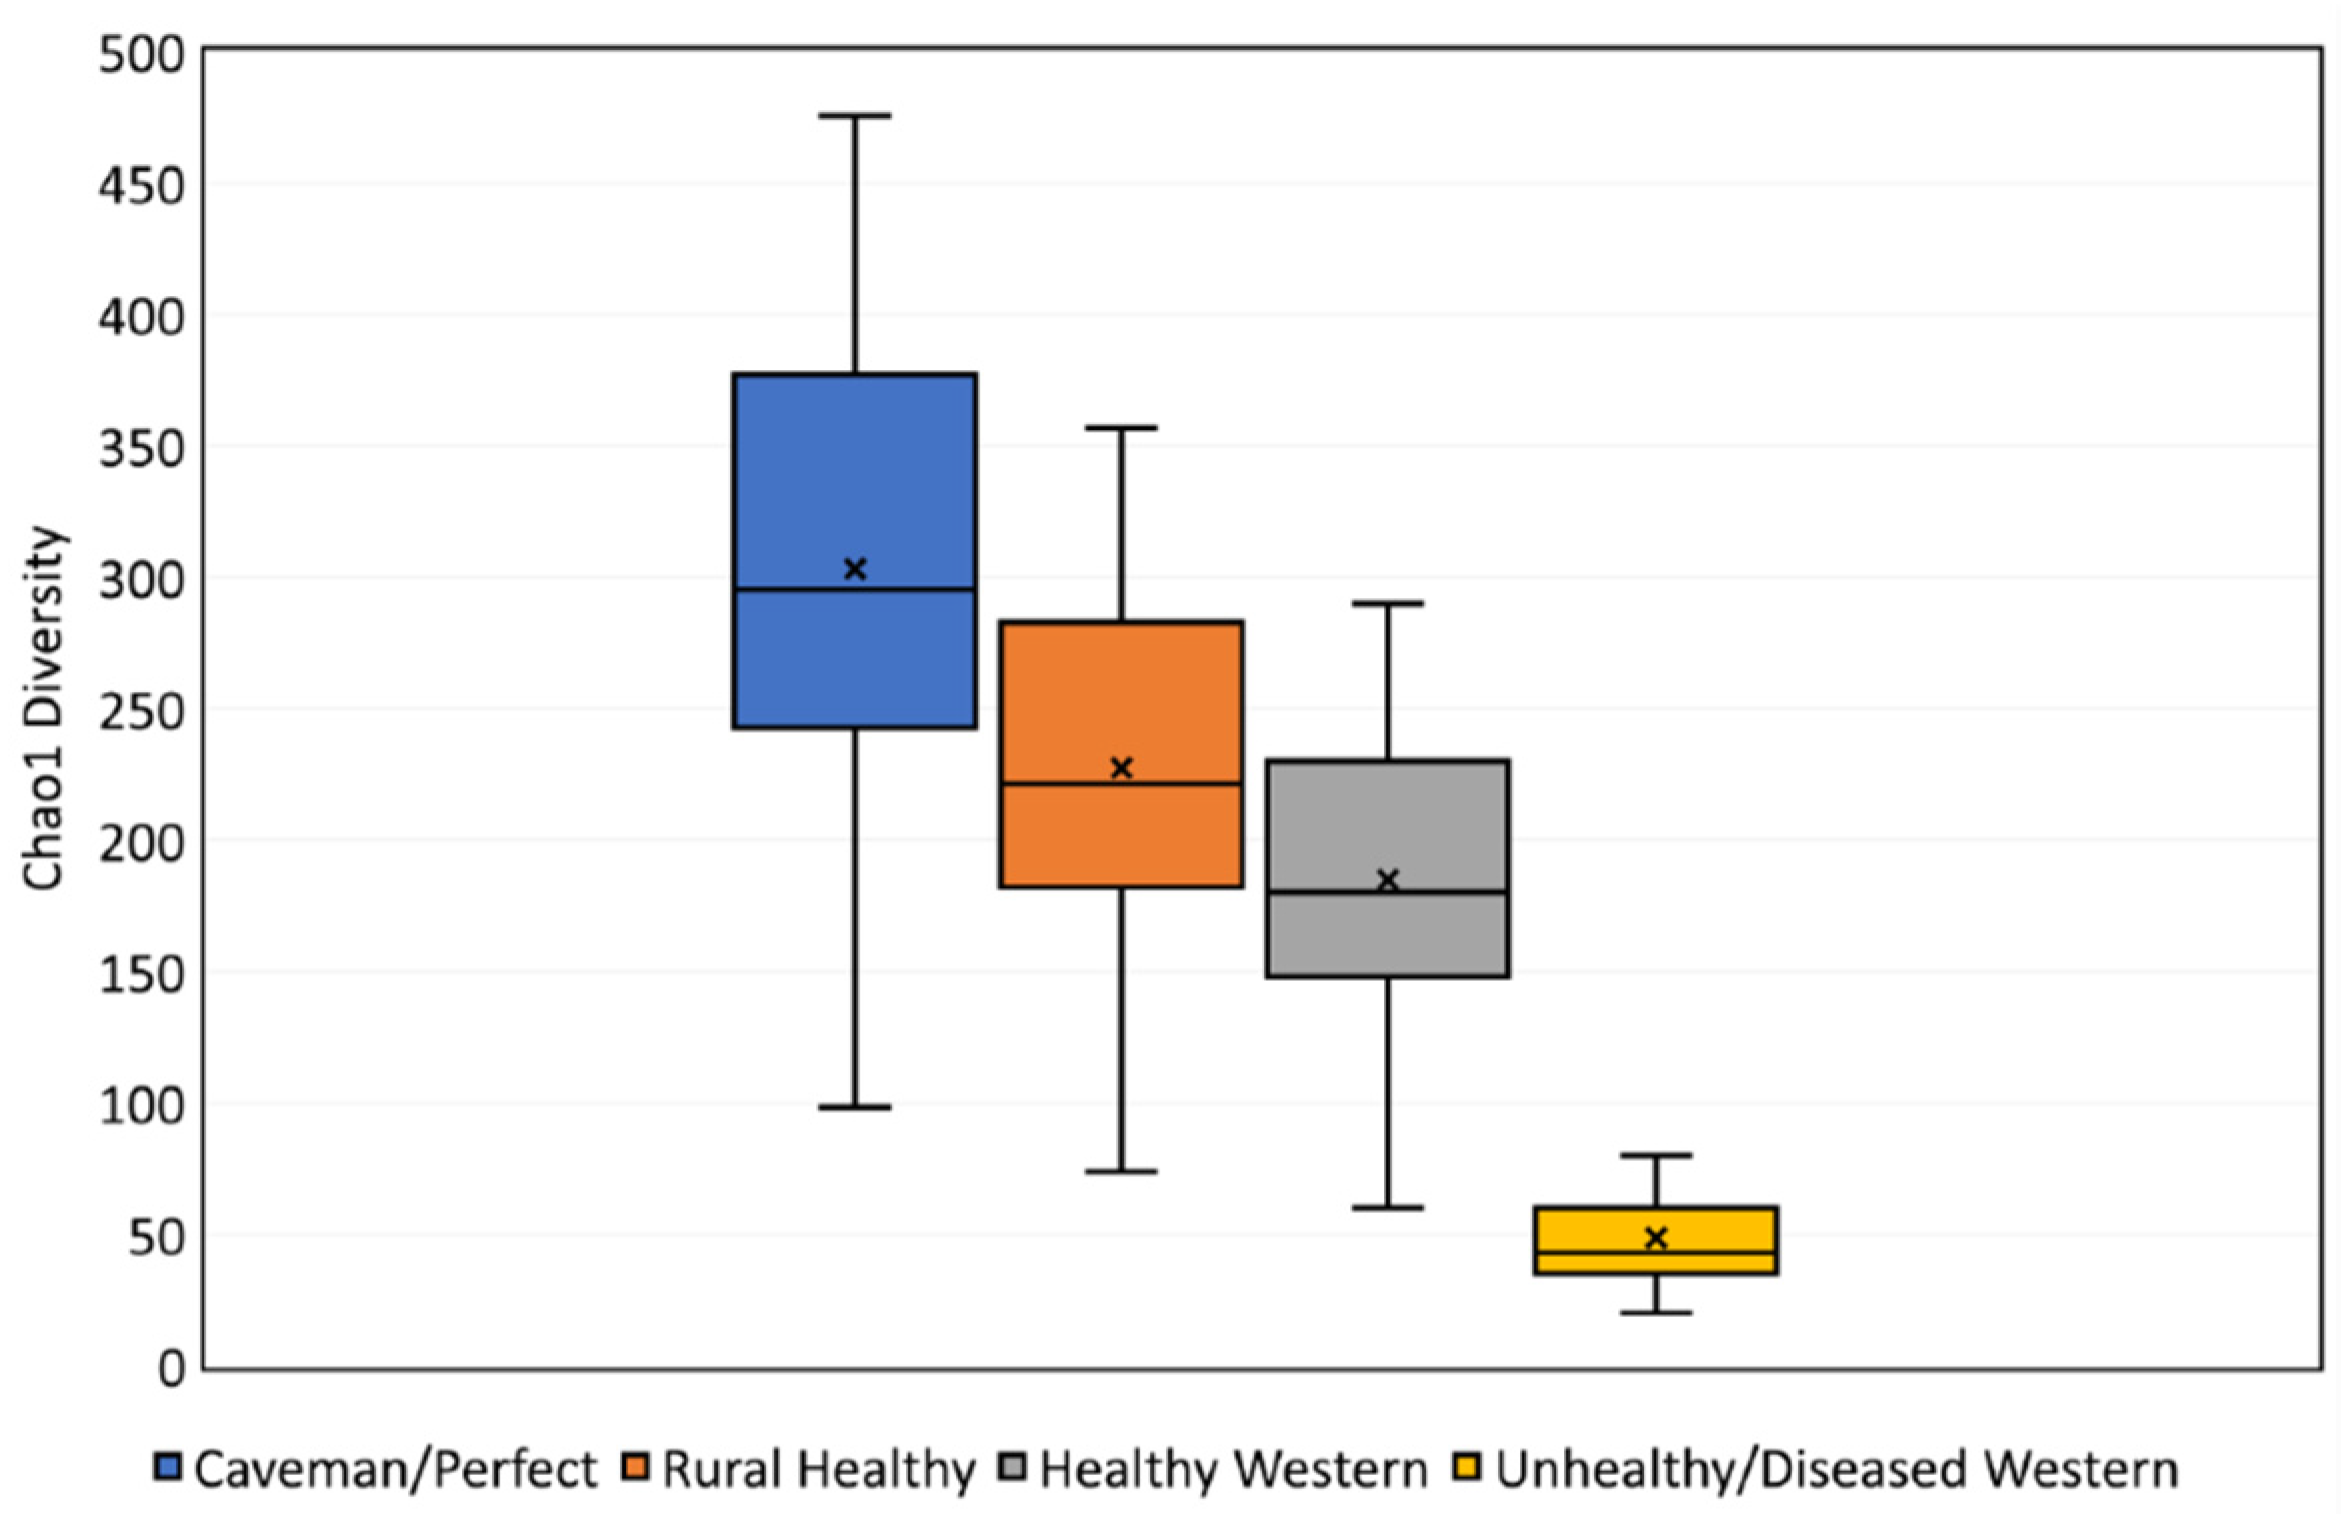
3.1. Benchmark for Healthy Western Skin

Figure 1 shows the benchmark value for skin microbiome diversity of healthy “western” skin using the Chao1 richness estimator, and the value can now be used to update our skin-health measuring mechanism. Using Chao1 and at 6600 sequence reads, the level to which every sample in this study was rarefied to the benchmark value obtained was ~180 with upper and lower quartiles ~208 and ~150, respectively. We note this value changed depending on the rarefaction level and sequence reads. As the amount of sequences per sample increases, so does the richness of an ecosystem, as more species could potentially be discovered in a sample which contains more organisms. However, the rate of this increase slows with increasing sequences, as there is only a finite amount of organism types that can be found within a system. Simple rarefaction curves show this concept, such as the ones displayed in our 2017 work [34].
The alpha diversity of the human participants (n = 50, male = 25 and female = 25) in this study (Figure 1 and Figure 2) is compared to our previous work, which used 32 western human participants from the town of Graz in Austria, all of whom were female, measured at T1 before product use started [79]. This meant they also resembled a normal western person’s skin. We included the comparison to see how the diversity changed when a larger sample size, and an even spread of genders and ages was used.
Results using the Shannon diversity index are shown in Figure 2. As mentioned previously, we are most interested in Chao1 results because they give the best analysis of diversity, and although the Shannon index is inferior, we include it because it tells us how evenly the microbes within systems are spread between the different inhabiting types.
In both alpha diversity comparisons, the studies were similar, with average diversity slightly higher in the previous study. All samples from both studies were processed using identical procedures from sampling and sample processing to sequencing, including re-analysing the previous data with QIIME 2, which was formerly analyzed using QIIME.
Beta diversity analyses show that the microbial community structure is distinctly different on the skin of participants in this study as compared with those in our previous work. This is shown by the very separate groupings in Figure 3a,b. The PCoA plots are used to visualize similarities and differences between microbial communities. A reason for the stark differences could be “batch effect”-there is no specific factor or reason, which could be controlled, for this difference. The studies may not officially be suitable for comparison because their data are obtained from different sequencing runs, however, the discrepancies from run-to-run are not likely to be significantly large, especially as we use the data here for average diversity using a significant number of participants. It could be different if we were looking at the results from a single sample in each run.

3.2. Sex

There were no statistically significant differences in alpha diversity comparing sex (Figure 4a,b), however, the average diversity was slightly higher in males using Shannon diversity, but slightly lower using Chao1. Among the 50 human participants, 25 were male and 25 were female.
We further explored the relationship between the microbiome and sex of participants by displaying PCoA plots, which are also used in Section 3.1, Section 3.3, and Section 3.4, and an RDA plot. No sex-dependent clustering (Figure 4c,d) in beta diversity could be observed, but again the controls were grouped separately. Redundancy analysis (RDA plots) showed significant differences between female and male study subjects (Figure 5). The axes of the RDA plots show a small percentage, indicating that the variance of the data is not substantial.

3.3. Age

We split the alpha and beta diversity results into the following age groups: Group 1 (18–27 years), Group 2 (28–37 years), Group 3 (38–47 years), Group 4 (48–57 years), and Group 5 (58–70 years). There were ten people, five males and five females, in each group, meaning these results are a preliminary evaluation.
In alpha diversity, a weak trend of decreasing alpha diversity with increasing age is seen with Chao1, but the observation is not statistically significant (Figure 6a). The Shannon index of the age groups shows less of this trend (Figure 6b). There are no significant differences in diversity between ages, but the comparative tests performed are not clear. The highest average diversity appears to be in adults aged 28 to 37, in both the Chao1 and Shannon indices, while those aged 48 to 57 display the lowest average in both. However, these need to be investigated with a larger sample size in future work, in order to fully validate these preliminary findings.
In beta diversity (Figure 6c,d), the PCoA plots showed no significant clustering of the age groups. Redundancy analysis (RDA plots) showed no significant differences between the age groups (Figure 7), but Group 5 seemed to be separate from the other groups. The axes of the RDA plots show a small percentage, indicating that the variance of the data is not substantial.

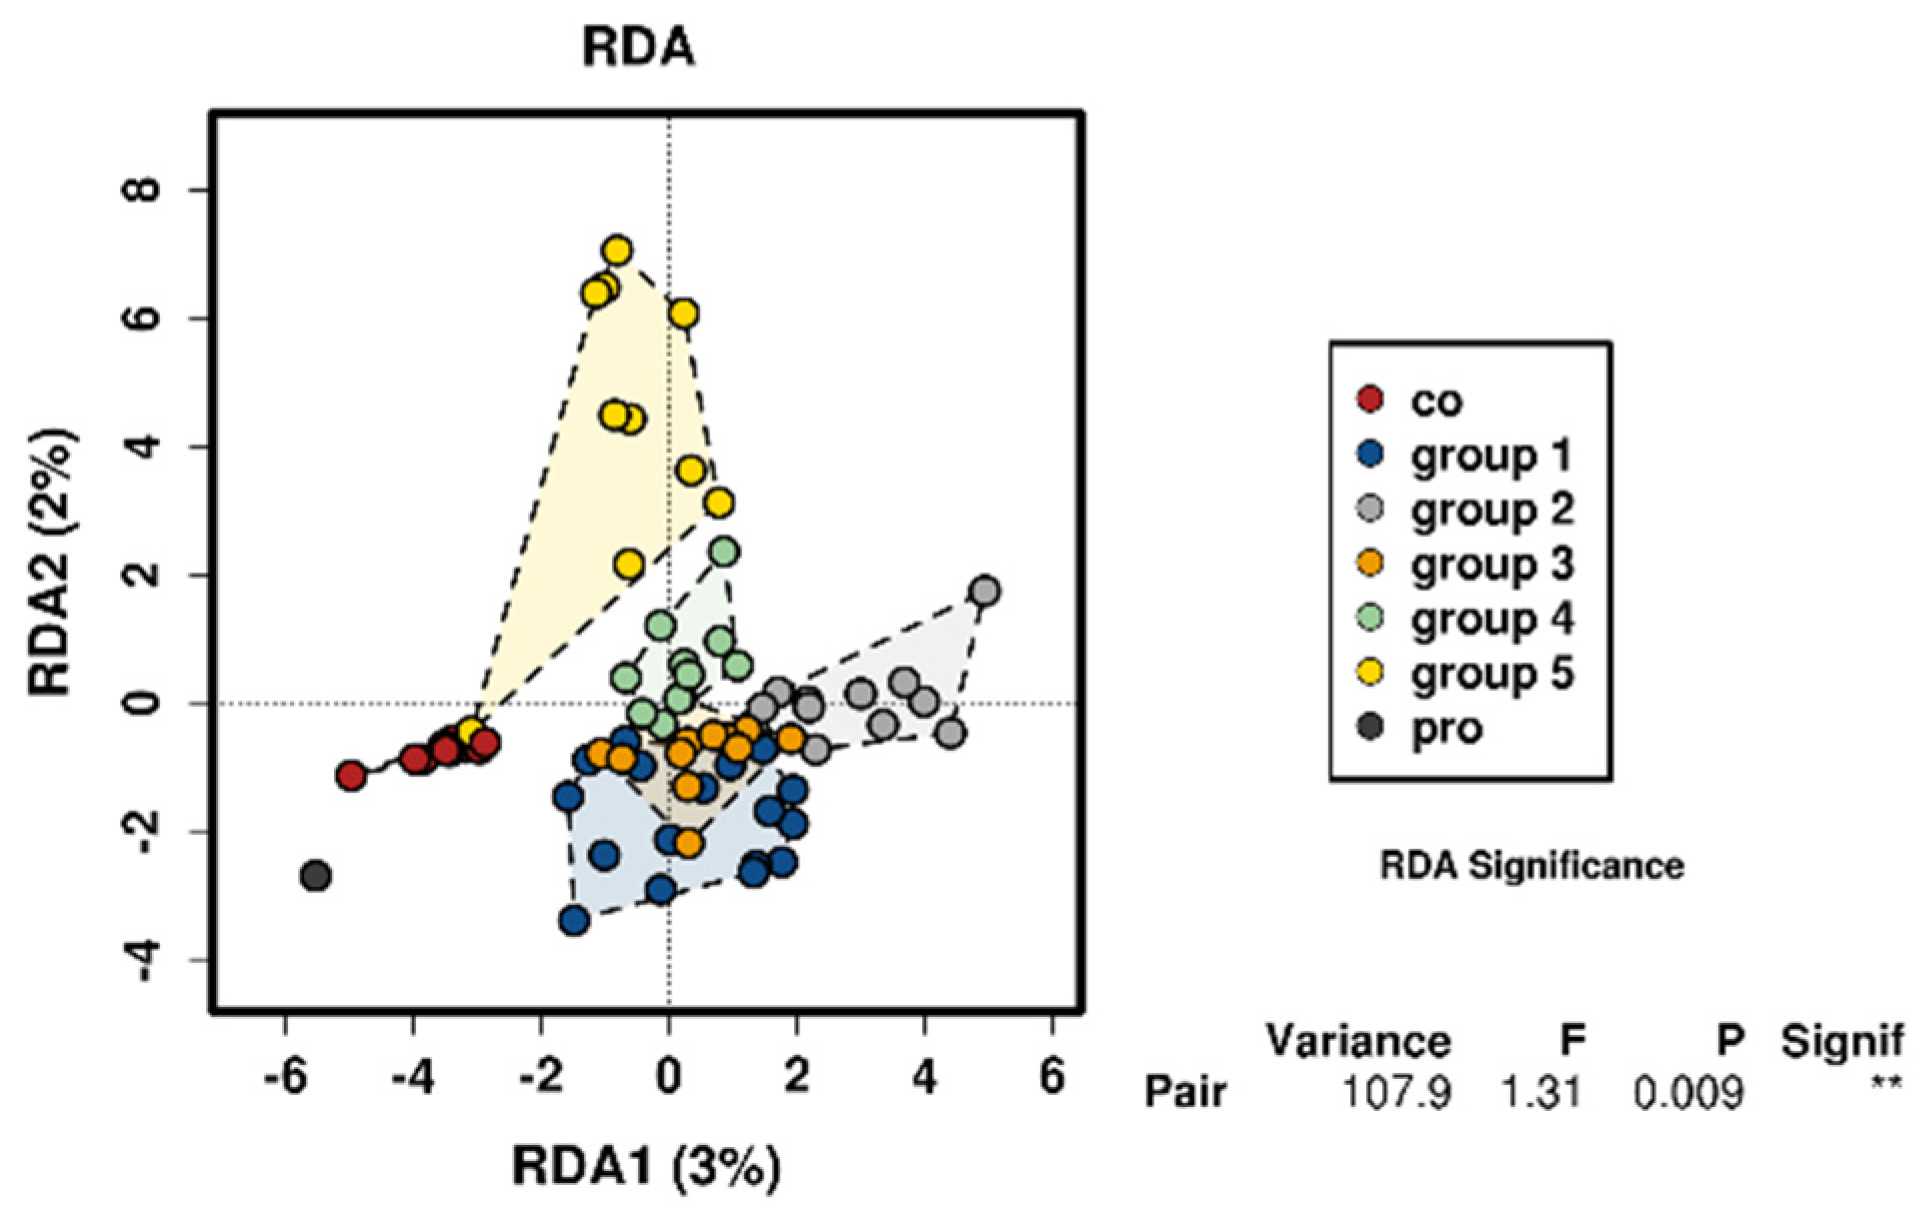
3.4. Control Testing

Analysing differences in microbial communities using the PCoA plots revealed that the samples (taken from the 50 human participants) were grouped differently from the controls (buffer, kit, and PCR controls), which indicated that there was no contamination of the samples, and the sampling and manufacturing process was sterile (Figure A1a,b in Appendix A). Skin microbiome samples, which group near to the control samples in beta diversity plots, carried a low number of reads like the control samples. Rarefaction analysis showed that a sufficient number of sequences were used to represent the diversity of the healthy skin microbial communities (Figure A1 in Appendix A).

4. Discussion

4.1. Why the Benchmark Is Important

Our previous 2017 work collated skin microbiome diversity using the Chao1 index of humans with differing levels of skin health on one graph, to see if there was a trend [34]. This is displayed in Figure 8. We noticed that the unhealthier the skin was, the lower the diversity. For example, “unhealthy western skin” was more decreased in diversity than that found on western humans with “healthy skin”, devoid of any skin problems. “Caveman/perfect skin” was the diversity of tribes people with negligible or zero contact with western civilization who displayed “unprecedented” levels of diversity and an absence of western skin problems such as acne and eczema [34,42]. We proposed biodiversity as a reliable measure of skin health, and it gave us a sliding scale of different levels of skin health, against which we could compare human subjects’ skin microbiome diversity, to see whether they were nearer “healthy” skin at a higher biodiversity, or diseased skin at a lower level. The beauty of this was that it meant we could, for the first time, begin to test what was contributing to the large increase in skin problems in the western world.
The values, in the graph from our 2017 work (Figure 8), used slightly different Chao1 diversity measuring methodology, therefore, the primary objective of this paper was to move the benchmarks over to the new methodology used by the Medical University of Graz. To do this, in this paper, we obtained a new “healthy western skin” benchmark. Using this, and the ratios or multiplication factors from our previous mechanism, we can transfer across the other benchmarks. Figure 9 explains how this would work. For example, our 2017 work showed unhealthy/diseased western skin diversity to be 4.2 times lower than “healthy western skin”, therefore, we would divide our current benchmark found in this study by 4.2 to get a benchmark value for “unhealthy/diseased western skin” using the current methodology. As the benchmark for “healthy western skin” found in this study was ~180 at a read depth of 6600 sequences, the value for “unhealthy/diseased western ski” would be roughly 180/4.2 = 42.9. Table 1 shows the multiplication factors. This method would be done for all the benchmarks displayed in our previous paper, to get the sliding scale of how diversity changes for different states of health on the skin.
For the purposes of this discussion, we created an example set of boxplots transferring “caveman/perfect” and “rural healthy”, as well as “unhealthy/diseased western” benchmarks of diversity from our previous work (Figure 10). This is how we would transfer the data across in future work, along with other benchmarks. The multiplication factors used to obtain these example plots from the new benchmark found in this study are listed in Table 1.
We note that the benchmark for “healthy western skin” can change depending on other factors, including age and sex. It is for this reason we take a preliminary look at these in the following sections, so we can best improve our mechanism in the future.

4.2. The Effect of Sex

This study found no significant differences in alpha diversity between the sexes, but men carried slightly lower average biodiversity using Chao1. This finding was echoed in previous work where a decreased diversity for men was evident on almost all body sites [61]. This difference was statistically significant across far more body sites on humans from rural communities than urban ones, implying environmental factors in the western world could be a cause of the smaller effect of sex on diversity. Further work found women’s backs were higher in diversity using Chao1 than men, but similar to our study, it was not significant [87].
Although the focus was not on community structure, our RDA findings showed a significant difference in bacterial communities between men and women, which backed up a previous study that also found a significant difference in alpha diversity between men and women for one body site, the palm of the hand [62]. However, it used phylogenetic diversity, which may make comparisons difficult. A final study showed that the total number of bacteria on the feet of women was much higher than on men. However, as alpha diversity analysis methods take into account more factors than just the number of bacteria present, this is not fully comparable [88].
The fact that men produce more sebum could influence results, especially on high-sebum areas of the skin. On average, sebaceous areas of the skin are less diverse than dry or moist [61,89,90], which could be due to sebum production increasing skin acidity [60]. Damaged skin promotes resident bacterial flora’s dispersal from the skin and leads to pathogenic bacterial and fungal growth [5,6,21]. This could explain why our results did not show significant differences in diversity between the sexes, because we used the “dry” volar forearm. Differences in facial cosmetics application, far less pronounced on the forearm than the face, could also have diminished the diversity difference. The generally more acidic skin of men [91,92], associated with lower ecosystem diversity [93], along with amount of cosmetic application and hormone production [92,94], wash frequency [62], and perspiration rate could be reasons for differences between the sexes [60,95].

4.3. The Effect of Age

Our results show humans between the ages of 28 and 37 appear to have the highest average alpha diversity in both Chao1 and Shannon, and humans aged 48–57 have the lowest, although the results are not statistically significant. Our study uses smaller and more regular age groupings as compared with previous work, however, the sample size of 10 in each group means our work is preliminary. Future work is needed to give more accurate insight into how diversity changes with age.
Previous work has displayed mixed results, which could be because age-related changes varied across body sites, between subjects, and different diversity evaluating methodologies [61,96]. A study with 495 human subjects observed the highest diversity on humans aged 20–29 but evaluated the diversity differently, using relative abundance of ”important” Corynebacterium OTUs, rendering comparisons obsolete [96]. Two studies found higher alpha diversity in older than younger skin across multiple body sites including the volar forearm. Both used a “young” (23–37 and 21–50 years) and “old” (60–76 and 51–90 years) group of women [63] and adults [97], respectively. Their groupings, however, took in a wider range of ages which could have impacted the results.
In contrast, two studies with similar age range groups were in more agreement with our results. The first found greater diversity on the volar forearm of younger adults aged 25–35 as compared with those aged 50–60 [61]. The second found females aged 25–35 to have higher diversity than those aged 50–63 [98].
We are still unsure why age-related diversity changes occur. Older humans are more susceptible to the onset of inflammatory disorders [99], which fits in with our study where older people tended to have less diverse skin, but it is not known why their microbiomes maybe easier to colonise for opportunistic taxa. With aging, the skin’s ability to produce sebum and retain moisture changes [100], although short term changes in transepidermal water loss (TEWL) and diversity appear not to be linked [101].

4.4. Limitations and Future Work

We note this study took samples from the volar forearm of participants. Previous work has shown that body site strongly influenced skin microbial diversity and community structure, i.e., dry areas such as the volar forearm, the body site found to have the highest diversity, displayed higher diversity than sebaceous (such as forehead and cheeks) and moist (inguinal crease and popliteal fossa) areas [22,24,30,58,61,63,89,90,96,102,103].
Benchmark diversity values for “unhealthy” or “diseased” western skin, and “perfect” or “caveman” skin on uncontacted tribes people [42] will be accurately transferred from our 2017 paper in future work, using the multiplication factors found between their value and that of healthy western skin. We want our mechanism to be able to accurately evaluate the skin health of anyone, taking into account age, sex, body site, and area of residence [61]. Diversity benchmarks for separate skin diseases should also be included, as they have a far greater effect than factors such as age and sex [87].
The inclusion of more detailed bioinformatic analyses focusing on the specific types of microbe present, such as an LEfSe, which was beyond the scope or remit of this study for the reasons explained in the introduction, could be an interesting future addition. This may help move us closer to being able to use microbiome community structure as a biomarker for skin health and disease. However, our current understanding of this area is limited, and therefore it is not included here.
We note that there have been known annotation errors in microbial databases, such as the Silva database used in this study, which have been shown to affect results. However, clustering methods were found to affect diversity more than databases [104]. Despite the Silva database being worse than other databases at determining microbes at the species level due to errors [104], the focus of this study was diversity, primarily using the Chao1 index, which did not rely on the correct identification of microbes but the amount of singletons and doubletons [105]. Therefore, this particular problem applies to microbiome composition studies. A bigger concern from this study’s perspective is distinguishing between true “rare” species and sequencing artifacts. Quality filtering techniques were used in this study for this purpose; they aimed to remove unique sequences that were not “rare” species but errors. This process has a large influence on low abundance OTUs [106]. These methods are not perfect but are being improved.
A larger sample group should be recruited, so that age-related changes in diversity can be investigated independently in men and women. Due to the preliminary nature of these results, in a follow-up study we will conduct an in-depth evaluation of how age affects biodiversity. This will include full correlation analysis using Spearman rho and Pearson’s correlation to determine whether a relationship exists, and the strength of it. In addition, we will explore how different p-value thresholds affect results and use corrections for multiple testing such as the Bonferroni method which aims to mitigate against the effect of false positive results. Previous work has shown that different studies should have different p-value thresholds [107], and that one should not “believe that an association or effect is absent just because it was not statistically significant” [108].

5. Conclusions

In this study, we determined a benchmark value for the microbial diversity, using the Chao1 index, found on healthy western human skin. At a read depth of 6600 sequences, we found average Chao1 diversity to be ~180. This allows us, in future work, to transfer all benchmark levels of diversity from our 2017 paper, and to update our skin health measuring mechanism. This is a step towards helping us to begin to evaluate which environmental factors, such as synthetic chemicals in modern cosmetics, are contributing to the large rise in skin problems in the western world. Men carried a slightly lower average biodiversity than women, and younger adults appeared to have a higher average diversity than older adults, but these results were not statistically significant. A larger sample group should be used in the future to investigate these preliminary findings in more detail, and to determine whether age-related diversification differs between men and women. Moreover, to aid dermatological assessments of susceptibility to infections or disease, and associated treatments, diversity benchmarks split into age, sex, area of residence, body site, and skin diseases should be added to the skin health measuring mechanism.

Supplementary Materials

The data to replicate the results in this study is available online at https://0-www-mdpi-com.brum.beds.ac.uk/2079-9284/7/4/79/s1.

Author Contributions

C.W.-R. and S.W.-R. were the main contributors, conceived the idea for the experiment, planned, organised, helped with analysis of data, and wrote it; conceptualization, C.W.-R. and S.W.-R.; formal analysis, C.W.-R.; writing—original draft preparation, C.W.-R. and S.W.-R.; writing—review and editing, C.W.-R. and S.W.-R.; visualization, C.W.-R. and S.W.-R.; supervision, C.W.-R.; project administration, C.W.-R. and S.W.-R.; funding acquisition, C.W.-R. All authors have read and agreed to the published version of the manuscript.

Funding

This research was funded by using a FemTech grant for “women in science” which was organized and applied for through ACIB (Austrian Centre for Industrial Biotechnology). This was put towards the laboratory work.

Acknowledgments

This work was supported by Pavane Consultants Ltd. I would like to extend a thank-you to the Medical University of Graz, who recruited the participants, performed laboratory work, and analysed data. I would also like to thank my mother, Linda Russell, whose help in organisation of the project, and help with study design and conceptualisation was priceless; and lastly my father, Nick Wallen, whose help with writing and organisation was crucial.

Conflicts of Interest

Christopher Wallen-Russell and Sam Wallen-Russell are employees of research and development company Pavane Consultants Ltd., who commissioned the paper, and directors of JooMo Ltd. Skin health company, JooMo Ltd., holds the exclusive license for the manufacturing, marketing, and sale of Pavane Consultant Ltd.’s products. As the licence holder for the JooMo Ltd. range of skin health products, Pavane Consultants Ltd. are interested in determining how skin health can be measured and which environmental factors have caused the huge increase in skin allergy problems in the past 75 years.

Appendix A

Figure A1. PCoA plots were created for (a) Chao and (b) Bray–Curtis for controls of the study compared with sample data from human participants. It shows that samples, product control, and controls are separate; (c) Rarefaction on RSV level, showing the sequencing potential of all samples based on age groups.
Cosmetics 07 00079 g0a1

References

  1. Hublin, J.J.; Ben-Ncer, A.; Bailey, S.E.; Freidline, S.E.; Neubauer, S.; Skinner, M.M.; Bergmann, I.; Le Cabec, A.; Benazzi, S.; Harvati, K.; et al. New fossils from Jebel Irhoud, Morocco and the pan-African origin of Homo sapiens. Nature 2017, 546, 289–292. [Google Scholar] [CrossRef] [Green Version]
  2. Sender, R.; Fuchs, S.; Milo, R. Revised Estimates for the Number of Human and Bacteria Cells in the Body. PLoS Biol. 2016, 14, e1002533. [Google Scholar] [CrossRef] [Green Version]
  3. Cogen, A.L.; Nizet, V.; Gallo, R.L. Skin microbiota: A source of disease or defence? Br. J. Dermatol. 2009, 158, 442–455. [Google Scholar] [CrossRef] [Green Version]
  4. Blaser, M.J.; Falkow, S. What are the consequences of the disappearing human microbiota? Nat. Rev. Microbiol. 2009, 7, 887–894. [Google Scholar] [CrossRef]
  5. Noble, W.C. Staphylococci on the skin. In The Skin Microflora and Microbial Skin Disease; Noble, W.C., Ed.; Cambridge University Press: London, UK, 2004; pp. 135–152. [Google Scholar]
  6. Holland, K.T.; Bojar, R.A. Cosmetics: What is their influence on the skin microflora? Am. J. Clin. Dermatol. 2002, 3, 445–449. [Google Scholar] [CrossRef] [PubMed]
  7. Grice, E.A.; Kong, H.H.; Renaud, G.; Young, A.C.; Bouffard, G.G.; Blakesley, R.W.; Wolfsberg, T.G.; Turner, M.L.; Segre, J.A.; Program, N.C.S. A diversity profile of the human skin microbiota. Genome Res. 2008, 18, 1043–1050. [Google Scholar] [CrossRef] [Green Version]
  8. Sanford, J.A.; Gallo, R.L. Functions of the skin microbiota in health and disease. Semin. Immunol. 2013, 25, 370–377. [Google Scholar] [CrossRef] [Green Version]
  9. Barnard, E.; Li, H. Shaping of cutaneous function by encounters with commensals. J. Physiol. 2016, 595, 437–450. [Google Scholar] [CrossRef] [Green Version]
  10. Pamer, E.G. Immune responses to commensal and environmental microbes. Nat. Immunol. 2007, 8, 1173–1178. [Google Scholar] [CrossRef]
  11. Grice, E.A.; Snitkin, E.S.; Yockey, L.J.; Bermudez, D.M.; Comparative, N.; NISC Comparative Sequencing Program; Liechty, K.W.; Segre, J.A. Longitudinal shift in diabetic wound microbiota correlates with prolonged skin defense response. Proc. Natl. Acad. Sci. USA 2010, 33107, 14799–14804. [Google Scholar] [CrossRef] [Green Version]
  12. Kong, H.H.; Segre, J.A. Skin microbiome: Looking back to move forward. J. Investig. Dermatol. 2012, 132 Pt 2, 933–939. [Google Scholar] [CrossRef] [Green Version]
  13. Christensen, G.J.M.; Brüggemann, H. Bacterial skin commensals and their role as host guardians. Benef. Microbes 2014, 5, 201–215. [Google Scholar] [CrossRef] [PubMed]
  14. Park, B.; Iwase, T.; Liu, G.Y. Intranasal Application of S. epidermidis Prevents Colonization by Methicillin-Resistant Staphylococcus aureus in Mice. PLoS ONE 2011, 6, e25880. [Google Scholar] [CrossRef] [PubMed] [Green Version]
  15. Rosebury, T. Microorganisms Indigenous to Man; McGraw Hill: New York, NY, USA, 1962. [Google Scholar]
  16. Mackowiak, P.A. The Normal Microbial Flora. N. Engl. J. Med. 1982, 307, 83–93. [Google Scholar] [CrossRef] [Green Version]
  17. Smith, K.; McCoy, K.D.; Macpherson, A.J. Use of axenic animals in studying the adaptation of mammals to their commensal intestinal microbiota. Semin. Immunol. 2007, 19, 59–69. [Google Scholar] [CrossRef]
  18. Gordon, H.A.; Pesti, L. The gnotobiotic animal as a tool in the study of host microbial relationships. Bacteriol. Rev. 1971, 35, 390–429. [Google Scholar] [CrossRef]
  19. Grice, E.A. The intersection of microbiome and host at the skin interface: Genomic- and metagenomic-based insights. Genome Res. 2015, 25, 1514–1520. [Google Scholar] [CrossRef]
  20. Katsuyama, M.; Ichikawa, H.; Ogawa, S.; Ikezawa, Z. A novel method to control the balance of skin microflora: Part 1. Attack on biofilm of Staphylococcus aureus without antibiotics. J. Dermatol. Sci. 2005, 38, 197–205. [Google Scholar]
  21. Lambers, H.; Piessens, S.; Bloem, A.; Pronk, H.; Finkel, P. Natural skin surface pH is on average below 5, which is beneficial for its resident flora. Int. J. Cosmet. Sci. 2006, 28, 359–370. [Google Scholar] [CrossRef]
  22. Oh, J.; Byrd, A.L.; Park, M.; Kong, H.H.; Segre, J.A.; Segre, J.A. Temporal Stability of the Human Skin Microbiome. Cell 2016, 165, 854–866. [Google Scholar] [CrossRef] [Green Version]
  23. Byrd, A.L.; Belkaid, Y.; Segre, J.A. The human skin microbiome. Nat. Rev. Microbiol. 2018, 16, 143–155. [Google Scholar] [CrossRef] [PubMed]
  24. Oh, J.; Byrd, A.L.; Deming, C.; Conlan, S.; Kong, H.H.; Segre, J.A.; NISC Comparative Sequencing Program. Biogeography and individuality shape function in the human skin metagenome. Nature 2014, 514, 59–64. [Google Scholar] [CrossRef] [PubMed] [Green Version]
  25. Ley, R.E.; Lozupone, C.A.; Hamady, M.; Knight, R.; Gordon, J.I. Worlds within worlds: Evolution of the vertebrate gut microbiota. Nat. Rev. Microbiol. 2008, 6, 776–788. [Google Scholar] [CrossRef] [Green Version]
  26. Pei, Z.; Bini, E.J.; Yang, L.; Zhou, M.; Francois, F.; Blaser, M.J. Bacterial biota in the human distal esophagus. Proc. Natl. Acad. Sci. USA 2004, 101, 4250–4255. [Google Scholar] [CrossRef] [Green Version]
  27. Dessinioti, C.; Katsambas, A.D. The role of Propionibacterium acnes in acne pathogenesis: Facts and controversies. Clin. Dermatol. 2010, 28, 2–7. [Google Scholar] [CrossRef]
  28. Gao, Z.; Tseng, C.; Strober, B.E.; Pei, Z.; Blaser, M.J. Substantial Alterations of the Cutaneous Bacterial Biota in Psoriatic Lesions. PLoS ONE 2008, 3, e2719. [Google Scholar] [CrossRef]
  29. Gao, Z.; Tseng, C.; Pei, Z.; Blaser, M.J. Molecular analysis of human forearm superficial skin bacterial biota. Proc. Natl. Acad. Sci. USA 2007, 104, 2927–2932. [Google Scholar] [CrossRef] [Green Version]
  30. Perez, G.I.P.; Gao, Z.; Jourdain, R.; Ramirez, J.; Gany, F.; Clavaud, C.; Demaude, J.; Breton, L.; Blaser, M.J. Body Site Is a More Determinant Factor than Human Population Diversity in the Healthy Skin Microbiome. PLoS ONE 2016, 11, e0151990. [Google Scholar] [CrossRef] [Green Version]
  31. Kong, H.H.; Oh, J.; Deming, C.; Conlan, S.; Grice, E.A.; Beatson, M.A.; Nomicos, E.; Polley, E.C.; Komarow, H.D.; Murray, P.R.; et al. Temporal shifts in the skin microbiome associated with disease flares and treatment in children with atopic dermatitis. Genome Res. 2012, 22, 850–859. [Google Scholar] [CrossRef] [Green Version]
  32. Meron, E. Nonlinear Physics of Ecosystems, 1st ed.; CRC Press: Boca Raton, FL, USA, 2015. [Google Scholar]
  33. Goerner, S.J. Chaos and the Evolving Ecological Universe; Gordon and Breach Publishers: London, UK, 1994. [Google Scholar]
  34. Wallen-Russell, C.; Wallen-Russell, S. Meta Analysis of Skin Microbiome: New Link between Skin Microbiota Diversity and Skin Health with Proposal to Use This as a Future Mechanism to Determine Whether Cosmetic Products Damage the Skin. Cosmetics 2017, 4, 14. [Google Scholar] [CrossRef] [Green Version]
  35. Finlay, B.B.; Arrieta, M.-C. Let Them Eat Dirt. In Saving Your Child from an Oversanitized World; Windmill Books: London, UK, 2016. [Google Scholar]
  36. Lefcheck, J.S.; Byrnes, J.E.K.; Isbell, F.; Gamfeldt, L.; Griffin, J.N.; Eisenhauer, N.; Hensel, M.J.S.; Hector, A.; Cardinale, B.J.; Duffy, J.E. Biodiversity enhances ecosystem multifunctionality across trophic levels and habitats. Nat. Commun. 2015, 6, 6936. [Google Scholar] [CrossRef] [PubMed]
  37. Balvanera, P.; Pfisterer, A.B.; Buchmann, N.; He, J.-S.; Nakashizuka, T.; Raffaelli, D.; Schmid, B. Quantifying the evidence for biodiversity effects on ecosystem functioning and services. Ecol. Lett. 2006, 9, 1146–1156. [Google Scholar] [CrossRef] [PubMed] [Green Version]
  38. Gamfeldt, L.; Hillebrand, H.; Jonsson, P.R. Multiple functions increase the importance of biodiversity for overall ecosystem functioning. Ecology 2008, 89, 1223–1231. [Google Scholar] [CrossRef] [PubMed]
  39. Thrupp, L.A. The importance of biodiversity in agroecosystems. J. Crop. Improv. 2004, 12, 315–337. [Google Scholar] [CrossRef]
  40. Hooper, D.U.; Chapin, F.S.; Ewel, J.J.; Hector, A.; Inchausti, P.; Lavorel, S.; Lawton, J.H.; Lodge, D.M.; Loreau, M.; Naeem, S.; et al. Effects of biodiversity on ecosystem functioning: A consensus of current knowledge. Ecol. Monogr. 2005, 75, 3–35. [Google Scholar] [CrossRef]
  41. Srinivas, G.; Möller, S.; Wang, J.; Künzel, S.; Zillikens, D.; Baines, J.F.; Ibrahim, S.M. Genome-wide mapping of gene–microbiota interactions in susceptibility to autoimmune skin blistering. Nat. Commun. 2013, 4, 2462. [Google Scholar] [CrossRef] [Green Version]
  42. Clemente, J.C.; Pehrsson, E.C.; Blaser, M.J.; Sandhu, K.; Gao, Z.; Wang, B.; Magris, M.; Hidalgo, G.; Contreras, M.; Noya-Alarcón, Ó.; et al. The microbiome of uncontacted Amerindians. Sci. Adv. 2015, 1, e1500183. [Google Scholar] [CrossRef] [Green Version]
  43. Blaser, M.J.; Dominguez-Bello, M.G.; Contreras, M.; Magris, M.; Hidalgo, G.; Estrada, I.; Gao, Z.; Clemente, J.C.; Costello, E.K.; Knight, R. Distinct cutaneous bacterial assemblages in a sampling of South American Amerindians and US residents. ISME J. 2013, 7, 85–95. [Google Scholar] [CrossRef]
  44. Salgado, V.R.; de Queiroz, A.T.L.; Sanabani, S.S.; de Oliveira, C.I.; Carvalho, E.M.; Costa, J.M.L.; Barral-Netto, M.; Barral, A. The microbiological signature of human cutaneous leishmaniasis lesions exhibits restricted bacterial diversity compared to healthy skin. Memórias Inst. Oswaldo Cruz 2016, 111, 241–251. [Google Scholar] [CrossRef] [Green Version]
  45. Hoffmann, A.R.; Patterson, A.P.; Diesel, A.; Lawhon, S.D.; Ly, H.J.; Stephenson, C.E.; Mansell, J.; Steiner, J.M.; Dowd, S.E.; Olivry, T.; et al. The skin microbiome in healthy and allergic dogs. PLoS ONE 2014, 9, e83197. [Google Scholar]
  46. Gardiner, M.; Vicaretti, M.; Sparks, J.; Bansal, S.; Bush, S.; Liu, M.; Darling, A.E.; Harry, E.J.; Burke, C. A longitudinal study of the diabetic skin and wound microbiome. PeerJ 2017, 5, e3543. [Google Scholar] [CrossRef] [PubMed]
  47. Grice, E.A.; Segre, J.A. The skin microbiome. Nat. Rev. Microbiol. 2011, 9, 244–253. [Google Scholar] [CrossRef] [PubMed]
  48. Baviera, G.; Leoni, M.C.; Capra, L.; Cipriani, F.; Longo, G.; Maiello, N.; Ricci, G.; Galli, E. Microbiota in healthy skin and in atopic eczema. BioMed Res. Int. 2014, 2014, 436921. [Google Scholar] [CrossRef]
  49. Manasson, J.; Reddy, S.M.; Neimann, A.L.; Segal, L.N.; Scher, J.U. Cutaneous Microbiota Features Distinguish Psoriasis from Psoriatic Arthritis. Arthritis Rheumatol. 2016, 68, 1708. [Google Scholar]
  50. Nakatsuji, T.; Chen, T.H.; Butcher, A.M.; Trzoss, L.L.; Nam, S.-J.; Shirakawa, K.T.; Zhou, W.; Oh, J.; Otto, M.; Fenical, W.; et al. A commensal strain of Staphylococcus epidermidis protects against skin neoplasia. Sci. Adv. 2018, 4, eaao4502. [Google Scholar] [CrossRef] [Green Version]
  51. Velegraki, A.; Cafarchia, C.; Gaitanis, G.; Iatta, R.; Boekhout, T. Malassezia Infections in Humans and Animals: Pathophysiology, Detection, and Treatment. PLoS Pathog. 2015, 11, e1004523. [Google Scholar] [CrossRef] [Green Version]
  52. Prescott, S.L.; Larcombe, D.-L.; Logan, A.C.; West, C.; Burks, W.; Caraballo, L.; Levin, M.; Van Etten, E.; Horwitz, P.; Kozyrskyj, A.; et al. The skin microbiome: Impact of modern environments on skin ecology, barrier integrity, and systemic immune programming. World Allergy Organ. J. 2017, 10, 29. [Google Scholar] [CrossRef]
  53. Huang, Y.J.; Marsland, B.J.; Bunyavanich, S.; O’Mahony, L.; Leung, D.Y.M.; Muraro, A.; Fleisher, T.A. The microbiome in allergic disease: Current understanding and future opportunities-2017 PRACTALL document of the American Academy of Allergy, Asthma & Immunology and the European Academy of Allergy and Clinical Immunology. J. Allergy Clin. Immunol. 2017, 139, 1099–1110. [Google Scholar]
  54. Sherwani, M.A.; Tufail, S.; Muzaffar, A.F.; Yusuf, N. The skin microbiome and immune system: Potential target for chemoprevention? Photodermatol. Photoimmunol. Photomed. 2018, 34, 25–34. [Google Scholar] [CrossRef] [Green Version]
  55. Misic, A.M.; Gardner, S.E.; Grice, E.A. The Wound Microbiome: Modern Approaches to Examining the Role of Microorganisms in Impaired Chronic Wound Healing. Adv. Wound Care 2014, 3, 502–510. [Google Scholar] [CrossRef] [Green Version]
  56. Lu, L.J.; Liu, J. Human Microbiota and Ophthalmic Disease. Yale J. Biol. Med. 2016, 89, 325–330. [Google Scholar]
  57. Zaidi, A.K.; Spaunhurst, K.; Sprockett, D.; Thomason, Y.; Mann, M.W.; Fu, P.; Ammons, C.; Gerstenblith, M.; Tuttle, M.S.; Popkin, D.L. Characterization of the facial microbiome in twins discordant for rosacea. Exp. Dermatol. 2018, 27, 295–298. [Google Scholar] [CrossRef] [PubMed]
  58. Findley, K.; Oh, J.; Yang, J.; Conlan, S.; Deming, C.; Meyer, J.A.; Schoenfeld, D.; Nomicos, E.; Park, M.; NIH Intramural Sequencing Center Comparative Sequencing Program; et al. Topographic diversity of fungal and bacterial communities in human skin. Nature 2013, 498, 367–370. [Google Scholar] [CrossRef] [PubMed]
  59. SanMiguel, A.; Grice, E.A. Interactions between host factors and the skin microbiome. Cell. Mol. Life Sci. 2015, 72, 1499–1515. [Google Scholar] [CrossRef] [PubMed] [Green Version]
  60. Giacomoni, P.U.; Mammone, T.; Teri, M. Gender-linked differences in human skin. J. Dermatol. Sci. 2009, 55, 144–149. [Google Scholar] [CrossRef] [PubMed]
  61. Ying, S.; Zeng, D.-N.; Chi, L.; Tan, Y.; Galzote, C.; Cardona, C.; Lax, S.; Gilbert, J.; Quan, Z.-X. The Influence of Age and Gender on Skin-Associated Microbial Communities in Urban and Rural Human Populations. PLoS ONE 2015, 10, e0141842. [Google Scholar] [CrossRef] [PubMed]
  62. Fierer, N.; Hamady, M.; Lauber, C.L.; Knight, R. The influence of sex, handedness, and washing on the diversity of hand surface bacteria. Proc. Natl. Acad. Sci. USA 2008, 105, 17994–17999. [Google Scholar] [CrossRef] [Green Version]
  63. Shibagaki, N.; Suda, W.; Clavaud, C.; Bastien, P.; Takayasu, L.; Iioka, E.; Kurokawa, R.; Yamashita, N.; Hattori, Y.; Shindo, C.; et al. Aging-related changes in the diversity of women’s skin microbiomes associated with oral bacteria. Sci. Rep. 2017, 7, 10567. [Google Scholar] [CrossRef]
  64. Taylor, B.; Wadsworth, M.; Wadsworth, J.; Peckham, C. Changes in the reported prevalence of childhood eczema since the 1939-45 war. Lancet 1984, 324, 1255–1257. [Google Scholar] [CrossRef]
  65. Simpson, C.R.; Newton, J.; Hippisley-Cox, J.; Sheikh, A. Trends in the epidemiology and prescribing of medication for eczema in England. J. R. Soc. Med. 2009, 102, 108–117. [Google Scholar] [CrossRef] [Green Version]
  66. Burd, R.M. Psoriasis: A general overview. Br. J. Hosp. Med. 2006, 67, 259–262. [Google Scholar] [CrossRef] [PubMed]
  67. Prescott, S.L.; Tang, M.L.K. The Australasian Society of Clinical Immunology and Allergy position statement: Summary of allergy prevention in children. Med. J. Aust. 2005, 182, 464–467. [Google Scholar] [CrossRef] [PubMed]
  68. Asher, M.I.; Montefort, S.; Björkstén, B.; Lai, C.K.; Strachan, D.P.; Weiland, S.K.; Williams, H. Worldwide time trends in the prevalence of symptoms of asthma, allergic rhinoconjunctivitis, and eczema in childhood: ISAAC Phases One and Three repeat multicountry cross-sectional surveys. Lancet 2006, 368, 733–743. [Google Scholar] [CrossRef]
  69. Shaw, T.E.; Currie, G.P.; Koudelka, C.W.; Simpson, E.L. Eczema Prevalence in the United States: Data from the 2003 National Survey of Children’s Health. J. Investig. Dermatol. 2011, 131, 67–73. [Google Scholar] [CrossRef] [PubMed] [Green Version]
  70. NIH HMP Working Group TNHW; Peterson, J.; Garges, S.; Giovanni, M.; McInnes, P.; Wang, L.; Schloss, J.A.; Bonazzi, V.; McEwen, J.E.; Wetterstrand, K.A.; et al. The NIH Human Microbiome Project. Genome Res. 2009, 19, 2317–2323. [Google Scholar]
  71. Grabchak, M.; Marcon, E.; Lang, G.; Zhang, Z. The generalized Simpson’s entropy is a measure of biodiversity. PLoS ONE 2017, 12, e0173305. [Google Scholar] [CrossRef]
  72. Mouillot, D.; Bellwood, D.R.; Baraloto, C.; Chave, J.; Galzin, R.; Harmelin-Vivien, M.; Kulbicki, M.; Lavergne, S.; Lavorel, S.; Mouquet, N.; et al. Rare Species Support Vulnerable Functions in High-Diversity Ecosystems. PLoS Biol. 2013, 11, e1001569. [Google Scholar] [CrossRef] [Green Version]
  73. Leitão, R.P.; Zuanon, J.; Villéger, S.; Williams, S.E.; Baraloto, C.; Fortune, C.; Mendonça, F.P.; Mouillot, D. Rare species contribute disproportionately to the functional structure of species assemblages. Proc. R. Soc. B Biol. Sci. 2016, 283, 20160084. [Google Scholar] [CrossRef]
  74. Caporaso, J.G.; Lauber, C.L.; Walters, W.A.; Berg-Lyons, D.; Lozupone, C.A.; Turnbaugh, P.J.; Fierer, N.; Knight, R. Global patterns of 16S rRNA diversity at a depth of millions of sequences per sample. Proc. Natl. Acad. Sci. USA 2011, 108 (Suppl. 1), 4516–4522. [Google Scholar] [CrossRef] [Green Version]
  75. Zakrzewski, M.; Proietti, C.; Ellis, J.J.; Hasan, S.; Brion, M.J.; Berger, B.; Krause, L. Calypso: A user-friendly web-server for mining and visualizing microbiome-environment interactions. Bioinformatics 2017, 33, 782–783. [Google Scholar] [CrossRef] [Green Version]
  76. Bouslimani, A.; Porto, C.; Rath, C.M.; Wang, M.; Guo, Y.; Gonzalez, A.; Berg-Lyon, D.; Ackermann, G.; Christensen, G.J.M.; Nakatsuji, T.; et al. Molecular cartography of the human skin surface in 3D. Proc. Natl. Acad. Sci. USA 2015, 112, E2120–E2129. [Google Scholar] [CrossRef] [PubMed] [Green Version]
  77. Chao, A. Nonparametric Estimation of the Number of Classes in a Population Nonparametric Estimation of the Number of Classes in a Population. Scand. J. Stat. 1984, 11, 265–270. [Google Scholar]
  78. Colwell, R.K.; Coddington, J.A. Estimating terrestrial biodiversity through extrapolation. Philos. Trans. R. Soc. B Biol. Sci. 1994, 345, 101–118. [Google Scholar]
  79. Wallen-Russell, C. The Role of Every-Day Cosmetics in Altering the Skin Microbiome: A Study Using Biodiversity. Cosmetics 2018, 6, 2. [Google Scholar] [CrossRef] [Green Version]
  80. Kuczynski, J.; Liu, Z.; Lozupone, C.; McDonald, D.; Fierer, N.; Knight, R. Microbial community resemblance methods differ in their ability to detect biologically relevant patterns. Nat. Methods 2010, 7, 813–819. [Google Scholar] [CrossRef]
  81. Van den Wollenberg, A.L. Redundancy analysis an alternative for canonical correlation analysis. Psychometrika 1977, 42, 207–219. [Google Scholar] [CrossRef]
  82. Rao, C.R. The Use and Interpretation of Principal Component Analysis in Applied Research. Sankhyā Indian J. Stat. Ser. A 1964, 26, 329–358. [Google Scholar]
  83. Paliy, O.; Shankar, V. Application of multivariate statistical techniques in microbial ecology. Mol. Ecol. 2016, 25, 1032–1057. [Google Scholar] [CrossRef] [Green Version]
  84. Ramette, A. Multivariate analyses in microbial ecology. FEMS Microbiol. Ecol. 2007, 62, 142–160. [Google Scholar] [CrossRef] [Green Version]
  85. Concato, J.; Hartigan, J.A. P values: From suggestion to superstition. J. Investig. Med. 2016, 64, 1166–1171. [Google Scholar] [CrossRef] [Green Version]
  86. Johnson, V.E. Revised standards for statistical evidence. Proc. Natl. Acad. Sci. USA 2013, 110, 19313–19317. [Google Scholar] [CrossRef] [PubMed] [Green Version]
  87. Stehlikova, Z.; Kostovcik, M.; Kostovcikova, K.; Kverka, M.; Juzlova, K.; Rob, F.; Hercogova, J.; Bohac, P.; Pinto, Y.; Uzan, A.; et al. Dysbiosis of Skin Microbiota in Psoriatic Patients: Co-occurrence of Fungal and Bacterial Communities. Front. Microbiol. 2019, 10. [Google Scholar] [CrossRef]
  88. Steglińska, A.; Jachowicz, A.; Szulc, J.; Adamiak, J.; Otlewska, A.; Pielech-Przybylska, K.; Gutarowska, B. Factors Influencing Microbiological Biodiversity of Human Foot Skin. Int. J. Environ. Res. Public Health 2019, 16, 3503. [Google Scholar] [CrossRef] [PubMed] [Green Version]
  89. Grice, E.A.; Kong, H.H.; Conlan, S.; Deming, C.B.; Davis, J.; Young, A.C.; Bouffard, G.G.; Blakesley, R.W.; Murray, P.R.; Green, E.D.; et al. Topographical and temporal diversity of the human skin microbiome. Science 2009, 324, 1190–1192. [Google Scholar] [CrossRef] [PubMed] [Green Version]
  90. Costello, E.K.; Lauber, C.L.; Hamady, M.; Fierer, N.; Gordon, J.I.; Knight, R. Bacterial Community Variation in Human Body Habitats Across Space and Time. Science 2009, 326, 1694–1697. [Google Scholar] [CrossRef] [PubMed] [Green Version]
  91. Kim, M.K.; Choi, S.Y.; Byun, H.J.; Huh, C.H.; Park, K.C.; Patel, R.A.; Shinn, A.H.; Youn, S.W. Evaluation of gender difference in skin type and pH. J. Dermatol. Sci. 2006, 41, 153–156. [Google Scholar] [CrossRef] [PubMed]
  92. Dao, H.; Kazin, R.A. Gender differences in skin: A review of the literature. Gend. Med. 2007, 4, 308–328. [Google Scholar] [CrossRef]
  93. Fierer, N.; Jackson, R.B. The diversity and biogeography of soil bacterial communities. Proc. Natl. Acad. Sci. USA 2006, 103, 626–631. [Google Scholar] [CrossRef] [Green Version]
  94. Roth, R.R.; James, W.D. Microbial Ecology of the Skin. Annu. Rev. Microbiol. 1988, 42, 441–464. [Google Scholar] [CrossRef]
  95. Marples, R.R. Sex, constancy, and skin bacteria. Arch. Dermatol. Res. 1982, 272, 317–320. [Google Scholar] [CrossRef]
  96. Dimitriu, P.A.; Iker, B.; Malik, K.; Leung, H.; Mohn, W.W.; Hillebrand, G.G. New insights into the intrinsic and extrinsic factors that shape the human skin microbiome. MBio 2019, 10, e00839-19. [Google Scholar] [CrossRef] [PubMed] [Green Version]
  97. Leung, M.H.Y.; Wilkins, D.; Lee, P.K.H. Insights into the pan-microbiome: Skin microbial communities of Chinese individuals differ from other racial groups. Sci. Rep. 2015, 5, srep11845. [Google Scholar] [CrossRef] [PubMed]
  98. Kim, H.J.; Kim, J.J.; Myeong, N.R.; Kim, T.; Kim, D.A.; An, S.; Kim, H.; Park, T.; Jang, S.I.; Yeon, J.H.; et al. Segregation of age-related skin microbiome characteristics by functionality. Sci. Rep. 2019, 9, 1–11. [Google Scholar] [CrossRef] [PubMed] [Green Version]
  99. Kim, H.O.; Kim, H.S.; Youn, J.C.; Shin, E.C.; Park, S. Serum cytokine profiles in healthy young and elderly population assessed using multiplexed bead-based immunoassays. J. Transl. Med. 2011, 9, 113. [Google Scholar] [CrossRef] [Green Version]
  100. Luebberding, S.; Krueger, N.; Kerscher, M. Skin physiology in men and women: In vivo evaluation of 300 people including TEWL, SC hydration, sebum content and skin surface pH. Int. J. Cosmet. Sci. 2013, 35, 477–483. [Google Scholar] [CrossRef] [PubMed]
  101. Wallen-Russell, C. Is There a Relationship between Transepidermal Water Loss and Microbial Biodiversity on the Skin? Cosmetics 2019, 6, 18. [Google Scholar] [CrossRef] [Green Version]
  102. Caporaso, J.G.; Lauber, C.L.; Costello, E.K.; Berg-Lyons, D.; Gonzalez, A.; Stombaugh, J.; Knights, D.; Gajer, P.; Ravel, J.; Fierer, N.; et al. Moving pictures of the human microbiome. Genome Biol. 2011, 12, R50. [Google Scholar] [CrossRef] [Green Version]
  103. Huttenhower, C.; Gevers, D.; Knight, R.; Abubucker, S.; Badger, J.H.; Chinwalla, A.T. Structure, function and diversity of the healthy human microbiome. Nature 2012, 486, 207–214. [Google Scholar]
  104. Park, S.-C.; Won, S. Evaluation of 16S rRNA Databases for Taxonomic Assignments Using a Mock Community. Genom. Inform. 2018, 16, e24. [Google Scholar] [CrossRef] [Green Version]
  105. Kim, B.R.; Shin, J.; Guevarra, R.B.; Lee, J.H.; Kim, D.W.; Seol, K.H.; Lee, J.-H.; Kim, H.B.; Isaacson, R.E. Deciphering diversity indices for a better understanding of microbial communities. J. Microbiol. Biotechnol. 2017, 27, 2089–2093. [Google Scholar] [CrossRef] [Green Version]
  106. Zhan, A.; Xiong, W.; He, S.; MacIsaac, H.J. Influence of Artifact Removal on Rare Species Recovery in Natural Complex Communities Using High-Throughput Sequencing. PLoS ONE 2014, 9, e96928. [Google Scholar] [CrossRef] [PubMed] [Green Version]
  107. Betensky, R.A. The p-Value Requires Context, Not a Threshold. Am. Stat. 2019, 73 (Suppl. 1), 115–117. [Google Scholar] [CrossRef] [Green Version]
  108. Di Leo, G.; Sardanelli, F. Statistical significance: P value, 0.05 threshold, and applications to radiomics—reasons for a conservative approach. Eur. Radiol. Exp. 2020, 4, 18. [Google Scholar] [CrossRef] [PubMed] [Green Version]
Figure 1. The mean diversity benchmark value for “healthy western skin” as found in this study is ~180. Alpha diversity boxplots using Chao1 showing the new benchmark of diversity found in this study (red) and comparing it with the results from our previous work (blue). There are no significant changes in alpha diversity between the studies. The black lines indicate average diversity. Samples were rarefied to 6600, so plots were visually comparable to others in this study.
Cosmetics 07 00079 g001
Figure 2. Alpha diversity boxplots using the Shannon diversity index showing the new benchmark of diversity found in this study (red) and comparing it with the results from our previous work (blue). There are no significant changes in alpha diversity between the studies. The black lines indicate average diversity. Samples were rarefied to 6600 sequence reads.
Cosmetics 07 00079 g002
Figure 3. Beta diversity principal coordinates analysis (PCoA) plots were created for (a) Chao and (b) Bray–Curtis comparing the current study (red) with our previous study (blue). Samples were rarefied to 6600 sequence reads.
Cosmetics 07 00079 g003
Figure 4. Alpha and beta diversity comparing female (red) and male (blue) participants. Alpha diversity boxplots were created for (a) Chao1 and (b) Shannon indices of female and male participants. There are no significant changes in Alpha diversity between the sexes. The black lines indicate average diversity. Samples were rarefied to 6600 reads, so plots were comparable with others in this study. PCoA plots were created for (c) Chao and (d) Bray–Curtis of the female and male participants. There is no significant grouping between the sexes, but the controls and the product control (“no”–grey) are grouped separately.
Cosmetics 07 00079 g004
Figure 5. Redundancy analysis (RDA) plot of female and male participants. “No” (grey) indicates the controls. The figure shows significant differences between the sexes. Female, male, and controls are clustering separately. The overlapping of controls with a female sample indicates a low number of reads in the female sample.
Cosmetics 07 00079 g005
Figure 6. Alpha and beta diversity of the 50 human participants split into 10 per group, 5 males and 5 females. Alpha diversity boxplots were created for (a) Chao1 and (b) Shannon indices (Group 1, 18–27 years; Group 2, 28–37 years; Group 3, 38–47 years; Group 4, 48–57 years; and Group 5, 58–70 years) where no significant differences were observed. Samples were rarefied to 6600 reads, so plots were comparable with others in this study. The black lines indicate average diversity. Beta diversity PCoA plots were created for (c) Chao1 and (d) Bray–Curtis of the different age groups, as explained above. There is no significant grouping between the age groups, but the controls (“co”, red) and the product control (“pro”, black) are grouped separately.
Cosmetics 07 00079 g006
Figure 7. RDA plot of different age groups (Group 1,18–27 years; Group 2, 28–37 years; Group 3, 38–47 years; Group 4, 48–57 years; and Group 5, 58–70 years). “Co” (red) are the controls and “pro” (black) the product control. The figure shows that age Groups 1–4 are clustering, whereas Group 5 is separate. The controls are clustered together, and the product control is different from the other samples. The overlapping of controls with Group 5 samples indicates samples with a low number of reads.
Cosmetics 07 00079 g007
Figure 8. Graph showing the combined benchmarks taken from our previous work [34]. This graph formed the basis for the skin health measuring mechanism, with benchmark values of diversity for a range of different states of health on the skin. For an explanation of each please see our previous work.
Cosmetics 07 00079 g008
Figure 9. Graph showing how to obtain a multiplication factor between ”healthy” and ”unhealthy” western skin diversity, to be used in transferring the remaining benchmarks from our 2017 work to the new skin health measuring mechanism.
Cosmetics 07 00079 g009
Figure 10. Boxplots showing the transferred Chao1 diversity benchmarks for “caveman/perfect skin” (blue), “rural healthy” (orange), and “unhealthy/diseased western” (yellow). The “healthy western skin” (grey) is taken directly from the data found in this study in Section 3.1, and the other benchmarks were created using the multiplication factors in Table 1. As all data in this study was rarefied to 6600 sequences, this is the read depth these benchmarks would apply at; at higher numbers of sequences, the diversity would change. This is a rough example of how we would transfer the benchmarks across, and future work will do this accurately, considering other factors.
Cosmetics 07 00079 g010
Table 1. Table showing the multiplication factors needed to get from the benchmark for “healthy western skin” to the other benchmarks listed in our 2017 work.
Skin Diversity BenchmarkMultiplication Factor
Unhealthy/diseased western0.24 (1/4.2)
Healthy western-
Rural healthy1.23
Caveman/perfect1.64
Publisher’s Note: MDPI stays neutral with regard to jurisdictional claims in published maps and institutional affiliations.

