1. Introduction
With the onset of the COVID-19 pandemic, it soon became clear that the SARS-CoV-2 virus primarily spreads through droplets and aerosols that are released when breathing, talking, and coughing [
1,
2,
3]. As a response, personal protective equipment (PPE), such as full face and FFP3 masks and face shields, became mandatory for medical professionals. Although adequate PPE can provide suitable protection, problems may arise, such as reduced dexterity and impaired visibility [
4], which could be reflected in the number of errors in medical procedures. The spread of aerosols contaminated with SARS-CoV-2 can, in certain situations, also pose a problem such as during the intubation and extubation procedure when large quantities of aerosols are produced by the patient [
5,
6]. This increases the probability of an infection for the medical professionals attending the operation as well as the whole operation room, including all the equipment becoming contaminated. Lengthy and sometimes costly procedures are used by hospitals to decontaminate operating rooms [
7,
8]. This increases costs and renders the operation room unavailable for multiple hours or even days. These situations could be avoided if the droplets and aerosols generated by the patient could be contained and filtered without contaminating the operation room. In some cases, such as laparoscopic and neurological surgery, the use of PPE is not possible due to specialized equipment used by the surgeon.
A possible solution for such procedures would be the use of a protective box. The idea of a protective box first appeared in 2020 [
9] and soon, multiple improvements were published [
10,
11,
12,
13,
14]. The primary idea is to assemble a box-like object around the patient’s head and upper torso, which would contain any droplets and aerosols generated by the patient. The protective box is usually made from transparent polycarbonate panels and/or foldable plastic sheets. A number of openings are then cut in the panels and/or foldable plastic sheets for access to the patient by medical professionals.
Although, from the onset of the COVID-19 pandemic, there has been a substantial number of publications regarding barrier enclosure devices [
13], there are only a few studies where the particle concentration was measured [
11,
15,
16,
17,
18]. In all cases where a negative airflow was established, the number of detected particles inside the protective box dropped over time. The number of particles outside the box was lower compared to measurements where there was no negative airflow.
In the present study, we investigated the size- and time-dependent aerosol removal from an improved protective box equipped with active filtration during simulated intubation and extubation procedures. The particle concentration was measured within and outside the protective box in the range from 14 nm to 20 μm. The aim of this study was to investigate whether active filtration prevents aerosols from leaking into the surrounding air and what are the time and size dynamics of aerosols within the box as it is important to know when the box can be safely removed without spreading the contaminated aerosols.
2. Materials and Methods
2.1. Improved Protective Box
An improved protective box was designed based on a plastic polypropylene bag with armholes, covered with natural rubber latex sheets, that utilizes a supportive frame. Armholes are cut in the plastic bag in the shape of a cross, which are then covered with rubber latex sheets. In our case, four armholes were made. The latex sheets are taped to the bag with strong double-sided tape and a small straight incision is made for the armhole. As the latex is highly stretchable, the incision can be rather small to form a tight fit with the arm when it is inserted into the protective box. At the open end of the bag, a stretchable cord is mounted. The frame is made of nine detachable parts from 8 mm thick PMMA. When assembled, it forms a cube with the edge 60 cm in size. The plastic bag is pulled over the frame and below the operating table. Photographs of the protection box are shown in
Figure S1.
2.2. Active Filtration
A powered air-purifying respirator (PAPR) model SR 500 (Sundström Safety AB, Lagan, Sweeden) was used to provide a negative airflow to the protective box. A negative airflow of 240 L/min was used during the experiments. This model is approved in the United States of America by the National Institute for Occupational Safety and Health (NIOSH) for use in environments where hazards are known and characterized and can be used as an alternative to filter respirators. This model is an indispensable part of many COVID-19 wards in hospitals all around the world.
2.3. Aerosol Generator
An aerosol standard powder (ISO 12103-1 A1, DMT, Germany) [
19] was dispersed in the protective box during measurements with a Topas SAG 410 (Topas GmbH, Dresden, Germany) aerosol generator with the feed rate of 0.1 and preparation 3/7. The outlet air flow through the aerosol generator was approximately 8 L/min.
2.4. Scanning Mobility Particle Sizer
The nanoparticle total concentration and time-dependent size distribution was measured with a scanning mobility particle sizer (SMPS, electrostatic classifier model 3080; TSI Co., Shoreview, MN, USA) equipped with desiccator, soft X-ray neutralizer, long differential mobility analyzer (DMA, model 3081; TSI Co., Shoreview, MN, USA), and a water condensation particle counter (WCPC; model 3785; TSI Co., Shoreview, MN, USA). The sheath flow rate through the DMA was 4 L/min, while the aerosol flow rate through the WCPC was 1 L/min. No impactor was used upstream the neutralizer as it had no impact on the particle distribution. The SMPS was operated with the Aerosol Instrument Manager version 9.0.0.0, where multiple charge correction and diffusion correction were enabled. The inverted SMPS measurements were further analyzed using our own software written in Mathematica. The electrical mobility diameter was from 14 nm to 461 nm. The measurements were performed as successive size scans, with a 1-min duration of a single scan.
2.5. Laser Aerosol Particle Counter
A LAP 340 Laser Aerosol Particle Counter (LAPC) (Topas GmbH, Dresden, Germany) equipped with a DIL 554 Aerosol Dilution System (Topas GmbH, Dresden, Germany) was used to measure the particle concentration in the size range from 0.3 μm to 20 μm. The sheath flow rate of the LAPC was 28.3 L/min. The LAPC was turned on for 5 s every 30 s (5 s on, 25 s off) to minimize the impact on the particle concentration. The particle analyzing software PASWin was used to operate the LAPC. The inverted LAPC measurements were further analyzed using our own software written in Mathematica.
2.6. Experimental Arrangement
The experimental arrangement is schematically shown in
Figure 1A,B while a schematic of a real-life use is shown in
Figure 1C. For the purpose of the measurements, the protective box was placed within a bigger wooden-polycarbonate cube with the edge 1.2 m in size. With the outer box, the particle concentration outside the protective box was kept constant and as low as possible. Low and constant particle concentrations are needed to accurately determine if any particles escape from the protective box during the simulation of the intubation and extubation procedure.
The SMPS, LAPC, and the aerosol generator were kept outside the outer box, while the PAPR was placed within the protective box. In our case, the PAPR would be positioned on the patient as it is quite light and should not pose a problem. The used PAPR model could be equipped with inlet hoses. With such a configuration the PAPR could be positioned outside the protection box and only the inlet hoses would be connected to the protection box, as shown in
Figure 1C. To simulate the body of a patient, a box in the size of an average person was placed at the open end of the plastic cover, which was loosely tightened before the experiments. The outlet of the PAPR was situated outside the protective box but inside the outer box. In this way, the particle concentration within the outer box was kept constant and as low as possible and there was no net air flow between the inside and the outside of the outer box. A high efficiency particulate air (HEPA)-filtered air outlet was also used during the experiments to simulate oxygenation and preoxygenation. The outlet of the aerosol generator and the HEPA-filtered air outlet were positioned at the bottom of the protective box facing upwards, as schematically shown in
Figure 1A,B.
Particle concentration measurements were performed inside and outside the protective box. Inside the protective box, the sampling site was near the hand openings designated for the anesthesiologist, while on the outside, the sampling site was in front of the hand openings where the particle concentration would be highest if there was any leakage. Three measurements were performed inside and two measurements outside the protective box.
2.7. Simulation Procedure
2.7.1. Cough Calibration
The number of particles generated with a single cough was calculated according to literature [
20]. First, the protective box was blown for 10 min with HEPA-filtered air with a flow of 100 L/min to remove background aerosols from the box. To simulate a cough, the ISO 12103-1 A1 powder was dispersed into the protective box with the aerosol generator for 5 s with the feed rate of 0.1. After 5 min, the particle concentration was measured. Three consecutive measurements were performed. The whole procedure was repeated twice to obtain an average particle concentration after a simulated cough. It was assumed that: (a) the aerosol dispersed equally throughout the chamber; and (b) the particle concentration was highest 5 min after the aerosol generator was turned on. Equation (1) was used to determine the number of particles (#) generated with a single simulated cough
where
dN5min is the number of particles per cm
3 after 5 min,
dNbackground the number of particles per cm
3 before the aerosol generator was turned on, and
Vbox is the volume of the protective box. On average,
particles per cough were generated, which is almost twenty times more particles than the average number of particles generated by live subjects [
20]. The size distribution of generated aerosols,
Figure S2, agrees well with literature [
21].
2.7.2. Intubation Procedure
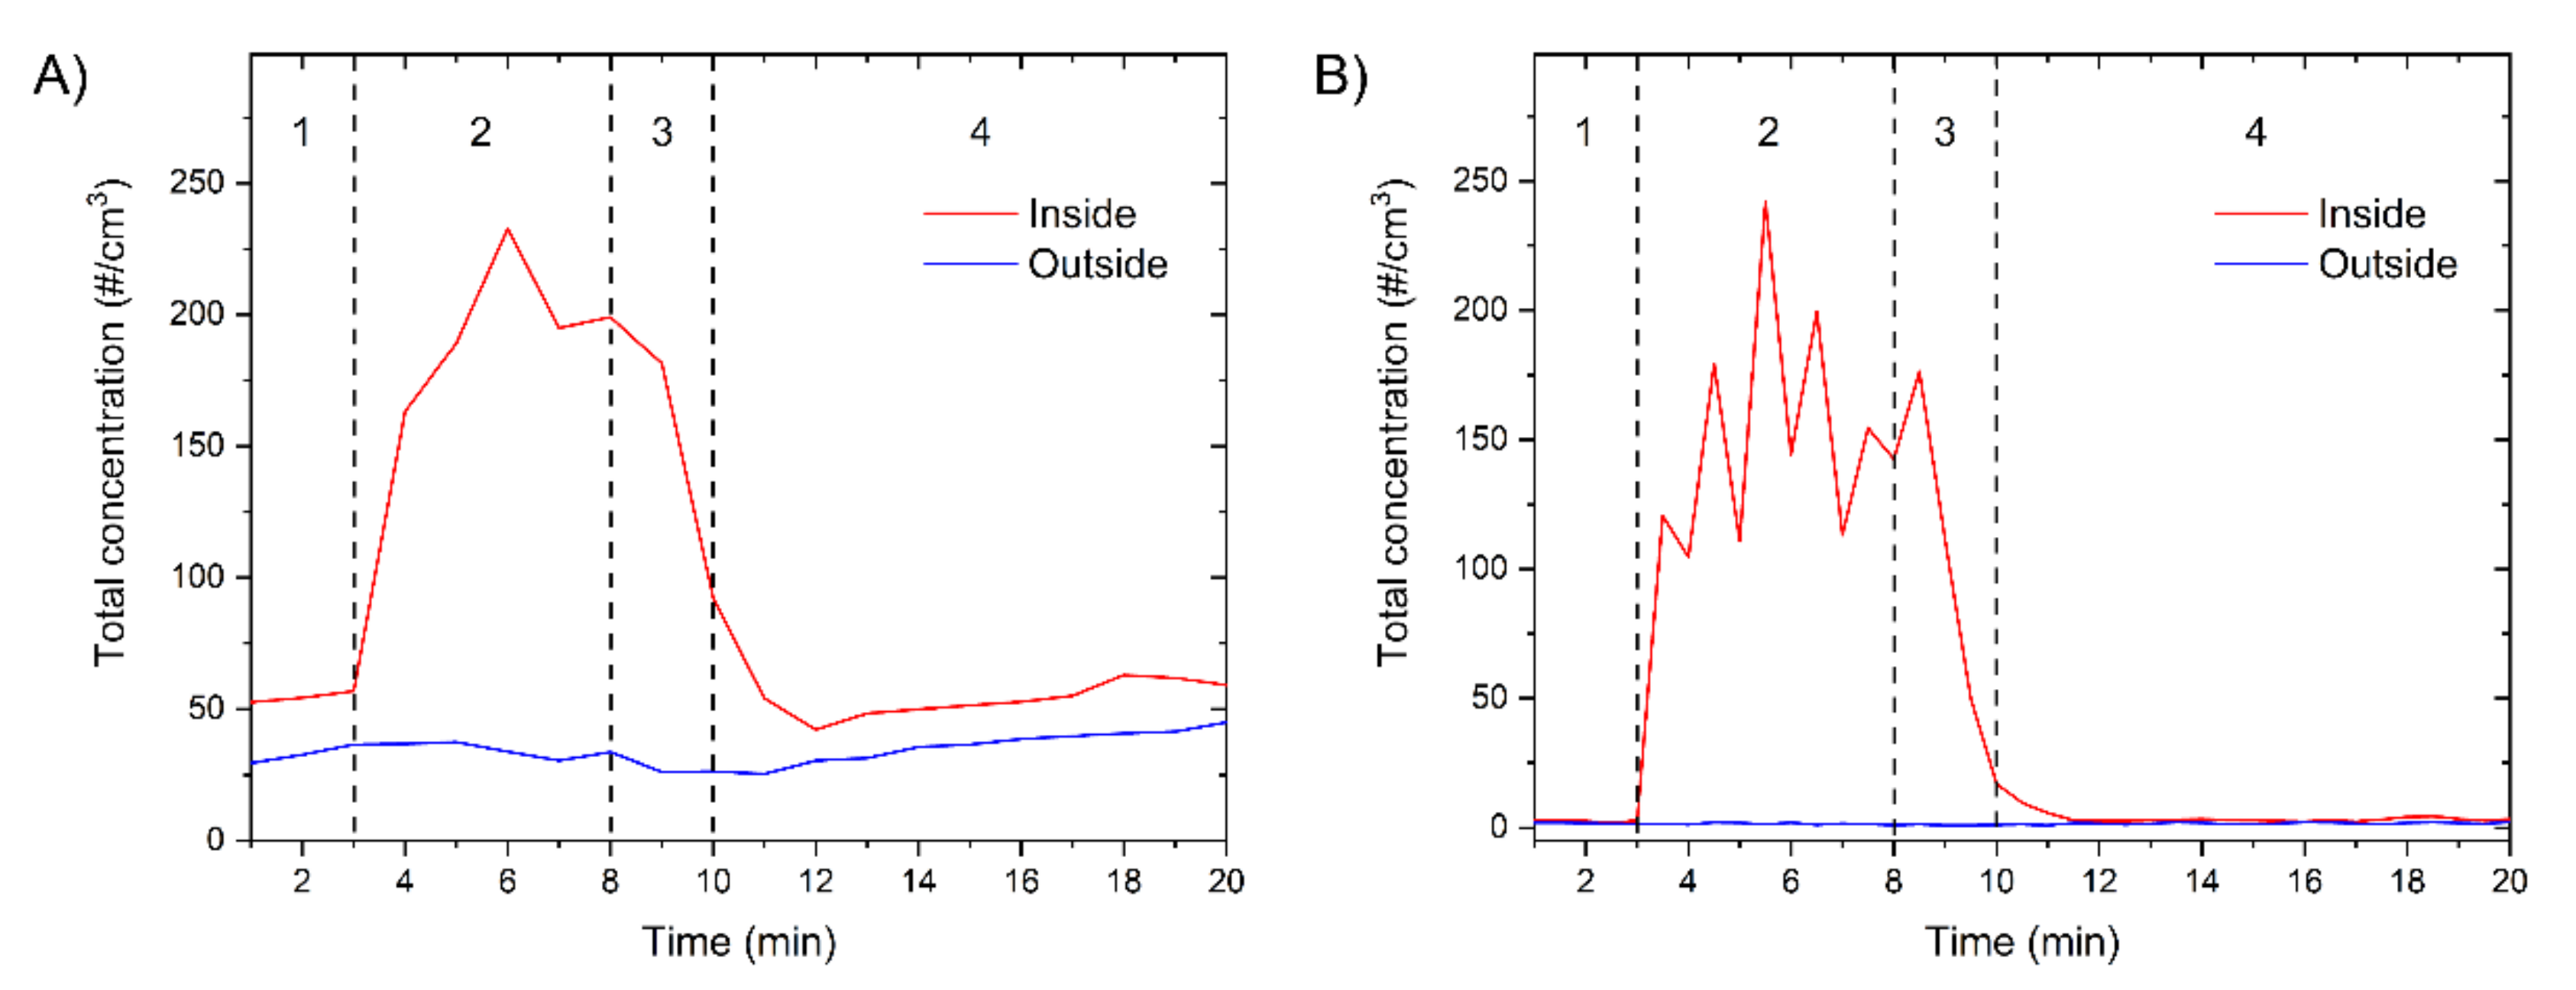
The timeline of the simulated intubation procedure is schematically shown in
Figure 2A) and is presented in
Table 1. In phase 1, the background particle concentration was measured. Then, the HEPA-filtered air with the flow of 10 L/min was turned on to simulate the air flow of preoxygenation, which could have an impact on the particle concentration. At the same time, the aerosol generator was turned on to simulate coughing. The aerosol generator was turned on once per minute to simulate mild to light coughing. In phase 3, the aerosol generator was turned off, while the HEPA-filter air still flowed with 10 L/min for another 2 min to simulate the ventilation with air before the intubation and after the patient has been put under anesthesia. In phase 4, the HEPA-filtered air was turned off and the decrease of particle concentration was measured for 10 min.
2.7.3. Extubation Procedure
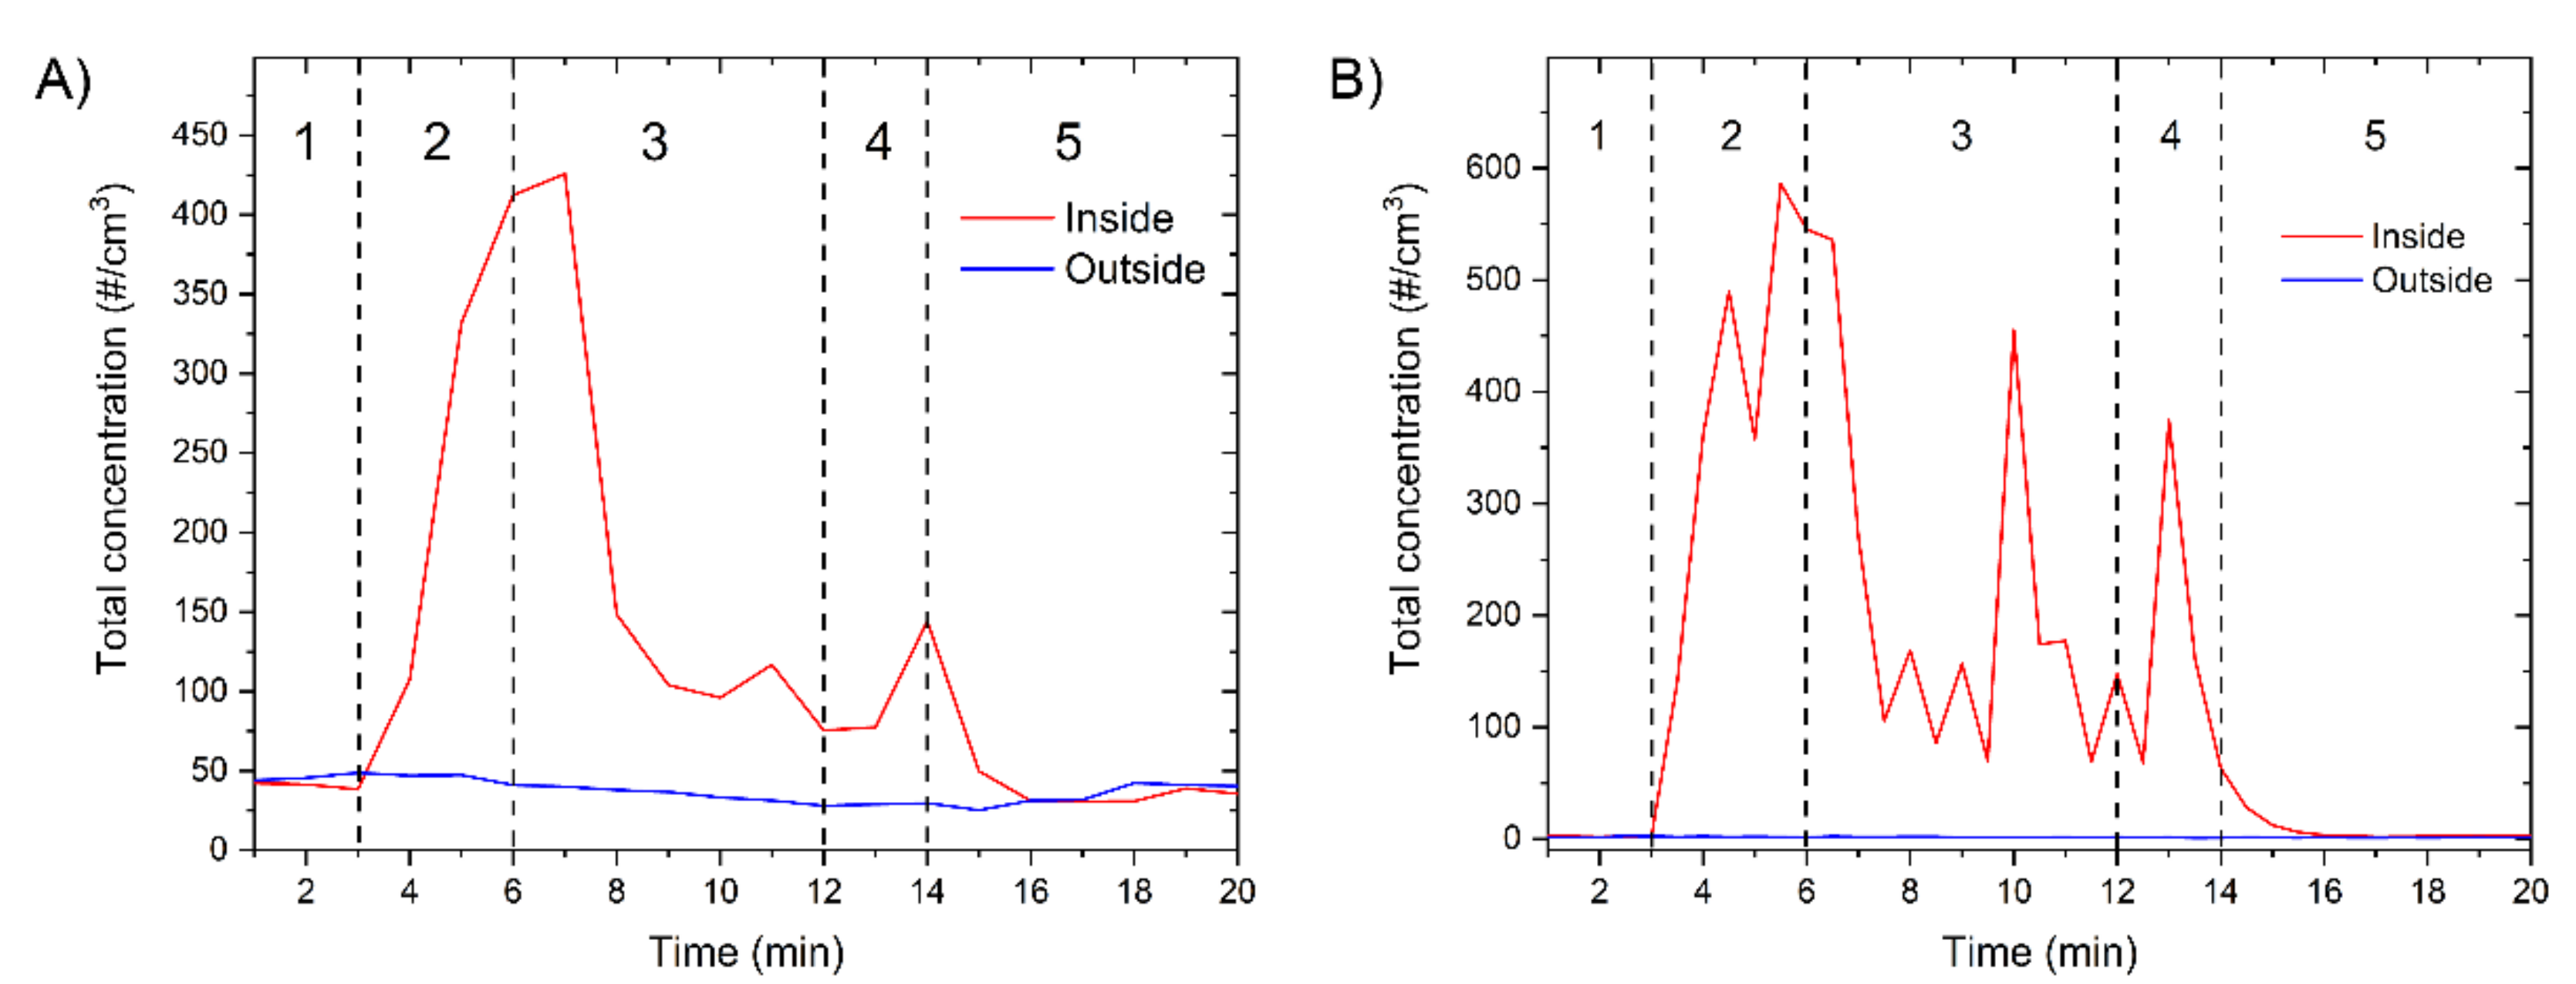
The simulation of the extubation procedure is schematically shown in
Figure 2B and is presented in
Table 2. In phase 1, the background particle concentration was measured. Then, the HEPA-filtered air with the flow of 10 L/min was turned on to simulate oxygenation after extubation as well as the aerosol generator to simulate coughing. In phase 2, the aerosol generator was turned on for 5 s every 20 s (5 s on, 15 s off). This simulated intense coughing usually observed after extubation. In phase 3, the aerosol generator was turned on only once a minute. In phase 4, the aerosol generator was turned off, while the HEPA-filter air still flowed with 10 L/min for 2 min. In phase 5, the HEPA-filtered air was also turned off and the decrease of particle concentration was measured for 6 min.
3. Results
3.1. Intubation
The total particle concentration, averaged over three measurements, measured inside and outside the protective box during the simulation of the intubation procedure is shown in
Figure 3. In phase 1, the background total concentration was measured. As it can be seen from
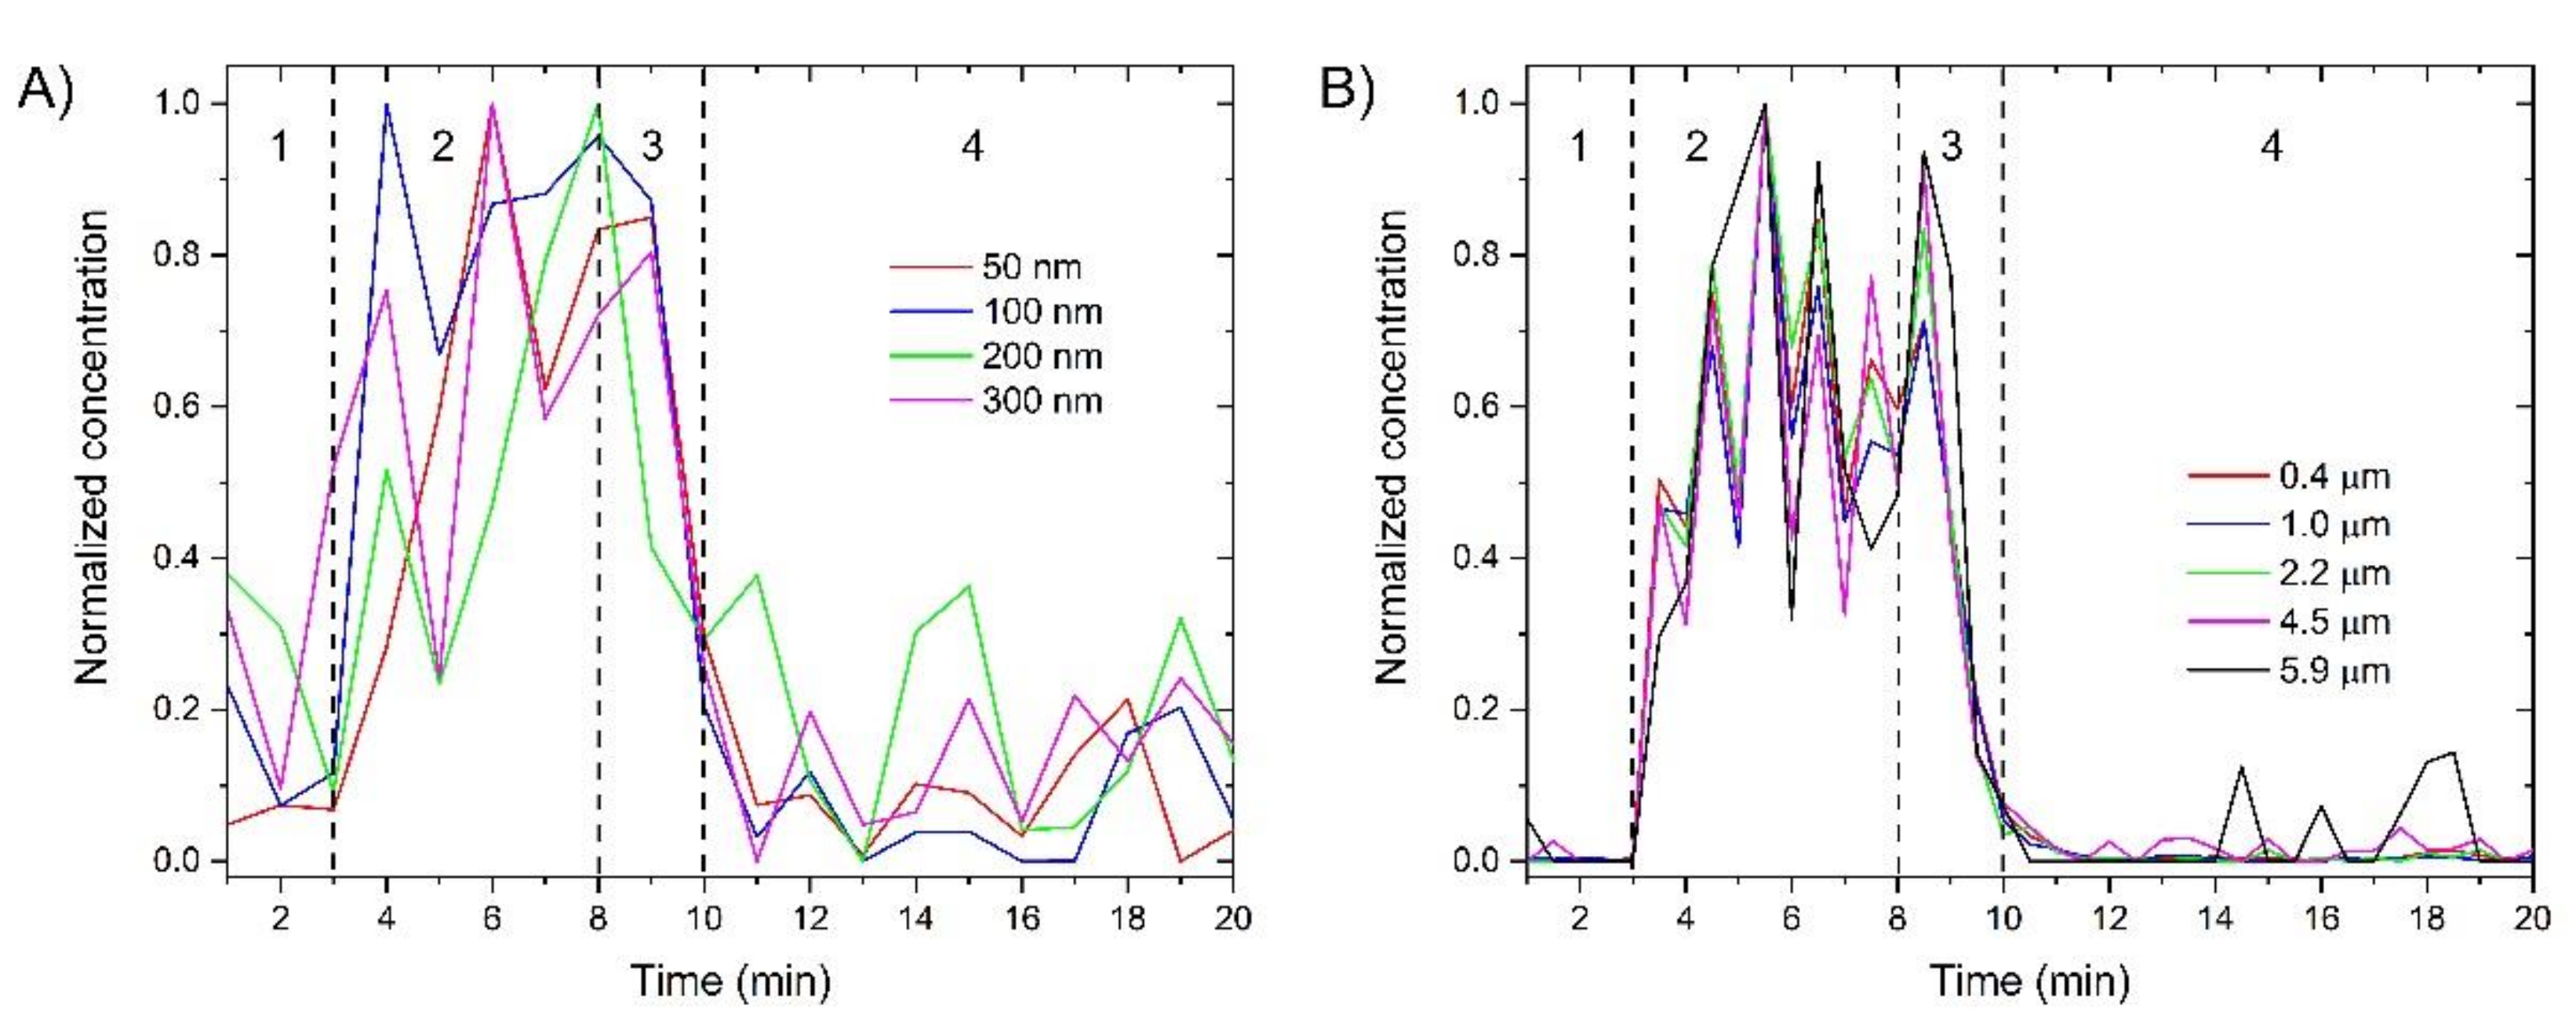
Figure 3, the background concentration was low and relatively stable. In phase 2, the aerosol generator was turned on as described above. The total concentration inside the protective box rapidly increased and stayed elevated throughout phase 2. In phase 3, the aerosol generator was turned off and only the HEPA-filtered was is blown into the protective box. The total concentration rapidly decreased. It reached background levels in phase 4, 2 min after the HEPA-filtered air was turned off. The decrease in the concentration did not depend on the particle size as concentrations of all particle sizes decreased exponentially and reached background concentrations at the same time,
Figure 4. Outside the protective box, the total concentration was constant over the course of the experiment, indicating that no particles escaped from the protective box. Throughout the whole measurement, the PAPR was on, which in combination with the SMPS and LPC, provided a negative airflow of 249 L/min.
3.2. Extubation
The total particle concentration, averaged over three measurements, measured inside and outside the protective box during the simulation of the extubation procedure was shown in
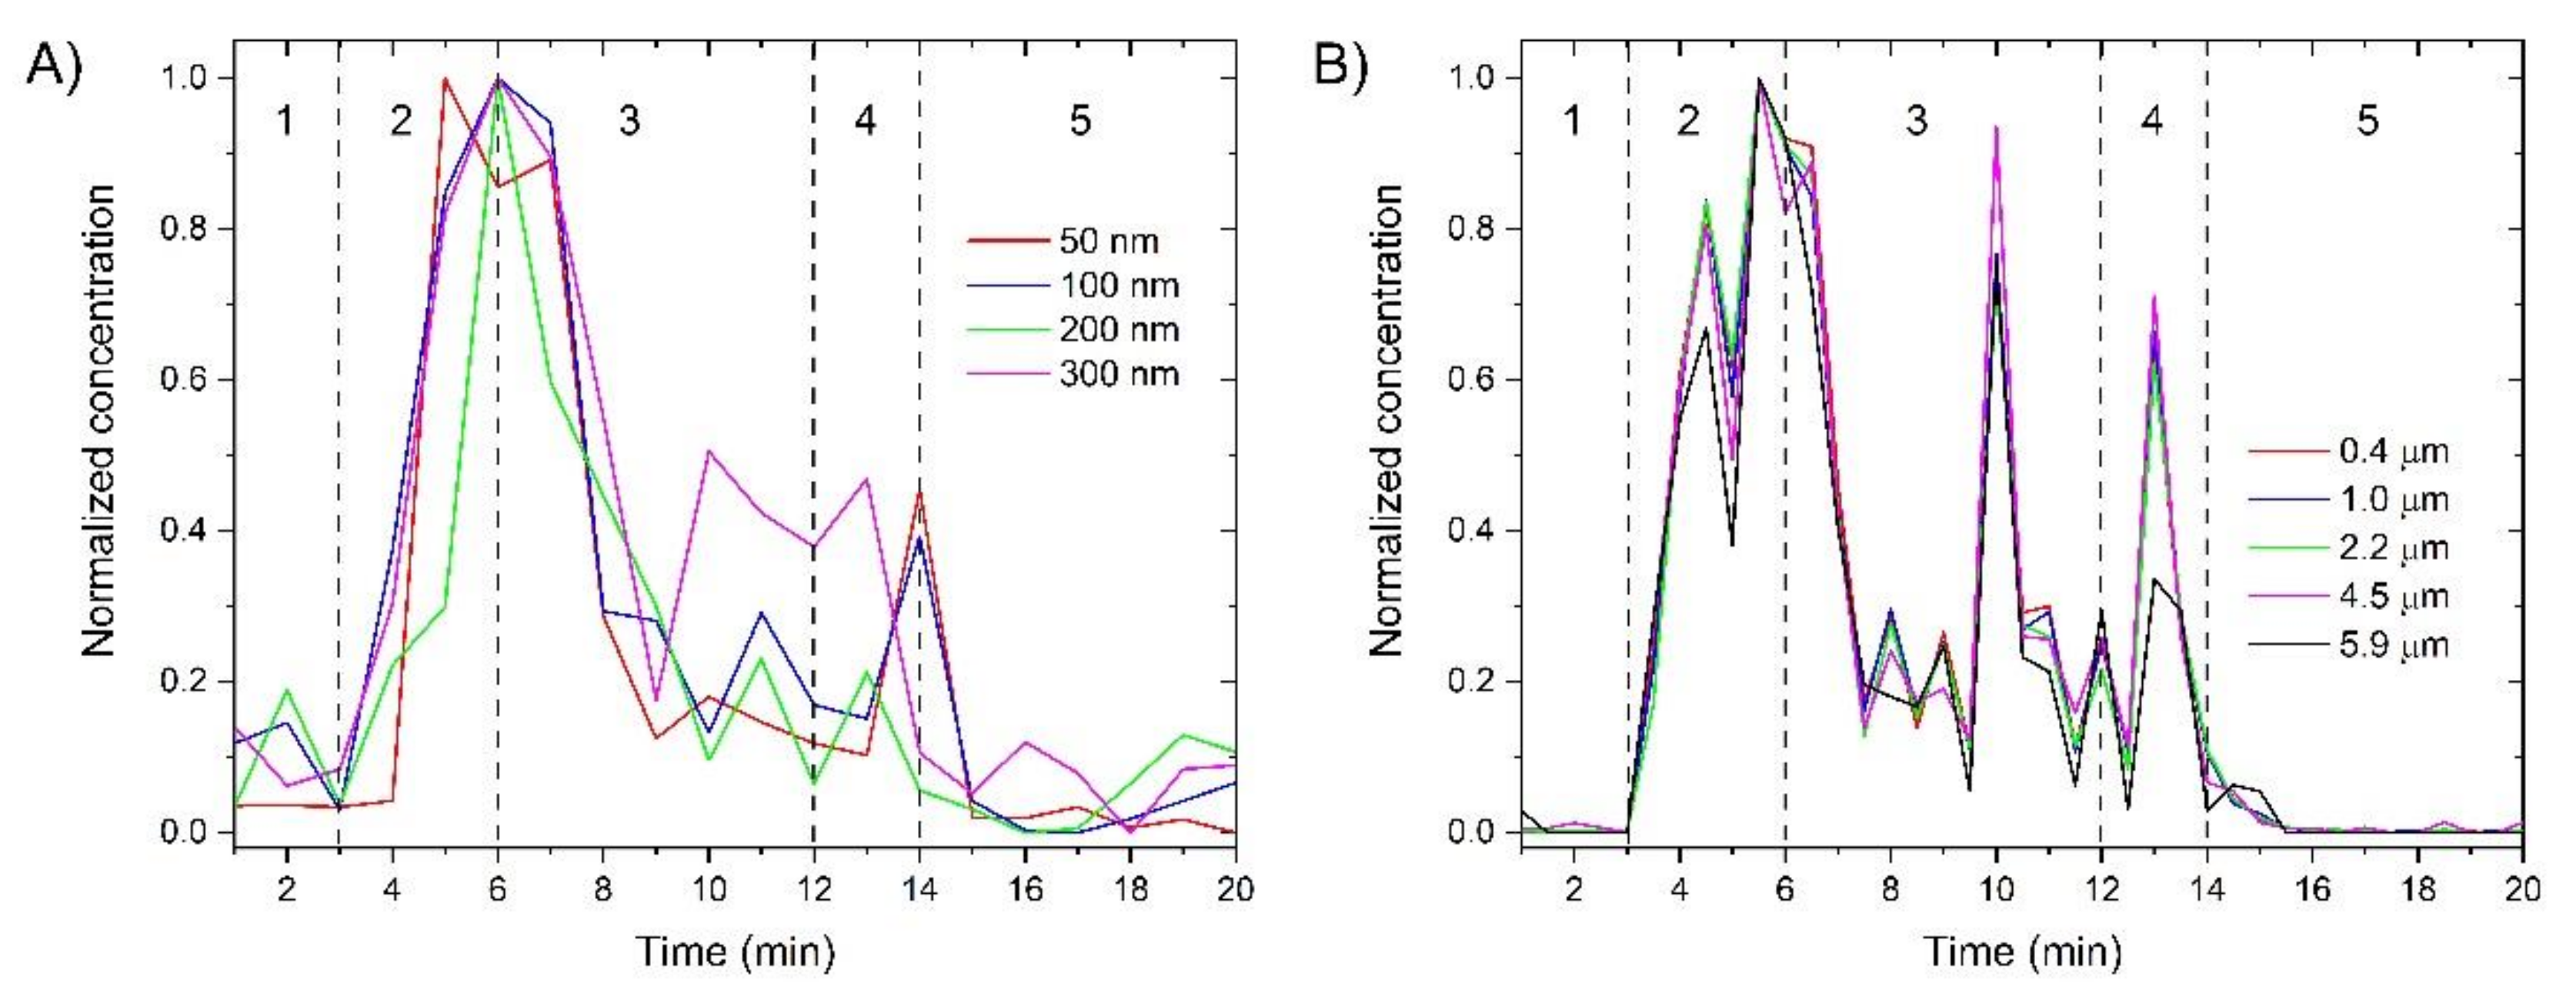
Figure 5. In phase 1, the background total concentration was measured, which was low and relatively stable. In phase 2, the aerosol generator was turned on as described above. The total concentration rapidly increased inside the protective box and was larger compared to the intubation procedure due to multiple coughs per minute. In phase 3, the total concentration decreased as the number of coughs per minute decreased. In phase 4, the aerosol generator was turned off and only the HEPA-filtered air was blown into the protective box. A spike in the particle concentration in phase 4 was probably due to some dust powder still present in the chamber. The total concentration rapidly decreased and reached background levels a few minutes into phase 5, when the HEPA-filtered air was turned off. The decrease in the concentration did not depend on the particle size,
Figure 6. Outside the protective box, the total concentration was constant over the course of the experiment, indicating that no particles escaped from the protective box. Throughout the whole measurement, the PAPR was on which in combination with the SMPS and LPC, provided a negative airflow of 249 L/min.
4. Discussion
Different barrier enclosure devices were reported, from plastic boxes to just plastic sheets [
13]. Plastic boxes usually lack portability and the ability to accommodate an airway assistant, while plastic sheets do not block aerosols generated by the patient. Our protective box is based on a plastic bag with armholes covered with latex sheets that utilizes a supportive frame. The modular nature of the supportive frame makes our protective box portable as well as easy and quick to assemble. The plastic bag can have multiple armholes for medical professionals and provides excellent protection against droplets and aerosols. The improved design of the hand aperture, which is covered with a latex sheet, provides a perfect fit for the arms, superb maneuverability, and prevents any leakage of droplets and aerosols towards medical professionals. The open end of the bag can be adjusted according to the patient size and allows the insertion of various tubing. In our case, we used a PAPR usually used by medical professionals in high-risk environments. As it is certified as medical equipment, it can be readily used in operation rooms.
During the simulated intubation and extubation procedures, the particle concentration inside the protective box increased when the aerosol generator was turned on. The rapid decrease in the particle concentration after the aerosol generator was turned off is attributed to the negative airflow provided by the PAPR. The high negative airflow is mandatory to prevent any aerosol leakage from the protective box. Without the PAPR, the particle concentration inside the intubation box decreases very slowly and some particles leak out through the hand openings. During the oxygenation and preoxygenation procedure the positive airflow decreases the pressure difference made by the PAPR. Only a sufficient negative airflow ensures that there is no leakage of particles through the armholes. As each barrier enclosure device is different, a sufficient negative airflow can only be determined through an experiment and supported by calculations [
22]. Our experiments show that concentrations of all measured particle sizes decrease within the same time frame. In our experiment, the number of particles dropped to background levels within the first 5 min, when the aerosol generator was turned off.
Once the intubation/extubation procedure is finished, the plastic bag can be removed and discarded while the supportive frame can be sterilized in an autoclave or wiped with a disinfectant. The bag would be discarded after the procedure which could require special training for the medical professionals. Although the bag itself together with the latex sheets is rather cheap (in the order of 10 EUR), it would produce a fair amount of waste. The use of the protective box in certain hospital settings would probably outweigh the environmental impact of the generated waste.
Although concerns have been raised that protective boxes could hinder and potentially delay airway management [
23], the results differ and not all studies come to the same conclusions [
24]. With proper training and good protection box design, the current obstacles could be overcome.
The comfort of the operator and the patient must also be taken into consideration. So far, studies have shown [
24,
25] that patients feel comfortable inside protection boxes but this could depend on the protection box design. Patients should not feel uncomfortable while inside the protection box as this could render the intubation process more difficult. The operator should also feel comfortable while operating with a protection box to prevent multiple intubation attempts and prolonged intubation times. Discomfort for the operator was usually caused due to restricted movement affecting airway maneuvers, additional mental capacity during intubation, the stylet hitting the top of the box, and impaired vision of the patient [
24,
25,
26].
The main limitation of this study is the use of only one protective box design and fixed parameters such as negative airflow and single measuring positions inside and outside the protective box. By varying the negative airflow, a minimum value could be obtained, when no aerosols are leaked from the protective box. This would also change the time dynamics of the aerosols inside the protective box. Different measuring positions would provide a better understanding if any aerosols leak from the protective box or remain afloat within it due to insufficient airflow.
This study shows that a protective box equipped with an active filtration device provides adequate protection against droplets and aerosols for the medical professionals dealing with infected patients during intubation and extubation procedures. As the protective box also prevents any leakage of droplets and aerosols in the operation room, it does not have to be decontaminated afterwards. Standardized protocols should be established to test the viability of different types of protective boxes which should prevent aerosols escaping from the box as well as a fast decrease of particle concentration within the box.
5. Conclusions
A protective box design based on a plastic bag with armholes covered by latex sheets that utilizes a supportive frame and is equipped with an active filtration device was created. It provides excellent protection against generated droplets and aerosols and offers exceptional portability and maneuverability. Size- and time-dependent measurements of a simulated intubation and extubation procedure were made for aerosols 14 nm to 20 μm in size, inside and outside the protective box. Inside the protective box, the particle concentration increased during cough simulation and decreased to background levels within 5 min after the aerosol generator being turned off. The decrease in the concentration does not depend on the particle size. Outside the intubation box, the particle concentration did not change with time. Additional tests have to be performed to fully evaluate the efficiency of the presented protective box.
Similar to other PPE, a performance standard should be established for different types of protective boxes. Working with an untested protective box could give a false sense of security which could do more harm than good.
Author Contributions
Conceptualization, L.P., M.Č. and M.S.; methodology, L.P. and M.Č.; validation, L.P., M.Č., M.S. and M.R.; formal analysis, L.P. and M.Č.; investigation, L.P., M.Č. and M.S.; resources, M.R. and M.S.; data curation, L.P. and M.Č.; writing—original draft preparation, L.P.; writing—review and editing, M.Č., M.S. and M.R.; visualization, L.P.; supervision, M.R.; project administration, M.R.; funding acquisition, M.R. All authors have read and agreed to the published version of the manuscript.
Funding
This research was funded by the Slovenian Research Agency, grant number P1-0099.
Institutional Review Board Statement
Not applicable.
Informed Consent Statement
Not applicable.
Data Availability Statement
The data presented in this study are available on request from the corresponding author.
Acknowledgments
The authors acknowledge the support from HYLA d.o.o.
Conflicts of Interest
The authors declare no conflict of interest.
References
- Stadnytskyi, V.; Bax, C.E.; Bax, A.; Anfinrud, P. The airborne lifetime of small speech droplets and their potential importance in SARS-CoV-2 transmission. Proc. Natl. Acad. Sci. USA 2020, 117, 11875–11877. [Google Scholar] [CrossRef] [PubMed]
- Lindsley, W.G.; Blachere, F.M.; Thewlis, R.E.; Vishnu, A.; Davis, K.A.; Cao, G.; Palmer, J.E.; Clark, K.E.; Fisher, M.A.; Khakoo, R. Measurements of airborne influenza virus in aerosol particles from human coughs. PLoS ONE 2010, 5, e15100. [Google Scholar] [CrossRef] [PubMed]
- Greenhalgh, T.; Jimenez, J.L.; Prather, K.A.; Tufekci, Z.; Fisman, D.; Schooley, R. Ten scientific reasons in support of airborne transmission of SARS-CoV-2. Lancet 2021, 397, 1603–1605. [Google Scholar] [CrossRef]
- Loibner, M.; Hagauer, S.; Schwantzer, G.; Berghold, A.; Zatloukal, K. Limiting factors for wearing personal protective equipment (PPE) in a health care environment evaluated in a randomised study. PLoS ONE 2019, 14, e0210775. [Google Scholar] [CrossRef]
- Canelli, R.; Connor, C.W.; Gonzalez, M.; Nozari, A.; Ortega, R. Barrier enclosure during endotracheal intubation. N. Engl. J. Med. 2020, 382, 1957–1958. [Google Scholar] [CrossRef] [PubMed]
- Fidler, R.L.; Niedek, C.R.; Teng, J.J.; Sturgeon, M.E.; Zhang, Q.; Robinowitz, D.L.; Hirsch, J. Aerosol retention characteristics of barrier devices. Anesthesiology 2021, 134, 61–71. [Google Scholar] [CrossRef]
- Cutts, T.; Kasloff, S.; Safronetz, D.; Krishnan, J. Decontamination of common healthcare facility surfaces contaminated with SARS-CoV-2 using peracetic acid dry fogging. J. Hosp. Infect. 2021, 109, 82–87. [Google Scholar] [CrossRef]
- Andersen, B.M.; Rasch, M.; Hochlin, K.; Jensen, F.-H.; Wismar, P.; Fredriksen, J.-E. Decontamination of rooms, medical equipment and ambulances using an aerosol of hydrogen peroxide disinfectant. J. Hosp. Infect. 2006, 62, 149–155. [Google Scholar] [CrossRef]
- Hsien Yung Lai Aerosol Box—Protects Healthcare Providers during Endotracheal Intubation. Available online: https://sites.google.com/view/aerosolbox/home (accessed on 12 April 2021).
- Serdinšek, M.; Pintarič, T.S.; Poredoš, P.; Serdinšek, M.S.; Umek, N. Evaluation of a foldable barrier enclosure for intubation and extubation procedures adaptable for patients with COVID-19: A mannequin study. J. Clin. Anesth. 2020, 67, 109979. [Google Scholar] [CrossRef]
- Hellman, S.; Chen, G.H.; Irie, T. Rapid clearing of aerosol in an intubation box by vacuum filtration. Br. J. Anaesth. 2020, 125, e296–e299. [Google Scholar] [CrossRef]
- Cárdenas-Mancera, J.; Valencia-Arango, L.; Segura-Salguero, J.C.; Díaz-Bohada, L. A Portable Negative Airflow Box to Control Exposure for Aerosol-Generating Procedures During Coronavirus Disease 2019 (COVID-19) Pandemic. J. Cardiothorac. Vasc. Anesth. 2020, 35, 681. [Google Scholar] [CrossRef] [PubMed]
- Price, C.; Ben-Yakov, M.; Choi, J.; Orchanian-Cheff, A.; Tawadrous, D. Barrier enclosure use during aerosol-generating medical procedures: A scoping review. Am. J. Emerg. Med. 2020, 41, 209–218. [Google Scholar] [CrossRef]
- Weng, C.-H.; Chiu, P.-W.; Kao, C.-L.; Lin, Y.-Y.; Lin, C.-H. Combating COVID-19 during Airway Management: Validation of a Protection Tent for Containing Aerosols and Droplets. Appl. Sci. 2021, 11, 7245. [Google Scholar] [CrossRef]
- Simpson, J.P.; Wong, D.N.; Verco, L.; Carter, R.; Dzidowski, M.; Chan, P.Y. Measurement of airborne particle exposure during simulated tracheal intubation using various proposed aerosol containment devices during the COVID-19 pandemic. Anaesthesia 2020, 75, 1587–1595. [Google Scholar] [CrossRef] [PubMed]
- Shaw, K.M.; Lang, A.L.; Lozano, R.; Szabo, M.; Smith, S.; Wang, J. Intensive care unit isolation hood decreases risk of aerosolization during noninvasive ventilation with COVID-19. Can. J. Anesth. Can. D’anesthésie 2020, 67, 1481–1483. [Google Scholar] [CrossRef] [PubMed]
- Lang, A.L.; Shaw, K.M.; Lozano, R.; Wang, J. Effectiveness of a negative-pressure patient isolation hood shown using particle count. Br. J. Anaesth. 2020, 125, e295–e296. [Google Scholar] [CrossRef] [PubMed]
- Lyaker, M.R.; Al-Qudsi, O.H.; Kopanczyk, R. Looking beyond tracheal intubation: Addition of negative airflow to a physical barrier prevents the spread of airborne particles. Anaesthesia 2020, 75, 1688–1689. [Google Scholar] [CrossRef]
- BS ISO 12103-1:1997 Road Vehicles. Test Dust for Filter Evaluation. Arizona Test Dust (British Standard). Available online: https://webstore.ansi.org/Standards/BSI/BSISO121031997 (accessed on 29 July 2021).
- Lee, J.; Yoo, D.; Ryu, S.; Ham, S.; Lee, K.; Yeo, M.; Min, K.; Yoon, C. Quantity, size distribution, and characteristics of cough-generated aerosol produced by patients with an upper respiratory tract infection. Aerosol Air Qual. Res. 2019, 19, 840–853. [Google Scholar] [CrossRef]
- Lindsley, W.G.; Pearce, T.A.; Hudnall, J.B.; Davis, K.A.; Davis, S.M.; Fisher, M.A.; Khakoo, R.; Palmer, J.E.; Clark, K.E.; Celik, I. Quantity and size distribution of cough-generated aerosol particles produced by influenza patients during and after illness. J. Occup. Environ. Hyg. 2012, 9, 443–449. [Google Scholar] [CrossRef] [PubMed]
- Perella, P.; Tabarra, M.; Hataysal, E.; Pournasr, A.; Renfrew, I. Minimising exposure to droplet and aerosolised pathogens: A computational fluid dynamics study. Br. J. Anaesth. 2021, 126, 544–549. [Google Scholar] [CrossRef]
- Lim, Z.J.; Ponnapa Reddy, M.; Karalapillai, D.; Shekar, K.; Subramaniam, A. Impact of an aerosol box on time to tracheal intubation: Systematic review and meta-analysis. Br. J. Anaesth. 2021, 126, e122–e125. [Google Scholar] [CrossRef]
- Jen, T.T.H.; Gusti, V.; Badh, C.; Mehta, S.; Denomme, J.; Lockhart, S.; Shams, B.; Klaibert, B.; Chau, A. The impact of a barrier enclosure on time to tracheal intubation: A randomized controlled trial. Can. J. Anesth. Can. D’anesthésie 2021, 68, 1358–1367. [Google Scholar] [CrossRef] [PubMed]
- Bidkar, P.; Goneppanavar, U.; Kaur, J.; Ramamoorthy, S.V. Safety tent for enhanced personal protection from aerosol-generating procedures while handling the COVID-19 patient airway. J. Anaesthesiol. Clin. Pharmacol. 2020, 36, S157. [Google Scholar]
- Ponnappan, K.T.; Dhingra, U.; Yadav, A.Y.; Sam, A.F. Plastic screen versus aerosol box as a barrier during endotracheal intubation: A simulation-based crossover study. Bali J. Anesthesiol. 2021, 5, 88–92. [Google Scholar]
| Publisher’s Note: MDPI stays neutral with regard to jurisdictional claims in published maps and institutional affiliations. |
© 2021 by the authors. Licensee MDPI, Basel, Switzerland. This article is an open access article distributed under the terms and conditions of the Creative Commons Attribution (CC BY) license (https://creativecommons.org/licenses/by/4.0/).


