Solving a Structure in the Reciprocal Space, Real Space and Both by Using the EXPO Software


Institute of Crystallography-CNR, Via G. Amendola 122/o, 70126 Bari, Italy
*
Author to whom correspondence should be addressed.
Crystals 2020, 10(1), 16; https://0-doi-org.brum.beds.ac.uk/10.3390/cryst10010016
Submission received: 4 December 2019
/
Revised: 20 December 2019
/
Accepted: 29 December 2019
/
Published: 31 December 2019
(This article belongs to the Special Issue Crystal Structure Characterization by Powder Diffraction)
Abstract
:The solution of crystal structures from X-ray powder diffraction data has undergone an intense development in the last 25 years. Overlapping, background estimate, preferred orientation are the main difficulties met in the process of determining the crystal structure from the analysis of the one-dimensional powder diffraction pattern. EXPO is a well known computer program that, designed for solving structures, organic, inorganic, as well as metal-organic by powder diffraction data, employs the two most widely used kinds of solution methods: Direct Methods proceeding in the reciprocal space and Simulated Annealing proceeding in the real space. EXPO allows also to suitably combine these two approaches for validating the structure solution. In this paper, we give examples of structure characterization by EXPO with the aim of suggesting a solution strategy leading towards the application of reciprocal-space methods or real-space methods or both.
1. Introduction
Crystal structure solution from powder diffraction data is limited respect to the single crystal because of the presence of diffraction peak overlap, the uncertain estimate of background and possible preferred orientation can prevent the complete and correct interpretation of the experimental diffraction pattern. Solution by powder diffraction is extensively applied to small structures, much less to macromolecules. Anyway, in the last 25 years, there has been a growing interest in powder diffraction: innovative theories, methodological approaches, experimental and computational abilities, and advanced software have been developed. Such a progress is also reported in the recent publication of the International Tables for Crystallography, Volume H, Powder Diffraction [1] which covers all the aspects of powder diffraction and is the key reference for all researchers involved in this area. The Tables point out also the important role of powder diffraction in crystal structure determination.
In this scenario, a relevant contribution has come also from the software EXPO [2], which is used for solving structures, organic, inorganic, metal-organic. EXPO is a computer program, born more than 20 years ago as a single-crystal diffraction like software for the ab-initio solution by powder diffraction data and progressively improved by robust theory, methodological approaches, computational and graphical tools. Not negligible is the capacity of the program to carry out all the steps of the powder solution process: determination of unit-cell parameters and space group; extraction of experimental structure factor moduli; solution by Direct Methods and/or Simulated Annealing; refinement by the Rietveld method, editing and visualizing molecules. One or more of these steps can be executed by following standard processes, which are mainly automatic, or non-default approaches whose application is easily guided by the EXPO user-friendly graphic tools. The authors of EXPO are also alert to develop computational methods able to minimize the execution time of the solution process: the solution by Direct Methods is usually performed in only a few minutes; instead the solution by Simulated Annealing can be slower and even requires days in case of quite complex structures. The standard approaches, which are the result of an intensive test work on hundreds of structures already solved and published, of different structure complexity, suggest solution strategies successful in most cases. Several options of non-default procedures are available in case of failure of the default run. This paper is focused on applications of EXPO for the solution in the reciprocal space [3], specifically by Direct Methods (default choice), or in the real space [4], in particular by Simulated Annealing, or by both.
The decision about the best solution strategy mainly depends on data quality, especially overall diffracted intensity, experimental resolution and peak overlap; structure complexity expressed in terms of number of non-hydrogen atoms in the asymmetric unit and/or degrees of freedom of the structure; available information on the expected structure model. In particular, peak overlap [5] is unavoidably present and can cause that the interpretation of a powder diffraction pattern is not straightforward. Altomare et al. [6] proposed a method for evaluating the overlapping degree of a powder diffraction profile, warning that the larger the overlap, the smaller is the number of independent observations with consequences on the rate of success of Direct Methods solution procedures and least-squares refinement processes.
In this paper, we discuss and compare the different conditions requested for a successful solution by Direct Methods and Simulated Annealing, respectively, in EXPO and we present two case studies that clarify the opportunity of using one method rather than the other one and explain the strength of using both, if possible. In particular, we show that we can originally and profitably exploit the structure model obtained at the end of the solution process by Simulated Annealing for improving the solution by Direct Methods and confirming the correctness of the Simulated Annealing model.
2. Solving Structures in the Reciprocal Space by EXPO: Case Studies
Structure solution by X-ray powder diffraction data through reciprocal-space methods [3] is a single-crystal like process. In this perspective, the structure factor moduli are extracted from the experimental diffraction pattern, then Direct Methods, Patterson Methods, Maximum Entropy Methods or Charge Flipping determine the phases of reflections, finally deriving the electron density map. The structure solution process in the reciprocal space by EXPO consists of a very fast sequence of steps: extraction, from the powder profile, of the experimental structure factor moduli through the Le Bail method [7]; progressive use of the moduli by Direct Methods for solving the phase problem and statistically and probabilistically evaluating the phases of structure factors; calculation of the inverse Fourier transform of structure factors so determined in both moduli and phases; interpretation of peak positions and intensities in the electron density map for obtaining the structure model; optimization of the structure model by least-squares-fourier-recycling methods. In addition to the speed, another great advantage of the Direct Methods ab-initio solution is the minimal request of necessary initial information, chemical formula and diffraction pattern only. Moreover, when a chemically plausible structure model is obtained by Direct Methods, its reliability is usually high. The solution by Direct Methods is the automatic choice in EXPO because it is fast and, if successful, reliable.
The attainment of the correct solution by Direct Methods requires conditions that, unfortunately, are not always fulfilled: well estimated structure factors moduli extracted from the diffraction pattern and atomic experimental resolution.
Because of diffraction peak overlap, the accuracy of the extracted moduli is usually poor even if it can be improved by the use of prior information in the Le Bail algorithm [8] in EXPO. Peak overlap can be reduced, but not completely eliminated. In this paragraph we consider the set of 155 test structures, contained in our database of structures already solved (by using different available methods and/or software) and published, on which the capacity of solution by EXPO, by using default and non-default strategies, has been proved. The set is made up by organic, metal-organic, inorganic structures and covers a broad range of research fields. For them, in Table 1, we provide the experimental resolution (RES), the structure complexity defined by the number of non-hydrogen atoms in the asymmetric unit (NA-noH), and the type of data (laboratory X-ray or synchrotron) (see below for the content in the last column). Molecular formula and reference corresponding to each test structure are listed as Supplementary information in Table S1.
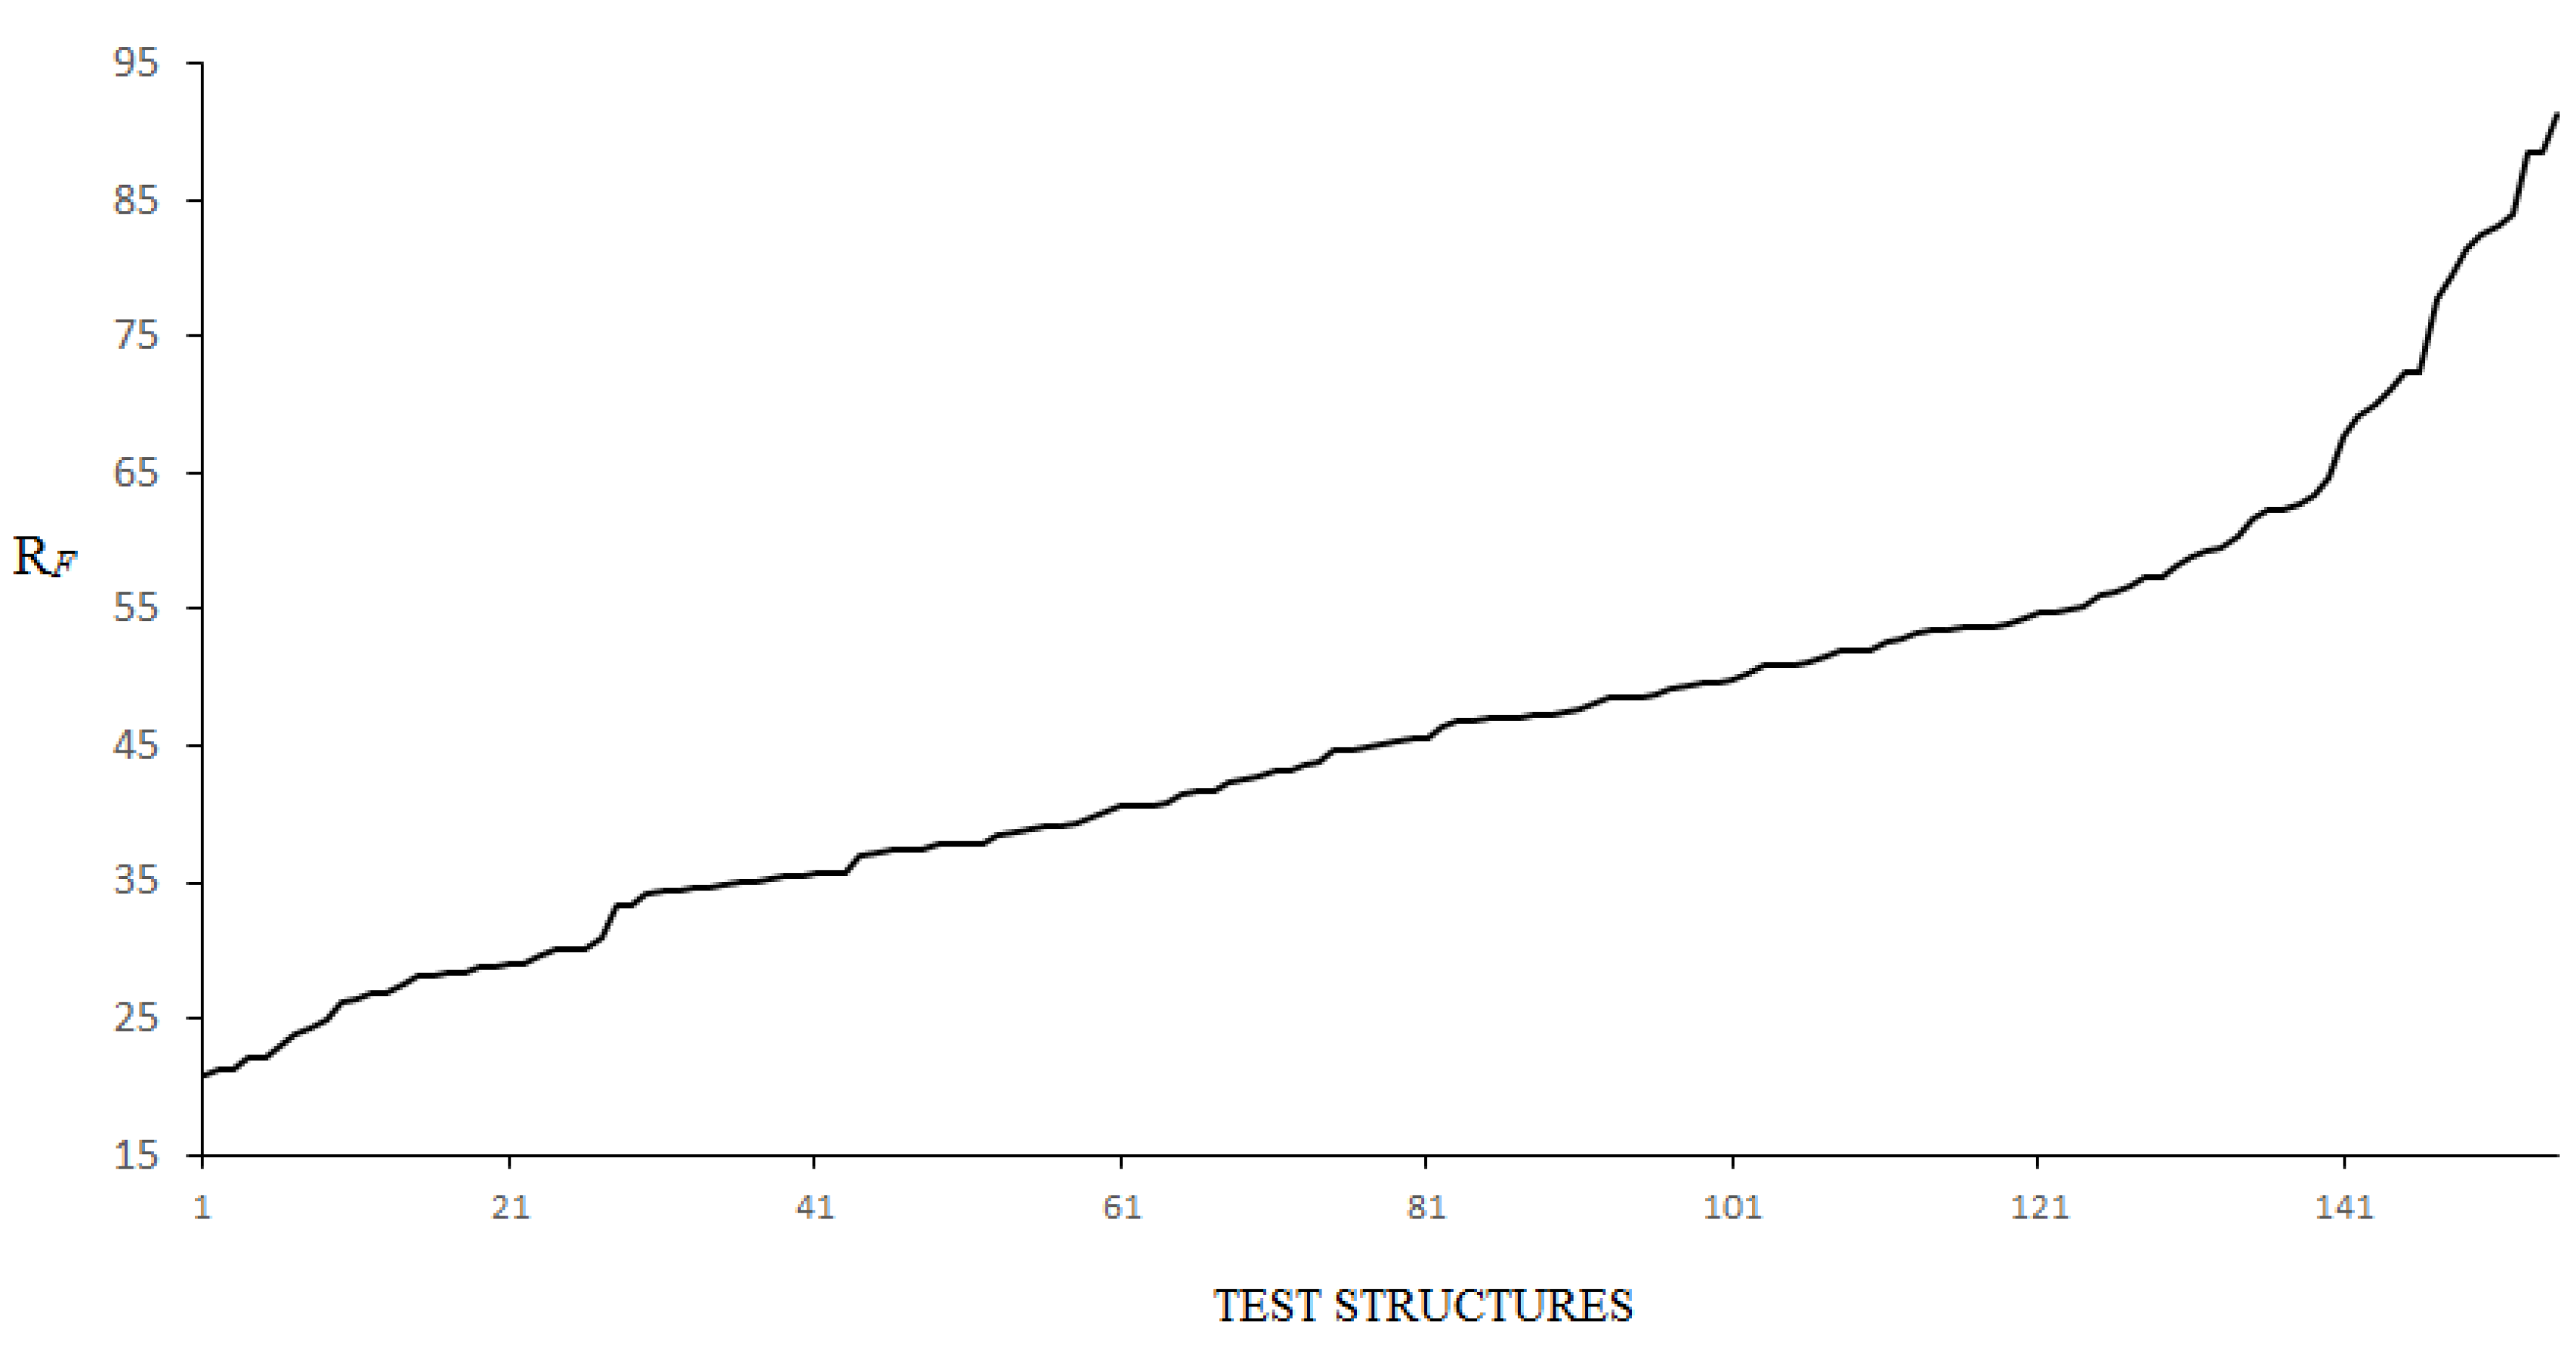
Figure 1 gives details about the errors on the structure factor moduli estimates extracted from the experimental powder diffraction profile: for each test structure reported in Table 1, the ordinate axis displays the corresponding RF reliability parameter (the structures have been ranked by the increasing value of RF),
where the summation is over the number of reflections in the experimental diffraction pattern, is the structure factor modulus corresponding to the h reflection extracted by the Le Bail method in EXPO and is the modulus calculated by the correctly refined model. The RF values, which are calculated in an a-posteriori analysis after that the structures have been solved, reveal that the errors range from 21% to 91% and that very large errors may occur: the percentage of structures with RF > 40% is 62%; 35% with RF > 50%. Such a circumstance clarifies the reasons why the ab-initio solution by powder diffraction is still a challenge.
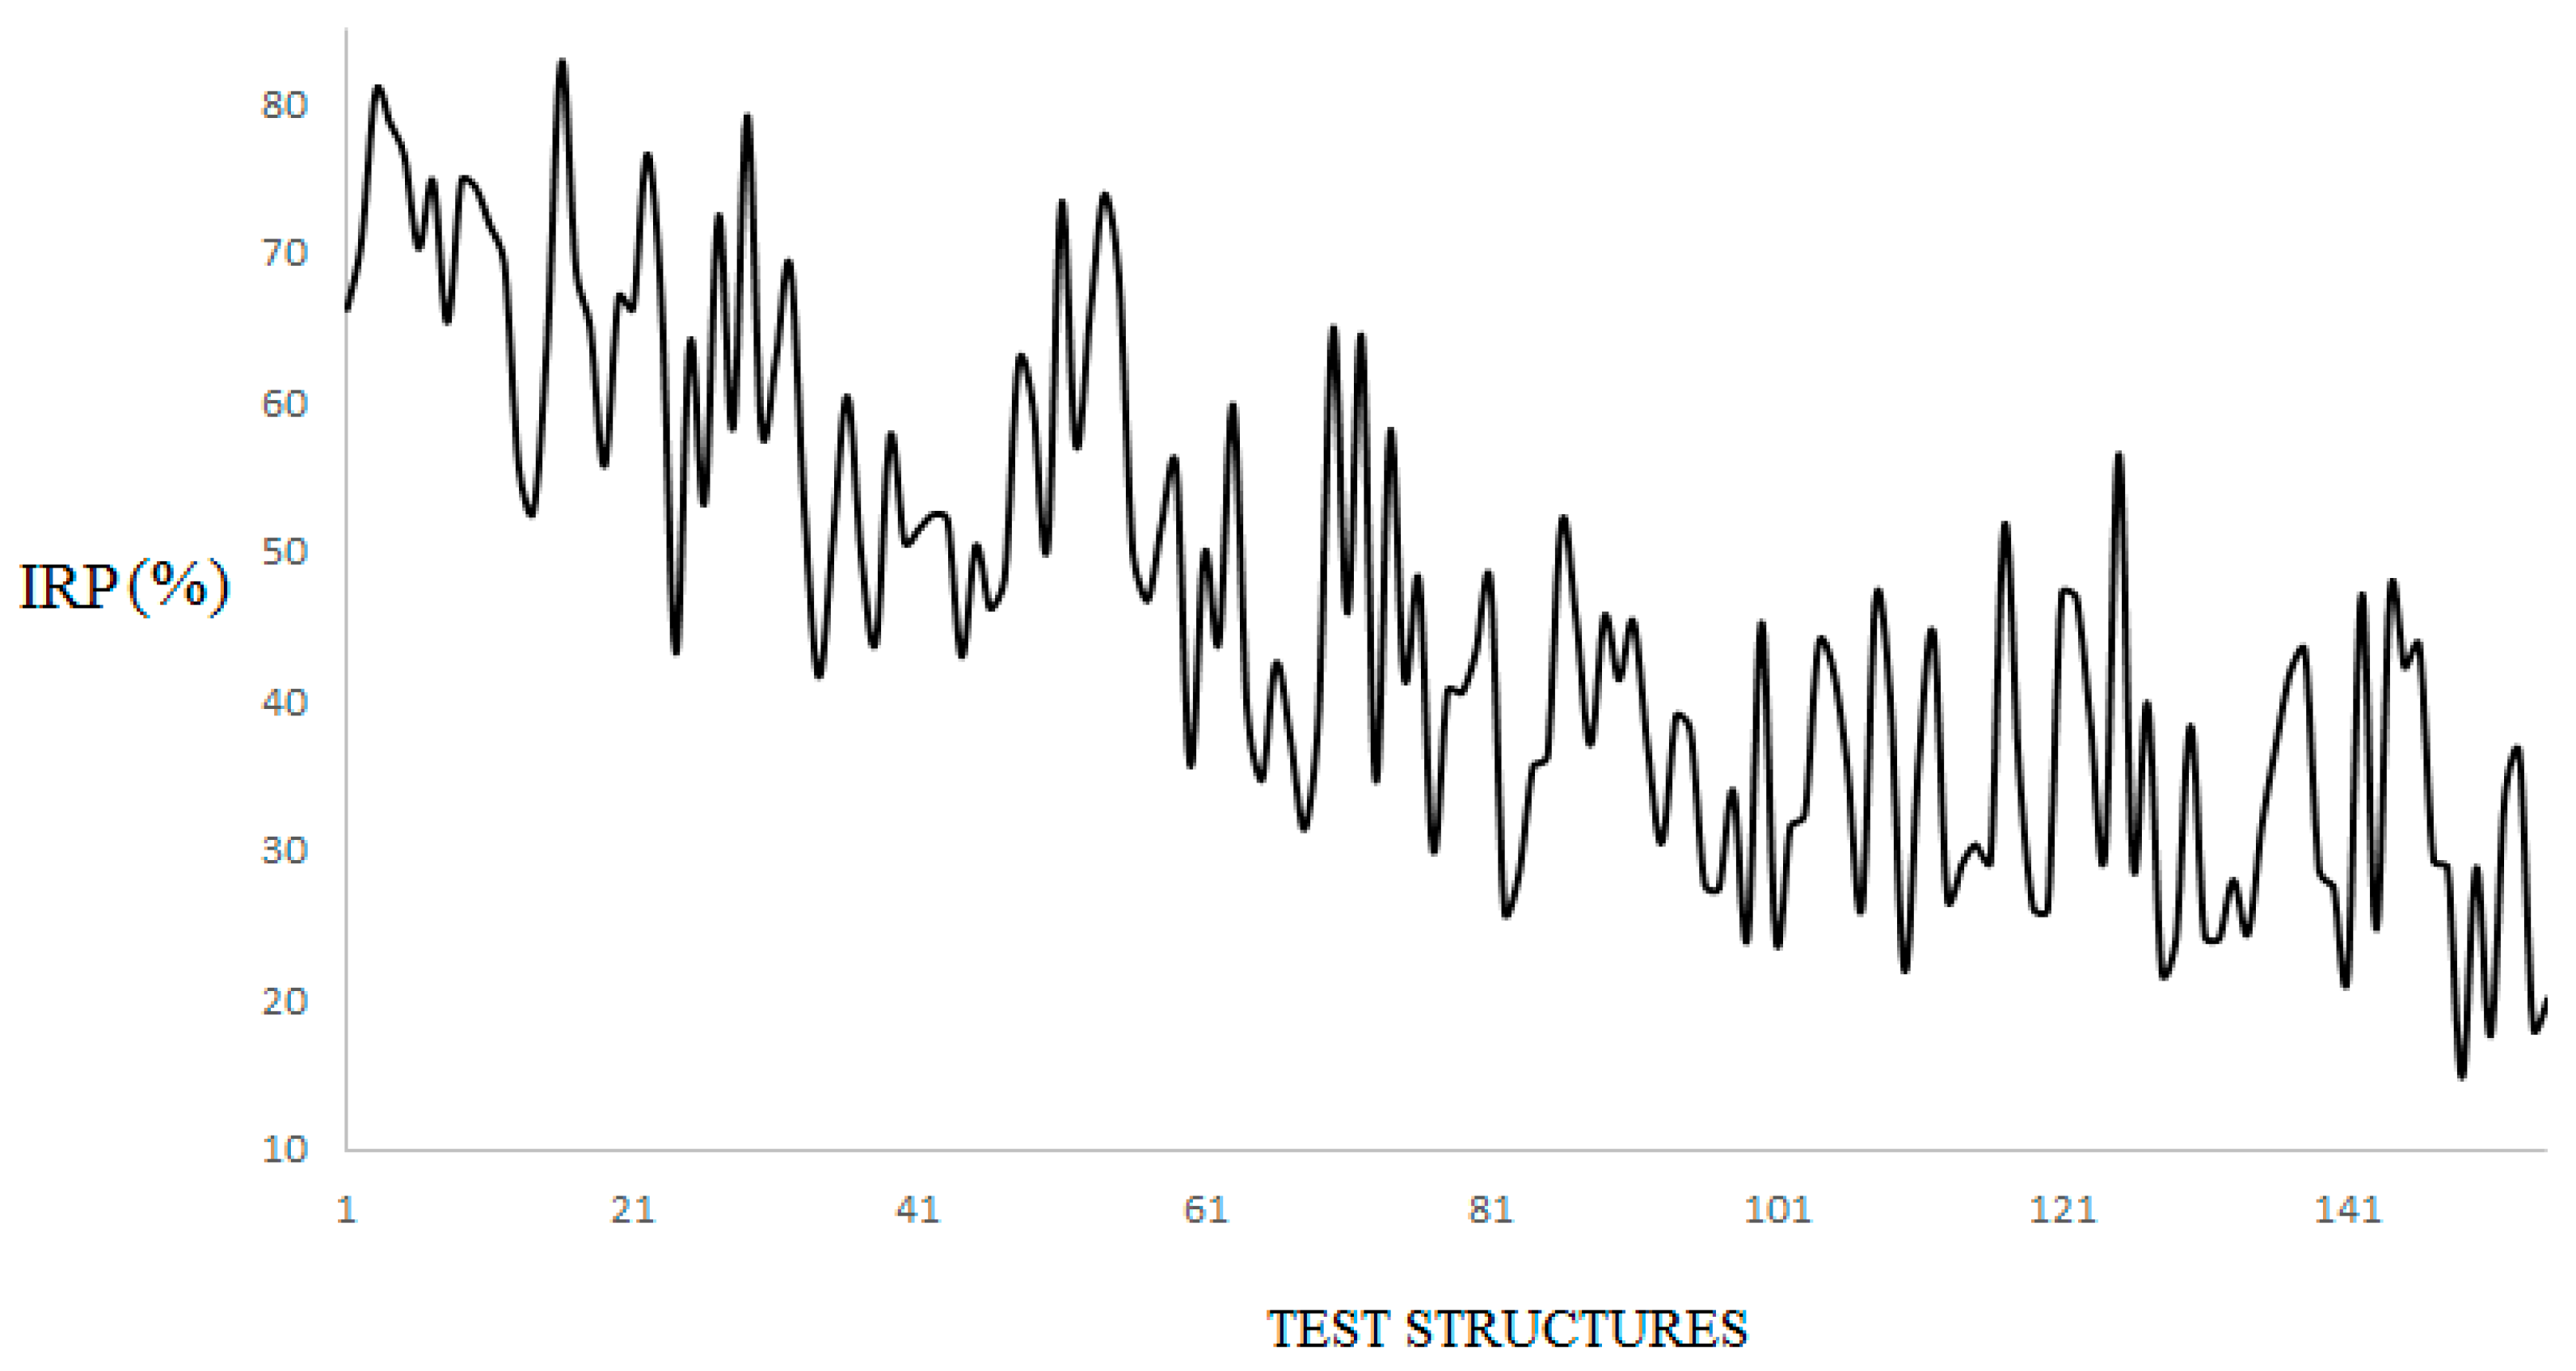
One of the causes of the uncertainties on the experimental structure factor moduli is undoubtedly the peak overlap. It can be useful to quantify the peak overlap extent in a powder diffraction pattern. We developed a method that evaluates the peak overlap degree, specifically the percentage of independent observations in an experimental powder diffraction profile [6]: the larger the overlap, the smaller is the number of independent observations, the smaller the rate of success solution. The percentage value can be used as one of the predictive indications on the success of the solution process by Direct Methods. In Figure 2, the percentage of independent reflections (IRP) is shown for each of the 155 test structures reported in Table 1: in average, IRP decreases as RF increases; the correlation between IRP and RF is −0.75, which indicates the strong relationship between the peak overlap degree and the uncertainties on the structure factor moduli estimates. Only 36% of the reported structures have IRP larger than 50%.
The average values of RF and IRP on synchrotron data structures are 42% and 52% respectively, while the corresponding values on the laboratory X-ray data structures are 47% and 44%.
In the last column of Table 1, the ratio between the number of independent reflections, obtained by multiplying the number of reflections in the experimental pattern (NRexp) by IRP, and NA-noH is supplied (IR/NA-noH). Direct Methods usually require that the number of reflections actively used in the phasing process (NRact) is at least 7 times the number of non-hydrogen atoms in the asymmetric unit to assure a sufficient number of phase relationships and a good quality electron-density map [6]. NRact is usually much smaller than the number of measured reflections: for the test structures in Table 1, 10% < (NRact/NRexp)⋅100 < 46%. This means that when IRP is small the condition requested by Direct Methods is hardly satisfied.
When we are approaching the solution process of a new structure by Direct Methods, a preliminary estimate about the success probability can be useful. The possibility of success increases with increasing IRP and IR/NA-noH, and decreasing RES and NA-noH. According to the analysis on our test structures, Table 2 schematizes the limits, empirically determined, of these conditions for the two extreme cases of high and low success rates, respectively. When a structure does not verify the conditions of high and low success rates, the advice is anyway to attempt the EXPO ab-initio solution process. Structure unsolved by Direct Methods can be successfully solved by real-space methods.
The organic structures are the most resistant to the solution attempts by Direct Methods because the rapid scattering factor decay for light atoms usually limits the experimental resolution and therefore two case studies of organic structures are commented below. They are outside the limits of conditions of both high and low success rate.
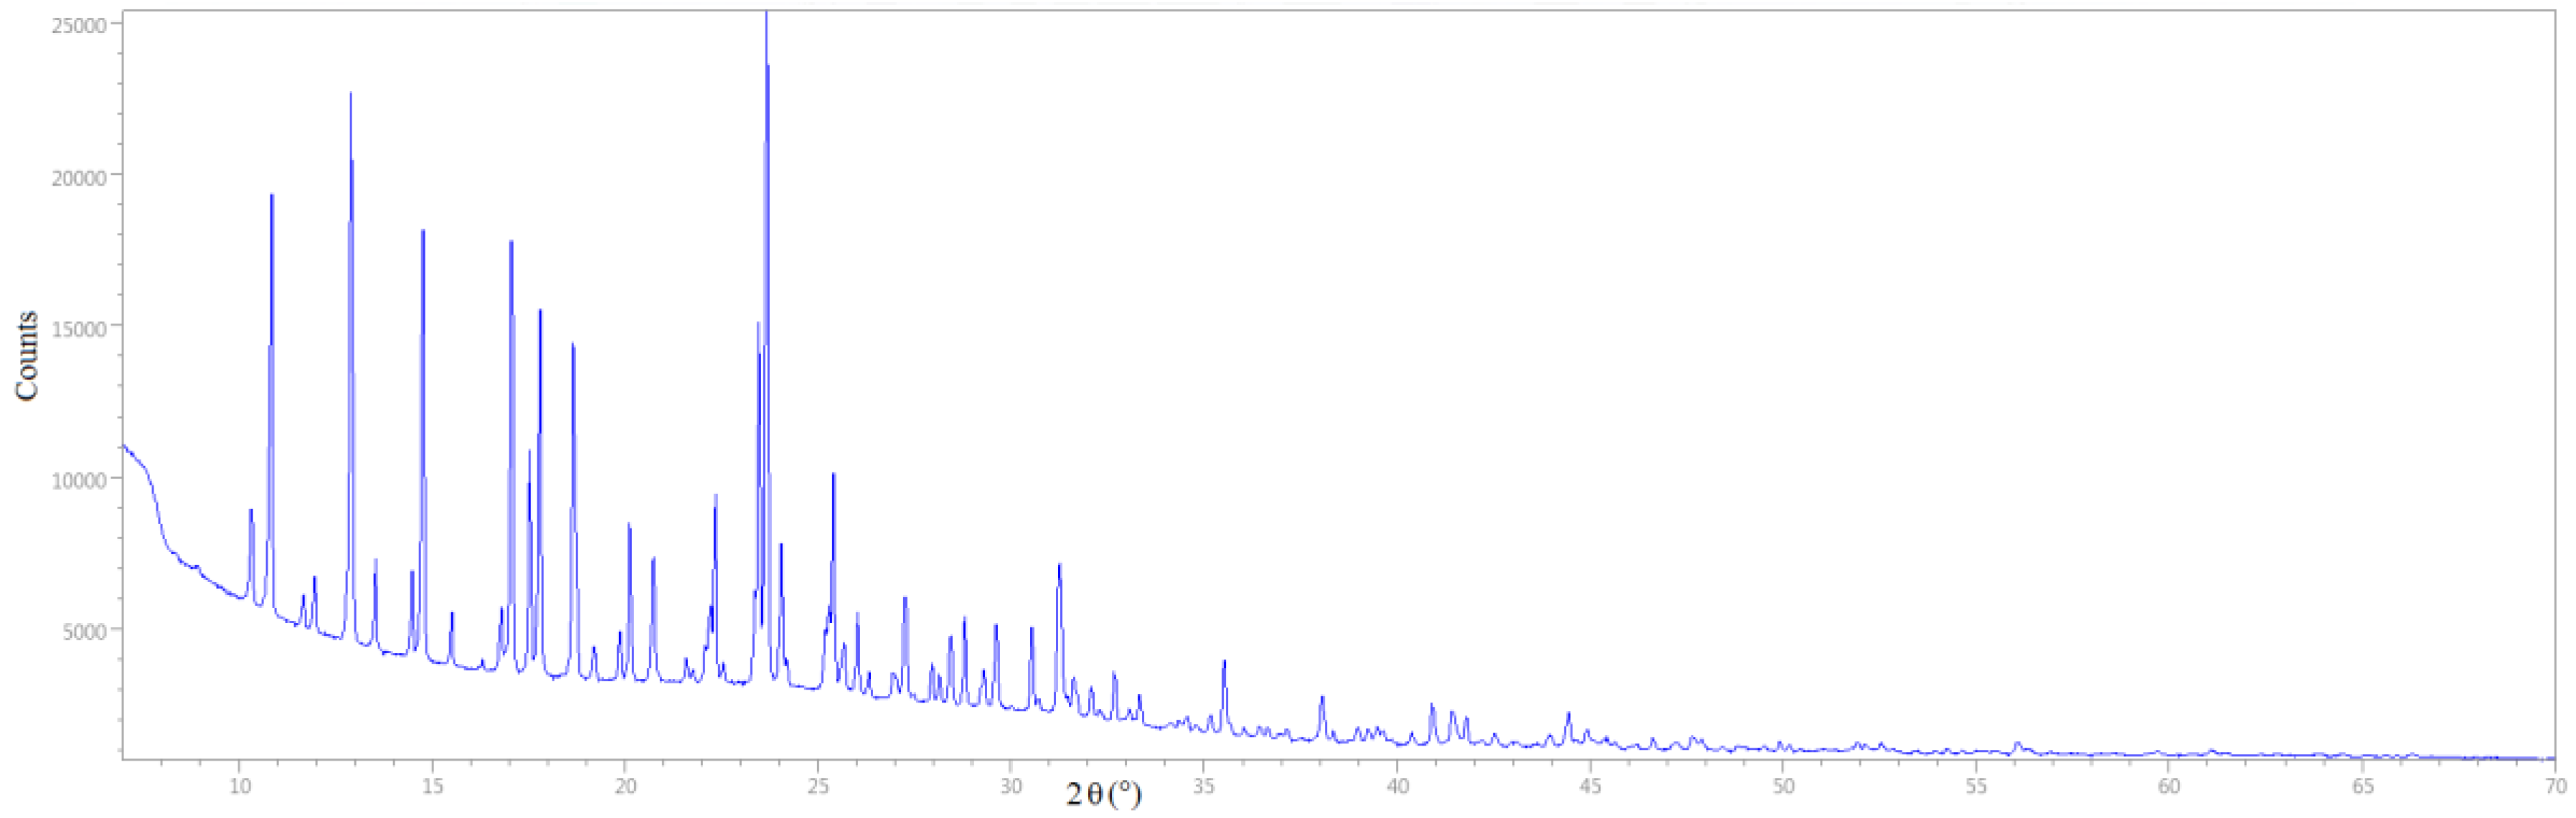
Firstly, we will consider the case of 5-(5-nitro furan-2-ylmethylen), 3-N-(2-methoxy phenyl), 2-N’-(2-methoxyphenyl) imino thiazolidin-4-one compound [9] with chemical formula C22H17O6N3S. X-ray diffraction data, shown in Figure 3, were collected at room temperature (293 K) by using an automated Rigaku RINT2500 laboratory diffractometer (50 KV, 200 mA), equipped with an asymmetric Johansson Ge(111) crystal to select the monochromatic CuKa1 radiation (λ = 1.54056 Å). The silicon strip Rigaku D/teX Ultra detector was used. The measurement was scanned for diffraction angles (2θ) ranging from 7° to 70° with a step size of 0.02° and a time of 6 s/step. The value of RES is 1.34 Å.
The structure has been automatically and successfully indexed by EXPO: triclinic, cell parameters: a = 11.476 Å, b = 10.912 Å, c = 8.809 Å, α = 103.663°, β = 91.490°, γ = 84.140°. Assuming P as space group, NA-noH = 32. The number of reflections in the experimental pattern is 919 and the number of independent reflections (IR) calculated by EXPO according to [6] is 349 (IRP = 38%) with IR/NA-noH of 10.9. With these conditions, the ab-initio solution process by Direct Methods in EXPO is not promising, but can be tried. Anyway, the default run did not provide a feasible solution. Therefore, with the aim of facing the peak overlap problem, possible responsible of failure, a non-default attempt was carried out by using the EXPO strategy based on a random approach in the Le Bail extraction step [10]: a special directive was introduced in the input file for EXPO. The input file of 5-(5-nitro furan-2-ylmethylen), 3-N-(2-methoxy phenyl), 2-N’-(2-methoxyphenyl) imino thiazolidin-4-one compound for EXPO is given as supplementary information in Table S2. We derived a reasonable structure model, but approximate (presence of false atom positions and chemical labels, lowly accurate bond distances and angles) and uncomplete. The model was improved by the application of default [11] and non-default structure model optimization strategies [12] ending to the complete and correct solution. The overall execution time for obtaining the correct Direct Methods solution starting from only the chemical formula and experimental diffraction pattern was about 5 min [Intel(R) Core(TM) i7-4510U CPU @ 2.00 GHz 2.60 GHz]. In an a-posteriori analysis, after that the structure has been solved, we checked, by comparison with the true model, that the error on the structure factor moduli extracted by the Le Bail method is about 46%. The hydrogen atoms were geometrically located in the Direct Methods model by using the tool available in EXPO and then the structure was refined by the Rietveld method (Rp = 2.034, Rwp = 2.777). In Figure 4 the observed, calculated and difference profiles as well as the background are shown.
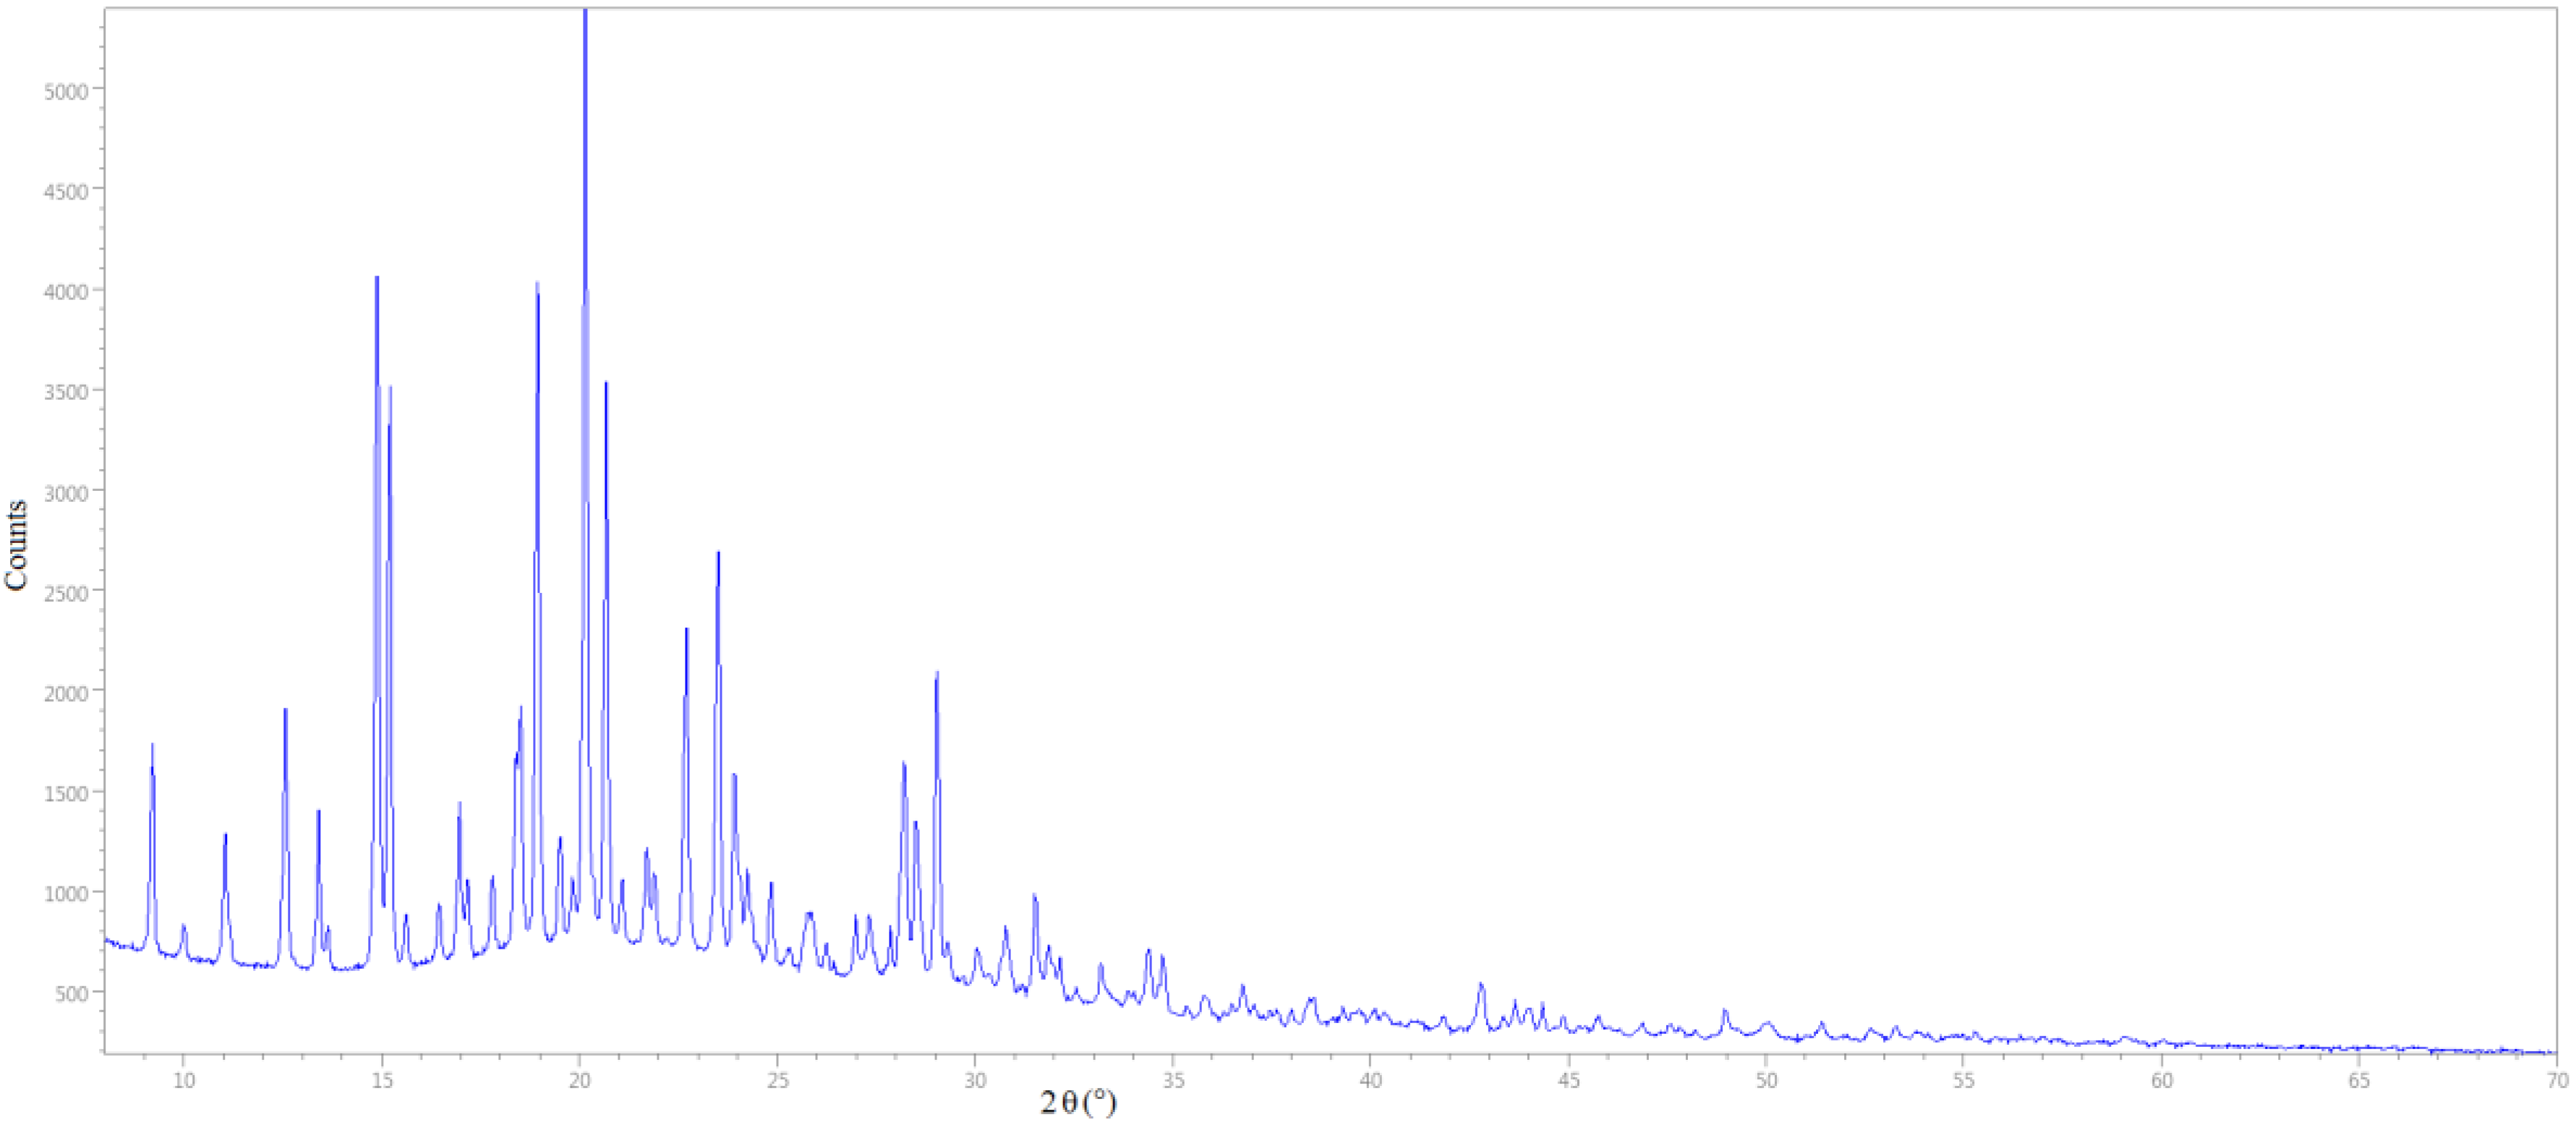
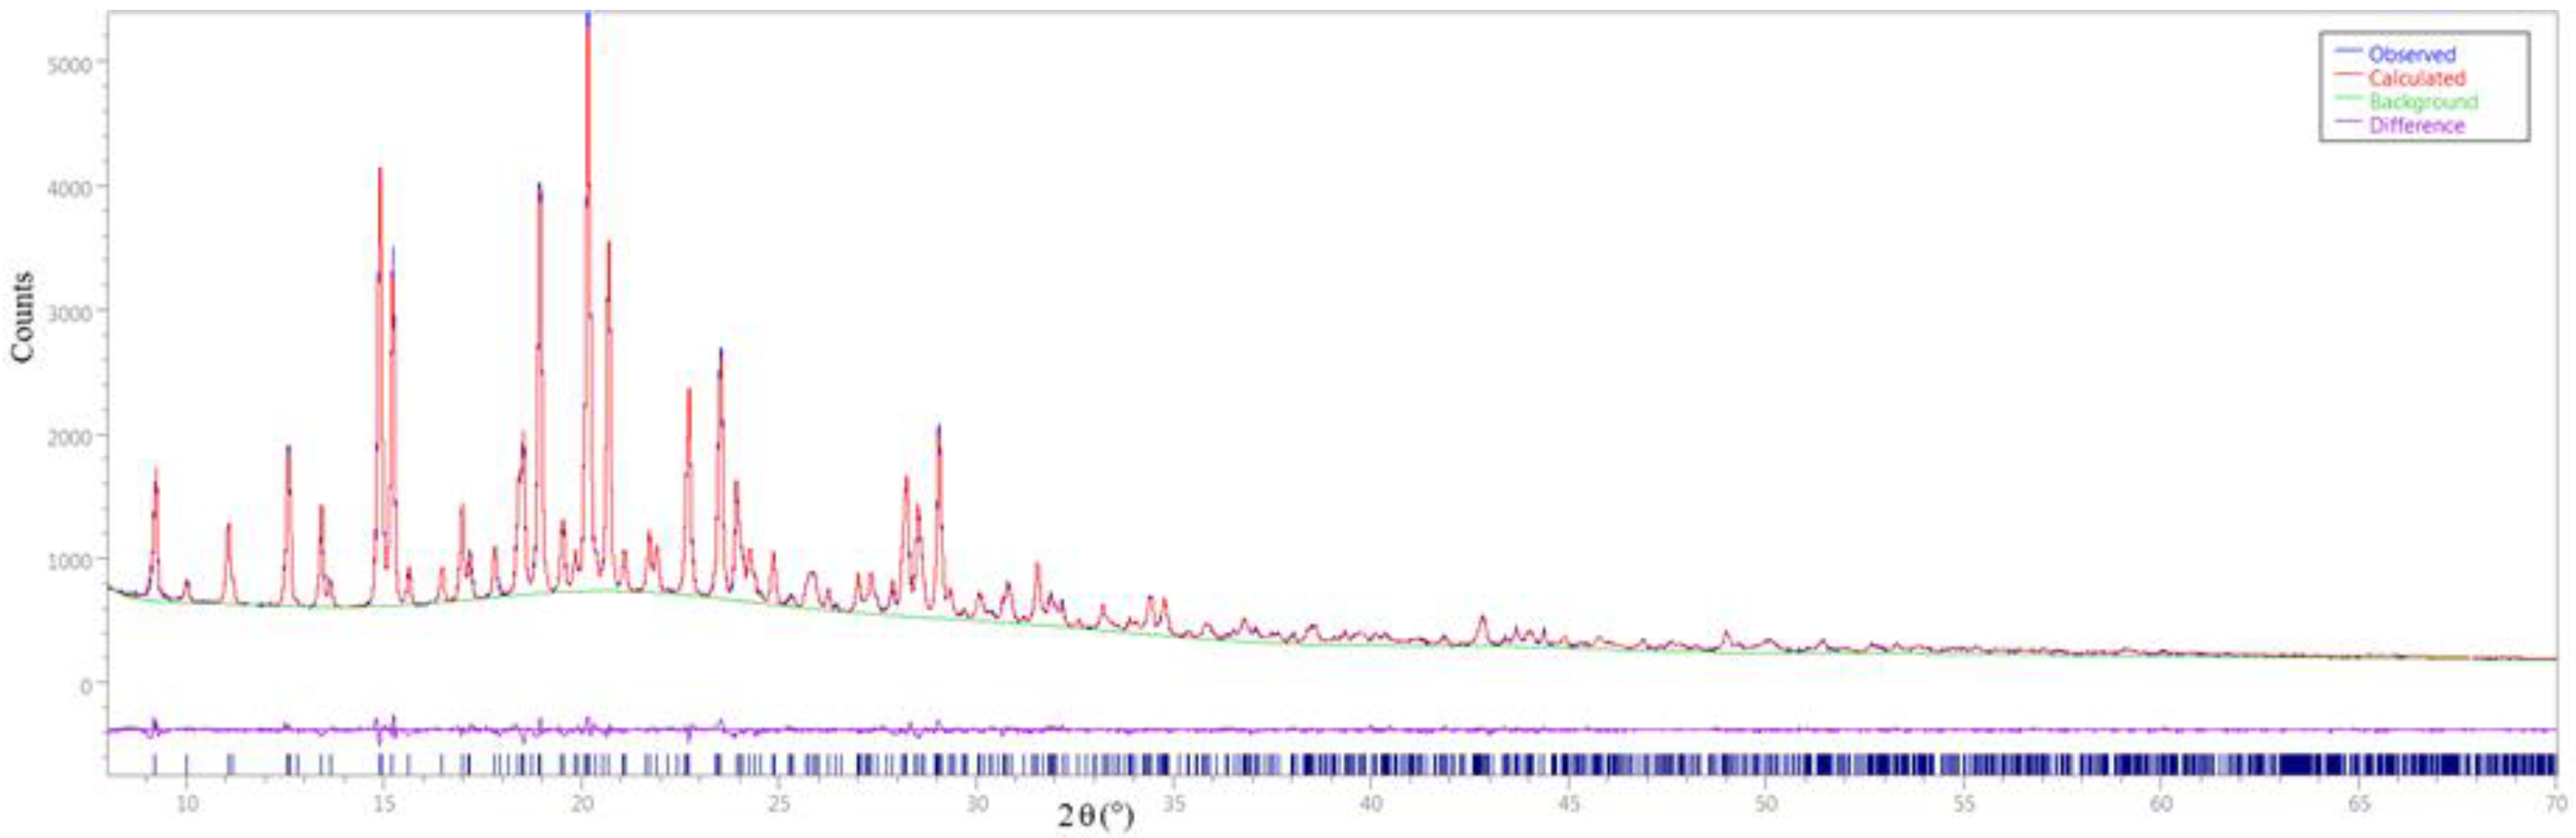
The second case corresponds to 2-(5,6-dimethylimidazo[2,1-b]thiazol-3-yl)-1-morpholinoethanone compound with chemical formula C13H17N3O2S (shorthand code MORPHOLIN), Z’ = 2, solved by single-crystal diffraction data [13]. X-ray powder diffraction data, shown in Figure 5, were collected at room temperature (293 K) by using an automated Rigaku RINT2500 laboratory diffractometer (50 KV, 200 mA), equipped with an asymmetric Johansson Ge(111) crystal to select the monochromatic CuKa1 radiation (λ = 1.54056 Å). The silicon strip Rigaku D/teX Ultra detector was used. The measurement was scanned for diffraction angles (2θ) ranging from 8° to 70° with a step size of 0.02° and a time of 6 s/step. The value of RES is 1.34 Å.
The cell parameters and the space group have been automatically and successfully determined by EXPO: monoclinic with cell parameters: a = 14.237 Å, b = 19.197 Å, c = 10.085 Å, β = 99.082°; space group P21/c. NA-noH is 38. The number of reflections in the experimental pattern is 1175 and the number of independent reflections (IR) calculated by EXPO is 331 (IRP = 28%) with IR/NA-noH equal to 8.7. Trials to solve the structure by Direct Methods in EXPO using default and non-default strategies were unsuccessful so we decided to solve the structure in the real space. In an a-posteriori analysis, we verified that the error on the structure factor moduli extracted by the Le Bail method was nearly 47%.
3. Solving Structures in Real Space by EXPO: A Case Study
Structure solution in the real space [4], developed for overcoming the limits of solution in the reciprocal space, is a valid alternative to Direct Methods especially when structure expected molecular geometry information is available and the solution in the real space can be successfully carried out requiring neither experimental atomic resolution nor extraction of the structure factor moduli. The structure complexity is described by degrees of freedom (DoFs) corresponding to the external DoFs of position (3 DoFs) and orientation (3 DoFs) of each structure fragment in the expected model, and to the internal DoFs of torsion angles. Countless variations of DoFs are randomly generated and the corresponding cost function (CF) values are monitored. CF depends on the agreement between the observed and calculated diffraction profiles. Global optimization methods are used to reach the global minimum of CF, which should correspond to the best real-space solution, possibly the correct structure. The efficiency of the real-space solution process depends on the discrepancy between the starting bond distance and bond angle values respect to the correct parameters and the number of DoFs. The execution time, which is usually longer than for the reciprocal-space solution case, mainly depends on the skill of building up the appropriate starting model, on the number of DoFs and on symmetry. In our experience, structures containing only one fragment with number of internal DoFs up to 7 are usually easily solved. For more complex structures, it can be effective to use fast computer and parallel version software.
The solution in the real space by EXPO searches the global minimum of CF by Simulated Annealing (SA) which has been suitably modified for improving efficiency and reducing execution time [14,15]. The CF function used in EXPO is Rwp [2].
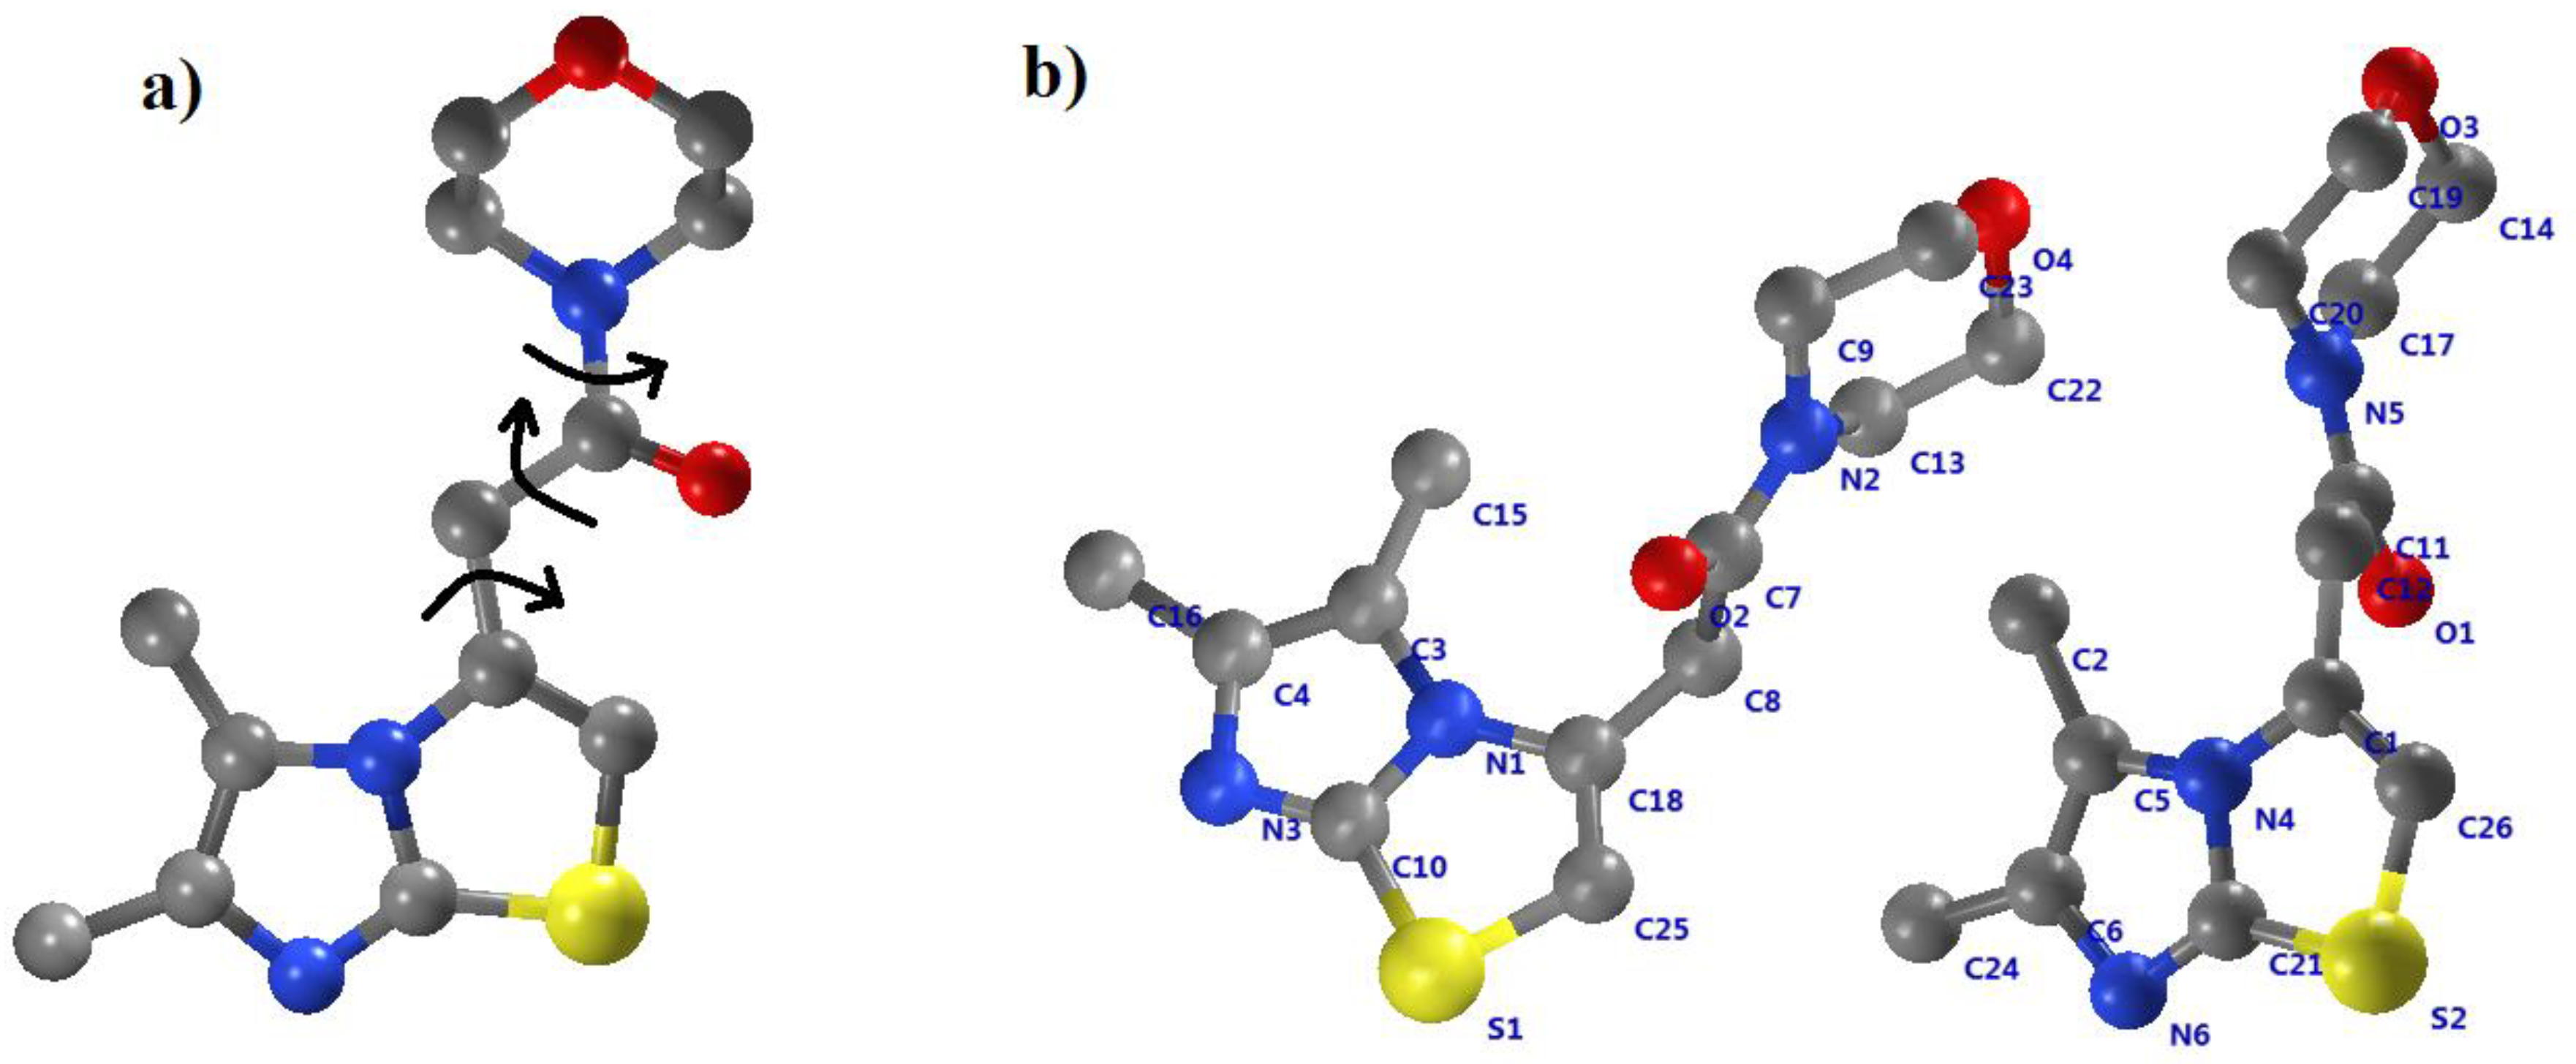
MORPHOLIN compound has been solved by SA in EXPO: the hydrogen atoms have been neglected. Eliminating the H atoms, which do not contribute significantly to X-ray diffraction, effectively decreases the time to evaluate CF for each trial structure. The angular range 8°< 2θ < 45.30° was used (RES = 2.0 Å). The starting expected model of the title compound was assembled using the sketching facilities of ACD/ChemSketch [16] and the geometry was optimized by using MOPAC [17], which was run, by using EXPO graphical interface. Two molecules were positioned into the unit cell. In Figure 6, the starting model (Figure 6a) obtained by MOPAC and the SA solution (Figure 6b) are shown.
A total of 18 DoFs (12 external and 6 torsion angles for the two molecules) were optimized by EXPO during the SA minimization process. No feasible solution was obtained in a default run (20 times). The global optimization algorithm was run, in a non-standard way, by 100 times under Linux workstation. The number of iterations was increased (niter directive set to 2000 in the EXPO input file) to achieve the optimal crystal structure with a reasonable success rate. The overall time spent on the calculation was about 277 hours (Intel(R) Xeon(R) CPU E5-2690 @ 2.90GHz). The structure of the best solution with the lowest profile cost function (Rwp = 7.34) was selected. The root mean square displacement calculated for all non-H atoms after the overlay upon structure solution obtained by single-crystal data [13] was 0.0436 Å. The hydrogen atoms were geometrically located by using the tool available in EXPO and then the structure was refined by the Rietveld method (Rp = 1.625, Rwp = 2.11). In Figure 7 the observed, calculated and difference profiles as well as the background are shown.
4. Solving Structures in Both Real Space and Reciprocal Space by EXPO for Solution Validation
After that a feasible solution has been attained in the real space, we can go back to the reciprocal space for confirming the SA solution also in the reciprocal space: such an occurrence strengthens the reliability of the SA model, which can be then moved to the final structure refinement step. In EXPO, the information derived in the real space can be suitably exploited in the reciprocal space, by the Le Bail method [8], which is used for extracting the structure factor moduli from the experimental diffraction profile. In absence of additional information, that is in a standard way, the Le Bail formula iterates starting arbitrary integrated intensity values and finally estimates the experimental structure factor moduli, whose goodness mainly depends on the peak overlap level in the pattern. By default, the Le Bail algorithm tends to equiportion the intensity of strongly overlapping reflections. On the other hand, the relevant property of the Le Bail method is that it is sensitive to the starting point: it can improve the results when additional information, in some way close to the true structure solution, is used for starting the Le Bail iteration [8]. We can use the SA solution as a-priori information: instead of starting with arbitrary integrated intensity values, the intensities calculated by the SA model are used for activating the Le Bail extraction process. If the calculated intensities are close to the true ones, the error on the extracted moduli is reduced and the probability to solve the structure by Direct Methods is increased.
We adopted this approach with MORPHOLIN and actively used the SA model shown in Figure 6b to derive the starting integrated intensity values to be used in the Le Bail iterations (this can be easily carried out by EXPO by selecting a few graphical steps). The newly extracted structure factor moduli were used for a successive solution step by Direct Methods which provided a feasible solution in about 2 minutes [Intel(R) Core(TM) i7-4510U CPU @ 2.00 GHz 2.60GHz]. The root mean square displacement calculated for all non-H atoms overlaying Direct Methods and SA models was 0.041 Å. It is worth noting that such a result confirms that the SA solution is correct, being able to improve the Le Bail extraction. Indeed, in an a-posteriori analysis, we checked that, by recycling the SA information in the Le Bail method, reduced the error on the extracted moduli from 47% to 36% enabling the correct solution.
The confirmation by Direct Methods is an effective step for validating the solution obtained by Simulated Annealing and moving to the final step of the Rietveld refinement.
5. Conclusions
In the last 25 years, a remarkable progress has been reached in the structure solution process from X-ray powder diffraction data, but the range of success must be still hopefully improved. We can decide to adopt methods applicable in the reciprocal space or, alternatively, in the real space, depending on the limits and performances of the methods related to the available information, the characteristics and the level of complexity of the structure under study.
A great advantage offered by the software EXPO is its applicability in both the reciprocal space and the real space, in particular, by Direct Methods and/or Simulated Annealing. Firstly, the ab-initio solution by Direct Methods, which requires minimal information, would be tested. Several structure model optimization strategies can be applied in EXPO, some of them automatically, some others by user’s request, all well supported by the user-friendly graphic interface. They usually succeed in providing the correct structure solution even starting from a very approximate Direct Methods model. When the reciprocal space solution does not succeed, if the expected geometry of the structure is known, one could try to solve the structure by Simulated Annealing. A feasible successful solution by Simulated Annealing can be exploited for reducing the errors affecting the Direct Methods process and solving also in the reciprocal space. A positive outcome from Direct Methods is an undoubted result on the goodness of the solution derived by Simulated Annealing.
Supplementary Materials
The following are available online at https://0-www-mdpi-com.brum.beds.ac.uk/2073-4352/10/1/16/s1, Table S1: For each test structure: molecular formula and reference, Table S2: The input file of 5-(5-nitro furan-2-ylmethylen), 3-N-(2-methoxy phenyl), 2-N’-(2-methoxyphenyl) imino thiazolidin-4-one compound for EXPO.
Author Contributions
A.A. conceived and designed the main ideas, supervised the whole work and wrote a major part of the text; N.C. and A.F. contributed to the applications section; C.C. designed and realized the structure study in real space; R.R. designed and realized the structure study in reciprocal space. All authors have read and finalized the manuscript.
Acknowledgments
The research work has been supported by the National Research Council of Italy (CNR).
Conflicts of Interest
The authors declare no conflict of interest. The founding sponsors had no role in the design of the study; in the collection, analyses, or interpretation of data; in the writing of the manuscript, and in the decision to publish the results.
References
- Gilmore, C.J.; Kaduk, J.A.; Schenk, H. (Eds.) International Tables for Crystallography, Volume H, Powder Diffraction; Wiley: New York, NY, USA, 2019; ISBN 978-1-118-41628-0. [Google Scholar]
- Altomare, A.; Cuocci, C.; Giacovazzo, C.; Moliterni, A.; Rizzi, R.; Corriero, N.; Falcicchio, A. EXPO2013: A kit of tools for phasing crystal structures from powder data. J. Appl. Cryst. 2013, 46, 1231–1235. [Google Scholar] [CrossRef]
- Altomare, A.; Cuocci, C.; Moliterni, A.; Rizzi, R. Solving crystal structures using reciprocal-space methods. In International Tables for Crystallography, Volume H, Powder Diffraction; Gilmore, C.J., Kaduk, J.A., Schenk, H., Eds.; Wiley: New York, NY, USA, 2019; pp. 395–413. [Google Scholar] [CrossRef]
- David, W.I.F. Real-space methods for structure solution from powder-diffraction data: Application to molecular structures. In International Tables for Crystallography, Volume H, Powder Diffraction; Gilmore, C.J., Kaduk, J.A., Schenk, H., Eds.; Wiley: New York, NY, USA, 2019; pp. 414–432. [Google Scholar] [CrossRef]
- Dinnebier, R.E.; Billinge, S.J.L. Overview and principles of powder diffraction. In International Tables for Crystallography, Volume H, Powder Diffraction; Gilmore, C.J., Kaduk, J.A., Schenk, H., Eds.; Wiley: New York, NY, USA, 2019; pp. 2–23. [Google Scholar] [CrossRef]
- Altomare, A.; Cascarano, G.; Giacovazzo, C.; Guagliardi, A.; Moliterni, A.G.G.; Burla, M.C.; Polidori, G. On the Number of Statistically Independent Observations in a Powder Diffraction Pattern. J. Appl. Cryst. 1995, 28, 738–744. [Google Scholar] [CrossRef]
- Le Bail, A.; Duroy, H.; Fourquet, J.L. Ab-initio structure determination of LiSbWO6 by X-ray powder diffraction. Math. Res. Bull. 1988, 23, 447–452. [Google Scholar] [CrossRef]
- Altomare, A.; Carrozzini, B.; Giacovazzo, C.; Guagliardi, A.; Moliterni, A.G.G.; Rizzi, R. Solving Crystal Structures from Powder Data. I. The Role of the Prior Information in the Two-Stage Method. J. Appl. Cryst. 1996, 29, 667–673. [Google Scholar] [CrossRef]
- Rahmani, R.; Djafri, A.; Chouaih, A.; Djafri, A.; Hamzaoui, F.; Rizzi, R.; Altomare, A. Synthesis, molecular and solid state structure of 5-(5-nitro furan-2- ylmethylen), 3-N-(2-methoxy phenyl), 2-N’-(2-methoxyphenyl) imino thiazolidin-4-one: X-ray powder diffraction and DFT studies. J. Mol. Struct. 2017, 1143, 259–264. [Google Scholar] [CrossRef]
- Altomare, A.; Giacovazzo, C.; Moliterni, A.G.G.; Rizzi, R. A random procedure for the decomposition of a powder pattern in EXPO. J. Appl. Cryst. 2001, 34, 704–709. [Google Scholar] [CrossRef] [Green Version]
- Altomare, A.; Cuocci, C.; Giacovazzo, C.; Moliterni, A.; Rizzi, R. Correcting resolution bias in electron density maps of organic molecules derived by direct methods from powder data. J. Appl. Cryst. 2008, 41, 592–599. [Google Scholar] [CrossRef]
- Altomare, A.; Cuocci, C.; Giacovazzo, C.; Moliterni, A.; Rizzi, R. COVMAP: A new algorithm for structure model optimization in the EXPO package. J. Appl. Cryst. 2012, 45, 789–797. [Google Scholar] [CrossRef]
- Veltri, L.; Mancuso, R.; Altomare, A.; Gabriele, B. Divergent Multicomponent Tandem Palladium-Catalyzed Aminocarbonylation-Cyclization Approaches to Functionalized Imidazothiazinones and Imidazothiazoles. ChemCatChem 2015, 7, 2206–2213. [Google Scholar] [CrossRef]
- Altomare, A.; Corriero, N.; Cuocci, C.; Moliterni, A.; Rizzi, R. The Hybrid Big Bang-Bing Crunch method for solving crystal structure from powder diffraction data. J. Appl. Cryst. 2013, 46, 779–787. [Google Scholar] [CrossRef]
- Altomare, A.; Corriero, N.; Cuocci, C.; Falcicchio, A.; Moliterni, A.; Rizzi, R. Direct space solution in the EXPO package: The combination of the HBB-BC algorithm with GRASP. J. Appl. Cryst. 2018, 51, 505–513. [Google Scholar] [CrossRef]
- ACD/ChemSketch. Available online: http://www.acdlabs.com/resources/freeware/chemsketch/ (accessed on 31 October 2019).
- Stewart, J.J.P. MOPAC2016. Stewart Computational Chemistry. MOPAC: Colorado Springs, CO, USA, 2016. Available online: http://OpenMOPAC.net (accessed on 31 October 2019).
Figure 1.
The RF value corresponding to each of the 155 test structures reported in Table 1. The structures have been ranked by the increasing value of RF.
Figure 1.
The RF value corresponding to each of the 155 test structures reported in Table 1. The structures have been ranked by the increasing value of RF.

Figure 2.
The percentage of independent reflections (IRP) value corresponding to each of the 155 test structures reported in Table 1.
Figure 2.
The percentage of independent reflections (IRP) value corresponding to each of the 155 test structures reported in Table 1.

Figure 3.
Experimental X-ray diffraction pattern of C22H17O6N3S.

Figure 4.
The result of the Rietveld refinement of 5-(5-nitro furan-2-ylmethylen), 3-N-(2-methoxy phenyl), 2-N’-(2-methoxyphenyl) imino thiazolidin-4-one compound by EXPO: the observed profile (blue line), calculated profile (red line), background (green line) and difference profile (purple line) are shown.

Figure 5.
Experimental X-ray diffraction pattern of C13H17N3O2S.

Figure 6.
2-(5,6-dimethylimidazo[2,1-b]thiazol-3-yl)-1-morpholinoethanone (chemical formula C13H17N3O2S (hydrogen atoms are not considered)): (a) the starting model used in the Simulated Annealing (SA) solution process in EXPO; (b) the SA solution.
Figure 6.
2-(5,6-dimethylimidazo[2,1-b]thiazol-3-yl)-1-morpholinoethanone (chemical formula C13H17N3O2S (hydrogen atoms are not considered)): (a) the starting model used in the Simulated Annealing (SA) solution process in EXPO; (b) the SA solution.

Figure 7.
The result of the Rietveld refinement of MORPHOLIN by EXPO: observed profile (blue line), calculated profile (red line), background (green line) and difference profile (purple line) are shown.
Figure 7.
The result of the Rietveld refinement of MORPHOLIN by EXPO: observed profile (blue line), calculated profile (red line), background (green line) and difference profile (purple line) are shown.


Table 1.
For each of the 155 test structures, experimental resolution (RES); number of non-hydrogen atoms in the asymmetric unit (NA-noH); type of data (laboratory X-ray or synchrotron data); ratio of the number of independent reflections (IR) and NA-noH (IR/NA-noH).
Table 1.
For each of the 155 test structures, experimental resolution (RES); number of non-hydrogen atoms in the asymmetric unit (NA-noH); type of data (laboratory X-ray or synchrotron data); ratio of the number of independent reflections (IR) and NA-noH (IR/NA-noH).
| Test Structure | RES (Å) | NA-noH | Type of Data X: Laboratory X-Ray Data S: Synchrotron Data | IR/NA-noH | Test Structure | RES | NA-noH | Type of Data X: Laboratory X-Ray Data S: Synchrotron Data | IR/NA-noH |
|---|---|---|---|---|---|---|---|---|---|
| 1 | 1.20 | 12 | X | 13.83 | 79 | 0.87 | 21 | S | 34.86 |
| 2 | 1.46 | 22 | X | 11.45 | 80 | 1.01 | 32 | X | 19.56 |
| 3 | 1.43 | 23 | X | 10.09 | 81 | 0.94 | 17 | S | 31.35 |
| 4 | 1.51 | 24 | S | 8.88 | 82 | 1.01 | 33 | S | 10.27 |
| 5 | 1.82 | 20 | X | 4.65 | 83 | 1.34 | 38 | X | 8.79 |
| 6 | 2.16 | 30 | X | 3.83 | 84 | 1.17 | 25 | X | 18.88 |
| 7 | 1.14 | 6 | S | 19.00 | 85 | 1.14 | 15 | X | 18.40 |
| 8 | 1.43 | 17 | X | 10.59 | 86 | 1.14 | 6 | X | 24.33 |
| 9 | 0.59 | 3 | S | 195.60 | 87 | 1.45 | 12 | X | 9.25 |
| 10 | 0.93 | 4 | S | 64.00 | 88 | 1.09 | 15 | X | 19.33 |
| 11 | 1.43 | 11 | X | 17.45 | 89 | 1.14 | 2 | X | 24.00 |
| 12 | 1.20 | 12 | X | 14.00 | 90 | 1.00 | 7 | X | 35.57 |
| 13 | 0.75 | 3 | X | 71.60 | 91 | 1.25 | 35 | X | 15.83 |
| 14 | 1.43 | 18 | X | 8.33 | 92 | 1.01 | 17 | S | 25.39 |
| 15 | 1.52 | 15 | X | 13.47 | 93 | 1.28 | 28 | X | 8.75 |
| 16 | 1.07 | 6 | S | 59.59 | 94 | 1.37 | 20 | X | 10.95 |
| 17 | 1.53 | 10 | X | 15.00 | 95 | 1.43 | 23 | X | 10.36 |
| 18 | 1.43 | 10 | X | 15.90 | 96 | 1.82 | 55 | X | 3.25 |
| 19 | 1.43 | 18 | X | 12.94 | 97 | 1.36 | 44 | X | 8.27 |
| 20 | 1.43 | 7 | X | 18.43 | 98 | 1.34 | 33 | X | 5.67 |
| 21 | 1.43 | 14 | X | 11.86 | 99 | 0.67 | 11 | X | 41.64 |
| 22 | 1.34 | 10 | S | 14.00 | 100 | 1.09 | 21 | X | 23.43 |
| 23 | 1.43 | 10 | X | 17.60 | 101 | 0.97 | 23 | X | 14.13 |
| 24 | 1.07 | 25 | S | 13.60 | 102 | 1.39 | 31 | X | 8.90 |
| 25 | 1.13 | 17 | S | 34.82 | 103 | 1.09 | 23 | X | 19.13 |
| 26 | 1.09 | 9 | X | 35.11 | 104 | 1.13 | 6 | S | 23.67 |
| 27 | 1.08 | 9 | S | 23.78 | 105 | 1.34 | 15 | X | 13.33 |
| 28 | 1.07 | 12 | X | 26.17 | 106 | 0.89 | 31 | X | 20.39 |
| 29 | 1.82 | 24 | X | 4.79 | 107 | 1.01 | 33 | S | 10.36 |
| 30 | 0.75 | 3 | X | 54.15 | 108 | 1.54 | 40 | X | 5.10 |
| 31 | 1.43 | 10 | X | 16.20 | 109 | 1.34 | 29 | X | 6.10 |
| 32 | 2.69 | 33 | X | 2.21 | 110 | 0.82 | 19 | X | 13.58 |
| 33 | 1.43 | 30 | X | 8.87 | 111 | 1.30 | 42 | X | 12.69 |
| 34 | 0.80 | 18 | S | 26.56 | 112 | 1.00 | 19 | X | 35.68 |
| 35 | 1.20 | 12 | X | 19.42 | 113 | 1.34 | 35 | X | 8.89 |
| 36 | 1.04 | 16 | X | 19.56 | 114 | 1.18 | 32 | S | 11.22 |
| 37 | 0.75 | 3 | X | 77.00 | 115 | 1.09 | 17 | X | 19.47 |
| 38 | 1.20 | 23 | X | 19.39 | 116 | 1.34 | 33 | X | 7.91 |
| 39 | 0.95 | 20 | S | 49.85 | 117 | 0.86 | 9 | S | 50.56 |
| 40 | 1.43 | 22 | X | 11.27 | 118 | 1.01 | 18 | X | 22.63 |
| 41 | 1.55 | 37 | X | 9.51 | 119 | 1.09 | 18 | X | 14.89 |
| 42 | 1.54 | 30 | X | 10.37 | 120 | 1.42 | 37 | X | 6.38 |
| 43 | 1.79 | 29 | X | 7.52 | 121 | 1.43 | 22 | X | 10.68 |
| 44 | 1.20 | 24 | X | 9.54 | 122 | 0.83 | 17 | S | 43.41 |
| 45 | 1.43 | 17 | X | 6.76 | 123 | 0.95 | 21 | S | 36.57 |
| 46 | 1.43 | 17 | X | 13.18 | 124 | 1.01 | 33 | X | 11.94 |
| 47 | 1.18 | 44 | S | 9.93 | 125 | 1.39 | 17 | X | 11.59 |
| 48 | 1.50 | 15 | S | 15.87 | 126 | 1.27 | 29 | X | 8.72 |
| 49 | 1.00 | 13 | S | 37.00 | 127 | 0.97 | 6 | X | 32.33 |
| 50 | 1.20 | 12 | X | 18.42 | 128 | 0.77 | 22 | S | 23.14 |
| 51 | 0.59 | 3 | X | 217.33 | 129 | 1.20 | 45 | X | 12.00 |
| 52 | 1.46 | 20 | X | 15.60 | 130 | 1.74 | 28 | S | 6.25 |
| 53 | 0.59 | 3 | X | 124.92 | 131 | 1.31 | 30 | X | 7.37 |
| 54 | 1.32 | 14 | S | 15.36 | 132 | 1.09 | 16 | X | 16.63 |
| 55 | 0.94 | 8 | X | 32.00 | 133 | 1.36 | 77 | X | 7.97 |
| 56 | 1.43 | 21 | X | 13.56 | 134 | 0.91 | 16 | X | 26.00 |
| 57 | 1.25 | 23 | S | 20.00 | 135 | 0.81 | 13 | X | 37.15 |
| 58 | 1.34 | 20 | X | 7.55 | 136 | 1.51 | 48 | S | 7.38 |
| 59 | 1.20 | 12 | X | 20.17 | 137 | 1.00 | 13 | X | 29.00 |
| 60 | 0.64 | 5 | S | 36.80 | 138 | 1.43 | 29 | X | 10.21 |
| 61 | 1.09 | 12 | S | 30.67 | 139 | 0.99 | 27 | X | 13.48 |
| 62 | 1.43 | 23 | X | 12.57 | 140 | 1.20 | 34 | X | 12.00 |
| 63 | 1.16 | 18 | S | 21.72 | 141 | 0.97 | 19 | X | 19.05 |
| 64 | 1.67 | 66 | S | 3.45 | 142 | 1.34 | 14 | X | 15.43 |
| 65 | 1.20 | 35 | X | 16.14 | 143 | 1.00 | 17 | X | 19.82 |
| 66 | 1.43 | 26 | X | 11.08 | 144 | 1.10 | 13 | X | 26.77 |
| 67 | 1.34 | 14 | X | 11.93 | 145 | 1.17 | 32 | X | 15.59 |
| 68 | 1.34 | 46 | X | 4.26 | 146 | 1.08 | 13 | S | 42.05 |
| 69 | 0.91 | 15 | X | 30.69 | 147 | 0.99 | 7 | X | 19.38 |
| 70 | 1.01 | 14 | S | 41.64 | 148 | 1.07 | 26 | X | 14.04 |
| 71 | 0.89 | 28 | X | 20.00 | 149 | 0.99 | 30 | X | 8.93 |
| 72 | 2.64 | 28 | X | 2.18 | 150 | 0.98 | 28 | X | 16.75 |
| 73 | 1.43 | 34 | X | 9.97 | 151 | 0.99 | 28 | X | 10.64 |
| 74 | 0.87 | 6 | S | 60.67 | 152 | 1.07 | 30 | X | 15.20 |
| 75 | 1.34 | 29 | X | 10.52 | 153 | 1.07 | 30 | X | 17.57 |
| 76 | 1.43 | 17 | X | 13.12 | 154 | 0.98 | 30 | X | 10.50 |
| 77 | 1.09 | 33 | X | 19.30 | 155 | 0.81 | 13 | X | 26.54 |
| 78 | 1.20 | 18 | X | 16.00 |
Table 2.
Conditions for high and low success rates of structure solutions by Direct Methods.
| High Success Rate by Direct Methods | Low Success Rate by Direct Methods |
|---|---|
| IRP > 60% and RES < 1.2Å and NA-noH < 30 and IR/NA-noH > 15 | IRP < 50% and RES > 1.5Å and NA-noH > 35 and IR/NA-noH < 9 |
© 2019 by the authors. Licensee MDPI, Basel, Switzerland. This article is an open access article distributed under the terms and conditions of the Creative Commons Attribution (CC BY) license (http://creativecommons.org/licenses/by/4.0/).
Share and Cite
MDPI and ACS Style
Altomare, A.; Corriero, N.; Cuocci, C.; Falcicchio, A.; Rizzi, R. Solving a Structure in the Reciprocal Space, Real Space and Both by Using the EXPO Software. Crystals 2020, 10, 16. https://0-doi-org.brum.beds.ac.uk/10.3390/cryst10010016
AMA Style
Altomare A, Corriero N, Cuocci C, Falcicchio A, Rizzi R. Solving a Structure in the Reciprocal Space, Real Space and Both by Using the EXPO Software. Crystals. 2020; 10(1):16. https://0-doi-org.brum.beds.ac.uk/10.3390/cryst10010016
Chicago/Turabian StyleAltomare, Angela, Nicola Corriero, Corrado Cuocci, Aurelia Falcicchio, and Rosanna Rizzi. 2020. "Solving a Structure in the Reciprocal Space, Real Space and Both by Using the EXPO Software" Crystals 10, no. 1: 16. https://0-doi-org.brum.beds.ac.uk/10.3390/cryst10010016
Note that from the first issue of 2016, this journal uses article numbers instead of page numbers. See further details here.