Freeze Concentration of Aqueous [DBNH][OAc] Ionic Liquid Solution


1
Department of Chemical and Metallurgical Engineering, School of Chemical Engineering, Aalto University, P.O. Box 16100, FI-00076 Aalto, Finland
2
Max Planck Institute for Dynamics of Complex Technical Systems, Sandtorstrasse 1, 39106 Magdeburg, Germany
*
Author to whom correspondence should be addressed.
Crystals 2020, 10(3), 147; https://0-doi-org.brum.beds.ac.uk/10.3390/cryst10030147
Submission received: 31 January 2020
/
Revised: 22 February 2020
/
Accepted: 24 February 2020
/
Published: 26 February 2020
(This article belongs to the Special Issue Advances in Industrial Crystallization)
Abstract
:In the present work, freeze crystallization studies, as a novel concentration method for aqueous 1,5-diazabicyclo[4.3.0]non-5-enium acetate ([DBNH][OAc]) ionic liquid solution, were conducted. In order to find the appropriate temperature and composition range for freeze crystallization, the solid–liquid equilibrium of a binary [DBNH][OAc]–water compound system was investigated with differential scanning calorimetry (DSC). Results of this analysis showed that the melting temperature of the pure ionic liquid was 58 ℃, whereas the eutectic temperature of the binary compound system was found to be −73 ℃. The activity coefficient of water was determined based on the freezing point depression data obtained in this study. In this study, the lowest freezing point was −1.28 ℃ for the aqueous 6 wt.% [DBNH][OAc] solution. Ice crystal yield and distribution coefficient were obtained for two types of aqueous solutions (3 wt.% and 6 wt.% [DBNH][OAc]), and two freezing times (40 min and 60 min) were used as the main parameters to compare the two melt crystallization methods: static layer freeze and suspension freeze crystallization. Single-step suspension freeze crystallization resulted in higher ice crystal yields and higher ice purities when compared with the single-step static layer freeze crystallization. The distribution coefficient values obtained showed that the impurity ratios in ice and in the initial solution for suspension freeze crystallization were between 0.11 and 0.36, whereas for static layer freeze crystallization these were between 0.28 and 0.46. Consequently, suspension freeze crystallization is a more efficient low-energy separation method than layer freeze crystallization for the aqueous-ionic liquid solutions studied and, therefore, this technique can be applied as a concentration method for aqueous-ionic liquid solutions.

1. Introduction
Crystallization from melt is one of the separation and concentration techniques used for organic compound solutions [1]. Nevertheless, under certain conditions, several organic compounds and green solvents, such as ionic liquids and deep eutectic solvents, can undergo thermal degradation or hydrolysis [2,3,4,5,6]. Even though it has been reported that low-pressure evaporation and distillation [7,8,9] can be used as a concentration method in the recycling of ionic liquids from aqueous ionic liquid solutions, the main drawback of such processes is that they are high-energy separation methods due to the high latent heat of evaporation. Consequently, there is a need to find more feasible concentration methods, which also allow application at low-temperature ranges.
Melt crystallization is a low-energy separation method that typically uses a low processing temperature close to room temperature. This is an advantage when working with thermally unstable substances or organic compounds that tend to react and decompose at higher temperatures [10]. Freeze concentration of an aqueous solution is one type of melt-based crystallization method and this is defined as the separation of formed ice from the aqueous solution.
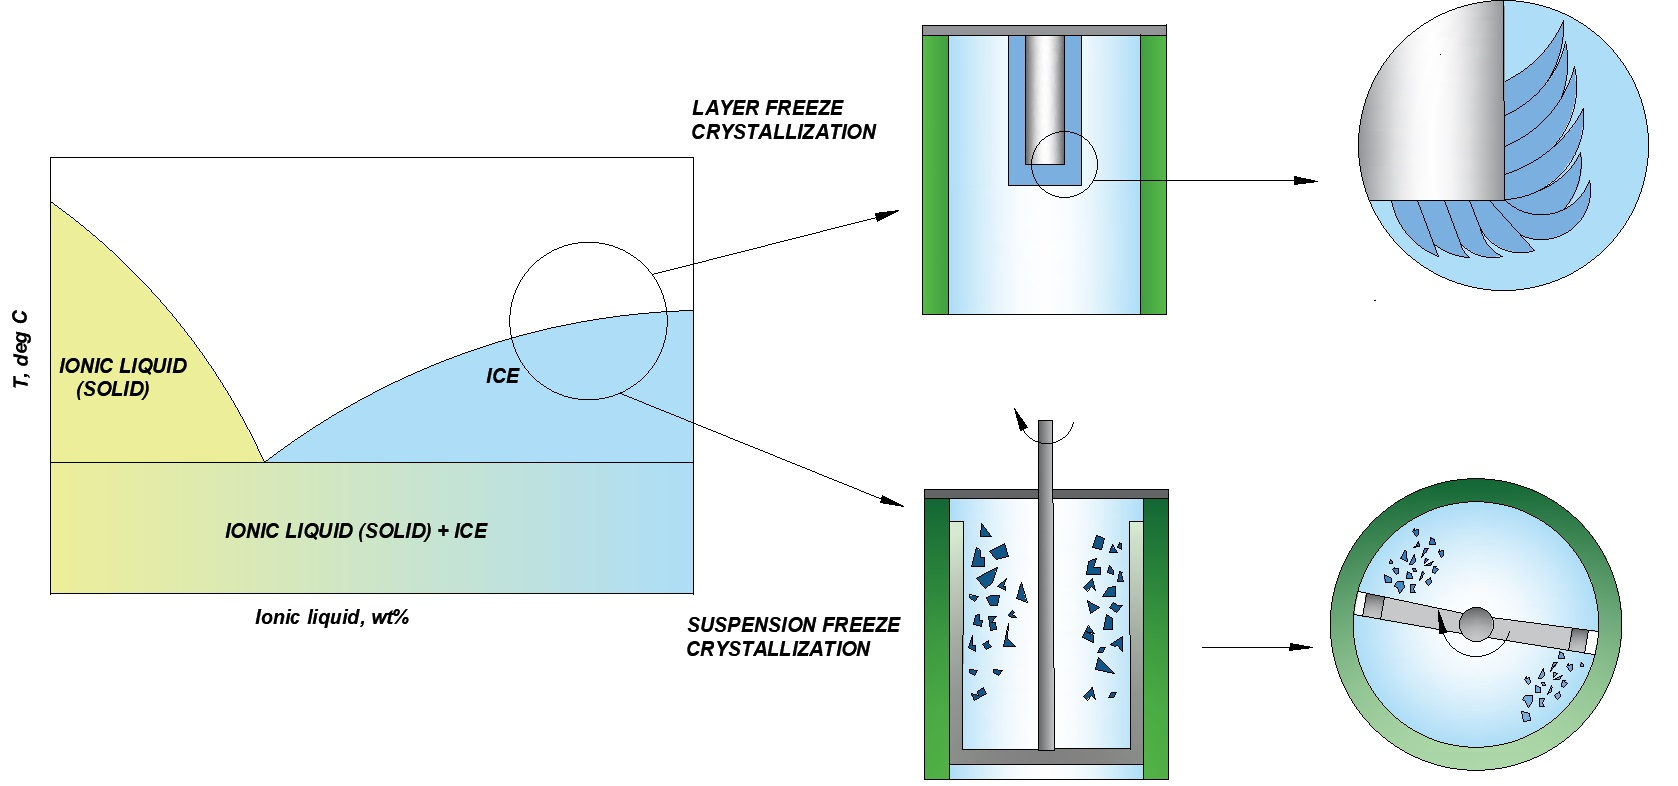
Melt crystallization methods can be generally classified as either layer crystallization or suspension crystallization [11]. In static layer crystallization, the formation and growth of the ice layer occurs at the sub-cooled surface of a crystallizer from stagnant aqueous solution. In contrast, with the suspension crystallization technique, ice crystals form and grow within a sub-cooled solution present inside a crystallizer equipped with a scraper.
Moreover, a recent study [12] has shown that the combination of evaporation and freeze crystallization processes as a new method of recycling an ionic liquid from an aqueous solution is more energy efficient than evaporation-based concentration, primarily as a result of the lower latent heat of freezing when compared with the latent heat of evaporation.
In the present work, an ionic liquid (IL), 1,5-diazabicyclo[4.3.0]non-5-enium acetate ([DBNH][OAc]), was used as a model compound for the investigation of the freeze concentration method. [DBNH][OAc] has been shown to be an efficient solvent for dissolving birch-based cellulose [13] and is considered to be a promising industrial solvent due to its safety, low environmental impact, economic viability, and production of high-quality fiber even from low-refined unbleached pulps [14,15,16,17] with good spinnability [18]. Nevertheless, the main challenge to the wider application of IL is that it can be a relatively expensive organic solvent and, therefore, it must be efficiently recycled from aqueous solution as a way to reduce costs [19].
In this work, freeze crystallization techniques as a concentration method for IL recycling were investigated. The solid–liquid equilibria were determined between [DBNH][OAc] and water by the differential scanning calorimetry (DSC) technique.
2. Materials and Methods
This section describes the DSC procedure used for phase diagram construction and outlines the methodologies employed for static layer freeze crystallization, suspension freeze crystallization, and for separation efficiency studies.
2.1. Differential Scanning Calorimetry (DSC)
The solid–liquid equilibrium of binary [DBNH][OAc] and water solution was investigated to obtain phase diagram data that cover both [DBNH][OAc]- and water-enriched solutions. Thermal analyses were conducted by DSC (3, Mettler Toledo (Schwerzenbach, Switzerland)) equipped with an intra-cooler. Individual samples, with a mass of ca. 10 mg, were placed in 25 µL aluminum crucibles that were subsequently sealed before being placed in the experimental chamber with a N2 flux regulated atmosphere. As low heating and cooling rates offer better information about the thermal behavior of the samples, i.e., whether the ionic liquid is a crystal or a glass formation [20], a heating and cooling rate of 1 K/min was chosen for all experiments.
2.2. Water Activity Coefficient
Water activity coefficients of aqueous [DBNH][OAc] solutions were calculated using Equations (1) and (2). Gmehling et al. [21] derived Equation (1) for the solubility of an organic solute in a solvent starting from the isofugacity condition. It can be used to estimate the activity coefficient of a sub-cooled liquid solvent as a function of the enthalpy of fusion, heat capacity difference between liquid and solid phase, and melting point of the solvent. When the system is close to its melting point, the last two terms of Equation (1) can be neglected and the simplified, Equation (2) is obtained. In the remainder of the article, Equation (1) is referred to as the activity coefficient equation and Equation (2) as the simplified activity coefficient equation.
where
| activity coefficient of water, | |
| mole fraction of water, | |
| enthalpy of fusion for water at 273.15 K (6009.5 J/mol), | |
| heat capacity difference between water and solid ice (J/molK), | |
| R | universal gas constant (8.3143 J/molK), |
| freezing point of pure water (273.15 K), | |
| freezing point of aqueous ionic liquid solution obtained by DSC (K). |
Heat capacity difference, , is a function of temperature, and its value changes significantly when the temperature of a system is significantly lower than its melting point. Equation (3), previously reported by Sippola and Taskinen [22], was used to calculate the heat capacity change of water at its freezing point.
2.3. Layer Freeze Crystallization
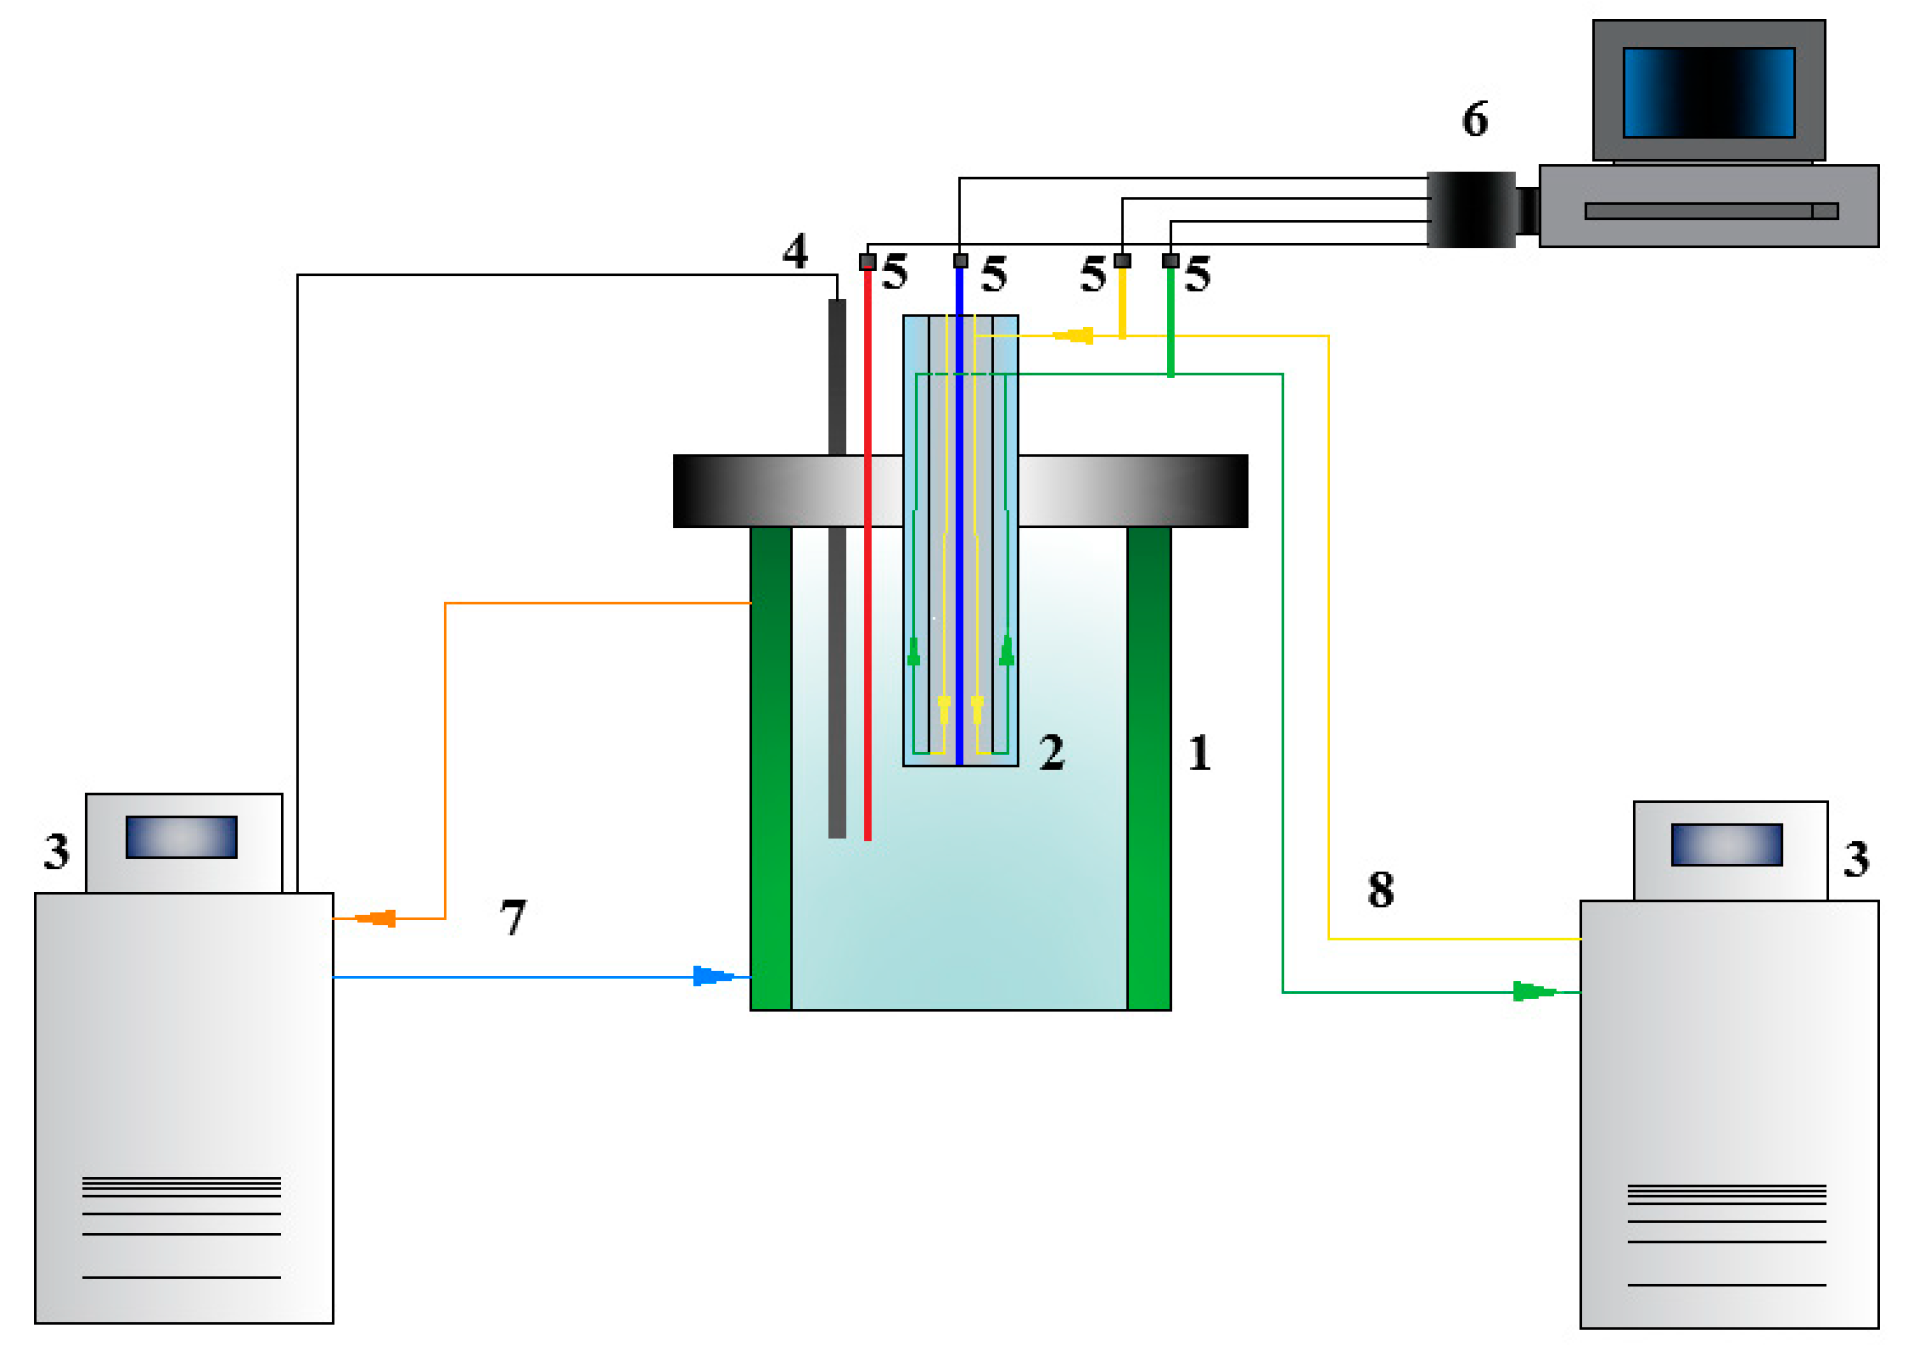
Experiments with stagnant 3 wt.% and 6 wt.% [DBNH][OAc] aqueous solutions were conducted in a crystallizer that consisted of a 250 mL jacketed flat-bottom glass vessel equipped with a cylindrical stainless-steel cold finger. The experimental setup is shown in Figure 1.
Both elements of the crystallizer, the jacketed vessel (1) and the cold finger (2), were connected to a pair of Lauda ECO RE 1050 thermostats (Lauda-Königshofen, Germany) (3). The coolant streams (approx. 50 wt.% aqueous ethylene glycol solution) were circulated at a flow rate of 1.64 L/min through the jacketed vessel and at a flow rate of 0.35 L/min through the cold finger—the flow rates of circulating coolants through the jacketed vessel and cold finger were measured by Kytola EH-5SA and Kytola EH-4AA rotameters (Muurame, Finland), respectively. Thermocouples (5) were used to measure the temperature at four points within the crystallizer: inside the jacketed vessel (representing the temperature of solution), at the inlet of the cold finger coolant line, at the outlet from the cold finger, and inside the cold finger proximal to the tip (representing the temperature of sub-cooling). In addition, the external thermostatic control of the Lauda PT 100 (4) connected to the jacketed vessel was used to measure the solution temperature. Monitoring of temperature and storage of the measured data were performed using LabVIEW (Espoo, Finland) data acquisition software (6).
Studies of the ice layer on the cold finger from [DBNH][OAc] solutions were carried out at five different temperatures of coolant circulating through cold finger (sub-cooling temperatures) with two freezing times of 40 min and 60 min. The coolant temperature in the jacket was kept constant, and each separate temperature of coolant circulating through cold finger was set to be lower than the freezing point of solution, i.e., a sub-cooling temperature. The degree of sub-cooling was varied by altering the temperature of coolant of the cold finger.
For each experiment at a new sub-cooling temperature, the temperature of the thermostat connected to the cold finger was set to the desired value, whereas the temperature of the coolant circulating through the jacketed vessel was kept constant at the freezing point value of the respective solution. In addition, the internal sensor of the thermostat was used to adjust the temperature of coolant circulating through the cold finger at sub-cooling value.
After a constant temperature of solution and temperature of sub-cooling was achieved, freeze crystallization was induced by seeding with an ice crystal. This procedure was performed outside the jacketed vessel by the attachment of a seed ice crystal to the bottom surface of the cold finger, followed by immediate re-immersion in the solution. This immersion time was considered as the starting time in each freezing experiment, and the ice layer was allowed to grow on the cold finger for a pre-selected freezing time. The cold finger surface area where ice layer formation occurred is referred to as the cooling area in the layer freeze crystallization (FC) experiments. The ice seeds were produced by a Scotsman AF 103 Ice Flaker and were transported inside an insulated container.
After the fixed freezing time was complete, the ice layer formed was removed from the cold finger and rinsed with 5 mL of de-ionized water at 0 ℃ to remove any mother liquor remnants. The dimensions of the ice sample (outer diameter and height) and mass were measured before the sample melted.
2.4. Suspension Freeze Crystallization
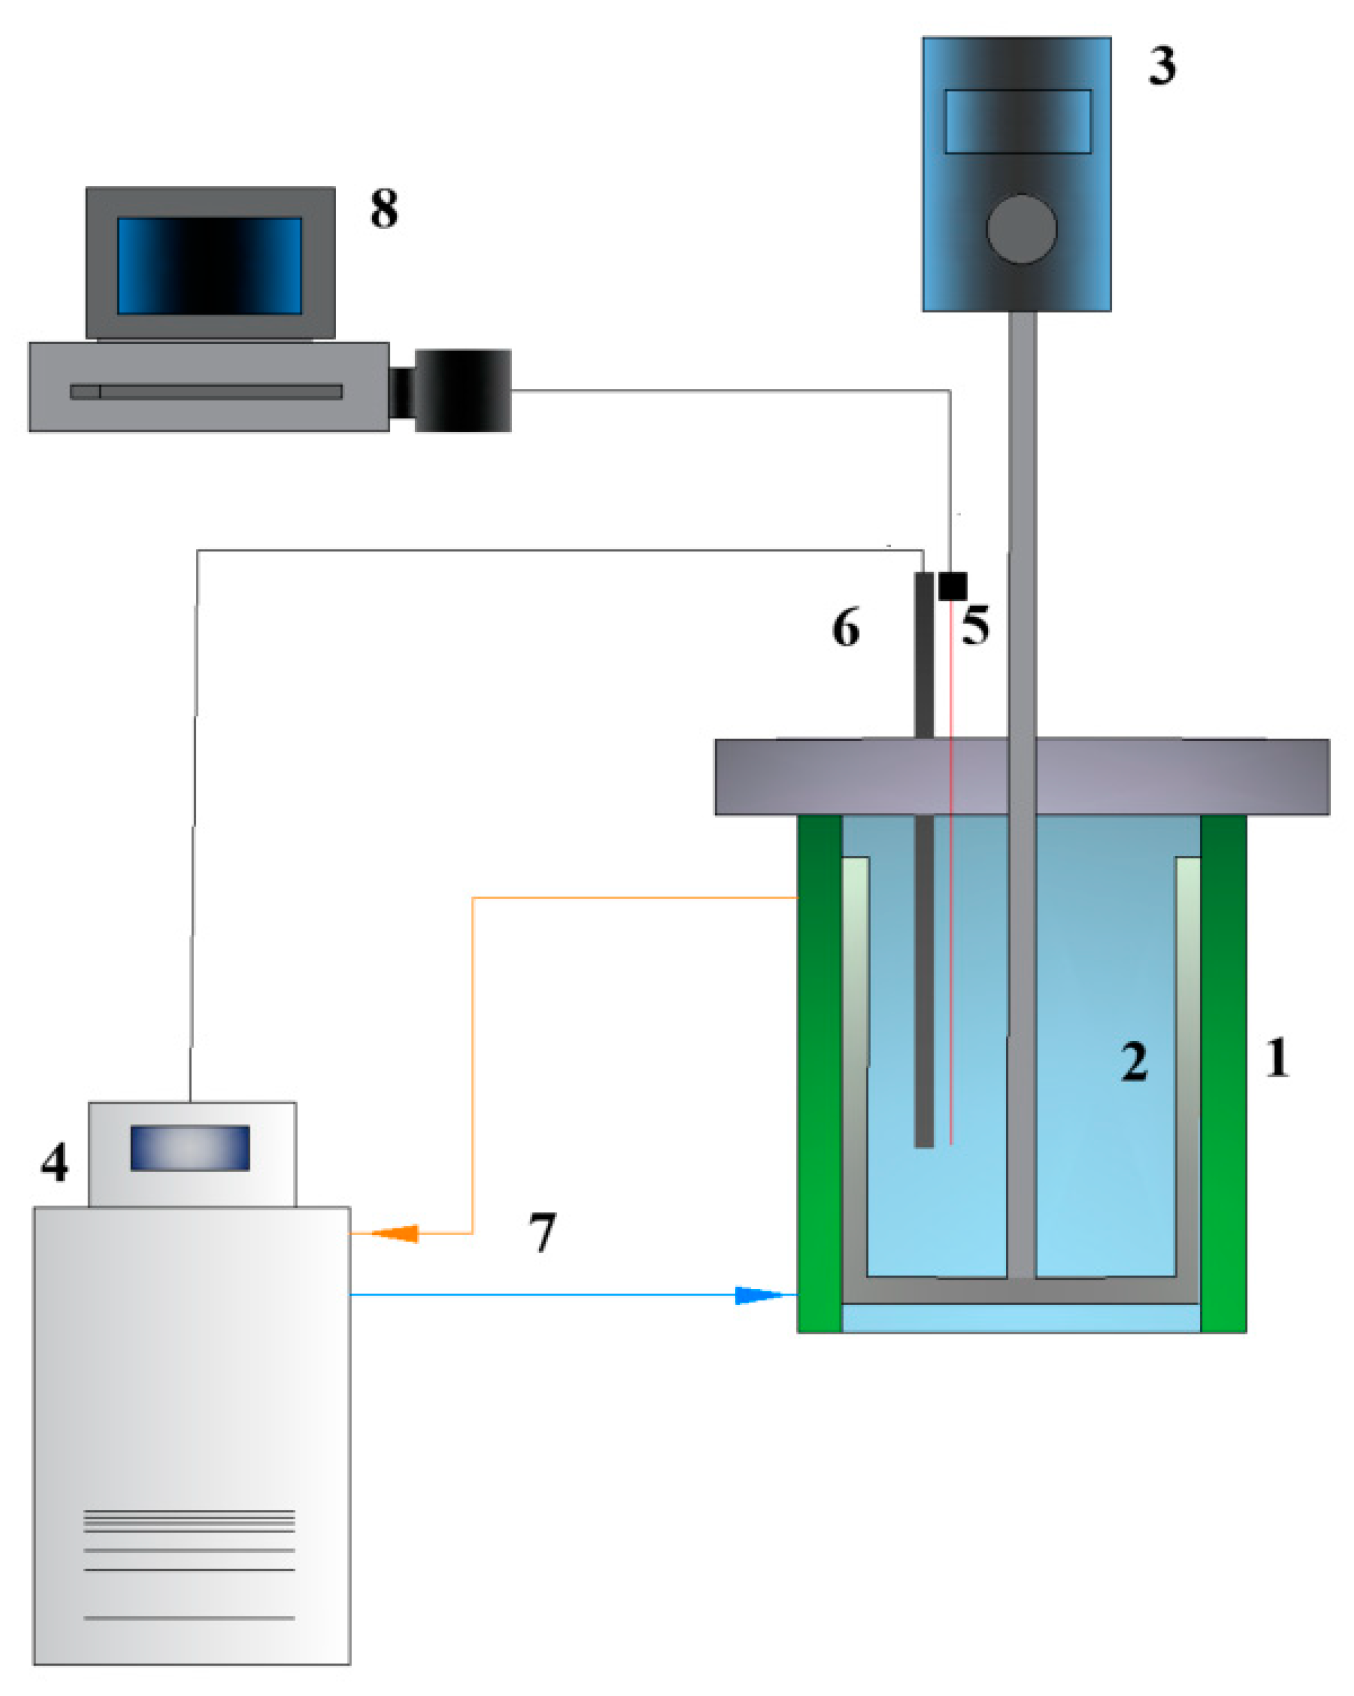
The experimental setup of suspension freeze crystallization is shown in Figure 2.
The crystallizer setup consisted of a 250 mL jacketed glass vessel (1) with a rotating scraper (2) that prevents encrustation of ice crystals at the inner surface of the crystallizer. A rotation speed of 18 rpm was set for the scraper (3). The coolant (approx. 50 wt.% aqueous ethylene glycol solution) was circulating at a flow rate of 1.64 L/min through the jacketed vessel connected to a Lauda ECO RE 1050 thermostat (3), and the flow rate of the coolant was measured by a Kytola EH-5SA rotameter. The thermocouple (5) and the Lauda PT 100 thermosensor (6) were used to determine solution temperature. LabVIEW and WinTherm software were used to monitor and store measured temperature data (8).
Suspension crystallization experiments with 3 and 6 wt.% [DBNH][OAc] aqueous solutions were conducted at five different temperatures of sub-cooled solutions for freezing times of 40 and 60 min. In the case of suspension freeze crystallization, the degree of sub-cooling presents the difference between the temperature of the sub-cooled solution and its freezing point. Sub-cooling of the solution depended on the temperature of coolant circulated by the thermostat pump through the jacket of the crystallizer. When the sub-cooling temperature of solution reached the desired value and became stable, ice crystal seeds were placed inside the crystallizer to induce the freeze crystallization. For suspension FC experiments, the cooling area is the vessel inner wall surface area. The ice seeds were produced by a Scotsman AF 103 Ice Flaker and transported inside an insulated container.
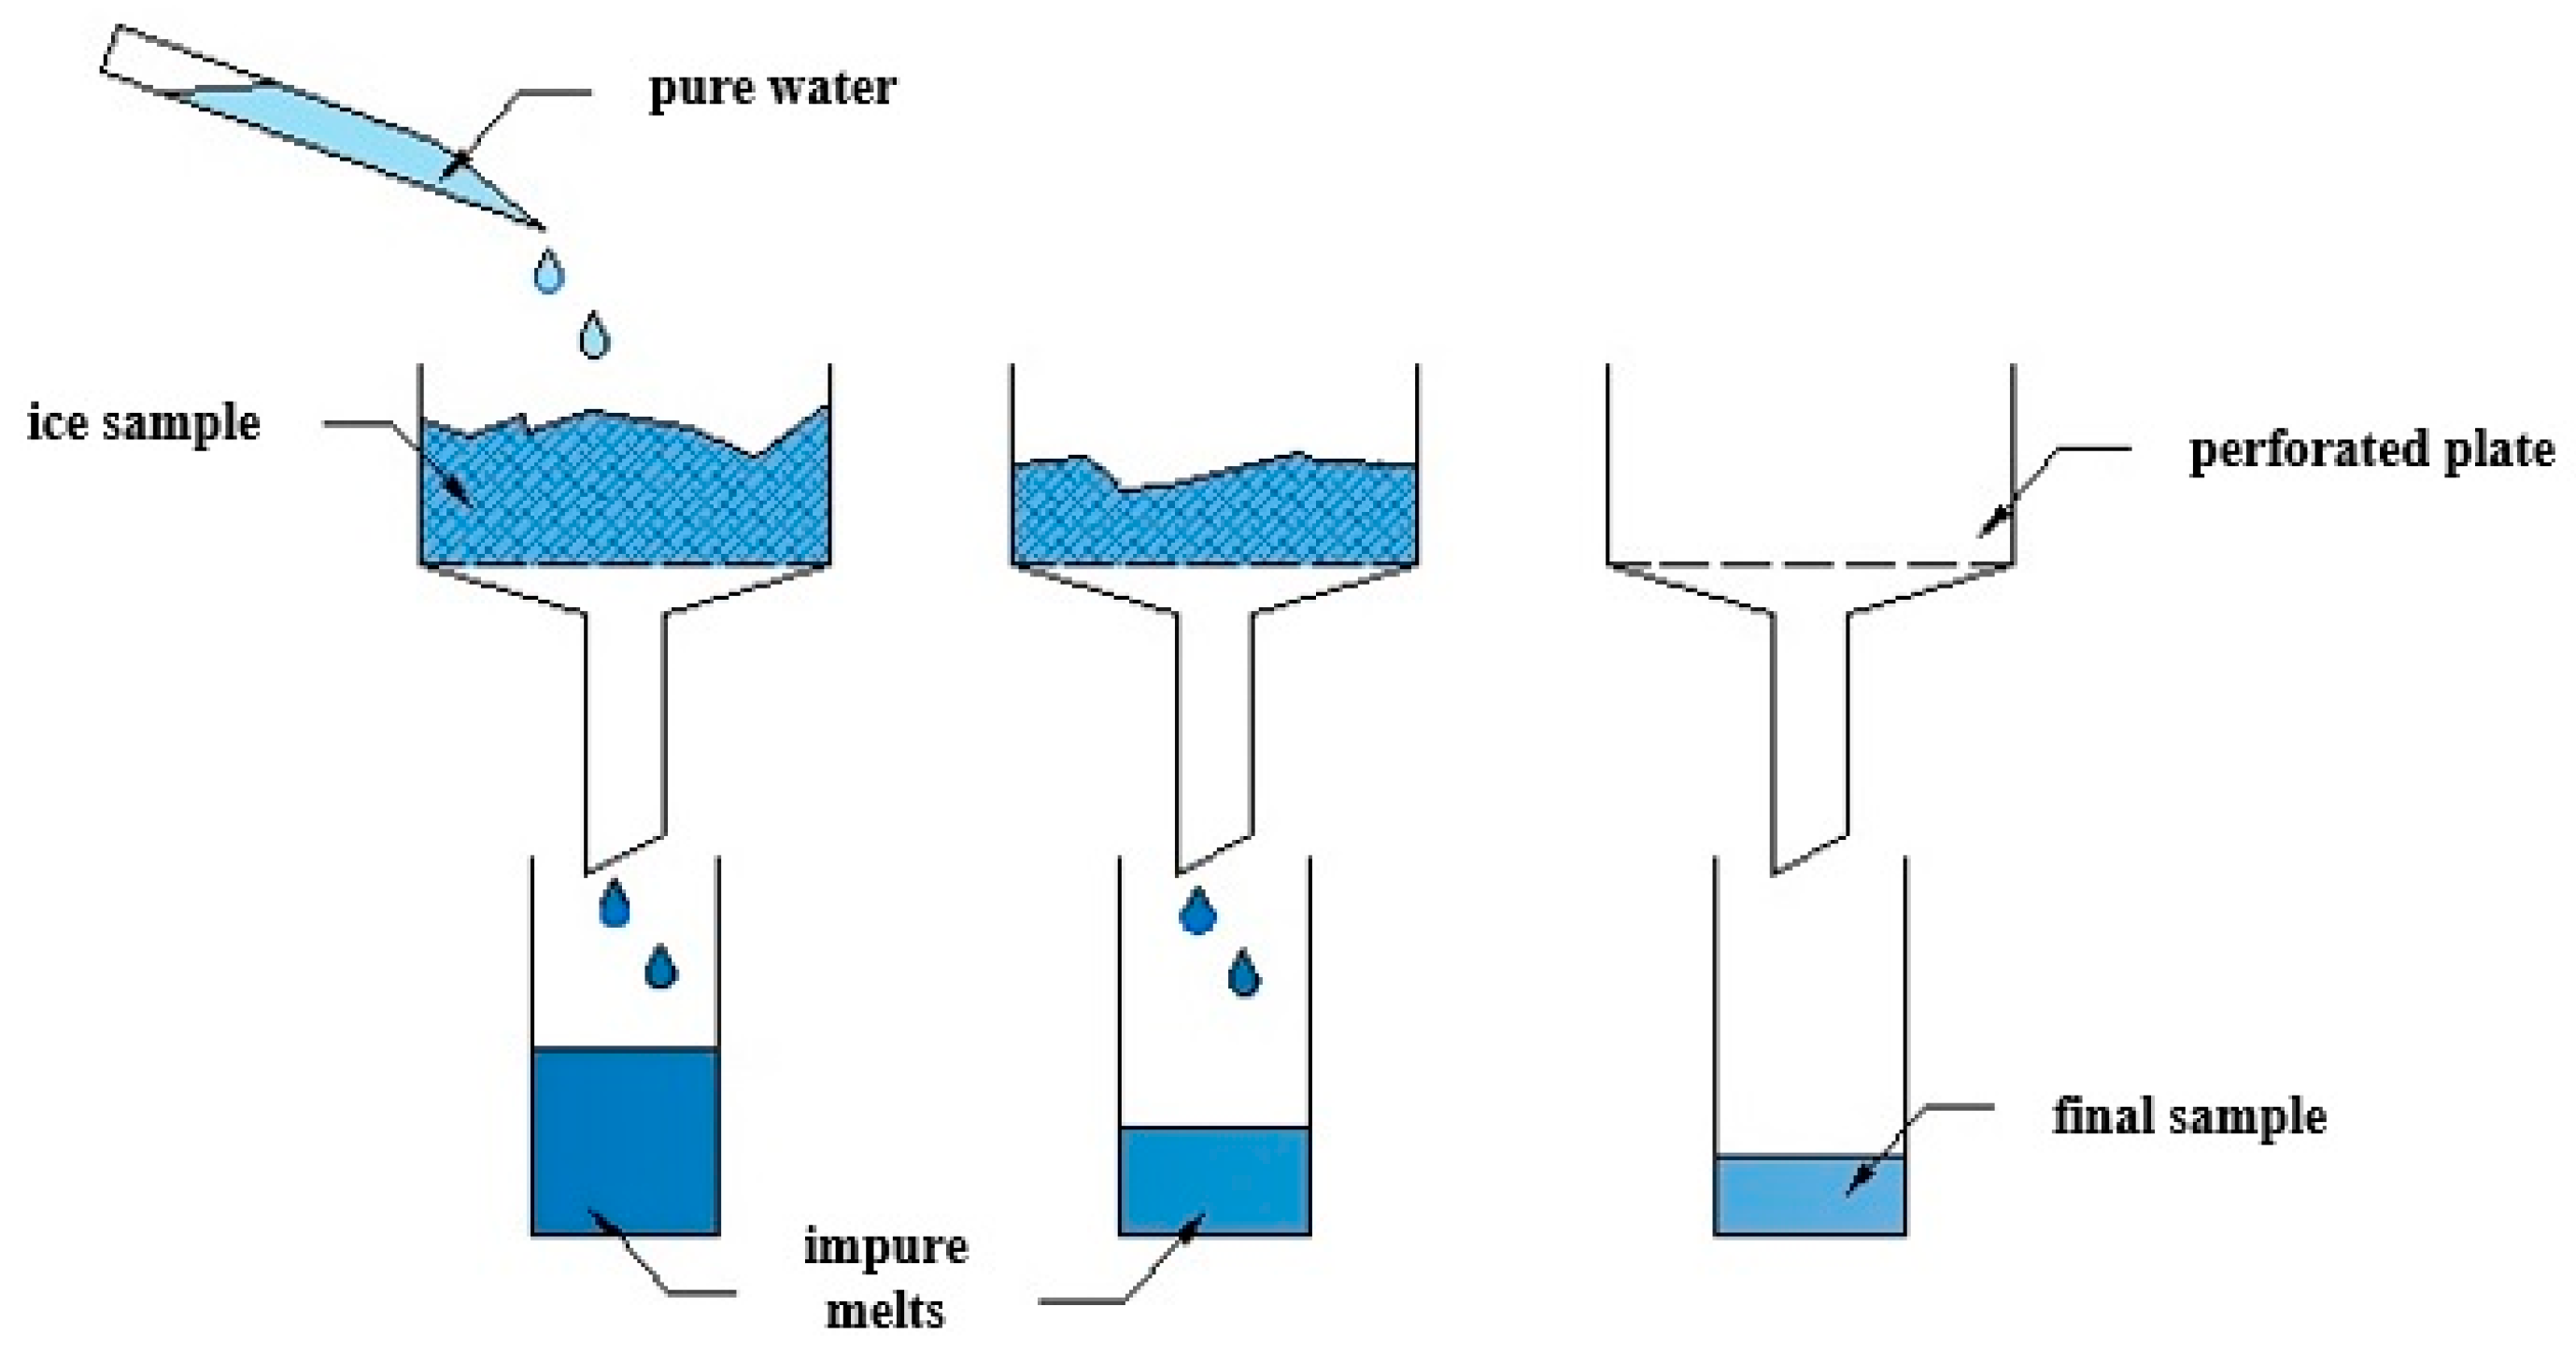
As the main challenge was to properly separate ice crystals from the mother liquor, a gravity-based filtration procedure with a perforated plate setup was used (Figure 3), where partial melting of washed ice samples could take place.
Approximately 15 g of surface floating ice crystals and mother liquor were taken directly from the reactor with a spoon and pressed on to the perforated plate in order to squeeze the mother liquor from the sample. Additionally, the sample was washed with 7 mL of de-ionized water at 0 °C to remove the remaining mother liquor. Washed samples were then left to partially melt and, with each step, the ice became more purified. The last fraction of ice crystals, with a mass of approx. 5 g, were considered to be pure crystals that had properly separated from the mother liquor, and its melt was used for the ice crystal purity analysis.
2.5. Determining Distribution Coefficient and Crystal Yield
In order to conduct the layer and suspension crystallization experiments, the freezing points of two DBNH[OAc] aqueous solutions were determined in the jacketed crystallizer fitted with a scraper. Upon seeding, ice crystallization commenced and as a result of the heat of crystallization, the solution temperature increased until a constant value was attained, which remained for the duration of crystallization. This temperature was taken as the freezing point and was measured with a thermocouple with a standard uncertainty of 0.01 °C (expanded uncertainty of 0.02 °C).
The ice crystal yield and the distribution coefficient were the main parameters used to assess the efficiency of freeze crystallization as a separation method.
Ice crystal yield was determined based on the mass of a pure ice sample as calculated by Equation (4)
where
| mass of the pure ice (kg), | |
| mass of the water in initial solution (kg). |
The mass of the ice samples produced by layer freeze crystallization was determined by weighing, whereas the mass of ice samples crystallized in the suspension crystallizer was calculated based on the concentration difference of [DBNH][OAc] in the mother liquor at the end of crystallization and the initial solution.
The distribution coefficient, K, is expressed as the ratio of the impurity in the ice to the initial impurity in the solution:
where
| Cimp | concentration of ionic liquid in ice (kg [DBNH][OAc]/kg ice), |
| C0 | initial concentration of ionic liquid in solution (kg [DBNH][OAc]/kg solution). |
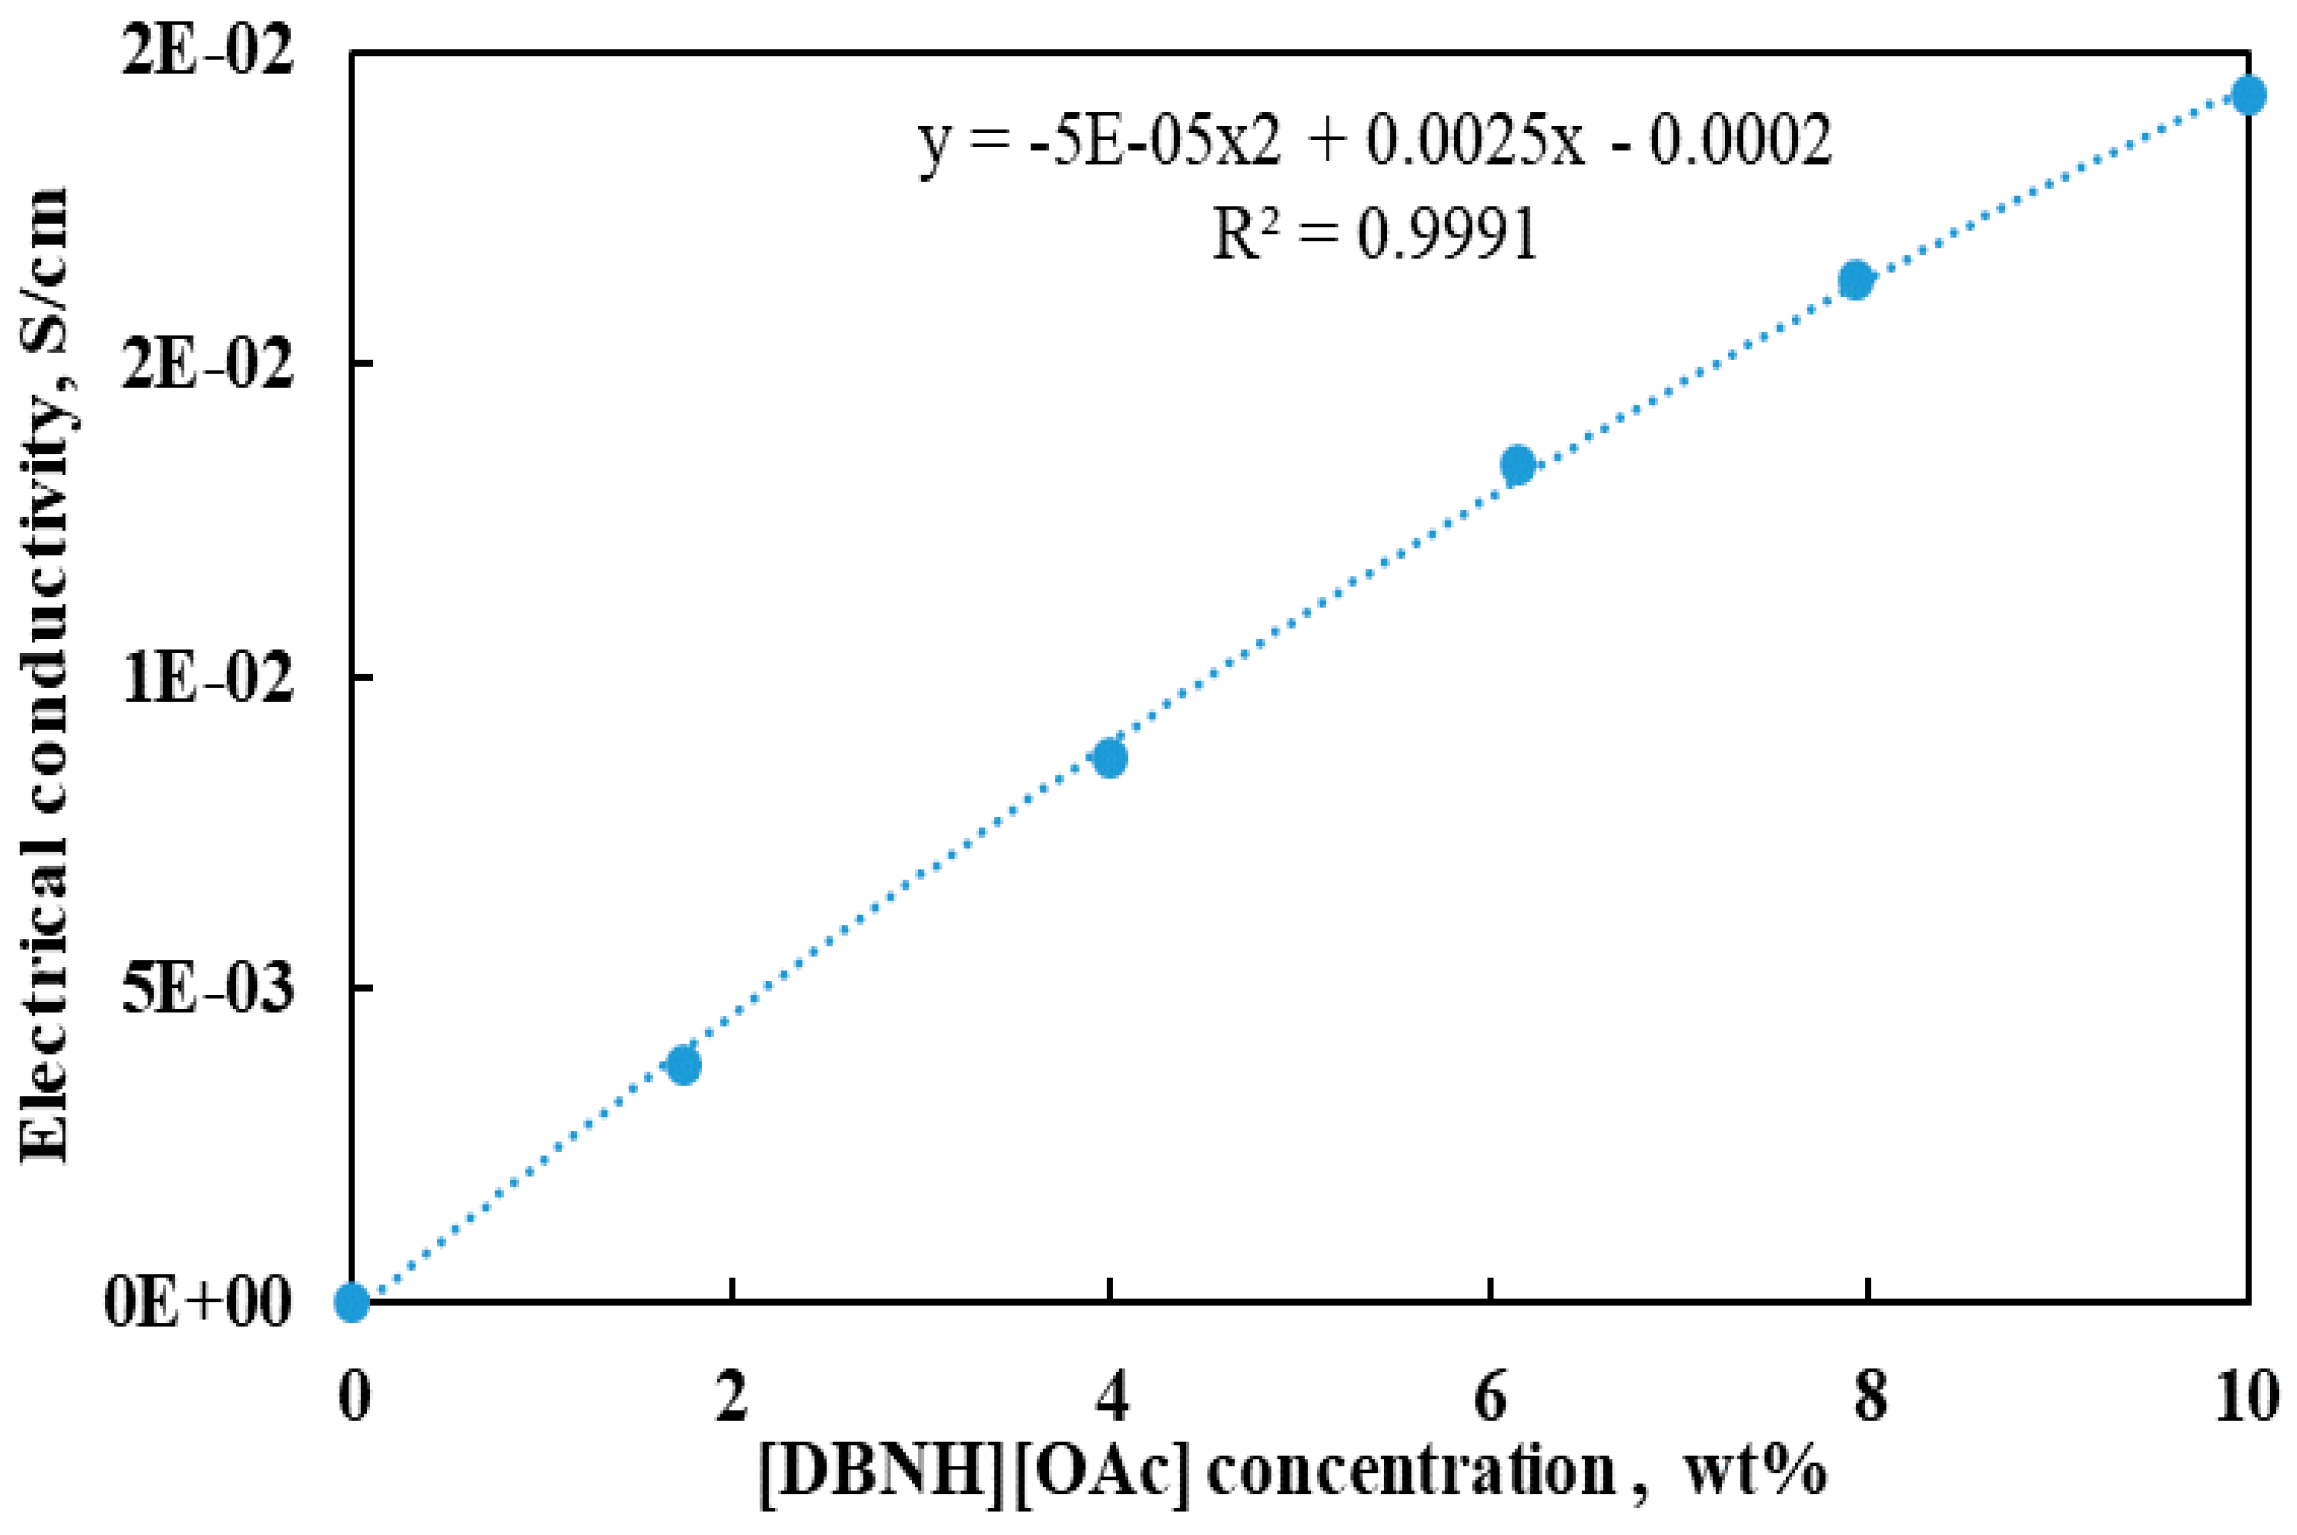
Purity of the ice samples —which is determined from the concentration of [DBNH][OAc] present in the ice crystals—was analyzed by the measurement of melted ice and mother liquor sample electrical conductivities with a Consort C3050 electrical conductivity meter. To obtain a correlation between electrical conductivity and concentration, the electrical conductivities of six solutions (0, 2, 4, 6, 8, and 10 wt.% [DBNH][OAc](aq)) were measured and are shown in Figure 4.
3. Results
3.1. Phase Equilibria of Binary [DBNH][OAc] and Water System
Mixtures of [DBNH][OAc] and water at different ratios were analyzed by DSC. For each different sample, the corresponding liquidus temperature and/or glass transition (or eutectic temperature) were extracted from DSC curves obtained, and these were then plotted in a phase diagram as shown in Figure S1. The compositions of [DBNH][OAc] and water mixture samples analyzed are provided in Table S1.
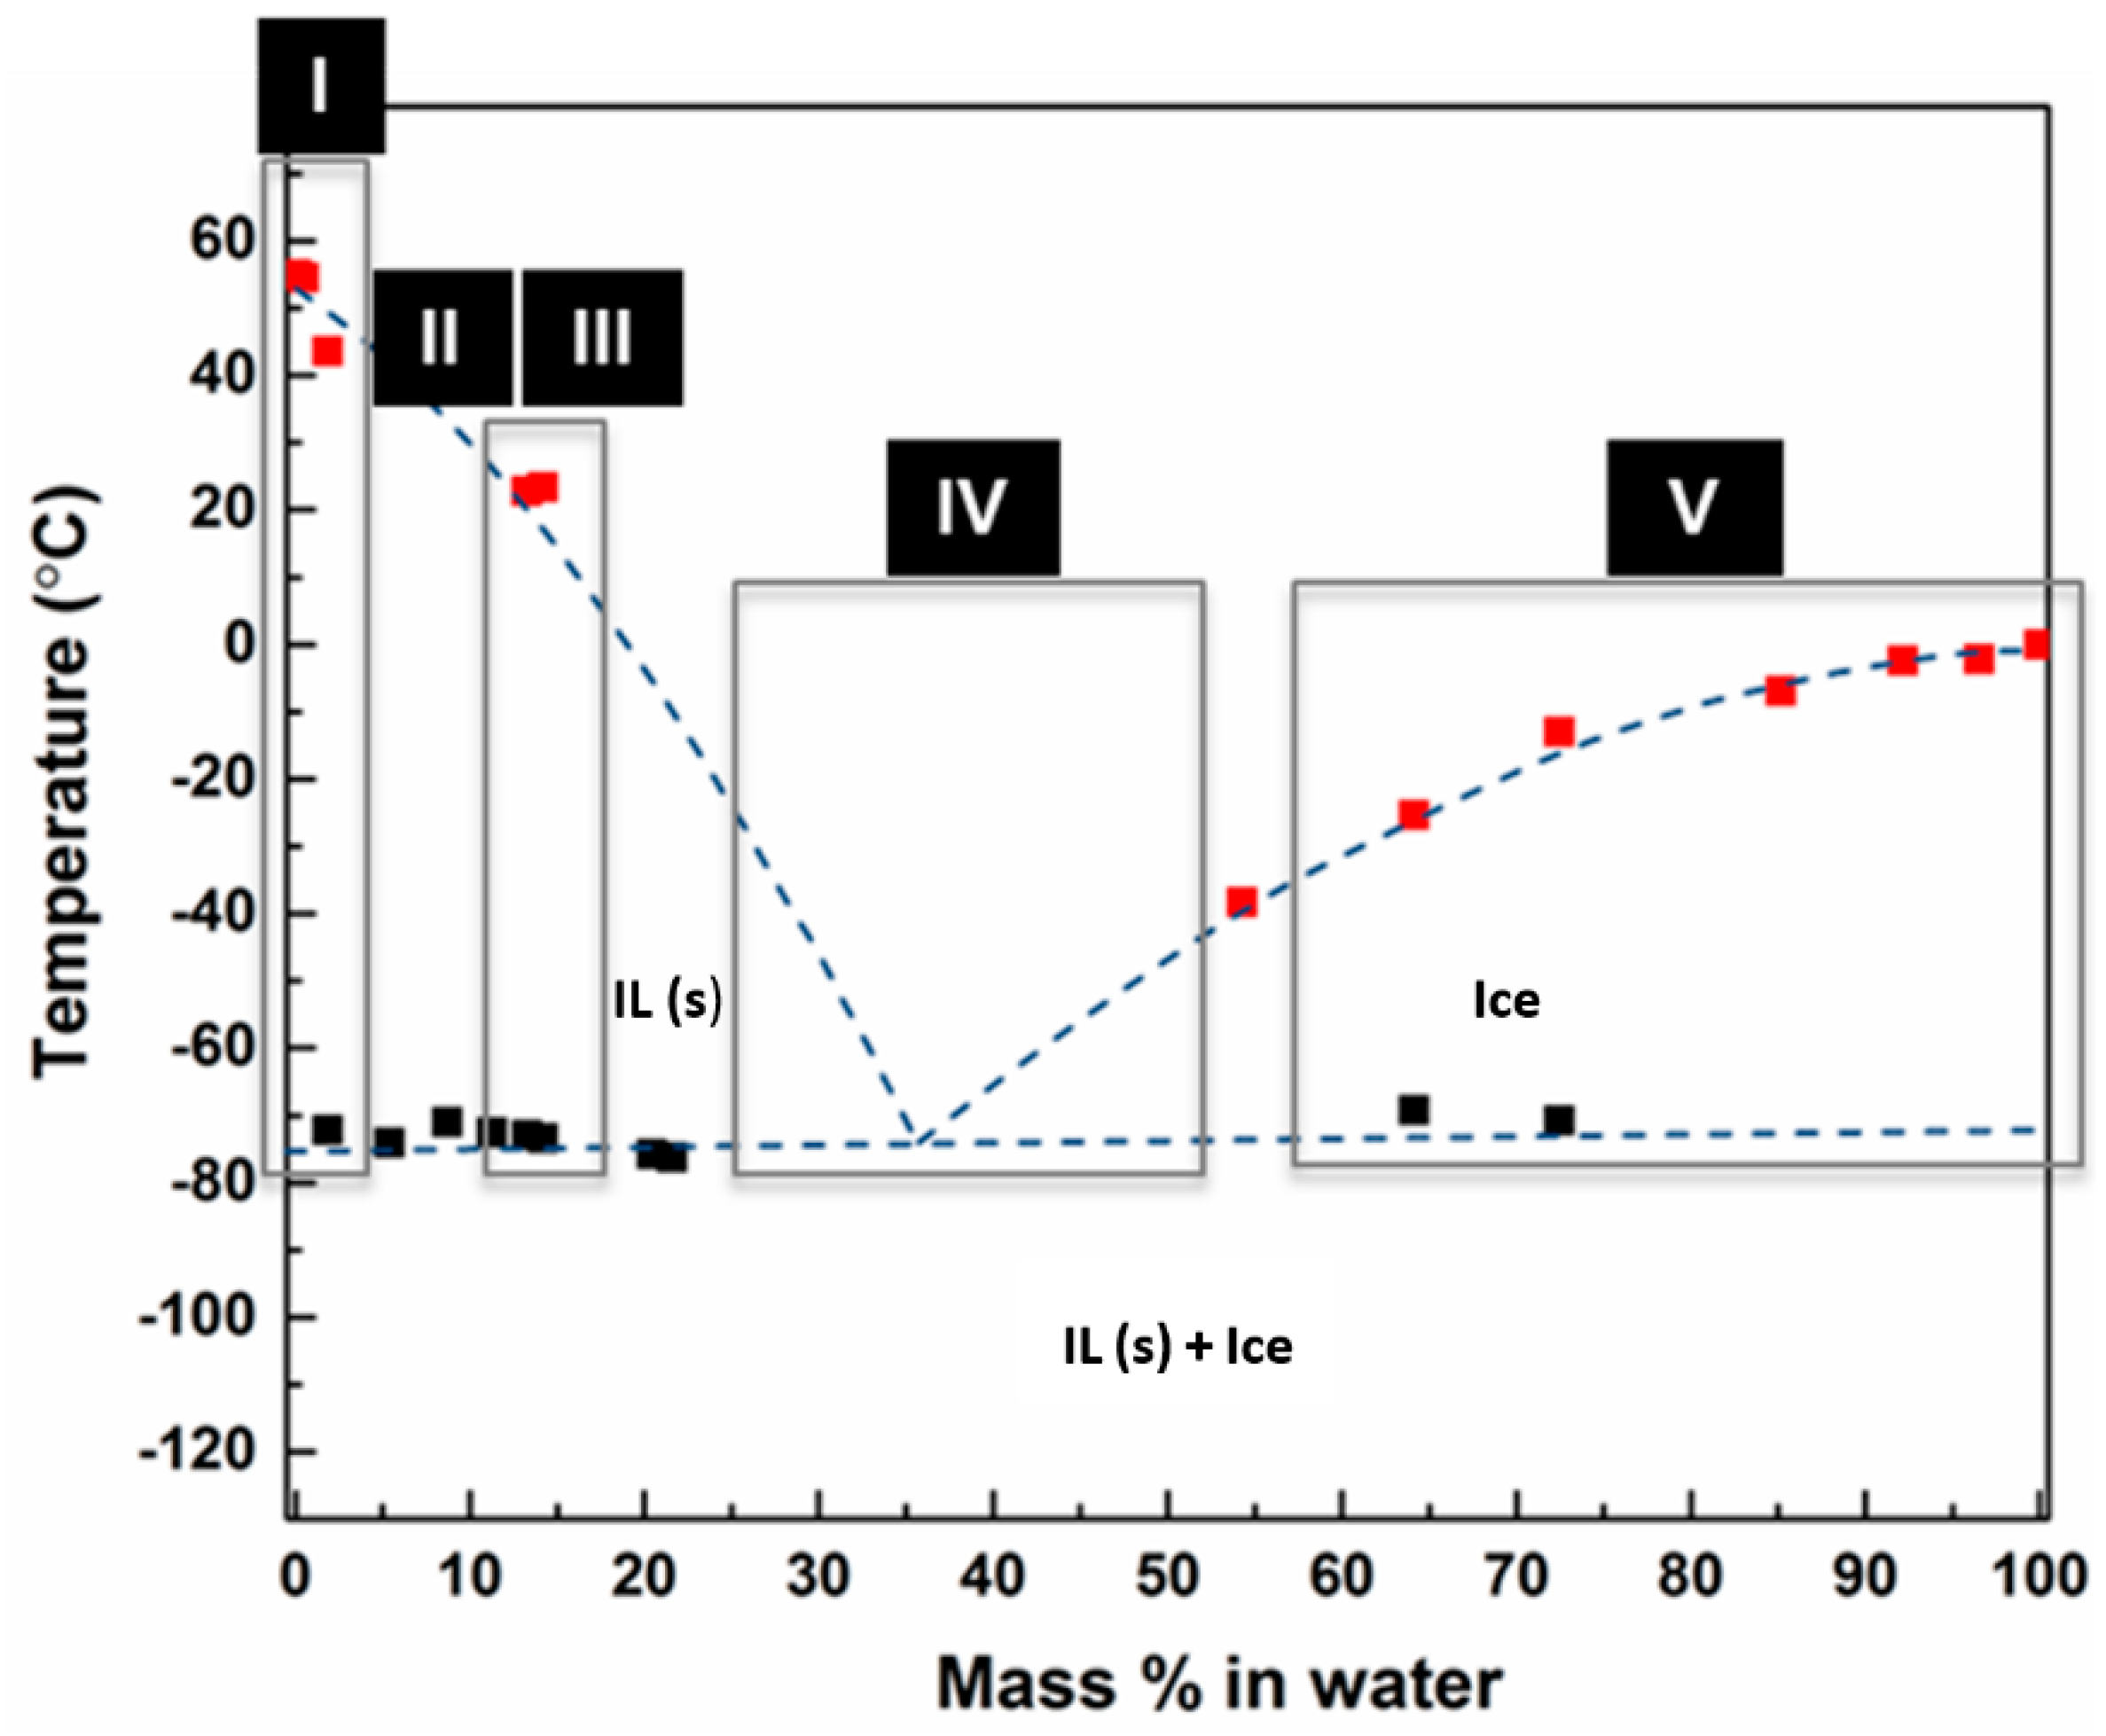
The binary phase equilibria between [DBNH][OAc] and water are shown in Figure 5. The phase diagram was constructed based on temperature transition data obtained for the ionic liquid–water mixtures (water content was varied over a range between 0.49 wt.% and 100 wt.%). As can be seen from Figure 5, the black dot highlights glass transition or eutectic temperature, which is at −73 °C and the red dots relate to the liquidus temperatures. For the mixtures of [DBNH][OAc]–H2O, where water content was less than 54.3 wt.%, only four temperatures were obtained by DSC, due to the ionic liquid glass-formation that occurs with such compositions. Consequently, the ionic liquid liquidus curve was plotted by extrapolation.
Results from the DSC study show that the [DBNH][OAc]–H2O mixtures can be divided into five regions based on their different crystallization behaviors. These regions are shown in Figure 5 and relate to the following characteristics:
- Region 1: At lower water content, mixtures were solid at ambient temperature.
- Region 2: No crystallization upon cooling and no recrystallization upon heating were observed, but glass transitions were measured at −73 °C
- Region 3: Crystallization of mixtures occurred upon heating. The mixtures underwent the transitions in following order: glass transition, recrystallization, and finally melting.
- Region 4: Mixtures neither crystallized nor underwent glass transition when they were cooled to −80 °C and heated up to 25 °C during DSC analyses.
- Region 5: For the mixtures with water content was greater than 54.3 wt.%, crystallization occurred upon cooling and melting upon heating. The melting temperatures acquired were used to construct the liquidus line of ice.
The phase equilibrium obtained results show that the appropriate temperature range and composition range for freeze crystallization of aqueous [DBNH][OAc] solution are in Region 5. Aqueous [DBNH][OAc] solutions from this region with freezing points above −10 °C can be feasibly concentrated by freeze crystallization.
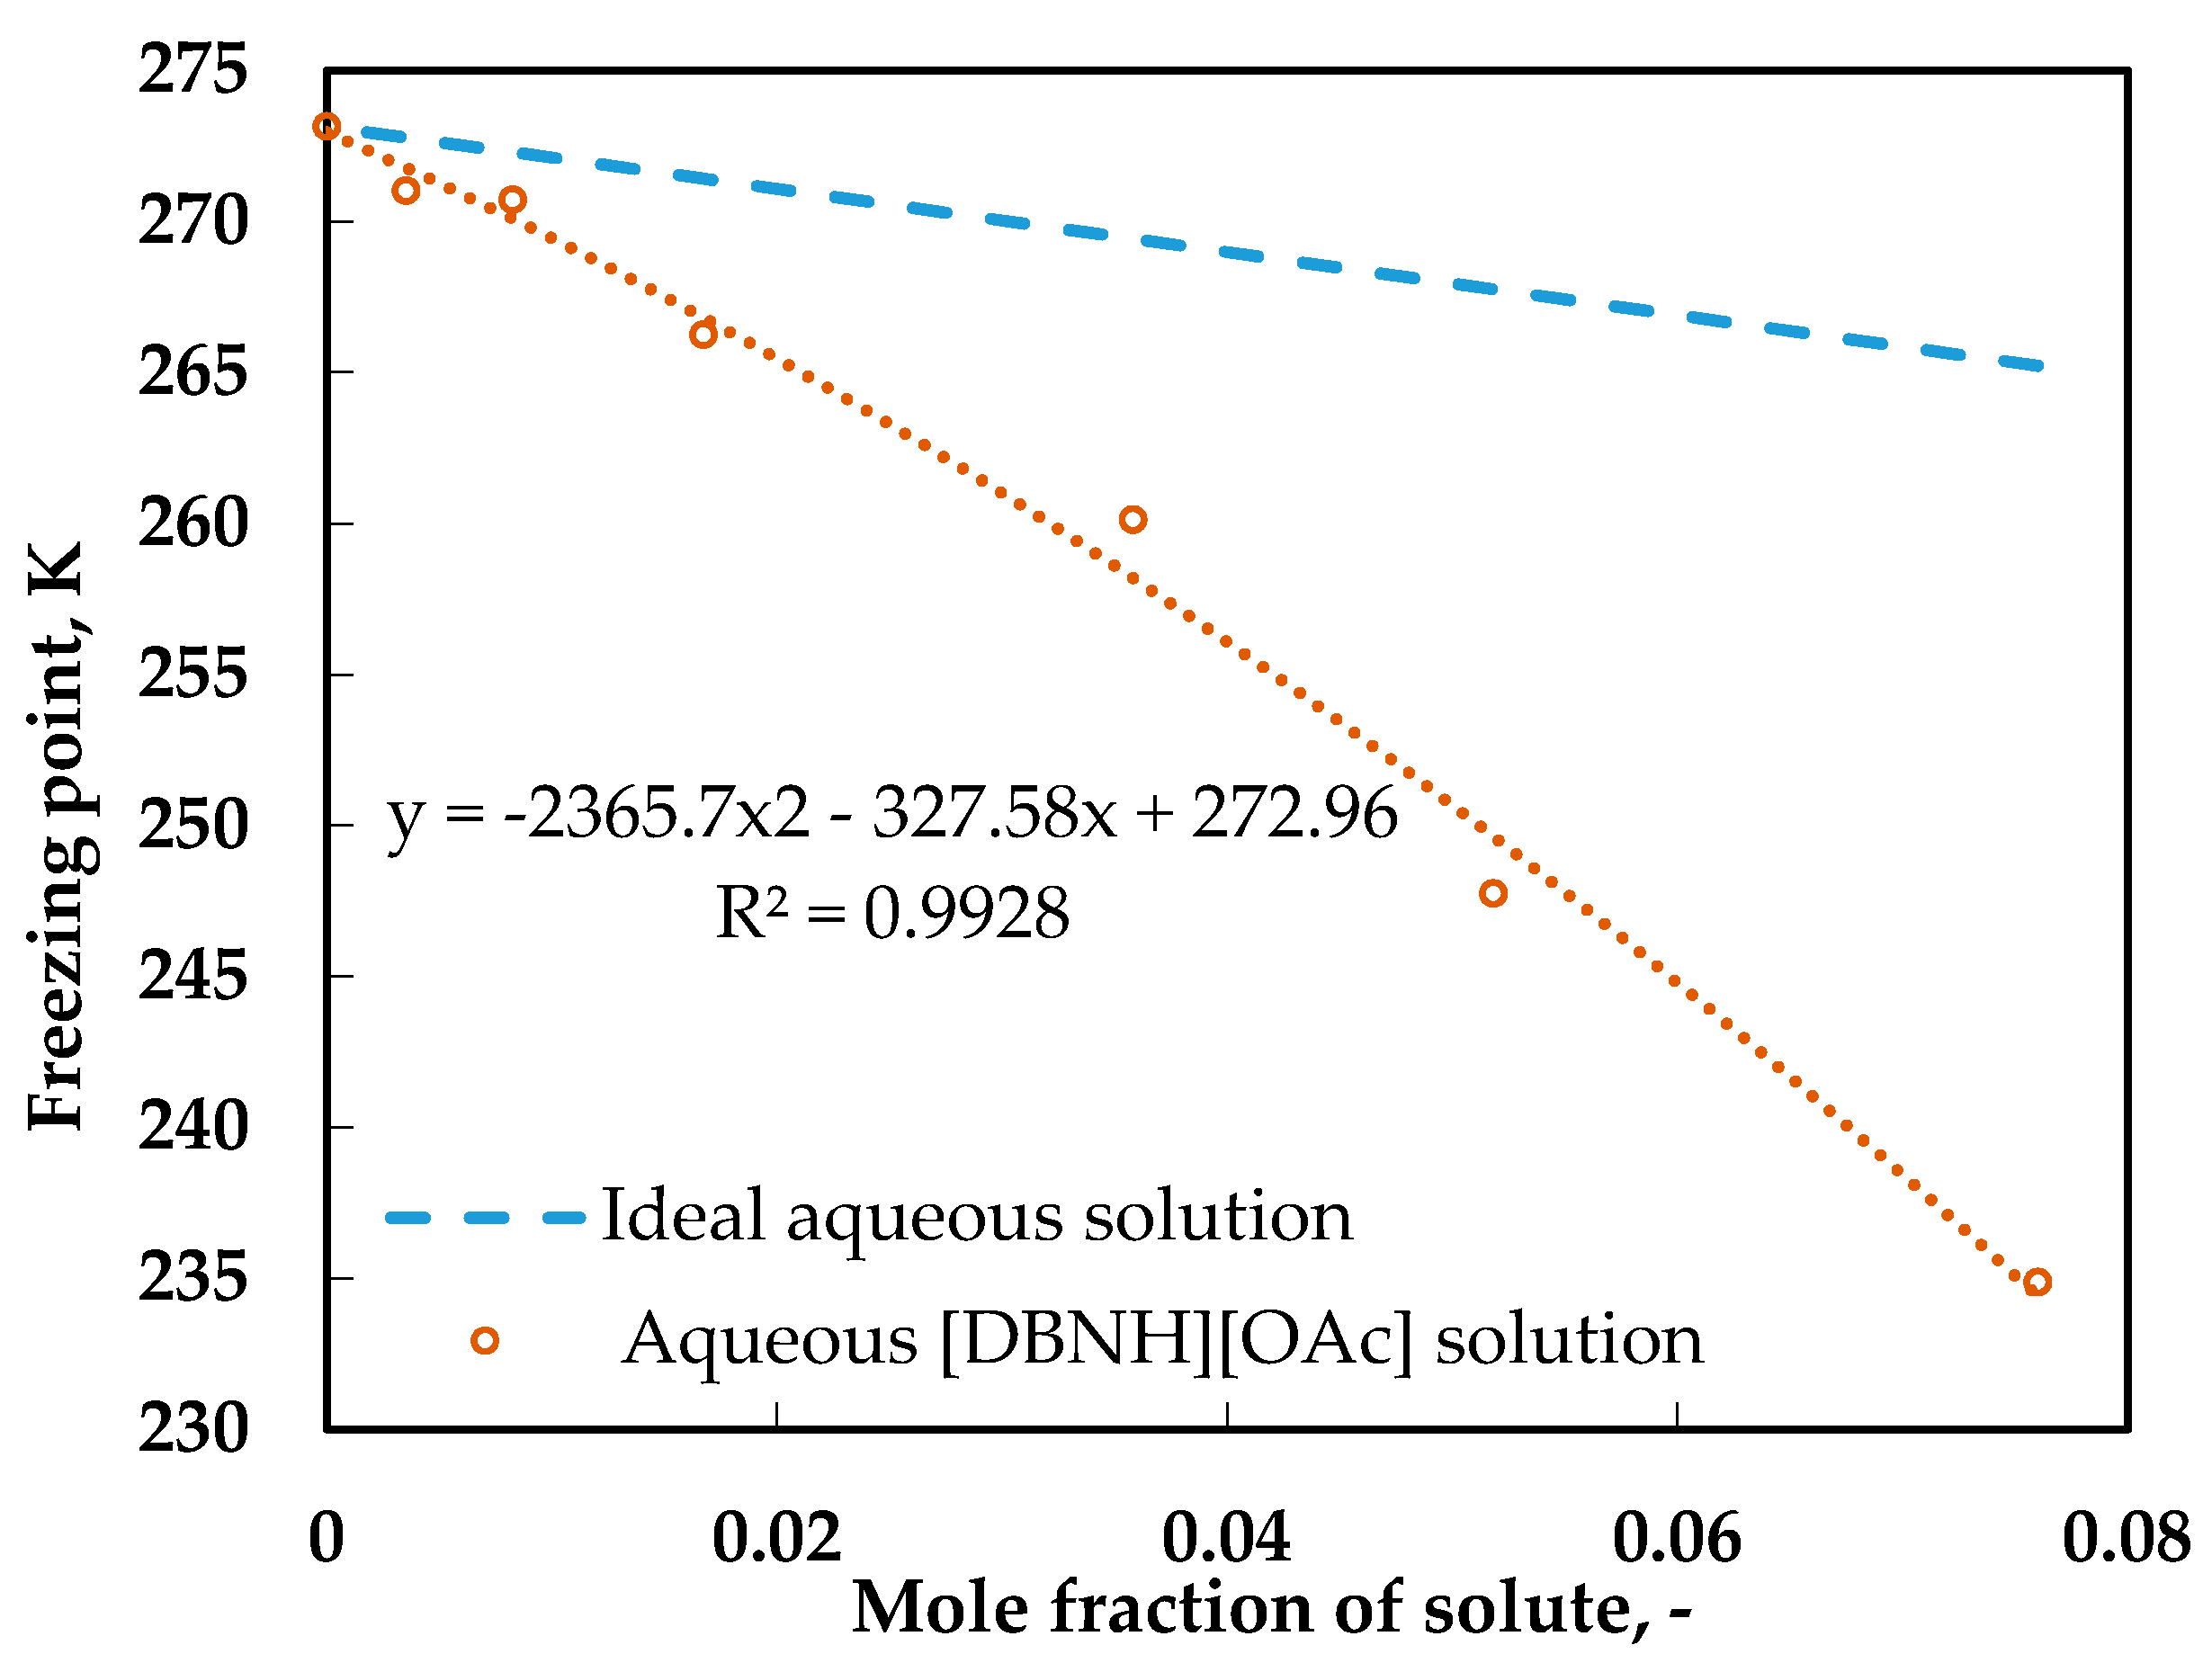
Calculated freezing points of an ideal aqueous solution (γ = 1) based on Equation (2) and experimentally obtained freezing points for an aqueous [DBNH][OAc] solution for the same range of dissolved solute were compared, as shown in Figure 6.
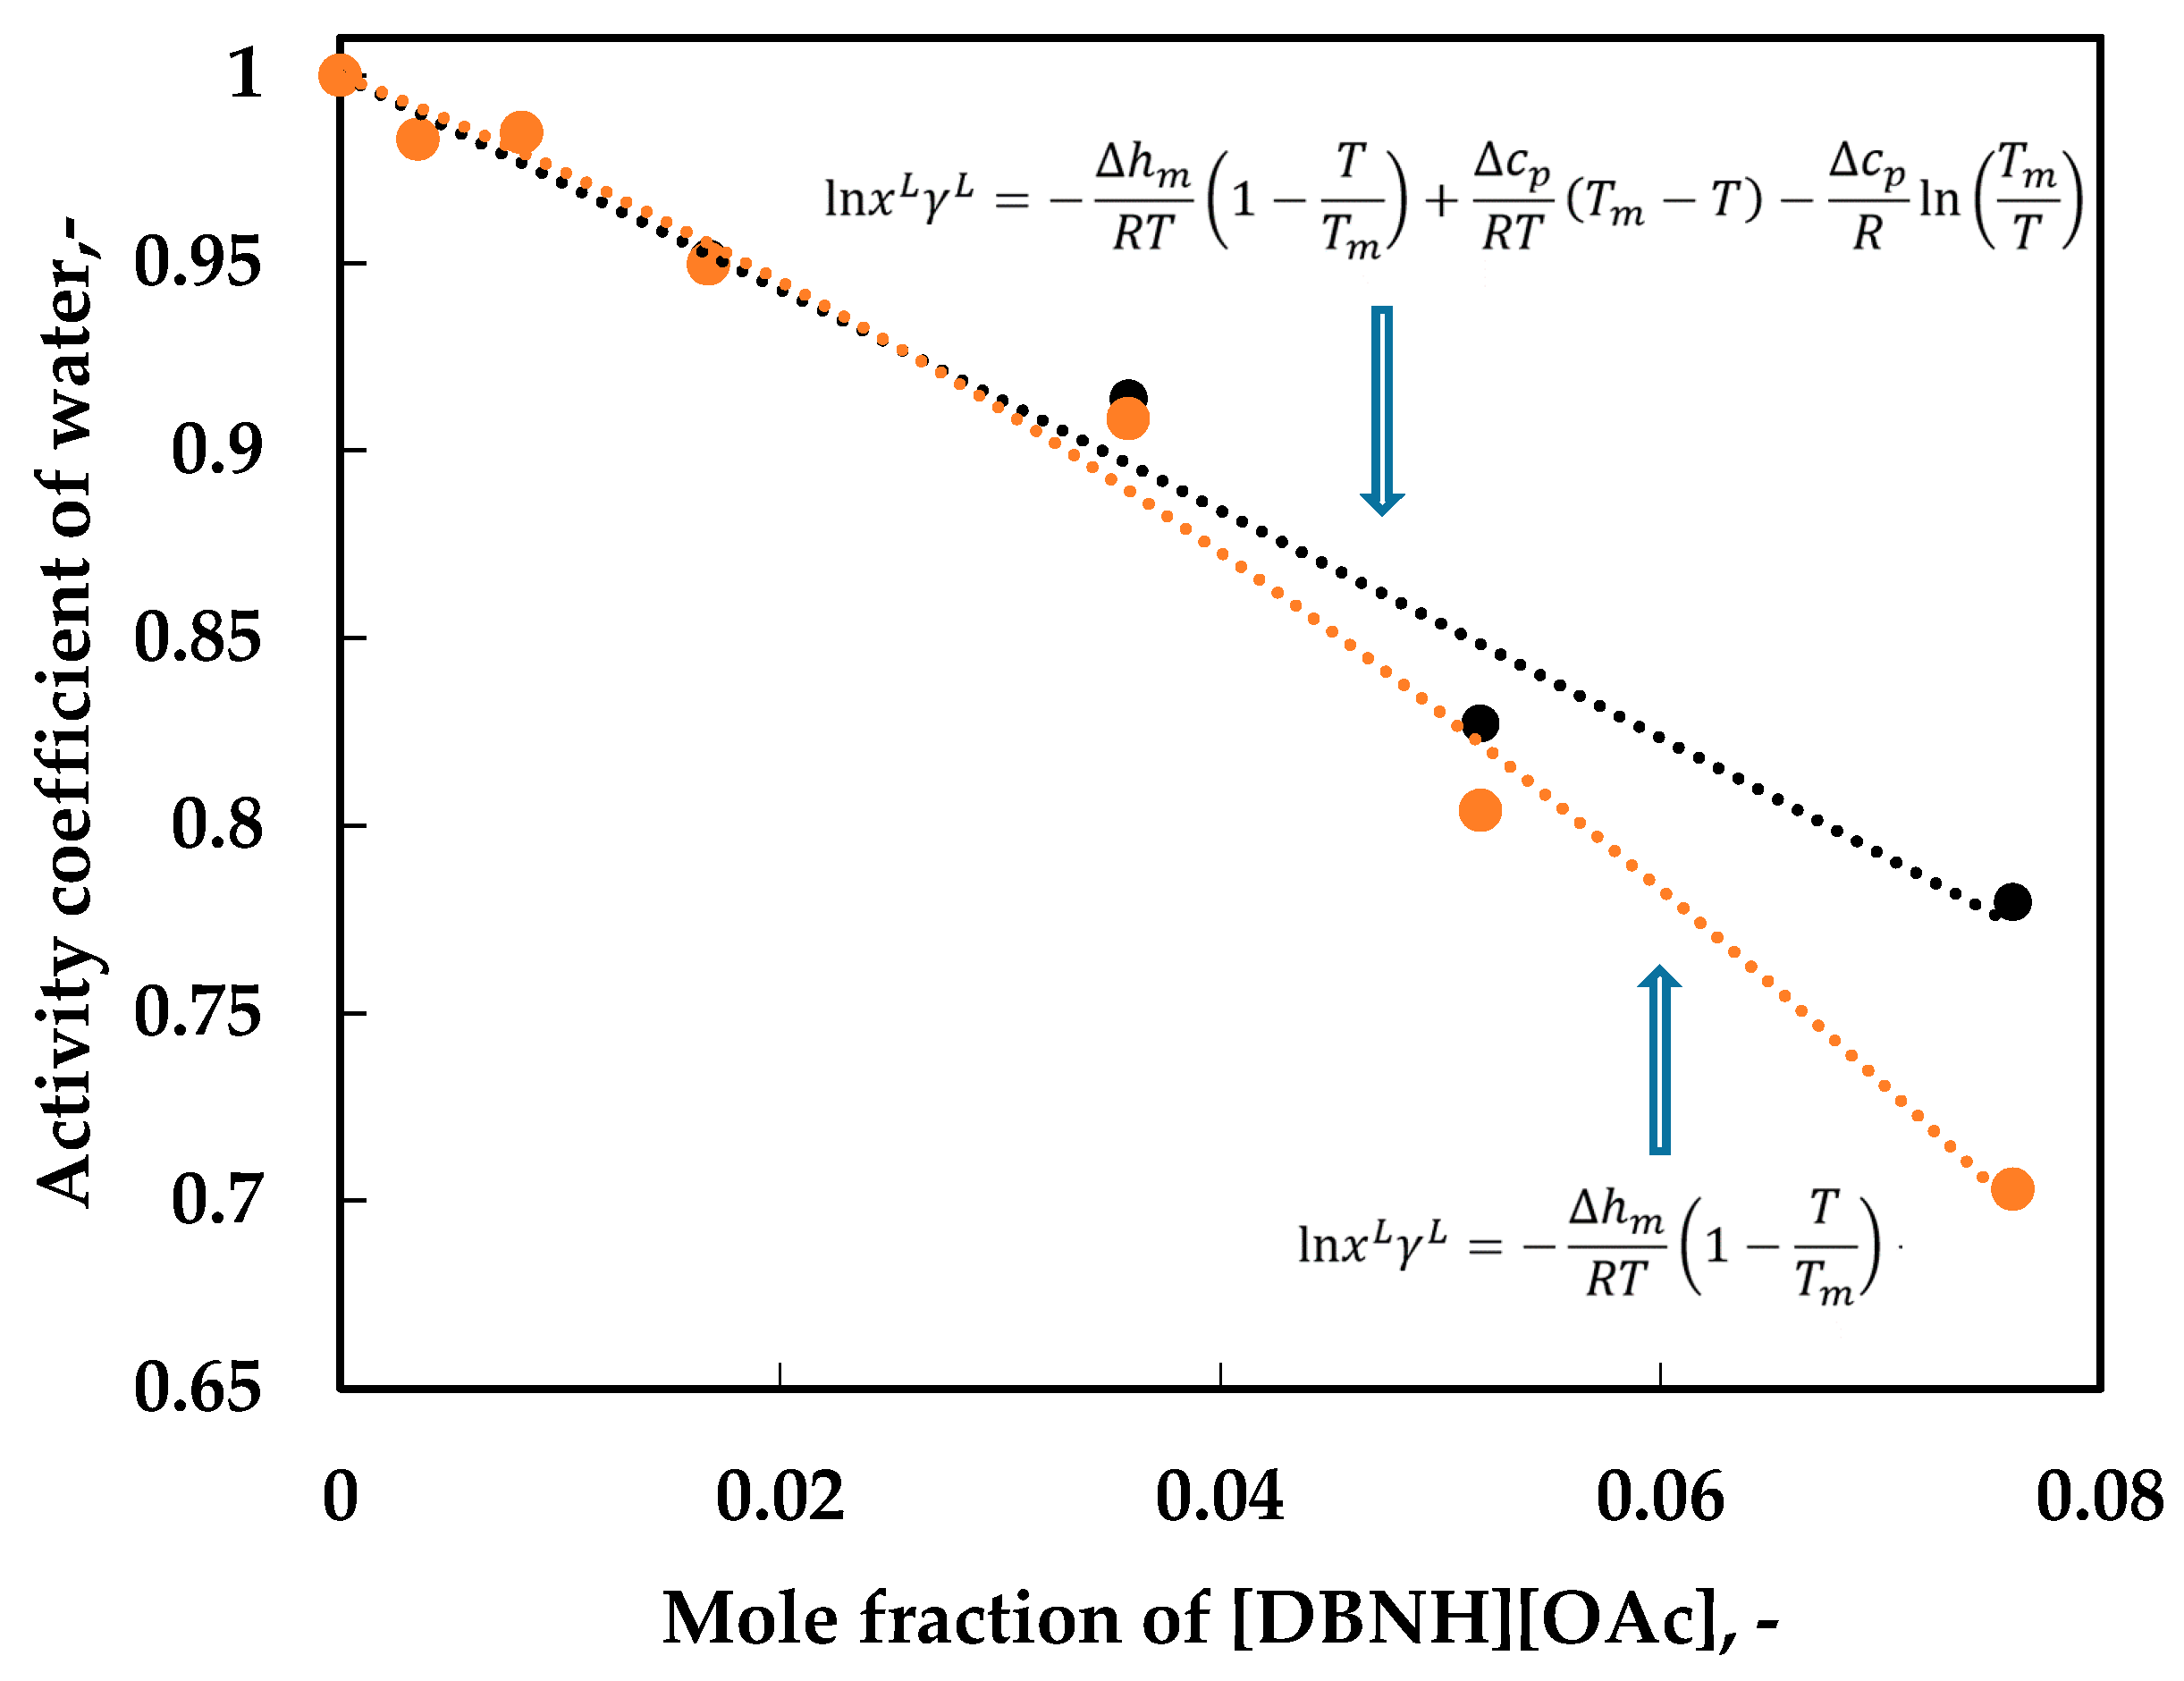
Water activity coefficients for aqueous [DBNH][OAc] solutions from Region 5 of the phase diagram, as calculated by Equations (1) and (2), are presented in Figure 7. It is apparent that aqueous ionic liquid solutions are non-ideal and [DBNH][OAc]–H2O has an attractive interaction, as γL < 1. The freezing point depression data obtained by DSC were used as a basis for the thermodynamic modeling. When the two heat capacity change terms of undercooled water in Equation (2) are considered, this results in a lower level of non-ideality for the studied binary solution in higher concentrations when compared to the model based on Equation (1), where the specific heat capacity change terms are ignored. Furthermore, it is worth noting that Equation (3) was also used to calculate specific heat capacity change at −38.28 °C, even though Equation (3) is only considered to be valid over a temperature range between 0 and −35 °C according to Sippola and Taskinen [22].
3.2. Layer Freeze Crystallization Results
In order to make a comparison between crystal yields and distribution coefficients, the experiments for approximately the same set of five sub-cooling degrees for both aqueous [DBNH][OAc] solutions and both freezing times were carried out (n.b., sub-cooling degrees deviated in range between 0.01 °C and 0.09 °C). All experimental and calculated data can be found in the Supplementary Material (Tables S2–S5).
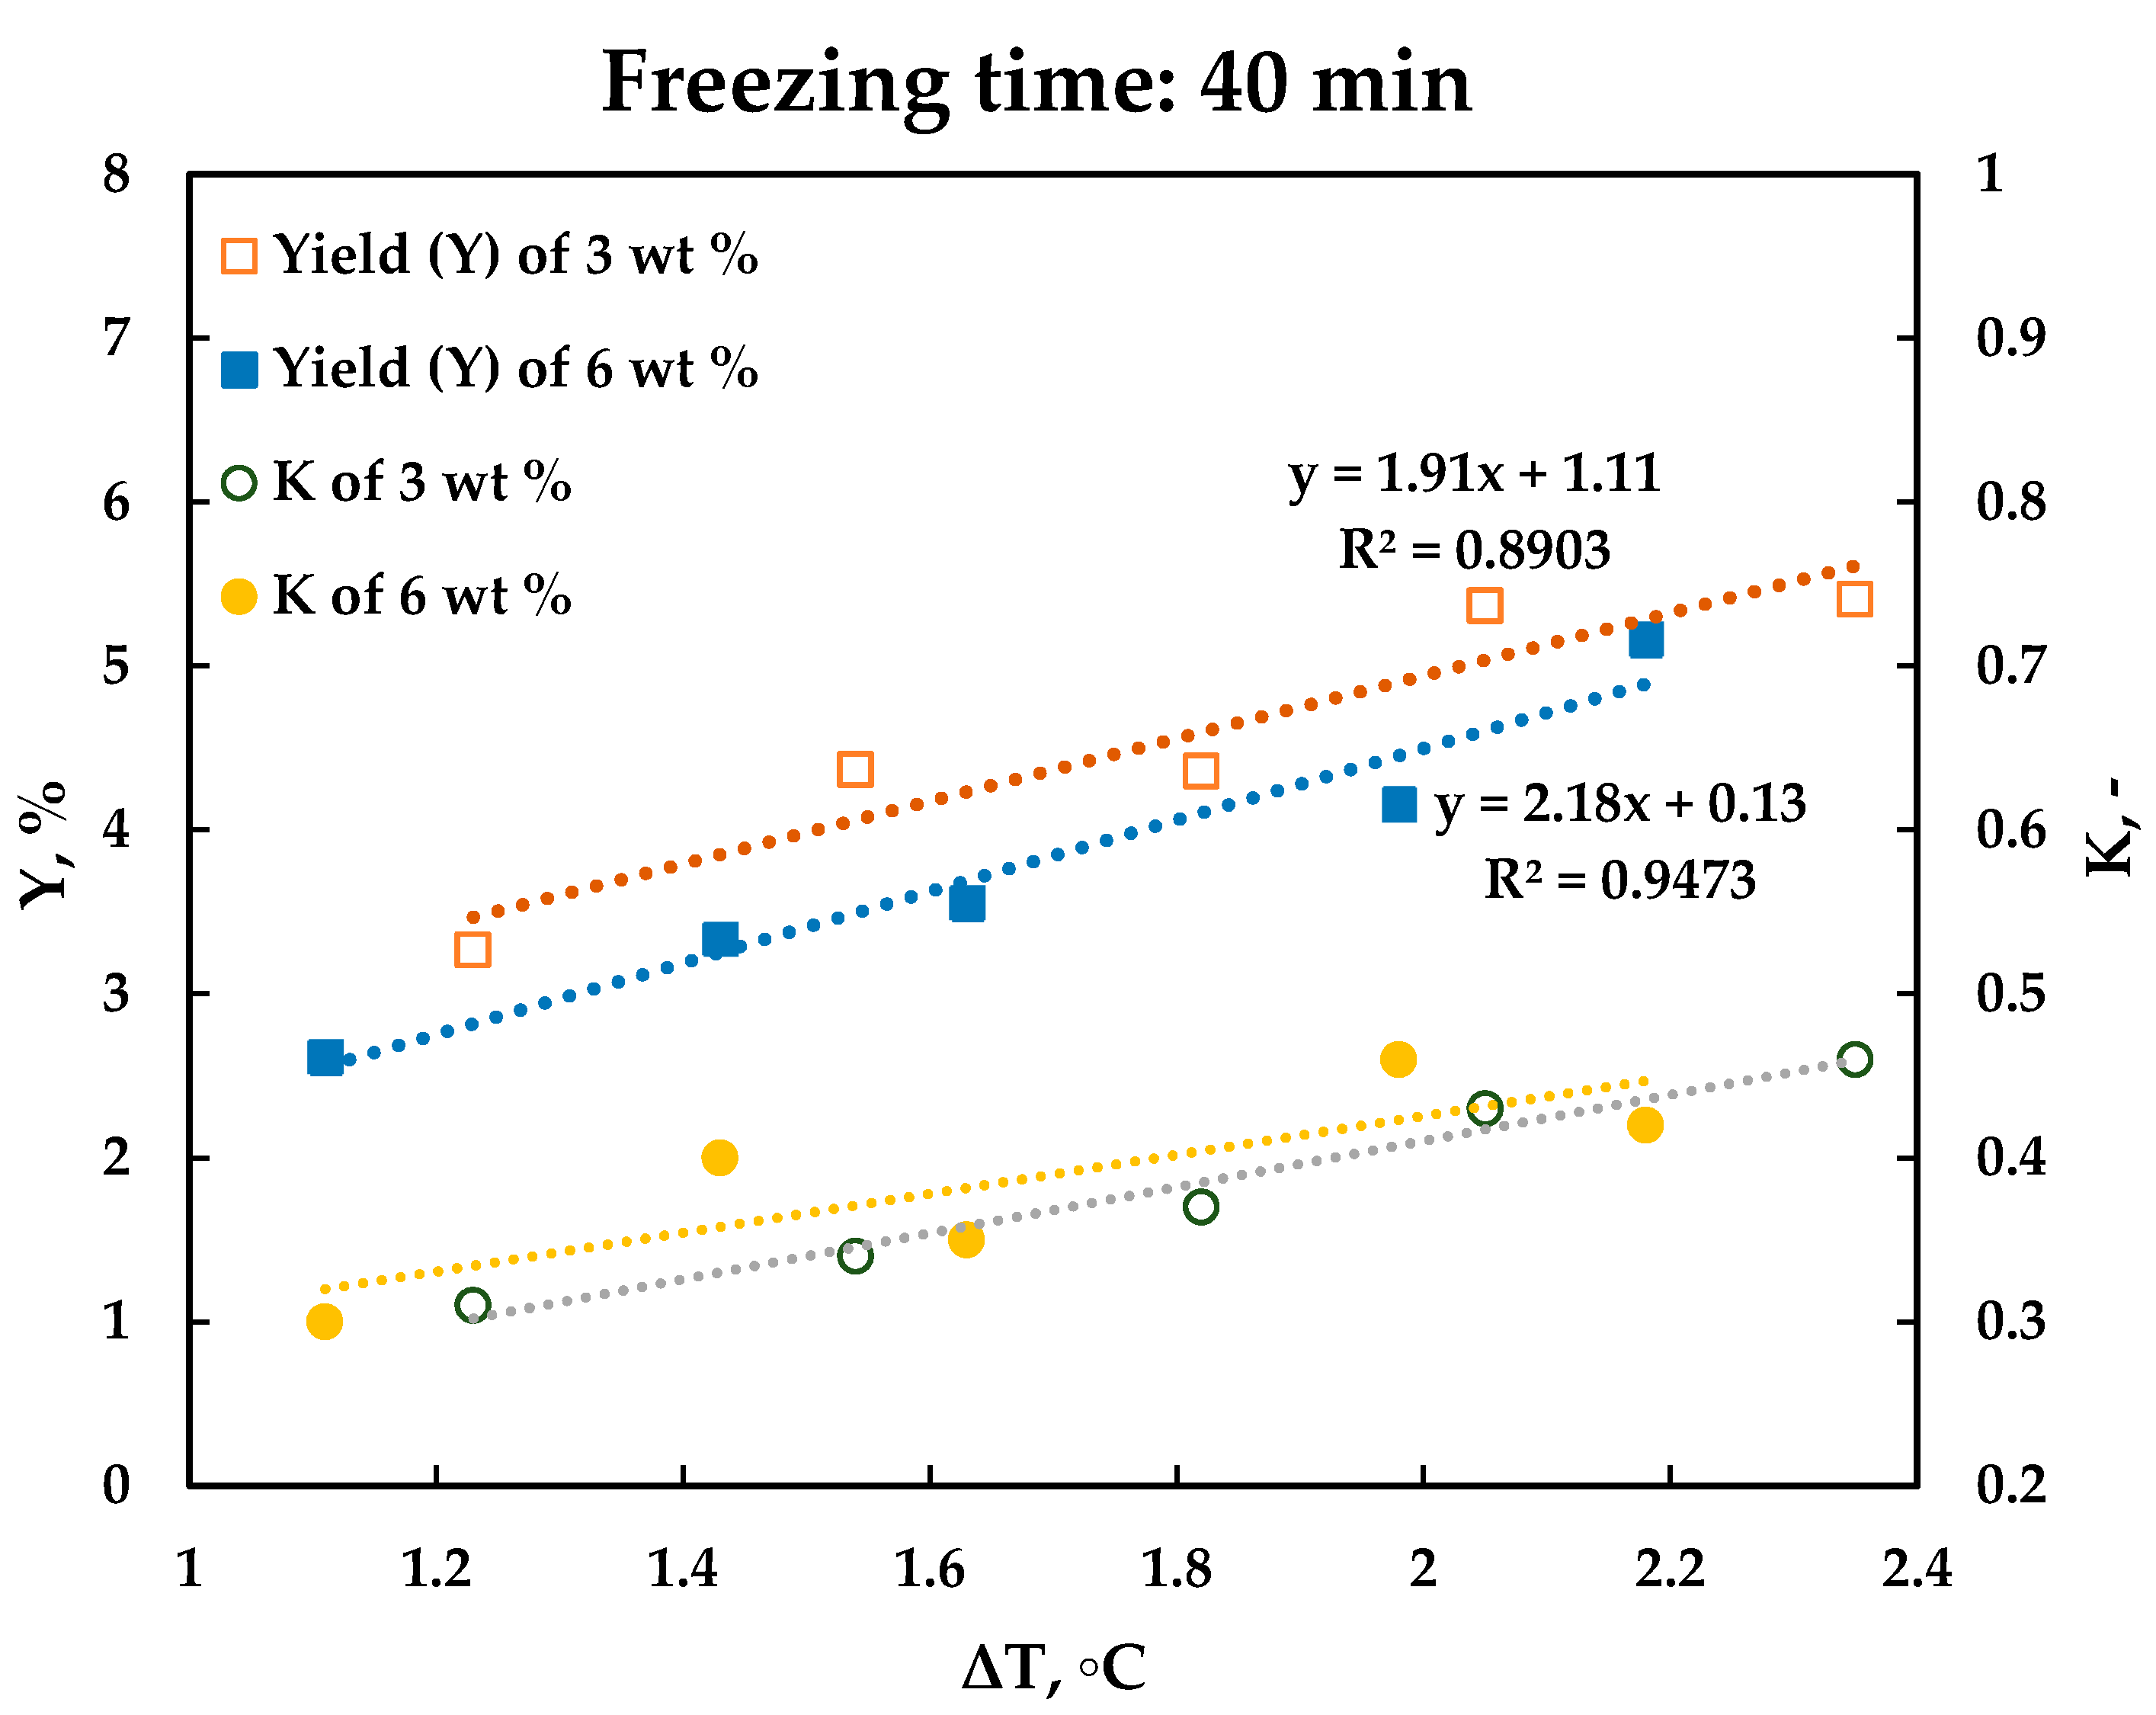
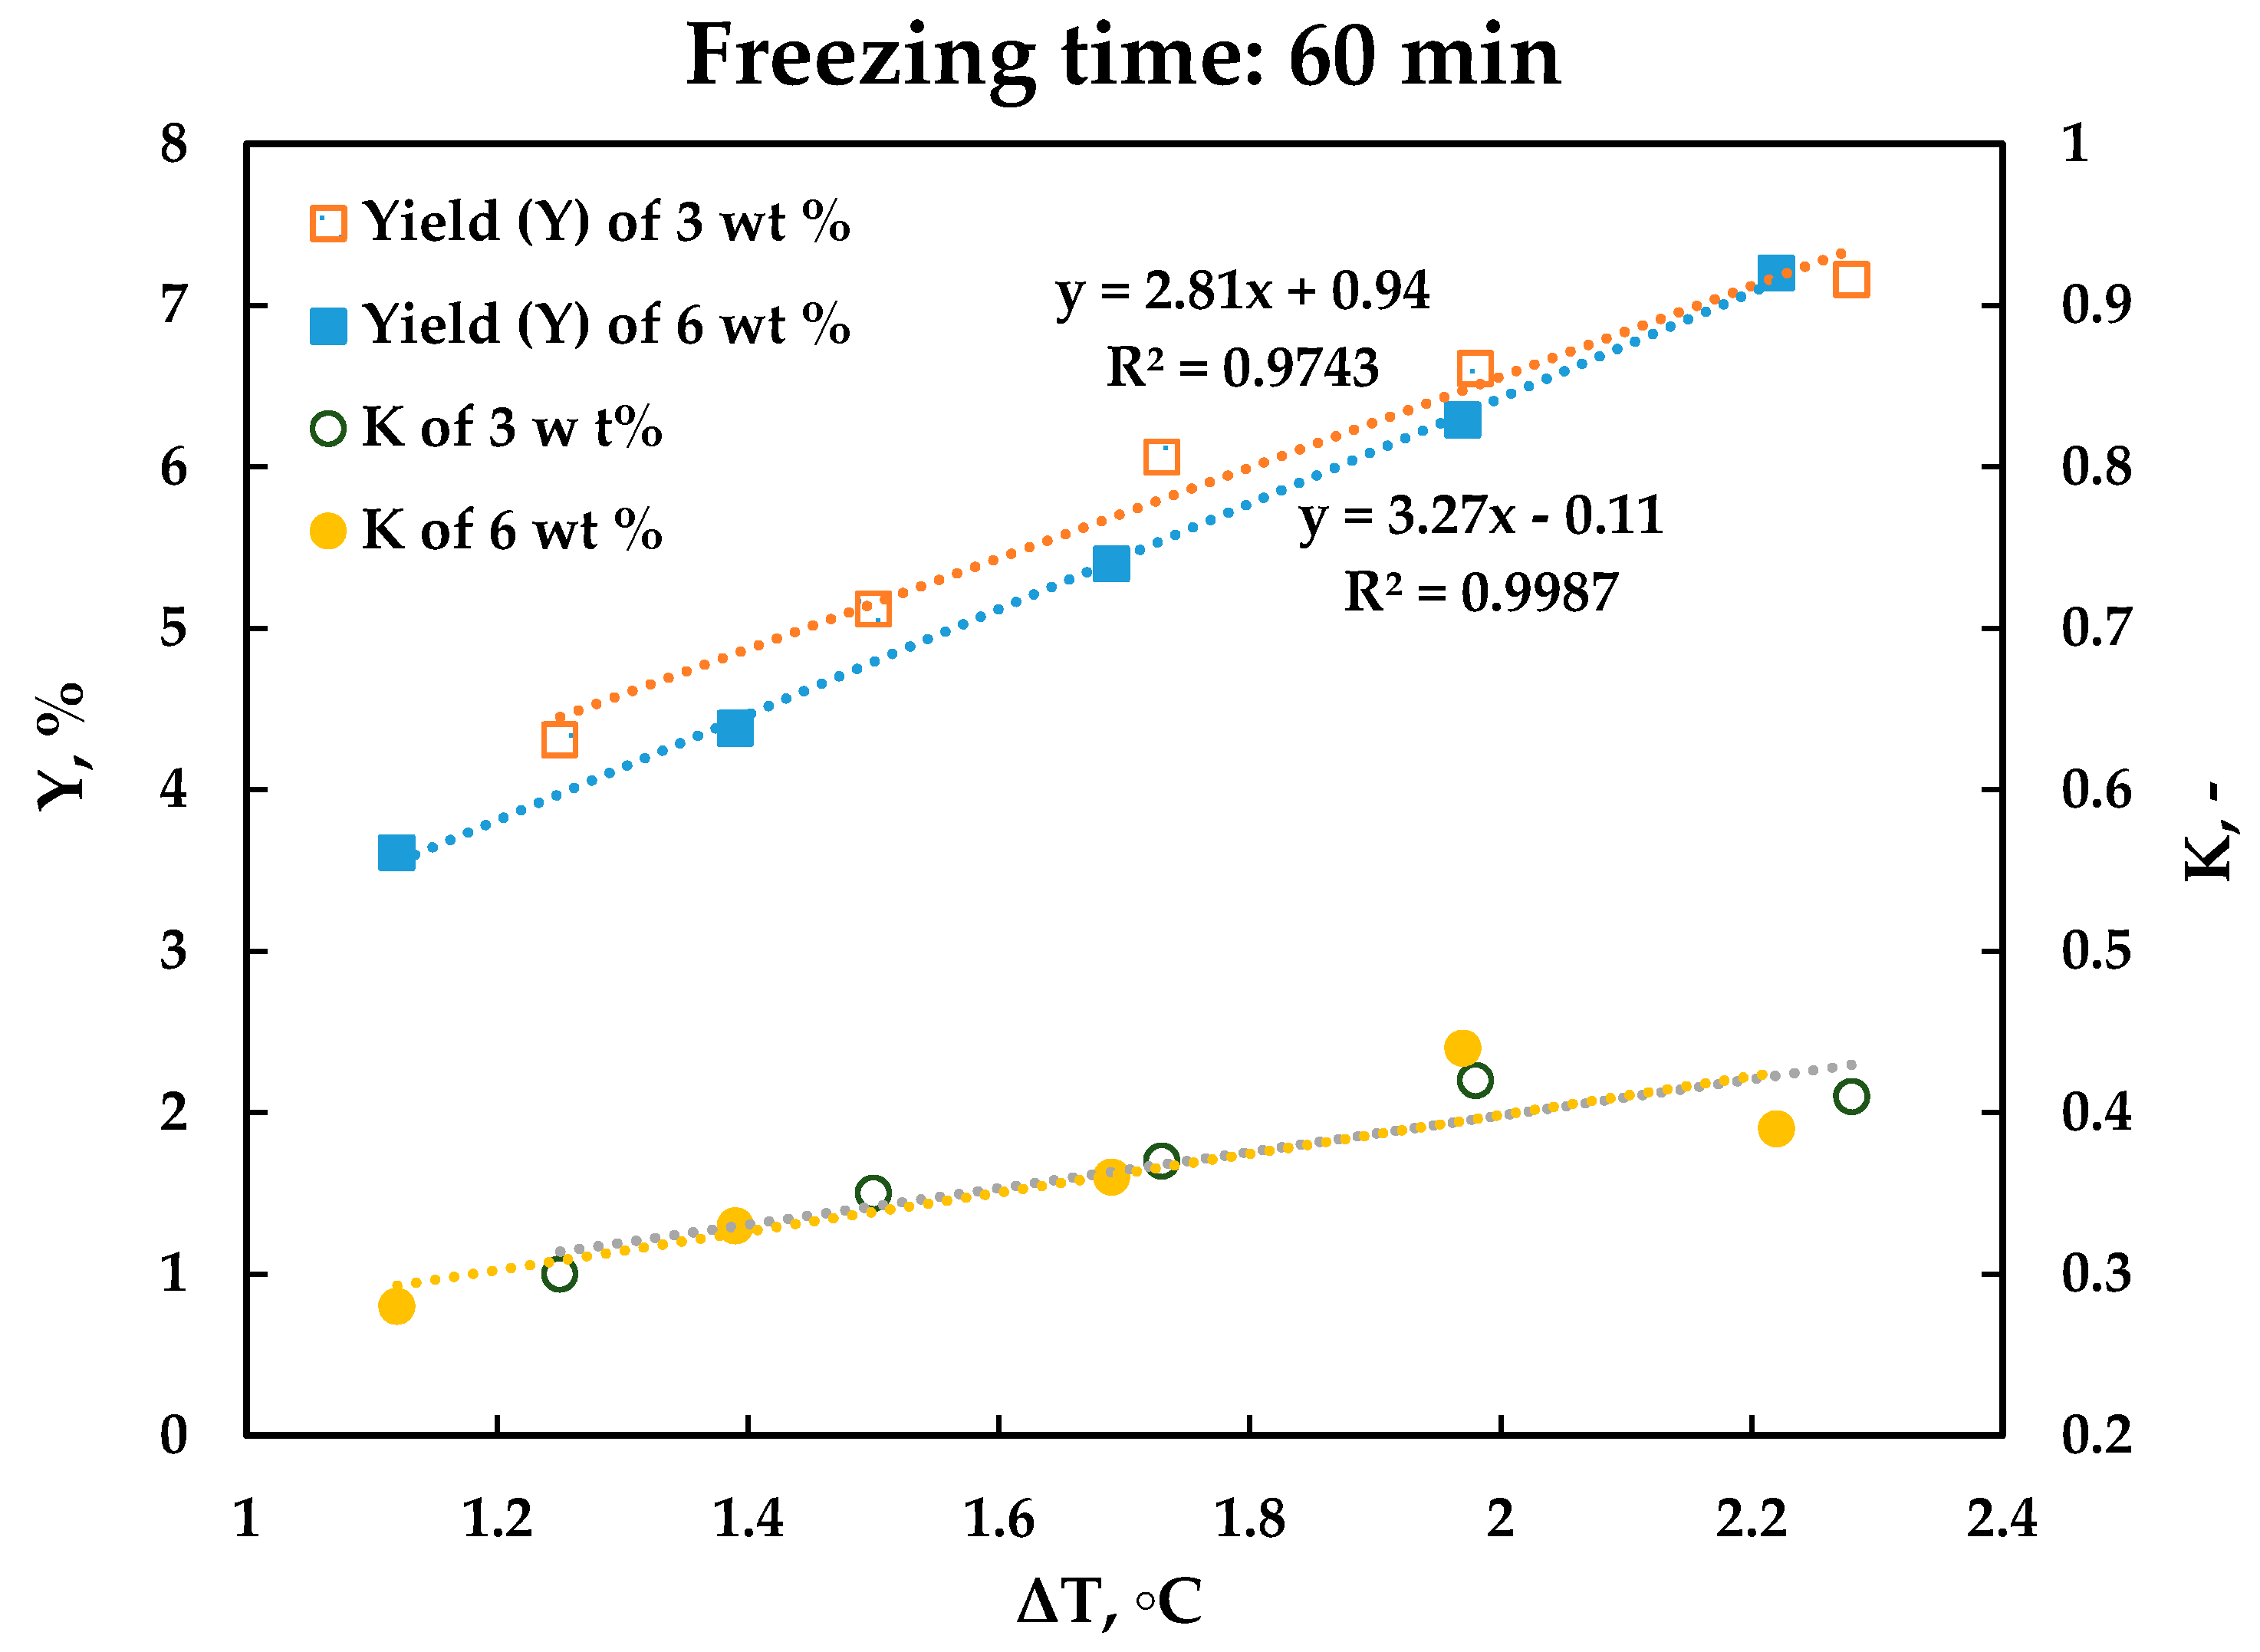
The ice yield and distribution coefficient as a function of sub-cooling degree are presented in Figure 8 and Figure 9. Ice crystal yield as a function of sub-cooling temperature shows a similar linear dependence for both freezing times and for both aqueous [DBNH][OAc] solutions. As expected, the greater the sub-cooling degree, the higher the crystal yield is. The distribution coefficients obtained show the separation efficiency of layer freeze crystallization varied between 0.28 and 0.46. The results indicate that the distribution coefficients for both types of solutions are almost independent of crystallization duration, as there are only negligible differences between the values of distribution coefficients obtained at the same level of sub-cooling for the two different freezing times investigated.
3.3. Suspension Freeze Crystallization Results
Experimental and calculated data are presented in the Supplementary Material (Tables S6–S9). Related sub-cooling degrees for both freezing times were found to vary within a range between 0.02 and 0.12.
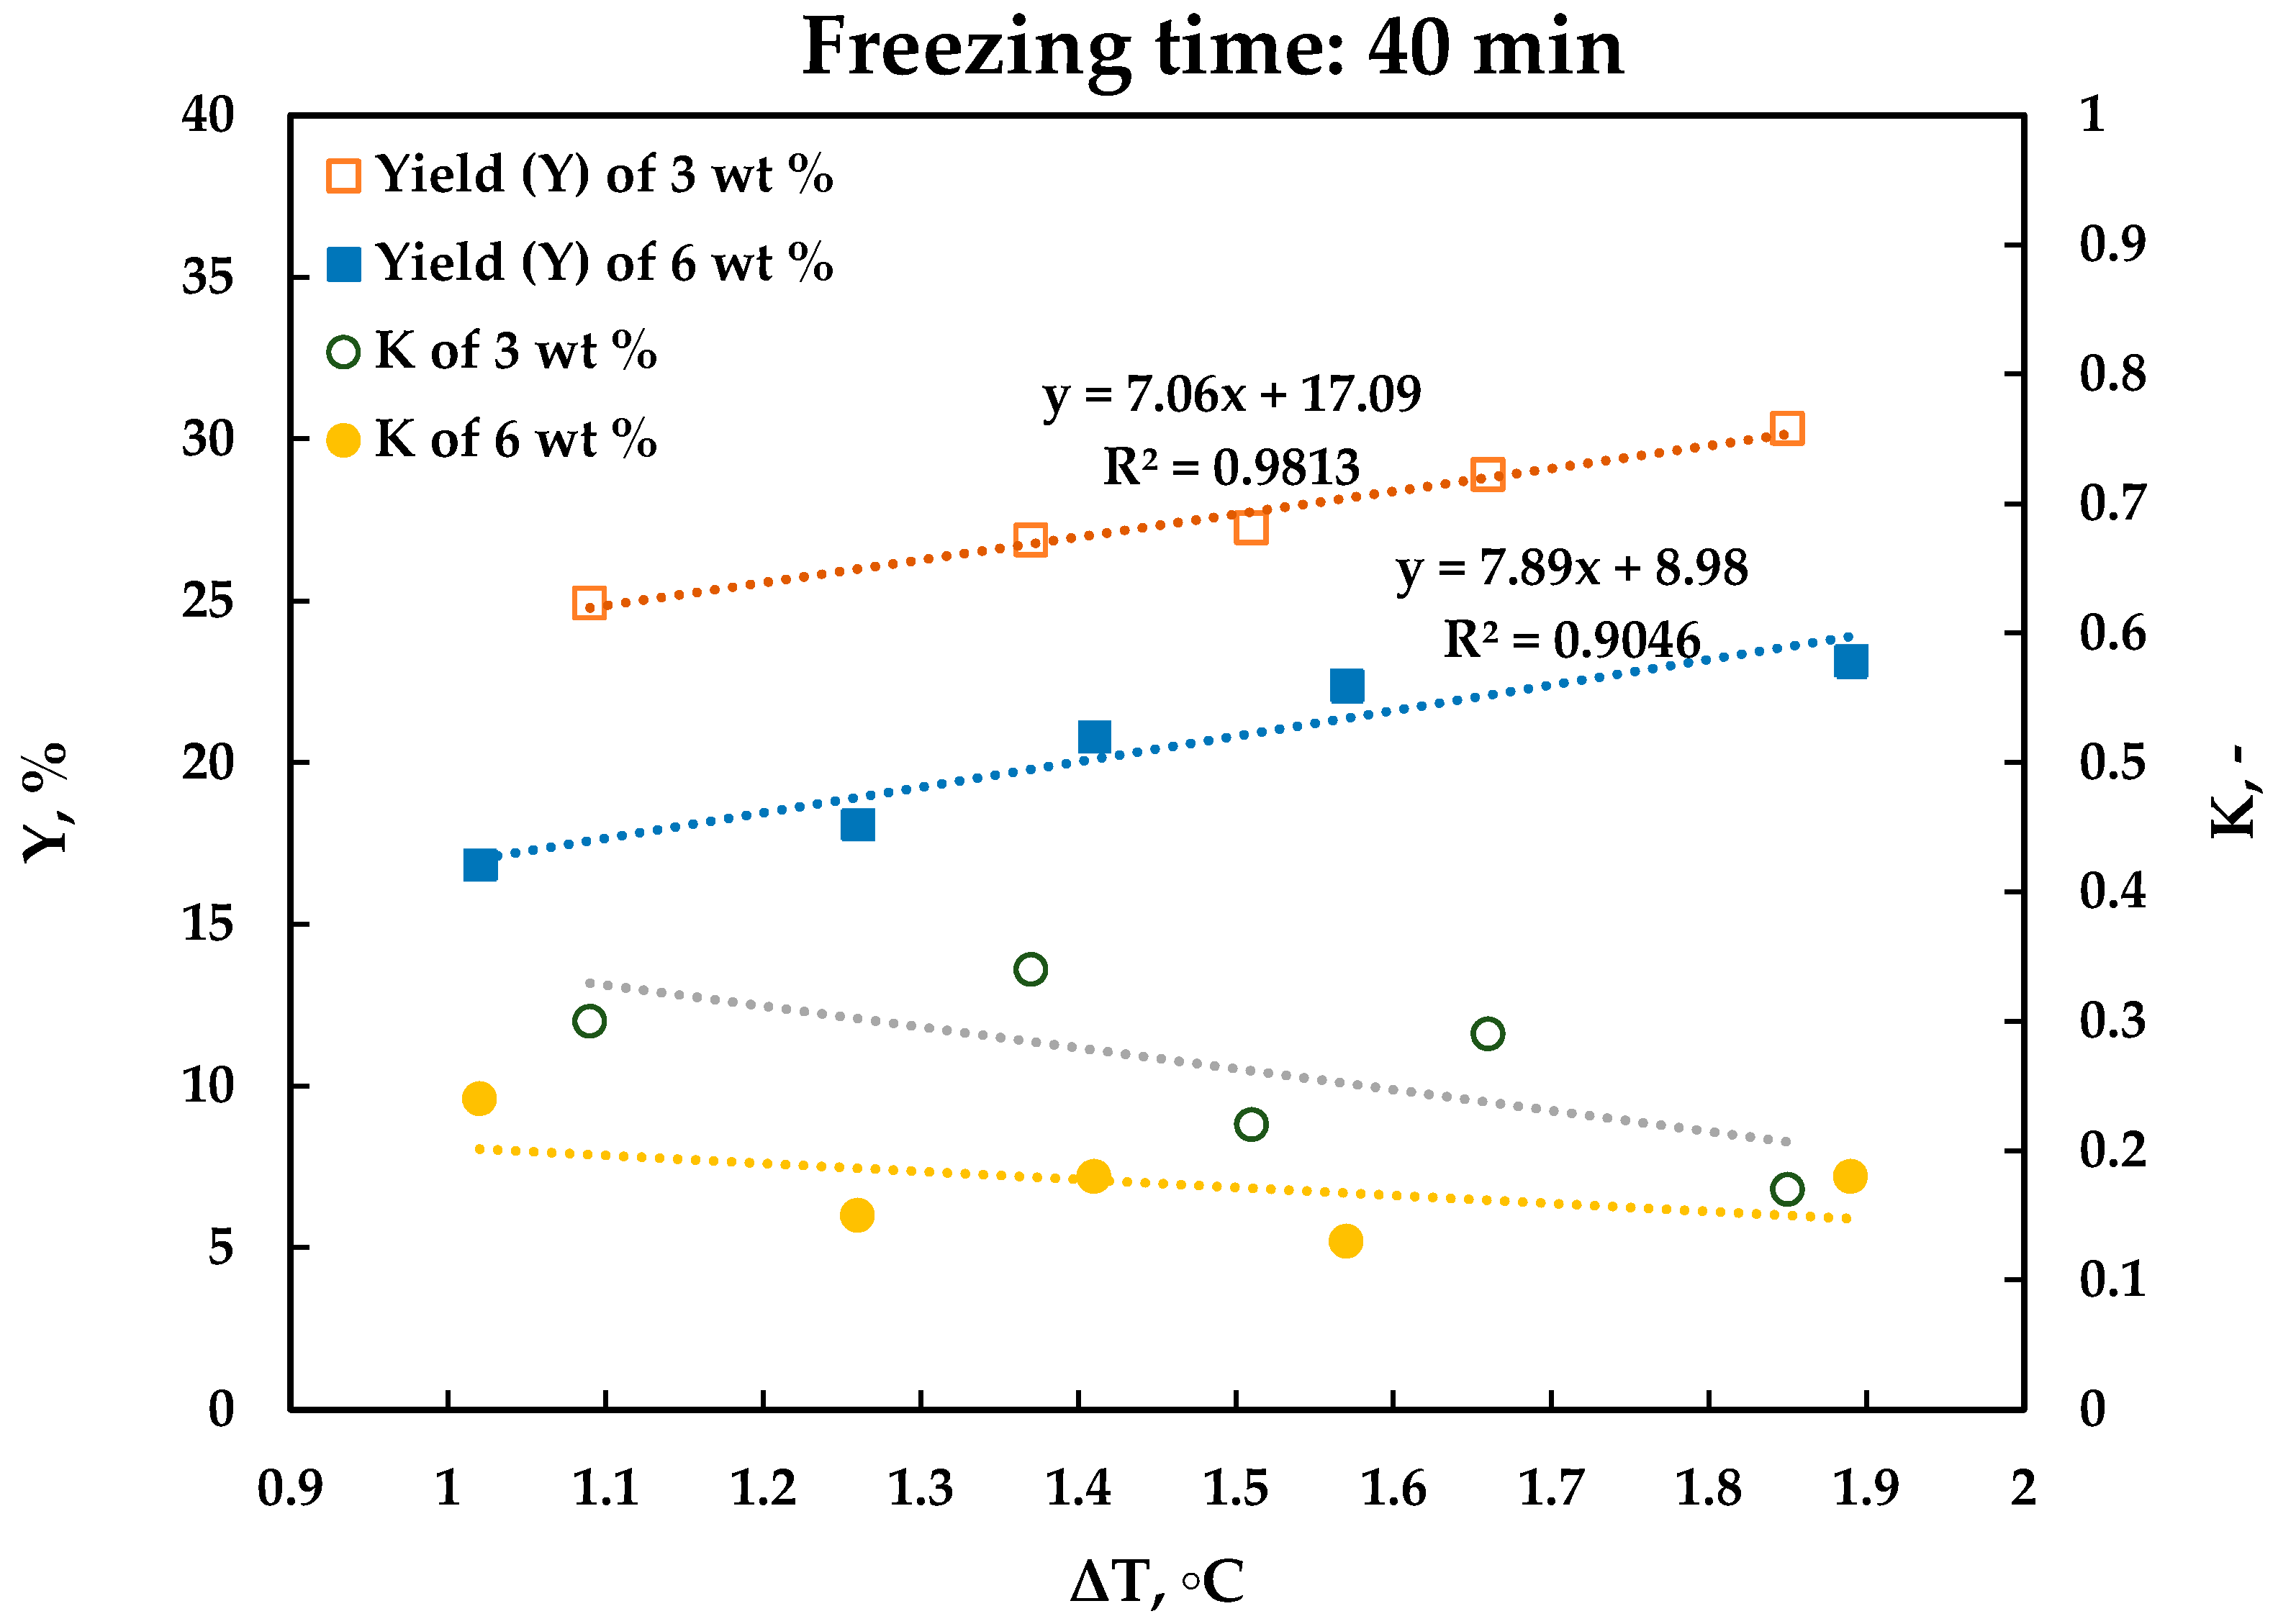
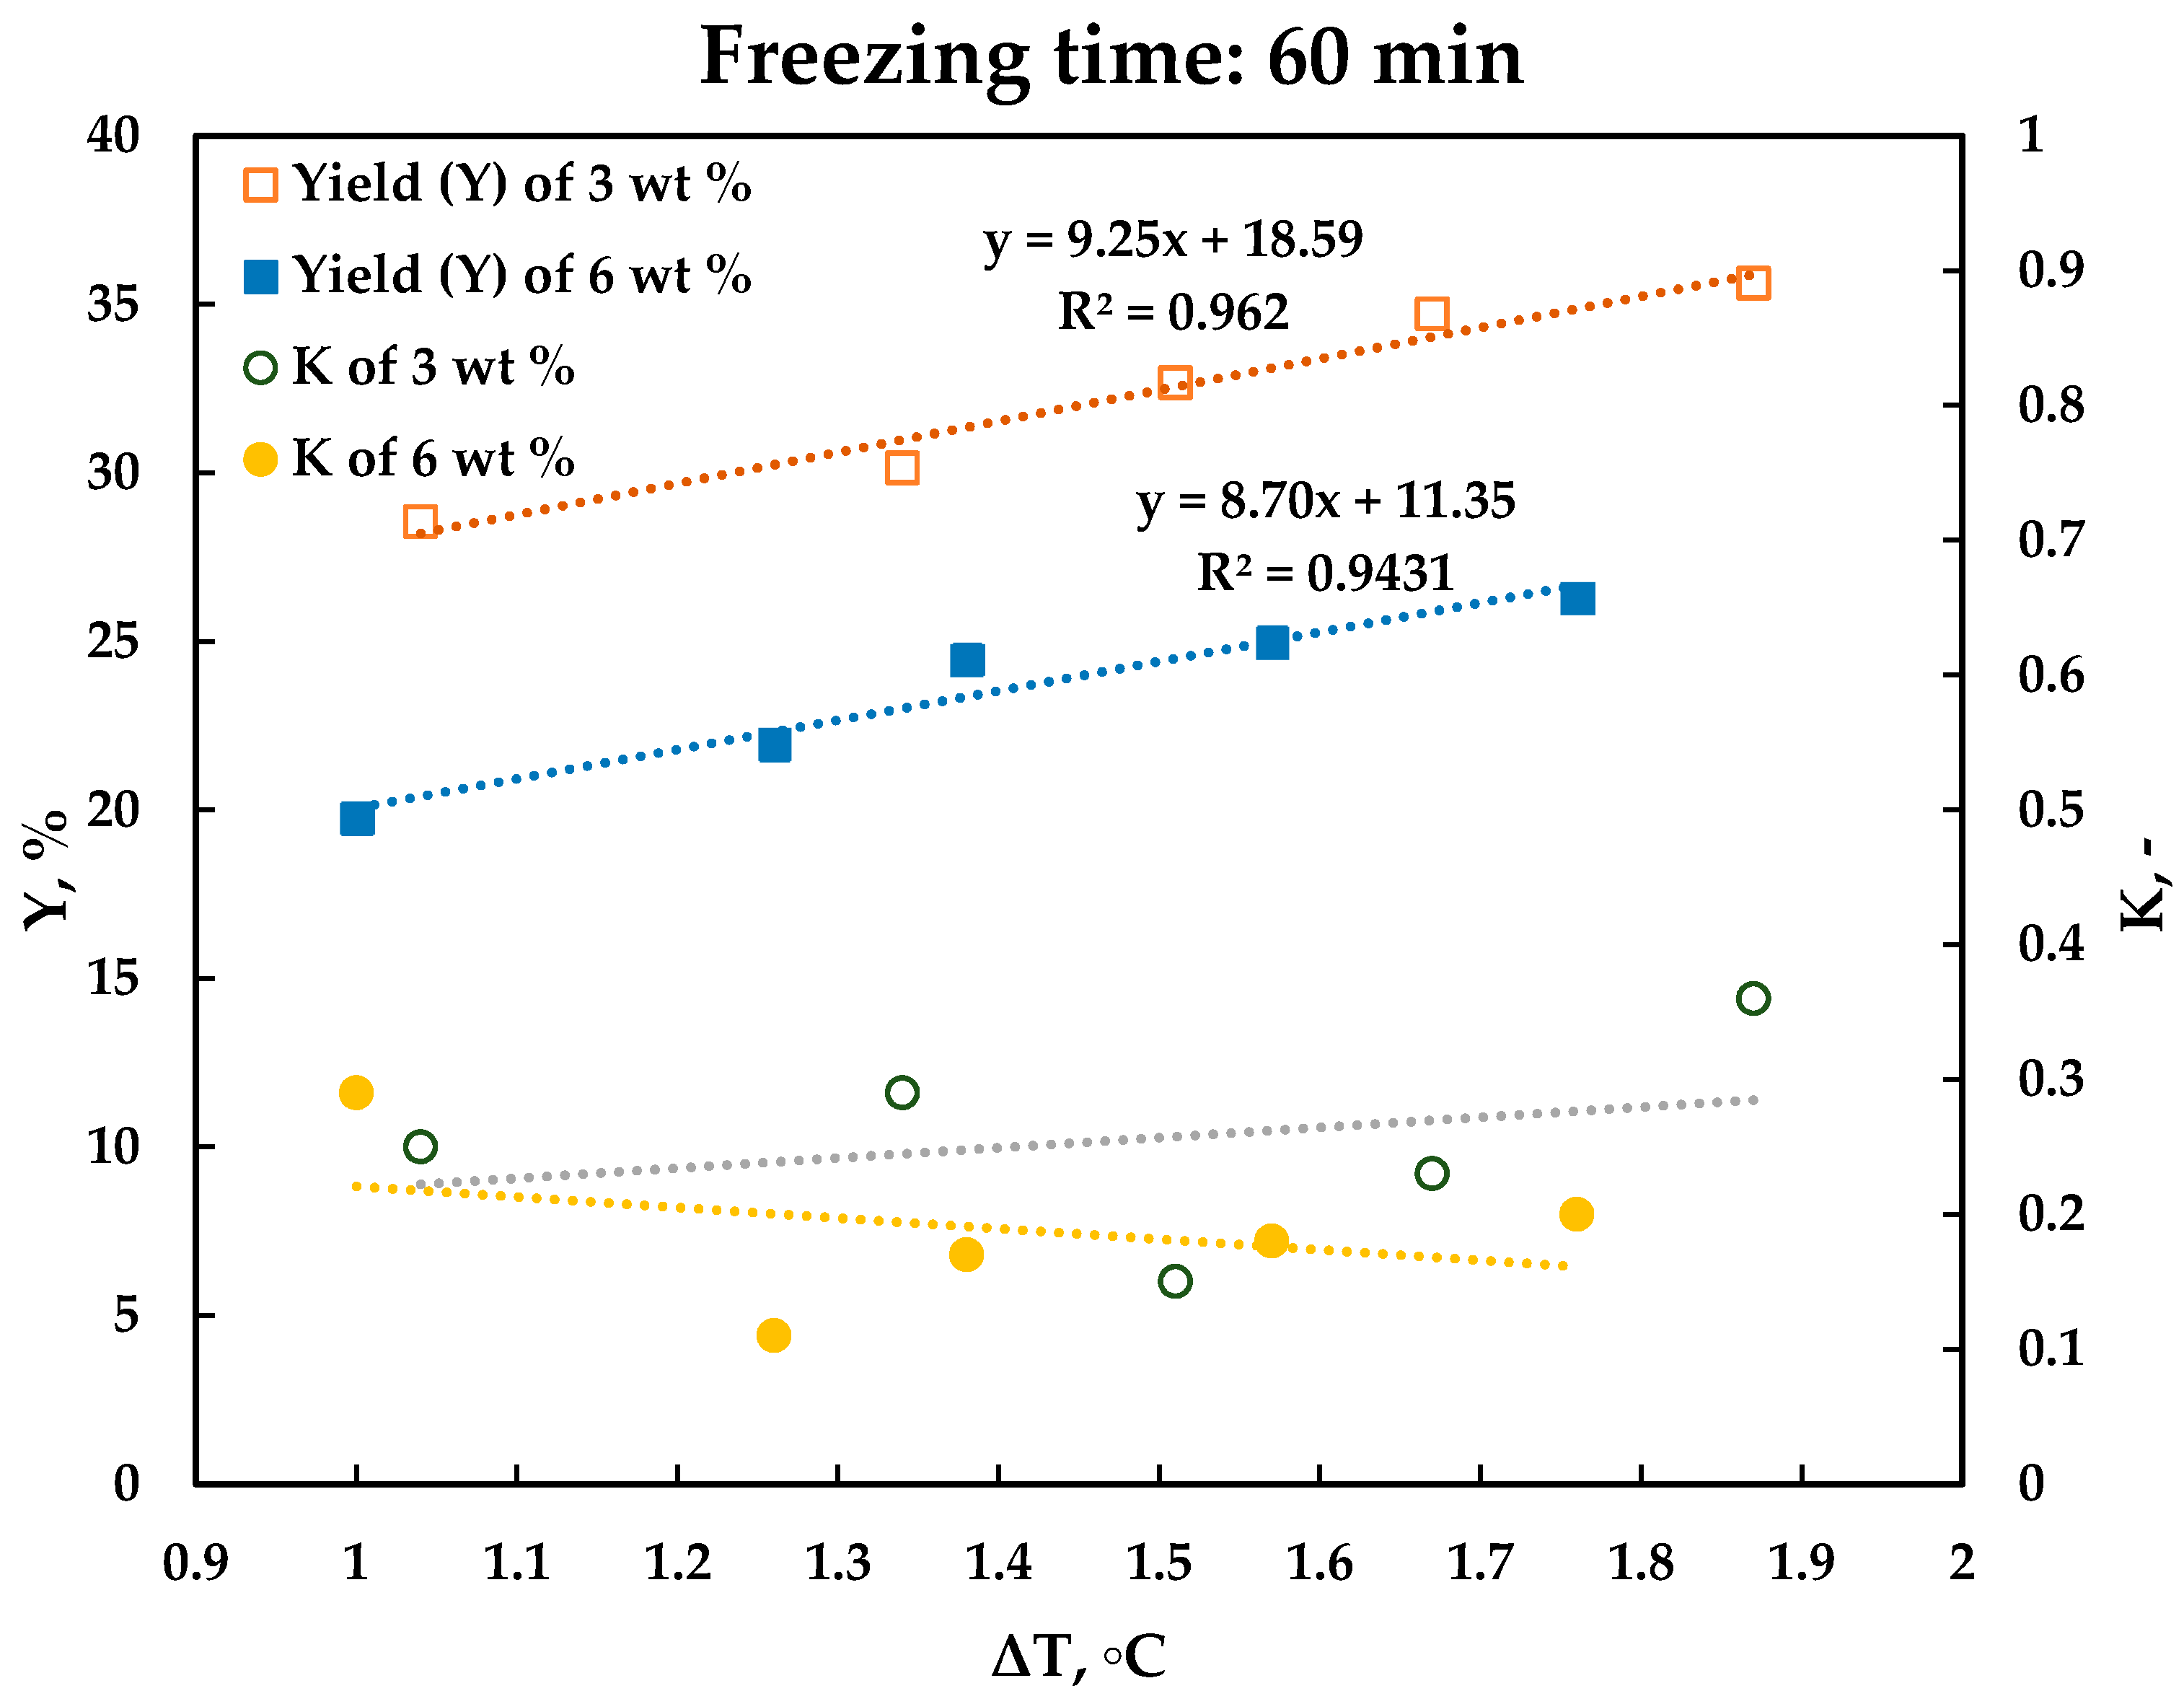
Figure 10 and Figure 11 show the ice yield and distribution coefficients obtained by the suspension FC experiments as function of sub-cooling degree. The ice crystal yield shows a linear dependence on sub-cooling temperature, and its value increases as the degree of sub-cooling increases. Nevertheless, the distribution coefficient is rather independent of sub-cooling degree and the values vary in a range between 0.11 and 0.36.
4. Discussion
Based on the comparison between static layer FC and suspension FC methods, the following observations are presented.
For the same freezing time and approximately the same sub-cooling temperature, ice crystal yields obtained by suspension freeze crystallization are around four-to-eight times higher than yields obtained by static layer freeze crystallization. This is as a result of the higher consumption of cooling energy and larger cooling surface area needed for the suspension crystallization experiments. In this case, the cooling area for suspension FC experiments was around nine times higher than the cooling area for static layer FC experiments.
From Figure 8, Figure 9, Figure 10 and Figure 11, it is apparent that the difference between ice crystal yields obtained from the two types of aqueous solutions is greater in the case of suspension crystallization than in the case of layer crystallization. Moreover, the average value of the distribution coefficient is higher for static layer freeze crystallization, which indicates a lower ice purity than in case of suspension crystallization. These observations suggest that the mother liquor remained entrapped within the ice layer formed by the layer FC method. The distribution coefficient of static layer crystallization also shows a tendency to increase with higher undercooling and supersaturation, while for suspension crystallization the case is observed to display the opposite behavior.
For both freeze crystallization methods, the values of overall ice growth rate or freezing capacity (defined as kilogram of ice per unit of time and employed cooling surface area) are in the range of 10−4–10−3 kg/m2s. Furthermore, layer FC progressed with somewhat faster freezing kinetics, as the values of overall growth rates of layer FC are noticeably higher when compared to those obtained by suspension FC. Nevertheless, for both FC methods, the overall growth rate decreased for the more concentrated solutions of 6 wt.% [DBNH][OAc], which means that [DBNH][OAc] decreased the ice-growth kinetics.
5. Conclusions
In this study, the solid–liquid equilibria of a binary 1,5-diazabicyclo[4.3.0]non-5-enium acetate ([DBNH][OAc])–water compound system as well as layer and suspension freeze crystallization as a concentration method were investigated. The main conclusions that can be drawn from this study are as follows:
- Based on obtained solid–liquid equilibria, it was concluded that melt crystallization can be employed as a concentration method for aqueous [DBNH][OAc] solutions with water content higher than 54.3 wt.%.
- Water activity coefficient results calculated in mole fraction range between 0 and 0.08 showed that [DBNH][OAc] solutions are non-ideal solutions with an attractive interaction between [DBNH][OAc] and water molecules.
- Single-step suspension freeze crystallization is a more suitable concentration method for aqueous [DNBH][OAc] solutions than single-step layer freeze crystallization, based on the comparison between ice crystal yield and ice purity of these two freeze crystallization methods.
Supplementary Materials
The following are available online at https://0-www-mdpi-com.brum.beds.ac.uk/2073-4352/10/3/147/s1, Figure S1: Schematic diagram of extracting thermal data from a DSC curve, Table S1: Liquidus and glass transition (or eutectic temperature) temperatures extracted from DSC curves, Table S2: Layer freeze crystallization data of aqueous 3 wt.% [DBNH][OAc] solutions with a freezing time of 40 min, Table S3: Layer freeze crystallization data of aqueous 3 wt.% [DBNH][OAc] solutions with a freezing time of 60 min, Table S4: Layer freeze crystallization data of aqueous 6 wt.% [DBNH][OAc] solutions with a freezing time of 40 min, Table S5: Layer freeze crystallization data of aqueous 6 wt.% [DBNH][OAc] solutions with a freezing time of 60 min, Table S6: Suspension freeze crystallization data of aqueous 3 wt.% [DBNH][OAc] solutions with a freezing time of 40 min, Table S7: Suspension freeze crystallization data of aqueous 3 wt.% [DBNH][OAc] solutions with a freezing time of 60 min, Table S8: Suspension freeze crystallization data of aqueous 6 wt.% [DBNH][OAc] solutions with a freezing time of 40 min, Table S9: Suspension freeze crystallization data of aqueous 6 wt.% [DBNH][OAc] solutions with a freezing time of 60 min.
Author Contributions
Conceptualization of freeze crystallization experiments, N.O. and M.L.-K.; conceptualization of DSC analysis, L.Y. and H.L.; methodology, validation, and investigation of freeze crystallization, N.O.; methodology, validation, and investigation of DSC analysis L.Y.; writing—original draft, N.O.; writing—review and editing, N.O., L.Y., and M.L.-K.; visualization, N.O. and L.Y.; supervision, M.L.-K. and H.L. All authors have read and agreed to the published version of the manuscript.
Funding
The first author is thankful to Aalto CHEM’s funding for financial support.
Acknowledgments
The authors are grateful to Han Bing and Peter Schulze for their valuable assistance during experimental work as well as to Sanna Hellsten for providing synthetized ionic liquid.
Conflicts of Interest
The authors declare no conflict of interest. The funders had no role in the design of the study; in the collection, analyses, or interpretation of data; in the writing of the manuscript; or in the decision to publish the results.
References
- Ulrich, J. Introduction. In Melt Crystallization: Fundamentals, Equipment and Applications; Ulrich, J., Glade, H., Eds.; Berichte aus der Verfahrenstechnik; Shaker: Aachen, Germany, 2003; pp. 1–6. [Google Scholar]
- Parviainen, A.; Wahlström, R.; Liimatainen, U.; Liitiä, T.; Rovio, S.; Helminen, J.K.J.; Hyväkkö, U.; King, A.W.T.; Suurnäkki, A.; Kilpeläinen, I. Sustainability of Cellulose Dissolution and Regeneration in 1,5-Diazabicyclo[4.3.0]Non−5-Enium Acetate: A Batch Simulation of the IONCELL-F Process. RSC Adv. 2015, 5, 69728–69737. [Google Scholar] [CrossRef] [Green Version]
- Wendler, F.; Todi, L.-N.; Meister, F. Thermostability of Imidazolium Ionic Liquids as Direct Solvents for Cellulose. Thermochim. Acta 2012, 528, 76–84. [Google Scholar] [CrossRef]
- Vigier, K.D.O.; Chatel, G.; Jérôme, F. Contribution of Deep Eutectic Solvents for Biomass Processing: Opportunities, Challenges, and Limitations. ChemCatChem 2015, 7, 1250–1260. [Google Scholar] [CrossRef]
- Freire, M.G.; Neves, C.M.S.S.; Marrucho, I.M.; Coutinho, J.A.P.; Fernandes, A.M. Hydrolysis of Tetrafluoroborate and Hexafluorophosphate Counter Ions in Imidazolium-Based Ionic Liquids. J. Phys. Chem. A 2010, 114, 3744–3749. [Google Scholar] [CrossRef] [PubMed]
- Meine, N.; Benedito, F.; Rinaldi, R. Thermal Stability of Ionic Liquids Assessed by Potentiometric Titration. Green Chem. 2010, 12, 1711. [Google Scholar] [CrossRef]
- Ahmad, W.; Ostonen, A.; Jakobsson, K.; Uusi-Kyyny, P.; Alopaeus, V.; Hyväkkö, U.; King, A.W.T. Feasibility of Thermal Separation in Recycling of the Distillable Ionic Liquid [DBNH][OAc] in Cellulose Fiber Production. Chem. Eng. Res. Des. 2016, 114, 287–298. [Google Scholar] [CrossRef]
- Kakko, T.; King, A.W.T.; Kilpeläinen, I. Homogenous Esterification of Cellulose Pulp in [DBNH][OAc]. Cellulose 2017, 24, 5341–5354. [Google Scholar] [CrossRef] [Green Version]
- Hanabusa, H.; Izgorodina, E.I.; Suzuki, S.; Takeoka, Y.; Rikukawa, M.; Yoshizawa-Fujita, M. Cellulose-Dissolving Protic Ionic Liquids as Low Cost Catalysts for Direct Transesterification Reactions of Cellulose. Green Chem. 2018, 20, 1412–1422. [Google Scholar] [CrossRef]
- Ulrich, J.; Bülau, H.C. Melt Crystallization. In Handbook of Industrial Crystallization, 2nd ed.; Myerson, A.S., Ed.; Elsevier Science and Technology: Oxford, UK, 2001; pp. 161–180, ProQuest Ebook Central; Available online: https://0-ebookcentral-proquest-com.brum.beds.ac.uk/lib/aalto-ebooks/detail.action?docID=317222 (accessed on 31 January 2020).
- Lewis, A.; Seckler, M.; Kramer, H.J.M.; van Rosmalen, G. Industrial Crystallization: Fundamentals and Applications; Cambridge University Press: Cambridge, UK, 2015; pp. 261–281. [Google Scholar]
- Liu, Y.; Meyer, A.S.; Nie, Y.; Zhang, S.; Thomsen, K. Low Energy Recycling of Ionic Liquids via Freeze Crystallization during Cellulose Spinning. Green Chem. 2018, 20, 493–501. [Google Scholar] [CrossRef]
- Parviainen, A.; King, A.W.T.; Mutikainen, I.; Hummel, M.; Selg, C.; Hauru, L.K.J.; Sixta, H.; Kilpeläinen, I. Predicting Cellulose Solvating Capabilities of Acid-Base Conjugate Ionic Liquids. ChemSusChem 2013, 6, 2161–2169. [Google Scholar] [CrossRef] [PubMed]
- Stepan, A.M.; Michud, A.; Hellstén, S.; Hummel, M.; Sixta, H. IONCELL-P&F: Pulp Fractionation and Fiber Spinning with Ionic Liquids. Ind. Eng. Chem. Res. 2016, 55, 8225–8233. [Google Scholar] [CrossRef]
- Hauru, L.K.J.; Hummel, M.; Michud, A.; Sixta, H. Dry Jet-Wet Spinning of Strong Cellulose Filaments from Ionic Liquid Solution. Cellulose 2014, 21, 4471–4481. [Google Scholar] [CrossRef]
- Ma, Y.; Stubb, J.; Kontro, I.; Nieminen, K.; Hummel, M.; Sixta, H. Filament Spinning of Unbleached Birch Kraft Pulps: Effect of Pulping Intensity on the Processability and the Fiber Properties. Carbohydr. Polym. 2018, 179, 145–151. [Google Scholar] [CrossRef] [PubMed] [Green Version]
- Asaadi, S.; Hummel, M.; Ahvenainen, P.; Gubitosi, M.; Olsson, U.; Sixta, H. Structural Analysis of Ioncell-F Fibres from Birch Wood. Carbohydr. Polym. 2018, 181, 893–901. [Google Scholar] [CrossRef] [PubMed]
- Hauru, L.K.J.; Hummel, M.; Nieminen, K.; Michud, A.; Sixta, H. Cellulose Regeneration and Spinnability from Ionic Liquids. Soft Matter 2016, 12, 1487–1495. [Google Scholar] [CrossRef] [PubMed] [Green Version]
- Lê, H.Q.; Sixta, H.; Hummel, M. Ionic Liquids and Gamma-Valerolactone as Case Studies for Green Solvents in the Deconstruction and Refining of Biomass. Curr. Opin. Green Sustain. Chem. 2019, 18, 20–24. [Google Scholar] [CrossRef]
- Gabbott, P. A Practical Introduction to Differential Scanning Calorimetry. In Principles and Applications of Thermal Analysis; Gabbott, P., Ed.; Blackwell Publishing Ltd.: Oxford, UK, 2008; pp. 1–50. [Google Scholar] [CrossRef]
- Gmehling, J.; Kolbe, B.; Kleiber, M.; Rarey, J. Chemical Thermodynamics for Process. Simulation; Wiley-VCH Verlag & Co. KGaA: Weinheim, Germany, 2012; pp. 405–437. [Google Scholar]
- Sippola, H.; Taskinen, P. Activity of Supercooled Water on the Ice Curve and Other Thermodynamic Properties of Liquid Water up to the Boiling Point at Standard Pressure. J. Chem. Eng. Data 2018, 63, 2986–2998. [Google Scholar] [CrossRef] [PubMed]
Figure 1.
Experimental setup of static layer freeze crystallization: (1) crystallizer, (2) cold finger, (3) thermostats, (4) Pt 100 thermosensor, (5) thermocouples, (6) data processing device, (7) coolant streams circulating through jacketed vessel, (8) coolant streams circulating through cold finger.

Figure 2.
Experimental setup of suspension freeze crystallization: (1) crystallizer, (2) scraper, (3) mixer, (4) thermostat, (5) thermocouple, (6) Pt 100 thermosensor, (7) coolant streams circulating through jacketed vessel, (8) data processing device.
Figure 2.
Experimental setup of suspension freeze crystallization: (1) crystallizer, (2) scraper, (3) mixer, (4) thermostat, (5) thermocouple, (6) Pt 100 thermosensor, (7) coolant streams circulating through jacketed vessel, (8) data processing device.

Figure 3.
Gravity-based filtration and partial melting of ice crystals.

Figure 4.
Electrical conductivity of aqueous solutions as a function of ionic liquid concentration.

Figure 5.
Phase equilibria between [DBNH][OAc] and water with solid forms. Five different crystallization behaviors in the [DBNH][OAc] and water mixtures.
Figure 5.
Phase equilibria between [DBNH][OAc] and water with solid forms. Five different crystallization behaviors in the [DBNH][OAc] and water mixtures.

Figure 6.
Freezing point depressions of ideal aqueous solutions calculated by simplified activity coefficient equation and aqueous [DBNH][OAc] solutions obtained by differential scanning calorimetry (DSC).
Figure 6.
Freezing point depressions of ideal aqueous solutions calculated by simplified activity coefficient equation and aqueous [DBNH][OAc] solutions obtained by differential scanning calorimetry (DSC).

Figure 7.
Activity coefficient of water as a function of solute mole fraction.

Figure 8.
Ice yield and distribution coefficient of static layer freeze crystallization as a function of sub-cooling degree.
Figure 8.
Ice yield and distribution coefficient of static layer freeze crystallization as a function of sub-cooling degree.

Figure 9.
Ice yield and distribution coefficient of static layer freeze crystallization as a function of sub-cooling degree.
Figure 9.
Ice yield and distribution coefficient of static layer freeze crystallization as a function of sub-cooling degree.

Figure 10.
Ice yield and distribution coefficient of suspension freeze crystallization as a function of sub-cooling degree.
Figure 10.
Ice yield and distribution coefficient of suspension freeze crystallization as a function of sub-cooling degree.

Figure 11.
Ice yield and distribution coefficient of suspension freeze crystallization as a function of sub-cooling degree.
Figure 11.
Ice yield and distribution coefficient of suspension freeze crystallization as a function of sub-cooling degree.

© 2020 by the authors. Licensee MDPI, Basel, Switzerland. This article is an open access article distributed under the terms and conditions of the Creative Commons Attribution (CC BY) license (http://creativecommons.org/licenses/by/4.0/).
Share and Cite
MDPI and ACS Style
Osmanbegovic, N.; Yuan, L.; Lorenz, H.; Louhi-Kultanen, M. Freeze Concentration of Aqueous [DBNH][OAc] Ionic Liquid Solution. Crystals 2020, 10, 147. https://0-doi-org.brum.beds.ac.uk/10.3390/cryst10030147
AMA Style
Osmanbegovic N, Yuan L, Lorenz H, Louhi-Kultanen M. Freeze Concentration of Aqueous [DBNH][OAc] Ionic Liquid Solution. Crystals. 2020; 10(3):147. https://0-doi-org.brum.beds.ac.uk/10.3390/cryst10030147
Chicago/Turabian StyleOsmanbegovic, Nahla, Lina Yuan, Heike Lorenz, and Marjatta Louhi-Kultanen. 2020. "Freeze Concentration of Aqueous [DBNH][OAc] Ionic Liquid Solution" Crystals 10, no. 3: 147. https://0-doi-org.brum.beds.ac.uk/10.3390/cryst10030147
Note that from the first issue of 2016, this journal uses article numbers instead of page numbers. See further details here.