Article

Low-Cost High-Performance SnO2–Cu Electrodes for Use in Direct Ethanol Fuel Cells

1
Center of Excellence for Research in Engineering Materials, King Saud University, Riyadh 11421, Saudi Arabia
2
Mechanical Design and Materials Department, Faculty of Energy Engineering, Aswan University, Aswan 81521, Egypt
3
Department of Metallurgical Engineering, Jadavpur University, Kolkata 700032, India
4
Metallurgical and Material Engineering Department, Veer Surendra Sai University of Technology, Sambalpur 8062, India
*
Author to whom correspondence should be addressed.
Submission received: 17 December 2020 / Revised: 5 January 2021 / Accepted: 8 January 2021 / Published: 11 January 2021
(This article belongs to the Special Issue Advanced Functional Oxide Ceramics)

Abstract

:
The high cost of Pt-based electrode materials limits the commercialization of fuel cells and their subsequent application in renewable energy production. It is thus necessary to develop economical, high-performance electrodes alongside biofuels to reduce the pollution associated with the production of energy. Tin dioxide–copper foil (SnO2–Cu) electrode materials are herein developed using an electrodeposition process. Cyclic voltammetry, chronoamperometry, and potentiodynamic polarization methods are used to electrochemically characterize the electrode materials, with the results revealing that their excellent catalytic properties result in them delivering a high current. The surface morphologies of the developed electrodes are examined using scanning electron microscopy, with the results showing that upon an increase in the deposition time, a finer deposit of SnO2 is formed on the surface of the Cu foil. Consequently, electrochemical oxidation using an enhanced surface area of the material leads to it exhibiting a high current and excellent corrosion resistance. Powder X-ray diffraction was used to confirm the successful depositing of SnO2 on the surface of Cu. The fuel cell fabricated using the SnO2–Cu electrode is promising for use in clean energy generation, as it can be prepared at low cost compared to conventionally used electrodes.

1. Introduction

Tin dioxide (SnO2) is a key material used in photovoltaic cells, lithium batteries, and gas sensors [1,2,3,4,5]. The most widely used methods to make deposits of SnO2 are spin coating [6], electrodeposition [7], evaporation [8], chemical vapor deposition [9,10], sol–gel processes [11,12], and the pyrolysis of tin compounds [13]. Due to it requiring a low temperature and the high energy that can be generated near electrode surfaces, electrodeposition is an effective process for synthesizing powders and coating films and can be used to prepare complicated surfaces. This technique has been commonly used to prepare metal-based coatings since before 1900 on account of it being inexpensive in terms of both raw materials and equipment. Over the last few decades, metal oxides have also been successfully prepared via electrodeposition [14,15,16,17,18,19]. Moreover, nowadays, it is easy to synthesize films that have excellent properties by controlling the electrodeposition parameters, materials, and synthesis conditions.
The capacity of SnO2 is approximately double that of graphite, making it one of the most important anodic materials used in fuel cell applications. In 2002, Chang et al. [20] successfully synthesized nanocrystalline SnO2 via cathodic electrodeposition, which is one of the most effective ways of fabricating nanosized SnO2 and is an ideal method for use in industrial applications because of the unlimited choices in terms of substrate materials that can be used during deposition [21,22]. Therefore, in this study, cathodic electrodeposition was selected as the method of choice for producing nanosized SnO2. As OH ions or O radicals are required in the electrodeposition of metal oxides, an oxygen source is a necessity. Several oxygen sources have been reported to be effective in the cathodic electrodeposition of metal oxides, such as blown oxygen gas, hydrogen peroxide, and nitrate ions [23,24,25].
As is known, when the grain or particle size of a metal oxide is refined to the nanoscale, the chemical and physical properties of the compound change significantly, depending on the new nanocrystalline structure generated upon its reduction in size. Due to the excellent performance of nanometal oxides, the research in this area has progressed, leading to materials with excellent properties being reported for use in nanotechnology [26,27,28,29,30].
In this study, SnO2 is deposited on copper (Cu) foil via cathodic electrodeposition over various time periods. The surface morphologies of the coated films are studied using scanning electron microscopy (SEM). Film characterization and phase identification of the deposited layers are performed using powder X-ray diffraction (PXRD). Electrochemical characterization of the developed SnO2 deposits on Cu foil is achieved using cyclic voltammetry (CV), chronoamperometry, and potentiodynamic polarization methods.

2. Experimental

2.1. The Pre-Treatment of Materials and Chemicals

Cu foil with a surface area of 1 cm2 was polished using emery papers of different grades, then washed using distilled water, and dried using a high-pressure air jet. The foil was then washed using dilute acetic acid to remove any Cu oxide [16]. After washing it with distilled water, the Cu foil was then immersed in acetone for 15 min to remove any organic impurities or contaminations, followed by cleaning with both methanol and distilled water for a further 15 min.
SnO2 electrodeposition on a Cu electrode was carried out via a two-electrode set-up using a potentiostatic route involving 20 mL of SnCl4.5H2O (99% purity, from Sigma Aldrich, St. Louis, MO, United States). Comparing electrode set-ups, the three-electrode system is much more stable than a two-electrode system because of its accuracy in measuring the voltage, however, in large-scale production and industrial applications, two-electrode systems are more commonly used. In the two-electrode system used in this work, a 1 cm2 Cu plate was used as the cathode and a graphite electrode as the anode, separated by a distance of around 28 mm. During all electrodeposition experiments, the electrolyte was stirred continuously using a low speed stirrer and after each experiment the cathodes were cleaned using distilled water, before being dried under a jet of air. The electrodeposition process was repeated three times for different time periods of 10, 15, and 20 min.

2.2. Electrochemical Characterization

To study the electrochemical performance of the developed electrodeposited samples, chronoamperometry, CV, and potentiodynamic polarization techniques were used employing a pH 13.1 1 M ethanol + 1 M potassium hydroxide (KOH)) solution.
The CVs of the electroplated samples were measured using a computer controlled electrochemical framework machine, DY 2300 potentiostat, and a three-electrode system. The working anode was the sample to be measured, with a graphite rod and saturated calomel electrode (SCE) employed as counter and reference electrodes, respectively. The tests were conducted using a stepping potential at a scan rate of 50 mV/s in the range of −1.3–0.3 V vs. SCE at the open circuit potential to calculate Imax (current efficiency).
Chronoamperometry (I vs. t) was performed on the above-mentioned equipment using different software, in which to ascertain the time taken for the current to be transmitted from the cell, the current (I) was analyzed as a component of time (t). Trial tests were carried out at various potentials to determine the ethanol oxidation potential of the electrode materials.
Potentiodynamic polarization tests on all the samples were carried out at room temperature in 1 M ethanol + 1 M KOH solution at a scan rate of 1 mV/s using a Gamry potentiostat (PC/750, Warminster, PA, USA), where SCE and graphite were used as reference and counter electrodes, respectively, and the sample to be tested was employed as the working cathode. As the surface area exposed to the solution differs according to the sample being assessed, a standardized sample area was considered for all of the samples when plotting the data.
The above-mentioned three-electrode Gamry potentiostat system was also used for electrochemical impedance spectroscopy (EIS) measurements. The EIS tests were performed in the frequency range of 0.1 Hz–30 kHz with a signal amplitude of 10–20 mV. At each frequency, the absolute impedance and phase angles were measured to obtain data for a Nyquist plot, in which the impedance data were interpreted and fit to an appropriate equivalent electrical circuit using a simplex fit model, involving both real and imaginary data components.

2.3. Physical Characterization

The samples were characterized using PXRD and SEM. PXRD patterns were collected at room temperature using a Rigaku Ultima III X-ray diffractometer equipped with a monochromatic Cu Kα source operated at a scan rate of 2°/min. Peak analysis of the data was carried out using the inbuilt software of the diffractometer.
Microstructural characterization and surface morphology determination of the samples were carried out by SEM using a JEOL JSM 6360 microscope.

3. Results and Discussions

3.1. Cyclic Voltammetry Study

Figure 1 shows the CV curves of the SnO2-coated Cu foil samples electrodeposited for different time periods at a fixed temperature in 1 M ethanol + 1 M KOH solution, where it can be seen that for all the curves, there is a current maximum representing the highest rate of ethanol oxidation, at which point the maximum output current is delivered from the anode compartment of the fuel cell. It is interesting to note that the SnO2-coated Cu foil that was electroplated for 20 min exhibits the maximum current. According to the information in the literature [17,31,32], the point corresponding to conditions where the rate of nucleation is the highest and the rate of growth is the lowest gives rise to finer and nano deposits.

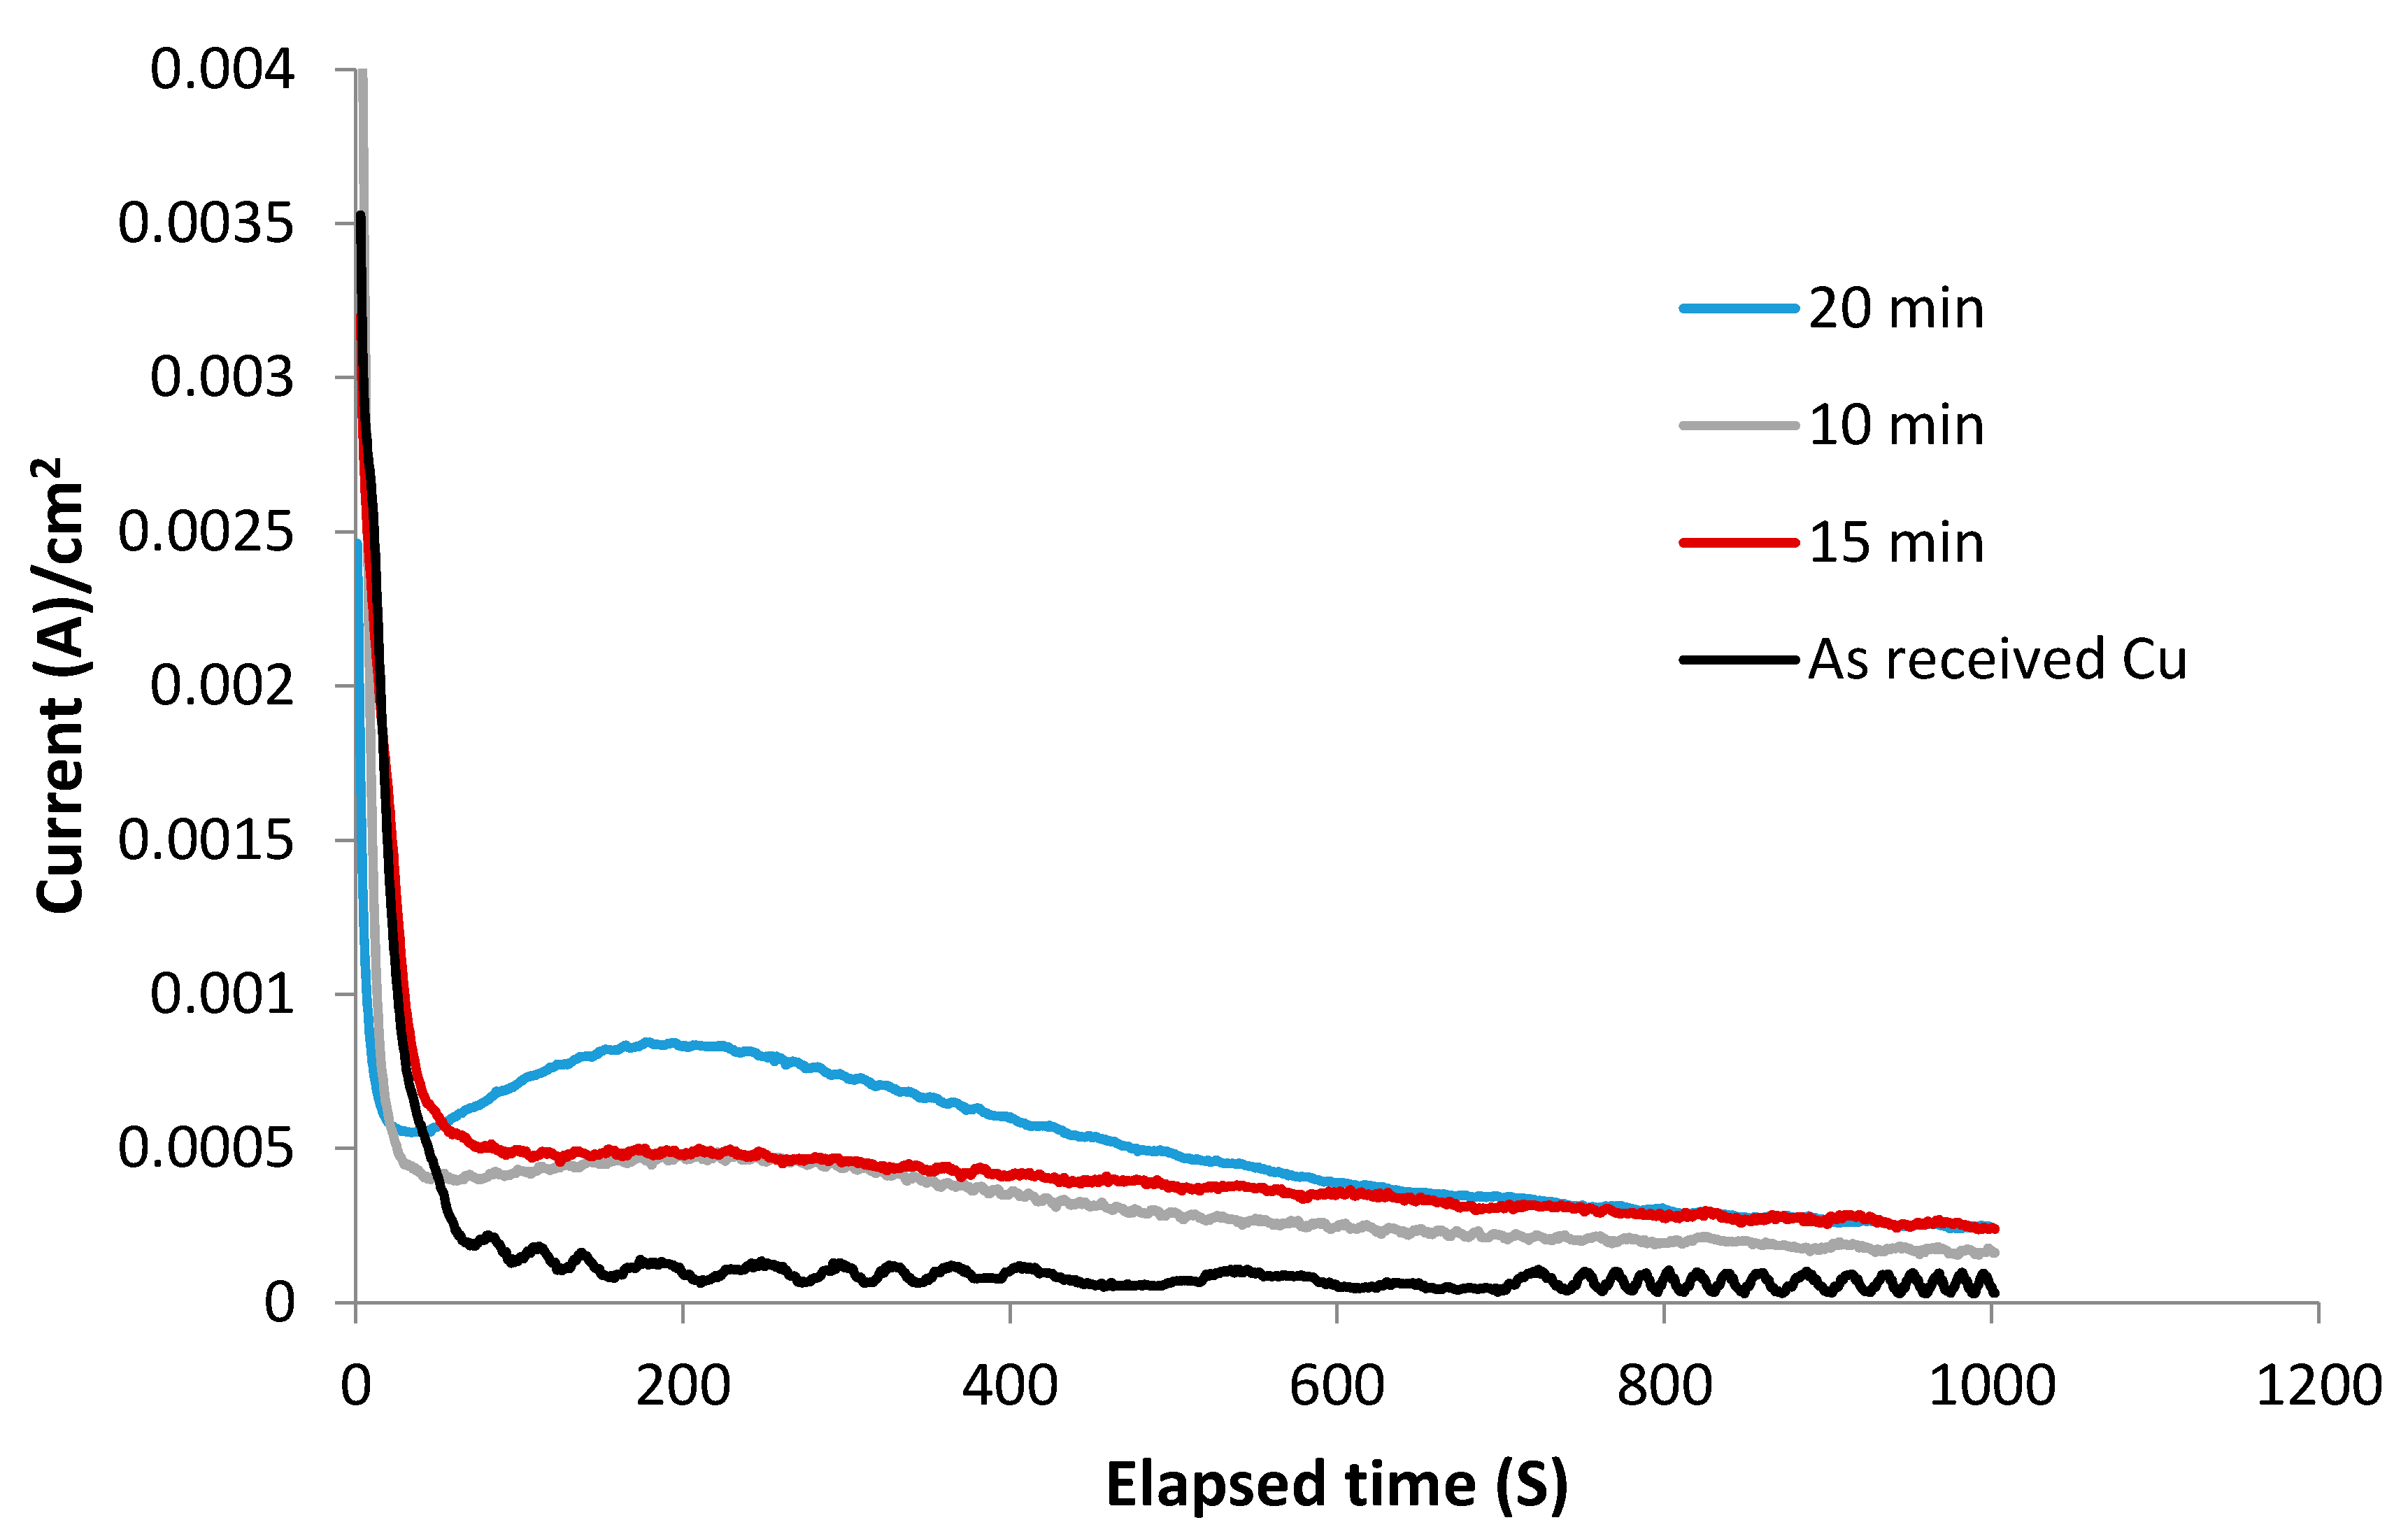
3.2. Chronoamperometry Study

Chronoamperometry is a technique that is useful for determining the steady state current of a sample after investigation, especially after observing a high current peak, as was determined in the CV data of the SnO2–Cu electrodes. Figure 2 shows the chronoamperometry results of the electrocoated SnO2–Cu samples prepared at different deposition times recorded in 1 M ethanol + 1 M KOH solution. From the data, it can be seen that the currents associated with the samples initially follow a downward trend before reaching steady state values, around which they generally remain for the duration of the experiments. This data shows that SnO2 is a promising electrode material for use in fuel cell applications. It can also be observed that the SnO2 sample deposited for 20 min exhibited the highest current in the chronoamperometry results, as well as the highest peak in the CV measurements.

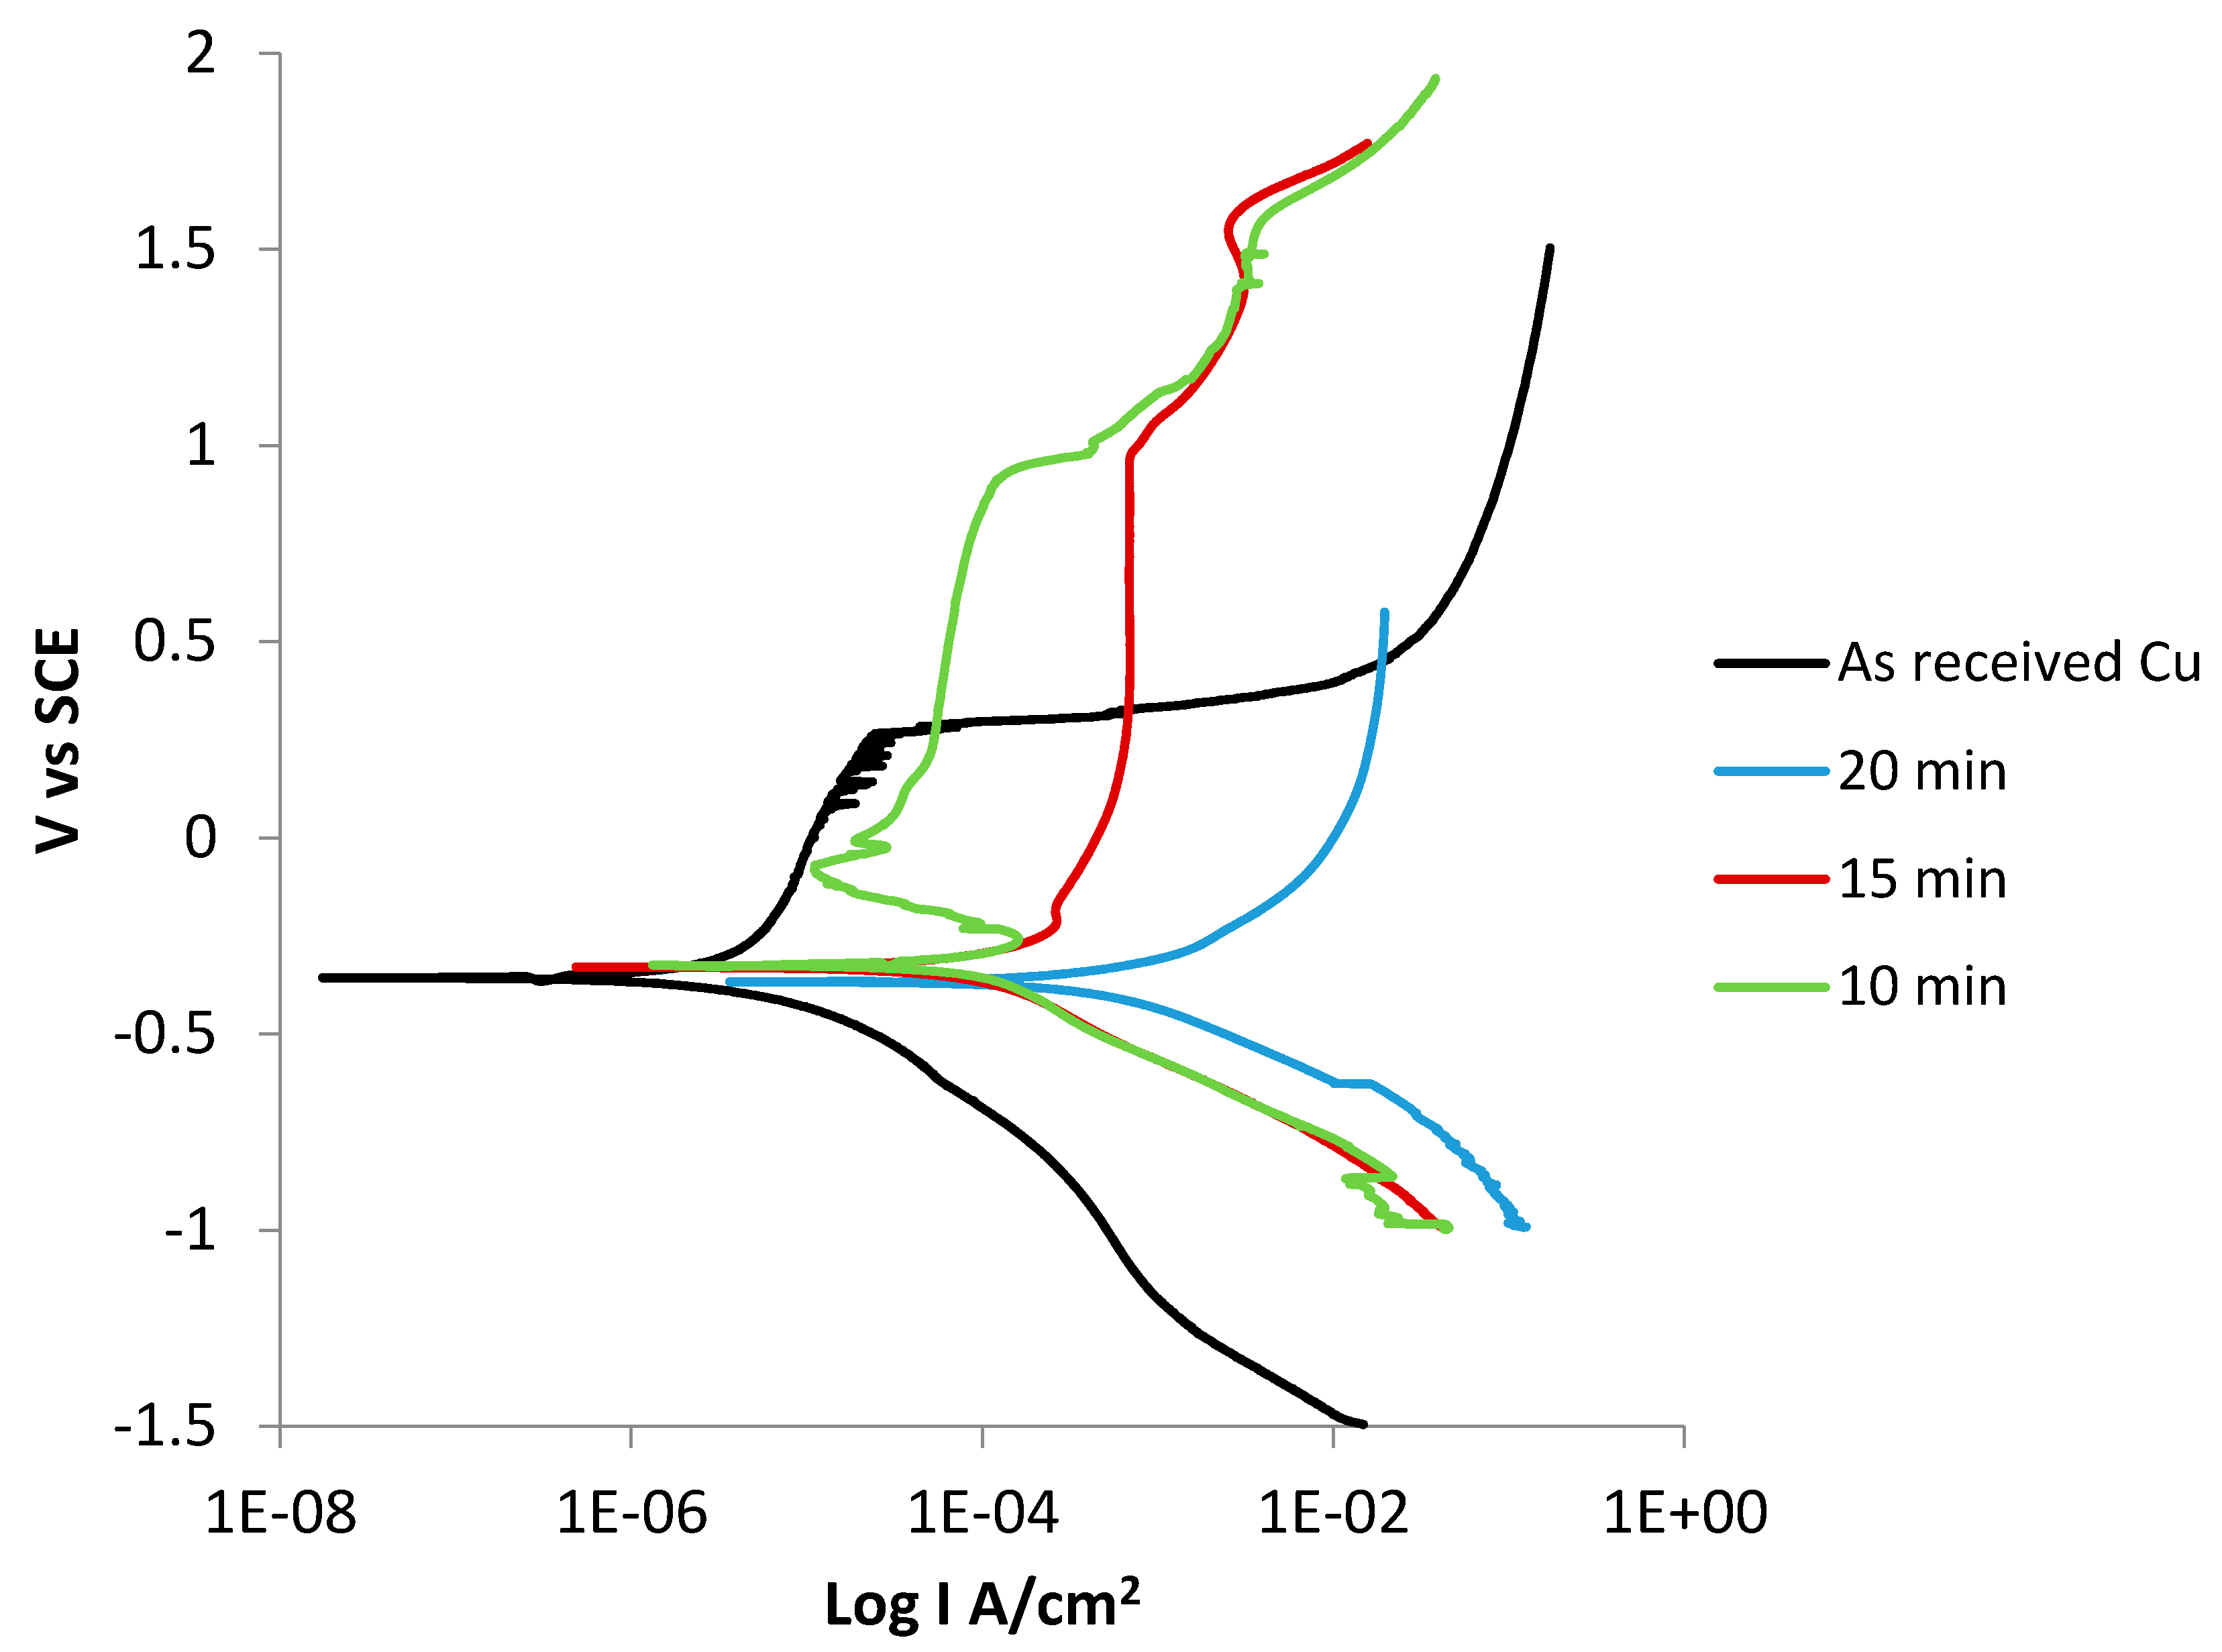
3.3. Potentiodynamic Polarization Analysis
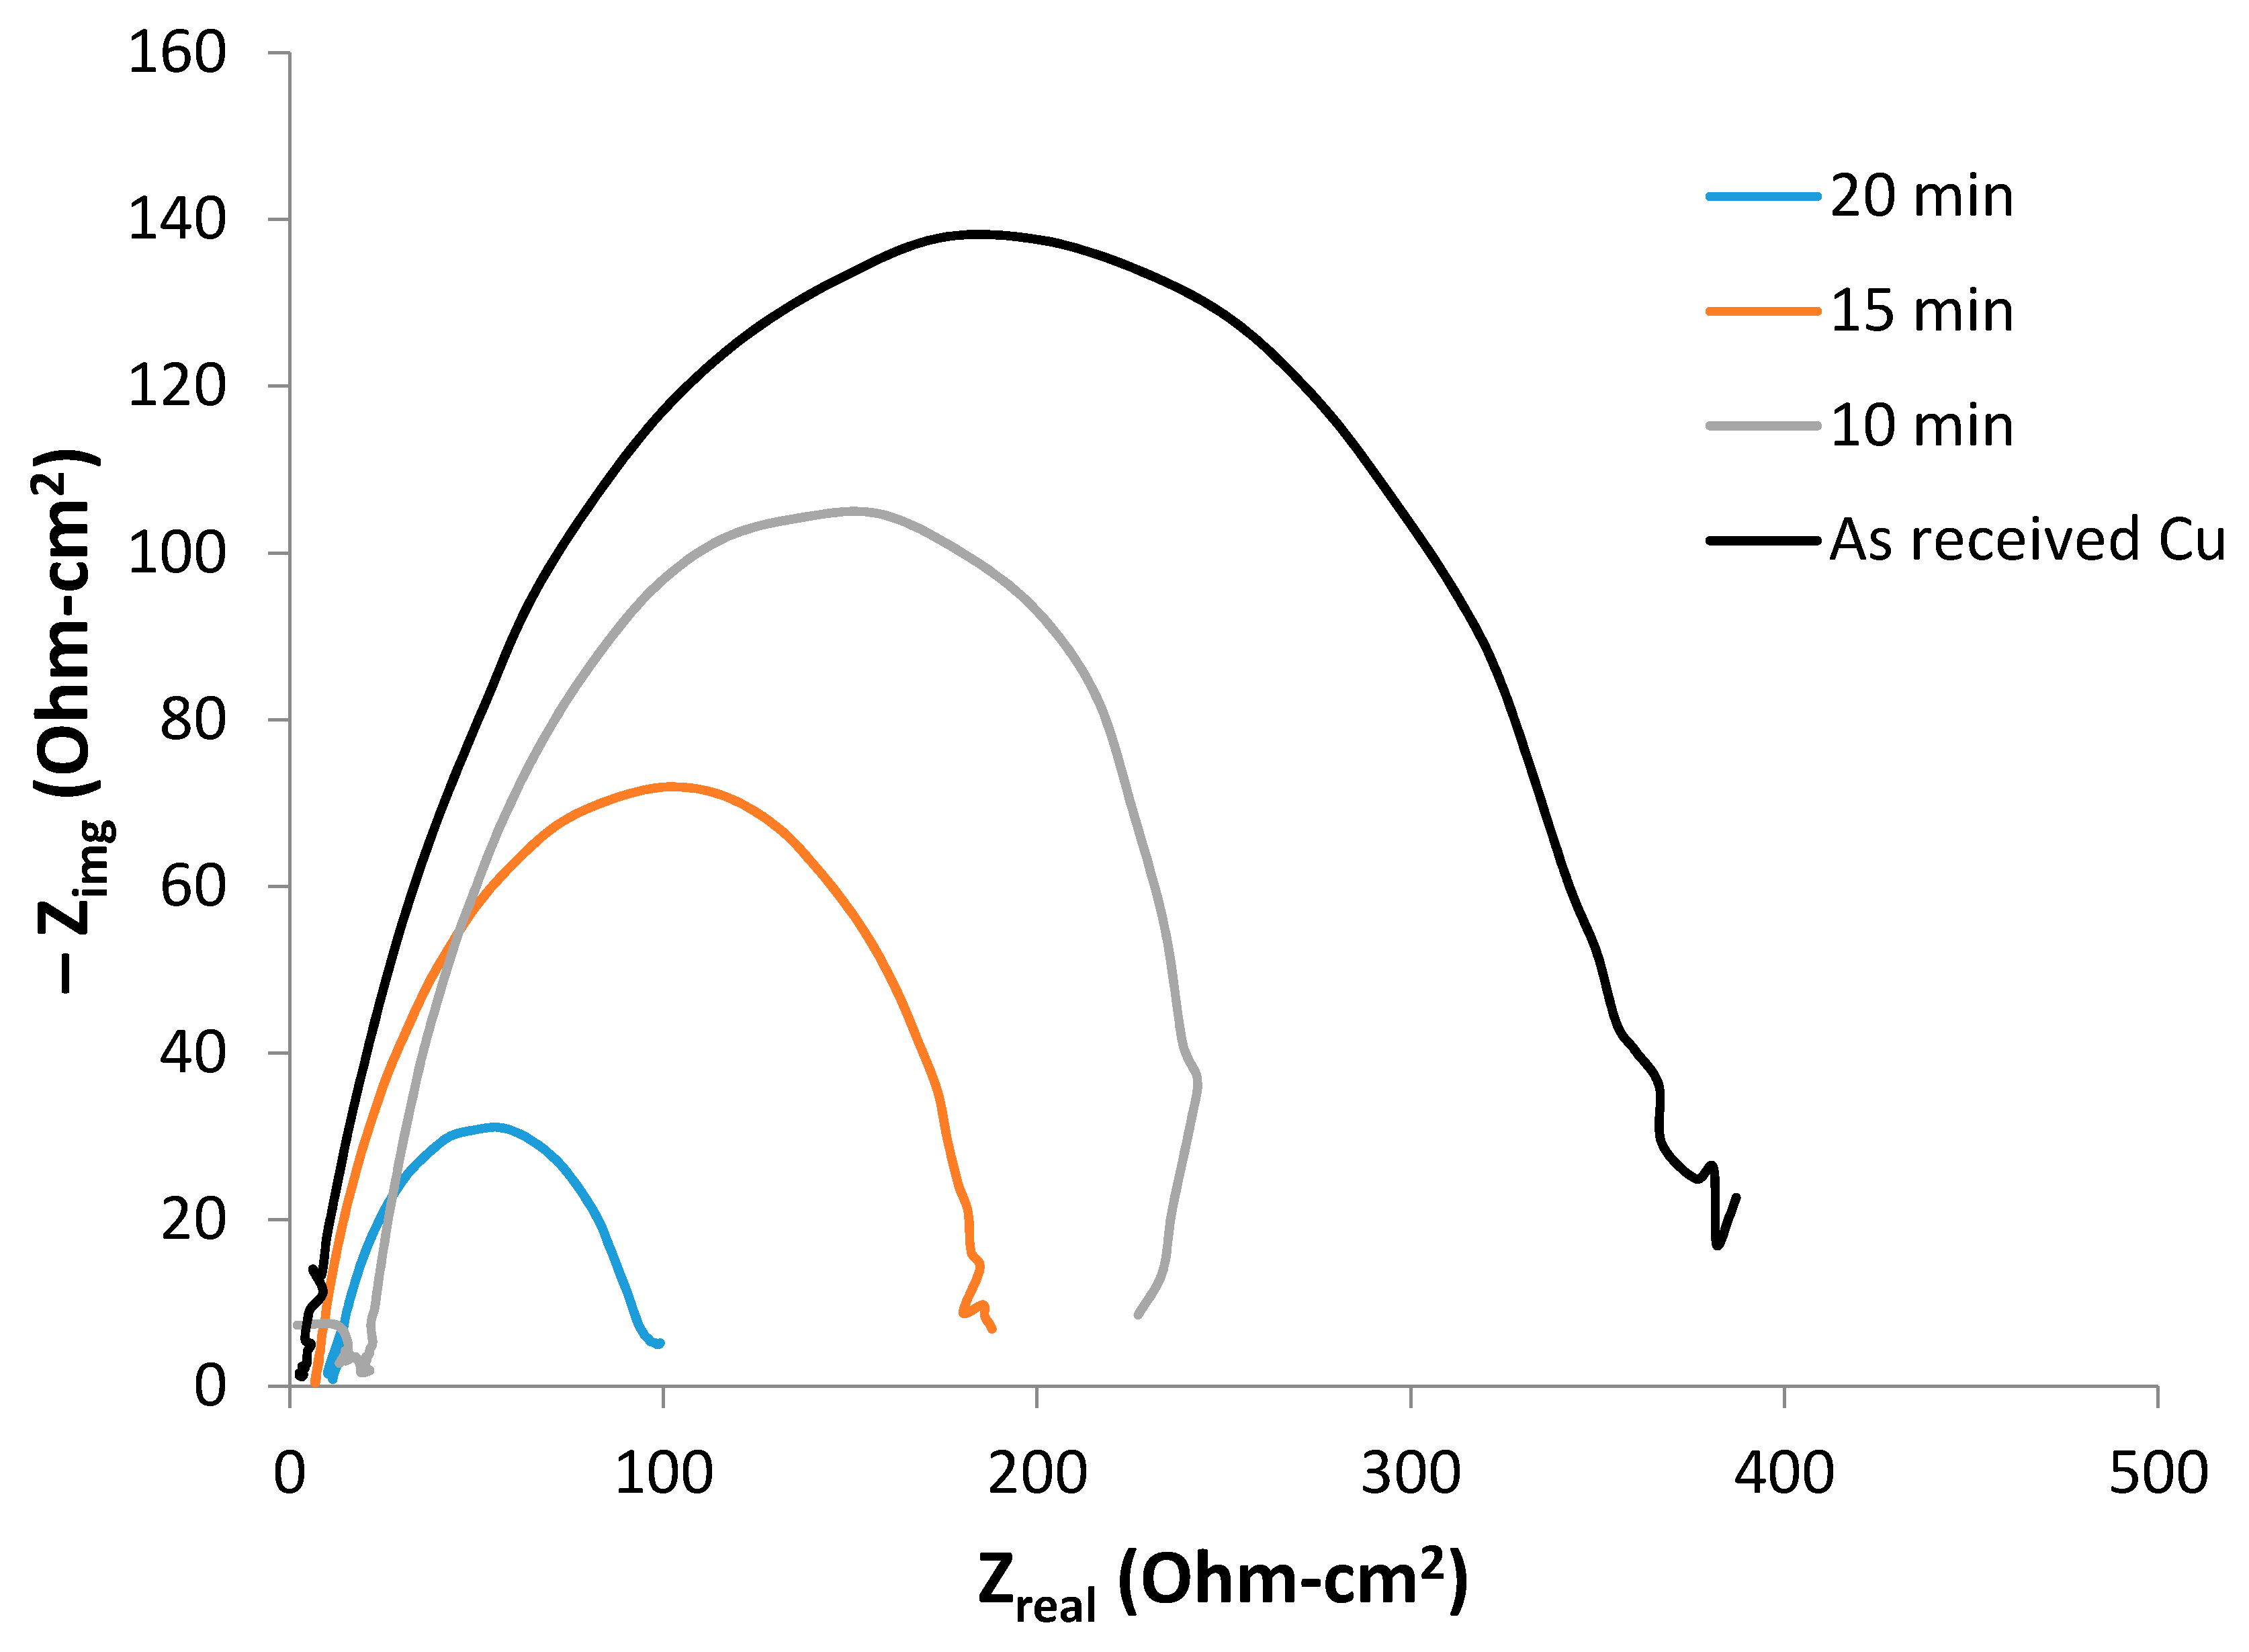
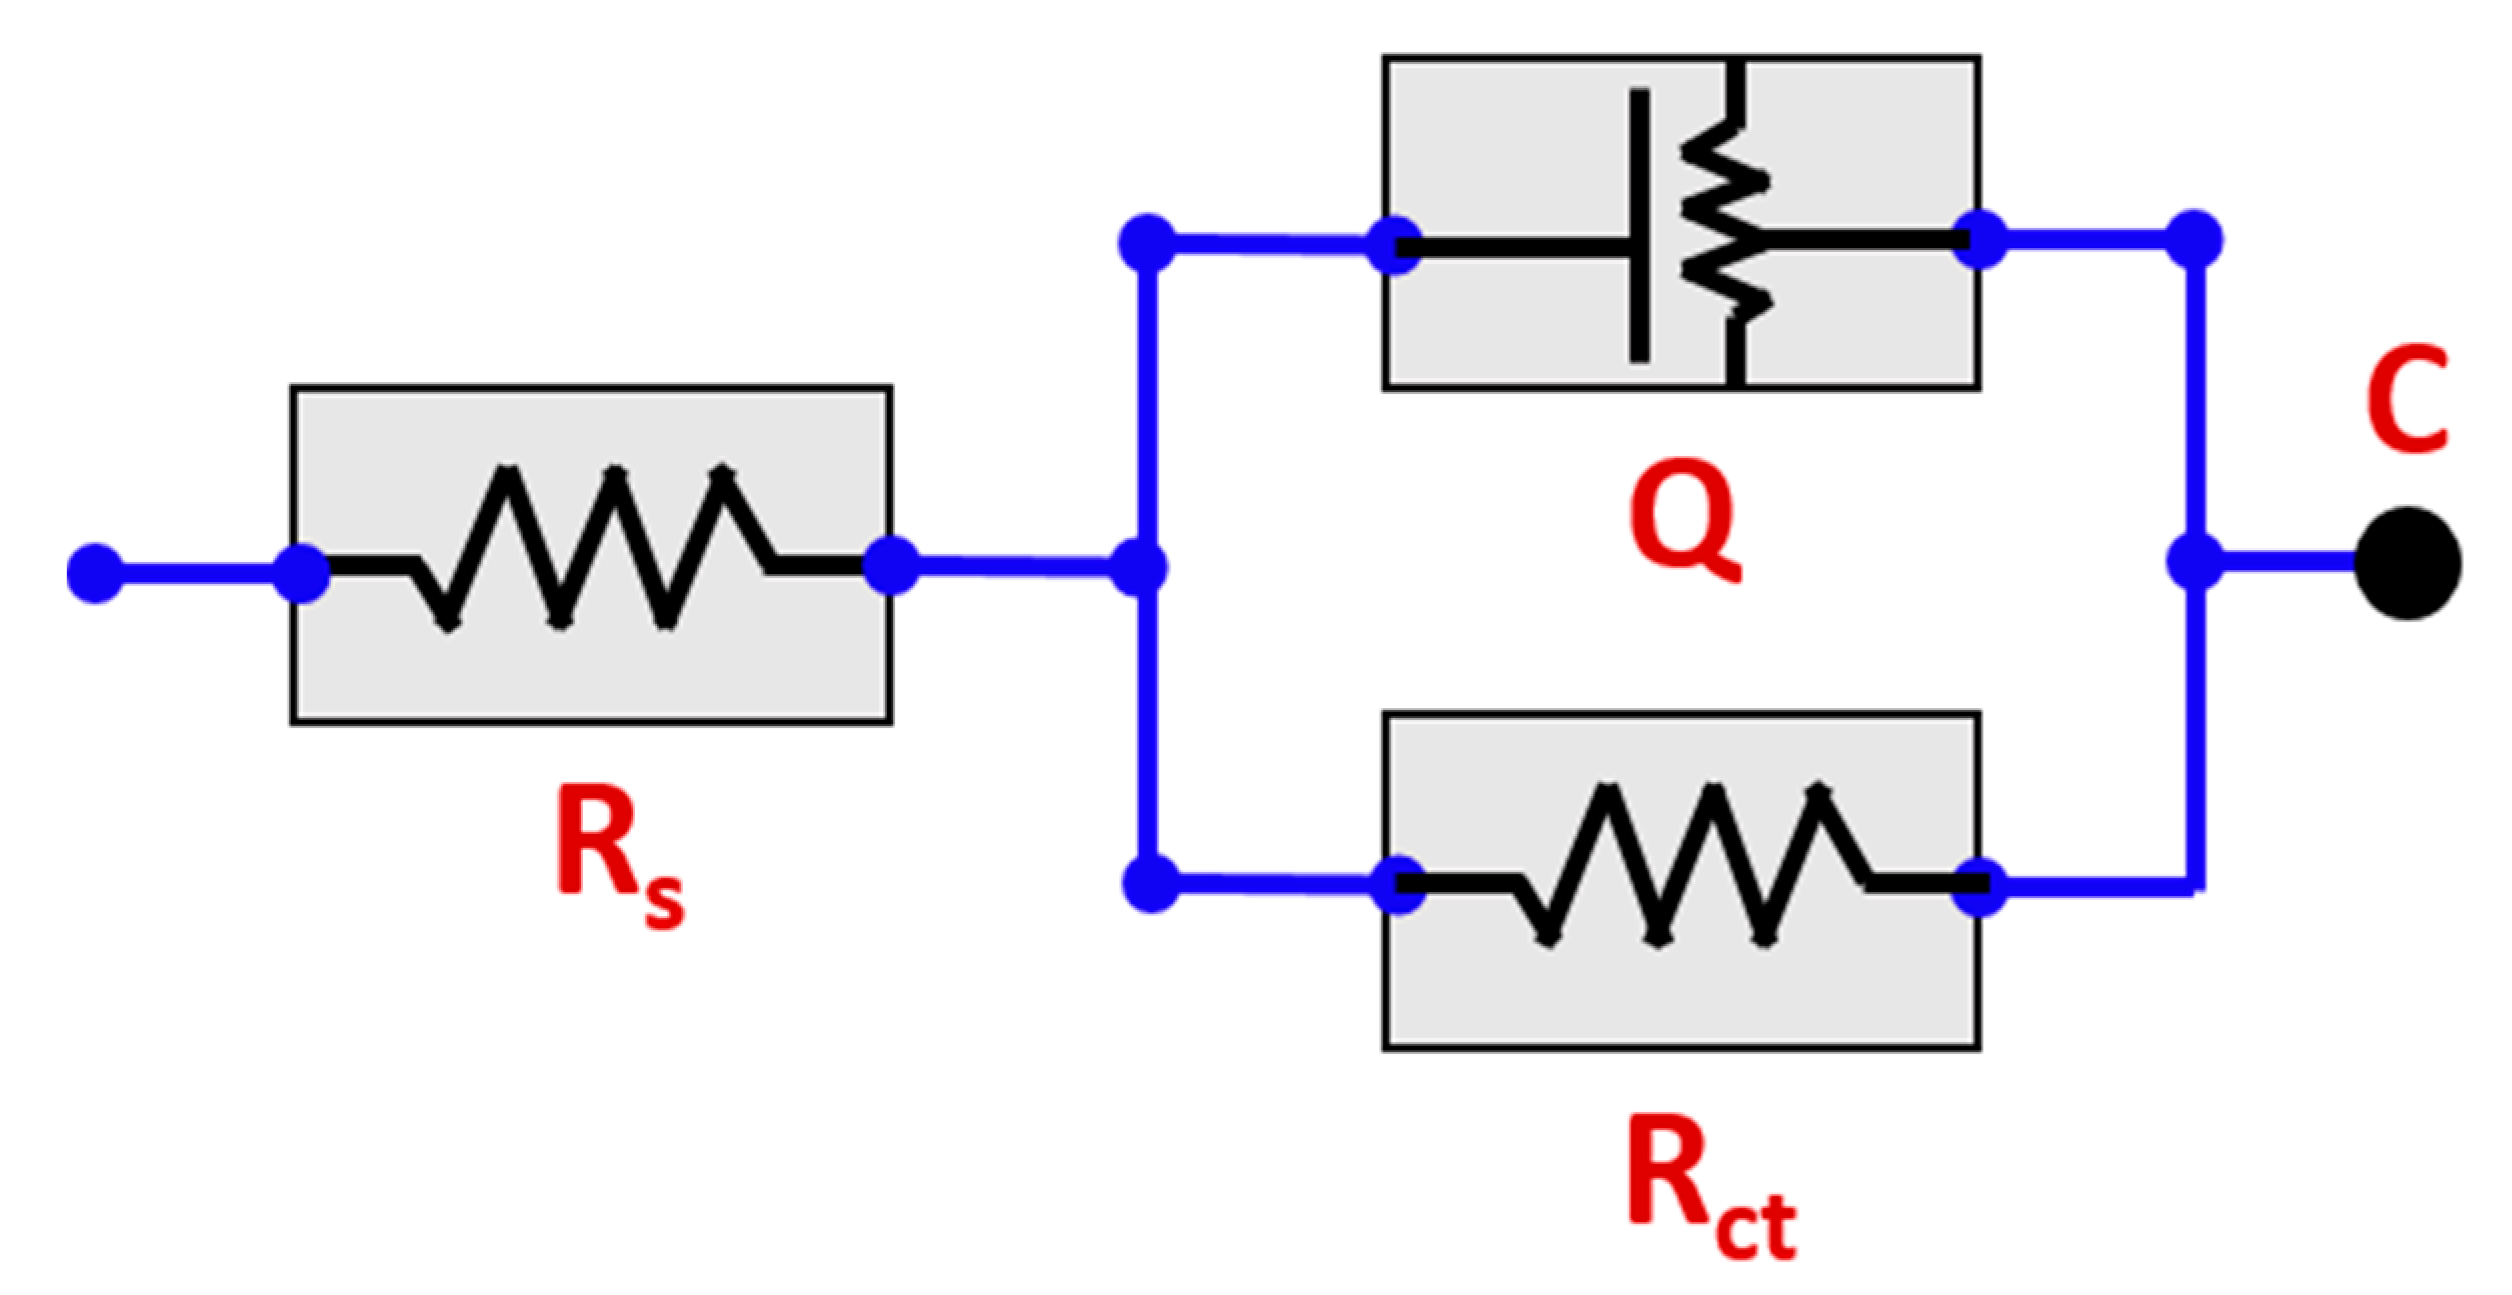
Potentiodynamic polarization tests were carried out on the prepared SnO2-coated Cu electrodes to determine their electrokinetic properties. Figure 3 shows the polarization curves of the as-received Cu foil and SnO2-coated Cu electrodes recorded in 1 M ethanol + 1 M KOH solution. Table 1 shows the data obtained from the polarization curves using the Tafel extrapolation method. It can be clearly seen from the curves that the sample deposited over the longest time period of 20 min exhibits a higher current density than the other samples, indicating that the current delivery from the electrodes increases in line with an increase in the deposition time. The corrosion current density values, icorr, also show the same trend, and there is not much difference between the corrosion potential values, Ecorr, of all of the samples.

3.4. EIS Analysis

The corrosion behavior of the as-received Cu and SnO2-coated Cu foil samples deposited over different time periods in 1 M ethanol + 1 M KOH solution was investigated, and mechanistic and kinetic parameters were obtained using EIS and potentiodynamic polarization techniques, and these were analyzed. Figure 4 shows the Nyquist plots obtained via the fitting of the experimental data to an equivalent circuit model, as presented in Figure 5. The fitted equivalent circuit comprises solution resistance (Rs) between the reference electrode and working electrodes and the charge transfer resistance (Rct), which is a measure of the corrosion response at the electrolyte/metal interface [33,34]. To simulate the irregularity of metal surfaces and make the data fitting more accurate, the pure double-layer capacitance (Cdl) was replaced by the constant phase element (CPE, Q as shown in the circuit in Figure 5) in the fitted circuit [35]. The corrosion resistance of different alloys can be determined from the Rct, which is inversely proportional to icorr. The impedance (ZCPE) of the samples can be calculated using the following expression:
ZCPE = 1/(Y0 (jω)n)
where n is the phase shift exponent, the value of which ranges between 0.75 and 1.0 and indicates the CPE type (inductance, capacitance, or resistance) [36]; ω represents the angular frequency; j is the imaginary unit; and Y0 is the CPE constant.
The data extracted from the equivalent circuit are shown in Table 2.
It is clear from the Nyquist plots that upon an increase in the deposition, there is a decrease in the diameter of the capacitive loop, with the smallest diameter observed for the sample with the longest deposition time of 20 min and the as-received Cu sample exhibiting the capacitive loop with the largest diameter. As previously stated, the Rct value is inversely proportional to the icorr value, where the values presented in Table 1 and Table 2 show the same trend. The sample coated for 20 min shows the lowest Rct value and thus its corrosion resistance properties, indicated by its icorr value, are the worst of all the samples.

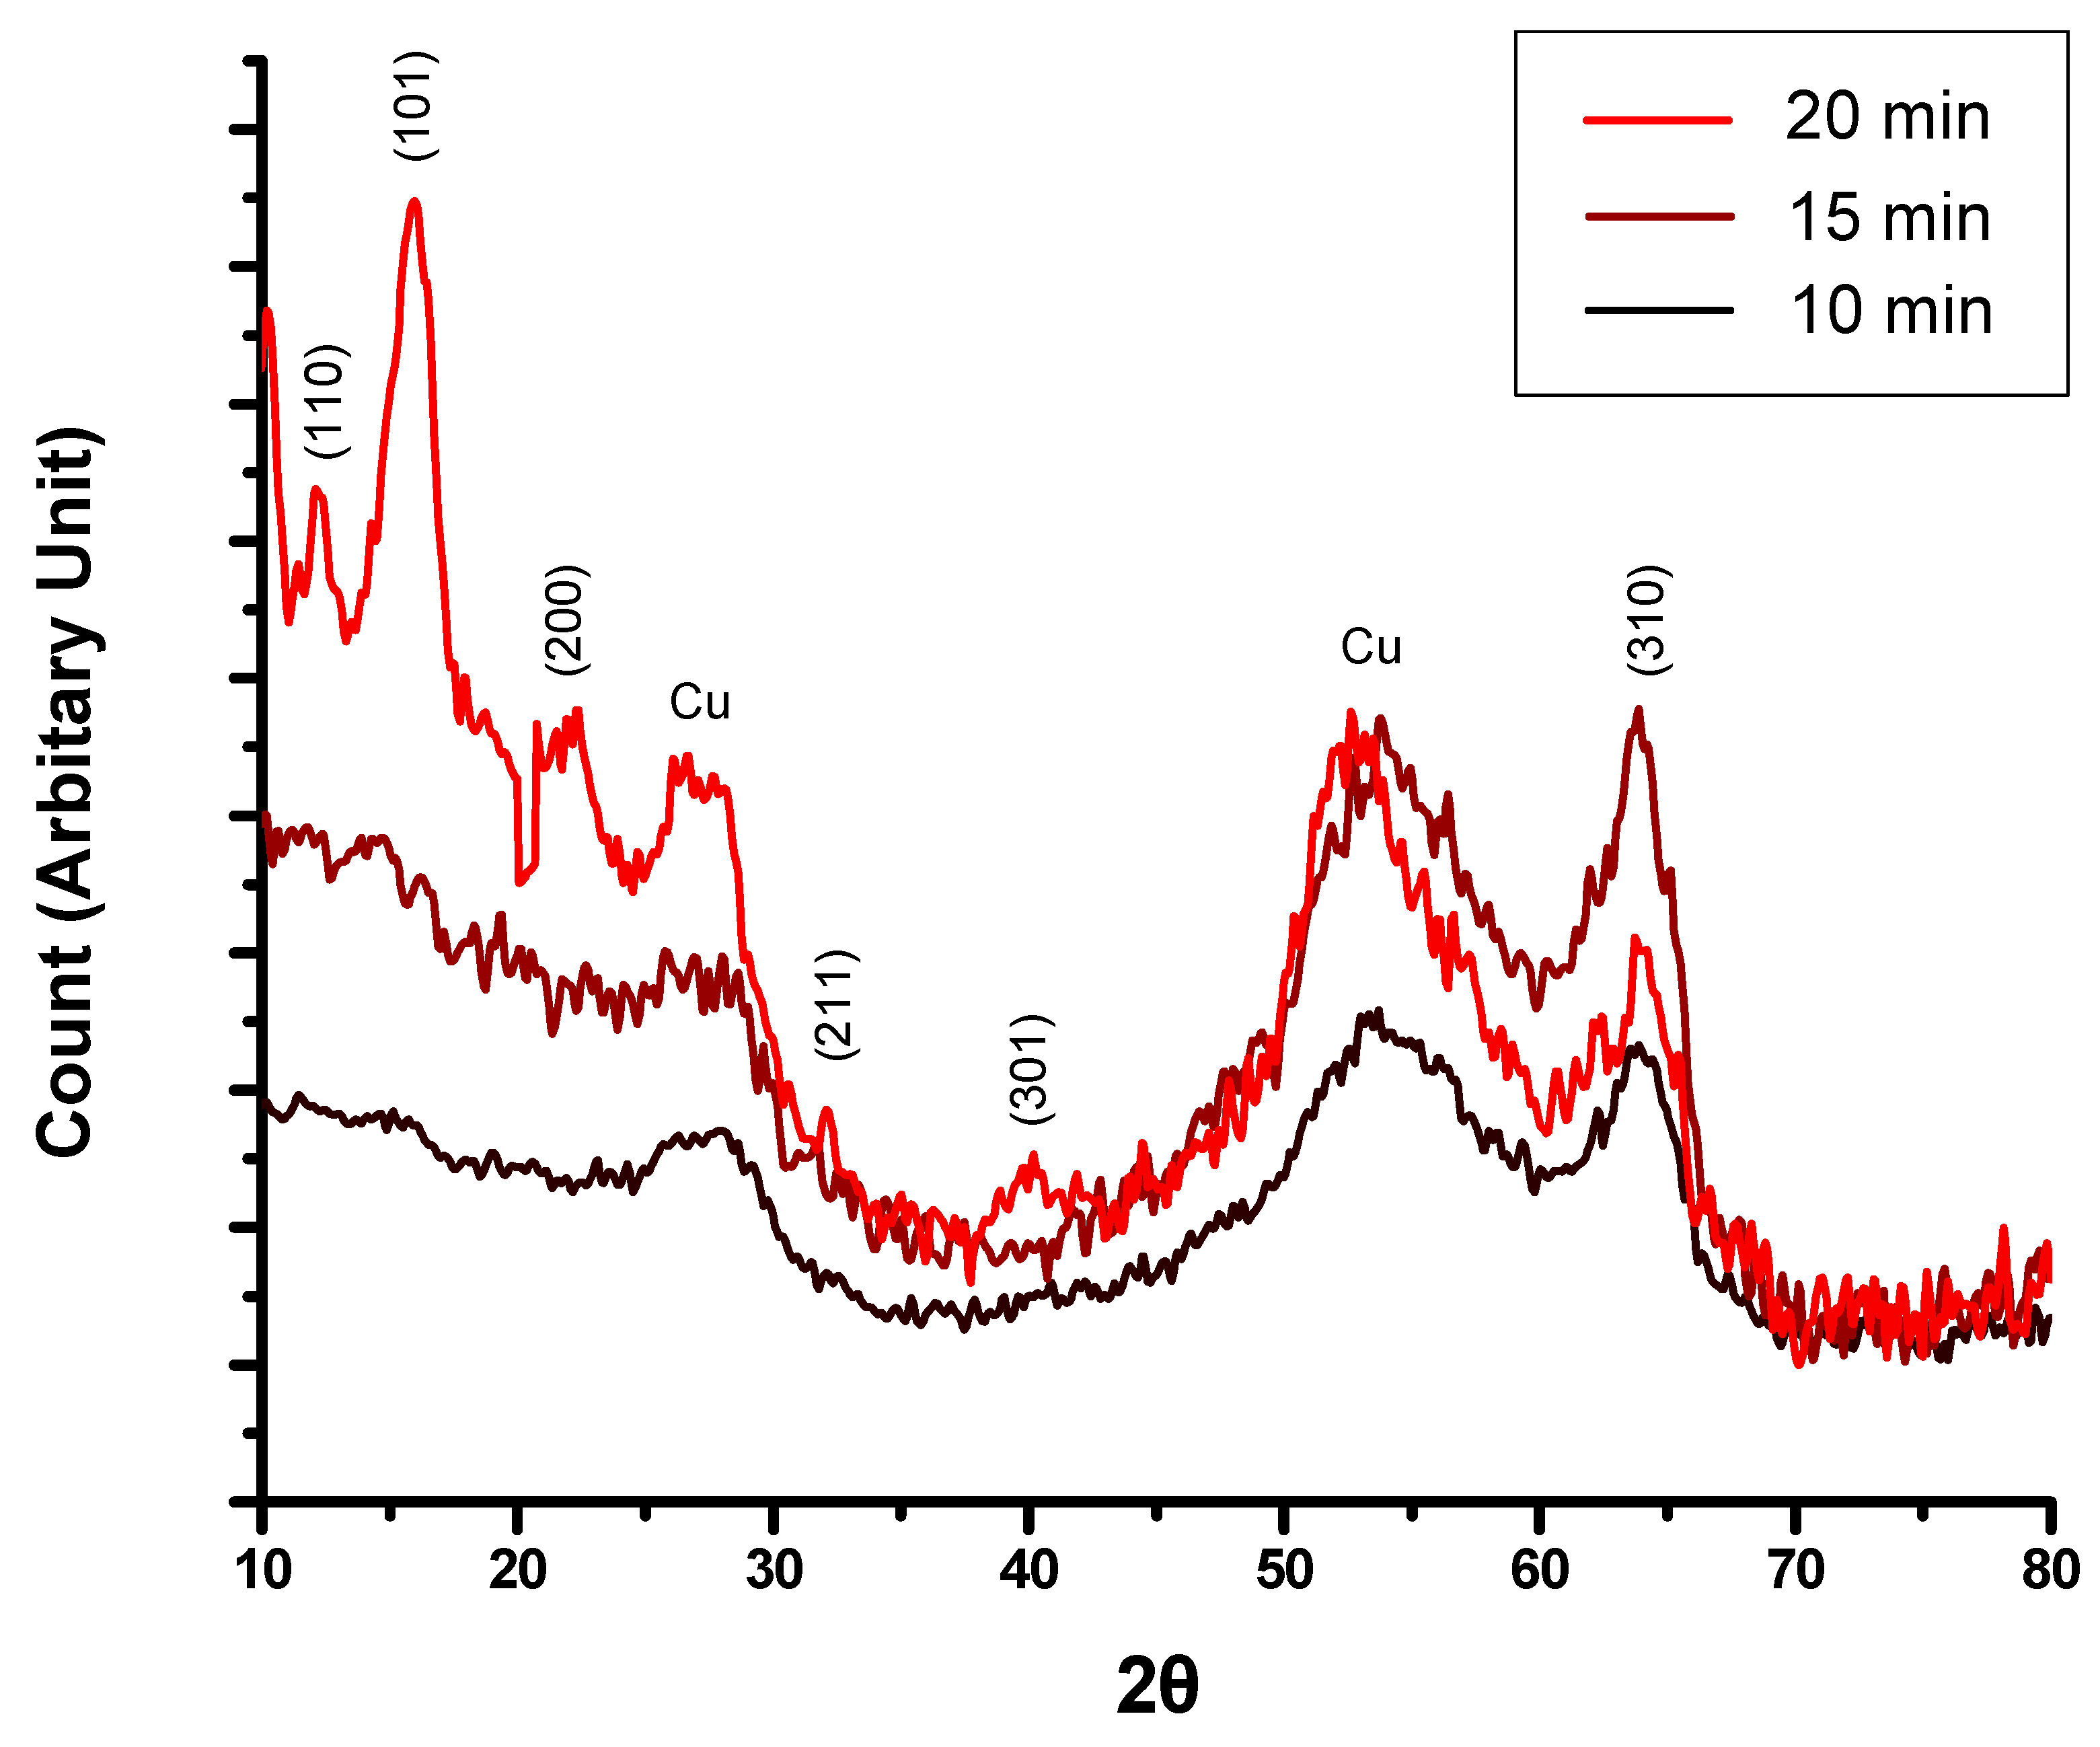
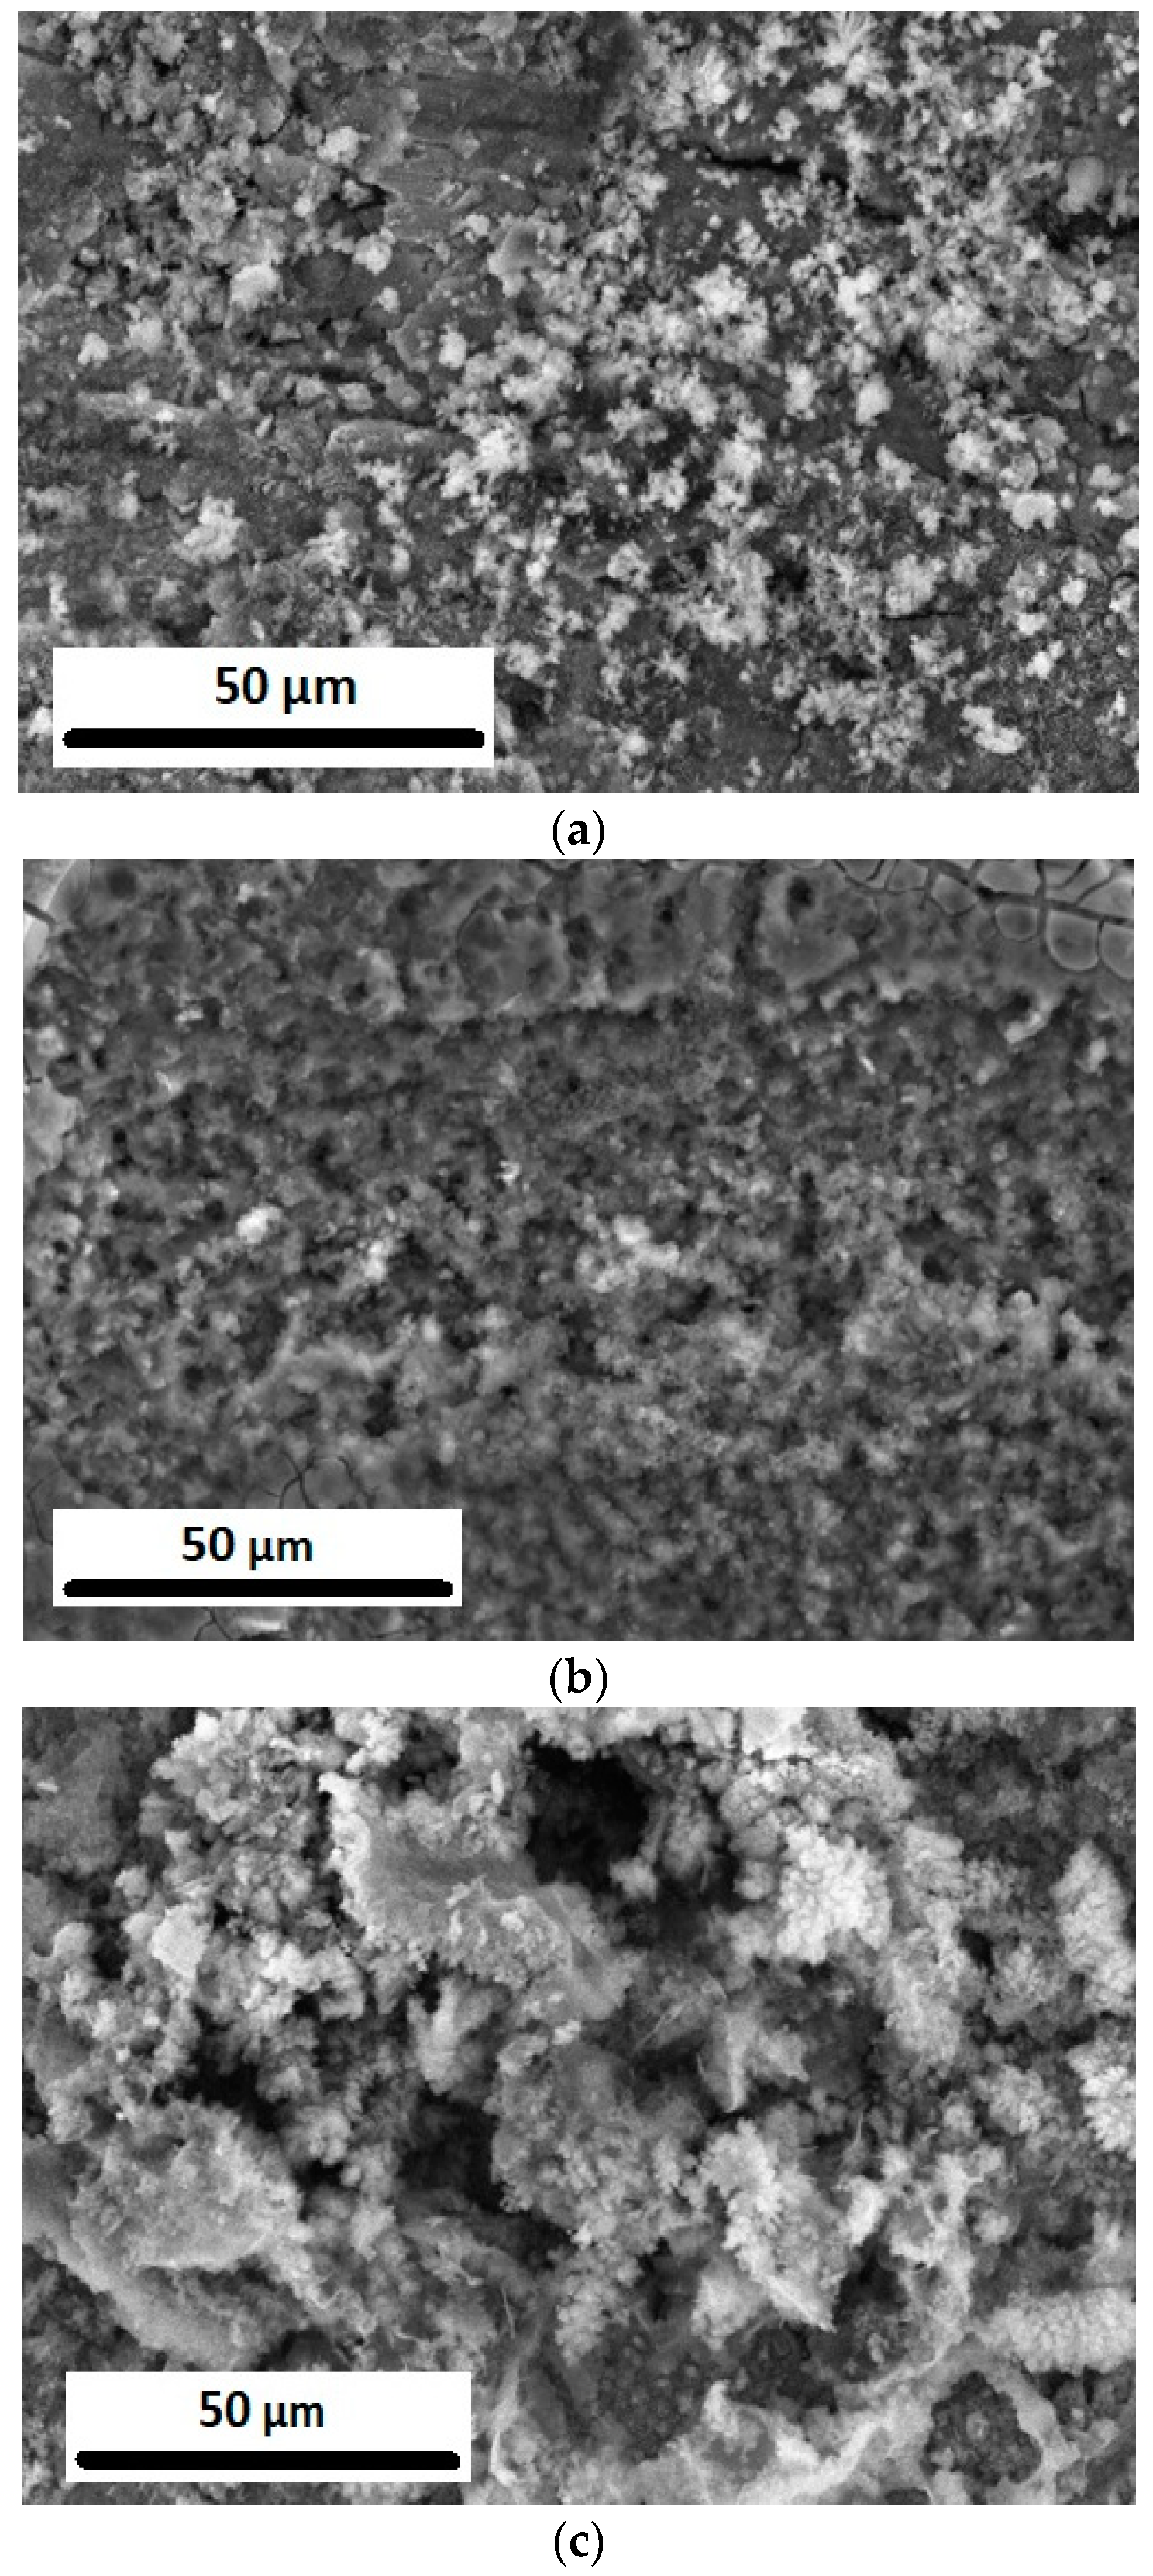
3.5. Materials Characterization

Figure 6 shows the PXRD patterns of the SnO2-coated Cu electrodes deposited over different time periods. All of the peaks in the patterns were indexed and identified using the matching elements function of the diffractometer library with. A tetragonal SnO2 phase (JCPDS Card #41-1445) was clearly detected alongside Cu substrate peaks. Well-defined diffraction patterns were easily obtained, even at a low temperature, and their peaks assigned, indicating the formation of crystalline SnO2 films, and confirming that the crystal structure of SnO2 was retained after the deposition process was carried out.
Figure 7 shows the SEM images of the SnO2-coated Cu samples deposited over different time periods, where it can be clearly seen from the images that upon increasing the deposition time of the oxide layer on the surface of the Cu foil, the sample becomes finer. After a long deposition time, the surface becomes rougher than after a shorter time. Upon an increase in the deposition time, the fine grains in the sample aggregate to create a porous, rough surface, resulting in an increase in the current density and a subsequent increase in the icorr values and the delivering of more current, which is favorable for a fuel cell.
EDX spectroscopy was used to quantitatively analyze the samples, and their Sn and O contents are presented in Table 3. The data show that the percentage of Sn increases in line with an increase in the deposition time.

4. Conclusions

SnO2 was deposited on Cu foil via an electrodeposition process that was carried out for different deposition times. PXRD and SEM results prove the successful formation of a SnO2 film on the Cu foil, where a finer layer can be achieved by increasing the deposition time. Electrochemical analysis of the samples was carried out using CV, chronoamperometry, and potentiodynamic polarization, with the results showing that SnO2–Cu exhibits promising efficiency to be an economical, high-performance, and excellent electrode material for use in electrocatalytic fuel cells. This electrode material is much cheaper than the expensive commercial Pt electrodes currently available, which are most commonly used in direct ethanol fuel cells. This present investigation opens up a new avenue for the commercial and economical production of renewable energy using fuel cells powered by bio ethanol from biomass. The results of this work thus provide strong incentive and serve to encourage the research on and manufacturing of fuel cells for commercial purposes to move to a new level of innovation based on the low-cost quality concept presented here.

Author Contributions

Conceptualization, H.S.A. and A.H.S.; data curation, A.S., M.G., S.S., and J.A.M.; formal analysis, A.H.S., S.A.R., and A.S.; funding acquisition, A.H.S.; investigation, H.S.A. and A.S.; methodology, M.G., S.S., and H.S.A.; resources, A.H.S.; software, H.S.A.; supervision, H.S.A.; validation, A.S., S.A.R., and J.A.M.; visualization, S.S.; writing—original draft, H.S.A. and A.H.S.; writing—review and editing, H.S.A. All authors have read and agreed to the published version of the manuscript.

Funding

This work was funded by the Deputyship for Research & Innovation, “Ministry of Education” in Saudi Arabia through the project number IFKSURG-1439-029.

Institutional Review Board Statement

Not applicable.

Informed Consent Statement

Not applicable.

Data Availability Statement

The data presented in this study are available on request from the corresponding author.

Acknowledgments

The authors extend their appreciation to the Deputyship for Research & Innovation, “Ministry of Education” in Saudi Arabia for funding this research work through the project number IFKSURG-1439-029.

Conflicts of Interest

The authors declare no conflict of interest.

References

  1. Agnihotri, O.; Mohammad, M.; Abass, A.; Arshak, K. Electrical and optical properties of chemically deposited conducting glass for SIS solar cells. Solid State Commun. 1983, 47, 195–198. [Google Scholar] [CrossRef]
  2. Summitt, R.; Marley, J.A.; Borrelli, N.F. The ultraviolet absorption edge of stannic oxide (SnO2). J. Phys. Chem. Solids 1964, 25, 1465–1469. [Google Scholar] [CrossRef]
  3. Ginley, D.S.; Bright, C. Transparent Conducting Oxides. MRS Bull. 2000, 25, 15–18. [Google Scholar] [CrossRef]
  4. Ginley, D.; Coutts, T.; Perkins, J.; Young, D.; Li, X.; Parilla, P. Next-Generation Transparent Conducting Oxides for Photovoltaic Cells: An Overview. In Proceedings of the MRS Online Proceedings Library, England, UK, January 2001; Volume 668, p. 27. [Google Scholar] [CrossRef]
  5. Hartnagel, H.L.; Dawar, A.L.; Jain, A.K.; Jagadish, C.J. Semiconducting Transparent Thin Films; CRC Press, IOP: Bristol, UK, 1995; ISBN 10: 9780750303224. [Google Scholar]
  6. Shoyama, M.; Hashimoto, N. Effect of poly ethylene glycol addition on the microstructure and sensor characteristics of SnO2 thin films prepared by sol–gel method. Sens. Actuators B Chem. 2003, 93, 585–589. [Google Scholar] [CrossRef]
  7. Chang, S.; Leu, I.-C.; Hon, M. Electrodeposition of nanocrystalline SnO2 coatings with two-layer microstructure. J. Cryst. Growth 2004, 273, 195–202. [Google Scholar] [CrossRef]
  8. Yuan, X.; Cao, L.; Wan, H.; Zeng, G.; Xi, S. Study on the self-packing of SnO2 nanoparticles at the air–hydrosol interface and its composite LB films with arachidic acid. Thin Solid Film. 1998, 327–329, 33–36. [Google Scholar] [CrossRef]
  9. Santos, L.R.B.; Chartier, T.; Pagnoux, C.; Baumard, J.F.; Santillii, C.V.; Pulcinelli, S.H.; Larbot, A. Tin oxide nanoparticle formation using a surface modifying agent. J. Eur. Ceram. Soc. 2004, 24, 3713–3721. [Google Scholar] [CrossRef]
  10. Udawatte, C.P.; Kakihana, M.; Yoshimura, M. Preparation of pure perovskite-type BaSnO3 powders by the polymerized complex method at reduced temperature. Solid State Ion. 1998, 108, 23–30. [Google Scholar] [CrossRef]
  11. Sergent, N.; Gélin, P.; Périer-Camby, L.; Praliaud, H.; Thomas, G. Preparation and characterisation of high surface area stannic oxides: Structural, textural and semiconducting properties. Sens. Actuators B Chem. 2002, 84, 176–188. [Google Scholar] [CrossRef]
  12. Ibarguen, C.A.; Mosquera, A.; Parra, R.; Castro, M.; Rodríguez-Páez, J. Synthesis of SnO2 nanoparticles through the controlled precipitation route. Mater. Chem. Phys. 2007, 101, 433–440. [Google Scholar] [CrossRef]
  13. Cullity, B.D.; Weymouth, J.W. Elements of X-Ray Diffraction. Am. J. Phys. 1957, 25, 394–395. [Google Scholar]
  14. Izaki, M.; Omi, T. Electrolyte Optimization for Cathodic Growth of Zinc Oxide Films. J. Electrochem. Soc. 1996, 143, L53–L55. [Google Scholar] [CrossRef]
  15. Peulon, S.; Lincot, D. Cathodic electrodeposition from aqueous solution of dense or open-structured zinc oxide films. Adv. Mater. 1996, 8, 166–170. [Google Scholar] [CrossRef]
  16. Zhitomirsky, I.; Gal-Or, L.; Kohn, A.; Hennicke, H.W. Electrodeposition of ceramic films from non-aqueous and mixed solutions. J. Mater. Sci. 1995, 30, 5307–5312. [Google Scholar] [CrossRef]
  17. Bohannan, E.W.; Jaynes, C.C.; Shumsky, M.G.; Barton, J.K.; Switzer, J.A. Low-temperature electrodeposition of the high-temperature cubic polymorph of bismuth(III) oxide. Solid State Ion. 2000, 131, 97–107. [Google Scholar] [CrossRef]
  18. Yao, J.; Chen, P.; Fujishima, A. Electrochromic behavior of electrodeposited tungsten oxide thin films. J. Electroanal. Chem. 1996, 406, 223–226. [Google Scholar] [CrossRef]
  19. Dierstein, A.; Natter, H.; Meyer, F.; Stephan, H.-O.; Kropf, C.; Hempelmann, R. Electrochemical deposition under oxidizing conditions (EDOC): A new synthesis for nanocrystalline metal oxides. R. Scr. Mater. 2001, 44, 2209–2212. [Google Scholar] [CrossRef]
  20. Chang, S.T.; Leu, I.C.; Hon, M.H. Preparation and characterization of nanostructured tin oxide films by electrochemical deposition. Electrochem. Solid-State Lett. 2002, 5, C71–C74. [Google Scholar] [CrossRef]
  21. Zheng, M.; Li, G.; Zhang, X.; Huang, S.; Lei, Y.; Zhang, L. Fabrication and structural characterization of large-scale uniform SnO2 nanowire array embedded in anodic alumina membrane. Chem. Mater. 2001, 13, 3859–3861. [Google Scholar] [CrossRef]
  22. Zhitomirsky, I. Cathodic electrodeposition of ceramic and organoceramic materials. Fundam. Asp. Adv. Colloid Interface Sci. 2002, 97, 279–317. [Google Scholar] [CrossRef]
  23. Abdo, H.S.; Sherif, E.-S.M.; El-Serehy, H.A. Manufacturing of Ti-6%Al and Ti-6%Al-4%V Alloys and Their Corrosion in Sodium Chloride Solutions. Crystals 2020, 10, 181. [Google Scholar] [CrossRef] [Green Version]
  24. Pauporté, T.; Lincot, D. Electrodeposition of semiconductors for optoelectronic devices: Results on zinc oxide. Electrochim. Acta 2000, 45, 3345–3353. [Google Scholar] [CrossRef]
  25. Qiu, X.-F.; Zhu, J.-J.; Chen, H.-Y. Controllable synthesis of nanocrystalline gold assembled whiskery structures via sonochemical route. J. Cryst. Growth 2003, 257, 378–383. [Google Scholar] [CrossRef]
  26. Li, N.; Charles, R. Martin and Bruno Scrosati, A High-Rate, High-Capacity, Nanostructured Tin Oxide Electrode. Electrochem. Solid State Lett. 2000, 3, 316. [Google Scholar] [CrossRef]
  27. Zhang, X.; Liu, Y.-C.; Zhang, J.; Lu, Y.; Shen, D.; Fan, X.; Kong, X. Structure and photoluminescence of Mn-passivated nanocrystalline ZnO thin films. J. Cryst. Growth 2003, 254, 80–85. [Google Scholar] [CrossRef]
  28. Baik, N.S.; Sakai, G.; Shimanoe, K.; Miura, N.; Yamazoe, N. Hydrothermal treatment of tin oxide sol solution for preparation of thin-film sensor with enhanced thermal stability and gas sensitivity. Sens. Actuators B Chem. 2000, 65, 97–100. [Google Scholar] [CrossRef]
  29. Singh, A.; Aswal, D.K.; Viswanadham, C.; Goswami, G.; Gupta, L.; Gupta, S.; Yakhmi, J.V. Enhanced magnetoresistance in nanocrystalline La0.6Pb0.4MnO3 thin films. J. Cryst. Growth 2002, 244, 313–317. [Google Scholar] [CrossRef]
  30. Chavez, K.L.; Hess, D.W. A Novel Method of Etching Copper Oxide Using Acetic Acid. J. Electrochem. Soc. 2001, 148, G640–G643. [Google Scholar] [CrossRef] [Green Version]
  31. Zhao, L.; Mitsushima, S.; Ishihara, A.; Matsuzawa, K.; Ota, K.-I. Pt-Ir-SnO2/C Electrocatalysts for Ethanol Oxidation in Acidic Media. Chin. J. Catal. 2011, 32, 1856–1863. [Google Scholar] [CrossRef]
  32. Abdo, H.S.; Seikh, A.H.; Mohammed, J.A.; Luqman, M.; Ragab, S.A.; Almotairy, S.M. Influence of Chloride Ions on Electrochemical Corrosion Behavior of Dual-Phase Steel over Conventional Rebar in Pore Solution. Appl. Sci. 2020, 10, 4568. [Google Scholar] [CrossRef]
  33. Abdo, H.S.; Seikh, A.H.; Mandal, B.B.; Mohammed, J.A.; Ragab, S.A.; Abdo, M.S. Microstructural Characterization and Corrosion-Resistance Behavior of Dual-Phase Steels Compared to Conventional Rebar. Crystals 2020, 10, 1068. [Google Scholar] [CrossRef]
  34. Singh, A.K.; Shukla, S.K.; Singh, M.; Quraishi, M. Inhibitive Effect of Ceftazidime on Corrosion of Mild Steel in Hydrochloric Acid Solution. Mater. Chem. Phys. 2011, 129, 68–76. [Google Scholar] [CrossRef]
  35. El Azhar, M.; Mernari, B.; Traisnel, M.; Bentiss, F.; Lagrenée, M. Corrosion Inhibition of Mild Steel by the New Class of Inhibitors [2,5- Bis(n-Pyridyl)-1,3,4-Thiadiazoles] in Acidic Media. Corros. Sci. 2001, 43, 2229–2238. [Google Scholar] [CrossRef]
  36. Macdonald, J.R.; Johnson, W.B. Impedance Spectroscopy: Theory, Experiment, and Applications, 2nd ed.; Wiley: New York, NY, USA, 1987; ISBN 978-0-471-64749-2. [Google Scholar]
Figure 1. CV curves of the as-received Cu foil (black line) and the SnO2-coated Cu foil samples deposited over different times periods of 10 min (green line), 15 min (red line), and 20 min (blue line) recorded in 1 M ethanol + 1 M potassium hydroxide (KOH) solution.
Crystals 11 00055 g001
Figure 2. Chronoamperometry curves of the ethanol oxidation reaction on as-received Cu foil (black line) and the SnO2-coated Cu foil samples deposited over different times periods of 10 min (green line), 15 min (red line), and 20 min (blue line).
Crystals 11 00055 g002
Figure 3. Polarization study on the as-received Cu foil and SnO2-coated Cu electrode samples deposited over different time periods in 1 M ethanol + 1 M KOH solution.
Crystals 11 00055 g003
Figure 4. Nyquist plots of the as-received Cu and SnO2-coated Cu electrodes deposited over different time periods in 1 M ethanol + 1 M KOH solution.
Crystals 11 00055 g004
Figure 5. Equivalent circuit diagram.
Crystals 11 00055 g005
Figure 6. XRD patterns of SnO2 deposited on Cu foil over different time periods.
Crystals 11 00055 g006
Figure 7. SEM images of the SnO2-coated Cu samples deposited over (a) 10 min, (b) 15 min, and (c) 20 min.
Crystals 11 00055 g007
Table 1. Ecorr and icorr value of as received Cu and SnO2-coated Cu in 1 M ethanol + 1 M potassium hydroxide (KOH) solution.
Sample Nameicorr(A/cm2)Ecorr(V)
As-received Cu3 × 10−6−3.56 × 10⁻¹
10 min7 × 10−53.24 × 10⁻¹
15 min1.5 × 10−4−3.29 × 10⁻¹
20 min2.5 × 10−3−3.67 × 10⁻¹
Table 2. Electrochemical impedance parameters of the as-received Cu and SnO2-coated Cu electrodes deposited for different time periods in 1 M ethanol + 1 M KOH solution.
Sample NameRct (Ohm cm2)n
As-received Cu32.20.762
10 min14.6 0.778
15 min8.70.858
20 min5.40.828
Table 3. EDX analysis of the SnO2-coated Cu electrodes deposited over different time periods in 1 M ethanol + 1 M KOH solution.
SampleElementWeight%Atom%
10 minO26.4868.06
Sn73.5231.94
15 minO20.5063.30
Sn79.5036.70
20 minO18.3061.42
Sn81.738.58
Publisher’s Note: MDPI stays neutral with regard to jurisdictional claims in published maps and institutional affiliations.

