
Three-Dimensional Electron Diffraction for Structural Analysis of Beam-Sensitive Metal-Organic Frameworks


Department of Materials and Environmental Chemistry, Stockholm University, 106 91 Stockholm, Sweden
*
Author to whom correspondence should be addressed.
Crystals 2021, 11(3), 263; https://0-doi-org.brum.beds.ac.uk/10.3390/cryst11030263
Submission received: 31 January 2021
/
Revised: 23 February 2021
/
Accepted: 2 March 2021
/
Published: 8 March 2021
(This article belongs to the Special Issue Crystallography on Metal-Organic Frameworks and Beyond)
Abstract
:Electrons interact strongly with matter, which makes it possible to obtain high-resolution electron diffraction data from nano- and submicron-sized crystals. Using electron beam as a radiation source in a transmission electron microscope (TEM), ab initio structure determination can be conducted from crystals that are 6–7 orders of magnitude smaller than using X-rays. The rapid development of three-dimensional electron diffraction (3DED) techniques has attracted increasing interests in the field of metal-organic frameworks (MOFs), where it is often difficult to obtain large and high-quality crystals for single-crystal X-ray diffraction. Nowadays, a 3DED dataset can be acquired in 15–250 s by applying continuous crystal rotation, and the required electron dose rate can be very low (<0.1 e s−1 Å−2). In this review, we describe the evolution of 3DED data collection techniques and how the recent development of continuous rotation electron diffraction techniques improves data quality. We further describe the structure elucidation of MOFs using 3DED techniques, showing examples of using both low- and high-resolution 3DED data. With an improved data quality, 3DED can achieve a high accuracy, and reveal more structural details of MOFs. Because the physical and chemical properties of MOFs are closely associated with their crystal structures, we believe 3DED will only increase its importance in developing MOF materials.
1. Introduction
Metal-organic frameworks (MOFs) or porous coordination polymers (PCPs) are formed by coordination of metal ions or clusters with organic ligands. Due to their large surface areas, tunable pore structures, adjustable chemical functionality, and structural flexibility [1,2,3,4,5,6], MOFs have shown wide applications such as gas storage [7,8,9,10], separation [11,12,13,14], energy storage and conversion [15,16,17,18,19,20], drug delivery [21,22], sensing [23,24,25,26], catalysis [27,28,29,30,31], and bio-technological applications [32]. A deep understanding of their atomic structures is essential for utilizing their properties to develop new applications and design new MOFs. Various diffraction techniques have been applied for structure determination of MOF crystals, among which are single-crystal X-ray diffraction (SCXRD), powder X-ray diffraction (PXRD), and electron diffraction (ED).
SCXRD is currently the most common and mature technique for structure determination. A large variety of crystal structures of new materials has been solved using SCXRD [33]. However, structure determination by SCXRD requires large crystal sizes to be at least a few micrometers, and it is sometimes difficult to grow for MOF crystals. Many MOFs are synthesized as nano- or submicron-sized crystals, which are too small to be studied by SCXRD. In such cases, PXRD has been an alternative technique, by which data from millions of randomly oriented crystals are collected. However, the peak overlap of Bragg reflections in PXRD data leads to a major challenging for structure determination where extraction of the intensities of overlapped peaks is difficult. This drawback is more likely intensified for MOFs, which often have large unit cells or contain multiple crystalline phases.
Three-dimensional electron diffraction (3DED) techniques have been developed to overcome the size limitation imposed by SCXRD, which have been shown to be powerful for ab initio structure determination of nano- or submicron-sized crystals. Electrons interact much stronger with matter than X-rays do. By taking this advantage, therefore, ED data with a high signal-to-noise ratio can be obtained even for tiny crystals. During the past two decades, several research groups have independently developed different protocols of 3DED [34,35,36,37,38,39,40,41,42,43,44]. The principle of 3DED is to tilt the crystal around the goniometer axis in a TEM and record two-dimensional (2D) ED pattern at each tilt angle. Reconstructing the 2D ED patterns at different angles into a 3D reciprocal lattice allows for the determination of unit cell and space group. Further indexing the reflections and extracting their intensities provide the basis for determining the crystal structure by using e.g., direct methods, charge flipping, etc. Various studies have demonstrated that 3DED methods can effectively and accurately determine different kinds of structures of MOFs [45,46,47].
In this review, we describe the development of 3DED techniques, with a focus on recently developed continuous rotation data collection. Benefiting from the fast data collection, the continuous rotation methods exhibit significant advantages for structural analysis of MOFs, which are sensitive to radiation damage by electron beams. We explore the importance of minimizing radiation damage and improving data quality to achieve high accuracy and reliability of atomic structures obtained by 3DED. We choose several MOFs as examples to demonstrate the power of structure determination by 3DED, from low-resolution data (≥1.3 Å) to high-resolution data (<1.3 Å). Finally, we discuss the limitation and future perspectives of 3DED methods.
2. Three-Dimensional Electron Diffraction (3DED) Methods
Electron diffraction (ED) was first discovered in 1927 [48]. Structural analysis by ED has also a long history, with the first publication of structure determination by ED in 1937 [49]. Ab initio structure determination was conducted on different types of organic and inorganic crystals using ED patterns taken along different zone axes [50,51,52,53,54]. However, it is highly time-consuming to collect complete ED data and obtain integrated intensities based on zone axis patterns. It is also challenging to merge ED intensities from different zone axes to obtain 3D data. Furthermore, multiple scattering of electrons in the crystal results in dynamical effects, which are pronounced in zonal ED patterns.
Since the late 2000 s, several groups have developed 3DED techniques to address the aforementioned drawbacks in using electron diffraction for structural analysis of nano- and submicron-sized crystals. Two groups led by Kolb and Hovmöller independently developed methods and software for 3DED data collection. The basic concept of 3DED is to rotate an arbitrarily oriented crystal by tilting a goniometer in a TEM and acquire a series of ED patterns at different goniometer tilt angles, so that 3D reciprocal space is sampled. Kolb et al. developed automated diffraction tomography (ADT) [34], which is performed in scanning transmission electron microscopy (STEM) mode. During the data collection of ADTs, the fine data sampling is achieved by combining goniometer tilt with electron beam precession using the beam tilt deflectors, which is also called precession electron diffraction tomography (PEDT) [35]. Hovmöller et al. developed rotation electron diffraction (RED) [36,37], which is performed in TEM mode using stepwise rotation. During the data collection of RED, the sampling is achieved by combining coarse goniometer tilt (e.g., 1.0–2.0 °/step) with fine beam tilt (e.g., 0.05–0.20 °/step) to cover the reciprocal space. Various software has been developed for processing 3DED data, and reconstruction and virtualization of reflections in 3D reciprocal space, i.e., RED data processing [37], ADT3D [55], PETS [56], and EDT-PROCESS [38]. From the reconstructed 3D reciprocal lattice, the unit cell parameters and space group can be determined, and the intensities can be integrated and extracted. The developments of 3DED have drastically simplified the data collection procedure, decreased the time needed for data collection, and reduced the effect of dynamical scattering.
Overcoming the size limitation of SCXRD, 3DED has been applied to study nano- and submicron-crystals of MOFs, whose structures are difficult or even impossible to be solved by SCXRD or PXRD [45,46,47]. However, due to the weak coordination interaction between inorganic metal ions and organic linkers, MOFs suffer more from electron beam damage than inorganic crystals, such as zeolites [57] and metal oxides [58]. This leads to crystal degradation during the 3DED data collection. As a result, data quality is limited, particularly in terms of data resolution, which needs to be higher enough to resolve individual atoms in MOF crystals for ab initio structure determination. While it is possible to obtain structural models from low resolution 3DED data, the data is not enough for structure refinement to validate the structural model. In such a case, other techniques, such as Rietveld refinement against PXRD, nuclear magnetic resonance (NMR) spectroscopy, etc. are often used as complementary methods to validate the structures obtained from 3DED data [59,60,61,62].
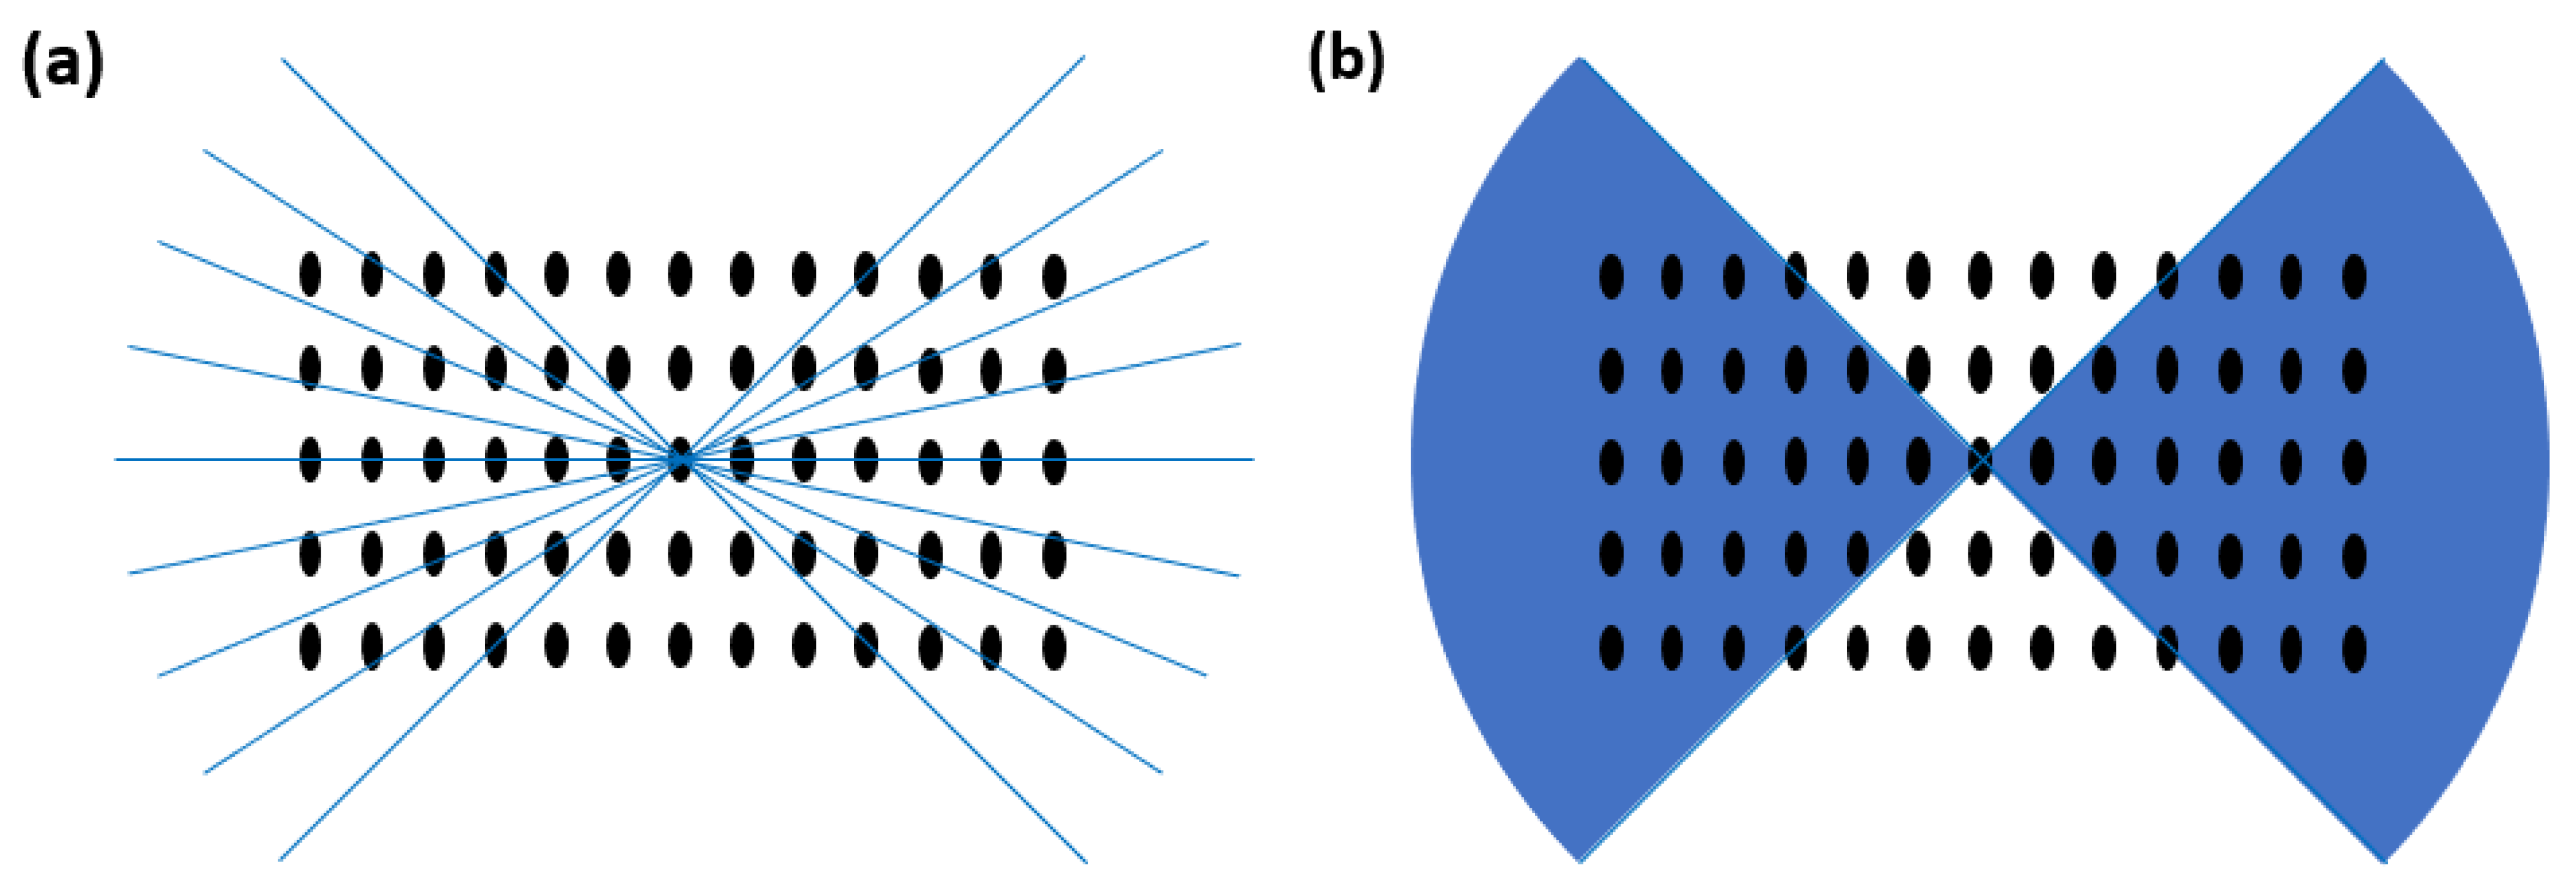
New 3DED protocols by applying continuous crystal rotation, denoted by different groups as continuous rotation electron diffraction (cRED) [43], Fast ADT [44], Fast-EDT [42], MicroED [41], and rotation electron diffraction [40], have been developed. As a result, these methods have greatly speeded up data collection, reduced beam damage, and improved data quality. In contrast to the stepwise 3DED techniques, 3DED data are recorded in a movie mode while the crystal is continuously rotated at a constant speed (Figure 1). Using this strategy, the total data collection time can be reduced to less than a few minutes, which drastically reduces the overall beam damage and prevents loss of crystallinity. Combining with a high-speed detector with fast readout time, the total electron dose applied on the crystal can be decreased, the missing data wedge in 3D reciprocal space can be minimized, and data quality can therefore be further improved. Because the recorded images represent integrated intensities over the desired exposure time for continuous rotation data, more accurate intensities can be obtained. In many cases, collecting the data at the cryogenic condition with a cooling holder can further mitigate the beam damage [63] and therefore improve data resolution. In practice, due to the sample drift caused by goniometer tilt, it is often difficult to keep the same crystal area selected for data acquisition using continuous rotation methods. To solve the problem, a crystal-tracking solution was developed by defocusing the diffraction patterns at regular intervals (e.g., after every 10 diffraction patterns), and the crystal can be re-centered either manually or automatically by software such as Instamatic [43,64]. For continuous rotation data, in addition to the software developed for processing stepwise 3DED data [65,66], software developed for X-ray crystallography, such as XDS [67], DIALS [68], and MOSFLM [69] can be adapted for data reduction and intensity extraction. Using kinematical approximation, ab initio structure solution can be performed in a similar manner as for SCXRD by applying direct methods, charge flipping, etc., with software such as SHELX [70,71], SIR [72], and JANA [73]. Notably, during data processing, wavelength and atomic scattering factors for electrons should be used instead of those for X-rays. Electron beam damage could be further reduced using serial electron diffraction (SerialED), where one single ED pattern is obtained per crystal with a throughput of thousands of ED patterns per hour [43]. Recent publications show that SerialED could enhance the resolution and signal-to-noise ratio of the data [74,75]. However, unit cell parameters are required for processing and indexing of SerialED data, which is an obstacle for the study of new materials, e.g., new MOFs. On the other hand, the development of serial rotation electron diffraction (SerialRED) allows automated cRED data acquisition, with a throughput of hundreds of crystals per hour [76]. An automated data processing pipeline was developed to process the SerialRED data, group and identify various phases in the sample by hierarchical cluster analysis based on the matching of unit cells and diffraction intensities [76]. With such advantages of the latest developments on 3DED methods, the number of MOF structures determined by 3DED keeps increasing.
3. Applications of 3DED on MOFs
As 3DED provides advantages on structural analysis of nano- and submicron-sized crystals, a growing number of MOFs whose structures cannot be studied by SCXRD have been determined by 3DED (Table 1). In this section, we present various examples of structure determination of MOFs using both low resolution (≥1.3 Å) and high-resolution (<1.3 Å) 3DED data. We first describe early applications with generally low data resolutions, followed by applications using high-resolution data obtained with improved 3DED techniques. We explore the importance of improving data resolution to reveal more structural details and achieve high accuracy and reliability of structural models.
3.1. Structural Elucidation Using Low-Resolution 3DED Data
The resolution of 3DED data from a MOF crystal is affected by many factors, for example, the crystallinity of the MOF, the stability of the MOF in vacuum and under the electron beam. Data resolution can be improved by reducing the total electron dose used for 3DED data collection. Stepwise 3DED data collection by ADT and RED, which were first developed, often requires higher electron doses and much longer data collection time compared to continuous rotation 3DED. Therefore, early examples of structure determination of MOFs using stepwise rotation for 3DED data collection, often have poor data resolution (>1.3 Å). In such cases, direct phasing of 3DED data and subsequent least-squares structure refinement were almost impossible. However, the unit cell and space group determined by 3DED can be used for structure solution by real space approaches such as simulate annealing and model building. The resulting structural models need to be further verified and refined using complementary techniques such as PXRD and NMR.
For example, the structures of a series of isoreticular lanthanide-based MOFs were determined using RED data [60]. Built from lanthanide chains and tritopic linkers, the SUMOF-7I to -7IV have expanding pore diameters from 8.4 to 23.9 Å. (Figure 2). It was unsuccessful in producing sufficiently large crystals of SUMOF-7II, III, and IV for SCXRD. Instead, RED was employed for the structure determination of the SUMOF-7s. The resolution of RED data decreased with the increasing size of the linkers, from 1.05 Å for SUMOF-7I(La), 1.23 Å for SUMOF-7II(La), to 3.57 Å for SUMOF-7III(La). As the resolution of the RED data was too low to ab initio determine the structure of SUMOF-7III(La), a structural model was built based on the obtained unit cell by using reticular chemistry. The structural models were further refined against the high-quality PXRD data by Rietveld refinement. SUMOF-7I, 7II, and -7III exhibit permanent porosity and high thermal and chemical stability.
RED was applied to obtain the key structural information of PCN-333(Al). It reveals that the crystal system is cubic with a large a parameter (≈127 Å). The space group was determined to be Fd-3m by combining RED and HRTEM [62]. With this important information, PCN-333(Al) was determined by model building and refined against PXRD data despite the limited data resolution (5 Å). The structural analysis revealed that the PCN-333(Al) MOF contains ultra-large mesoporous cages which could encapsulate enzymes. In another example for the structure determination of PCN-128W, the unit cell parameters and space group were successfully determined from RED data with a resolution of 1.4 Å. An initial structural model was obtained by direct methods. However, the resolution was insufficient for structure refinement. The structure of PCN-128W was subsequently refined against synchrotron PXRD data using the Rietveld method. It reveals that the crystal structure of PCN-128W consists of Zr6 clusters linked by rectangular 4′,4′′′,4′′′′,4′′′′′′′-(ethene-1,1,2,2-tetrayl)tetrakis-(([1,1′-biphenyl]-4-carboxylic acid)) (H4ETTC) planar ligands and exhibits an interesting piezofluorochromic behavior [61].
3.2. Structural Elucidation Using High-Resolution 3DED Data
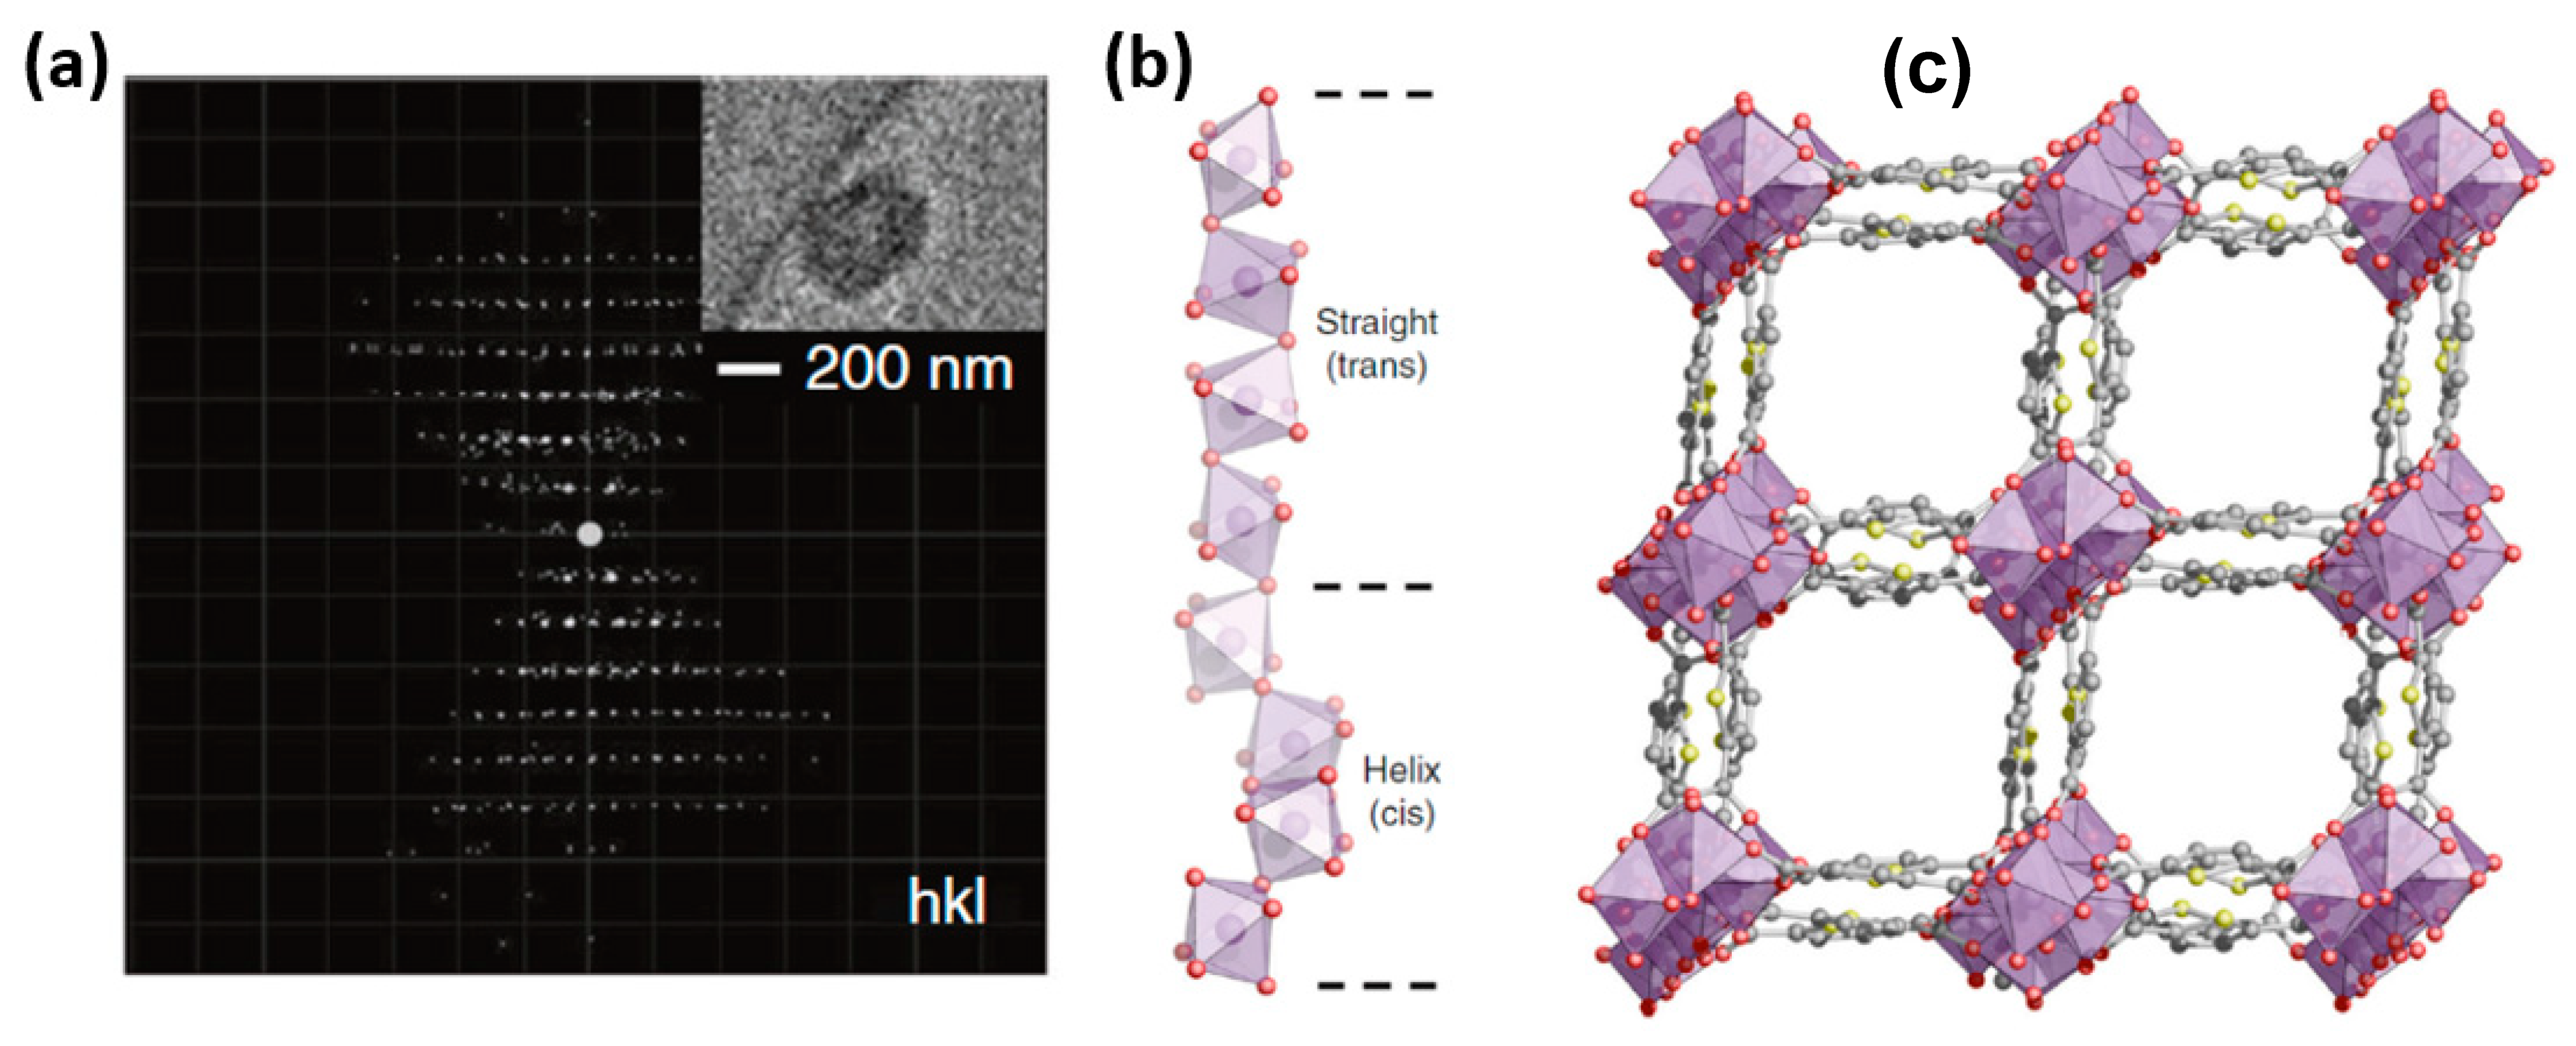
With the development of continuous rotation methods, ultrafast 3DED data collection can be achieved using a high rotation speed (>0.4 º/s), and a complete dataset can be obtained in 15–250 s. A low electron dose rate (<0.1 e Å−2s−1) can be applied to reduce electron beam damage. These advances have significantly improved the 3DED data quality. For most MOFs, it is possible to collect high resolution 3DED data (0.7–1.1 Å, Table 1). With a resolution better than 1.3 Å, the structures of MOFs can be solved ab initio from the 3DED data by direct phasing methods such as direct methods and charge flipping. More importantly the structural model can be refined against 3DED intensities. In addition, with improved data quality, more structural details can be revealed, which provides fundamental knowledge regarding the physical and chemical properties of MOFs. For example, cRED was used to determine the structure of CAU-23 (Figure 3), which crystallized as nano-sized particles of ~200 nm. Low dose illumination and fast data acquisition were applied to collect cRED data. The cRED data has a resolution of 1.13 Å, which is high enough for ab initio structure determination. The structure was therefore solved and refined from the cRED data, and all framework atoms were located with high precision and agreement values [87]. The framework structure of CAU-23 is chiral with a non-centrosymmetric space group. Four consecutive trans and cis corner-sharing AlO6 polyhedra formed the rod-shaped inorganic building unit. CAU-23 has a high-water sorption capacity, which makes it as an ideal material for ultra-low temperature adsorption driven chillers.
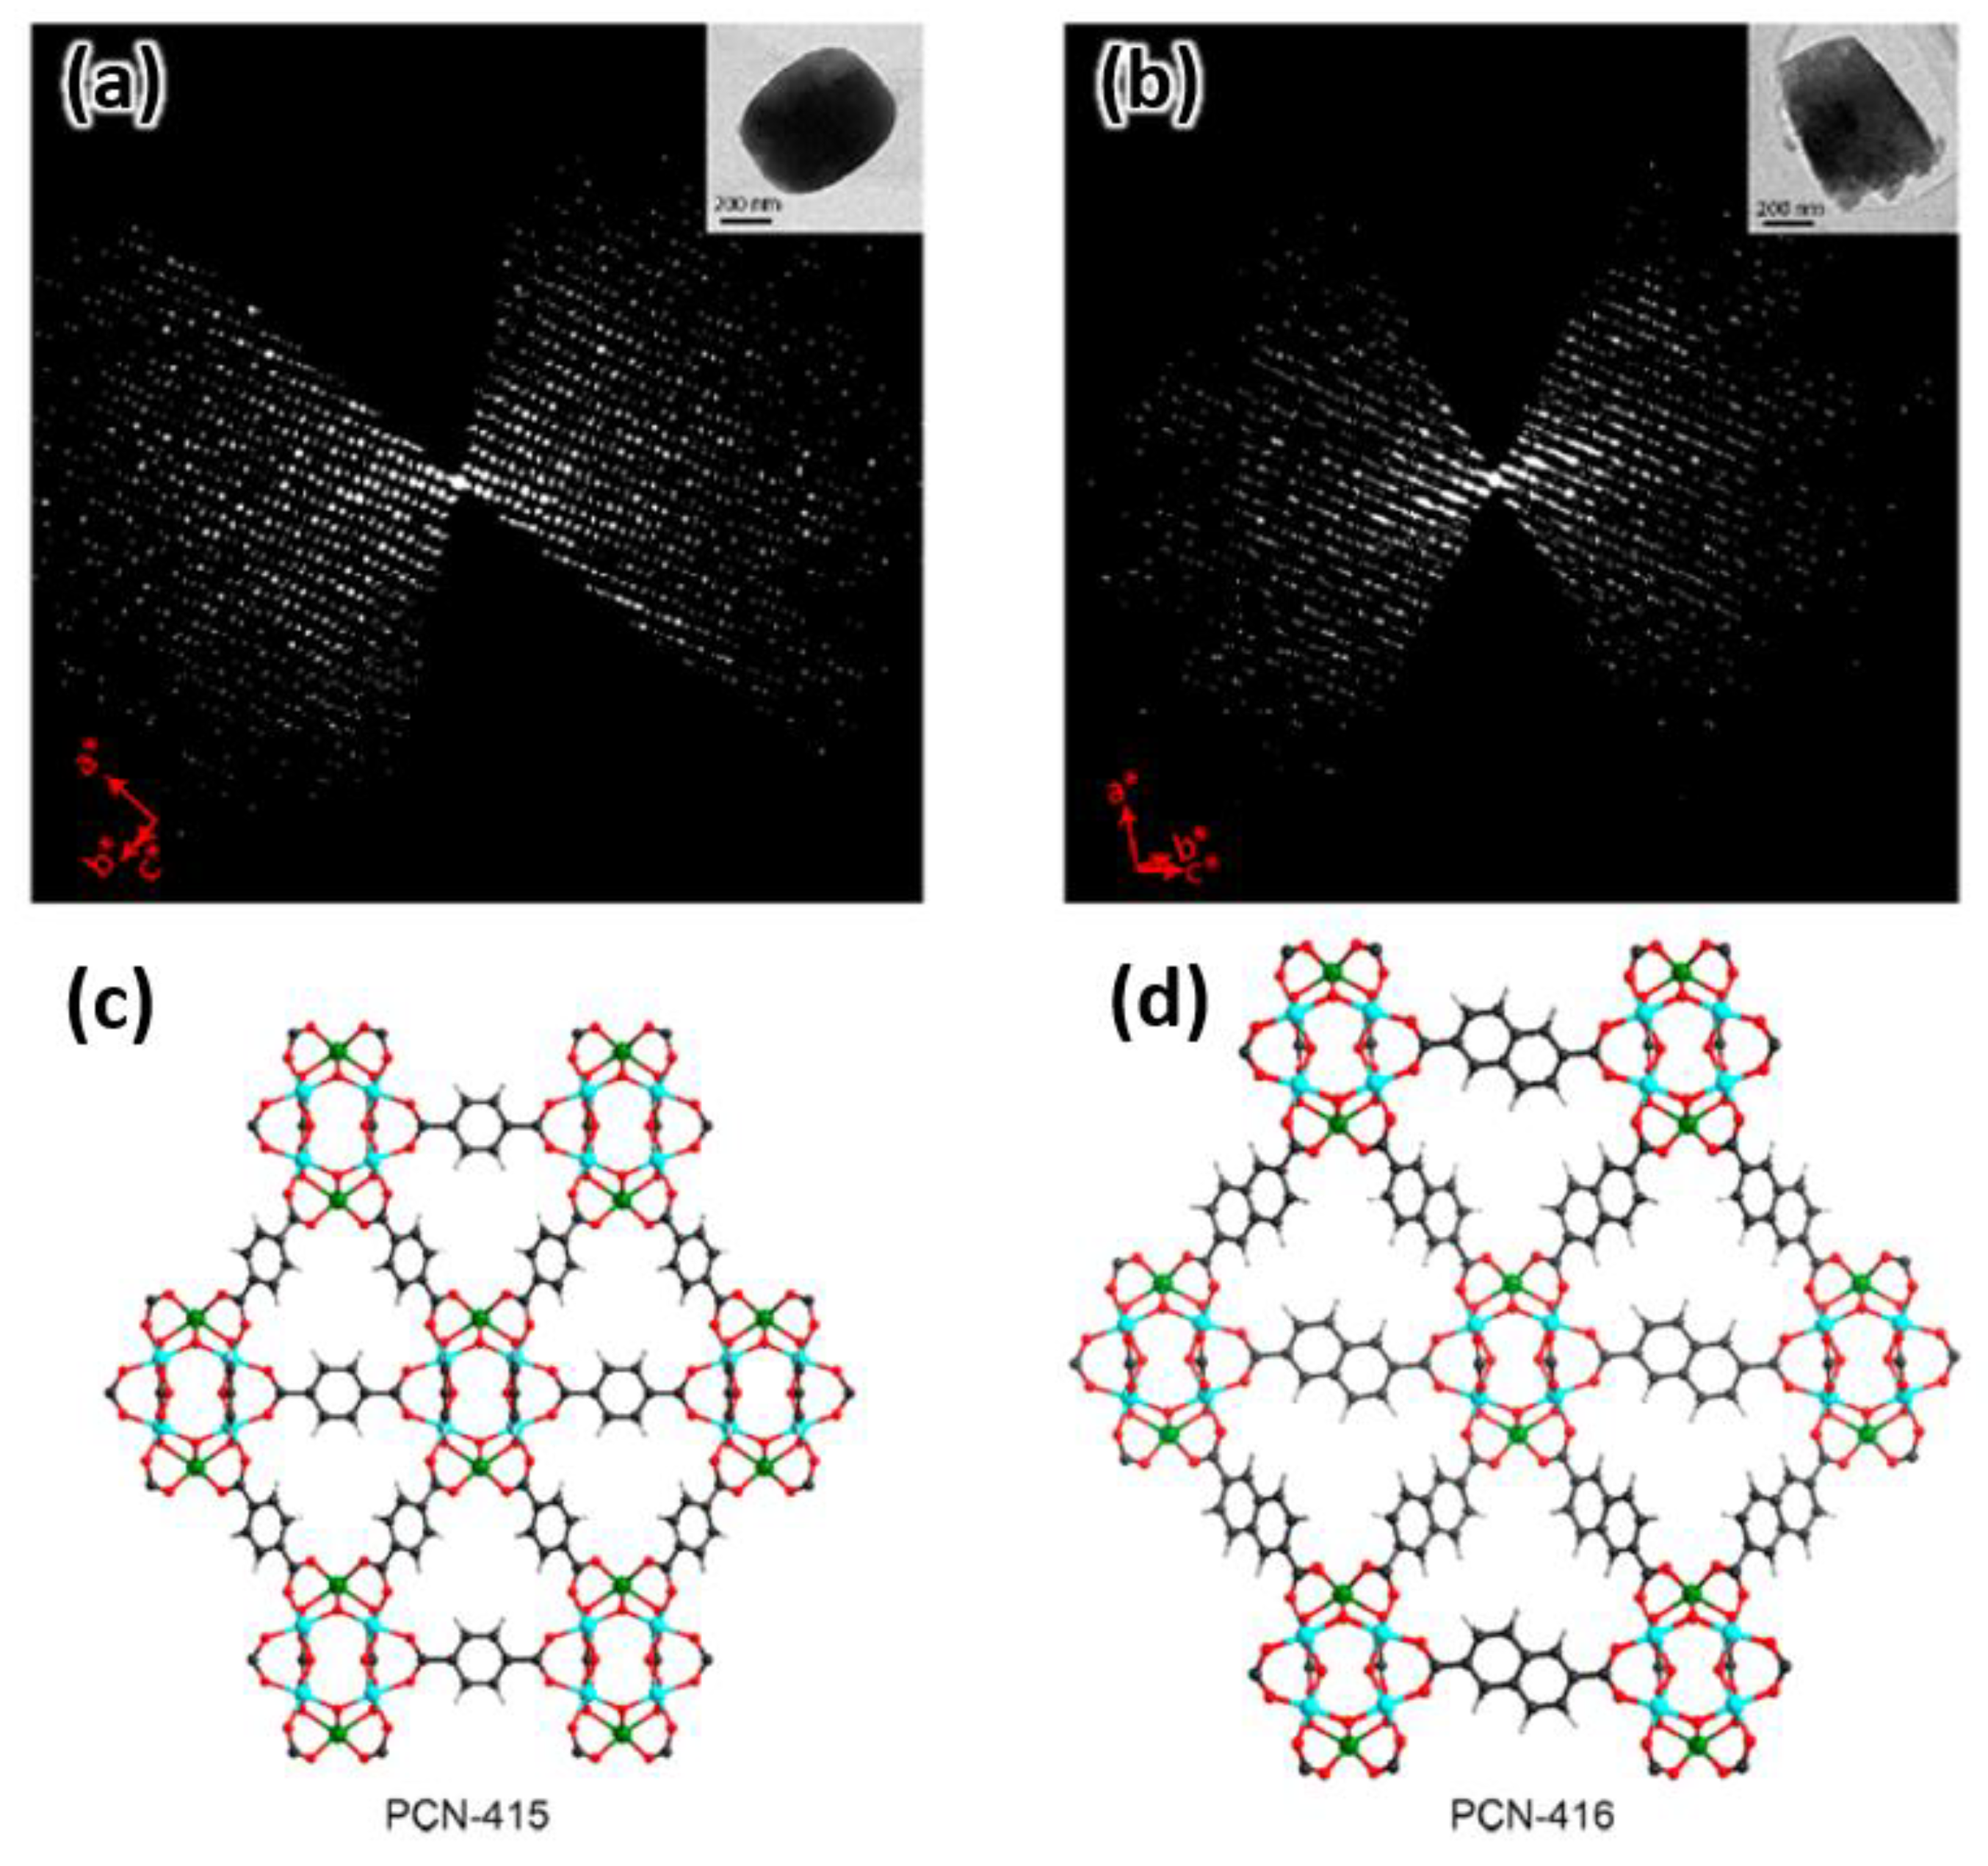
The structures of two isoreticular MOFs named PCN-415 and PCN-416 were successfully determined from cRED data at 0.75 and 1.05 Å resolution, respectively (Figure 4) [85]. PCN-415 was synthesized by linking the [Ti8Zr2O12(MeCOO)16] clusters and 1,4-benzenedicarboxylate (BDC) linkers. Extension of BDC into 2,6-naphthalenedicarboxylate (NDC) gives rise to an isoreticular MOF, PCN-416. Due to the small crystal sizes of PCN-415 and PCN-416, cRED was applied to both solve and refine the structures. In addition, the structural models were compared with those refined against PXRD. The atomic positions refined by cRED and PXRD are very similar and differ on average by 0.032 Å for Zr and Ti atoms and by 0.071 Å for O and C atoms. The small deviation demonstrates high accuracy and reliability of the 3DED method. Importantly, the high-resolution data enables precise locations of Ti and Zr in the mixed metal cluster, which is crucial for understanding the photoactivity of PCN-145 and PCN-416 and their utilization as photocatalysts for hydrogen generation.
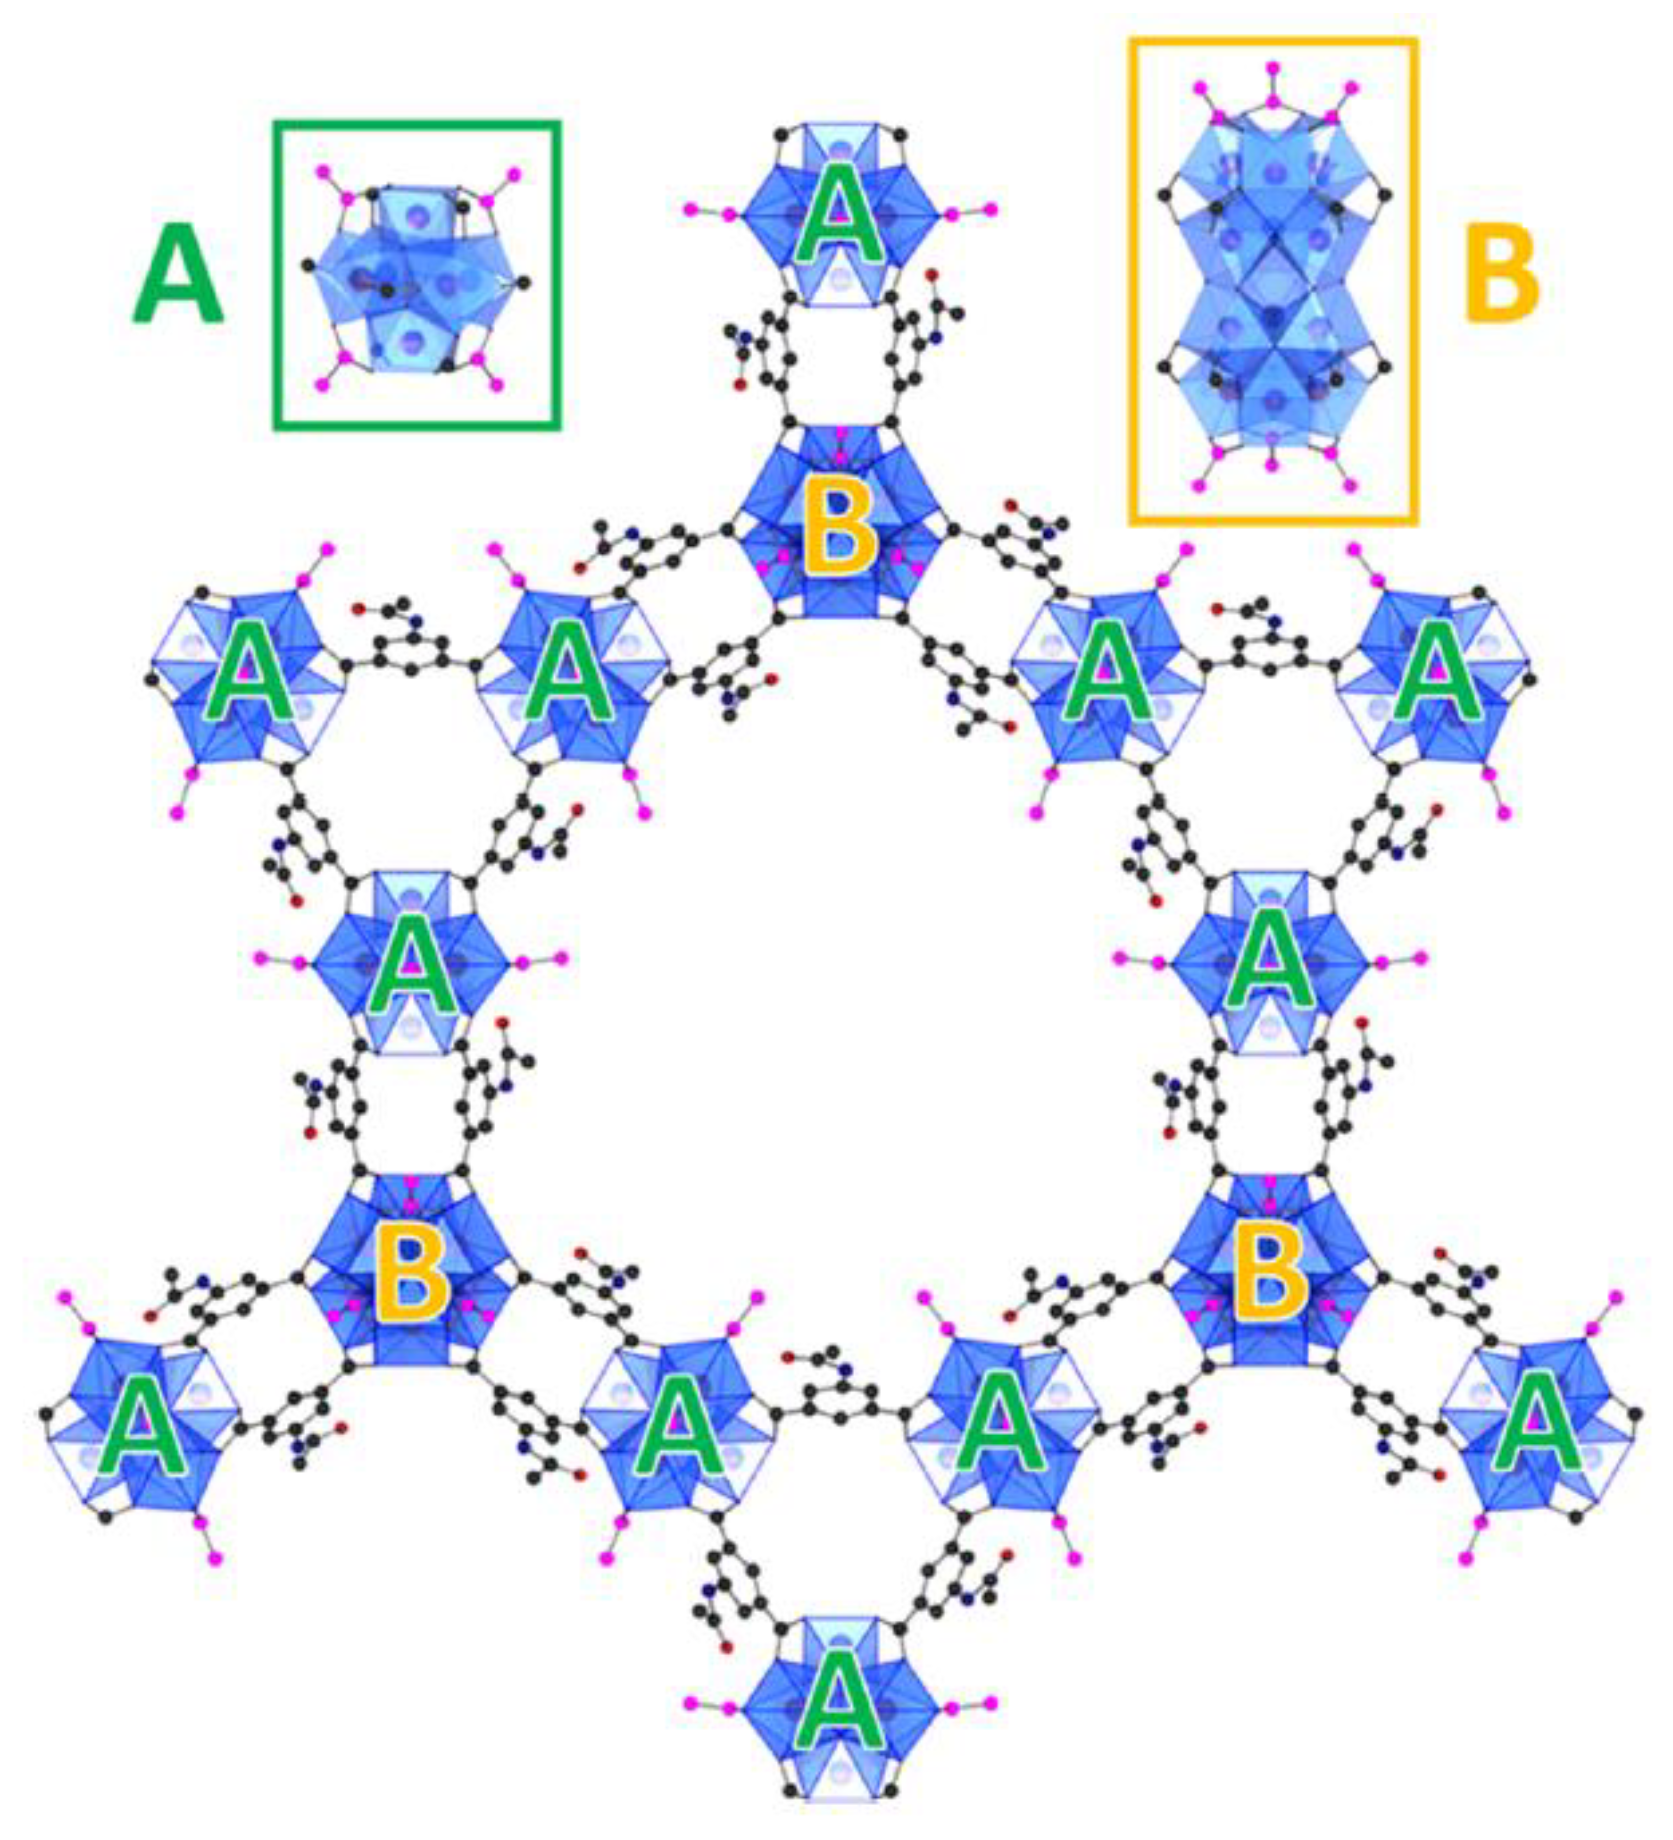
CAU-45 is an example of a mesoporous MOF solved by direct phasing of cRED data [93]. Its structure could be solved from a cRED dataset collected in less than 1.5 min. The data resolution was better than 0.8 Å. Multiple cRED datasets were merged to increase the data completeness. The structure was refined using the high-quality cRED data. In addition to the framework structure, the hydrogen bond network and disorders of the amide groups could be identified from the refinement against the cRED data. CAU-45 exhibits a honeycomb structure of stacked layers which comprise both hexa- and dodecanucelar zirconium clusters (Figure 5).
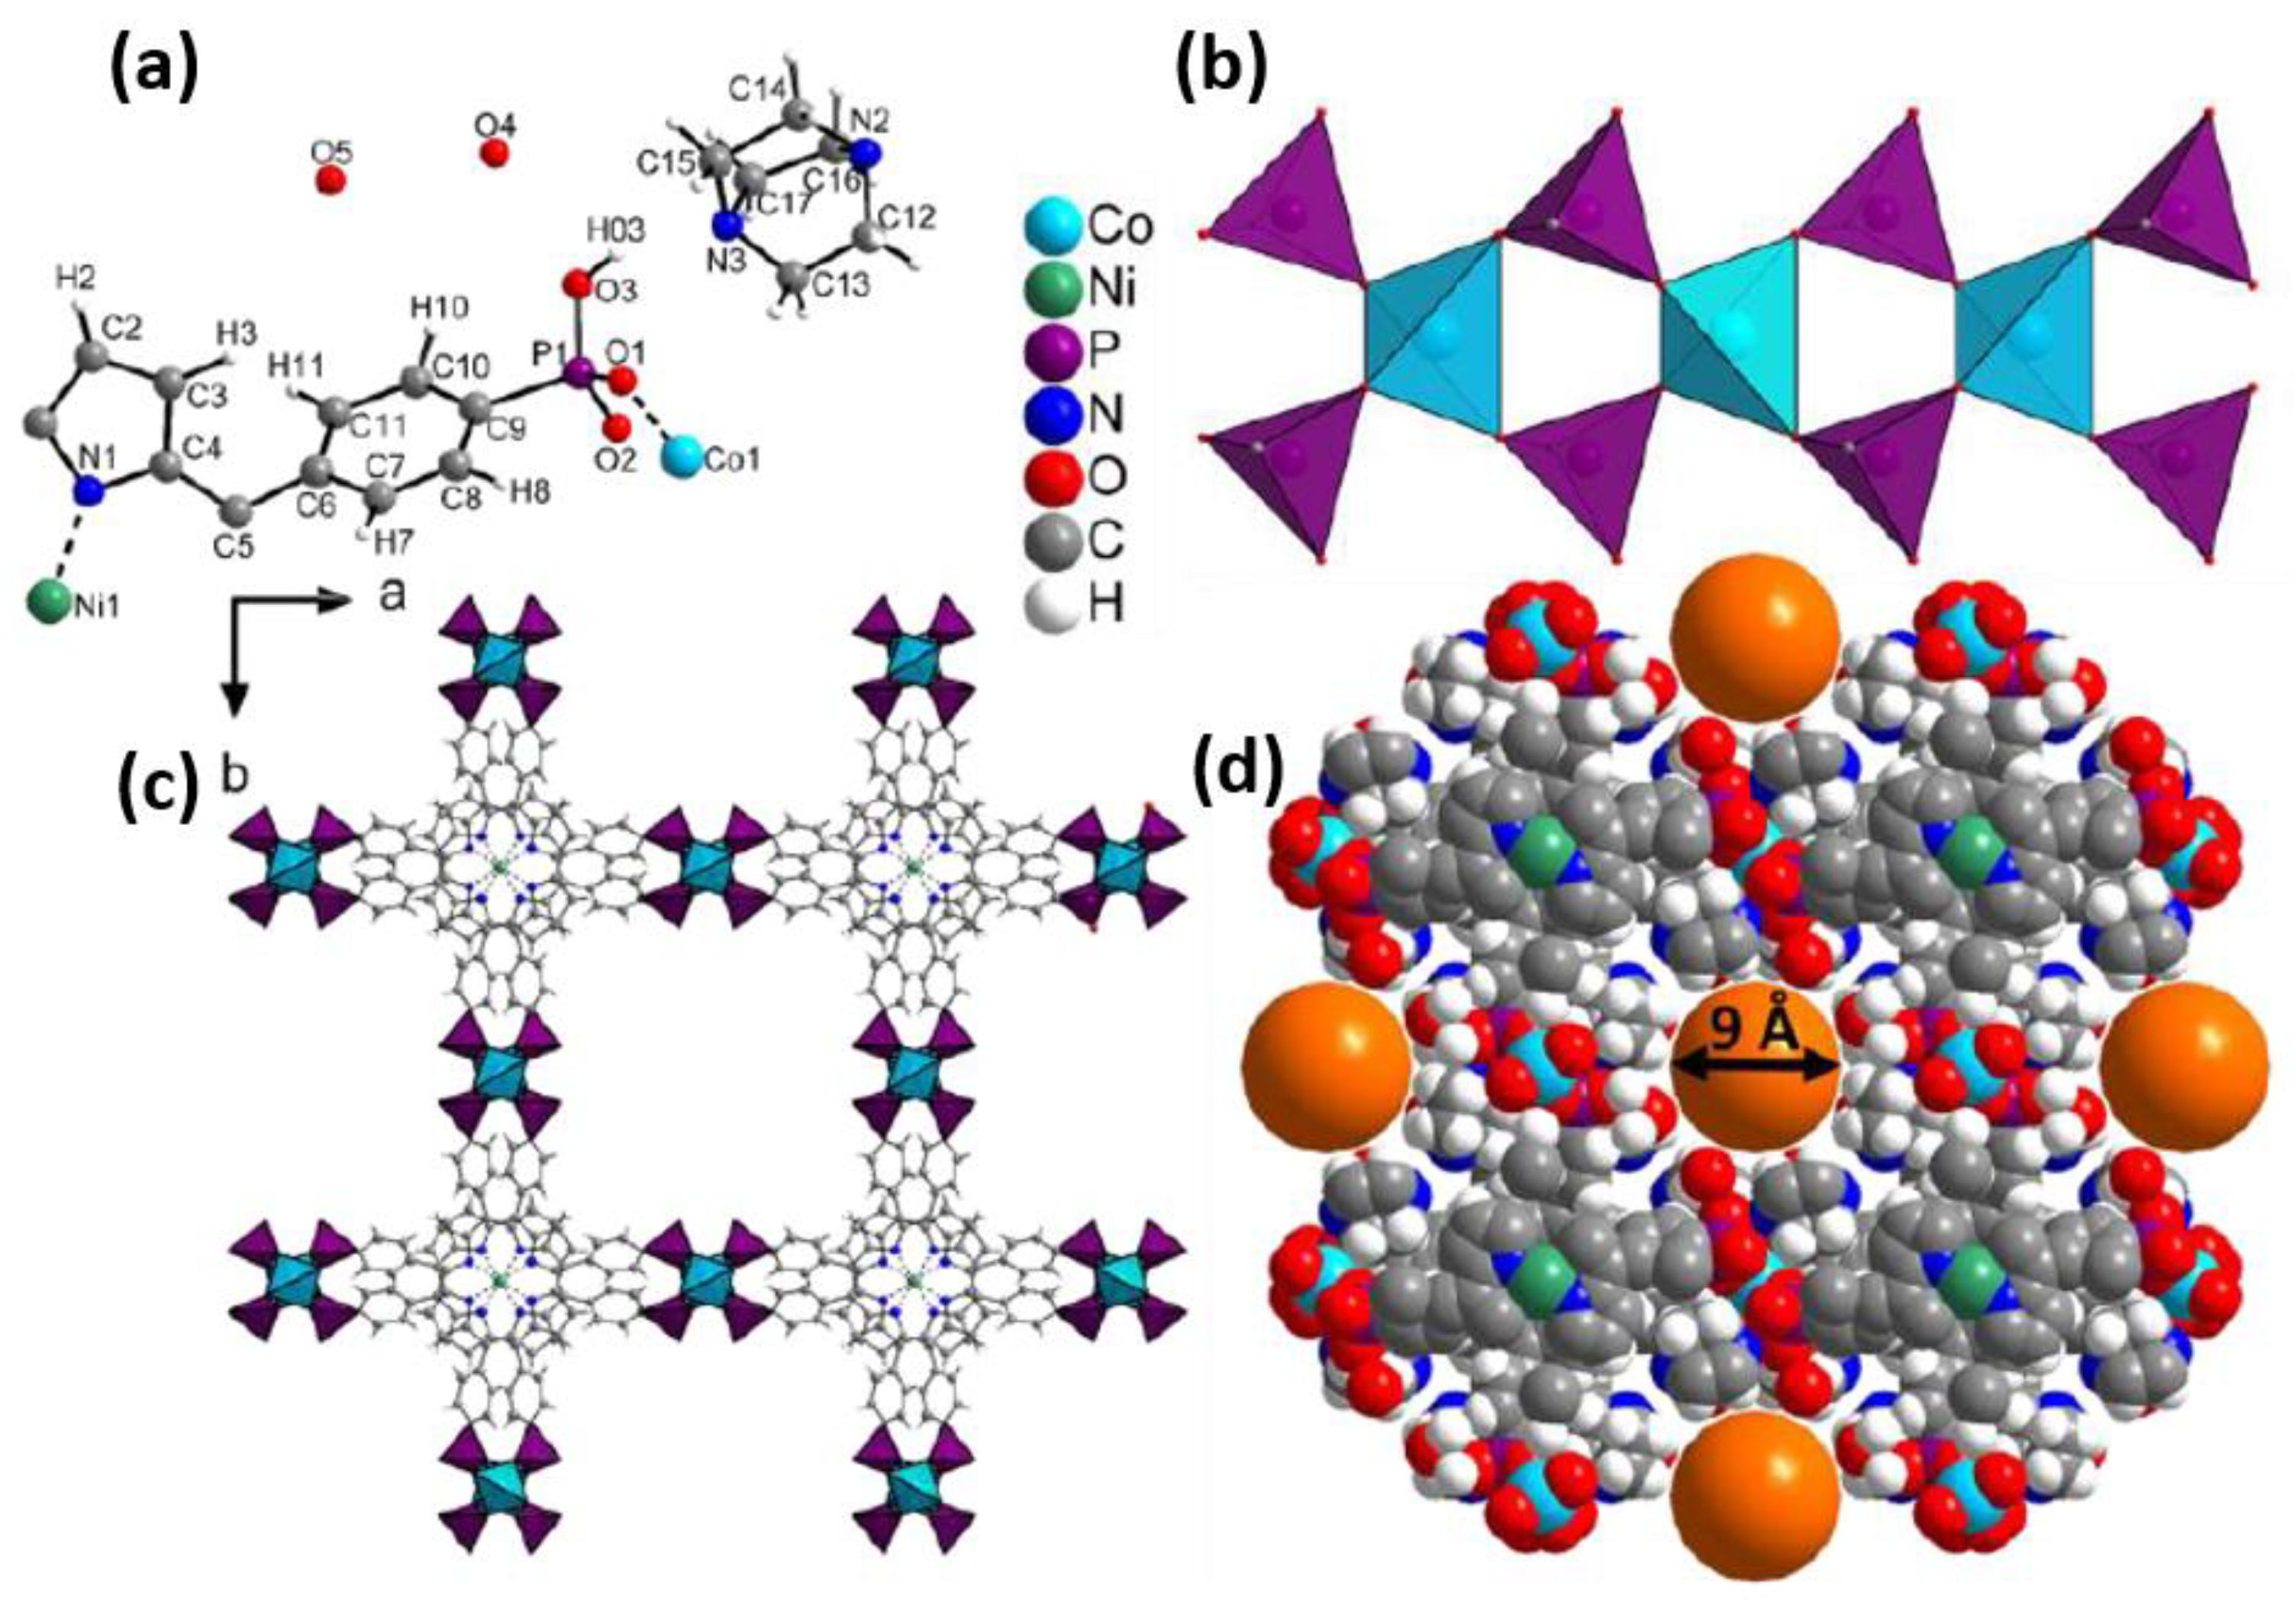
With the improvement of 3DED data quality, it is possible to locate guest species in the pores of MOFs. Using cRED data collected at low sample temperature (96 K), the structure of a novel porous cobalt MOF, Co-CAU-36, was determined (Figure 6) [86]. Co-CAU-36 was synthesized using Co(II) as the metal ion and tetracarboxyporphyrin (H6TCPP) as the linker in a solvent mixture containing 1,4-diazabicyclo[2.2.2]octane (DABCO), HCl, and water. Eight high resolution cRED datasets (0.83–1.00 Å) were obtained from different crystals. Accurate structural models were determined from each of the eight datasets. Notably, not only the framework atoms but also solvent DABCO and H2O molecules in the pores could be located after analyzing the difference Fourier maps. Furthermore, hydrogen bonds were observed between the DABCO and the framework, as well as between the water molecules, which are crucial to stabilize the solvent molecules.
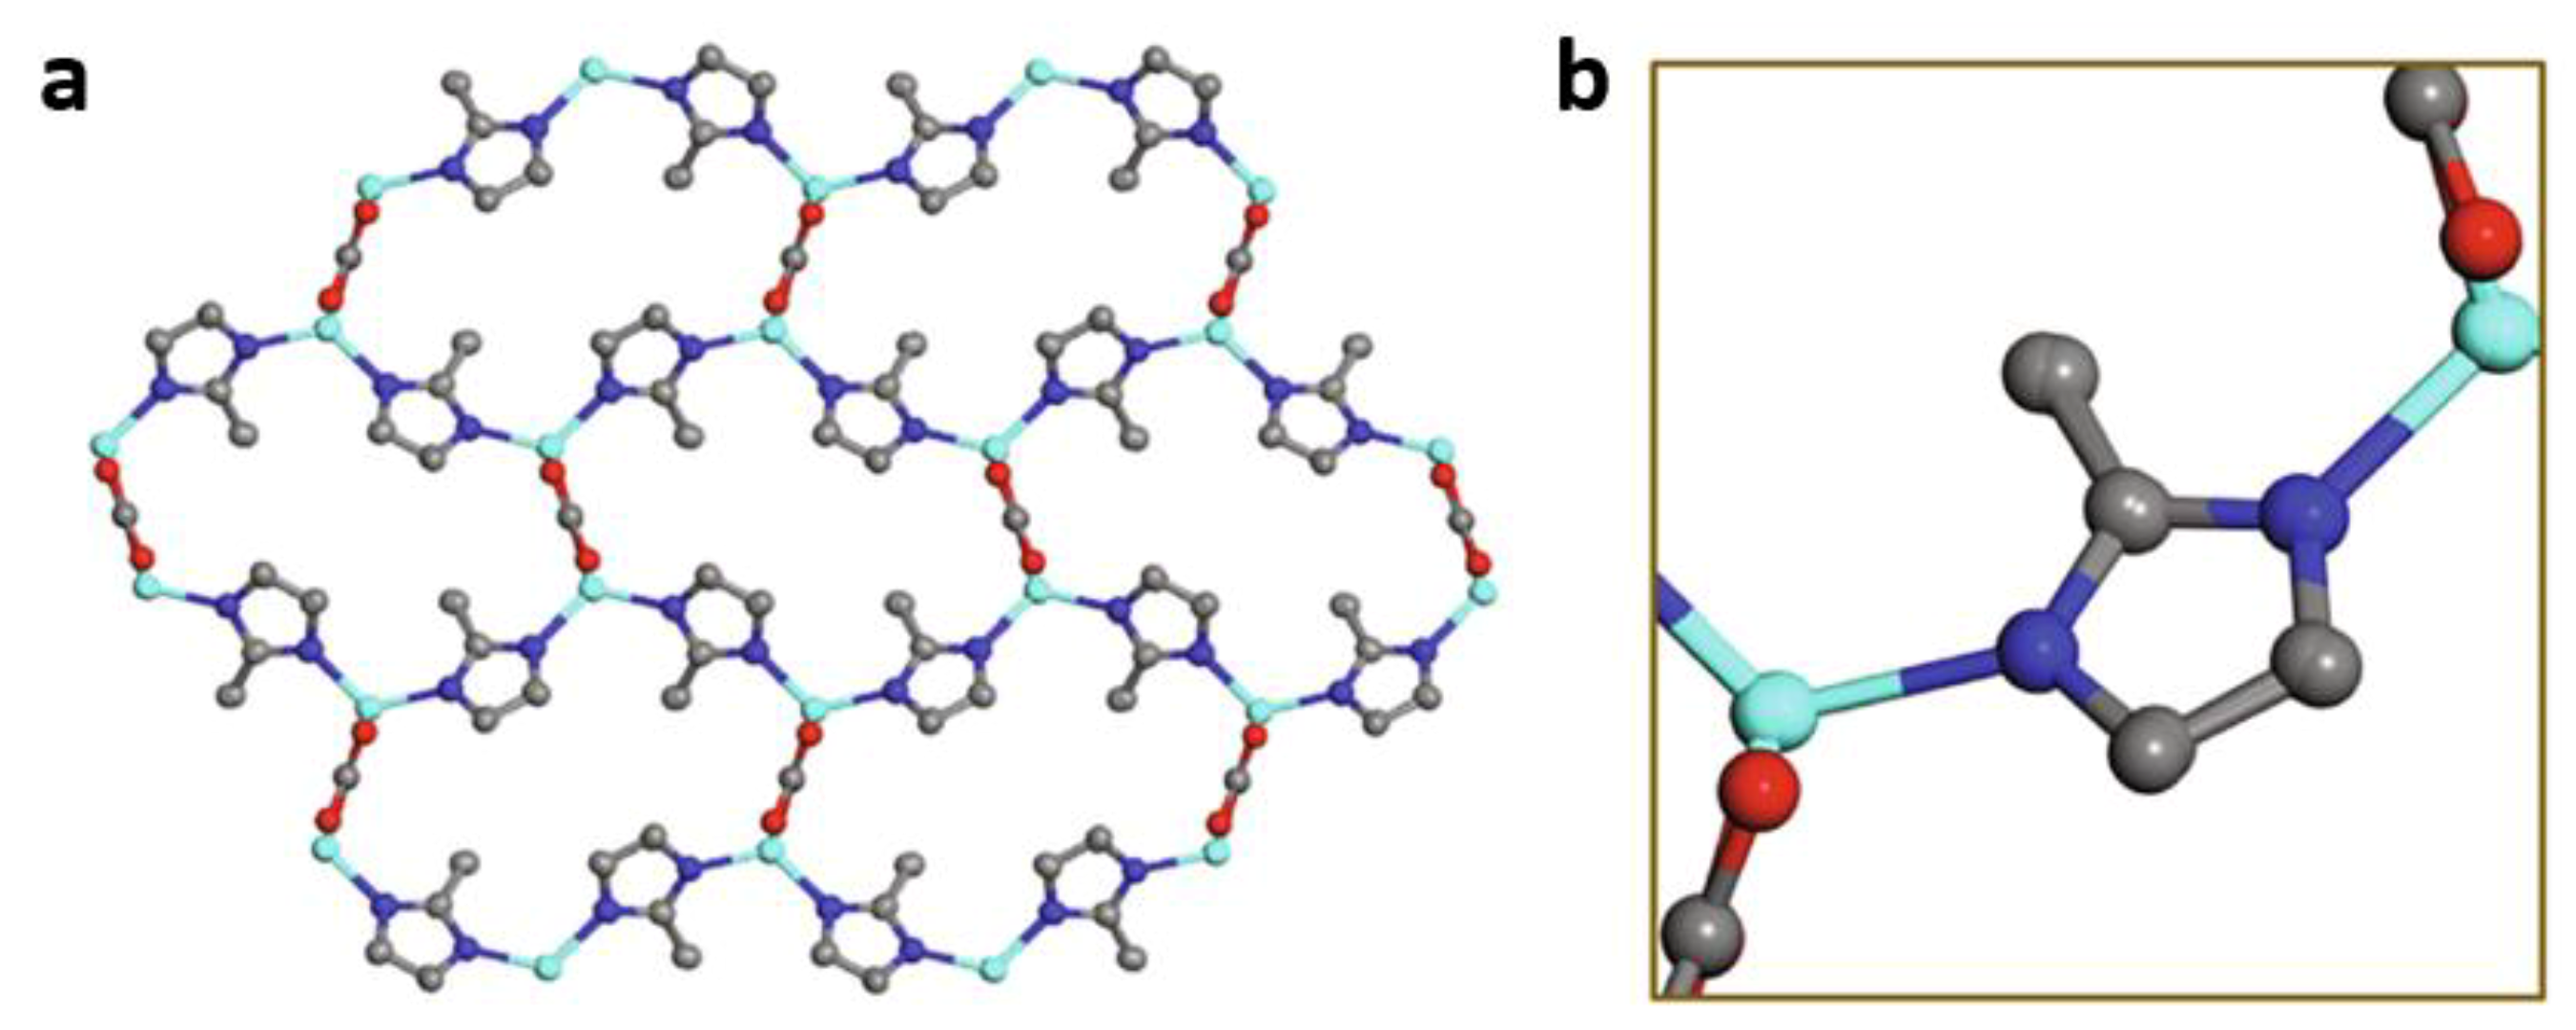
A zeolitic imidazolate framework ZIF-CO3-1 was another example whose structure was ab initio determined using high-resolution cRED data (1.0 Å) [96]. ZIF-CO3-1 was built by linking Zn(II) cations with 2-methylimidazolate (mIM−) and carbonate (CO32− ) ions. To assess the accuracy of structure determination by 3DED, the final structural model of ZIF-CO3-1 refined against cRED data was compared to that refined against SCXRD data (Figure 7) [95,99]. Although the R1 value of cRED data (0.227) is higher than that of SCXRD data (0.049), the two structural models are very similar, with an average deviation of 0.06(1) Å for the heavy Zn atom and 0.07(3) Å for light atoms including N, C, and O (Figure 7). The average deviation for the bond lengths and angles are 0.04(3) Å and 4(3)°, respectively. The small deviation suggests that the structural models obtained by using high quality 3DED data are as accurate and reliable as those obtained by SCXRD. The high R1-values, therefore, are mainly caused by dynamical effects, because the 3DED intensities are treated as kinematical intensities in structure refinement using X-ray crystallography software, such as SHELX and JANA.
4. Summary and Outlook
In this review, we describe the development of using 3D electron diffraction for structure determination and the recent advances of 3DED techniques from stepwise rotation to continuous rotation. The continuous rotation methods provide cutting edges to minimize beam damage and improve data quality. We describe the structure determination of MOFs by using low resolution (≥1.3 Å) and high resolution (<1.3 Å) 3DED data. For low-resolution data, key structural information such as unit cell parameters and space groups can be determined from 3DED data. Further structure determination requires a combination with other characterization techniques. For high-resolution data, structure determination using 3DED can be as accurate as SCXRD does. With the improvement of data quality, detailed structural information such as the location of guest molecules, hydrogen-bonding networks can also be obtained.
Despite the achievements of 3DED methods, more efforts are needed to further develop 3DED techniques and explore their applications in MOF materials. As hardware, especially detectors, are crucial for obtaining high quality data, faster and more sensitive detectors are needed to further improve data resolution. Overcoming dynamical effects caused by multiple scattering is another challenge, which hinders discovering more structural details of MOFs. The loss of crystallinity caused by vacuum can be prevented by applying cryo-EM techniques. However, cryo-EM techniques are mostly based on aqueous solutions. As most MOFs crystallize in organic solvents and could be unstable in aqueous solutions, further development of organic solvent based cryo-EM techniques is desired to prevent damage of MOFs in vacuum.
With the fast development of 3DED techniques, we believe 3DED will become a widespread technique to provide accurate and reliable structural models for MOFs. Predictably, by taking the advantages of 3DED for structural analysis, it will certainly accelerate research in the field of MOFs.
Author Contributions
Z.H. conceived the idea. M.G. and X.Z. prepared an initial draft of the manuscript. All authors have participated in the writing of the final manuscript, and agreed to the published version of the manuscript.
Funding
This work was funded by the Swedish Research Council (VR, 2016-04625, Z.H. and 2017-04321, X.Z.) and the Swedish Research Council Formas (2020-00831, Z.H.).
Conflicts of Interest
There is no conflict to declare.
References
- Yaghi, O.M.; Li, G.; Li, H. Selective binding and removal of guests in a microporous metal–organic framework. Nature 1995, 378, 703–706. [Google Scholar] [CrossRef]
- Kitagawa, S.; Kitaura, R.; Noro, S. Functional porous coordination polymers. Angew. Chem. Int. Ed. 2004, 43, 2334–2375. [Google Scholar] [CrossRef] [PubMed]
- Eddaoudi, M.; Kim, J.; Rosi, N.; Vodak, D.; Wachter, J.; O’Keeffe, M.; Yaghi, O.M. Systematic design of pore size and functionality in isoreticular MOFs and their application in methane storage. Science 2002, 295, 469–472. [Google Scholar] [CrossRef] [PubMed] [Green Version]
- Schneemann, A.; Bon, V.; Schwedler, I.; Senkovska, I.; Kaskel, S.; Fischer, R.A. Flexible metal–organic frameworks. Chem. Soc. Rev. 2014, 43, 6062–6096. [Google Scholar] [CrossRef] [Green Version]
- Lo, S.-H.; Feng, L.; Tan, K.; Huang, Z.; Yuan, S.; Wang, K.-Y.; Li, B.-H.; Liu, W.-L.; Day, G.S.; Tao, S.; et al. Rapid desolvation-triggered domino lattice rearrangement in a metal–organic framework. Nat. Chem. 2020, 12, 90–97. [Google Scholar] [CrossRef] [PubMed]
- Yuan, S.; Huang, L.; Huang, Z.; Sun, D.; Qin, J.-S.; Feng, L.; Li, J.; Zou, X.; Cagin, T.; Zhou, H.-C. Continuous variation of lattice dimensions and pore sizes in metal–organic frameworks. J. Am. Chem. Soc. 2020, 142, 4732–4738. [Google Scholar] [CrossRef] [PubMed]
- Li, H.; Eddaoudi, M.; Groy, T.L.; Yaghi, O.M. Establishing microporosity in open metal− organic frameworks: Gas sorption isotherms for Zn (BDC)(BDC = 1, 4-benzenedicarboxylate). J. Am. Chem. Soc. 1998, 120, 8571–8572. [Google Scholar] [CrossRef]
- Li, Q.; Zhang, W.; Miljanić, O.Š.; Sue, C.-H.; Zhao, Y.-L.; Liu, L.; Knobler, C.B.; Stoddart, J.F.; Yaghi, O.M. Docking in metal-organic frameworks. Science 2009, 325, 855–859. [Google Scholar] [CrossRef]
- Trickett, C.A.; Helal, A.; Al-Maythalony, B.A.; Yamani, Z.H.; Cordova, K.E.; Yaghi, O.M. The chemistry of metal–organic frameworks for CO2 capture, regeneration and conversion. Nat. Rev. Mater. 2017, 2, 1–16. [Google Scholar] [CrossRef]
- Chen, Z.; Li, P.; Zhang, X.; Li, P.; Wasson, M.C.; Islamoglu, T.; Stoddart, J.F.; Farha, O.K. Reticular access to highly porous acs-MOFs with rigid trigonal prismatic linkers for water sorption. J. Am. Chem. Soc. 2019, 141, 2900–2905. [Google Scholar] [CrossRef] [PubMed]
- Li, J.-R.; Sculley, J.; Zhou, H.-C. Metal–organic frameworks for separations. Chem. Rev. 2012, 112, 869–932. [Google Scholar] [CrossRef]
- Duan, J.; Jin, W.; Kitagawa, S. Water-resistant porous coordination polymers for gas separation. Coord. Chem. Rev. 2017, 332, 48–74. [Google Scholar] [CrossRef] [Green Version]
- Bobbitt, N.S.; Mendonca, M.L.; Howarth, A.J.; Islamoglu, T.; Hupp, J.T.; Farha, O.K.; Snurr, Q. Metal–organic frameworks for the removal of toxic industrial chemicals and chemical warfare agents. Chem. Soc. Rev. 2017, 46, 3357–3385. [Google Scholar] [CrossRef] [PubMed]
- Lin, R.-B.; Xiang, S.; Xing, H.; Zhou, W.; Chen, B. Exploration of porous metal–organic frameworks for gas separation and purification. Coord. Chem. Rev. 2019, 378, 87–103. [Google Scholar] [CrossRef]
- Zhang, T.; Lin, W. Metal–organic frameworks for artificial photosynthesis and photocatalysis. Chem. Soc. Rev. 2014, 43, 5982–5993. [Google Scholar] [CrossRef] [PubMed]
- Sheberla, D.; Bachman, J.C.; Elias, J.S.; Sun, C.-J.; Shao-Horn, Y.; Dincă, M. Conductive MOF electrodes for stable supercapacitors with high areal capacitance. Nat. Mater. 2017, 16, 220–224. [Google Scholar] [CrossRef]
- Feng, D.; Lei, T.; Lukatskaya, M.R.; Park, J.; Huang, Z.; Lee, M.; Shaw, L.; Chen, S.; Yakovenko, A.A.; Kulkarni, A.; et al. Robust and conductive two-dimensional metal− organic frameworks with exceptionally high volumetric and areal capacitance. Nat. Energy 2018, 3, 30–36. [Google Scholar] [CrossRef]
- Park, J.; Lee, M.; Feng, D.; Huang, Z.; Hinckley, A.C.; Yakovenko, A.; Zou, X.; Cui, Y.; Bao, Z.J. Stabilization of hexaaminobenzene in a 2D conductive metal–organic framework for high power sodium storage. Am. Chem. Soc. 2018, 140, 10315–10323. [Google Scholar] [CrossRef]
- Chen, G.; Gee, L.B.; Xu, W.; Zhu, Y.; Lezama-Pacheco, J.S.; Huang, Z.; Li, Z.; Babicz, J.T.; Choudhury, S.; Chang, T.-H.; et al. Valence-Dependent Electrical Conductivity in a 3D Tetrahydroxyquinone-Based Metal–Organic Framework. J. Am. Chem. Soc. 2020, 142, 21243–21248. [Google Scholar] [CrossRef] [PubMed]
- Park, J.; Hinckley, A.C.; Huang, Z.; Chen, G.; Yakovenko, A.A.; Zou, X.; Bao, Z.J. High Thermopower in a Zn-Based 3D Semiconductive Metal–Organic Framework. Am. Chem. Soc. 2020, 142, 20531–20535. [Google Scholar] [CrossRef] [PubMed]
- Rocca, J.D.; Liu, D.; Lin, W. Nanoscale metal–organic frameworks for biomedical imaging and drug delivery. Acc. Chem. Res. 2011, 44, 957–968. [Google Scholar] [CrossRef] [Green Version]
- Horcajada, P.; Gref, R.; Baati, T.; Allan, P.K.; Maurin, G.; Couvreur, P.; Férey, G.; Morris, R.E.; Serre, C. Metal–organic frameworks in biomedicine. Chem. Rev. 2012, 112, 1232–1268. [Google Scholar] [CrossRef]
- Kreno, L.E.; Leong, K.; Farha, O.K.; Allendorf, M.; van Duyne, R.P.; Hupp, J.T. Metal–Organic Framework Materials as Chemical Sensors. Chem. Rev. 2012, 112, 1105–1125. [Google Scholar] [CrossRef] [PubMed]
- Hu, Z.; Deibert, B.J.; Li, J. Luminescent metal–organic frameworks for chemical sensing and explosive detection. Chem. Soc. Rev. 2014, 43, 5815–5840. [Google Scholar] [CrossRef] [PubMed] [Green Version]
- Lu, K.; Aung, T.; Guo, N.; Weichselbaum, R.; Lin, W. Nanoscale metal–organic frameworks for therapeutic, imaging, and sensing applications. Adv. Mater. 2018, 30, 1707634. [Google Scholar] [CrossRef]
- Cui, Y.; Yue, Y.; Qian, G.; Chen, B. Luminescent functional metal–organic frameworks. Chem. Rev. 2012, 112, 1126–1162. [Google Scholar] [CrossRef]
- Lee, J.; Farha, O.K.; Roberts, J.; Scheidt, K.A.; Nguyen, S.T.; Hupp, J.T. Metal–organic framework materials as catalysts. Chem. Soc. Rev. 2009, 38, 1450–1459. [Google Scholar] [CrossRef]
- Yoon, M.; Srirambalaji, R.; Kim, K. Homochiral metal–organic frameworks for asymmetric heterogeneous catalysis. Chem. Rev. 2012, 112, 1196–1231. [Google Scholar] [CrossRef]
- Wang, X.; Han, X.; Zhang, J.; Wu, X.; Liu, Y.; Cui, Y.J. Homochiral 2D porous covalent organic frameworks for heterogeneous asymmetric catalysis. Am. Chem. Soc. 2016, 138, 12332–12335. [Google Scholar] [CrossRef] [PubMed]
- Carmona, F.J.; Maldonado, C.R.; Ikemura, S.; Romão, C.C.; Huang, Z.; Xu, H.; Zou, X.; Kitagawa, S.; Furukawa, S.; Barea, E. Coordination Modulation Method To Prepare New Metal–Organic Framework-Based CO-Releasing Materials. ACS Appl. Mater. Interfaces 2018, 10, 31158–31167. [Google Scholar] [CrossRef] [PubMed]
- Roy, S.; Huang, Z.; Bhunia, A.; Castner, A.; Gupta, A.K.; Zou, X.; Ott, S.J. Electrocatalytic Hydrogen Evolution from a Cobaloxime-Based Metal–Organic Framework Thin Film. Am. Chem. Soc. 2019, 141, 15942–15950. [Google Scholar] [CrossRef] [PubMed] [Green Version]
- Doonan, C.; Riccò, R.; Liang, K.; Bradshaw, D.; Falcaro, P. Metal–organic frameworks at the biointerface: Synthetic strategies and applications. Acc. Chem. Res. 2017, 50, 1423–1432. [Google Scholar] [CrossRef] [PubMed] [Green Version]
- Groom, C.R.; Bruno, I.J.; Lightfoot, M.P.; Ward, S.C. The Cambridge structural database. Acta Crystallogr. Sect. B Struct. Sci. Cryst. Eng. Mater. 2016, 72, 171–179. [Google Scholar] [CrossRef] [PubMed]
- Kolb, U.; Gorelik, T.; Kübel, C.; Otten, M.T.; Hubert, D. Towards automated diffraction tomography: Part I—Data acquisition. Ultramicroscopy 2007, 107, 507–513. [Google Scholar] [CrossRef]
- Boullay, P.; Palatinus, L.; Barrier, N. Precession electron diffraction tomography for solving complex modulated structures: The case of Bi5Nb3O15. Inorg. Chem. 2013, 52, 6127–6135. [Google Scholar] [CrossRef]
- Zhang, D.; Oleynikov, P.; Hovmöller, S.; Zou, X.Z. Collecting 3D electron diffraction data by the rotation method. Für Krist. 2010, 225. [Google Scholar] [CrossRef]
- Wan, W.; Sun, J.; Su, J.; Hovmöller, S.; Zou, X.J. Three-dimensional rotation electron diffraction: Software RED for automated data collection and data processing. Appl. Crystallogr. 2013, 46, 1863–1873. [Google Scholar] [CrossRef] [Green Version]
- Gemmi, M.; Oleynikov, P.Z. Scanning reciprocal space for solving unknown structures: Energy filtered diffraction tomography and rotation diffraction tomography methods. Z. Krist.-Cryst. Mater. 2013, 228, 51–58. [Google Scholar] [CrossRef]
- Shi, D.; Nannenga, B.L.; Iadanza, M.G.; Gonen, T. Three-dimensional electron crystallography of protein microcrystals. eLife 2013, 2, e01345. [Google Scholar] [CrossRef]
- Nederlof, I.; van Genderen, E.; Li, Y.-W.; Abrahams, J.P. A Medipix quantum area detector allows rotation electron diffraction data collection from submicrometre three-dimensional protein crystals. Acta Crystallogr. D Biol. Crystallogr. 2013, 69, 1223–1230. [Google Scholar] [CrossRef] [Green Version]
- Nannenga, B.L.; Shi, D.; Leslie, A.G.W.; Gonen, T. High-resolution structure determination by continuous-rotation data collection in MicroED. Nat. Methods 2014, 11, 927–930. [Google Scholar] [CrossRef] [PubMed] [Green Version]
- Gemmi, M.; la Placa, M.G.I.; Galanis, A.S.; Rauch, E.F.; Nicolopoulos, S.J. Fast electron diffraction tomography. Appl. Crystallogr. 2015, 48, 718–727. [Google Scholar] [CrossRef]
- Cichocka, M.O.; Ångström, J.; Wang, B.; Zou, X.; Smeets, S.J. High-throughput continuous rotation electron diffraction data acquisition via software automation. Appl. Crystallogr. 2018, 51, 1652–1661. [Google Scholar] [CrossRef] [PubMed] [Green Version]
- Plana-Ruiz, S.; Krysiak, Y.; Portillo, J.; Alig, E.; Estradé, S.; Peiró, F.; Kolb, U. Fast-ADT: A fast and automated electron diffraction tomography setup for structure determination and refinement. Ultramicroscopy 2020, 211, 112951. [Google Scholar] [CrossRef] [PubMed]
- Gemmi, M.; Mugnaioli, E.; Gorelik, T.E.; Kolb, U.; Palatinus, L.; Boullay, P.; Hovmöller, S.; Abrahams, J.P. 3D electron diffraction: The nanocrystallography revolution. ACS Cent. Sci. 2019, 5, 1315–1329. [Google Scholar] [CrossRef] [Green Version]
- Huang, Z.; Grape, E.S.; Li, J.; Inge, A.K.; Zou, X. 3D electron diffraction as an important technique for structure elucidation of metal-organic frameworks and covalent organic frameworks. Coord. Chem. Rev. 2021, 427, 213583. [Google Scholar] [CrossRef]
- Huang, Z.; Willhammar, T.; Zou, X. Three-dimensional electron diffraction for porous crystalline materials: Structural determination and beyond. Chem. Sci. 2021, 12, 1206–1219. [Google Scholar] [CrossRef]
- Thomson, G.P.; Reid, A. Diffraction of cathode rays by a thin film. Nature 1927, 119, 890. [Google Scholar] [CrossRef]
- Vainshtein, B.K. Structure Analysis by Electron Diffraction; Pergamon Press: Oxford, NY, USA, 1964. [Google Scholar]
- Nicolopoulos, S.; Gonzalez-Calbet, J.M.; Vallet-Regi, M.; Corma, A.; Corell, C.; Guil, J.M.; Perez-Pariente, J.J. Direct phasing in electron crystallography: Ab initio determination of a new MCM-22 zeolite structure. Am. Chem. Soc. 1995, 117, 8947–8956. [Google Scholar] [CrossRef]
- Dorset, D.L. Electron crystallography–accomplishments and challenges. Acta Crystallogr. A 1998, 54, 750–757. [Google Scholar] [CrossRef]
- Weirich, T.E.; Zou, X.; Ramlau, R.; Simon, A.; Cascarano, G.L.; Giacovazzo, C.; Hovmöller, S. Structures of nanometre-size crystals determined from selected-area electron diffraction data. Acta Crystallogr. A 2000, 56, 29–35. [Google Scholar] [CrossRef] [PubMed]
- Wagner, P.; Terasaki, O.; Ritsch, S.; Nery, J.G.; Zones, S.I.; Davis, M.E.; Hiraga, K.J. Electron diffraction structure solution of a nanocrystalline zeolite at atomic resolution. Phys. Chem. B 1999, 103, 8245–8250. [Google Scholar] [CrossRef]
- Zou, X.; Hovmöller, S. Electron crystallography: Imaging and single-crystal diffraction from powders. Acta Crystallogr. A 2008, 64, 149–160. [Google Scholar] [CrossRef] [PubMed]
- Kolb, U.; Mugnaioli, E.; Gorelik, T.E. Automated electron diffraction tomography—A new tool for nano crystal structure analysis. Cryst. Res. Technol. 2011, 46, 542–554. [Google Scholar] [CrossRef]
- Palatinus, L.; Brázda, P.; Jelínek, M.; Hrdá, J.; Steciuk, G.; Klementová, M. Specifics of the data processing of precession electron diffraction tomography data and their implementation in the program PETS2.0. Acta Crystallogr. Sect. B Struct. Sci. Cryst. Eng. Mater. 2019, 75, 512–522. [Google Scholar] [CrossRef]
- Huang, Z.; Seo, S.; Shin, J.; Wang, B.; Bell, R.G.; Hong, S.B.; Zou, X. 3D-3D topotactic transformation in aluminophosphate molecular sieves and its implication in new zeolite structure generation. Nat. Commun. 2020, 11, 3762. [Google Scholar] [CrossRef]
- Yun, Y.; Wan, W.; Rabbani, F.; Su, J.; Xu, H.; Hovmöller, S.; Johnsson, M.; Zou, X.J. Phase identification and structure determination from multiphase crystalline powder samples by rotation electron diffraction. Appl. Crystallogr. 2014, 47, 2048–2054. [Google Scholar] [CrossRef]
- Denysenko, D.; Grzywa, M.; Tonigold, M.; Streppel, B.; Krkljus, I.; Hirscher, M.; Mugnaioli, E.; Kolb, U.; Hanss, J.; Volkmer, D. Elucidating Gating Effects for Hydrogen Sorption in MFU-4-Type Triazolate-Based Metal–Organic Frameworks Featuring Different Pore Sizes. Chem. Eur. J. 2011, 17, 1837–1848. [Google Scholar] [CrossRef]
- Yao, Q.; Gómez, A.B.; Su, J.; Pascanu, V.; Yun, Y.; Zheng, H.; Chen, H.; Liu, L.; Abdelhamid, H.N.; Martín-Matute, B.; et al. Series of highly stable isoreticular lanthanide metal–organic frameworks with expanding pore size and tunable luminescent properties. Chem. Mater. 2015, 27, 5332–5339. [Google Scholar] [CrossRef] [Green Version]
- Zhang, Q.; Su, J.; Feng, D.; Wei, Z.; Zou, X.; Zhou, H.-C. Piezofluorochromic metal–organic framework: A microscissor lift. J. Am. Chem. Soc. 2015, 137, 10064–10067. [Google Scholar] [CrossRef]
- Feng, D.; Liu, T.-F.; Su, J.; Bosch, M.; Wei, Z.; Wan, W.; Yuan, D.; Chen, Y.-P.; Wang, X.; Wang, K.; et al. Stable metal-organic frameworks containing single-molecule traps for enzyme encapsulation. Nat. Commun. 2015, 6, 5979. [Google Scholar] [CrossRef] [Green Version]
- Jiang, J.; Jorda, J.L.; Yu, J.; Baumes, L.A.; Mugnaioli, E.; Diaz-Cabanas, M.J.; Kolb, U.; Corma, A. Synthesis and structure determination of the hierarchical meso-microporous zeolite ITQ-43. Science 2011, 333, 1131–1134. [Google Scholar] [CrossRef] [PubMed]
- Smeets, S.; Wan, W.J. Serial electron crystallography: Merging diffraction data through rank aggregation. Appl. Crystallogr. 2017, 50, 885–892. [Google Scholar] [CrossRef]
- Simancas, J.; Simancas, R.; Bereciartua, P.J.; Jorda, J.L.; Rey, F.; Corma, A.; Nicolopoulos, S.; Das, P.P.; Gemmi, M.; Mugnaioli, E.J. Ultrafast electron diffraction tomography for structure determination of the new zeolite ITQ-58. Am. Chem. Soc. 2016, 138, 10116–10119. [Google Scholar] [CrossRef] [PubMed] [Green Version]
- Gemmi, M.; Lanza, A.E. 3D electron diffraction techniques. Acta Crystallogr. Sect. B Struct. Sci. Cryst. Eng. Mater. 2019, 75, 495–504. [Google Scholar] [CrossRef] [PubMed]
- Kabsch, W. Integration, scaling, space-group assignment and post-refinement. Acta Crystallogr. D Biol. Crystallogr. 2010, 66, 133–144. [Google Scholar] [CrossRef] [PubMed] [Green Version]
- Winter, G.; Waterman, D.G.; Parkhurst, J.M.; Brewster, A.S.; Gildea, R.J.; Gerstel, M.; Fuentes-Montero, L.; Vollmar, M.; Michels-Clark, T.; Young, I.D.; et al. DIALS: Implementation and evaluation of a new integration package. Acta Crystallogr. Sect. Struct. Biol. 2018, 74, 85–97. [Google Scholar] [CrossRef] [Green Version]
- Battye, T.G.G.; Kontogiannis, L.; Johnson, O.; Powell, H.R.; Leslie, A.G.W. iMOSFLM: A new graphical interface for diffraction-image processing with MOSFLM. Acta Crystallogr. D Biol. Crystallogr. 2011, 67, 271–281. [Google Scholar] [CrossRef] [PubMed] [Green Version]
- Sheldrick, G.M. A short history of SHELX. Acta Crystallogr. A 2008, 64, 112–122. [Google Scholar] [CrossRef] [Green Version]
- Sheldrick, G.M. Crystal structure refinement with SHELXL. Acta Crystallogr. Sect. Found. Adv. 2015, 71, 3–8. [Google Scholar] [CrossRef] [PubMed] [Green Version]
- Burla, M.C.; Caliandro, R.; Carrozzini, B.; Cascarano, G.L.; Cuocci, C.; Giacovazzo, C.; Mallamo, M.; Mazzone, A.; Polidori, G.J. Crystal structure determination and refinement via SIR2014. Appl. Crystallogr. 2015, 48, 306–309. [Google Scholar] [CrossRef]
- Petříček, V.; Dušek, M.; Palatinus, L.Z. Crystallographic computing system JANA2006: General features. Z. Krist.-Cryst. Mater. 2014, 229. [Google Scholar] [CrossRef]
- Gallagher-Jones, M.; Ophus, C.; Bustillo, K.C.; Boyer, D.R.; Panova, O.; Glynn, C.; Zee, C.-T.; Ciston, J.; Mancia, K.C.; Minor, A.M.; et al. Nanoscale mosaicity revealed in peptide microcrystals by scanning electron nanodiffraction. Commun. Biol. 2019, 2, 1–8. [Google Scholar]
- Bücker, R.; Hogan-Lamarre, P.; Mehrabi, P.; Schulz, E.C.; Bultema, L.A.; Gevorkov, Y.; Brehm, W.; Yefanov, O.; Oberthür, D.; Kassier, G.H.; et al. Serial protein crystallography in an electron microscope. Nat. Commun. 2020, 11, 996. [Google Scholar] [CrossRef] [PubMed] [Green Version]
- Wang, B.; Zou, X.; Smeets, S. Automated serial rotation electron diffraction combined with cluster analysis: An efficient multi-crystal workflow for structure determination. IUCrJ 2019, 6, 854–867. [Google Scholar] [CrossRef]
- Smolders, S.; Willhammar, T.; Krajnc, A.; Sentosun, K.; Wharmby, M.T.; Lomachenko, K.A.; Bals, S.; Mali, G.; Roeffaers, M.B.J.; De Vos, D.E.; et al. A Titanium (IV)-Based Metal–Organic Framework Featuring Defect-Rich Ti-O Sheets as an Oxidative Desulfurization Catalyst. Angew. Chem. 2019, 131, 9258–9263. [Google Scholar] [CrossRef]
- He, T.; Huang, Z.; Yuan, S.; Lv, X.-L.; Kong, X.-J.; Zou, X.; Zhou, H.-C.; Li, J.-R. Kinetically Controlled Reticular Assembly of a Chemically Stable Mesoporous Ni (II)-Pyrazolate Metal–Organic Framework. J. Am. Chem. Soc. 2020, 142, 13491–13499. [Google Scholar] [CrossRef]
- Dou, J.-H.; Arguilla, M.Q.; Luo, Y.; Li, J.; Zhang, W.; Sun, L.; Mancuso, J.L.; Yang, L.; Chen, T.; Parent, L.R.; et al. Atomically precise single-crystal structures of electrically conducting 2D metal–organic frameworks. Nat. Mater. 2020. [Google Scholar] [CrossRef]
- Feyand, M.; Mugnaioli, E.; Vermoortele, F.; Bueken, B.; Dieterich, J.M.; Reimer, T.; Kolb, U.; de Vos, D.; Stock, N. Automated Diffraction Tomography for the Structure Elucidation of Twinned, Sub-micrometer Crystals of a Highly Porous, Catalytically Active Bismuth Metal–Organic Framework. Angew. Chem. Int. Ed. 2012, 51, 10373–10376. [Google Scholar] [CrossRef]
- Wang, Y.; Takki, S.; Cheung, O.; Xu, H.; Wan, W.; Öhrström, L.; Inge, A.K. Elucidation of the elusive structure and formula of the active pharmaceutical ingredient bismuth subgallate by continuous rotation electron diffraction. Chem. Commun. 2017, 53, 7018–7021. [Google Scholar] [CrossRef] [Green Version]
- Hynek, J.; Brázda, P.; Rohlíček, J.; Londesborough, M.G.S.; Demel, J. Phosphinic acid based linkers: Building blocks in metal–organic framework chemistry. Angew. Chem. Int. Ed. 2018, 57, 5016–5019. [Google Scholar] [CrossRef]
- Portolés-Gil, N.; Lanza, A.; Aliaga-Alcalde, N.; Ayllón, J.A.; Gemmi, M.; Mugnaioli, E.; López-Periago, A.M.; Domingo, C. Crystalline Curcumin bioMOF Obtained by Precipitation in Supercritical CO2 and Structural Determination by Electron Diffraction Tomography. ACS Sustain. Chem. Eng. 2018, 6, 12309–12319. [Google Scholar] [CrossRef]
- Rhauderwiek, T.; Zhao, H.; Hirschle, P.; Döblinger, M.; Bueken, B.; Reinsch, H.; Vos, D.D.; Wuttke, S.; Kolb, U.; Stock, N. Highly stable and porous porphyrin-based zirconium and hafnium phosphonates–electron crystallography as an important tool for structure elucidation. Chem. Sci. 2018, 9, 5467–5478. [Google Scholar] [CrossRef] [PubMed] [Green Version]
- Yuan, S.; Qin, J.-S.; Xu, H.-Q.; Su, J.; Rossi, D.; Chen, Y.; Zhang, L.; Lollar, C.; Wang, Q.; Jiang, H.-L.; et al. [Ti8Zr2O12 (COO)16] cluster: An ideal inorganic building unit for photoactive metal–organic frameworks. ACS Cent. Sci. 2018, 4, 105–111. [Google Scholar] [CrossRef] [PubMed] [Green Version]
- Wang, B.; Rhauderwiek, T.; Inge, A.K.; Xu, H.; Yang, T.; Huang, Z.; Stock, N.; Zou, X. A Porous Cobalt Tetraphosphonate Metal–Organic Framework: Accurate Structure and Guest Molecule Location Determined by Continuous-Rotation Electron Diffraction. Chem. Eur. J. 2018, 24, 17429–17433. [Google Scholar] [CrossRef] [PubMed]
- Lenzen, D.; Zhao, J.; Ernst, S.-J.; Wahiduzzaman, M.; Inge, A.K.; Fröhlich, D.; Xu, H.; Bart, H.-J.; Janiak, C.; Henninger, S.; et al. A metal–organic framework for efficient water-based ultra-low-temperature-driven cooling. Nat. Commun. 2019, 10, 3025. [Google Scholar] [CrossRef] [PubMed]
- Leubner, S.; Zhao, H.; Van Velthoven, N.; Henrion, M.; Reinsch, H.; De Vos, D.E.; Kolb, U.; Stock, N. Expanding the Variety of Zirconium-based Inorganic Building Units for Metal–Organic Frameworks. Angew. Chem. 2019, 131, 11111–11116. [Google Scholar] [CrossRef]
- Grape, E.S.; Xu, H.; Cheung, O.; Calmels, M.; Zhao, J.; Dejoie, C.; Proserpio, D.M.; Zou, X.; Inge, A.K. Breathing metal–organic framework based on flexible inorganic building units. Cryst. Growth Des. 2020, 20, 320–329. [Google Scholar] [CrossRef]
- Rabe, T.; Pewe, H.; Reinsch, H.; Willhammar, T.; Grape, E.S.; Stock, N. Influence of the substitution pattern of four naphthalenedicarboxylic acids on the structures and properties of group 13 metal–organic frameworks and coordination polymers. Dalton Trans. 2020, 49, 4861–4868. [Google Scholar] [CrossRef]
- Rönfeldt, P.; Reinsch, H.; Grape, E.S.; Inge, A.K.; Terraschke, H.; Stock, N.Z. Water-based Synthesis and Properties of a Scandium 1,4-Naphthalenedicarboxylate. Für Anorg. Allg. Chem. 2020, 646, 1373–1379. [Google Scholar] [CrossRef] [Green Version]
- Noa, F.M.A.; Grape, E.S.; Brülls, S.M.; Cheung, O.; Malmberg, P.; Inge, A.K.; McKenzie, C.J.; Mårtensson, J.; Öhrström, L.J. Metal–Organic Frameworks with Hexakis(4-carboxyphenyl)benzene: Extensions to Reticular Chemistry and Introducing Foldable Nets. Am. Chem. Soc. 2020, 142, 9471–9481. [Google Scholar]
- Leubner, S.; Bengtsson, V.E.G.; Synnatschke, K.; Gosch, J.; Koch, A.; Reinsch, H.; Xu, H.; Backes, C.; Zou, X.; Stock, N.J. Synthesis and Exfoliation of a New Layered Mesoporous Zr-MOF Comprising Hexa-and Dodecanuclear Clusters as Well as a Small Organic Linker Molecule. Am. Chem. Soc. 2020, 142, 15995–16000. [Google Scholar] [CrossRef]
- Cichocka, M.O.; Liang, Z.; Feng, D.; Back, S.; Siahrostami, S.; Wang, X.; Samperisi, L.; Sun, Y.; Xu, H.; Hedin, N.; et al. A Porphyrinic Zirconium Metal–Organic Framework for Oxygen Reduction Reaction: Tailoring the Spacing between Active-Sites through Chain-Based Inorganic Building Units. J. Am. Chem. Soc. 2020, 142, 15386–15395. [Google Scholar] [CrossRef] [PubMed]
- Huang, Z.; Ge, M.; Carraro, F.; Doonan, C.; Falcaro, P.; Zou, X. Can 3D electron diffraction provide accurate atomic structures of metal–organic frameworks? Faraday Discuss. 2021, 225, 118–132. [Google Scholar] [CrossRef] [Green Version]
- Carraro, F.; Velásquez-Hernández, M.d.; Astria, E.; Liang, W.; Twight, L.; Parise, C.; Ge, M.; Huang, Z.; Ricco, R.; Zou, X.; et al. Phase dependent encapsulation and release profile of ZIF-based biocomposites. Chem. Sci. 2020, 11, 3397–3404. [Google Scholar] [CrossRef] [Green Version]
- Grape, E.S.; Flores, J.G.; Hidalgo, T.; Martínez-Ahumada, E.; Gutiérrez-Alejandre, A.; Hautier, A.; Williams, D.R.; O’Keeffe, M.; Öhrström, L.; Willhammar, T.; et al. A Robust and Biocompatible Bismuth Ellagate MOF Synthesized Under Green Ambient Conditions. J. Am. Chem. Soc. 2020, 142, 16795–16804. [Google Scholar] [CrossRef] [PubMed]
- Banihashemi, F.; Bu, G.; Thaker, A.; Williams, D.; Lin, J.Y.S.; Nannenga, B.L. Beam-sensitive metal-organic framework structure determination by microcrystal electron diffraction. Ultramicroscopy 2020, 216, 113048. [Google Scholar] [CrossRef] [PubMed]
- Basnayake, S.A.; Su, J.; Zou, X.; Balkus, K.J. Carbonate-based zeolitic imidazolate framework for highly selective CO2 capture. Inorg. Chem. 2015, 54, 1816–1821. [Google Scholar] [CrossRef]
Figure 1.
Illustration of (a) stepwise and (b) continuous rotation methods for three-dimensional electron diffraction (3DED) data collection. For stepwise rotation in (a), the crystal can be centered at each step. Fine steps are required in order to sample the reciprocal lattice and accurately estimate the intensities. For continuous rotation in (b), integrated intensities are obtained which are more accurate than stepwise rotation. Continuous rotation prefers detectors with a short readout time to avoid missing data during the detector readout.

Figure 2.
Crystal structures of SUMOF-7I (a), SUMOF-7II (b), SUMOF-7III (c), and SUMOF-7IV (d). The diameters of the corresponding pore apertures are 8.4, 11.3, 16.3, and 23.9 Å, respectively (taking into account the van der Waals radii of the atoms) [60]. Reproduced from ref. [60] with permission from the American Chemical Society, copyright 2015.

Figure 3.
(a) Reconstructed 3D reciprocal lattice from cRED data of a nano-sized single-crystal (inset) of CAU-23. (b) The repetition of cis and trans corner-sharing AlO6 polyhedra forming the inorganic building unit of CAU-23. (c) The 3D structure of CAU-23 projected along [010]; water molecules are omitted for clarity [87]. Reproduced from ref. [87] with permission from the Springer Nature, copyright 2019.

Figure 4.
Reconstructed 3D reciprocal lattice of (a) PCN-415 and (b) PCN-416 from cRED data. Insets are the crystals from which the RED data were collected. (c) and (d) Structure of PCN-415 and PCN-416 built from [Ti8Zr2O12(RCOO)16] clusters and different carboxylate linkers [85]. Reproduced from ref. [85] with permission from the American Chemical Society, copyright 2018.

Figure 5.
Inorganic building units (IBUs) of CAU-45 and interconnection to a layered motive via 5-acetamidoisophthalate ions. (A) Hexanuclear clusters. (B) Dodecanuclear clusters. Zirconium−oxygen clusters: blue; linker carbon: black; acetate carbon: pink; oxygen: red; nitrogen: dark blue; hydrogen: not displayed [93]. Reproduced from ref. [93] with permission from the American Chemical Society, copyright 2020.

Figure 6.
Structure of Co-CAU-36. (a) The details of the structure showing possible H bonds between the DABCO molecule and the phosphonate group on the porphyrin. (b) The 1D CoO4-PO4 tetrahedral chain along the c-axis. (c) The structure of Co-CAU-36 viewed along the c-axis. (d) The ball filling model of the structure with the guest molecules shows the pore diameter of 9 Å. Reproduced from ref. [86] with permission from the John Wiley & Sons, Inc., copyright 2018.

Figure 7.
Comparison between the structural model of BSA@ZIF-C refined from cRED data and that of ZIF-CO3-1 from SCXRD data [95]. (a) The structures are stacked together, viewed along the c-axis. (b) An enlarged figure shows the connection of a mIM linker to Zn(II) cations, illustrating the accuracy of the model obtained from the cRED data. Blue spheres: N; red spheres: O; gray spheres: C; cyan spheres: Zn atoms. Reproduced from ref. [95] with permission from the Royal Society of Chemistry, copyright 2021.


Table 1.
List of selected metal-organic framework (MOF) structures determined using 3DED.
| MOF Name | 3DED Protocol | Resolution (Å) | Year of Publication | Reference |
|---|---|---|---|---|
| Low Resolution (≥1.3 Å) | ||||
| MFU-4l | ADT | 1.3 | 2011 | [59] |
| SUMOF-7III(La) | RED | 3.57 | 2015 | [60] |
| MIL-103 | RED | 1.82 | 2015 | [60] |
| PCN-128W | RED | 1.4 | 2015 | [61] |
| PCN-333(Al) | RED | 5.0 | 2015 | [62] |
| COK-47L | cRED | 1.35 | 2019 | [77] |
| BUT-33 | cRED | 1.5 | 2020 | [78] |
| Cu3HHTT2 | cRED | 1.5 | 2020 | [79] |
| High Resolution (<1.3 Å) | ||||
| CAU-7 | ADT | 1.15 | 2012 | [80] |
| SUMOF-7I(La) | RED | 1.05 | 2015 | [60] |
| SUMOF-7II(La) | RED | 1.23 | 2015 | [60] |
| Bismuth subgallate | cRED | 0.7 | 2017 | [81] |
| ICR-2 | EDT | 1.0 | 2018 | [82] |
| sc-CCMOF-1 | EDT | 1.0 | 2018 | [83] |
| Zr-CAU-30 | ADT | 1.0 | 2018 | [84] |
| PCN-415 | cRED | 0.75 | 2018 | [85] |
| PCN-416 | cRED | 1.05 | 2018 | [85] |
| Co-CAU-36 | cRED | 0.83 | 2018 | [86] |
| CAU-23 | cRED | 1.13 | 2019 | [87] |
| CAU-26 | ADT | 1.3 | 2019 | [88] |
| CAU-27-BDC | ADT | 1.0 | 2019 | [88] |
| SU-100 | cRED | 1.0 | 2020 | [89] |
| SU-100-HT | cRED | 0.8 | 2020 | [89] |
| Ga(OH)(1,4-ndc) | cRED | 0.8 | 2020 | [90] |
| Sc2(1,4-NDC)3 | cRED | 0.8 | 2020 | [91] |
| Zn-MOF-888 | cRED | 1.1 | 2020 | [92] |
| CTH-11 | cRED | 1.1 | 2020 | [92] |
| CAU-45 | cRED | 0.8 | 2020 | [93] |
| PCN-226 | cRED | 1.15 | 2020 | [94] |
| ZIF-CO3-1 | cRED | 1.0 | 2020 | [95,96] |
| SU-101 | cRED | 0.8 | 2020 | [97] |
| ZIF-8 | MicroED | 0.87 | 2020 | [98] |
Publisher’s Note: MDPI stays neutral with regard to jurisdictional claims in published maps and institutional affiliations. |
© 2021 by the authors. Licensee MDPI, Basel, Switzerland. This article is an open access article distributed under the terms and conditions of the Creative Commons Attribution (CC BY) license (http://creativecommons.org/licenses/by/4.0/).
Share and Cite
MDPI and ACS Style
Ge, M.; Zou, X.; Huang, Z. Three-Dimensional Electron Diffraction for Structural Analysis of Beam-Sensitive Metal-Organic Frameworks. Crystals 2021, 11, 263. https://0-doi-org.brum.beds.ac.uk/10.3390/cryst11030263
AMA Style
Ge M, Zou X, Huang Z. Three-Dimensional Electron Diffraction for Structural Analysis of Beam-Sensitive Metal-Organic Frameworks. Crystals. 2021; 11(3):263. https://0-doi-org.brum.beds.ac.uk/10.3390/cryst11030263
Chicago/Turabian StyleGe, Meng, Xiaodong Zou, and Zhehao Huang. 2021. "Three-Dimensional Electron Diffraction for Structural Analysis of Beam-Sensitive Metal-Organic Frameworks" Crystals 11, no. 3: 263. https://0-doi-org.brum.beds.ac.uk/10.3390/cryst11030263
Note that from the first issue of 2016, this journal uses article numbers instead of page numbers. See further details here.