Article

Electro-Optic Control of Lithium Niobate Bulk Whispering Gallery Resonators: Analysis of the Distribution of Externally Applied Electric Fields

1
Laboratory for Optical Systems, Department for Microsystems Engineering—IMTEK, University of Freiburg, Georges-Köhler-Allee 102, 79110 Freiburg, Germany
2
Gisela and Erwin Sick Chair of Micro-Optics, Department for Microsystems Engineering—IMTEK, University of Freiburg, Georges-Köhler-Allee 102, 79110 Freiburg, Germany
3
Fraunhofer Institute for Physical Measurement Techniques IPM, Georges-Köhler-Allee 301, 79110 Freiburg, Germany
*
Author to whom correspondence should be addressed.
Submission received: 26 February 2021 / Revised: 12 March 2021 / Accepted: 14 March 2021 / Published: 17 March 2021
(This article belongs to the Special Issue New Trends in Lithium Niobate: From Bulk to Nanocrystals)

Abstract

:
Whispering gallery resonators made out of lithium niobate allow for optical parametric oscillation and frequency comb generation employing the outstanding second-order nonlinear-optical properties of this material. An important knob to tune and control these processes is, e.g., the linear electro-optic effect, the Pockels effect via externally applied electric fields. Due to the shape of the resonators a precise prediction of the electric field strength that affects the optical mode is non-trivial. Here, we study the average strength of the electric field in z-direction in the region of the optical mode for different configurations and geometries of lithium niobate whispering gallery resonators with the help of the finite element method. We find that in some configurations almost 100% is present in the cavity compared to the ideal case of a cylindrical resonator. Even in the case of a few-mode resonator with a very thin rim we find a strength of 90%. Our results give useful design considerations for future arrangements that may benefit from the strong electro-optic effect in bulk whispering gallery resonators made out of lithium niobate.

1. Introduction

Non-centrosymmetric materials offer second-order non-linearities that allow for, e.g., second harmonic generation, optical parametric oscillation and difference frequency generation. Furthermore, such materials bear the linear electro-optic effect, the so-called Pockels effect and the piezo-electric effect [1]. Due to this, non-centrosymmetric materials are the centerpiece of many setups for optical frequency conversion, e.g., for optical parametric oscillators for mid-infrared spectroscopy and frequency comb conversion into the molecular footprint region [2,3], as a single photon source for quantum imaging [4] and infrared spectroscopy [5], to generate terahertz radiation [6] and to generate tunable continuous wave light in the visible spectrum [7]. One of the most prominent non-centrosymmetric materials is lithium niobate. Due to high second-order nonlinear-optical coefficients, high transparency in the visible and infrared optical wavelengths and large Pockels coefficients lithium niobate is an excellently suited optical material.
In the last two decades whispering gallery resonators (WGRs) have developed to a well established and powerful platform employing non-centrosymmetric materials for frequency conversion. The WGRs are monolithic resonators with spheroidal geometry manufactured from the bulk material or chip-integrated on wafers. They provide a high quality factor making them particularly interesting for non-linear optical applications. Moreover the mirror-less, monolithic devices reduce the footprint drastically compared with other resonator design schemes. The remarkable features of this platform are demonstrated in many experiments such as frequency comb generation based on third-order [8,9], and second-order optical non-linearity [10,11], electro-optically generated combs [12,13], optical parametric oscillation, second harmonic generation [14] and as a platform for quantum optics [15]. All applications can benefit from the Pockels effect. In the simplest case, the resonance frequency of the WGR can be stabilized to the pump laser frequency. In Figure 1a we illustrate a typical setup used in experiments recently that involve the linear electro-optic effect in bulk WGRs, e.g., electro-optic combs [13], second-order-non-linearity-based frequency combs [10], efficient microwave-to-optical photon conversion [16] and adiabatic frequency conversion [17]. The main principle can be summarized as follows: By generating an electric field in the resonator, the refractive index is changed and hence the resonance frequency due to the Pockels effect according to [18]:
Δ ν 0 = n 2 2 ν 0 r i E z
there n is the refractive index, ν 0 the WGR resonance frequency, E z the electric field and r i the electro-optic coefficient. This way, for example, the second harmonic generation light can be maximized [19]. Furthermore, the frequency comb threshold via second harmonic generation can be minimized [20]. For the Pockels-effect-based adiabatic frequency conversion the resonance frequency is changed with a voltage pulse faster than the photon life time. This allows to generate frequency shifts of several GHz within nanoseconds [17]. Also an electro-optically tunable higher-order optical filter made out of lithium niobate WGRs has made use of the linear electro-optic effect [18]. Knowledge of the electric field strength at the position of the light field and its homogeneity are needed to be able to compare the experimental data and theoretical predictions [15]. In the case of a cylindrical WGR, as illustrated in Figure 1b, estimating the electric field strength E z would be simple. According to the plate capacitor formula, we obtain
E 0 = U Δ z
with the thickness Δ z and the electric potential difference U. A straight sidewall would lead to an optical mode extended in z-direction up to the electrodes of the resonators, which would cause a damping of the light field. A WGR possesses a spheroidal geometry as shown in Figure 1. This makes the prediction of the electric field at the location of the optical mode non-trivial. The optical mode is not located between the electrodes of the resonator, the light traveling around the rim experiences in general a weaker externally generated electric field E z < E 0 . Furthermore, the electric field can become inhomogeneous through the cross section of the mode.
The aim of our work is to analyze the electric field strength E z in the area of the optical mode and its homogeneity. The strength of E z addresses the two commonly used Pockels-coefficients of LN, r 31 and r 33 [17,19,20]. They change the refractive index for light polarized perpendicularly to and parallel to the symmetry axis for z-cut lithium niobate. Furthermore, due to symmetry properties of lithium niobate this orientation is the best suited for most applications in bulk WGRs. We analyze the electric field distribution in two common mm-sized WGR configurations, for conventional geometries as well as the so called few- or single mode geometry [21,22] made out of z-cut bulk lithium niobate. By introducing a small bulge, single mode operation in bulk WGRs is possible [21,22]. Furthermore we analyze the effect of introducing a distance between the rim of the resonator and the beginning of the electrode to prevent electric breakdowns in air when applying high voltages to the electrodes of the resonator. Additionally, we consider two different dielectric constants, for the unclamped ϵ UC and for the clamped ϵ C case. In the experiments mentioned before different frequencies of the external electric fields were used. For external electric fields with a frequency well below 1 MHz we assume the unclamped case with ϵ U C . But for example in the Pockels-based adiabatic frequency conversion frequencies of the external electric field are significantly higher, and the resonator is effectively clamped, partially or fully making ϵ C applicable in the latter case. Due to this we simulate with ϵ C . Although the dielectric constant for the unclamped and clamped case in z-direction is ϵ 33 30 , the radial component ϵ 11 changes from 84 to 43. This will influence the electric field strength at the optical mode.

2. Materials and Methods

The simulations in this paper were performed using the finite element method [23]. We used the commercially available software COMSOL Multiphysics to calculate the external electric field and the spatial distribution of the optical mode. Since the WGRs show rotation symmetry with respect to the z-axis we can reduce the computational effort drastically by solving the problem in a 2D section. As illustrated in Figure 2 both geometries considered in this work include a lithium niobate WGR coated at the +z-side and −z-side with metal electrodes to allow the application of an external electrical field. The WGR is surrounded by air. For the permittivity of lithium niobate we consider two different cases. The unclamped case with ϵ UC with a radial component ϵ 11 UC = 84 and for the z-axis direction ϵ 33 UC = 30 . For the clamped case ϵ 11 C = 43 and ϵ 33 C = 29.6 [24]. We furthermore assume that no space charge fields are present in the crystals. One needs to be aware that all lithium niobate crystals exhibit some photo-refractive sensitivity that stems from light induced space charge fields. Thus for intense and blue/ultraviolet light space charges may modify the electric fields in the regions of the optical modes, most likely reducing the fields because of the generated photoconductivity.
We perform calculations using two different types of geometries. The first one is shown in Figure 2a and very typical [11,16,17,20]. Here most resonators are mm-sized and have a thickness of a few hundred micrometers. For a lithium niobate WGR which should couple extraordinarily polarized light of a wavelength of λ = 1 µm via a rutile prism, a ratio of the major radius R 1 and the minor radius R 2 of R 2 / R 1 0.4 is a good choice for a sufficient coupling efficiency [25]. For the simulations shown in Section 3.1 using this ratio, we vary the thickness between a minimum of 50   μ m and a maximum of Δ z = 2 × R 2 for major radii of R 1 = 100 , 500 and 1000   μ m . In case of Δ z = 2 × R 2 we obtain a semicircular bulge. Furthermore we investigate the effect of a gap between the resonator rim and the beginning of the electrode. To this end we introduce a distance Δ d between the rim of the resonator and the beginning of the electrode for a WGR with Δ z = 500   μ m and R 1 = 1000   μ m as is illustrated in Figure 2a. We define the rim as the spatial position where the curvature begins. This investigation we consider to be important for two different reasons: (1) Lithium niobate can withstand very high electric field strengths of up to 65 kV mm−1 [26]. However, air has a breakdown voltage of 3 kV mm−1 only, which limits the maximum voltage that can be applied to the resonator [27]. The shortest path between the electrodes through the air can be enlarged and hence the maximum voltage until an electric breakdown occurs. Furthermore, insulators can be applied to further increase the breakdown voltage. However, smaller electrodes reduce the field at the rim for a given voltage and it is open which effect will win. (2) This gap can also stem from the fabrication process of the WGR. During the shaping and polishing of the resonator the electrode can be partially removed. By introducing the gap Δ d we want to account for this, by either applying a gap just to the top electrode , in the following referred to as asymmetric case or to both electrodes, referred to as symmetric case in the following. Since the bulk WGRs are typically mounted on a post and therefore one side is protected, we consider the asymmetric case for a damage of the electrode during the fabrication process. The symmetric case is considered when applying an isolation layer on both electrodes.
Another investigated geometry is that of few-mode WGRs. As shown in Figure 2b, this is characterized by a small convex bulge at the equator of the resonator. The major radius R 1 of the resonator is always kept at 1 mm. The shape of the small bulge is characterized by two parameters. The first, r s , describes the radius of the circle, and Δ r , which characterizes the distance of the bulge from the straight part of the resonator. We keep the radius r s = 5   μ m constant, while the distance Δ r is varied. We simulate for thicknesses of Δ z = 500   μ m and Δ z = 50   μ m . In our model we approximate the shape of the bulge with a semicircle. In order to provide a smooth transition between semicircular bulge and the bulk material, the shape of the bulge is approximated by a cubic Bézier curve. The formula with weights can be found in the Appendix A.
The following simulation and analysis procedure is performed: For each geometrical configuration we perform an eigenfrequency analysis to compute the intensity distribution of the fundamental mode. In a second step we compute the electric field distribution for a voltage of U = 1   V applied to the electrodes. This is done by solving the electrostatic Maxwell equations. Finally, we determine for each geometry the average strength of the external electric field and the distribution in the area of the optical mode where the intensity is larger than 10% of the maximum intensity of the mode. We always use a wavelength λ = 1   μ m and the refractive index n of 2.16 [28]. In the simulation we use a free triangular mesh with a locally dense meshing. Inside the WGR the maximum element size is set to 4   μ m . This value decreases towards the position of the optical mode. Here, the maximum size is set to λ / 10 , i.e., to 100   n m .

3. Results

The results section is divided in two parts: The first part is dealing with the simulation in the conventional resonator geometry with different ratios of the thicknesses Δ z and the major radii R 1 . Additionally we discuss the influence of a gap Δ d between the rim of the resonator and the electrode. In the second part we discuss few-mode resonators for different Δ r and Δ z .

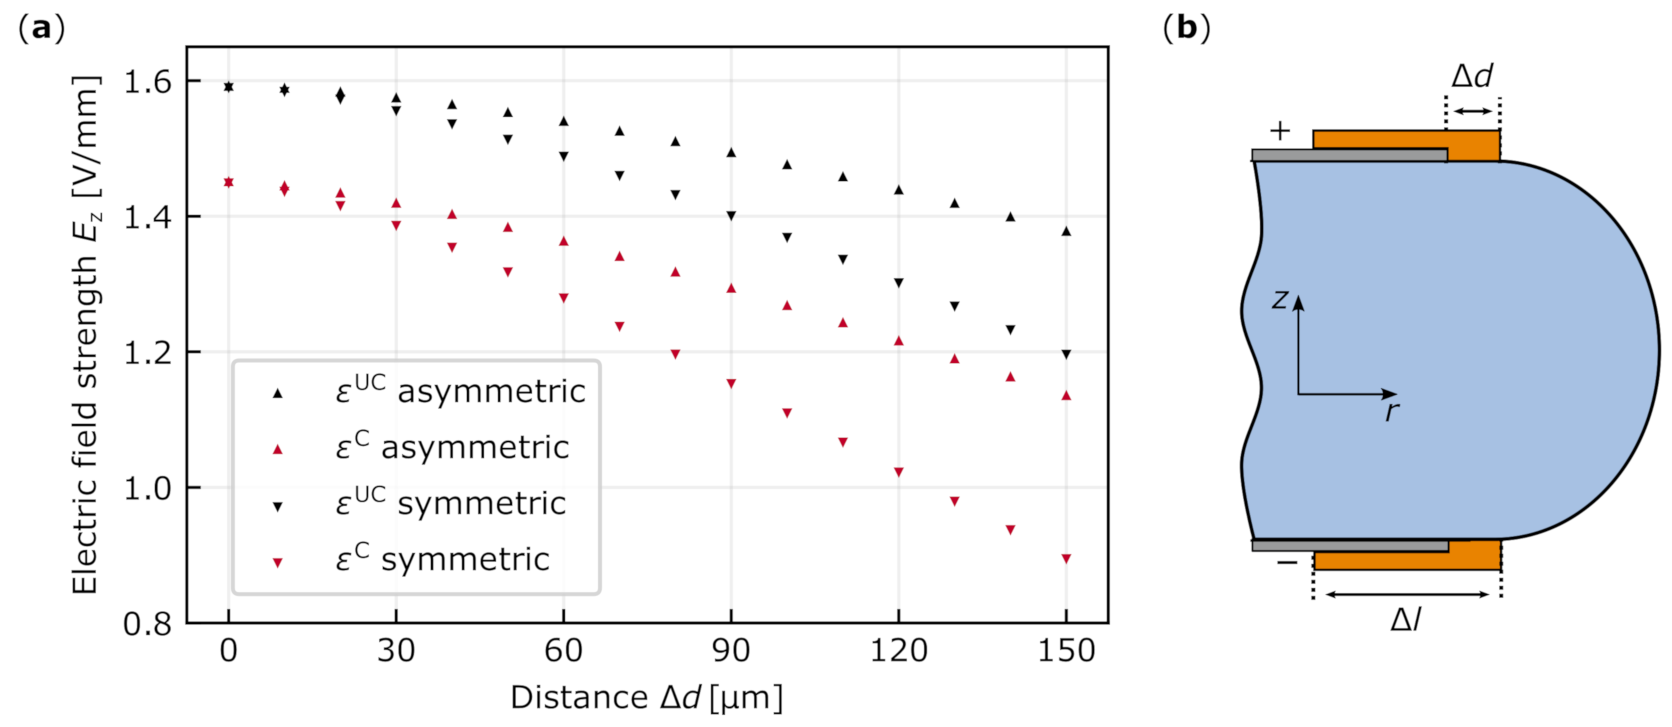
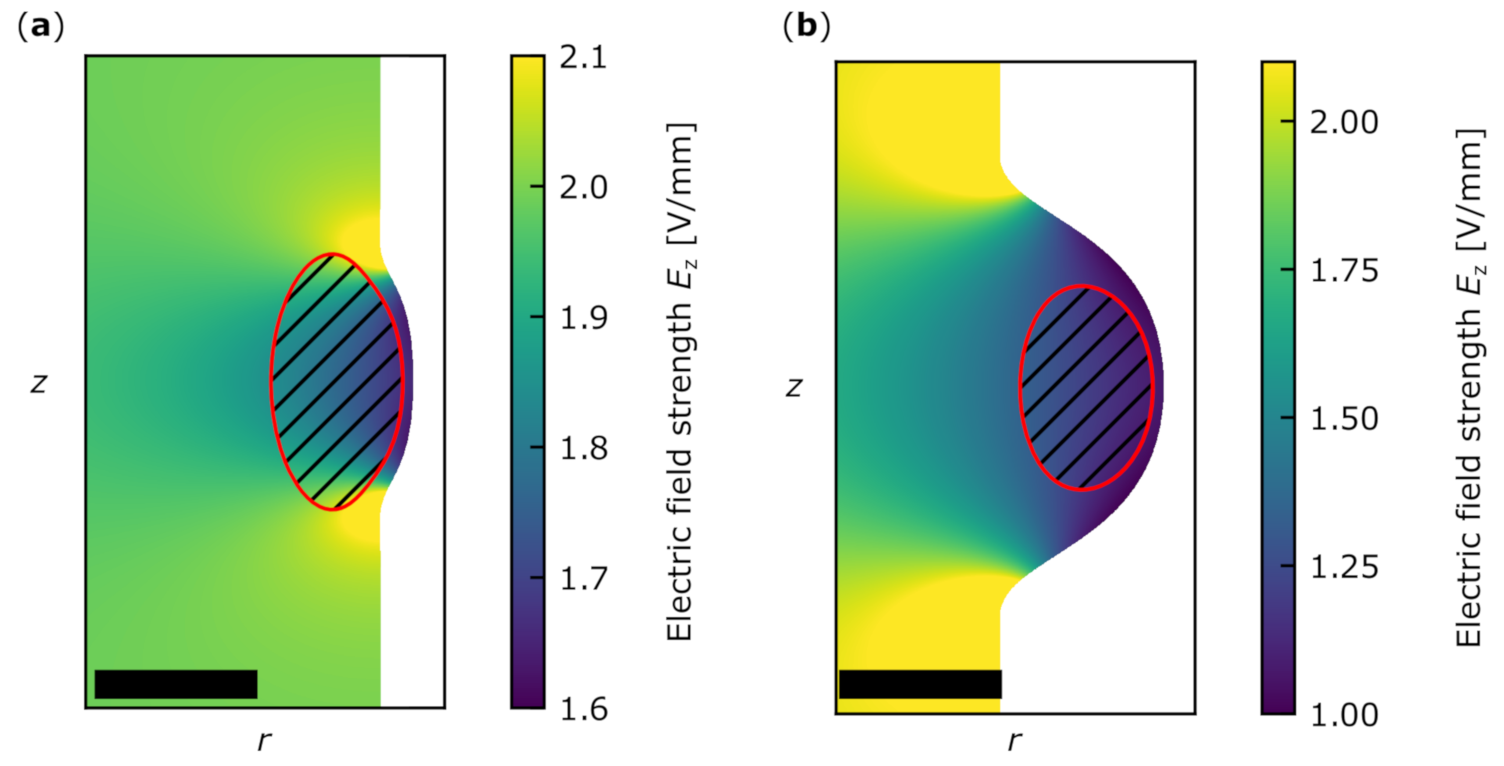
3.1. Conventional Resonator Geometry

In Figure 3 the electric field distribution in z-direction for two exemplary thicknesses Δ z = 500   μ m and Δ z = 50   μ m for R 1 = 1000   μ m is shown. In both cases the permittivity is assumed to be ϵ C . This results in a ratio of Δ z / R 1 = 0.5 in the first and Δ z / R 1 = 0.05 in the second example.
Comparing the field strengths in Figure 3a,b we obtain the expected behavior, that with decreasing thickness and a constant voltage applied to the electrodes, the electric field increases. Since the ratio R 2 / R 1 is constant, the horizontal distance between the electrode and the position of the optical mode decreases, while the size of the mode is constant for a given R 1 . This gives an additional gain in the effective electric field strength. In Figure 4a the average value of E z is shown for the investigated thicknesses between Δ z = 800   μ m and Δ z = 50   μ m of a WGR with R 1 = 1000   μ m in the unclamped case. Furthermore, in Figure 4b we compare our electric field strength determined for the unclamped and clamped cases with the field strength of a respective plate capacitor for different ratios Δ z / R 1 and for radii of R 1 = 100 , 500 and 1000   μ m .
For the resonator with Δ z / R 1 = 0.5 we obtain an electric field strength of 79.5% (72.5%) of the strength a plate capacitor of similar thickness would have. With decreasing thickness the mismatch becomes less, ending up with a strength of 98% (97%) of the case of a respective plate capacitor for Δ z / R 1 = 0.05 . The values within brackets represent the clamped case. To quantify the homogeneity of the external applied electric field we calculate the maximum values of the external electric field E z , max and the minimum values E z , min in the considered area of the optical mode. Then we derive Δ E z / E z = ( E z , max E z , min ) / E z . It is as small as 2% for all investigated thicknesses in case of the fundamental optical mode.
In the next set of simulations we determine the average strength of E z for the variation of the distance Δ d as indicated in Figure 2 for a standard 500-µm-thick resonator. The results are shown in Figure 5a. For each Δ d we calculate E z for both dielectric tensor values for lithium niobate.
We investigate the symmetric case, where the electrodes on the top and bottom move both the same way, as well as the asymmetric case, where only the top electrode changes its distance from the rim. In all cases the strength of E z decreases nearly linearly after Δ d = 30   μ m . Our measure for the field inhomogeneities Δ E z / E z stays below 2% across the area of the fundamental mode even for increasing values of distance Δ d . To estimate the possible gain in the breakdown voltage we calculate the shortest distance of the electrodes for this configuration through the air, assuming this to be the relevant distance. For an electrode reaching the rim we obtain an arc length of 0.54   m m . A straightforward way of increasing this distance and thus reducing the risk of a breakdown in air would be to apply isolating layers with a very high dielectric strength in the gaps Δ d and on top of both electrodes as shown in Figure 5b. As an example, we assume a Δ l = 300   μ m long layer on both sides. Hence the relevant distance between the electrodes doubles. Assuming that Δ d = 20   μ m is needed to apply the isolation layer sufficiently, we obtain a decrease in the electric field strength assuming ϵ UC of 1% only. In order to be able to contact the resonator the isolation layer cannot cover the whole electrode.

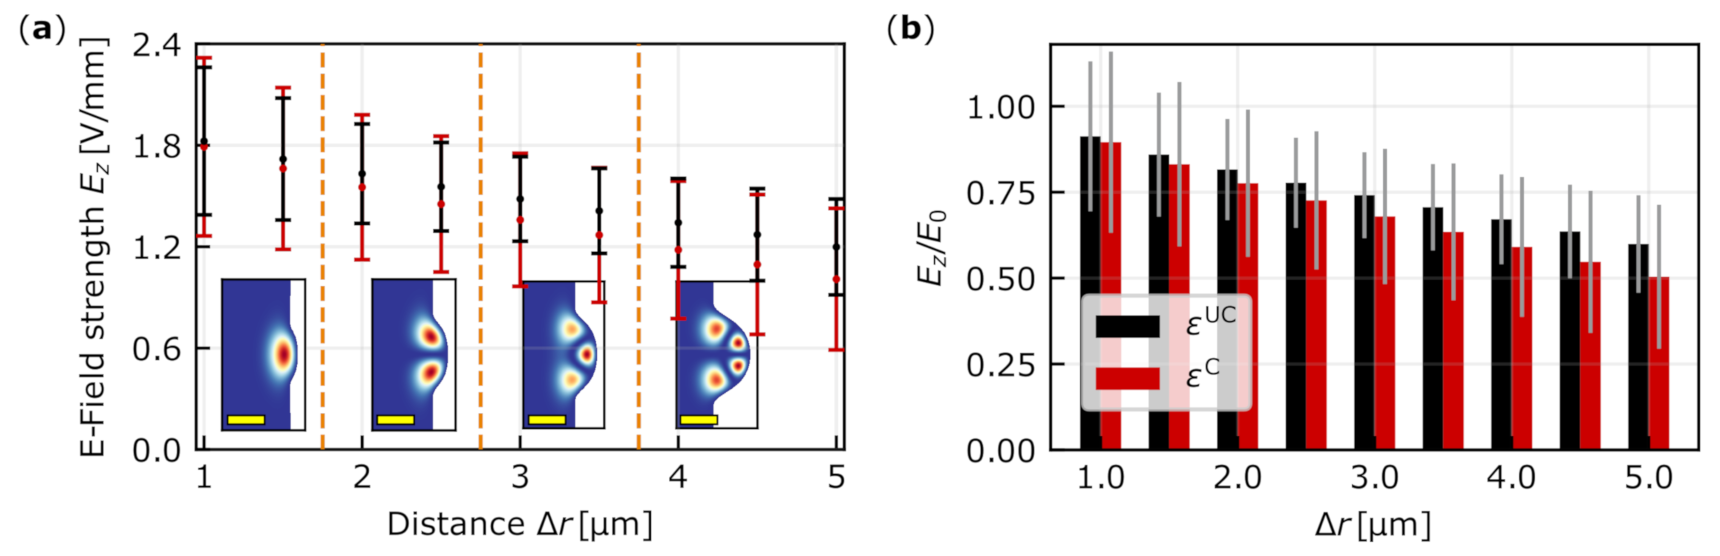
3.2. Few-Mode Resonator

Two examples for the obtained strength distributions of the electric field E z for the few-mode geometry are displayed in Figure 6 for a resonator with R 1 = 1000   μ m and Δ z = 500   μ m . For Δ r = 1   μ m the optical mode is almost completely located in the part of the resonator which is between the electrodes, while for Δ r = 5   μ m the optical mode is located in the bulge outside the electrodes. The change of the mean electric field strength E z in the area of the optical mode with increasing Δ r from 1 to 5   μ m is shown in Figure 7. Additionally, the number of the obtained transversal modes for each configuration is displayed. The size of the error bar is given as Δ E z = E z , max E z , min , with the minimum values of the external applied electric field E z , min and the maximum value E z , max in the considered area of the optical mode. For Δ r = 0 and 0.5   μ m no solution for the optical mode could be found in our simulation. For each Δ r we calculated E z for both dielectric constants. In Figure 7b we compare both E z to the respective field strength E 0 of a plate capacitor with the same thickness. The highest values for 91.2% (90%) are obtained for Δ r = 1   μ m . The value in the brackets represents the determined strength for ϵ C . At Δ r = 5   μ m we determine for ϵ UC a relative strength of E z / E 0 = 60 % which is 9.5% larger than that for ϵ C . The relative electric field inhomogeneity Δ E z / E z across the area of the fundamental mode for Δ r = 5   μ m assuming ϵ UC is determined to be 24% and for ϵ C 41% of average value. When the thickness of the resonator is reduced to Δ z = 50   μ m , the relative strength E z / E 0 changes in the sub-percent level compared to the WGR with Δ z = 500   μ m . Also the field homogeneity does not change significantly.

4. Discussion

For the conventional WGR geometry the performed simulations validate that with decreasing thickness the electric field strength is increasing. This is so far the expected behavior considering a simple plate capacitor model. Depending on the dielectric constant used, E z develops differently. For the unclamped case, ϵ UC is twice as large in the radial component as ϵ C and the E-field lines are thus more strongly drawn into the bulge providing a larger field strength and higher homogeneity of the field. For example for a WGR with Δ z / R 1 = 0.5 the deviation from the respective electric field strength of a plate capacitor between both WGRs is just 7%. This difference decreases to 0.7% at Δ z / R 1 = 0.05 . The homogeneity of E z considering the difference between the minimum and the maximum value is less than 2% for each Δ z / R 1 constant. We investigated for three different radii different ratios of Δ z / R 1 as long as the minimal dimensions of Δ z = 50   μ m and R 1 = 100   μ m are not violated. Due to the characteristics of the electric field we can use this ratio to determine the behavior of the electric field E z for typical dimensions of bulk WGRs made out of lithium niobate.
For a WGR with R 1 = 1000   μ m and Δ z = 500   μ m and with a gap Δ d we determine a reduction of the average electric field strength E z of less than 2%, if Δ d is less than 30   μ m in the asymmetric case and 20   μ m in the symmetric case. Also here for the unclamped case the reduction is lower compared to the clamped case. The relative inhomogeneity of the electric field Δ E z / E z is for all investigated cases less than 2%. These findings confirm that small damages of the electrode during the fabrication process have only minor impact on E z . We find that it is possible to increase the effective distance between the electrodes and thus increase the voltage at which the electrical breakdown in air takes place significantly by applying an isolation layer with only a minor decrease of the effective electric field E z at the cross section of the optical mode.
For the few-mode resonator the difference between the electric field strength E z for the clamped and unclamped dielectric tensor is larger compared with that for the conventional geometry. For this micrometer-sized bulge the effect of a twice as large radial component of ϵ UC compared with ϵ C comes obviously more into play as our results show. The larger Δ r , the greater the difference between both values is. For Δ r = 5   μ m the difference between both strengths of the dielectric tensors is 9.4%. Also the relative field inhomogeneity Δ E z / E z is larger compared to that of the conventional WGR geometry and varies between 17% and 23% for ϵ UC and from 28% up to 42% for ϵ C . The present study has only investigated the dielectric constants for the unclamped and clamped cases. Depending on the frequency that is used for the external electric field, one might excite resonances. For lithium niobate we expect these resonances for frequencies of some MHz [29]. Here the values for the dielectric constant might differ drastically. So far we discussed only the fundamental optical mode. Higher-order modes in conventional resonators will have a reduced homogeneity since they are spatially more expanded compared to the fundamental optical mode. However, the next higher order of transversal modes does not obtain significant deviation from the respective values of the fundamental mode with respect to strength and homogeneity. Applying an external electric field to a lithium niobate WGR due to the piezoelectric effect the resonance frequency is changed as well. However, this contribution is more than one order of magnitude lower than the frequency shift induced by the Pockels effect and can be neglected in most cases [17,19,20].

5. Conclusions

To conclude: For all geometries used most of the expected electrical field is indeed present in the region where the light circulates. However, for small rims and overlaying rims just half of the field expected from the plate capacitor formula reaches the relevant region. The inhomogeneity of the electric field distribution is in most cases excellent amounting to just 2% or less, again except for small and overlaying rims where several 10% of inhomogeneity might be present. The cases of the clamped versus the free resonators for quickly/slowly varying external applied electric fields yield differences of the order of 10% or more for the fields achieved. The simulations provide relevant information how to optimally design the resonators for Pockels tuning and to compare more precisely experimental data with theoretical expectations.

Author Contributions

Formal analysis, Y.M.; writing—review and editing, Y.M., I.B., H.Z. and K.B.; supervision, I.B., H.Z. and K.B. All authors have read and agreed to the published version of the manuscript.

Funding

This research received no external funding.

Institutional Review Board Statement

Not applicable.

Informed Consent Statement

Not applicable.

Data Availability Statement

The data presented in this study are available on request from the corresponding author.

Acknowledgments

Y.M. gratefully acknowledges financial support from the Gisela und Erwin Sick Stiftung. The authors thank Jan Szabados for helpful discussions.

Conflicts of Interest

The authors declare no conflict of interest.

Abbreviations

The following abbreviation are used in this manuscript:
Whispering gallery resonatorWGR

Appendix A. Bézier Curve

We used the following cubic Bézier curve to model the small bulge symmetrically around the center z = 0 :
b ( t ) = i = 0 3 b i w i B i 3 ( t ) i = 0 3 w i B i 3 ( t ) , t [ 0 , 1 ] .
B i p ( t ) are Bernstein basis function, with control points in the 2D euclidean space r z , b 0 = R 1 Δ r r s 2 ( r s Δ r ) 2 2 , b 1 = R 1 Δ r r s 2 ( r s Δ r ) 2 , b 2 = R 1 r s 2 ( r s Δ r ) 2 , b 3 = R 1 0 , all weight w i = 1 .

References

  1. Boyd, R.W. Nonlinear Optics, 3rd ed.; Academic Press: Burlington, MA, USA, 2008. [Google Scholar]
  2. Schliesser, A.; Picqué, N.; Hänsch, T.W. Mid-infrared frequency combs. Nat. Photonics 2012, 6, 440–449. [Google Scholar] [CrossRef] [Green Version]
  3. Vainio, M.; Halonen, L. Mid-infrared optical parametric oscillators and frequency combs for molecular spectroscopy. Phys. Chem. Chem. Phys. 2016, 18, 4266–4294. [Google Scholar] [CrossRef] [PubMed] [Green Version]
  4. Lemos, G.B.; Borish, V.; Cole, G.D.; Ramelow, S.; Lapkiewicz, R.; Zeilinger, A. Quantum imaging with undetected photons. Nature 2014, 512, 409–412. [Google Scholar] [CrossRef] [PubMed] [Green Version]
  5. Kalashnikov, D.A.; Paterova, A.V.; Kulik, S.P.; Krivitsky, L.A. Infrared spectroscopy with visible light. Nat. Photonics 2016, 10, 98–101. [Google Scholar] [CrossRef] [Green Version]
  6. Sowade, R.; Breunig, I.; Camara Mayorga, I.; Kiessling, J.; Tulea, C.; Dierolf, V.; Buse, K. Continuous-wave optical parametric terahertz source. Opt. Express 2009, 17, 22303. [Google Scholar] [CrossRef]
  7. Sowade, R.; Kießling, J.; Breunig, I. One light source—All colors. Opt. Photonik 2013, 8, 46–49. [Google Scholar] [CrossRef]
  8. He, Y.; Yang, Q.F.; Ling, J.; Luo, R.; Liang, H.; Li, M.; Shen, B.; Wang, H.; Vahala, K.; Lin, Q. Self-starting bi-chromatic LiNbO3 soliton microcomb. Optica 2019, 6, 1138. [Google Scholar] [CrossRef] [Green Version]
  9. Wang, C.; Zhang, M.; Yu, M.; Zhu, R.; Hu, H.; Loncar, M. Monolithic lithium niobate photonic circuits for Kerr frequency comb generation and modulation. Nat. Commun. 2019, 10, 978. [Google Scholar] [CrossRef]
  10. Szabados, J.; Puzyrev, D.N.; Minet, Y.; Reis, L.; Buse, K.; Villois, A.; Skryabin, D.V.; Breunig, I. Frequency comb generation via cascaded second-order nonlinearities in microresonators. Phys. Rev. Lett. 2020, 124, 203902. [Google Scholar] [CrossRef]
  11. Hendry, I.; Trainor, L.S.; Xu, Y.; Coen, S.; Murdoch, S.G.; Schwefel, H.G.L.; Erkintalo, M. Experimental observation of internally pumped parametric oscillation and quadratic comb generation in a χ(2) whispering-gallery-mode microresonator. Opt. Lett. 2020, 45, 1204–1207. [Google Scholar] [CrossRef]
  12. Zhang, M.; Buscaino, B.; Wang, C.; Shams-Ansari, A.; Reimer, C.; Zhu, R.; Kahn, J.M.; Lončar, M. Broadband electro-optic frequency comb generation in a lithium niobate microring resonator. Nature 2019, 568, 373–377. [Google Scholar] [CrossRef]
  13. Rueda, A.; Sedlmeir, F.; Kumari, M.; Leuchs, G.; Schwefel, H.G.L. Resonant electro-optic frequency comb. Nature 2019, 568, 378–381. [Google Scholar] [CrossRef]
  14. Breunig, I. Three-wave mixing in whispering gallery resonators. Laser Photonics Rev. 2016, 10, 569–587. [Google Scholar] [CrossRef]
  15. Strekalov, D.V.; Marquardt, C.; Matsko, A.B.; Schwefel, H.G.L.; Leuchs, G. Nonlinear and quantum optics with whispering gallery resonators. J. Opt. 2016, 18, 123002. [Google Scholar] [CrossRef] [Green Version]
  16. Rueda, A.; Sedlmeir, F.; Collodo, M.C.; Vogl, U.; Stiller, B.; Schunk, G.; Strekalov, D.V.; Marquardt, C.; Fink, J.M.; Painter, O.; et al. Efficient microwave to optical photon conversion: An electro-optical realization. Optica 2016, 3, 597. [Google Scholar] [CrossRef]
  17. Minet, Y.; Reis, L.; Szabados, J.; Werner, C.S.; Zappe, H.; Buse, K.; Breunig, I. Pockels-effect-based adiabatic frequency conversion in ultrahigh-Q microresonators. Opt. Express 2020, 28, 2939–2947. [Google Scholar] [CrossRef] [PubMed]
  18. Savchenkov, A.A.; Ilchenko, V.S.; Matsko, A.B.; Maleki, L. High-order tunable filters based on a chain of coupled crystalline whispering gallery-mode resonators. IEEE Photonics Technol. Lett. 2005, 17, 136–138. [Google Scholar] [CrossRef]
  19. Fürst, J.U.; Strekalov, D.V.; Elser, D.; Lassen, M.; Andersen, U.L.; Marquardt, C.; Leuchs, G. Naturally phase-matched second-harmonic generation in a whispering-gallery-mode resonator. Phys. Rev. Lett. 2010, 104, 153901. [Google Scholar] [CrossRef] [Green Version]
  20. Szabados, J.; Sturman, B.; Breunig, I. Frequency comb generation threshold via second-harmonic excitation in χ(2) optical microresonators. APL Photonics 2020, 5, 116102. [Google Scholar] [CrossRef]
  21. Ferdous, F.; Demchenko, A.A.; Vyatchanin, S.P.; Matsko, A.B.; Maleki, L. Microcavity morphology optimization. Phys. Rev. A 2014, 90. [Google Scholar] [CrossRef]
  22. Grudinin, I.S.; Yu, N. Dispersion engineering of crystalline resonators via microstructuring. Optica 2015, 2, 221. [Google Scholar] [CrossRef]
  23. Archambeault, B.; Brench, C.; Ramahi, O.M. (Eds.) EMI/EMC Computational Modeling Handbook, 2nd ed.; The Springer International Series in Engineering and Computer Science; Springer: Boston, MA, USA, 2001; Volume 630. [Google Scholar] [CrossRef]
  24. Weis, R.S.; Gaylord, T.K. Lithium niobate: Summary of physical properties and crystal structure. Appl. Phys. A 1985, 37, 191–203. [Google Scholar] [CrossRef]
  25. Strekalov, D.V.; Savchenkov, A.A.; Matsko, A.B.; Yu, N. Efficient upconversion of subterahertz radiation in a high-Q whispering gallery resonator. Opt. Lett. 2009, 34, 713–715. [Google Scholar] [CrossRef] [Green Version]
  26. Luennemann, M.; Hartwig, U.; Panotopoulos, G.; Buse, K. Electrooptic properties of lithium niobate crystals for extremely high external electric fields. Appl. Phys. B 2003, 76, 403–406. [Google Scholar] [CrossRef]
  27. Tipler, P.A. College Physics; Worth: New York, NY, USA, 1987; p. 467. [Google Scholar]
  28. Umemura, N.; Matsuda, D.; Mizuno, T.; Kato, K. Sellmeier and thermo-optic dispersion formulas for the extraordinary ray of 5 mol.% MgO-doped congruent LiNbO3 in the visible, infrared, and terahertz regions. Appl. Opt. 2014, 53, 5726–5732. [Google Scholar] [CrossRef]
  29. Abarkan, M.; Aillerie, M.; Kokanyan, N.; Teyssandier, C.; Kokanyan, E. Electro-optic and dielectric properties of zirconium-doped congruent lithium–niobate crystals. Opt. Mater. Express 2014, 4, 179. [Google Scholar] [CrossRef]
Figure 1. (a) Artist drawing of a setup used in recent experiments of frequency conversion schemes involving bulk lithium niobate whispering gallery resonators involving the electro-optic effect. The laser light is coupled into the WGR via a coupling prism. The resonator is coated with a metal electrode. (b,c) The electric field distribution indicated by the green lines for a cylindrical resonator with an idealized homogeneous field and for a commonly used resonator geometry. The red area indicates the size and position of the optical mode, not to scale.
Crystals 11 00298 g001
Figure 2. Geometries used for the simulation. We assume an axially symmetrical 2D model. The resonator has at the bottom and top a metal electrode. In (a) the geometry with a constant ratio is illustrated. Here R 1 is the major radius, R 2 the minor radius and Δ z the thickness. For this shape we also investigated a variation of the distance Δ d between the rim of the resonator and the electrode. (b) The few-mode geometry. The small bulge at the equator of the WGR is used to guide the light. Here r s is the radius of the small circle and the distance Δ r between the rim of the resonator and R 1 .
Crystals 11 00298 g002
Figure 3. Two examples of electric field distributions E z for different thicknesses. The distribution is plotted based on ϵ C . The red area indicates where the intensity of the fundamental optical mode is larger than 10% of its maximum. The black bar has in (a) a size of 50 μ m and in (b) of 10 μ m . For better visibility the range of field values is limited such that the region of interest provides enough contrast.
Crystals 11 00298 g003
Figure 4. (a) The average electric field strength in the area where the intensity is larger than 10 of its maximal intensity of the fundamental optical mode for R 1 = 1000 μm and different thicknesses Δ z . The green line indicates the field strength E z according to E z = E 0 = U / Δ z . (b) Comparison between the electric field E z and the respective field in a plate capacitor E 0 for different Δ z / R 1 . The error bars have point size.
Crystals 11 00298 g004
Figure 5. (a) The electric field strength in the area of the optical mode for different distances Δ d of the electrode from the rim of the resonator between 0 and 150   μ m . The major radius of the WGR is R 1 = 1000   μ m and the thickness Δ z = 500   μ m . (b) Schematic of a possible configuration with an additional isolation layer with length Δ l covering the top and the bottom electrode.
Crystals 11 00298 g005
Figure 6. Two examples for different Δ r in the case of a few-mode WGR with a semicircular bulge with radius r s = 5   μ m , R 1 = 1000   μ m and Δ z = 500   μ m . The electric field strength is plotted using the unclamped dielectric constant. We simulate in (a) Δ r = 1   μ m and in (b) Δ r = 5   μ m . The color code represents the electric field strength E z . The red area indicates the area where the intensity of the fundamental optical mode is larger than 10% of its the maximum value. The black bar has a size of 5 μ m . For better visibility the range of E z field values is limited such that the region of interest provides enough contrast.
Crystals 11 00298 g006
Figure 7. (a) The average electric field strength E z in the few-mode resonator with small radius r s = 5   μ m in the area where the normalized intensity of the fundamental optical mode is larger than 10 % . The red data points represent the strength E z with ϵ C and black the one with ϵ UC . The error bars represent Δ E z . The inset show the highest possible optical mode. The yellow bar has a size of 5   μ m . (b) Comparison between the electric field E z and the respective field in a plate capacitor E 0 . The gray bars as a measure for the field inhomogeneity are given by Δ E z / E 0 .
Crystals 11 00298 g007
Publisher’s Note: MDPI stays neutral with regard to jurisdictional claims in published maps and institutional affiliations.

