Article

Anisotropy of X-ray Absorption Cross Section in CeCoGe3 Single Crystal

1
European Synchrotron Radiation Facility, 38043 Grenoble, France
2
Faculty of Physics, M.V. Lomonosov Moscow State University, 119991 Moscow, Russia
3
IMR, Tohoku University, Oarai 311-1313, Japan
4
Federal Scientific Research Center “Crystallography and Photonics”, A.V. Shubnikov Institute of Crystallography, 119333 Moscow, Russia
*
Author to whom correspondence should be addressed.
Submission received: 24 April 2021 / Revised: 10 May 2021 / Accepted: 10 May 2021 / Published: 13 May 2021

Abstract

:
Absorption spectra of two orthogonal linearly polarized X-rays in a single CeCoGe3 crystal were measured at the ID12 beamline of the ESRF for the energies near the K-edges of Ge, Co and near the L23 edges of Ce. The X-ray natural linear dichroism (XNLD) was revealed in the vicinity of all the absorption edges, which indicates a splitting of electronic states in a crystalline field. Mathematical modelling in comparison with experimental data allowed the isotropic and anisotropic parts of atomic absorption cross section in CeCoGe3 to be determined near all measured absorption edges. The calculations also show that the “average” anisotropy of the cross section close to the Ge K-edge revealed in the experiment is less than the partial anisotropic contributions corresponding to Ge atoms in two different Wyckoff positions.

1. Introduction

The element-specific and polarization-dependent absorption of X-rays XAS (X-ray Absorption Spectroscopy) is a spectroscopy technique which is used to extract the geometrical information, as well as electronic and magnetic structure of matter [1,2]. A pronounced anisotropy of XAS and anomalous dispersion in anisotropic media with respect to the polarization of the incident photons can appear in the XANES (X-ray absorption Near Edge Structure) region at the energies of radiation close (about 50 eV) to absorption edges which reflect the ionisation threshold of the different core orbitals [3,4]. The anisotropies in the charges or spins distribution in the material manifests itself in dichroism of XAS, i.e., lead to a difference between the absorption spectra corresponding to two orthogonal polarizations of incident radiation. Circular and linear dichroism are well known phenomena in the visible optics, but in X-ray optics polarization phenomena began to be actively studied with the advent of synchrotron sources. The first studies of polarization effects in X-ray optics were carried out at the beginning of the 20th century, but the experimental studies were rather restricted because the radiation of X-ray tubes was not polarized [5,6,7,8]. Synchrotron sources give bright and polarized radiation in X-ray range, which led to the rapid development of methods based on the study of various types of X-ray dichroism [9,10,11,12]. XMCD (X-ray Magnetic Circular Dichroism) [13,14,15,16,17] and XMLD (X-ray Magnetic Linear Dichroism) [18,19] are actively used to study magnetic properties of substances. Conjunction of XMCD or XMLD with scanning or imaging electron microscopy gives capabilities for the study of complex magnetic materials such as imaging domains and domain walls in magnetic [20] and magnetoelectric [21] materials, investigating surface and interface effects [22,23,24]. Recently, it is accompanied by experiments with time resolution allowing the magnetization dynamics to be studied [25,26]. In nonmagnetic media, XNCD (X-ray Natural Circular Dichroism) [27,28,29] or XNRLD (X-ray nonreciprocal Linear Dichroism) [30,31,32,33] occurs only for E1E2 transitions in the presence of mixed p-d electronic states in crystals without inversion center. XNLD (X-ray Natural Linear Dichroism) in nonmagnetic anisotropic media may be produced by all kinds of multipole transitions [34,35,36]. Moreover, in crystals with low symmetry trichroism may appear, which means that three different absorption spectra correspond to three orthogonal linear polarizations [36]. In conjunction with PEEM (Photoemmision Electron Microscopy) XNLD also used for the imaging of microcrystallite orientations in various materials and biominerals or ferroelectric domains [37,38,39]. In [40] polarization-dependent imaging contrast (PIC) maps enable visualization of the nano- to microscale structure of apatite crystals in teeth and bone. However, a study of XNLD in single crystals remains actual, because it allows to study the electronic properties. The detailed study of the polarized X-ray absorption spectra features in polymorphic modifications of TiO2 anatase and rutile [41,42,43,44] accompanied by the FDM calculations has allowed the electronic structure, multipole transitions and effect of oxygen vacancies to be considered in detail.
In the present paper, we study XNLD in a CeCoGe3 single crystal with tetragonal 4 mm symmetry. This substance has very interesting low-temperature magnetic properties, and at T = 0.69 K and pressure 6.5 GPa it becomes a superconductor [45,46]. It is a representative of a big family of cerium based heavy-fermion compounds [47]. For our studies, we use XNLD as an instrument sensitive to the details of electronic structure. In tetragonal crystals, XNLD has to be observed in the absorption spectra with polarization of incident radiation parallel and perpendicular to the fourth-order axis. The existence of XNLD is a consequence of splitting of electronic states in a crystal field. In non-magnetic crystals, the absorption coefficient has the properties of a tensor, which is characterized by a set of nonzero coefficients corresponding to the point symmetry of the crystal. The interaction of X-ray radiation with each scattering atom is also anisotropic, and the point symmetry group of the individual Wyckoff position of the resonant atoms may differ from the point group of the crystal. However, after averaging over all scattering centers, the absorption coefficient of the unit cell and the entire crystal has a symmetry of the point group of the crystal. Therefore, if the resonant atoms occupy two or more nonequivalent Wyckoff positions in a unit cell, then the measured absorption spectrum is a sum of partial spectra that can only be distinguished by numerical simulation [48,49]. Partial contributions to the X-ray atomic factor can be experimentally separated only in the diffraction geometry [50]. In the presence of multipole transitions higher that the dipole the X-ray absorption coefficient has an angular dependence [36], which is usually most obvious in the pre-edge [44].
Because the measurements of the absorption coefficient require using of thin samples, which is not always possible, the secondary radiation spectra usually are measured, for example, the fluorescence spectrum. The spectral dependence of fluorescence often not completely coincides with the absorption spectrum; therefore, it needs to be corrected taking into account self-absorption effect when processing the results. A detailed discussion of the question how the spectra of secondary radiation are related to the absorption spectrum is given in [51]. Extracting absorption spectra from fluorescence spectra methods are given, for example, in [52,53,54].
The uniqueness of the CeCoGe3 crystal is that the measurements can be performed at the absorption edges of all elements at the same beamline, since their energies are close. Measuring of the linear dichroism at each absorption edge allows to extract small anisotropic correction to the absorption cross section corresponding to each atom, which is a unique property of a substance depending on the electronic levels splitting. This correction is associated with the imaginary part of resonant contribution to the atomic factor, giving the possibility to calculate the real part via the Kramers–Kronig relation. However, close to the Ge K-edge the absorption spectra are the sum of the partial spectra corresponding to atoms in two nonequivalent Wyckoff position. So, the numerical simulation will be made to separate the anisotropic corrections to the absorption cross section of Ge atoms in different sites.

2. Materials and Methods

CeCoGe3 is a member of a series of CeTX3 compounds (T = transition metal, X = Si or Ge), which crystallize in a noncentrosymmetric tetragonal structure of the BaNiSn3 type (the space group I 4 mm, No. 107), Figure 1. The unit cell parameters are a = b = 4.32042 Å, c = 9.83484 Å [55]. Atoms of cerium, cobalt and part of the germanium atoms occupy Wyckoff positions 2 (a) with 4 mm site symmetry: Co (0; 0; 0.666 (7)), Ce (0; 0; 0), Ge1 (0; 0; 0.4382 (6)), part of the germanium atoms is in the Wyckoff position 4 (b): Ge2 (0; 0.5; 0.7578 (5)) with the 2 mm symmetry [56] (Figure 1).
The cross section describing absorption of X-ray radiation is written elsewhere [36,57,58,59,60,61,62,63] and has the following form [36]:
σ ω = 4 π 2 α ω c f o ^ g 2 δ E f E g ω ,
where a is the initial state of the system with energy Ea, c is the final state with the energy Ec, ô is a transition operator describing the interaction of a medium with electromagnetic wave with the frequency ω, ρ(Ec) is a density of final states. Taking into account only the dipole and quadrupole multipole transitions between the electronic states, in can be written as following [36]:
σ ω = 4 π 2 α ω c ( f e × r g + 1 4 f e × r k × r g 2 δ E f E g ω ,
where k is a wave vector of the electromagnetic wave with polarization e. It is also possible to use the optical theorem [57] to calculate the absorption coefficient:
σ ω = 4 π k f 0 ,
where f 0 is the imaginary part of the forward scattering amplitude. f can be calculated as follows [60]:
f = e 2 c 2 I m c ( E c E a ) 3 3 ω g o ^ f f o ^ g E a E c + ω i Γ / 2 ,
where Γ(E) is the width of the excited state associated with it’s lifetime τ: Γ~τ−1. This approach is used in the FDMNES code [61,62,63,64] and further is applied to calculate the X-ray absorption coefficients in the vicinity of absorption edges of cerium, cobalt, and germanium.
In the case of tetragonal symmetry 4 mm and dipole E1 transition, the absorption cross section is determined by two independent coefficients. This is the case of dichroism in the absorption spectra:
σ D e = σ D 0 , 0 1 2 3   cos 2 θ 1 σ D 2 , 0 ,
where θ is the angle between the four-fold axis and the polarization vector σD(0,0) describes the isotropic part of the cross sections, σD(2,0) describes its anisotropic part.
In the case of lower symmetry, there are from three to six independent coefficients. For the simplest case realized for 2 mm symmetry, the angular dependence of the absorption cross section is determined by three coefficients σD(0,0), σD(2,0) and σDr(0,0) (trichoism):
σ D e = σ D 0 , 0 1 2 3   cos 2 θ 1 σ D 2 , 0 3   sin 2 θ   cos 2 ϕ σ D r 2 , 2 ,
where ϕ is an azimuthal angle describing the direction of the polarization vector in the crystal axis. In the case of a quadrupole transition and 4 mm symmetry, the absorption cross section is described by four independent coefficients. Corresponding expression of the angular and azimuthal dependence of the absorption cross section is given in [37]. To determine all coefficients describing the different tensor coefficients it is necessary to measure the absorption with different polarizations and its angular and azimuthal dependences. For the purely dipole transition and tetragonal crystal symmetry the absorption cross section depends only on the angle θ in accordance with Equation (5), but there is no dependence on azimuthal angle ϕ , describing rotation around the four-fold axis. It is just the case of CeCoGe3, confirmed by further calculations.
The data obtained in the experiment allow us to determine the isotropic and anisotropic parts of the X-ray absorption cross sections near all absorption edges of three chemical elements: Ge, Co, Ce in CeCoGe3. Using Equation (5), which is valid for the E1 transition in the 4 mm symmetry group, we can divide the absorption cross section into isotropic and anisotropic parts. If we choose one linear polarization along the four-fold axis z (θ = 0°) and another in the perpendicular plane (θ = 90°), then two independent coefficients can be determined as:
σ D 0 , 0 = 1 3 σ z + 2 σ x ,
σ D 2 , 0 = 2 3 σ x σ z ,
where σz is a cross-section corresponding to the polarization vector along c-axis, σx corresponds to the polarization vectors in the ab plane.
However, four Ge atoms occupy the position with 2 mm symmetry and absorption by each atom is described by three coefficients:
σ D 0 , 0 = 1 3 σ z + σ x + σ y ,
σ D 2 , 0 = 1 3 2 σ x + σ y 2 σ z ,
σ D r 2 , 2 = 1 3 2 σ x σ y ,
where σ’x, σ’y, σ’z are the partial absorption cross sections corresponding to one of the Ge atoms in 4(b) position. However, the averaging over all atoms in 4(b) position gives σDr(4b) = 0, hence it is not possible to determine this coefficient from the absorption measurement, but can be calculated numerically.
Further on anisotropic and isotropic parts of absorption cross section close to K-edge of Ge and Co and L23 edges of Ce are calculated using the experimental results and compared with the results of the ab initio calculations with the full potential finite difference method (FDM) as implemented in the FDMNES package [61,62,63,64]. The Hedin–Lundqvist exchange-correlation potential is used by default. However, some variable parameters are necessary for modeling. They are usually determined from the best coincidence between the calculated and the experimental results. In this work, we vary the following parameters: the size of the region in which a photoelectron wave coming out of a resonant atom is scattered by neighboring atoms (a cluster surrounding a resonant atom), the total width of the excited electron-hole state and the Fermi level. The size of the cluster was chosen so that with its further increase, the calculated absorption spectra did not change. This suggests that atoms outside this region have little effect on the absorption. To model the energy dependence of the total width of the excited state FDMNES program proposes various options, one of them simulates a smooth growth of Γ(E) in the form of arctangence. In our calculations the variable parameters are determined from the best agreement between the simulated and experimental spectra using the least squares method.

3. Results

The experimental data were obtained at the third-generation synchrotron ESRF (Grenoble, France), beamline ID12. A high quality CeCoGe3 single crystal was grown, cut in appropriate manner and polished. It has a form of a plate with large side (4 mm) parallel to (001) plane and narrow side (1 mm) parallel to (100) plane. The beam fell on the surface (001) of the sample at an angle of 45°.
Fluorescence spectra were measured near the L2 (6164.0 eV) and L3 (5723.0 eV) cerium absorption edges, as well as the K-absorption edges of Ge (11,113.8 eV) and Co (7709.0 eV). In one measurement the polarization vector lies in the vertical plane, in another experiment the polarization vector lies in the horizontal plane. The experimental design is shown in Figure 2. σver and σhor are the X-ray absorption cross sections in two measurements. A difference of the coefficients σver and σhor indicates the presence of linear X-ray dichroism for all absorption edges. Preliminary calculations have shown that the quadrupole contribution to the absorption cross sections is insignificant; therefore, a significant azimuthal dependence of the absorption cross section during crystal rotation around the [001] direction was not expected.

3.1. Anisotropy of the Absorption Cross Section of CeCoGe3 at the Energies Near the K-Edge of Ge

Applying Equation (5) to describe the scattering cross section in two experiments, it is necessary to set θ = 90° for the horizontal orientation of the polarization vector and θ = 45° for the polarization vector in the vertical plane. Hence, the isotropic and anisotropic contributions to the absorption cross section can be calculated as follows:
σ D 0 , 0 = 1 3 σ h o r + 2 σ v e r ,
σ D 2 ,   0 = 2 2 3 σ h o r σ v e r .
Equations (12) and (13) are used to separate anisotropic from isotropic part of the atomic absorption cross section of Ce, Co and Ge from the experimental data. However, in this experimental setup, fluorescence spectra can differ from the absorption spectra because of the self-absorption effect.
The correspondence between the absorption and fluorescence spectra in different experimental geometries was discussed in detail in the scientific literature [51,52,53,54]. Since in the present study the incident beam was not normal to the crystal surface it was necessary to take into account the effect of self-absorption. In order to obtain the absorption cross section from the experimental fluorescence spectrum we used the method described in [53]. It is applicable if the sample has a flat surface, and its thickness is bigger than the radiation penetration depth. Some necessary data was taken from the tables [65]. Calculations have shown strong effect of self-absorption close to K-edge of Ge in CeCoGe3, but not so strong close to K-edge of Co and L23 edges of Ce. This may be explained by the hardest energy of Ge K-edge and the largest penetration depth.
Figure 3 shows the experimental fluorescence spectrum close to the Ge K-edge, as well as the spectrum obtained after taking into account the self-absorption effect and the absorption spectrum calculated using the FDMNES code. Only the absorption coefficient due to excitation of the 1s atomic level was calculated. Additionally, Figure 3 shows the spectra of linear dichroism as the difference between the absorption cross sections of two orthogonal polarizations σhor-σver. The FDM model of the FDMNES code with the radius of a cluster 8.4 Å (161 atom) was used for the calculations. The dependence Γ(E) is shown in the insertion to Figure 3. Calculations show that quadrupole contribution to the absorption cross section is negligible, and the spectrum corresponds to almost purely the dipole resonant transition. All calculated spectra given in the article are given in absolute units–Megabarns and can be used for further studies.
Since Ge atoms occupy two different Wyckoff positions, we also calculated the absorption cross sections and linear dichroism for Ge atoms in the crystallographic positions 2(a) and 4(b) separately. They are shown in Figure 4a,b.
It can be seen in Figure 4a,b that Ge atoms in 4(b) Wyckoff position give bigger contribution to the absorption cross section and linear X-ray dichroism than Ge atoms in the position 2(a), but this is only because their number is greater. Dividing the coefficients by the number of atoms, we obtain the quantities characterizing atomic absorption cross section. However, at the atomic level, trichoism corresponds to the site symmetry of the 4(b) position of Ge [36]. Its coefficients cannot be obtained directly from the experimental data, because in (5) we must take the angles φ and φ + π/2 for two crystallographically equivalent Ge atoms, hence becomes zero after summing over a unit cell. However, on atomic level the absorption cross sections σ’x and σ’y of an individual Ge atom in position 4(b) are different. In accordance with Equation (1) the absorption cross section depends on the density of final electronic states. Since the linear dichroism arises as a result of the splitting of the electronic levels in a crystal field, and absorption at the K-edge corresponds to transitions from 1s to np-electronic states, we can conclude that the px and py states of Ge atoms in position 2(a) are degenerated, and in position 4(b) this degeneracy is lifted.
Figure 5 shows the coefficients σD(0,0), σD(2,0), corresponding to the isotropic and anisotropic parts of the atomic absorption cross section of Ge atoms in position 2(a), as well as the coefficients σD(0,0), σD(2,0) and σDr(2,0), which characterize the absorption by Ge atoms of position 4(b) per one atom. It can be seen in Figure 5a that, despite the fact that the metal bond is considered to be non-directional, interaction with the crystal field has a significant effect on electronic states and leads to anisotropy of the X-ray radiation absorption of by Ge atoms. It also follows from the spectral shape of the spectra in Figure 5a, that the anisotropic contributions corresponding to two Wyckoff positions of Ge have opposite signs at almost all photon energies. This means that the energy of the pz orbital of one Ge position is higher than the px,y orbitals and vice versa for another position, which is apparently due to the peculiarities of the coordination polyhedra. Additionally, it means that the “average” anisotropy of absorption revealed in the experiment is less than the anisotropy corresponding to Ge atoms in the individual positions at almost all energies of photons. This is confirmed by the calculations of DOS (Density of States) corresponding to two Wyckoff positions of Ge. FDMNES is a multi-optional code allowing many kinds of parameters to be modified. In the present calculations we have used the default options such as Hartree–Fock–Dirac procedure, Hedin, Lundqvist and Von Barth exchange-correlation potential, etc. In the electronic state density, only harmonics projected on the central atom are taken into account.
Figure 5b shows the difference between the DOS of the pz (n(pz)) and px,y (n(px,y)) orbitals. For the 2(a) Ge sites n(px) = n(py), but for the 4(b) site n(px) ≠ n(py). However, we average DOS of the in-plane orbitals for the 4(b) sites of Ge, because its difference cannot be determined from the study of the absorption cross section.

3.2. Anisotropy of the Absorption Cross Section of CeCoGe3 at Energies Near the K-Edge of Co

The site symmetry of Co atoms in CeCoGe3 unit cell is 4 mm. Four nearest germanium atoms form a square with a Co-Ge distance of 2.235 Å, the fifth Co atom lies on the z-axis at a distance of 2.273 Å. The absorption cross section near the K edge of Co is characterized by two independent parameters, which can be calculated using experimental data σver and σhor at the energies of the incident radiation close to the Co K-edge using Equations (12) and (13). Taking into account the self-absorption effect did not make significant changes in the fluorescence spectrum. We have calculated the polarized absorption cross sections close to the K-edge of Co in the CeCoGe3 with the help of the multiple scattering approach realized in the FDMNES package taking into account 189 atoms in a cluster with the radius 9.4 Å surrounding a resonant atom and with the help of the FDM approach with a cluster 7.1 Å (84 atoms). The results look similar, but the FDM calculations demonstrate better agreements with the experimental data. Figure 6 shows the isotropic and anisotropic resonant contributions to the X-ray absorption cross section near the K-edge of Co, obtained from the experimental measurements and calculated with the FDM method. As can be seen, the calculated absorption cross section and dichroism spectrum contains all the peaks that are present in the experimental spectrum, but there is a discrepancy between the heights of the calculated and experimental peaks between 0 eV and 20 eV. The calculated isotropic quadrupole contribution to the absorption cross section close the Co K-edge is also shown in Figure 6. It obviously is much less that the dipole contribution to the cross section and cannot explain this discrepancy, so it is most likely due to the not entirely accurate selection of parameters in the calculations.
The difference between the density of the pz and px,y states of Co calculated with the help of FDMNES code is shown in Figure 6b. It demonstrates a good agreement with the measured XNLD spectrum. A visible inconsistence exists close to the Fermi level which disappears during the spectra calculation after the convolution with the width of electronic levels.

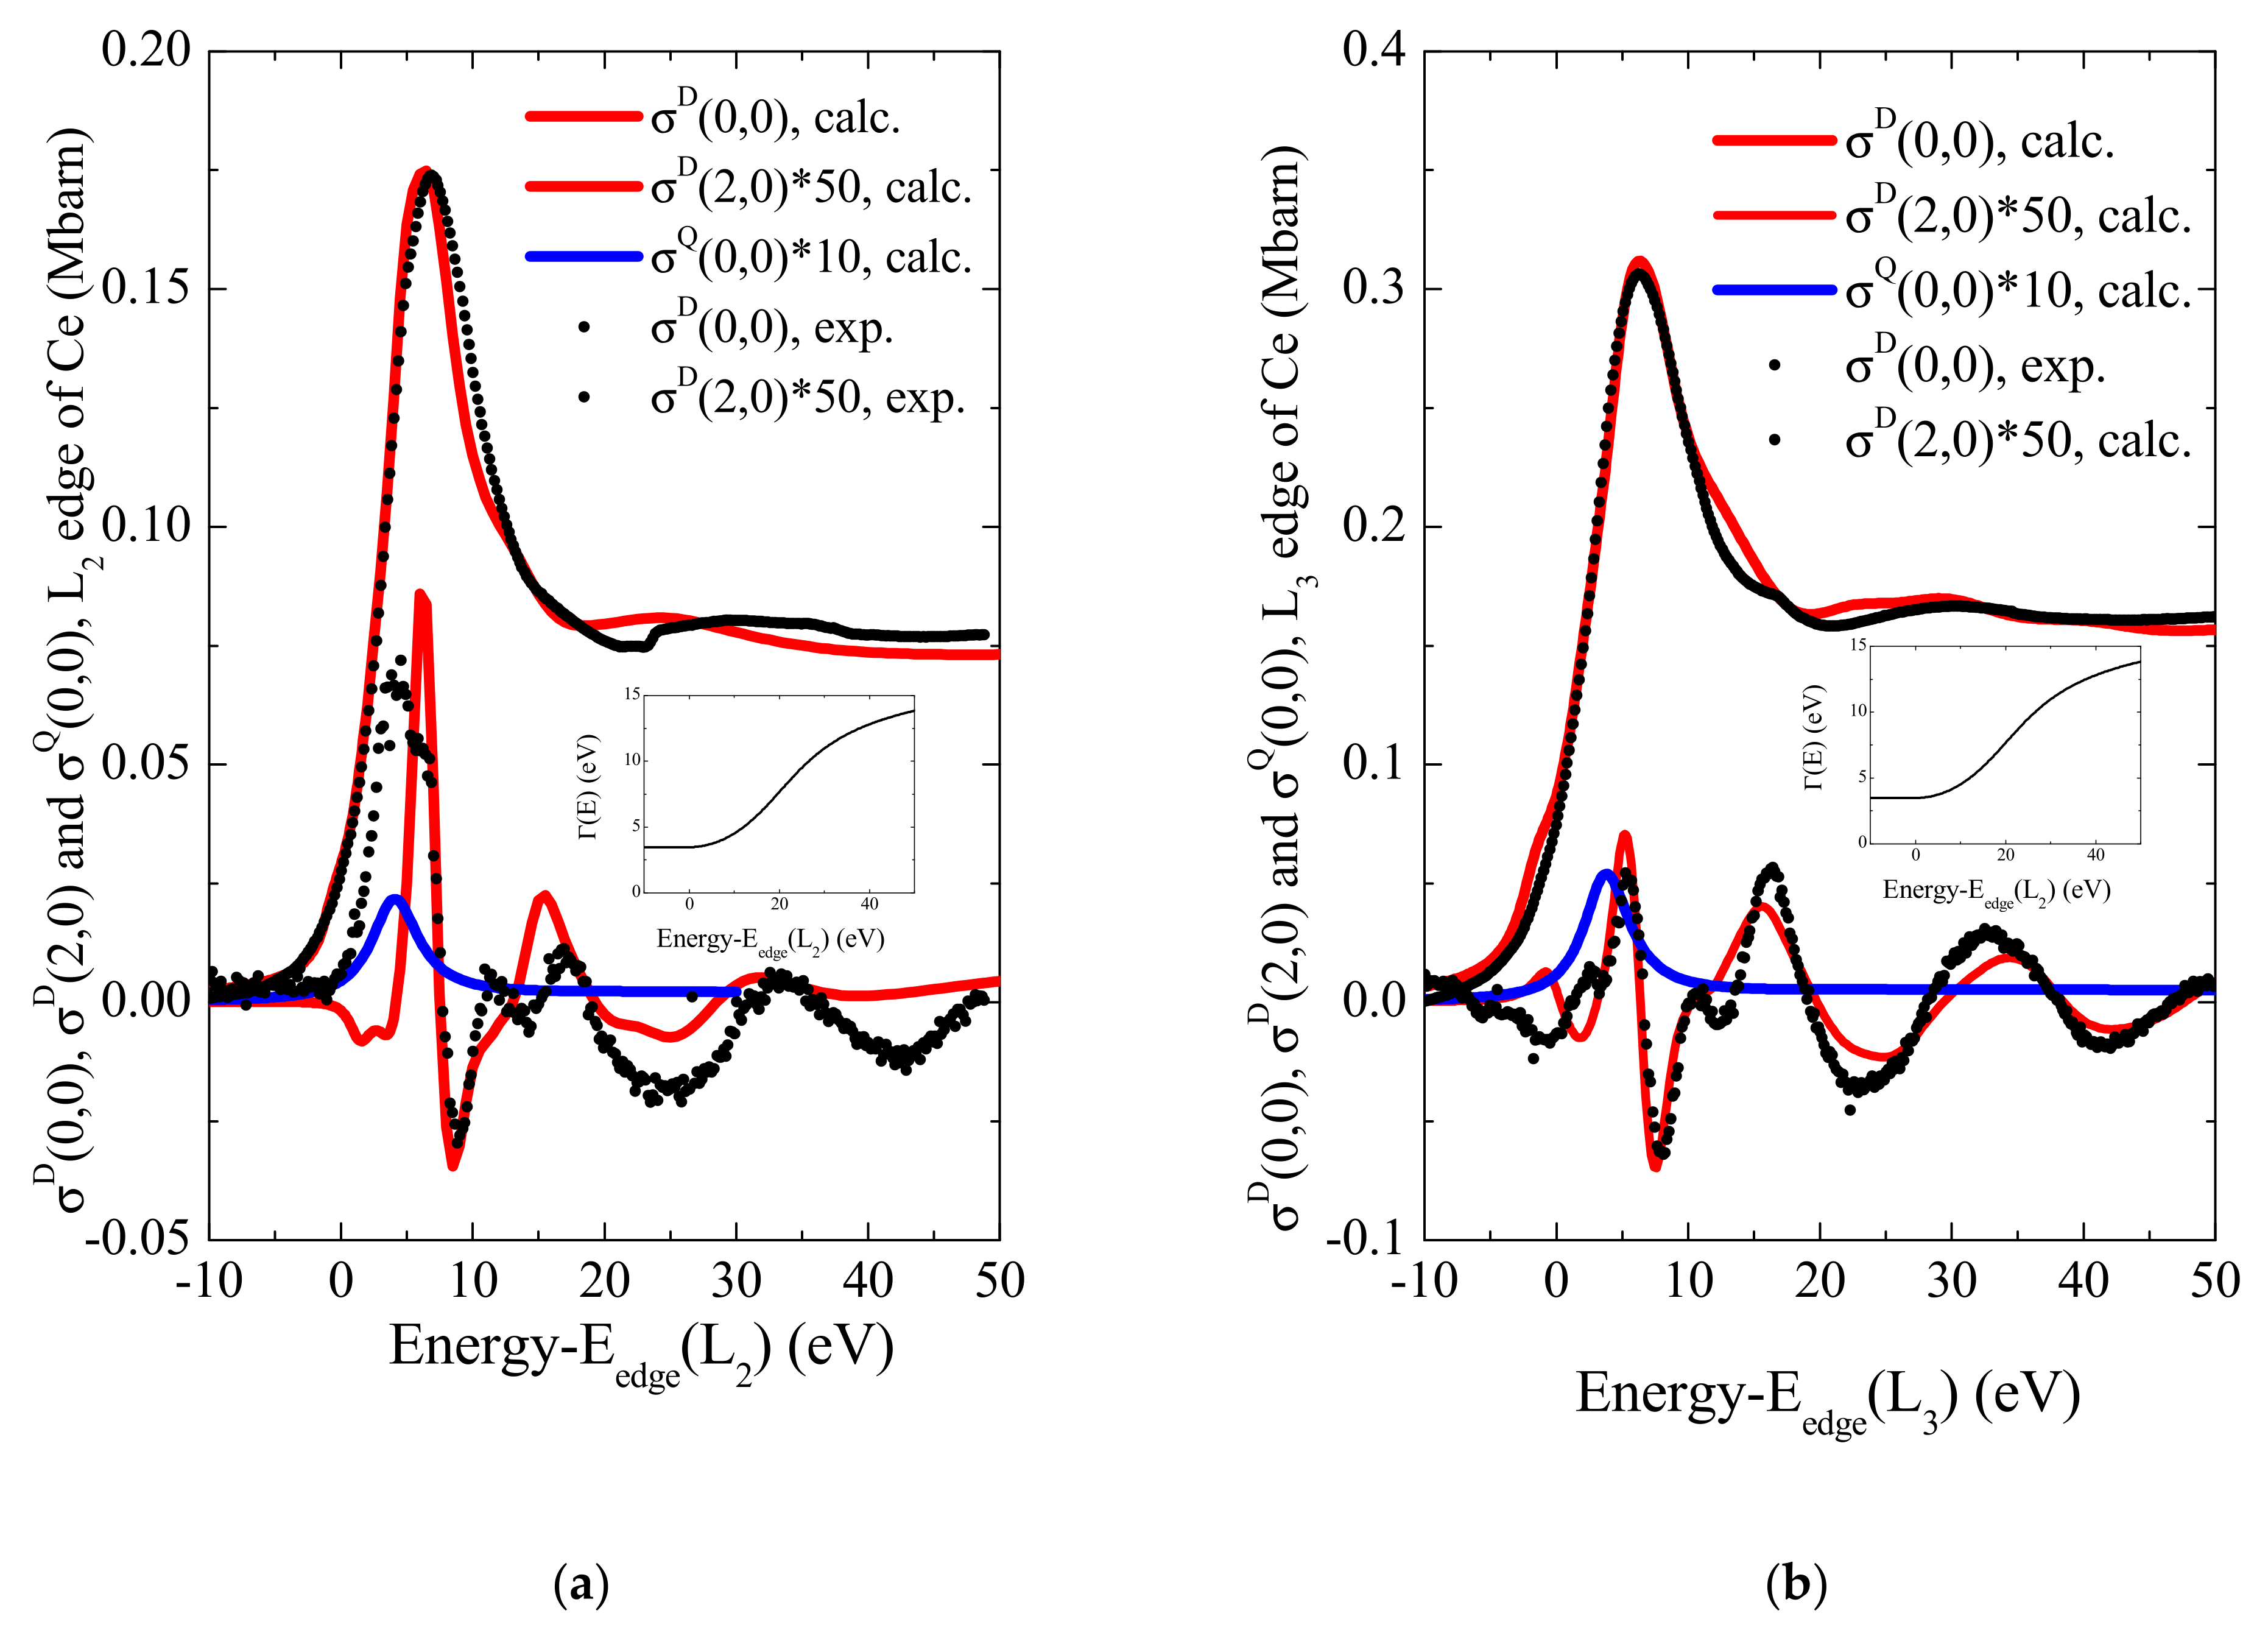
3.3. Anisotropy of the CeCoGe3 Absorption Cross Section at Energies Near L2,3 Edges of Ce

Figure 7a shows the experimentally measured absorption and linear dichroism spectra close to the L2 and L3 edges of Ce, reduced to the same energy scale. We can see that the spectral dependences of the cross sections and linear dichroism at two absorption edges are very similar. A significant difference of dichroism signal is present only in the area on the slope of the white line. L23 absorption edges correspond to excitation of 2p to nd electronic states in the case of a dipole transition and to nf states in the case of a quadrupole transition. The first coordination sphere of Ce atoms is formed by Ge atoms forming a square at a distance of 2.951 Å and a Co atom at a distance of 2.85 Å on the z axis. In a tetragonal crystalline field, the d states of Ce are split into eg and t2g levels, which causes anisotropy of the absorption cross section and linear dichroism. Figure 7b shows the difference between the density of t2g and eg d-electronic states of Ce calculated with the help of the FDMNES code in comparison with the XNLD measured close to the L2 absorption edge. We can see a good agreement between the curves except the region close to the Fermi level (0 eV in the calculation). Narrow lines seen in the calculated density of states is probably smoothen in the experiment and in further calculation of the energy spectra and could not be resolved.
The energy absorption spectra near L2 (6164 eV) and L3 (5723 eV) edges of Ce were calculated using the FDMNES code. The calculations involve 125 atoms in a region of a size 9.4 Å. The effects of self-absorption do not significantly affect the shape of the energy spectra. Figure 8a,b shows the isotropic and anisotropic parts of the resonant absorption cross section near the L2 and L3 absorption edges. Calculations were carried out in accordance with Equations (7) and (8) for modelling and Equations (12) and (13) for the experimental data. The inset in Figure 8 shows the Γ(E) used in the calculation of both absorption edges. The FDMNES calculations were carried out under the assumption of dipole resonance transitions. The quadrupole contribution to the absorption cross section was also calculated (blue line in Figure 8). According to [36], in the 4 mm symmetry group it is described by four independent coefficients. The FDMNES calculations show that the quadrupole contribution to the absorption cross section is almost two orders of magnitude smaller than the dipole isotropic term and is comparable with the anisotropic dipole contribution. Similarly, the anisotropic part of the quadrupole contribution to the absorption cross section is much smaller than the anisotropic dipole contribution. Therefore, in the case of CeCoGe3, the azimuthal dependence of the absorption cross sections to be very slight; the results are well described in the frames of the dipole approximation.

4. Conclusions

Our study of the absorption of polarized X-ray radiation in a CeCoGe3 single crystal demonstrates the presence of anisotropic parts of resonant cross section at incident radiation energies near the absorption edges of all atoms that make up the substance. Although this crystal, according to the published data [47], has a metallic conductivity, which implies the predominance of non-directional metal bonds, calculations based on localized wave functions have fairly good agreement with experimental data. It follows from the obtained results that the anisotropy of the absorption cross section near the L-edges of cerium is less than the anisotropy near the K-edges of germanium and cobalt. In the maxima of absorption the ratio σD (2,0)/σD (0,0) are approximately equal to: for Ge~1.5%, for Co~2%, for Ce~0.4%. This suggests that d-electron states are split less than p-electron states. It was shown in this work that the XNLD signal is in good agreement with the difference in the densities of electronic states split by the crystal field and can be used to characterize such a splitting. We also see that a “white line” is present in the absorption spectra of Ge and Ce, while it is absent in the spectrum of Co. It means that the “holes” close to Fermi level mainly corresponds to the Ge and Ce electron states. Using the numerical calculations, it becomes possible to separate the anisotropic contributions to the absorption cross sections corresponding to Ge atoms in two nonequivalent Wyckoff positions. It follows from the calculations that the spectral dependences of the partial anisotropic contributions to the absorption cross section near the K-edge of Ge are different (due to the difference in the shape of coordination polyhedra) and have opposite signs for almost all photon energies. Apparently, the ellipsoids describing the characteristic surfaces of the anisotropic tensor coefficients are elongated or oblate in different ways and depend on the energy of the incident radiation. The difference in the signs of the anisotropic parts of the absorption cross section of nonequivalent Ge atoms results in the fact that the observed linear X-ray dichroism is smaller than the values of the anisotropic contributions to the absorption cross sections corresponding to each atomic position separately; in other words, the “average” anisotropy of the resonant cross section revealed in the experiment is less than the anisotropy provided by the splitting of electronic levels in a crystal field.

Author Contributions

Conceptualization, A.R., E.O. and V.E.D.; investigation, A.R. and F.W.; sample preparation, D.A.; formal analysis, E.O., R.B. and A.E.; software, A.O., K.K.; resources, A.R. and F.W.; writing—original draft preparation, R.B. and A.E.; writing—review and editing, A.R., E.O., and V.E.D.; visualization, K.K. All authors have read and agreed to the published version of the manuscript.

Funding

This research was funded by the Russian Foundation for Basic Research (project no. 19-52-12029, study of the linear X-ray dichroism, and project no. 19-02-00483, calculation of X-ray absorption spectra).

Institutional Review Board Statement

Not applicable.

Informed Consent Statement

Not applicable.

Data Availability Statement

Experimental data is available upon reasonable request to the authors.

Acknowledgments

This research used the ID12 beamline of the European Synchrotron Radiation Facility (ESRF, Grenoble, France). We acknowledge ESRF for the provision of experimental facilities. V.D. was partly supported by the Ministry of Science and Higher Education over a state contract for the Federal Research Center Crystallography and Photonics, Russian Academy of Sciences. The work partly was performed using the equipment of the Center for the collective use of ultrahigh-performance computing resources of the Moscow State University Lomonosov [66].

Conflicts of Interest

The authors declare no conflict of interest.

References

  1. Van Bokhoven, J.A.; Lamberti, C. X-ray Absorption and X-ray Emission Spectroscopy: Theory and Applications; John Wiley Sons: Hoboken, NJ, USA, 2016. [Google Scholar] [CrossRef]
  2. Rehr, J.J.; Albers, R.C. Theoretical approaches to X-ray absorption fine structure. Rev. Mod. Phys. 2000, 72, 621–654. [Google Scholar] [CrossRef]
  3. Stöhr, J. NEXAFS Spectroscopy; Springer Series in Surface Sciences 25; Springer: Berlin/Heidelberg, Germany, 1992. [Google Scholar]
  4. Maslen, E.N. X-Ray Absorption. In International Tables for Crystallography; Prince, E., Ed.; Springer: Berlin/Heidelberg, Germany, 2006; Volume C, pp. 599–608. [Google Scholar]
  5. Krogstad, R.; Nelson, W.; Stephenson, S.T. X-ray absorption fine structure with polarized X-rays. Phys. Rev. 1953, 92, 1394–1395. [Google Scholar] [CrossRef]
  6. Hart, M. X-ray polarization phenomena. Philos. Mag. B 1978, 38, 41–56. [Google Scholar] [CrossRef]
  7. Alexander, E.; Fraenkel, B.S.; Perel, J.; Rabinovitch, K. Orientation dependence of k-absorption extended fine structure of a single crystal of germanium. Phys. Rev. 1963, 132, 1554–1558. [Google Scholar] [CrossRef]
  8. Belyakov, V.A.; Dmitrienko, V.E. Polarization phenomena in X-ray optics. Sov. Phys. Uspekhi 1989, 32, 697–719. [Google Scholar] [CrossRef]
  9. Van der Laan, G.; Thole, B.T.; Sawatzky, G.A.; Goedkoop, J.B.; Fuggle, J.C.; Esteva, J.-M.; Karnatak, R.; Remeika, J.P.; Dabkowska, H.A. Experimental proof of magnetic X-ray dichroism. Phys. Rev. B Condens. Matter Mater. Phys. 1986, 34, 6529–6531. [Google Scholar] [CrossRef] [PubMed]
  10. Schütz, G. Absorption of circularly polarized x rays in iron. Phys. Rev. Lett. 1987, 58, 737–740. [Google Scholar] [CrossRef] [Green Version]
  11. Templeton, D.H.; Templeton, L.K. X-ray dichroism and polarized anomalous scattering of the uranyl ion. Acta Cryst. Sect. A 1982, 38, 62–67. [Google Scholar] [CrossRef]
  12. Thole, B.T.; Van-der-laan, G.; Sawatzky, G.A. X-ray absorption spectra of magnetic rare-earth materials. Phys. Rev. Lett. 1985, 55, 2086–2088. [Google Scholar] [CrossRef]
  13. Thole, B.T.; Carra, P.; Sette, F.; Van-der-laan, G. X-ray circular dichroism as a probe of orbital magnetization. Phys. Rev. Lett. 1992, 68, 1943–1946. [Google Scholar] [CrossRef]
  14. Carra, P.; Thole, B.T.; Altarelli, M.; Wang, X. X-ray circular dichroism and local magnetic fields. Phys. Rev. Lett. 1993, 70, 694–697. [Google Scholar] [CrossRef]
  15. Rogalev, A.; Wilhelm, F.; Jaouen, N.; Goulon, J.; Kappler, J.-P. X-ray Magnetic Circular Dichroism: Historical Perspective and Recent Highlights. In Magnetism and Synchrotron Radiation; Beaurepaire, E., Scheurer, F., Krill, G., Kappler, J.-P., Eds.; Springer Science & Business Media: Berlin/Heidelberg, Germany, 2001. [Google Scholar]
  16. Schütz, G.; Knülle, M.; Ebert, H. X-Ray Magnetic Circular Dichroism and Its Relation to Local Magnetic Structures. In Resonant Anomalous X-ray Scattering. Theory and Application; Materlik, G., Sparks, C.S., Fischer, K., Eds.; Elsevier Science: Amsterdam, The Netherlands, 1994; pp. 535–555. [Google Scholar]
  17. Stöhr, J. Exploring the microscopic origin of magnetic anisotropies with X-ray magnetic circular dichroism (XMCD) spectroscopy. J. Magn. Magn. Mater. 1999, 200, 470–477. [Google Scholar] [CrossRef]
  18. Lϋnning, J.; Nolting, F.; Scholl, A.; Seo, J.W.; Fompeyrine, J.; Locquet, J.-P.; Stόhr, J. Determination of the antiferromagnetic spin axis in epitaxial LeFeO3 films by X-ray magnetic linear dichroism. Phys. Rev. B Condens. Matter Mater. Phys. 2003, 67, 214433–214500. [Google Scholar] [CrossRef] [Green Version]
  19. Van der Laan, G.; Arenholz, E.; Chopdekar, R.V.; Suzuki, Y. Influence of crystal field on anisotropic x-ray magnetic linear dichroism at the Co2+ L2,3 edges. Phys. Rev. B Condens. Matter Mater. Phys. 2008, 77, 064407. [Google Scholar] [CrossRef]
  20. Stohr, J.; Wu, Y.; Hermsmeier, B.D.; Samant, M.G.; Harp, G.R.; Koranda, S.; Dunham, D.; Tonner, B.P. Element-specific magnetic microscopy with circularly polarized x-rays. Science 1993, 259, 658–661. [Google Scholar] [CrossRef]
  21. Zhao, T.; Scholl, A.; Zavaliche, F.; Lee, K.; Barry, M.; Doran, A.; Cruz, M.P.; Chu, Y.H.; Ederer, C.; Spaldin, N.A.; et al. Electrical control of antiferromagnetic domains in multiferroic BiFeO3 films at room temperature. Nat. Mater. 2006, 5, 823–829. [Google Scholar] [CrossRef]
  22. Van der Laan, G.; Telling, N.D.; Potenza, A.; Dhesi, S.S.; Arenholz, E. Anisotropic x-ray magnetic linear dichroism and spectromicroscopy of interfacial Co/NiO(001). Phys. Rev. B Condens. Matter Mater. Phys. 2011, 83, 064409. [Google Scholar] [CrossRef]
  23. Stöhr, J.; Scholl, A.; Regan, T.J.; Anders, S.; Lüning, J.; Scheinfein, M.R.; Padmore, H.A.; White, R.L. Images of the antiferromagnetic structure of a NiO (100) surface by means of x-ray magnetic linear dichroism spectromicroscopy. Phys. Rev. Lett. 1999, 83, 1862–1865. [Google Scholar] [CrossRef] [Green Version]
  24. Nolting, F.; Scholl, A.; Stohr, J.; Seo, J.W.; Fompeyrine, J.; Siegwart, H.; Locquet, J.-P.; Ander, S.; LuÈning, J.; Fullerton, E.E.; et al. Direct observation of the alignment of ferromagnetic spins by antiferromagnetic spins. Nature 2000, 403, 767–768. [Google Scholar] [CrossRef]
  25. Choe, S.-B.; Acremann, Y.; Scholl, A.; Bauer, A.; Doran, A.; Stöhr, J.; Padmore, H.A. Vortex core-driven magnetization dynamics. Science 2004, 304, 420–422. [Google Scholar] [CrossRef] [Green Version]
  26. Milne, C.J.; Penfold, T.J.; Chergui, M. Recent experimental and theoretical developments in time-resolved X-ray spectroscopies. Coord. Chem. Rev. 2014, 277–278, 44–68. [Google Scholar] [CrossRef]
  27. Alagna, L.; Prosperi, N.; Turchini, S.; Rogalev, A.; Coulon-Ginet, C.; Natoli, C.R.; Peacock, R.D.; Stewart, B. X-ray natural circular dichroism. Phys. Rev. Lett. 1998, 80, 4799–4802. [Google Scholar] [CrossRef]
  28. Goulon, J.; Goulon-Ginet, C.; Rogalev, A.; Gotte, V.; Malgrange, C.; Brouder, C.; Natoli, C.R. X-ray natural dichroism in a uniaxial gyrotropic single crystal of LiIO3. J. Chem. Phys. 1998, 108, 6394–6403. [Google Scholar] [CrossRef]
  29. Brouder, C.; Natoli, C.R.; Sainctavit, P.; Goulon, J.; Goulon-Ginet, C.; Rogalev, A. Theory of X-ray natural circular dichroism. J. Synchrotron Radiat. 1999, 6, 261–263. [Google Scholar] [CrossRef] [Green Version]
  30. Goulon, J.; Rogalev, A.; Goulon-Ginet, C.; Benayoun, G.; Paolasini, L.; Brouder, C.; Malgrange, C.; Metcalf, P.A. First observation of nonreciprocal X-ray gyropropy. Phys. Rev. Lett. 2000, 85, 4385–4390. [Google Scholar] [CrossRef]
  31. Di Matteo, S.; Joly, Y.; Natoli, C.R. Detection of electromagnetic multipoles by X-ray spectroscopies. Phys. Rev. B Condens. Matter Mater. Phys. 2005, 72, 144406. [Google Scholar] [CrossRef] [Green Version]
  32. Carra, P.; Jerez, A.; Marri, I. X-ray dichroism in noncentrosymmetric crystals. Phys. Rev. B Condens. Matter Mater. Phys. 2003, 67, 045511. [Google Scholar] [CrossRef] [Green Version]
  33. Kubota, M.; Arima, T.; Kaneko, Y.; He, J.P.; Yu, X.Z.; Tokura, Y. X-ray directional dichroism of a polar ferrimagnet. Phys. Rev. Lett. 2004, 92, 137401. [Google Scholar] [CrossRef]
  34. Templeton, D.H.; Templeton, L.K. Polarized x-ray absorption and double refraction in vanadil biacetylacetonate. Acta Cryst. 1980, A36, 237–241. [Google Scholar] [CrossRef] [Green Version]
  35. Templeton, D.H.; Templeton, L.K. X-ray dichroism and polarized anomalous scattering of the uranyl ion. Acta Cryst. 1981, A37, C309. [Google Scholar] [CrossRef]
  36. Brouder, С. Angular dependence of x-ray absorption spectra. J. Phys. Condens. Matter 1990, 2, 701–738. [Google Scholar] [CrossRef]
  37. Gaudry, E.; Kiratisin, A.; Sainctavit, P.; Brouder, C.; Mauri, F.; Ramos, A.; Rogalev, A.; Goulon, J. X-ray natural linear dichroism (xnld) applied to the determination of relaxations around transition metal impurities in -Al2O3. Phys. Scr. 2005, T115, 1041–1043. [Google Scholar] [CrossRef]
  38. Metzler, R.A.; Abrecht, M.; Olabisi, R.M.; Ariosa, D.; Johnson, C.J.; Frazer, B.H.; Coppersmith, S.N.; Gilbert, P.U.P.A. Architecture of columnar nacre, and implications for its formation mechanism. Phys. Rev. Lett. 2007, 98, 268102. [Google Scholar] [CrossRef] [Green Version]
  39. Polisetty, S.; Zhou, J.; Karthik, J.; Damodaran, A.R.; Chen, D.; Scholl, A.; Martin, L.W.; Holcomb, M. X-ray linear dichroism dependence on ferroelectric polarization. J. Phys. Condens. Matter. 2012, 24, 245902. [Google Scholar] [CrossRef] [Green Version]
  40. Stifler, A.; Kølln Wittig, N.; Sassi, M.; Sun, C.-Y.; Marcus, M.A.; Birkedal, H.; Beniash, E.; Rosso, K.M.; Gilbert, P.U.P.A. X-ray linear dichroism in apatite crystals. J. Am. Chem. Soc. 2018, 37, 11698–11704. [Google Scholar] [CrossRef] [Green Version]
  41. Cabaret, D.; Bordage, A.; Juhin, A.; Arfaoui, M.; Gaudry, E. First-principles calculations of X-ray absorption spectra at the K-edge of 3d transition metals: An electronic structure analysis of the pre-edge. Phys. Chem. Chem. Phys. 2010, 12, 5619–5633. [Google Scholar] [CrossRef] [Green Version]
  42. Cabaret, D.; Joly, Y.; Renevier, H.; Natoli, C.R. Pre-edge structure analysis of Ti K-edge polarized X-ray absorption spectra in TiO2 by full-potential XANES calculations. J. Synchrotron Radiat. 1999, 6, 258–260. [Google Scholar] [CrossRef] [Green Version]
  43. Rossi, T.C.; Grolimund, D.; Nachtegaal, M.; Cannelli, O.; Mancini, G.F.; Bacellar, C.; Kinsche, D.; Rouxel, J.R.; Ohannessian, N.; Pergolesi, D.; et al. X-ray absorption linear dichroism at the Ti K edge of anatase TiO2 single crystals. Phys. Rev. B Condens. Matter Mater. Phys. 2019, 100, 245207. [Google Scholar] [CrossRef] [Green Version]
  44. Rossi, T.C.; Grolimund, D.; Cannelli, O.; Mancini, G.F.; Bacellar, C.; Kinschel, D.; Rouxel, J.R.; Chergui, M. X-ray absorption linear dichroism at the Ti K-edge of rutile (001) TiO2 single crystal. J. Synchrotron Radiat. 2020, 27, 425–435. [Google Scholar] [CrossRef]
  45. Knebel, G.; Aoki, D.; Lapertot, G.; Salce, B.; Flouquet, J.; Kawai, T.; Muranaka, H.; Settai, R.; Ônuki, Y. High Pressure Phase Diagram of the Non-centrosymmetric Antiferromagnet CeCoGe3. J. Phys. Soc. Jpn. 2009, 78, 074714. [Google Scholar] [CrossRef]
  46. Méasson, M.; Muranaka, H.; Kawai, T.; Ota, Y.; Sugiyama, K.; Hagiwara, M.; Kindo, K.; Takeuchi, T.; Shimizu, K.; Honda, F.; et al. Magnetic properties of RCoGe3 (R: Ce, Pr, and Nd) and strong anisotropy of the upper critical field in non-centrosymmetric compound CeCoGe3. J. Phys. Soc. Jpn. 2009, 78, 124713. [Google Scholar] [CrossRef]
  47. Knebel, G.; Aoki, D.; Flouquet, J. Antiferromagnetism and superconductivity in cerium based heavy-fermion compounds. C. R. Phys. 2011, 12, 542–566. [Google Scholar] [CrossRef] [Green Version]
  48. Oreshko, A.P.; Ovchinnikova, E.N.; Rogalev, A.; Wilhelm, F.; Mill, B.V.; Dmitrienko, V.E. X-ray natural circular dichroism in langasite crystal. J. Synchrotron Radiat. 2018, 25, 222–231. [Google Scholar] [CrossRef] [PubMed]
  49. Ovchinnikova, E.N.; Rogalev, A.; Wilhelm, F.; Kozlovskaya, K.A.; Oreshko, A.P.; Dmitrienko, V.E. X-ray natural circular dichroism in copper metaborate. J. Exp. Theor. Phys. 2016, 123, 27–32. [Google Scholar] [CrossRef]
  50. Beutier, G.; Collins, S.P.; Dmitrienko, V.E.; Lorenzo, J.E.; Hodeau, J.-L.; Kirfel, A.; Joly, Y.; Antonenko, A.A.; Sarkisyan, V.A.; Bombardi, A. Interplay of inequivalent atomic positions in resonant X-ray diffraction of Fe3BO6. J. Phys. Condens. Matter 2009, 21, 265402. [Google Scholar] [CrossRef] [PubMed]
  51. Goulon, J.; Goulon-Jinet, C.; Cortes, R.; Dubois, J.M. On experimental attenuation factors of the amplitude of the EXAFS oscillations in absorption, reflectivity and luminescence measurements. J. Phys. 1982, 43, 539–548. [Google Scholar] [CrossRef]
  52. Pfalzer, P.; Urbach, J.-P.; Klemm, M.; denBoer, M.L.; Frenkel, A.I.; Kirkland, J.P. Elimination of self-absorption in fluorescence hard-x-ray absorption. Phys. Rev. B Condens. Matter Mater. 1999, 60, 9335–9339. [Google Scholar] [CrossRef] [Green Version]
  53. Booth, C.H.; Bridges, F. Absorption correction for fluorescence measurements of extended x-ray absorption fine-structure. Phys. Scr. 2005, T115, 202–204. [Google Scholar] [CrossRef] [Green Version]
  54. Abe, H.; Aquilanti, G.; Boada, R.; Bunker, B.; Glatzel, P.; Nachtegaal, M.; Pascarelli, S. Improving the quality of XAFS data. J. Synchrotron Radiat. 2018, 25, 972–980. [Google Scholar] [CrossRef]
  55. Smidman, M.; Adroja, D.T.; Hillier, A.D.; Chapon, L.C.; Taylor, J.W.; Anand, V.K.; Singh, R.P.; Lees, M.R.; Goremychkin, E.A.; Koza, M.M.; et al. Neutron scattering and muon spin relaxation measurements of the noncentrosymmetric antiferromagnet CeCoGe3. Phys. Rev. B Condens. Matter Mater. Phys. 2013, 88, 134416. [Google Scholar] [CrossRef] [Green Version]
  56. Hahn, T.H. (Ed.) International Tables for Crystallography; Springer: Berlin/Heidelberg, Germany, 2005; Volume 1. [Google Scholar]
  57. Landau, L.D.; Lifshitz, E.M. Electrodynamics of Continuios Media, 2nd ed.; Eslevier Ltd.: Amsterdam, The Netherlands, 1984. [Google Scholar]
  58. Carra, P.; Benoist, R. X-ray natural circular dichroism. Phys. Rev. B Condens. Matter Mater. Phys. 2000, 62, R7703(R). [Google Scholar] [CrossRef] [Green Version]
  59. Schnohr, C.S.; Ridgway, M.C. Introduction to X-Ray Absorption Spectroscopy. In X-ray Absorption Spectroscopy of Semiconductors; Schnohr, C., Ridgway, M., Eds.; Springer Series in Optical Sciences; Springer: Berlin/Heidelberg, Germany, 2015; Volume 190. [Google Scholar] [CrossRef]
  60. Blume, M. Magnetic Effects in Anomalous Dispersion. In Resonant Anomalous Xray Scattering; Materlik, G., Ed.; Elsevier: Amsterdam, The Netherlands, 1994; p. 495. [Google Scholar]
  61. Joly, Y.; Grenier, S. Theory of X-ray Absorption Near Edge Structure. In X-ray Absorption and X-ray Emission Spectroscopy: Theory and Applications; van Bokhoven, J.A., Lamberti, C., Eds.; Wiley and Sons: Hoboken, NJ, USA, 2016; Chapter 4. [Google Scholar]
  62. Joly, Y. X-ray absorption near edge structure calculation beyond the muffin-tin approximation. Phys. Rev. B Condens. Matter Mater. Phys. 2001, 63, 125120. [Google Scholar] [CrossRef]
  63. Joly, Y.; Bunău, O.; Lorenzo, J.E.; Galéra, R.M.; Grenier, S.; Thompson, B. Self-consistency, spin-orbit and other advances in the FDMNES code to simulate XANES and RXD experiments. J. Phys. Conf. Ser. 2009, 190, 012007. [Google Scholar] [CrossRef]
  64. Joly, Y. The FDMNES Project. Available online: http://fdmnes.neel.cnrs.fr/ (accessed on 12 May 2021).
  65. Henke, B.L.; Lee, P.; Tanaka, T.J.; Shimabukuro, R.L.; Fujikawa, B.K. Low-energy x-ray interaction coefficients: Photoabsorption, scattering, and reflection, E = 100 − 2000 eV, Z = 1 − 94. At. Data Nucl. Data Tables 1982, 27, 1–144. [Google Scholar] [CrossRef]
  66. Sadovnichy, V.; Tikhonravov, A.; Voevodin, V.; Opanasenko, V. “Lomonosov”: Supercomputing at Moskow State University. In Contemporary High Performance Computing; Vetter, J., Ed.; CRC Press: Boca Raton, FL, USA, 2013; pp. 283–307. [Google Scholar]
Figure 1. CeCoGe3 crystal structure and coordination polyhedra surrounding atoms.
Crystals 11 00544 g001
Figure 2. Illustration of the directions of polarization vectors relative to the crystal axes in an experiment to measure X-ray linear dichroism in a crystal CeCoGe3.
Crystals 11 00544 g002
Figure 3. Black dots are the experimental fluorescence spectrum If(E) due to excitation of the 1s Ge level, blue dots are the absorption spectrum obtained after correction to the self-absorption effect and the linear dichroism spectrum. Red lines are the resonance part. The inset shows the dependence of the full width of the electron–hole statе Г(E) on energy used in the calculations. Eedge = 11,113.8 eV.
Crystals 11 00544 g003
Figure 4. (a) Calculated X-ray absorption spectra of Ge atoms in positions 2(a) (blue line), 4(b) (red line) and their sum (black line); (b) Linear dichroism spectra corresponding to two nonequivalent Wyckoff positions of Ge atoms. Blue line-linear dichroism corresponding to Ge atoms at position 2(a), red line-Ge at position 4(b), black line-their sum. Eedge = 11,113.8 eV.
Crystals 11 00544 g004
Figure 5. (a) Energy dependence of the coefficients describing the isotropic and anisotropic parts of the absorption coefficients of Ge atoms in two Wyckoff positions (calculated). (b) Difference between the pz and px DOS for the 2(a) position of Ge and pz and in-plane p DOS for the 4(b) position of Ge. Eedge = 11,113.8 eV.
Crystals 11 00544 g005
Figure 6. (a) Isotropic and anisotropic resonant contributions to the X-ray absorption cross section close to the Co K-edges. Points—the results obtained from experimental data; red lines—the results of calculations in the dipole approximation, blue line–an isotropic part of the cross section due to the quadrupole transition. The inset shows the dependence of the full width of the electron–hole state Γ(E) on energy used in the calculations. (b) XNLD close to the Co K-edge in comparison with the difference of the density of the px,y and pz electronic states in CeCoGe3. Eedge = 7709 eV.
Crystals 11 00544 g006
Figure 7. (а) Experimental absorption and linear dichroism spectra of L2, L3 Ce edges (reduced to the same energy scale). (b) XNLD close to the Ce L2-edge in comparison with the difference of the density of the t2g and eg electronic states in CeCoGe3. Eedge(L2) = 6164 eV.
Crystals 11 00544 g007
Figure 8. (a) Isotropic and anisotropic resonant contributions to the X-ray absorption cross section near L2 absorption edge of Ce (points are coefficients obtained from experimental data, red lines—calculation), as well as the isotropic quadrupole contribution to the absorption cross section (blue line). The inset shows the dependence of the total width of the excited state on energy used in the calculations. (b) Isotropic and anisotropic resonant contributions to the X-ray absorption cross section near L3 absorption edge of Ce (points are coefficients obtained from experimental data, red lines—calculation), as well as the isotropic quadrupole contribution to the absorption cross section (blue line). The inset shows the dependence of the full width of the electron–hole state Γ(E) on energy used in the calculations. Eedge(L2) = 6164 eV, Eedge(L3) = 5723 eV.
Crystals 11 00544 g008
Publisher’s Note: MDPI stays neutral with regard to jurisdictional claims in published maps and institutional affiliations.

