
Study on Microstructure and Properties of 12Ag–Cu–Zn–Sn Cadmium-Free Filler Metals with Trace In Addition


1
College of Materials Science and Technology, Nanjing University of Aeronautics and Astronautics, Nanjing 210016, China
2
State Key Laboratory of Advanced Brazing Filler Metals and Technology, Zhengzhou Research Institute of Mechanical Engineering, Zhengzhou 450001, China
*
Author to whom correspondence should be addressed.
Crystals 2021, 11(5), 557; https://0-doi-org.brum.beds.ac.uk/10.3390/cryst11050557
Submission received: 15 April 2021
/
Revised: 7 May 2021
/
Accepted: 14 May 2021
/
Published: 16 May 2021
(This article belongs to the Special Issue Advances of Welding Materials)
Abstract
:The effect of different In contents on the melting characteristics, mechanical properties, and microstructure of 12Ag–Cu–Zn–Sn filler metal was investigated in this paper, and flame brazing of 304 stainless steel and copper plates was done using the 12Ag–Cu–Zn–Sn–xIn filler metal. The results indicate that adding appropriate amount of In can evidently decrease the solidus and liquidus temperatures and improve the wettability of the low silver based filler metals. In addition, the shear strength of 304 stainless steel and copper plates joint brazed by 12Ag–Cu–Zn–Sn–1In are satisfactory due to the solution strength effect, and scanning electron microscopy examination of the braze-zone revealed that more relatively sound joints were obtained when brazing was done with 12Ag–Cu–Zn–Sn–xIn filler metal than with Indium free one; its performance is comparable to that of the joint brazed with the 20Ag–Cu–Zn–Sn filler metal, having a remarkable silver-saving effect.
1. Introduction
Silver brazing filler metals are well known as one of the most suitable filler materials for joining copper, mild steel, stainless steel, and other alloys due to its virtue of the high strength, thermal conductivity, electrical conductivity, oxidation resistance, and suitable melting point [1,2]. Among a number of silver-based brazing filler metals, Cd-containing filler metals with silver content of 20–45% are extensively used for brazing high-precision joints of austenitic stainless steel and copper. However, due to the toxicity of cadmium vapors to humans during brazing, the electrical equipment industries in most countries have to comply with the directives of restricting the use of cadmium in electrical and electronic equipment [3]. In addition, as silver has the dual attributes of industrial products and financial products, its price is easily affected by the international political and economic situation and macroeconomic policies, which makes the price of high-silver brazing filler metals extremely expensive and fluctuating. Therefore, developing novel low-silver cadmium-free brazing filler metals, and making the performance meet the market demand as much as possible, has aroused extensive interest.
Compared with Cd-containing brazing filler metals with silver content of 20–45%, low-silver cadmium-free Ag–Cu–Zn–Sn series alloys show slightly higher melting point, large melting range, poor wettability, and weldability [4], which are major restricts in promoting the use of low-silver cadmium-free Ag–Cu–Zn–Sn brazing filler metals in the aerospace, power electronic, and household appliances industry. Ma [5,6] has reported that the addition of Ga and Ce can optimize the thermal and mechanical properties of 17Ag–Cu–Zn–Sn filler metal; nevertheless, the content of Ag in 17Ag–Cu–Zn–Sn filler metal is still high. Meanwhile, the high price of Ga restricts further application of the novel brazing filler metal.
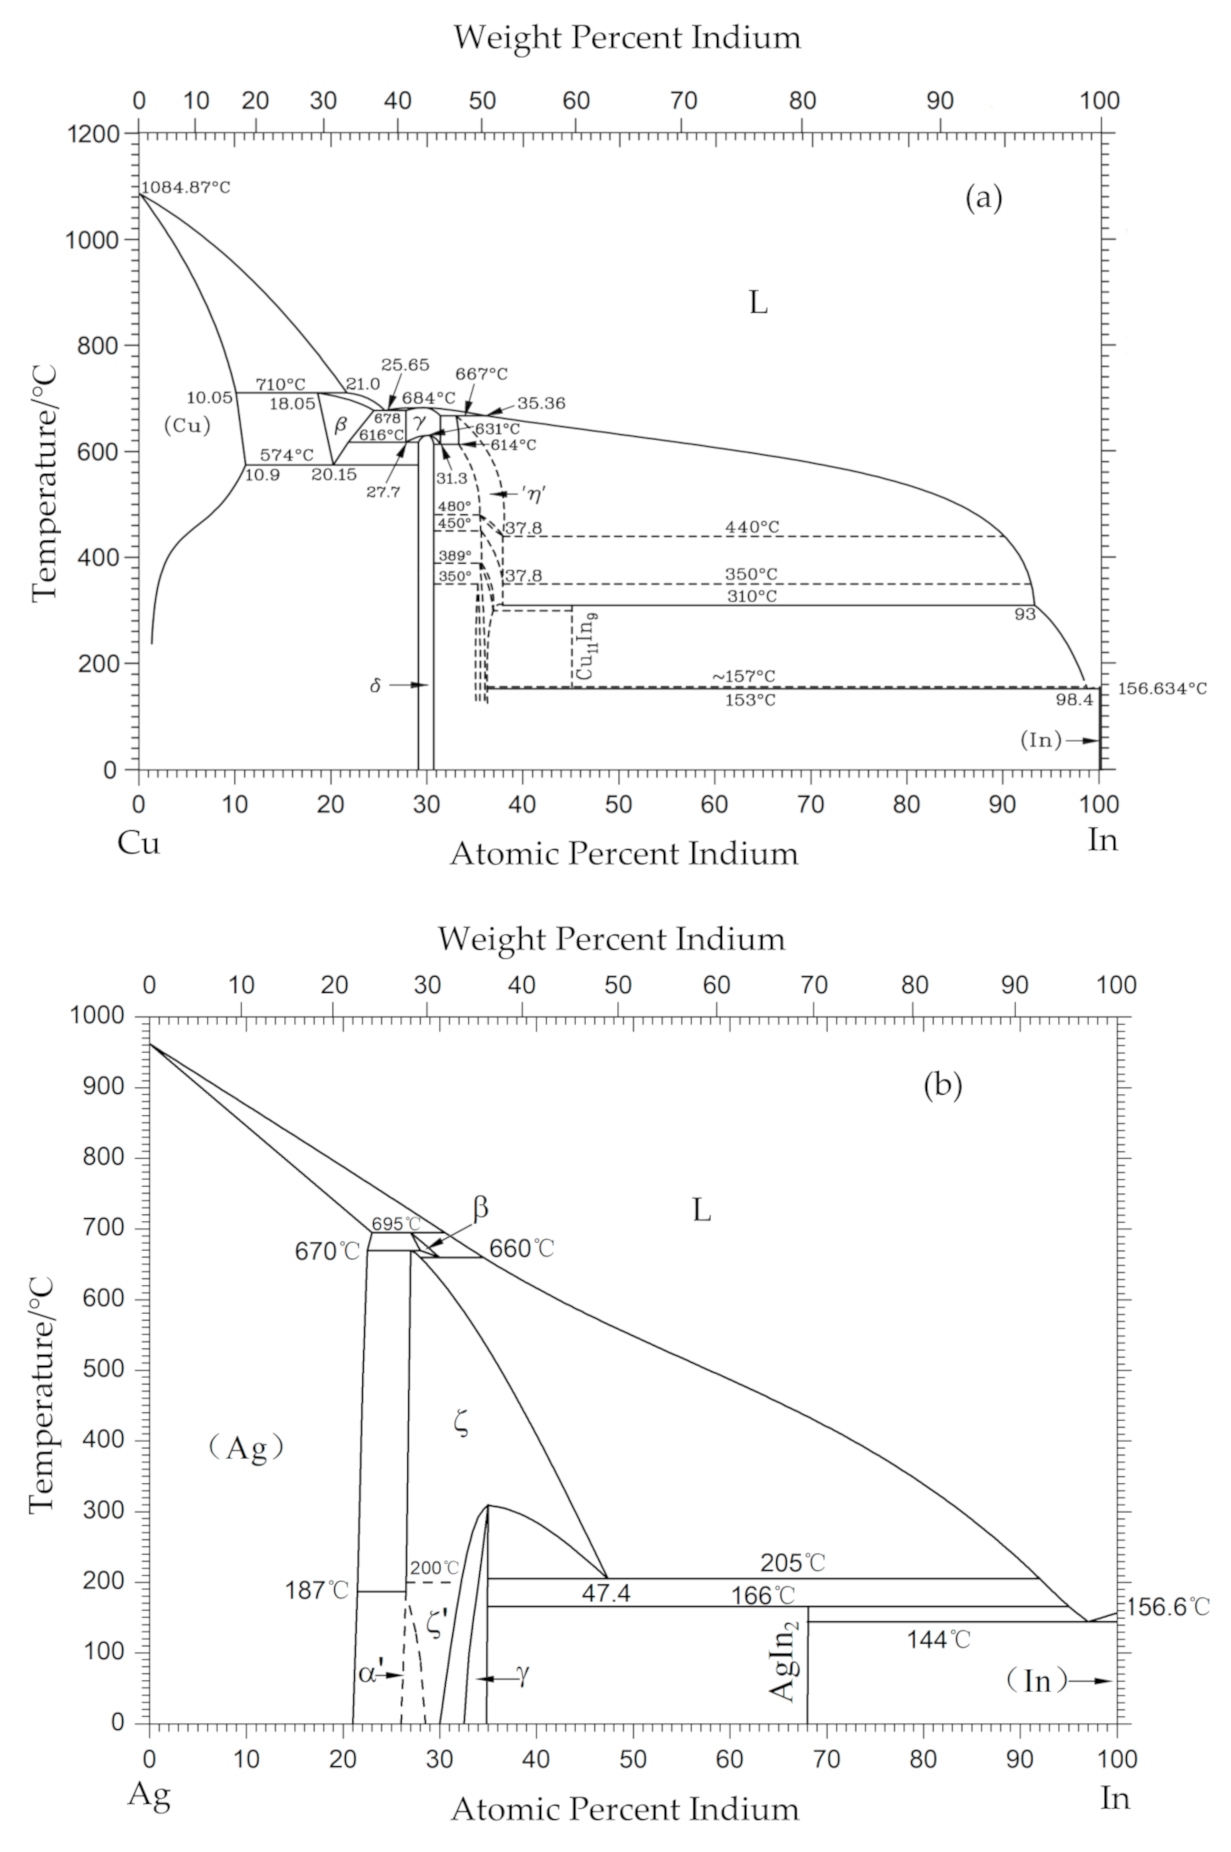
In produces twice as much annually as Ga and the price is relatively lower. When the In content of 30Ag–Cu–Zn–In filler metal is from 0 to 3%, the solidus temperature (Ts) and liquidus temperature (Tl) of 30Ag–Cu–Zn filler metal decrease from 690 to 652 °C and from 770 to 710 °C, respectively [7]. The distinct decrease of both Ts and Tl of the filler metal is mainly attributed to the fact that the melting point of In is only 156.61 °C, as shown in Figure 1; appropriate amounts of indium can dissolve in copper and silver to form silver-based and copper-based solid solutions with lower melting points [8].
The aim of this study lies in the investigation of the effect of In on the melting characteristics, wettability of low-silver cadmium-free 12Ag–Cu–Zn–Sn filler metal, and strength of the brazed joints. Copper and 304 stainless steel were used as materials to be brazed. Furthermore, the microstructures and fracture morphology of the brazed joints were investigated.
2. Materials and Methods
Melting of pilot alloys of Ag–Cu–Zn–Sn–xIn(x = 0, 0.5, 1, 2, 3, 5) system under laboratory conditions was carried out by medium frequency furnace (frequency 600 Hz, power 110 kW) with double-coil inductor, and then the molten alloys were poured into a steel mould to get cast ingots, all the cast ingots were fabricated into wires with 1.9 mm in diameter for brazing. The In contents of novel brazing alloys used in present study was analyzed by the inductively coupled plasma emission spectrometer (ICPAES) and the chemical composition is listed in Table 1. Differential Scanning Calorimeter (DSC) of Netzsch STA 449F was used to determine the solidus and liquidus temperatures of the filler metals, the heating rate and nitrogen flow rate were 10 °C/min and 200 mL/min, respectively.
The test plates of 304 stainless steel (austenitic stainless steel) and commercial pure copper used in the present study were processed specimens with dimensions of 40 mm × 40 mm × 2 mm for performance of experiments on spreading, and 60 mm × 25 mm × 3 mm for performance of experiments on shearing. The spreading test was carried out according to China’s National Standard GB/T 11364-2008 [10]. The silver filler metal (0.2 g) was placed on surface of the specimen covered with FB102 (42% of KF, 25% of KBF4, 35% of B2O3), which was heated at 850 °C for 1 min in an electrical resistance furnace. The results of processing of spreading area were obtained from Image-Pro Plus program.
Automatic oxy-acetylene torch was used in present experiment, the gas was controlled by the flow meter and the heating time was controlled by an automatic welding dolly. Prior to brazing, all the specimens and filler metals were degreased in acetone and ground by SiC paper, then cleaned in alcohol and dried. The strength of brazed joints with an overlap length of 2 mm were tested on an electronic universal testing machine according to the China’s National Standard GB/T 11363-2008 [11].
To ensure the accuracy and reliability of the results, all tests were done five times under the same condition.
The brazing alloys and joints interface layer specimen were etched about 7–8 s with a solution of ((NH4)2S2O8 (15 g) + H2O (100 mL) + NH3·H2O (2 mL)) after grinding and polishing. The microstructure and phase composition of the brazing alloys and joints interfaces were characterized employing scanning electron microscopy (SEM) with electron probe X-ray microanalysis (EPMA).
3. Results
3.1. Melting Characteristics of 12Ag–Cu–Zn–Sn–xIn Filler Metals
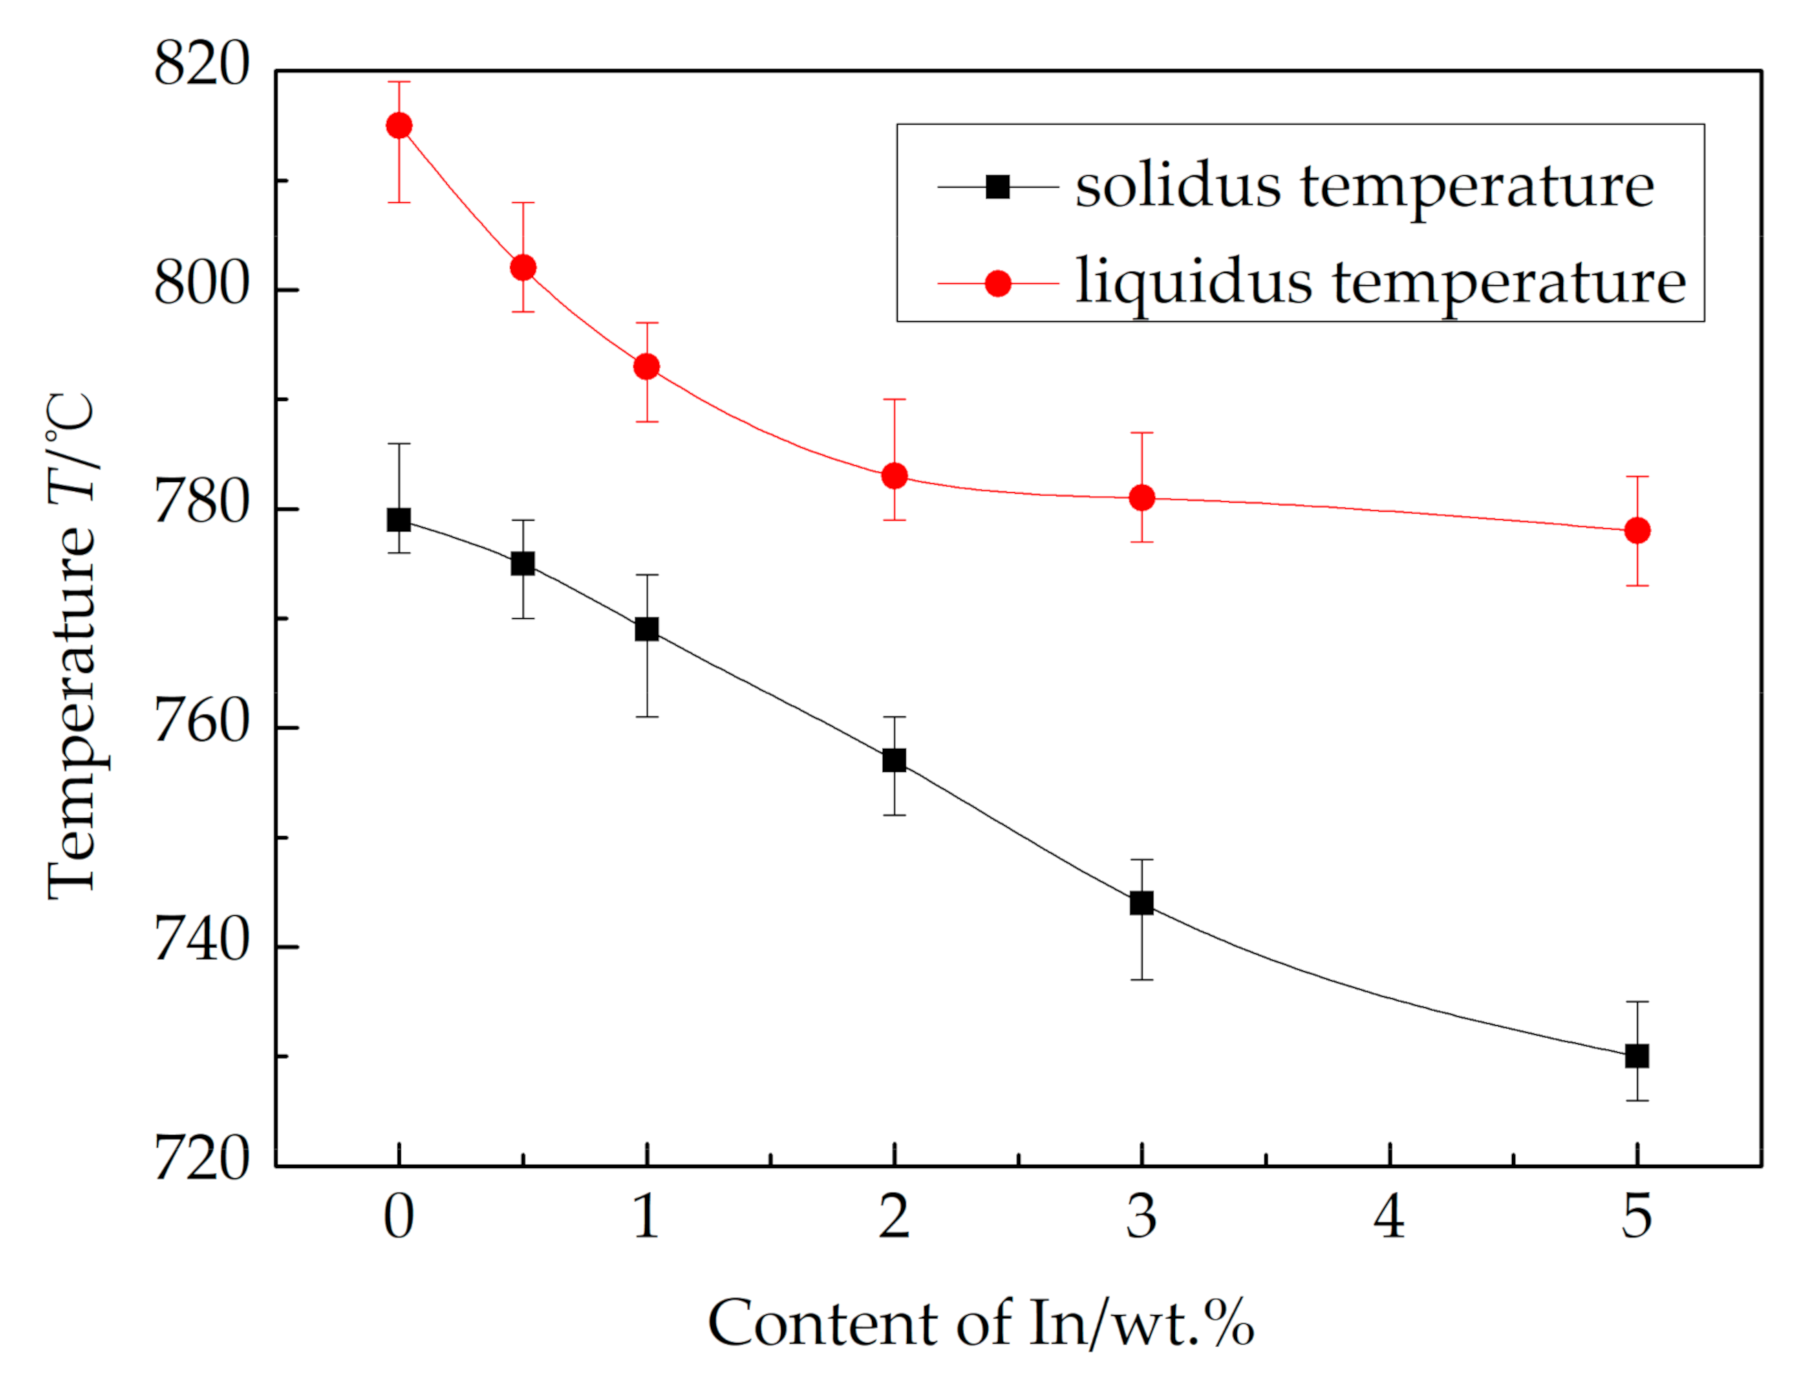
Figure 2 shows the melting characteristics of 12Ag–Cu–Zn–Sn–xIn filler metals, the results show that the liquidus temperature (Tl) and solidus temperature (Ts) of the alloys decrease upon increase of the In content. Compared with the 12Ag–Cu–Zn–Sn, the Tl and Ts of 12Ag–Cu–Zn–Sn–2In filler metal are decreased by 32 and 22 °C, respectively. Moreover, the melting range (∆T) also decreased from 36 to 25 °C. The remarkably decrease of melting points of the alloys compared to that of 12Ag–Cu–Zn–Sn filler metal can effectively avoid the over-burning of the base metal during the brazing process and increase the connection strength of the brazing joint. With the continuous increase of In content, the decreasing trend of Tl of the alloys tends to be gentle gradually, and ∆T also starts to increase. The increase of the melting range of filler metal can easily lead to defects such as microstructure segregation, poor fluidity, and oxide residue during brazing process, which will worsen the wettability of filler metal and the mechanical properties of brazing joints [12].
3.2. Wettability of 12Ag–Cu–Zn–Sn–xIn Filler Metals
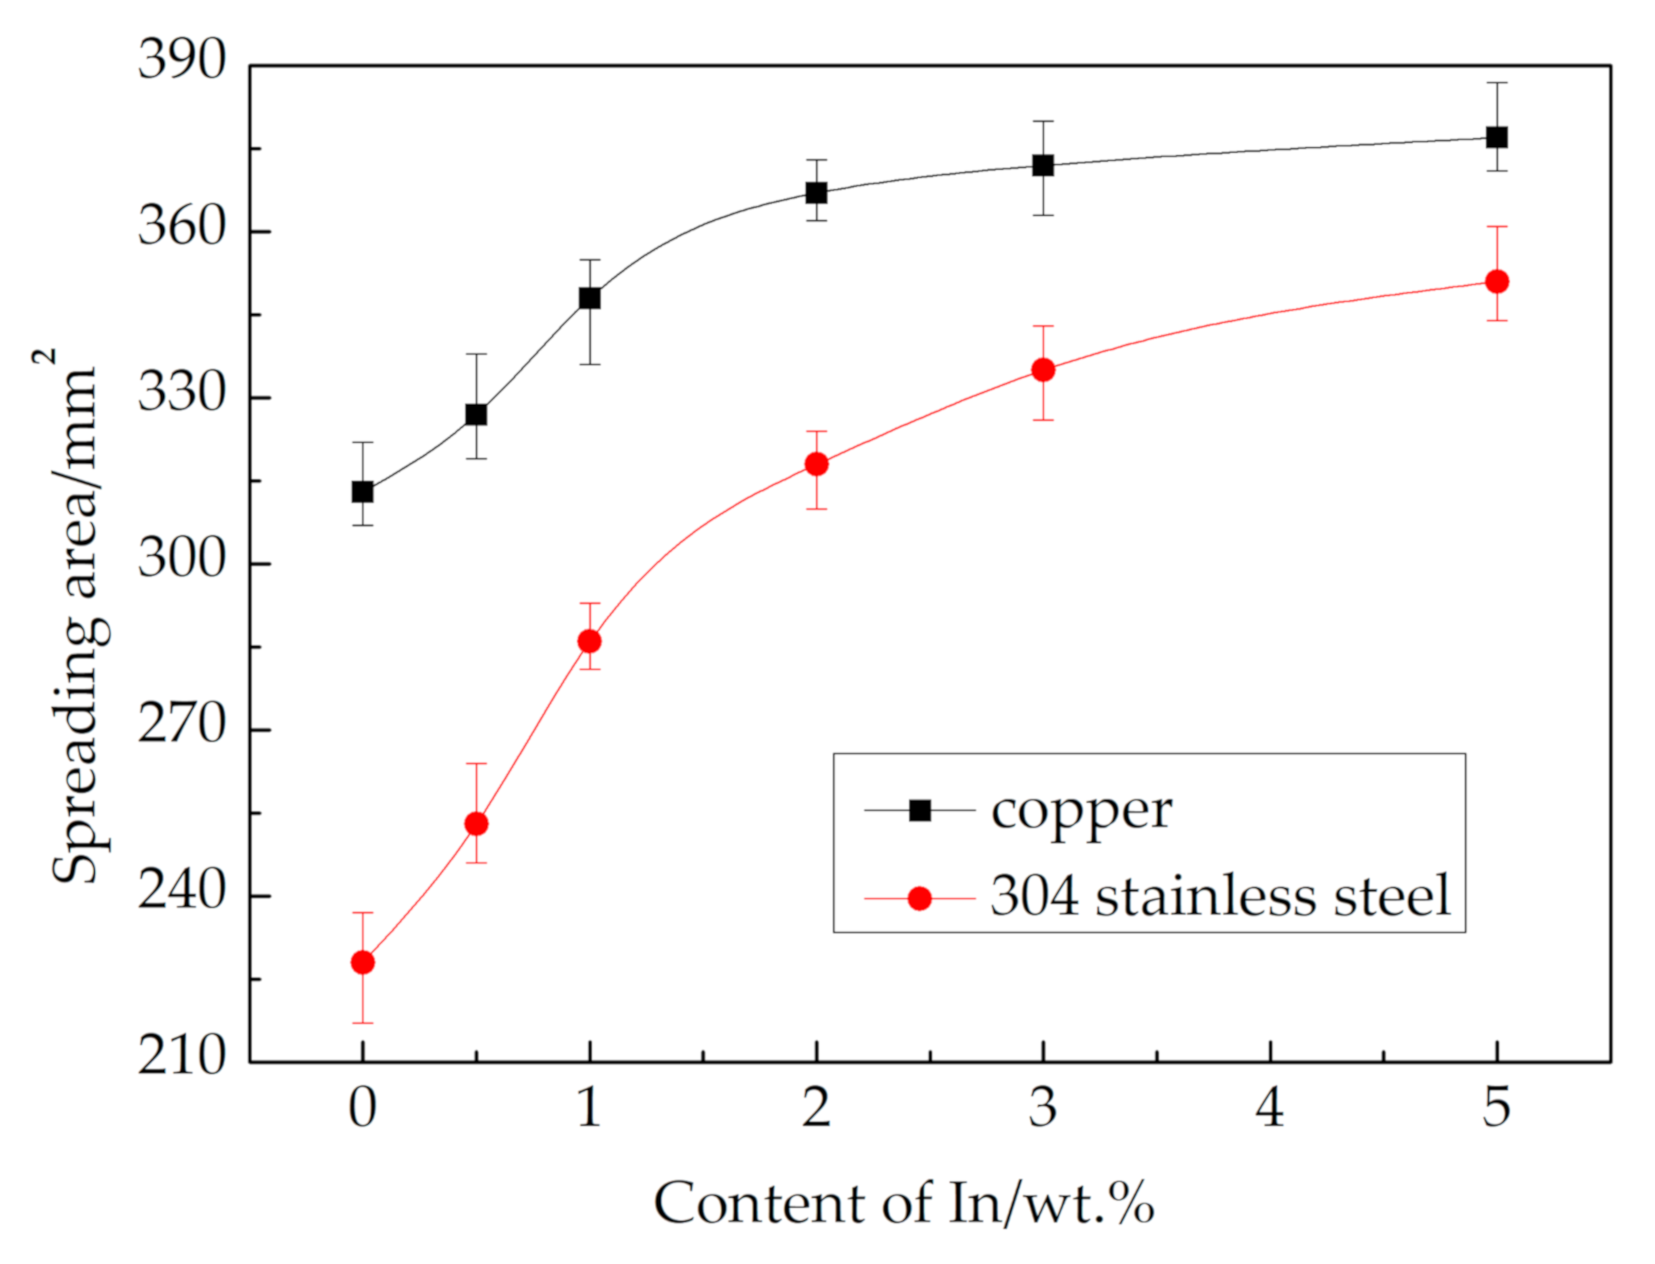
Wettability refer to the ability or tendency of a liquid to spread on a solid surface, the greater the spreading area of the brazing filler metal on the substrate, the better the wettability [13]. Figure 3 shows the spreading test results of 12Ag–Cu–Zn–Sn–xIn alloys on copper and 304 stainless steel plates at the temperature of 850 °C. As shown in Figure 3, 12Ag–Cu–Zn–Sn exhibited excellent spreading area on copper substrates, but a poor spreading area on 304 stainless steel substrates, which can be ascribed to the passive film of nickel oxide and chromium oxide produced on the surface of 304 stainless steel [14].
It can be seen that the wettability of 12Ag–Cu–Zn–Sn–xIn filler metals improved with the increase of In content. The spreading area of 12Ag–Cu–Zn–Sn–2In reached 367 mm2 on copper and 318 mm2 on 304 stainless steel, demonstrates a 17% and 39% increase compared with that of 12Ag–Cu–Zn–Sn, respectively. Notably, the addition of In greatly improves the wettability of the brazing filler metals to 304 stainless steel. Moreover, the spreading area of the brazing filler metal on the substrate is not increased obviously if the addition amount of In exceeds 2%, combining the results of Figure 2 and Figure 3, which showed that the decrease of the liquidus temperature may be the main reason for improving the spreading area of the braze filler. Lai [15] found that the fluidity of braze filler is related to its melting temperature. At the same brazing temperature, the lower the melting temperature of the braze filler, the greater the superheat, the atoms inside the liquid alloy are less attractive to the atoms on the surface, which increases the spreading area of the braze filler on the surface of the base metal.
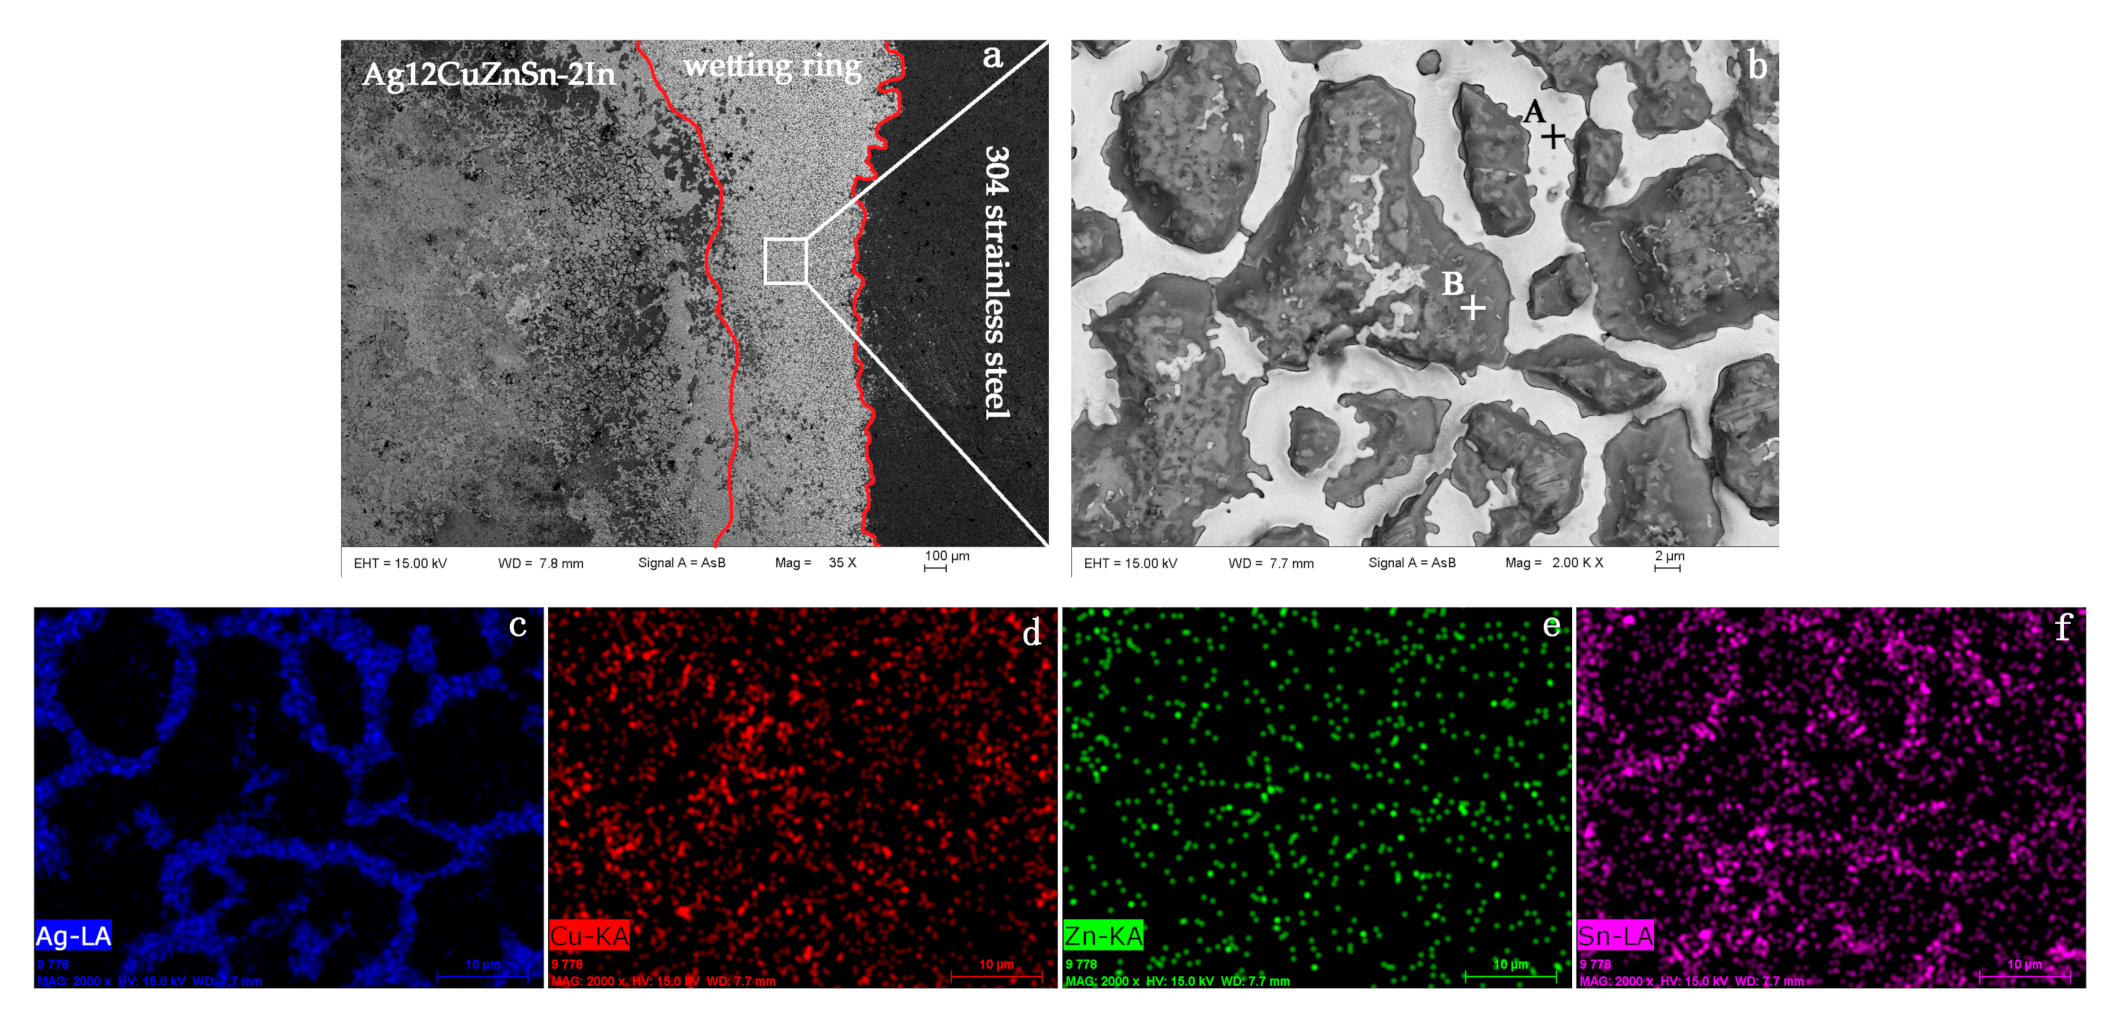
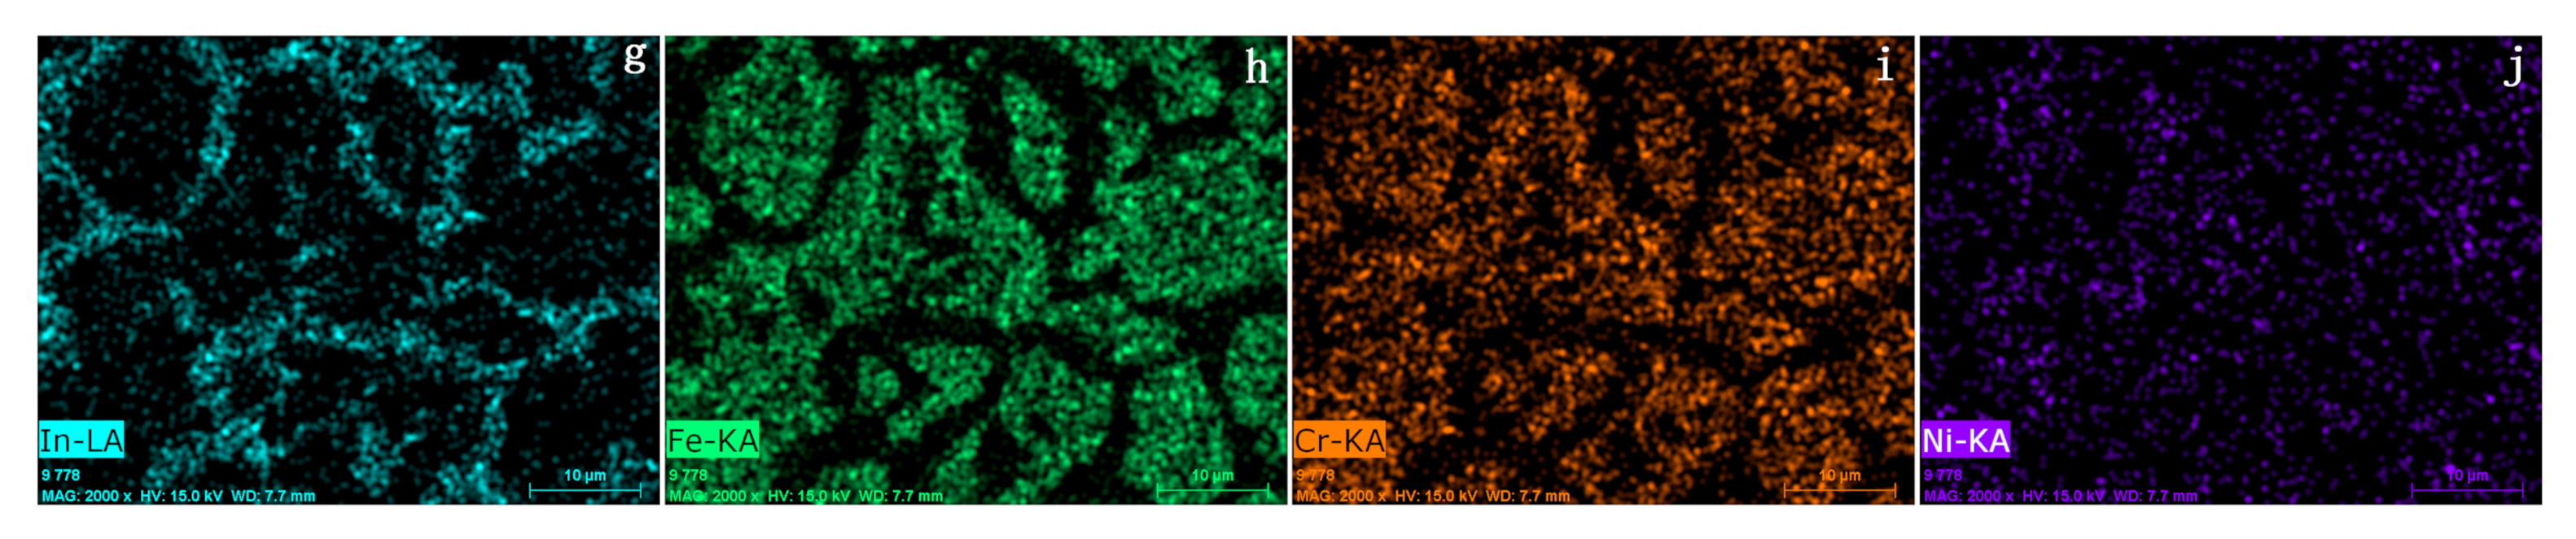
The high magnification SEM microstructures and the elements mappings of the substrate surface after the spreading test on 304 stainless steel using 12Ag–Cu–Zn–Sn–2In are shown in Figure 4, and the EDS of the points indicated in Figure 4 is shown in Table 2. It can be seen obviously that there is a wetting ring on the leading edge of the molten brazing alloy. As shown in Figure 4b, the wetting ring consists of a smooth white phase (named as A region) and a rough gray phase (named as B region). The elements mappings of Ag, In and Sn overlaps with A region, and Fe, Cr and Ni elements correspond to B region, combined with the results of EDS shown in Table 2, it can be concluded that A and B regions were composed of Ag–In–Sn alloy and stainless steel substrate, respectively. The preferentially spreading Ag–In–-Sn phase liquid alloy undergoes the mass transfer action, which reduces the surface tension between the brazing filler metal and the 304 stainless steel plate; that is, the “guide wetting effect” appears, which greatly improves the wetting performance of the brazing filler metal on base metal. Meanwhile, Kogi et al. [16] found that molten alloys containing mainly Ag and In spread preferentially on a Ni base plate, Ag and In, which are both constituents of Ag–Cu–In alloys, affect the wetting-ability of the filler metal.
3.3. Microstructure of 12Ag–Cu–Zn–Sn–xIn Filler Metals
The phase constitution of 12Ag–Cu–Zn–Sn–xIn filler metals was clarified by X-ray diffraction analysis, and Figure 5 shows the XRD patterns. According to the PDF cards and X-ray diffraction analysis, 12Ag–Cu–Zn–Sn–xIn alloys are mainly composed of α–Ag (Ag-based solid solution), α–Cu (Cu-based solid solution), and CuZn compounds phase (mainly β–CuZn and γ–Cu5Zn8 phase), there into, the brittle electron compound γ–Cu5Zn8 deteriorates the mechanical properties of brazing filler metals. As we can see from Figure 5, the diffraction peaks of CuZn compounds phase decrease when the In content of the brazing alloys is 2 wt.%, which is beneficial to the mechanical properties of the substrate [17]. However, the new intermetallic compounds Cu4In and Ag9In4 arose when the In content reaches 5 wt.%.
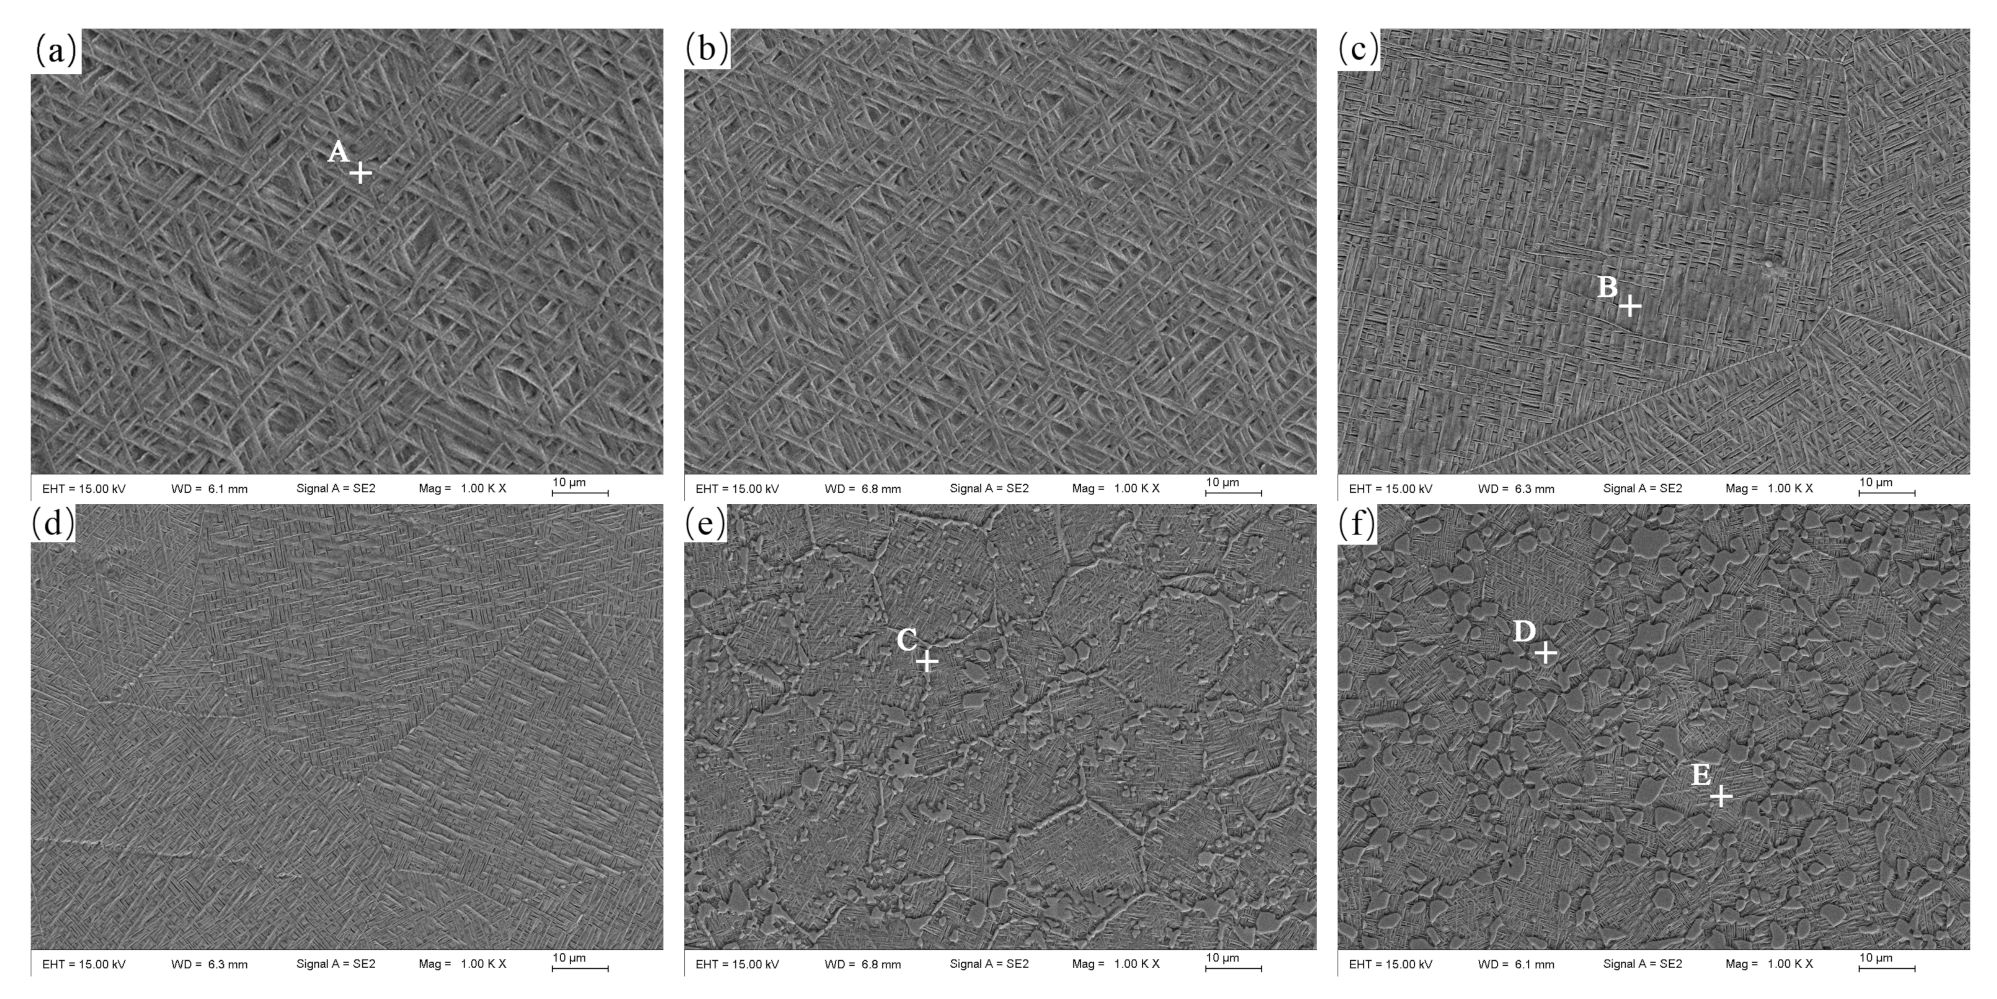
Figure 6 shows the SEM images of 12Ag–Cu–Zn–Sn–xIn filler metals with different contents of In. Ma [18] had studied that 17Ag–Cu–Zn–Sn was mainly comprised of needle-like Ag-based solid solution, bulk Cu-based solid solution, and CuZn compounds. However, for 12Ag–Cu–Zn–Sn braze filler in this paper, the needle-like Ag-based solid solution is clearly visible, but the bulk Cu-based solid solution phase disappear, replaced by a network-like mixed phase. Furthermore, the microstructure of 12Ag–Cu–Zn–Sn–2In filler metal is finer than that of Indium free one. Nevertheless, when the In content was 3 wt.%, some In-rich phases (named as C region) gathered at the grain boundaries. Xue et al. [19] found that Ag would preferentially interact with In to form Ag–In compounds, and then Cu reacts with excess of In to form Cu–In compounds, which indicated that the C region was a mixed phase rich in Ag9In4 intermetallic compounds. As the In quantity in the brazing alloy increases to 5 wt.%, some bulk phases (named as D region) were formed in the matrix. The results of EDS shown in Table 3 and the XRD patterns shown in Figure 5 indicated that the bulk D region was a mixed phase rich in Cu4In and Ag9In4 intermetallic compounds, which may deteriorate the mechanical properties of the brazing alloy. Therefore, the In content in the low-silver filler metal should be controlled within 3 wt.%.
3.4. Microstructure of the Brazing Joints
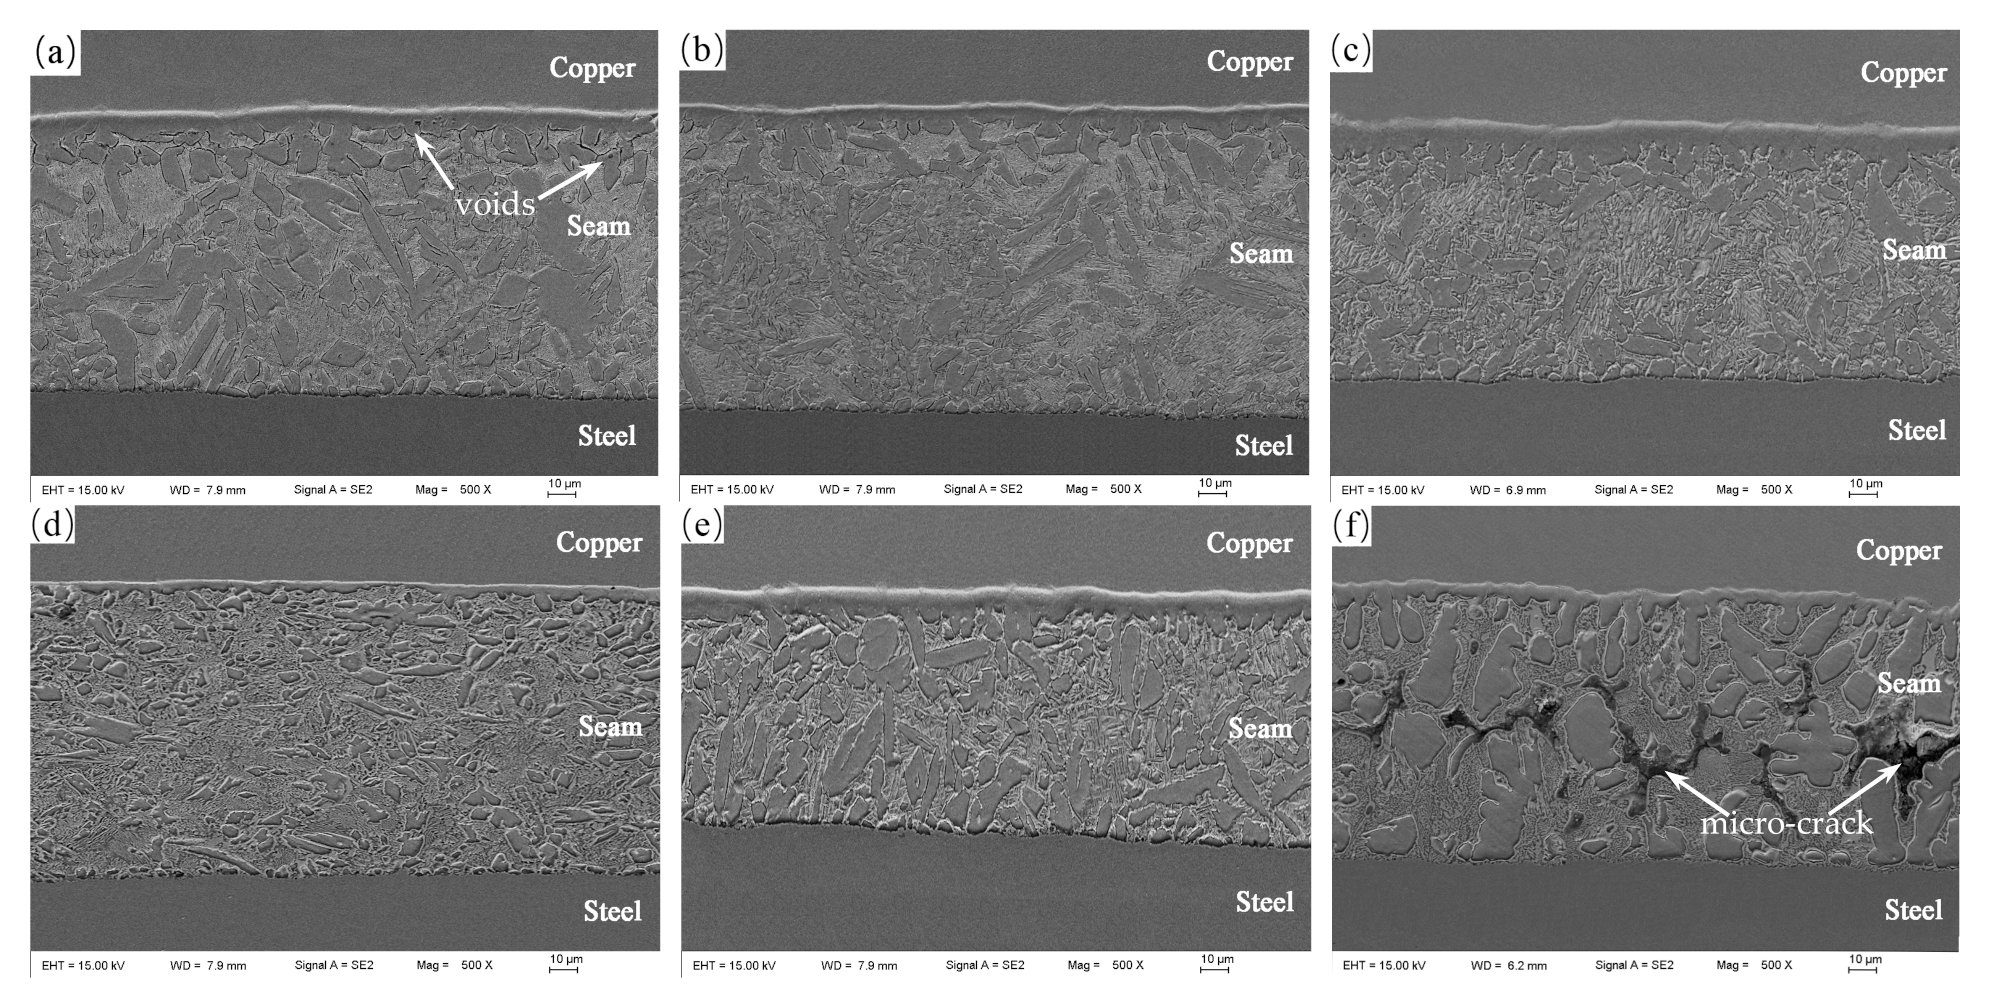
The scanning electron micrographs of copper/304 stainless steel joints with different contents of In are shown in Figure 7, which shows that the microstructure of brazing seam is significantly different. As can be seen, there were some voids in the brazed joint when low-silver 12Ag–Cu–Zn–Sn filler metals were used for brazing copper and 304 stainless steel substrate. With the addition of 0.5 to 2 wt.% In, the voids in the brazing joint disappear; moreover, the size of black bulk phase was finer. However, as the In content of the brazing alloy reaches 5 wt.%, some microcracks were formed in the brazing seam, which will deteriorate the mechanical properties of brazing joint.
In order to further study the brazed interfaces and the microstructure of seam, high magnification SEM micrograph of microstructures of 12Ag–Cu–Zn–Sn–2In brazing joint and the elements mappings of the interface adjoin 304 stainless steel substrate were used, and the test results are shown in Figure 8. The brazing seam is mainly composed of the bulk grey phases (named as B or F region) and network-like white phases (named as C or E region). According to the results of EDS shown in Table 4 and the elements mapping shown in Figure 8c–j, it was indicated that F and E regions were composed of Cu-rich phase and Ag-rich phase, respectively. Similar results were reported by Cao et al. [20] when the intermetallic compounds formation between brass/steel and Ag–Cu–Zn–Sn filler metal was investigated. In addition, it can be clearly seen from the results of EDS that the content of Ag and Zn in the D region is much lower than that in the A region, which indicates that excellent metallurgical bonding is obtained between the novel brazing alloy and the copper substrate.
3.5. Mechanical Property of Brazed Joints
The quality of copper/steel brazing joints was evaluated by tensile test at room temperature. The remarkable thing is that the fracture positions of the specimens all occurred on the copper plate, as shown in Figure 9, which indicated that the seam strength was higher than that of copper substrate, and the copper/steel joints with excellent mechanical properties were obtained.
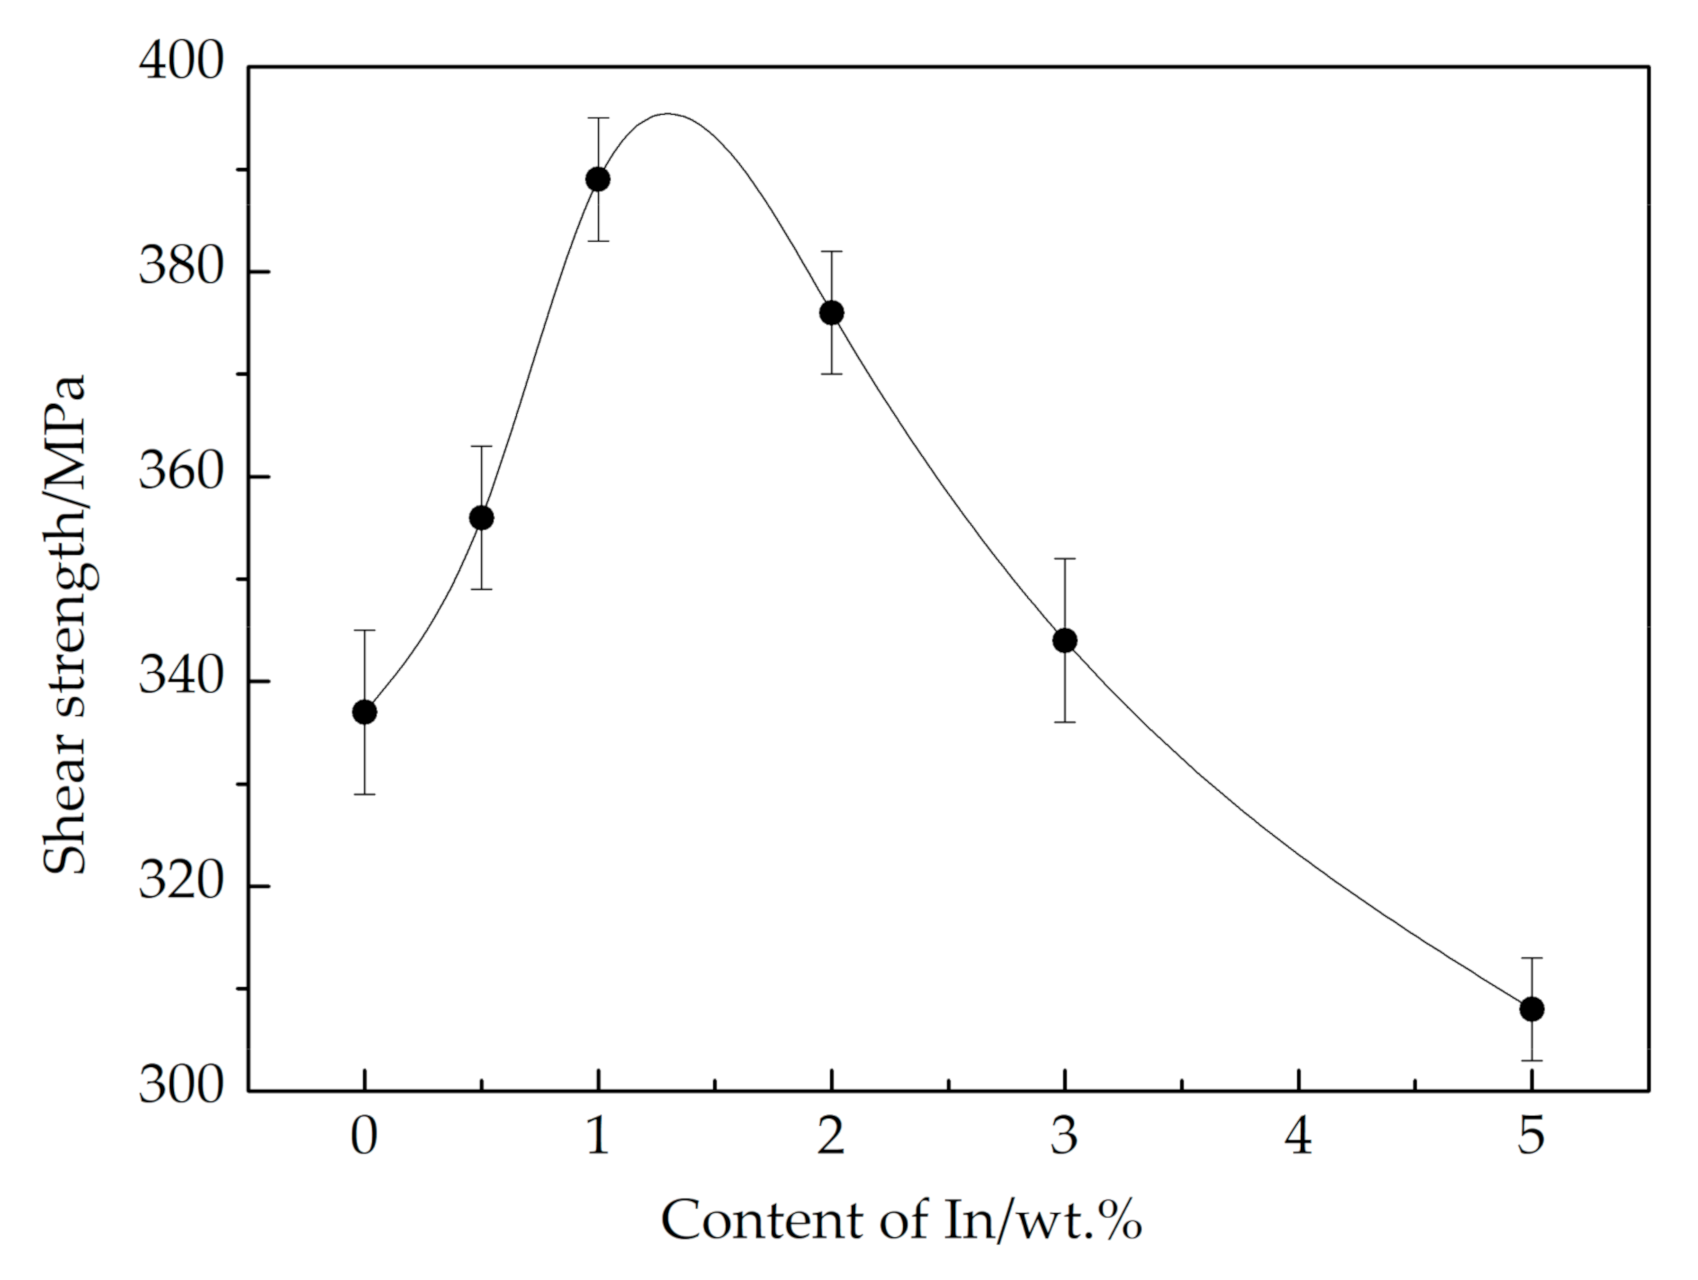
In order to further study the effect of In addition on the mechanical properties of brazed joints, 304 stainless steel to 304 stainless steel lap tests were carried out with 12Ag–Cu–Zn–Sn–xIn brazing filler metals, which found that the fracture occurs in the joints of the brazed specimens in all cases after shear tests; Figure 10 shows the curve of In content on the shear strength of brazing joints. From the results, it was found that the strength of the joints presents a parabolic trend, the peak value of 389.4 MPa was acquired at x = 1, which increases by 15.4% compared to that of 12Ag–Cu–Zn–Sn. However, when the content of In exceeds 2 wt.%, the shear strength decreases. The improvement of shear strength of brazing joints with appropriate amount of In may be explained by the microstructure of brazing alloys, as shown in the Ag–In phase diagram where In could be dissolved into Ag to form silver-based solid solution, and in which the solid solution strengthening may be mainly responsible for the increase of shear strength.
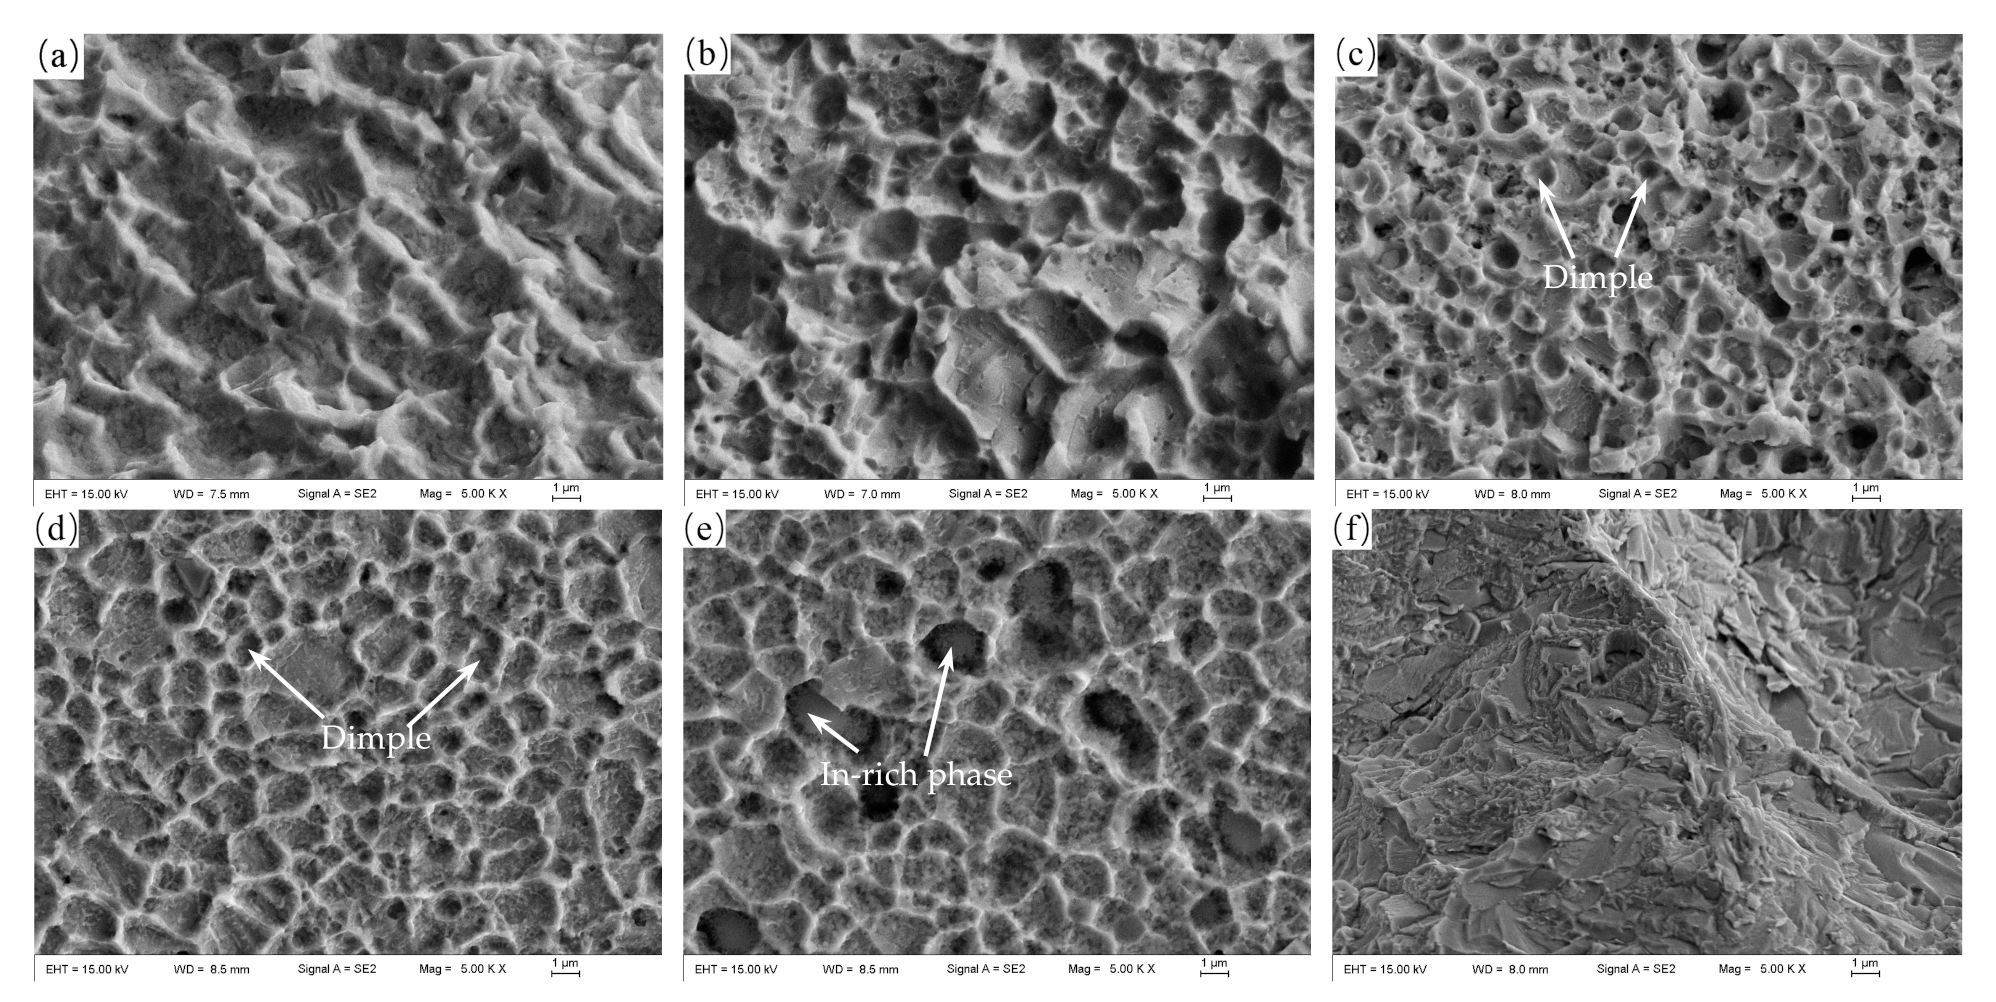
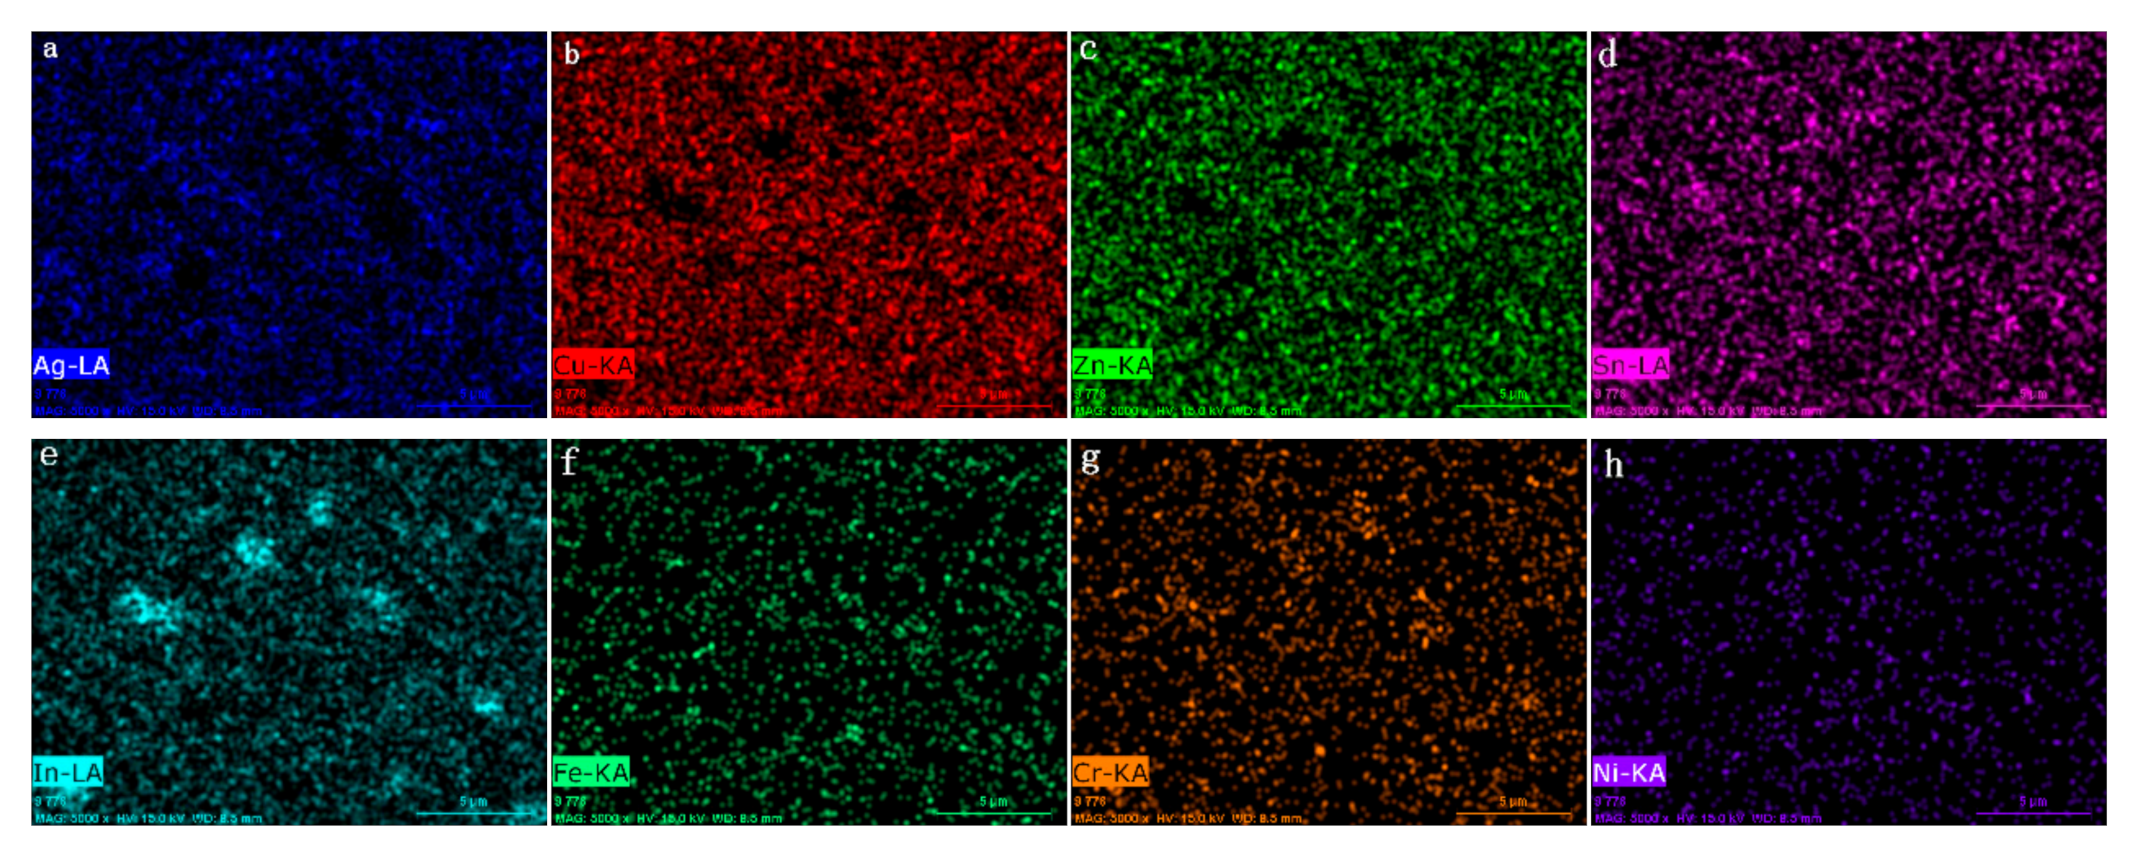
The fracture morphologies of steel/steel joints brazed with 12Ag–Cu–Zn–Sn–xIn filler metals are shown in Figure 11. The results indicated that the fracture morphologies of brazed joints changed significantly with trace In addition. The fracture of joint that was brazed using 12Ag–Cu–Zn–Sn–1In had the typical ductile characteristic with many small dimples, which is beneficial to the mechanical properties of brazed joints [21]. Figure 12 shows the elements mapping of the fracture morphologies of the brazing joint of 12Ag–Cu–Zn–Sn–3In filler metal in Figure 11; as can be seen, the In-rich phase appears in the fracture surface, which may be the stress source when the deformation occurs and deteriorate the mechanical properties of the brazed joint. However, when the 12Ag–Cu–Zn–Sn–5In was employed, the fracture of the joint was different from other structures. It was noted that a step-like structure was observed on the fracture surface, and it was found from the result of shear strength test that the strength of the joint with 12Ag–Cu–Zn–Sn–5In was lower than that of Indium free one.
4. Conclusions
In this work, the melting characteristics, wettability, and microstructure of the novel brazing filler metals were studied. Meanwhile, the shear strength and fracture morphologies of the brazing joints were investigated. The following conclusions could be drawn:
- (1)
- The melting characteristics and wettability of 12Ag–Cu–Zn–Sn–xIn filler metal were improved significantly with appropriate amount of In. Wetting ring was found on the leading edge of the molten brazing alloy on steel plates, which was mainly composed of Ag, In, and Sn.
- (2)
- The network-like structure was found in the alloys with trace In addition, the microstructure of 12Ag–Cu–Zn–Sn–2In filler metal was finer than that of Indium free one. Cu4In and Ag9In4 intermetallic compounds were formed in the matrix of brazing alloy when the content of In reaches 5 wt.%.
- (3)
- The fracture positions of copper/steel brazing joints all occurred on the copper plates. The strength of steel/steel brazing joints presented a parabolic trend with the addition of In, the peak value of 389.4 MPa was achieved using 12Ag–Cu–Zn–Sn–1In.
- (4)
- The fracture micrograph of the joint brazed with 12Ag–Cu–Zn–Sn–1In showed numerous small and uniform dimples, and a step-like structure was observed on the fracture surface when the 12Ag–Cu–Zn–Sn–5In was employed.
Author Contributions
Conceptualization, S.X.; methodology, Z.Y. and W.L.; software, J.W.; validation, J.W.; formal analysis, J.W.; investigation, J.W.; resources, J.W.; data curation, J.W.; writing—original draft preparation, J.W.; writing—review and editing, J.W.; visualization, J.W.; supervision, S.X.; project administration, S.X.; funding acquisition, S.X. All authors have read and agreed to the published version of the manuscript.
Funding
This work was funded by the National Natural Science Foundation of China, Grant No. 51975284 and the Priority Academic Program Development of Jiangsu Higher Education Institutions (PAPD).
Data Availability Statement
The data presented in this study are available on request from the corresponding author.
Acknowledgments
The authors sincerely acknowledge the financial supports by the National Natural Science Foundation of China, Grant No. 51975284, as well as the Priority Academic Program Development of Jiangsu Higher Education Institutions (PAPD).
Conflicts of Interest
The authors declare no conflict of interest.
References
- Winiowski, A.; Rózanski, M. Impact of tin and nickel on the brazing properties of silver filler metals and on the strength of brazed joints made of stainless steels. Arch. Metall. Mater. 2013, 58, 1007–1011. [Google Scholar] [CrossRef] [Green Version]
- Long, W.M.; Zhang, G.X.; Zhang, Q.K. In situ synthesis of high strength Ag brazing filler metals during induction brazing process. Scr. Mater. 2016, 110, 41–43. [Google Scholar] [CrossRef]
- Lu, B.; Xu, C.; Yang, J.X. WEEE flow and mitigating measures in China. Waste Manag. 2008, 28, 1589–1597. [Google Scholar]
- Wierzbicki, L.; Malec, W.; Stobrawa, J.; Cwolek, B.; Ju, B. Studies into new, environmentally friendly Ag-Cu-Zn-Sn brazing alloys of low silver content. Arch. Metall. Mater. 2011, 56, 147–158. [Google Scholar] [CrossRef]
- Ma, C.L.; Xue, S.B.; Wang, B. Study on novel Ag-Cu-Zn-Sn brazing filler metal bearing Ga. J. Alloy. Compd. 2016, 688, 854–862. [Google Scholar] [CrossRef]
- Ma, C.L.; Xue, S.B.; Wang, B.; Wang, J.X.; Hu, A.M. Effect of Ce addition on the microstructure and properties of Ag17CuZnSn filler metal. J. Mater. Eng. Perform. 2017, 26, 3180–3190. [Google Scholar] [CrossRef]
- Lai, Z.M.; Xue, S.B.; Han, X.P.; Gu, L.Y.; Gu, W.H. Study on microstructure and property of brazed joint of AgCuZn-X (Ga, Sn, In, Ni) brazing alloy. Rare Met. Mater. Eng. 2010, 39, 397–400. [Google Scholar]
- Ghosh, A.; Chattopadhyay, A.K. Interfacial reaction and wetting behavior of active Ag-Cu filler alloys on surface of cBN grits and its influence on failure patterns of brazed joint. Int. J. Refract. Met. Hard Mater. 2017, 68, 96–103. [Google Scholar] [CrossRef]
- Murray, J.L. ASM Handbook: Alloy Phase Diagrams; ASM International: Geauga County, OH, USA, 1992. [Google Scholar]
- GB/T 11364-2008. Test Method of Wettability for Brazing Filler Metals; Standardization Administration: Beijing, China, 2008. [Google Scholar]
- GB/T 11363-2008. Test Method of the Strength for Brazed and Soldered Joint; Standardization Administration: Beijing, China, 2008. [Google Scholar]
- Chiang, M.J.; Tsao, L.C.; Lin, W.H. Effects of zinc additions on the microstructure and melting temperatures of Al–Si–Cu filler metals. Mater. Charact. 2002, 48, 341–346. [Google Scholar]
- Yang, W.C.; Li, J.D.; Li, Y.; Feng, J.L.; Wu, J.W. Effect of aluminum addition on the microstructure and properties of non-eutectic Sn-20Bi solder alloys. Materials 2019, 12, 1194. [Google Scholar] [CrossRef] [PubMed] [Green Version]
- Zhu, W.W.; Zhang, H.; Guo, C.H.; Liu, Y.D.; Ran, X. Wetting and brazing characteristic of high nitrogen austenitic stainless steel and 316L austenitic stainless steel by Ag–Cu filler. Vacuum 2019, 166, 97–106. [Google Scholar] [CrossRef]
- Lai, Z.M. Effects of Ga/In and Rare Earth Ce on Microstructures and Properties of Brazed Joint of 30AgCuZn Filler Metal. Ph.D. Thesis, Nanjing University of Aeronautics and Astronautics, Nanjing, China, 2011. [Google Scholar]
- Kogi, S.; Kajiura, T.; Hanada, Y.; Miyazawa, Y. Wetting and spreading behavior of molten brazing filler metallic alloys on metallic substrate. Mater. Sci. Eng. 2014, 61, 1757. [Google Scholar] [CrossRef]
- Zhang, L.; Liu, X.Y.; Huang, H.; Zhan, W. Effects of Ti on microstructure, mechanical properties and biodegradation behavior of Zn-Cu alloy. Mater. Lett. 2019, 244, 119–122. [Google Scholar] [CrossRef]
- Ma, C.L. Effect of Ga and Ce on the Microstructure and Properties of Ag17CuZnSn Filler Metals. Ph.D. Thesis, Nanjing University of Aeronautics and Astronautics, Nanjing, China, 2017. [Google Scholar]
- Xue, M.; Li, L.F.; Zhang, Z.H.; Wang, H.; Wang, E.Z.; Qiu, T. Microstructure and melting properties of Ag–Cu–In intermediate temperature brazing alloys. Rare Met. 2015, 34, 324–328. [Google Scholar]
- Cao, J.; Zhang, L.X.; Wang, H.Q.; Wu, L.Z.; Feng, J.C. Effect of silver content on microstructure and properties of brass/steel induction brazing joint using Ag-Cu-Zn-Sn filler metal. J. Mater. Sci. Technol. 2011, 27, 377–381. [Google Scholar] [CrossRef]
- Zheng, Y.; Li, N.; Yan, J.Z.; Cao, Y.T. The microstructure and mechanical properties of 1Cr17Ni2/QAl7 brazed joints using Cu-Mn-Ni-Ag brazing alloy. Mater. Sci. Eng. 2016, 661, 25–31. [Google Scholar] [CrossRef]
Figure 1.
Cu–In and Ag–In phase diagram: (a) Cu–In phase diagram, (b) Ag–In phase diagram [9].
Figure 1.
Cu–In and Ag–In phase diagram: (a) Cu–In phase diagram, (b) Ag–In phase diagram [9].

Figure 2.
Melting behavior of 12Ag–Cu–Zn–Sn–xIn filler metals.

Figure 3.
Spreading areas of 12Ag–Cu–Zn–Sn–xIn on copper and 304 stainless steel plates.

Figure 4.
SEM image of surface appearance after spreading of 12Ag–Cu–Zn–Sn–2In filler metal (a,b) and corresponding the elements mapping: (c) Ag, (d) Cu, (e) Zn, (f) Sn, (g) In, (h) Fe, (i) Cr, (j) Ni.
Figure 4.
SEM image of surface appearance after spreading of 12Ag–Cu–Zn–Sn–2In filler metal (a,b) and corresponding the elements mapping: (c) Ag, (d) Cu, (e) Zn, (f) Sn, (g) In, (h) Fe, (i) Cr, (j) Ni.


Figure 5.
XRD pattern of 12Ag–Cu–Zn–Sn–xIn filler metals.

Figure 6.
Microstructure of 12Ag–Cu–Zn–Sn–xIn filler metals: (a) x = 0, (b) x = 0.5, (c) x = 1, (d) x = 2, (e) x = 3, (f) x = 5.
Figure 6.
Microstructure of 12Ag–Cu–Zn–Sn–xIn filler metals: (a) x = 0, (b) x = 0.5, (c) x = 1, (d) x = 2, (e) x = 3, (f) x = 5.

Figure 7.
Microstructure of the brazing joints: (a) x = 0, (b) x = 0.5, (c) x = 1, (d) x = 2, (e) x = 3, (f) x = 5.
Figure 7.
Microstructure of the brazing joints: (a) x = 0, (b) x = 0.5, (c) x = 1, (d) x = 2, (e) x = 3, (f) x = 5.

Figure 8.
SEM image of microstructures of 12Ag–Cu–Zn–Sn–2In brazing joint. (a) interface adjoin copper, (b) interface adjoin steel and corresponding the elements mapping: (c) Ag, (d) Cu, (e) Zn, (f) Sn, (g) In, (h) Fe, (i) Cr, (j) Ni.
Figure 8.
SEM image of microstructures of 12Ag–Cu–Zn–Sn–2In brazing joint. (a) interface adjoin copper, (b) interface adjoin steel and corresponding the elements mapping: (c) Ag, (d) Cu, (e) Zn, (f) Sn, (g) In, (h) Fe, (i) Cr, (j) Ni.


Figure 9.
Copper/304 stainless steel lap tests.

Figure 10.
Effect of In content on shear strength of brazing joints.

Figure 11.
Fracture morphologies of the brazing joint of 12Ag–Cu–Zn–Sn–xIn filler metals: (a) x = 0, (b) x = 0.5, (c) x = 1, (d) x = 2, (e) x = 3, (f) x = 5.
Figure 11.
Fracture morphologies of the brazing joint of 12Ag–Cu–Zn–Sn–xIn filler metals: (a) x = 0, (b) x = 0.5, (c) x = 1, (d) x = 2, (e) x = 3, (f) x = 5.

Figure 12.
The elements mapping of the fracture morphologies of the brazing joint of 12Ag–Cu–Zn–Sn–3In filler metal in Figure 11: (a) Ag, (b) Cu, (c) Zn, (d) Sn, (e) In, (f) Fe, (g) Cr, (h) Ni.
Figure 12.
The elements mapping of the fracture morphologies of the brazing joint of 12Ag–Cu–Zn–Sn–3In filler metal in Figure 11: (a) Ag, (b) Cu, (c) Zn, (d) Sn, (e) In, (f) Fe, (g) Cr, (h) Ni.


Table 1.
Chemical composition of the novel filler metals (wt.%).
| No. | Ag | Cu | Zn | Sn | In | |
|---|---|---|---|---|---|---|
| Nominal | Actual | |||||
| 1 | 12 | Bal. | 39.0 | 1.5 | 0 | 0 |
| 2 | 12 | Bal. | 38.7 | 1.5 | 0.5 | 0.49 |
| 3 | 12 | Bal. | 38.4 | 1.5 | 1 | 0.97 |
| 4 | 12 | Bal. | 37.9 | 1.5 | 2 | 2.03 |
| 5 | 12 | Bal. | 37.4 | 1.5 | 3 | 3.02 |
| 6 | 12 | Bal. | 36.4 | 1.5 | 5 | 4.96 |
Table 2.
EDS analysis results of the points indicated in Figure 4 (at.%).
Table 2.
EDS analysis results of the points indicated in Figure 4 (at.%).
| Points | Ag | Cu | Zn | Sn | In | Fe | Cr | Ni |
|---|---|---|---|---|---|---|---|---|
| A | 72.6 | 11.3 | 1.3 | 0.8 | 8.4 | 3.5 | 1.6 | 0.5 |
| B | 0.0 | 0.5 | 0.7 | 0.0 | 0.1 | 70.5 | 20.1 | 8.1 |
Table 3.
EDS analysis results of the points indicated in Figure 6 (at.%).
Table 3.
EDS analysis results of the points indicated in Figure 6 (at.%).
| Points | Ag | Cu | Zn | Sn | In |
|---|---|---|---|---|---|
| A | 7.3 | 53.3 | 38.4 | 1.0 | -- |
| B | 6.4 | 54.5 | 37.9 | 0.7 | 0.5 |
| C | 10.3 | 49.1 | 34.2 | 0.8 | 5.6 |
| D | 13.4 | 45.9 | 32.1 | 0.7 | 7.9 |
| E | 6.8 | 52.6 | 37.3 | 0.8 | 2.5 |
Table 4.
EDS analysis results of the points indicated in Figure 8 (at.%).
Table 4.
EDS analysis results of the points indicated in Figure 8 (at.%).
| Points | Ag | Cu | Zn | Sn | In | Fe | Cr | Ni |
|---|---|---|---|---|---|---|---|---|
| A | 4.7 | 79.3 | 15.5 | 0.3 | 0.2 | -- | -- | -- |
| B | 4.1 | 62.5 | 32.4 | 0.5 | 0.5 | -- | -- | -- |
| C | 27.3 | 44.4 | 23.3 | 1.8 | 3.2 | -- | -- | -- |
| D | 1.8 | 3.2 | 2.7 | 0.2 | 0.4 | 72.3 | 14.2 | 5.2 |
| E | 32.5 | 36.0 | 22.2 | 2.2 | 4.0 | 2.5 | 0.6 | -- |
| F | 5.1 | 58.7 | 33.5 | 0.6 | 0.6 | 0.6 | 0.4 | 0.5 |
Publisher’s Note: MDPI stays neutral with regard to jurisdictional claims in published maps and institutional affiliations. |
© 2021 by the authors. Licensee MDPI, Basel, Switzerland. This article is an open access article distributed under the terms and conditions of the Creative Commons Attribution (CC BY) license (https://creativecommons.org/licenses/by/4.0/).
Share and Cite
MDPI and ACS Style
Wu, J.; Xue, S.; Yao, Z.; Long, W. Study on Microstructure and Properties of 12Ag–Cu–Zn–Sn Cadmium-Free Filler Metals with Trace In Addition. Crystals 2021, 11, 557. https://0-doi-org.brum.beds.ac.uk/10.3390/cryst11050557
AMA Style
Wu J, Xue S, Yao Z, Long W. Study on Microstructure and Properties of 12Ag–Cu–Zn–Sn Cadmium-Free Filler Metals with Trace In Addition. Crystals. 2021; 11(5):557. https://0-doi-org.brum.beds.ac.uk/10.3390/cryst11050557
Chicago/Turabian StyleWu, Jie, Songbai Xue, Zhen Yao, and Weimin Long. 2021. "Study on Microstructure and Properties of 12Ag–Cu–Zn–Sn Cadmium-Free Filler Metals with Trace In Addition" Crystals 11, no. 5: 557. https://0-doi-org.brum.beds.ac.uk/10.3390/cryst11050557
Note that from the first issue of 2016, this journal uses article numbers instead of page numbers. See further details here.