1. Introduction
Over five decades, a large number of investigations have been carried out on various aspects of the continuous casting process. It is known that there are four recirculating domains inside the mould, two above the nozzle port and two below the nozzle port. The lower two recirculating domains are much bigger in size than those of the upper two recirculating domains. The first study was conducted on the straight bore nozzle and it studied the behaviour of the fluid flow pattern in the submerged entry nozzle with the help of a stopper rod and the slide gate control system. For most of the possible cases, modelling is done using water as the fluid which represents molten steel, as shown in
Table 1: water at 20 °C and liquid steel at 1600 °C have practically equal kinematic viscosities, thus making reduced scale aqueous models an excellent tool for the investigation of fluid flow process inside the mould for steelmaking to produce a better quality steel. Moreover, when water is used as a fluid representing molten steel, it fully ensures that easy flow visualization in the system.
The control of the level of fluctuations in the mould is mostly influenced by the Submerged Entry Nozzle (SEN) which plays a vital role in it. The parameters which mostly affect the submerged entry nozzle (SEN) are the internal bore diameter, port geometry, port locations, number of ports, internal base design, well depth, SEN submergence depth, SEN position, argon injection rate, tundish flow control, mould geometry, superheat, and casting speed. To decrease the level of fluctuation and avoid slag entrainment can be achieved by suitable SEN design [
1]. Fang et al. studied the effects of a Submerged Entry Nozzle on flow and beginning solidification in a continuous casting bloom form with electromagnetic stirring. The exploratory and mathematical results indicated that the optimized four-port SEN with inclining establishment cannot just improve the fluid flow pattern by lightening the level variance and diminishing the impact pressure to the wall [
2]. Cui et al. studied the impact of the submerged entry nozzle structure on liquid flow in a beam blank continuous casting mould. The outcomes show that the stream under the single-port SEN prompts a too critical effect on the solidifying shell in the area of the rib centre and the filets, particularly the filet of the external bend [
3].
Ramirez and Trejo studied the fluctuations of the free surface of liquid steel; two different models with the same casting parameters with different thicknesses were analysed by the hydrodynamics behaviour at the top portion of the mould. The first model was the standard thickness slab and the second model had a thickness three times wider [
4]. Michalek et al. designed submerged entry nozzles having one that was a straight conventional nozzle and a second one having five ports. According to the author, the riddling depth of the newest steel was observed with the help of straight SEN having a largest value of 5.6 m [
5]. In Liu et al., a model was introduced for studying the transient flow during continuous casting and it was, according to the author, for simulation of multiple stopper rod movement. The model taken into consideration comprises four sub models for studying transient flow conditions [
6]. Ramirez et al. suggested that SEN clogging was a complex problem in the continuous casting of steel which decreases the quality of steel produced. The clogging increases gradually which generates insufficient and uneven fluid flow patterns inside the nozzle and mould [
7]. Cho et al. studied the fluid flow behaviour in the mould that was not stable which induces surface velocity and fluctuations levels and relevance slag, which lead to defects in the surface in the continuous casting of steel. In this work, nail board dipping quantities were active to enumerate transient surface level, the velocity at the surface, the direction of flow, and depth of slag [
8].
Li et al. observed the latest method for the swirling flow in SEN. For inducing swirling flow, a rotating electromagnetic field was build up all around the SEN with the help of Lorentz force. The influence of the structure of the nozzle on the flow and temperature around the SEN and mould and even the influence of coil current intensity were numerically simulated [
9]. Begum et al. investigated a 3D computational fluid dynamics (CFD) model with turbulent fluid flow condition developed for the simulation of an industrial-sized vertical direct chill slab caster [
10]. Ren et al. suggested a method based on particle analysis for studying the non-metallics inclusions in steel produced. For a short period, when compared with traditional methods, the process had the advantages of morphology, size measuring, original positions recording, and, for a particular area, identifying the composition of non-metallic inclusions [
11]. Yingnakorna and Khumkoaa suggested that preheating SEN itself was an important factor which determines the lifetime of SEN. In this research, they investigated the corrosion behaviour and lifetime of SEN [
12]. Pirker et al. investigated flow behaviour in the submerged entry nozzle as crucial for continuous slab casting because it controls the mould fluid flow pattern. Here, the bottom portion of a bifurcated SEN was studied where deflection of flow decides the port outflow [
13]. According to the authors, the port tube consists of at least two exit ports and provides more effective rotational flow inside the moulds from which molten metal flows from the port tube. Results indicated that flow rotation increases the residence time inside the liquid mould pool for producing better floatation of the inclusions and also reduces the dendrites growth which formed along the steel solidifying [
14].
The research of Pieprzyca et al. focusses on the escalation of submerged entry nozzle depth in the continuous casting mould. The way at which molten steel flux and also the speed of flowing molten steel into the mould in the continuous casting process plays an important role [
15]. Sen et al. observed that continuous casting production of steel in defect-free form was the demand of each and every steelmaker. According to the authors, due to non-metallic inclusions, defects are formed in the steel. Steel turbulence must be such that more and more impurities will be floating near the meniscus of the mould and they are apprehended by the casting powder, and turbulence must not be high enough for capturing the particles of casting powder inside the liquid steel [
16]. Ramos et al. investigated two different bifurcated submerged entry nozzles having a rectangular port and a square port and having an immersion depth of 115 mm and 185 mm, taken for study and having a 1:1 scale ratio. Rectangular ports possess optimum velocity spikes per minute, having greater magnitudes rather than using square SEN [
17]. Ghaleni et al. studied the behaviour of fluid flow patterns and turbulence inside a slide gate; a throttled submerged entry nozzle was studied using the Detached-Eddy Simulation (DES) model. Results showed DES models as having notable rewards over the standard k-epsilon turbulence model model in the case of transient simulations [
18]. The results of Zhang et al. indicated that when the immersion depth of the submerged entry nozzles increases, molten steel fluctuations near the surface decrease. When the depth of immersion of the submerged entry nozzle was deeper, the velocity of the molten steel near the surface was found to be slower and the temperature was also low which results in the meniscus becoming too cold and also stagnant [
19]. According to Kohei and Yuji, to evaluate the effects of the electromagnetic brake under high molten steel flow rate conditions, the momentum of molten steel in a mould with two static magnetic fields in the flow control mould was investigated [
20]. Timmel et al. deal with numerical simulations and model experiments related to the behaviour of the fluid flow pattern during the continuous casting process in the steel making process. According to the authors, ultrasonic, inductive techniques, and X-ray radioscopy were employed for the quantification of flow or the visualizations of two-phase flow regimes occurring in the submerged entry nozzle and the mould [
21].
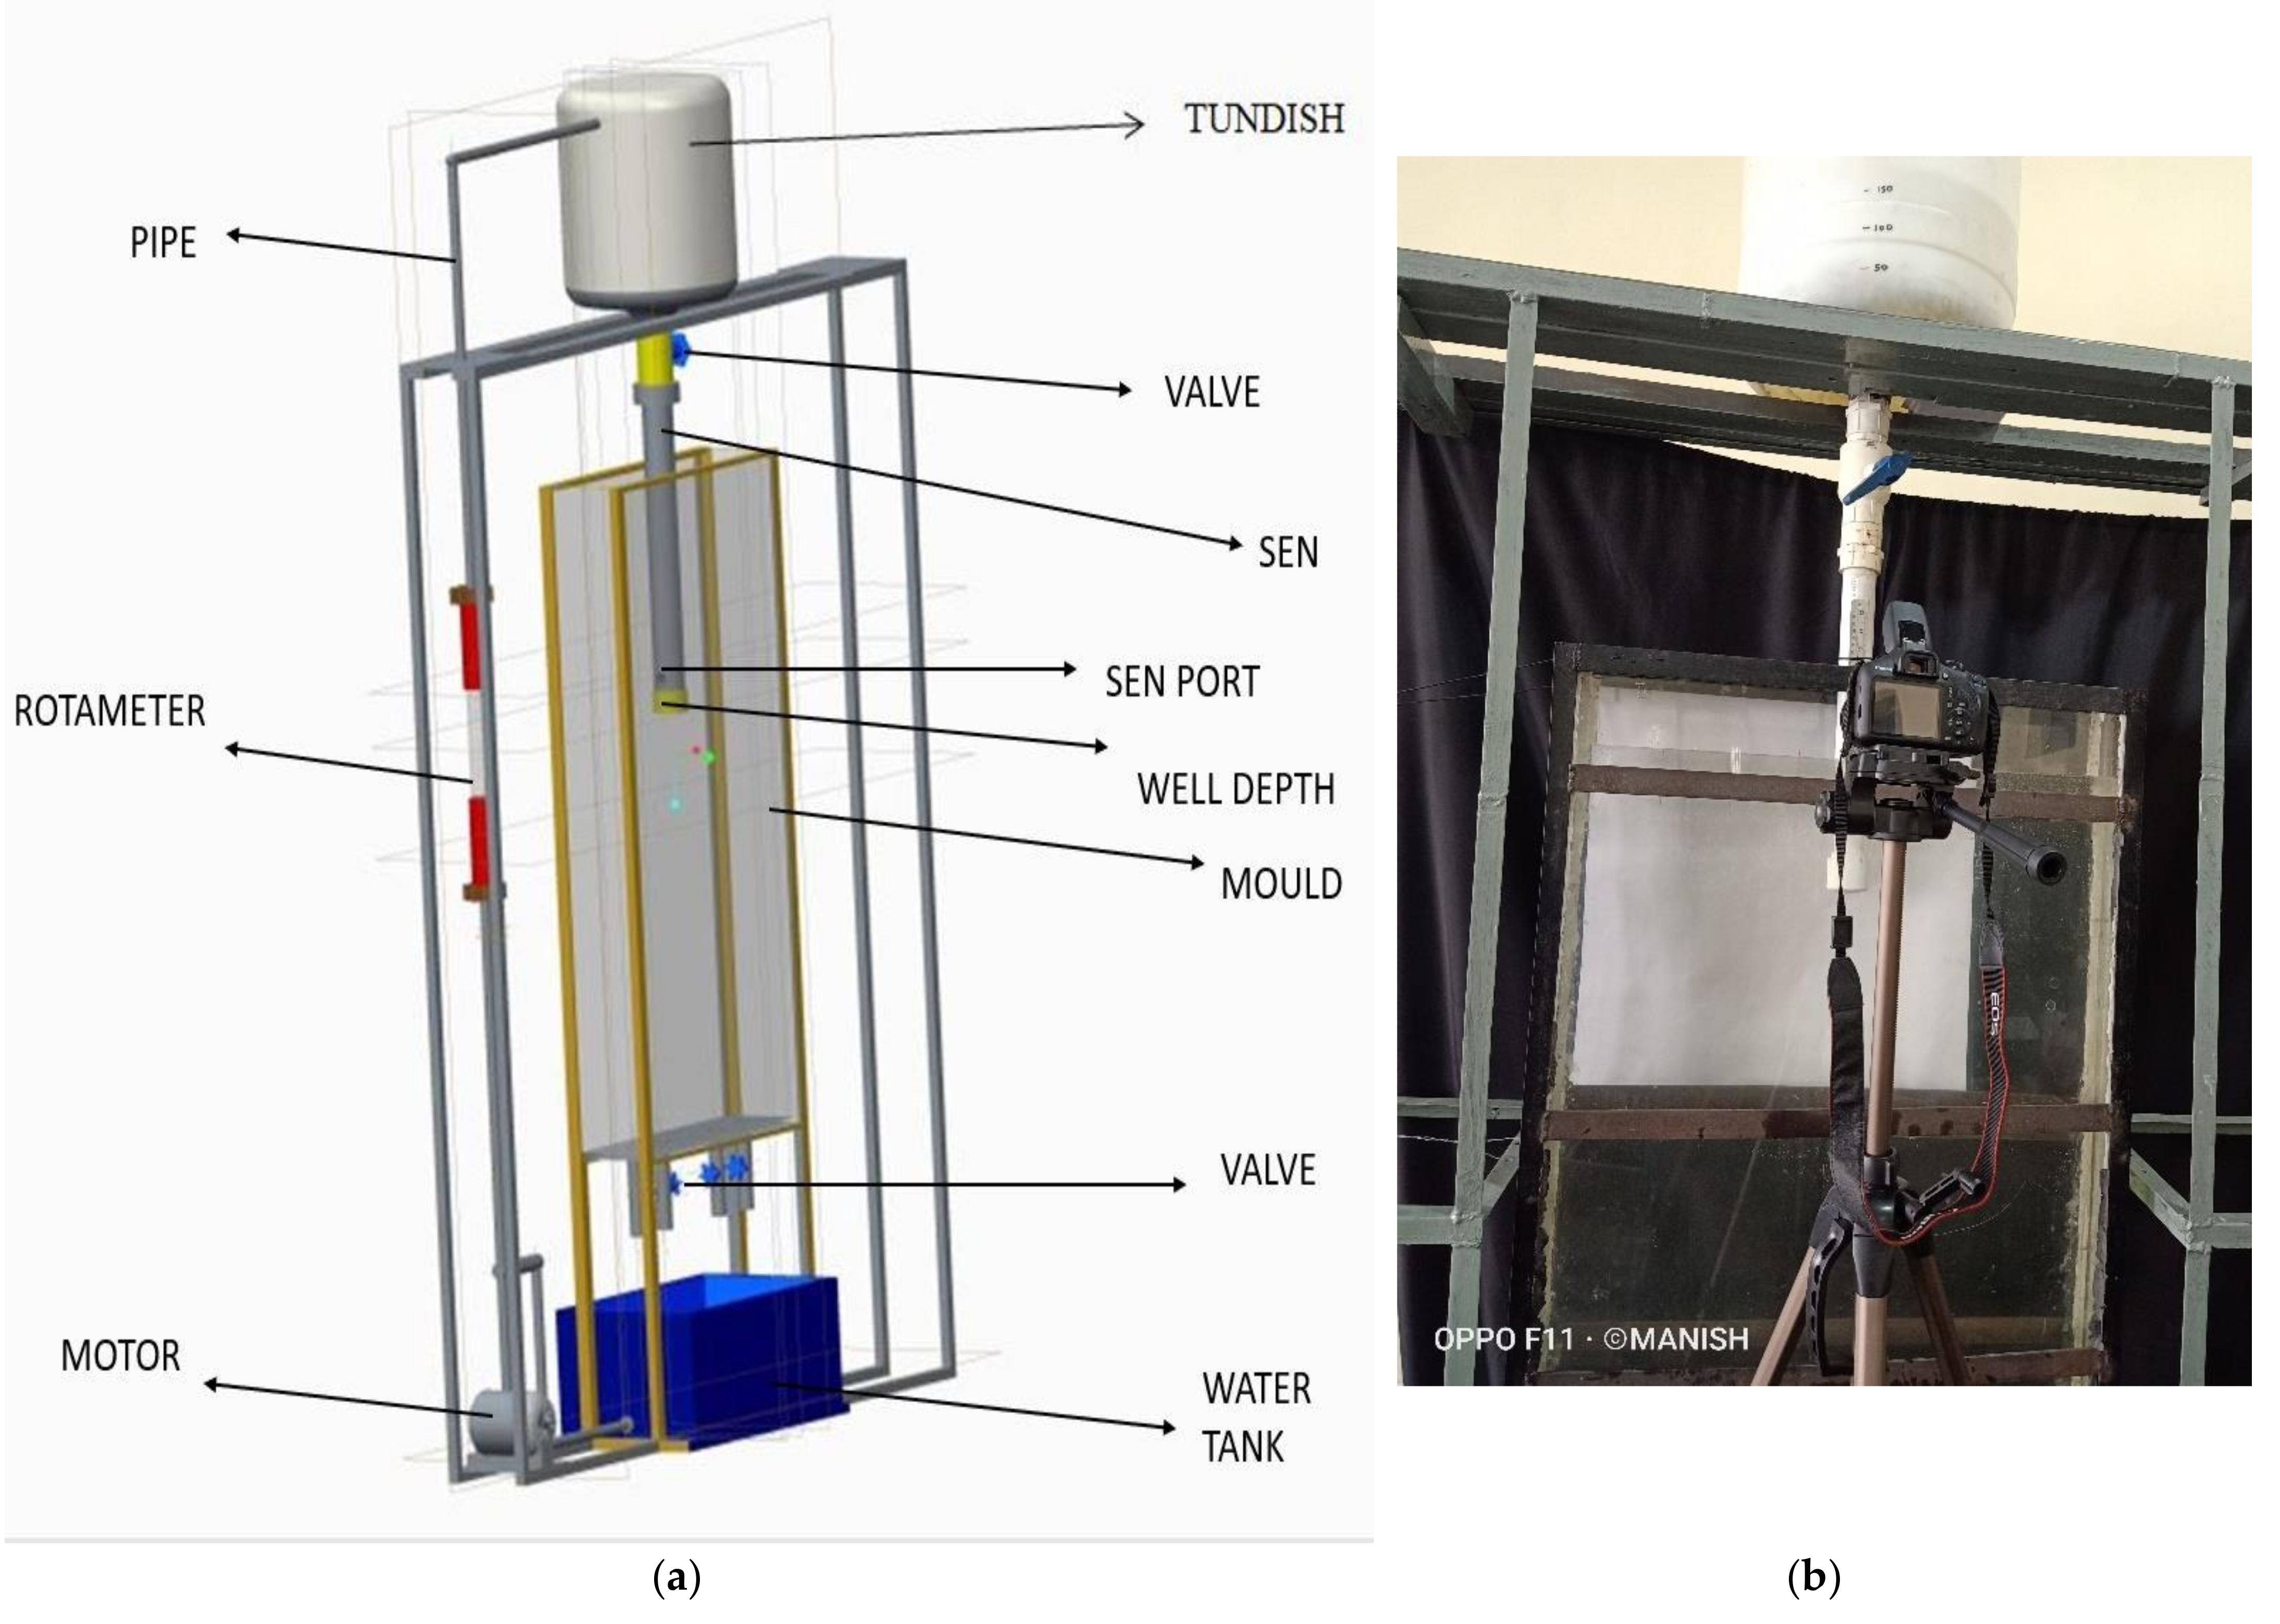
In this current study, a laboratory design of a continuous casing machine has been modelized and constructed toward implementation of an experiment under different variables like water flow rate, different mould section size, and different submerged entry nozzle port angle. Analysis provides persistent investigation results because laboratory design is not affected by the type and composition of the produce. In this experiment, the chief objectives are (i) performing an experiment to measure the meniscus fluctuation under different mould section size, and different submerged entry nozzle port angle under different operating conditions, and (ii) to conduct a comparative analysis of the various parameters for the proposed system.
2. Similarity Criteria
Considering the situation that occurs at the process plant in a laboratory, a working model of the real system has to be made. To simulate the real process, there are some criteria that have to be fulfilled. For a model to describe a real situation well, we must ensure the quality of the dimensionless numbers. The ratio of forces occurring in a system can be expressed by the dimensionless numbers, which in turn serve as similarity parameters for a scale down of SEN and mould equipment. Generally, we are balancing force ratios between the model and the prototype to maintain similitude. Dynamic similarity ensures that interactions between the forces which occur in the mould will also occur in the same fashion in the actual system.
The primary motivation for carrying out reduced scale model studies, ideally speaking, is to predict certain phenomena in the full scale steel processing system using appropriate scale up correlations. This, however, is often not possible to achieve since the physical models applied are often inexact, and hence, the corresponding scale up correlations are somewhat uncertain.
Water modelling of a system can easily be carried out by constructing a model on smaller scale. This is done by making use of scale factor, λ. This makes the system a lot cheaper and convenient to work with. A full scale water model requires no velocity scaling due to the dynamic similarity between liquid steel and water, as they share approximately the same kinematic viscosity. It is impossible to satisfy all the requirements of similarity of fluid flow during continuous casting in a single model due to limitations of water modelling and the diversity of flow phenomena. However, the Froude number alone can be satisfied at any scale in a ladle/tundish/mould water model as long as all the geometrical and fluid hydraulic heads in the system are varied with a single scaling parameter.
The present study is carried out on a slab caster mould, and the entire set-up consisting of SEN and mould was built with a scale factor of 0.33 scale. The velocity was scaled down using Froude similarity. Every length dimension in the water-model was scaled down as
Since the system is assumed to be Froude number dominated, velocity and flow rate in the model and full scale system are expressed as
where V
model and V
proto are the velocities at corresponding points in the model and prototype, respectively; Q
model and Q
proto are flow rates at corresponding points in the model and prototype respectively; D
model and D
Proto are the diameters of the SEN of the model and prototype, respectively; Fr
model and Fr
prototype represent the Froude Number in the model and prototype, respectively.
4. Result and Discussion
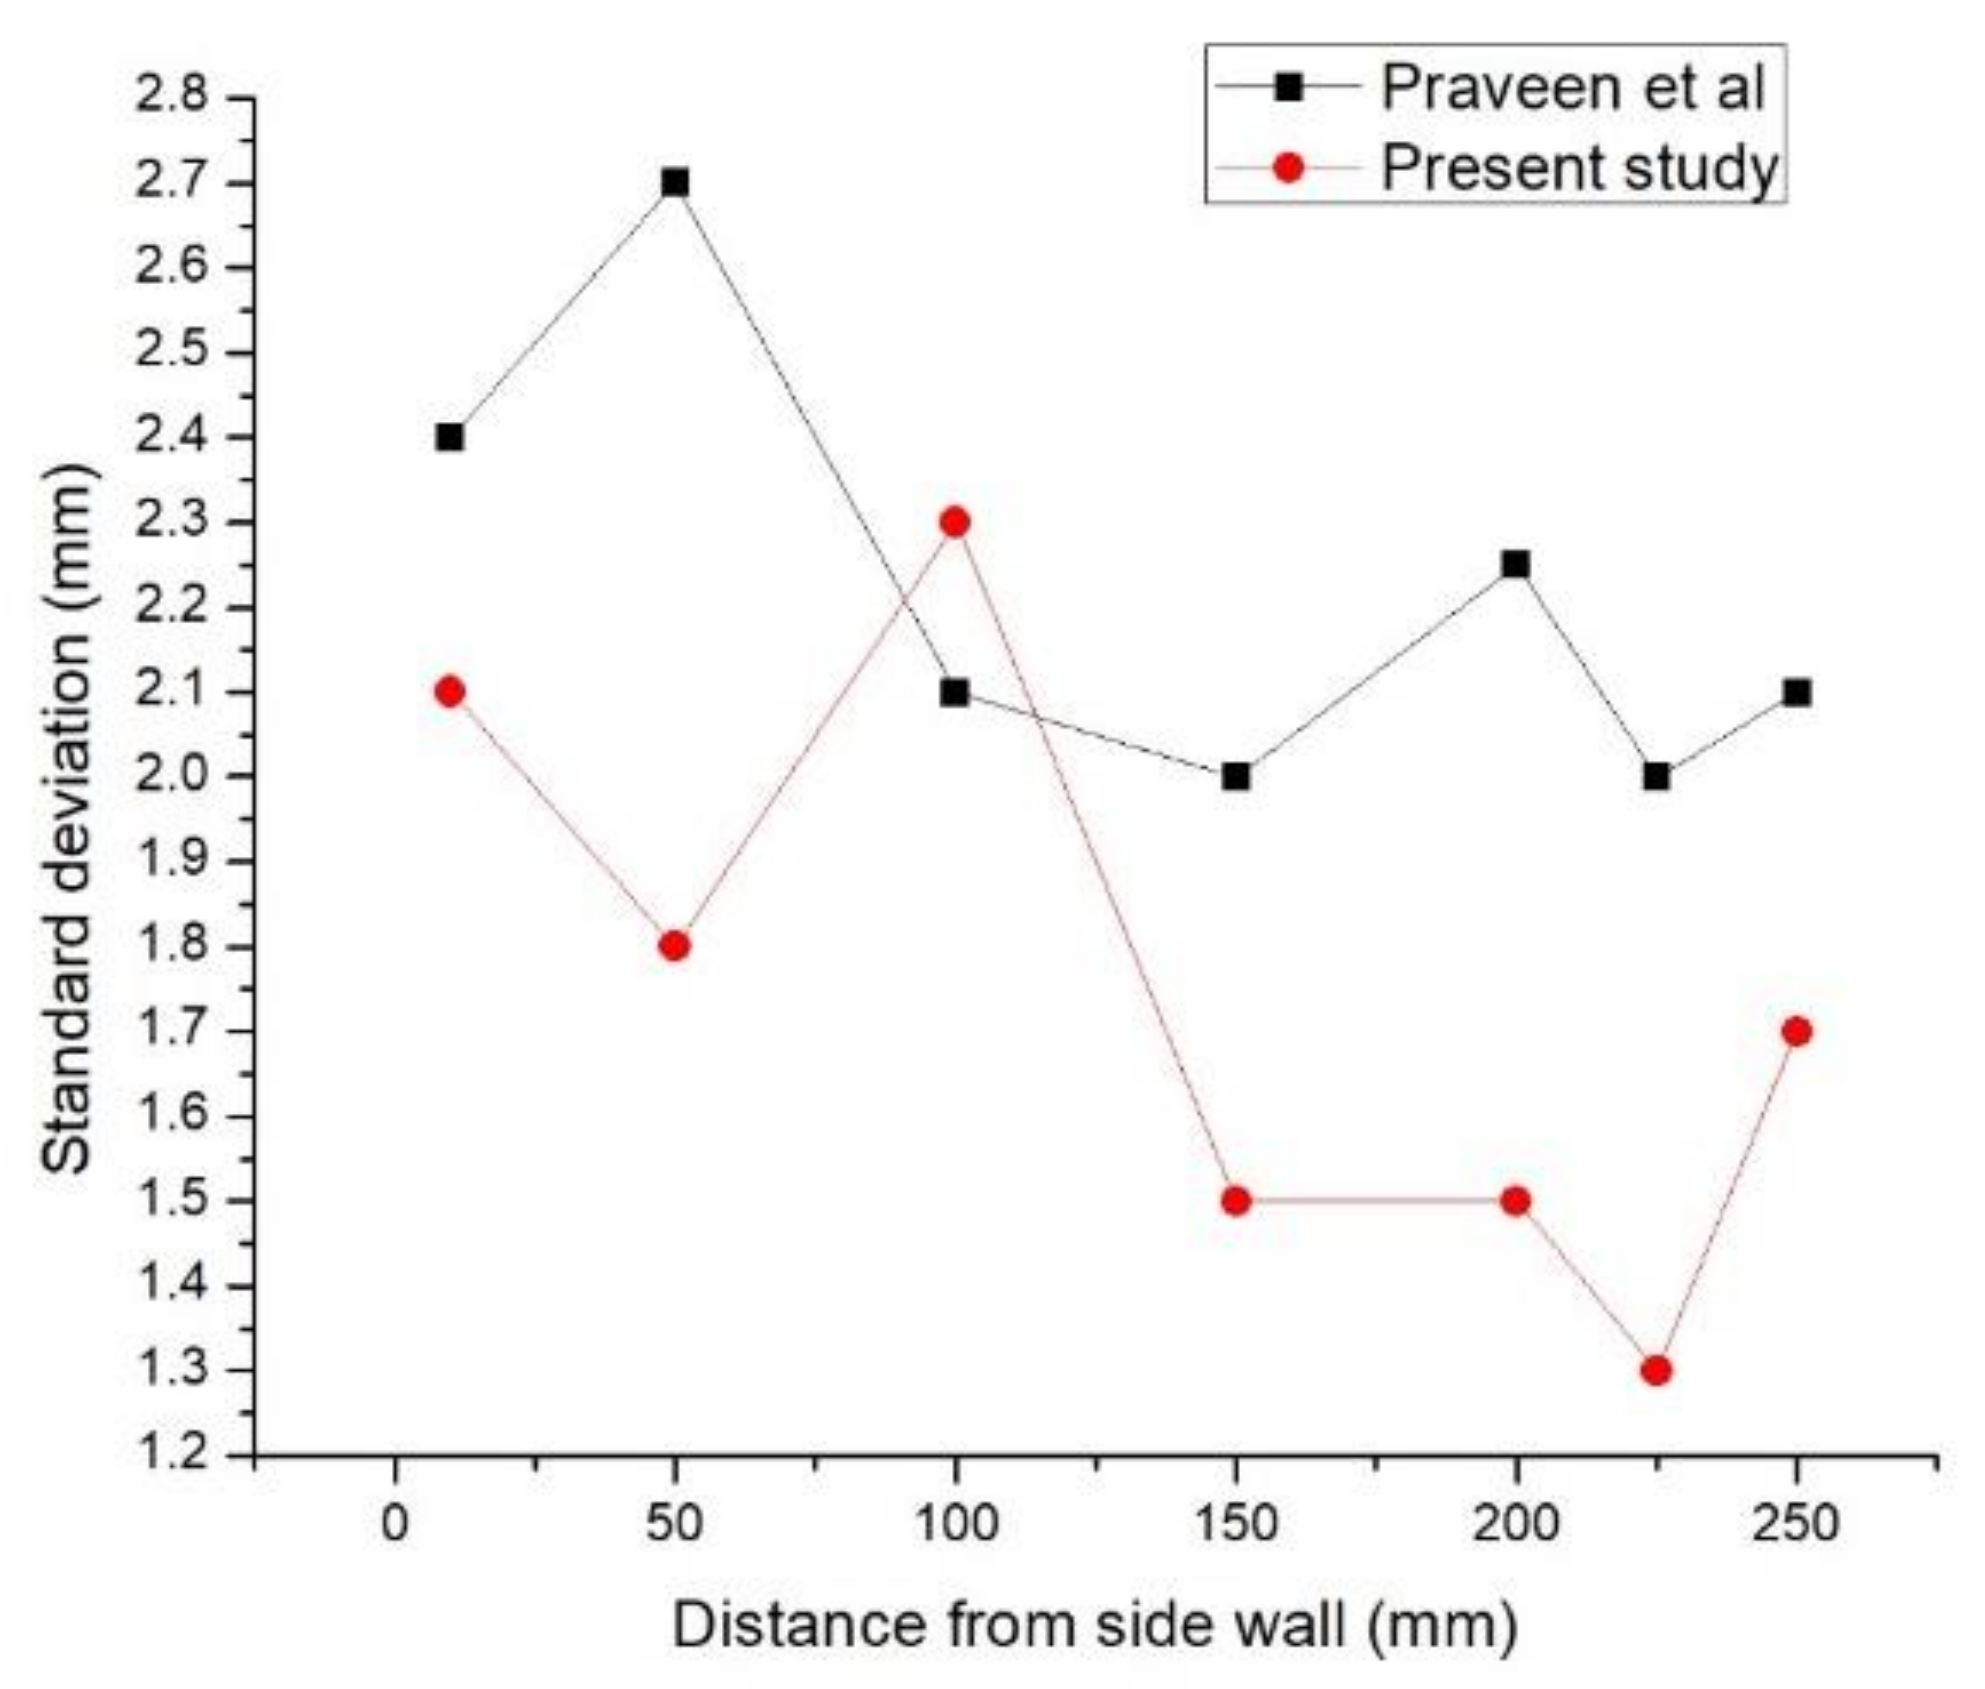
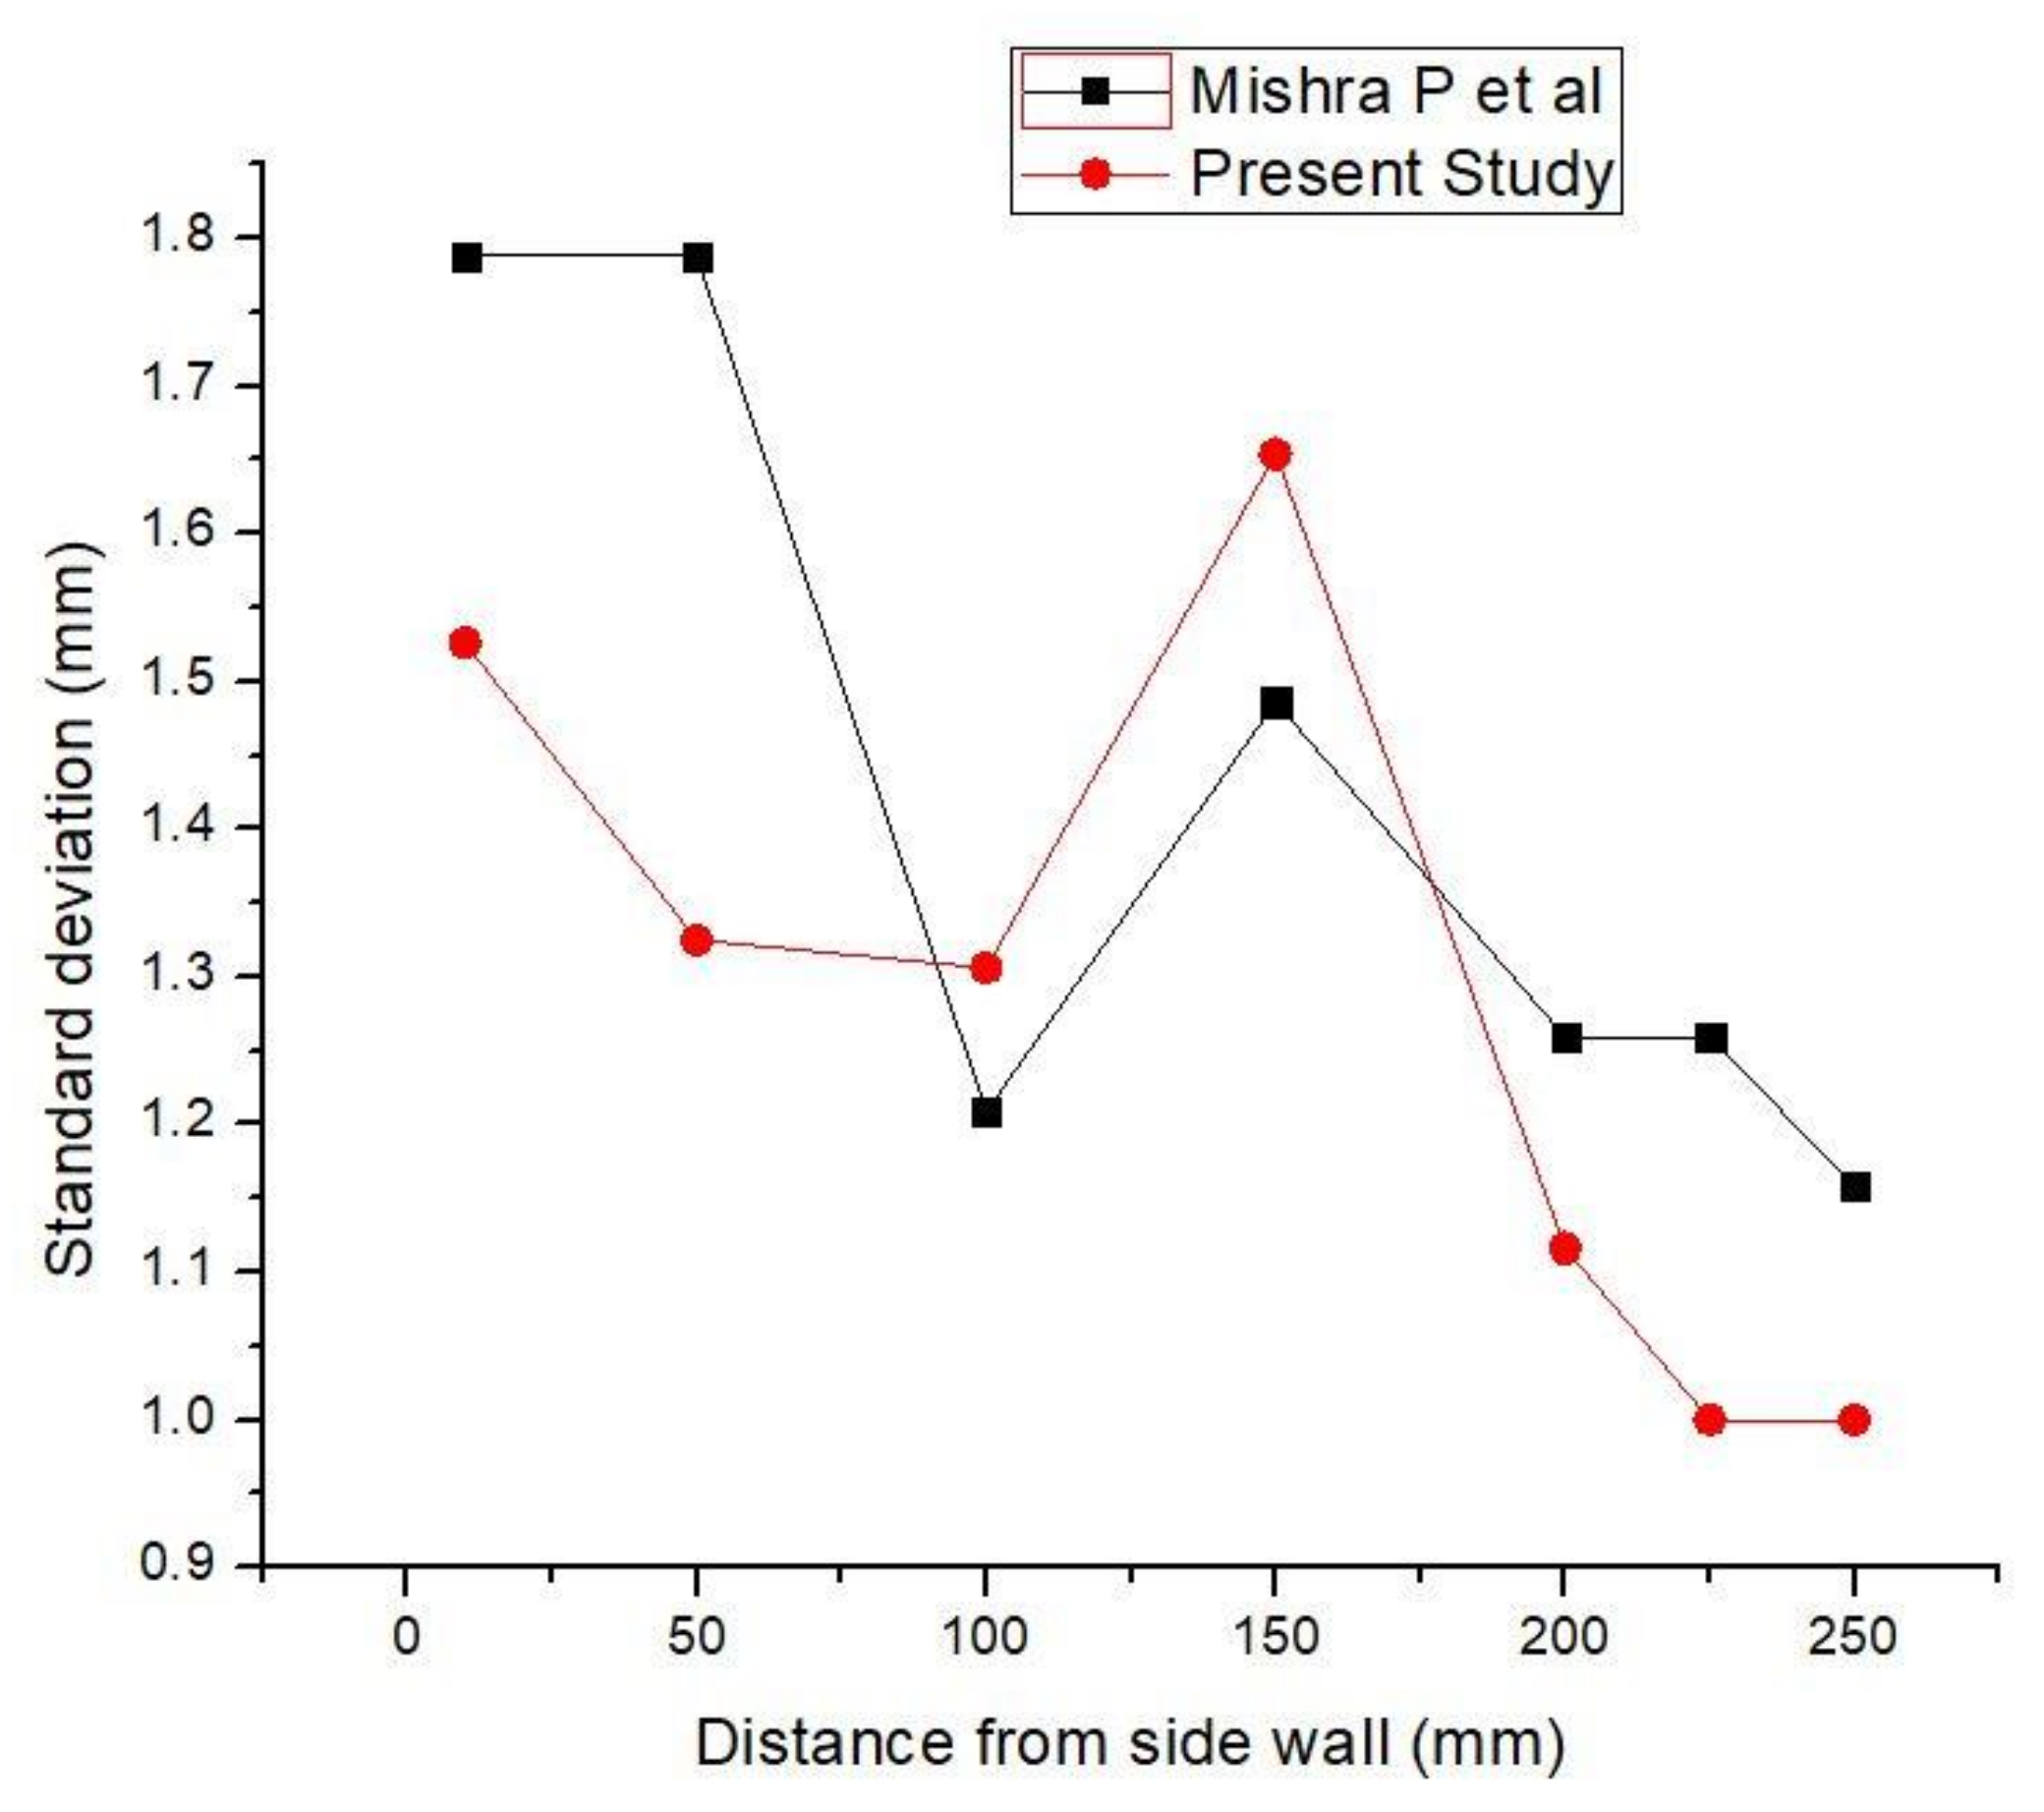
Water model experiments were performed to study the effects of mould section sizes, three different SENS, liquid flow rates through the SEN, on surface fluctuations in the mould. The video recording of the meniscus for each experiment was done and analysis of the meniscus was carried out at seven different locations in one half of the mould. The maximum meniscus fluctuation at each location was calculated by taking an average of 20 values at that time. The difference between the crest and trough is defined as the wave amplitude. The recorded video of surface fluctuations was downloaded into the computer for computation of average and maximum wave amplitude. A total of 100 frames in a sequence were downloaded from video for further analysis. Each frame was analysed individually. The data have been analysed for the prediction of average wave amplitude and maximum wave amplitude. The displacement of each point was first calculated with respect to a reference line. The reference line was chosen in such a way that all points fall above that line. This was done for the convenience of computation because our interest was in the wave amplitude. As mentioned earlier, the average meniscus displacement at each point was computed by taking an average of 20 points. This point kept on fluctuating during the measurement. The uncertainty in the measurement of this point was computed by taking the average and standard deviation of 20 values.
The comparative analysis of standard deviation from the present setup was done with different investigators as shown in
Figure 2 and
Figure 3.
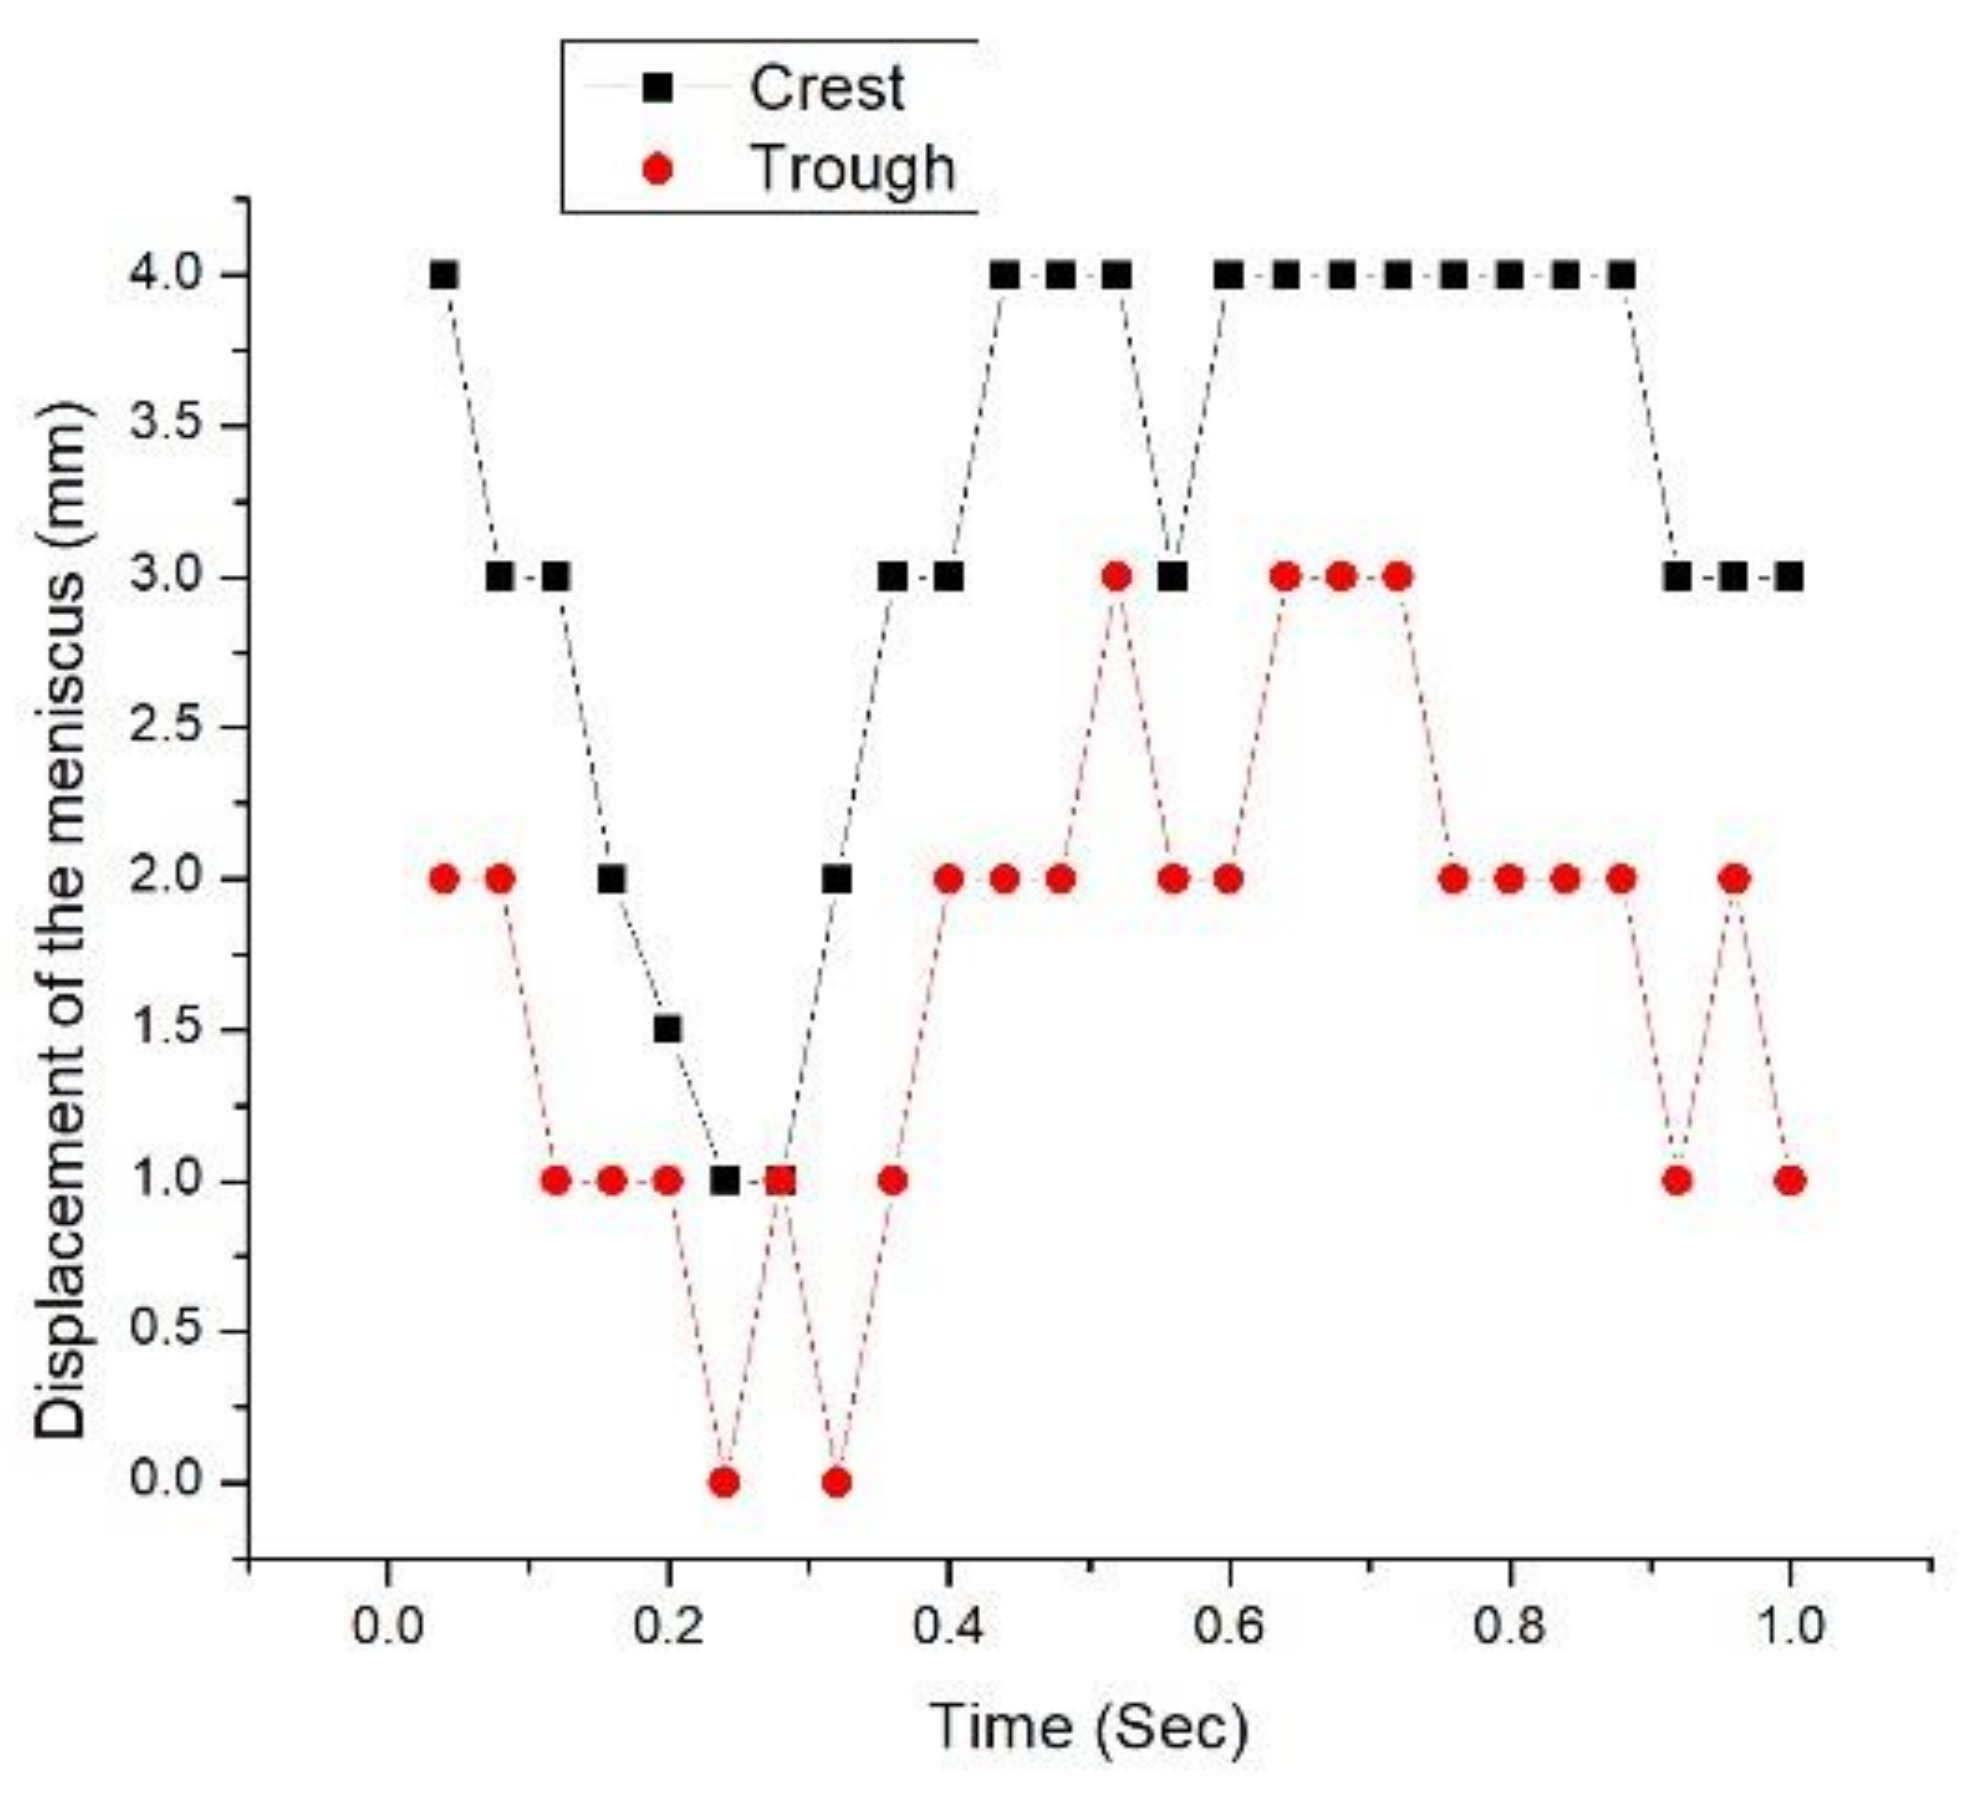
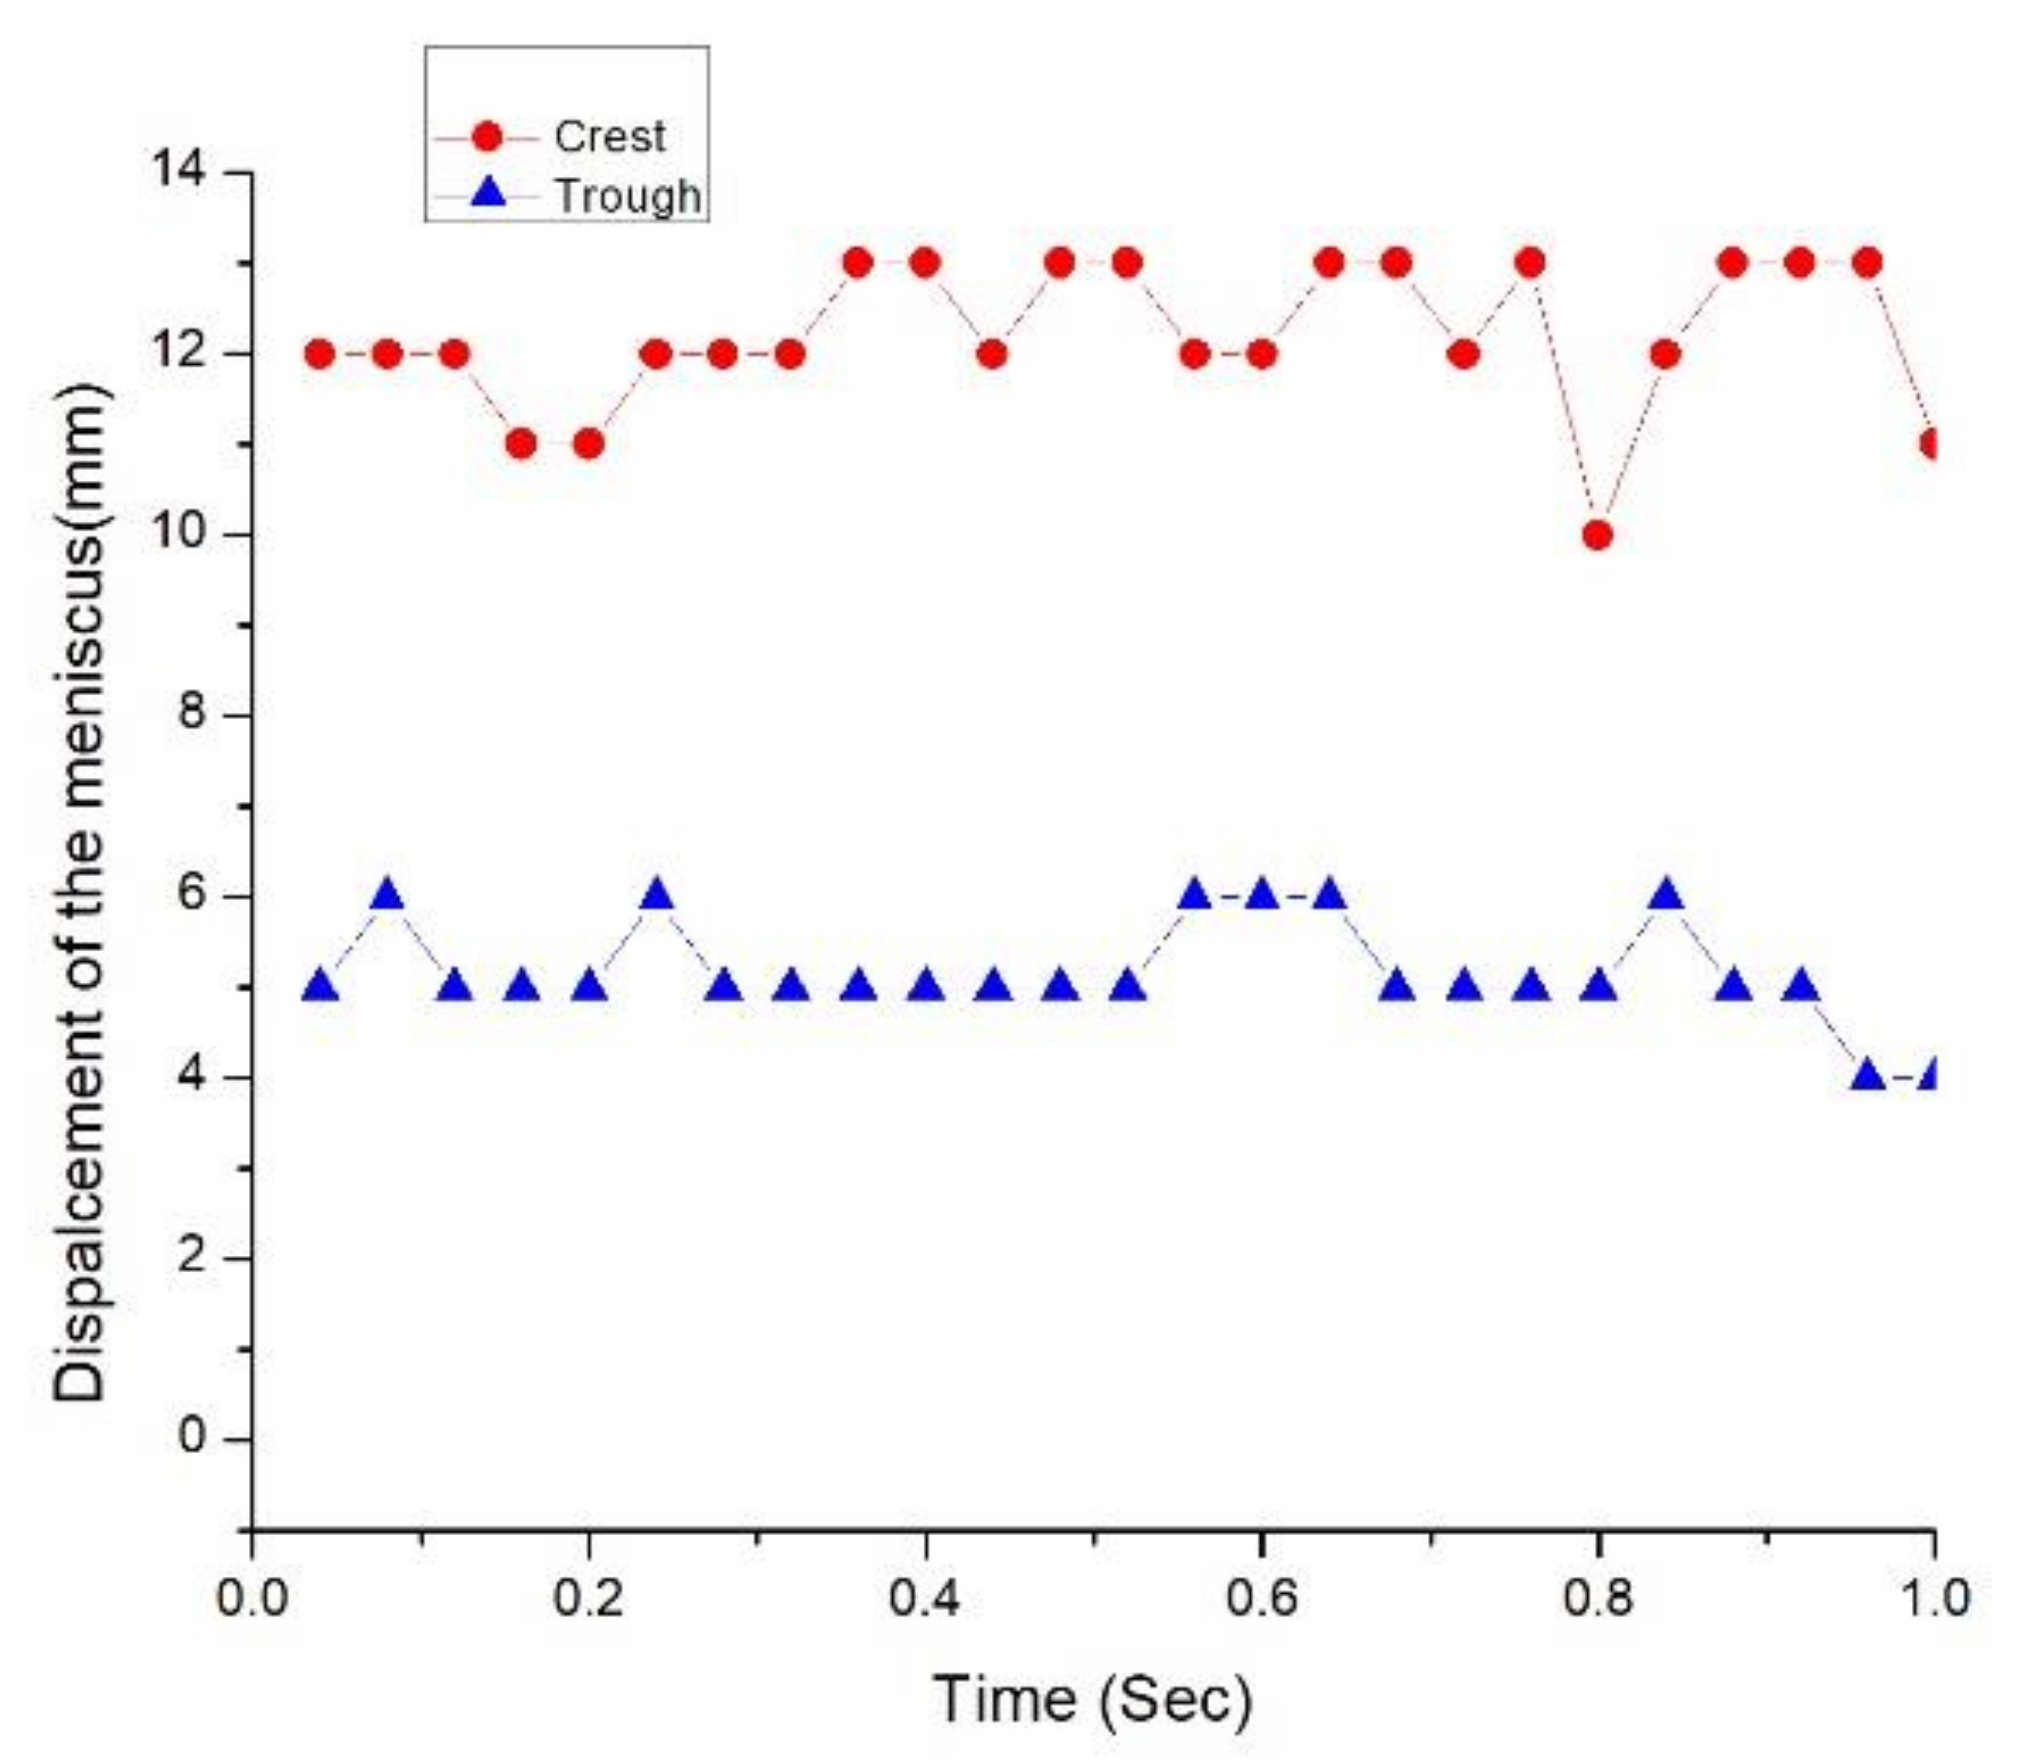
Figure 4 and
Figure 5 show the fluctuations of the meniscus wave at the crest and trough with respect to time for 0° and 15° downward port nozzles at the same conditions as abovementioned. For the parallel port, the difference between the crest and trough, i.e., amplitude, was found to be less in comparison with the 15° downward ports. However, the wave fluctuations at a particular location, either crest or trough, was found to be more in case of the parallel port nozzle compared to the 15° downward ports.
4.1. Maximum Meniscus Profile for Different Section Size
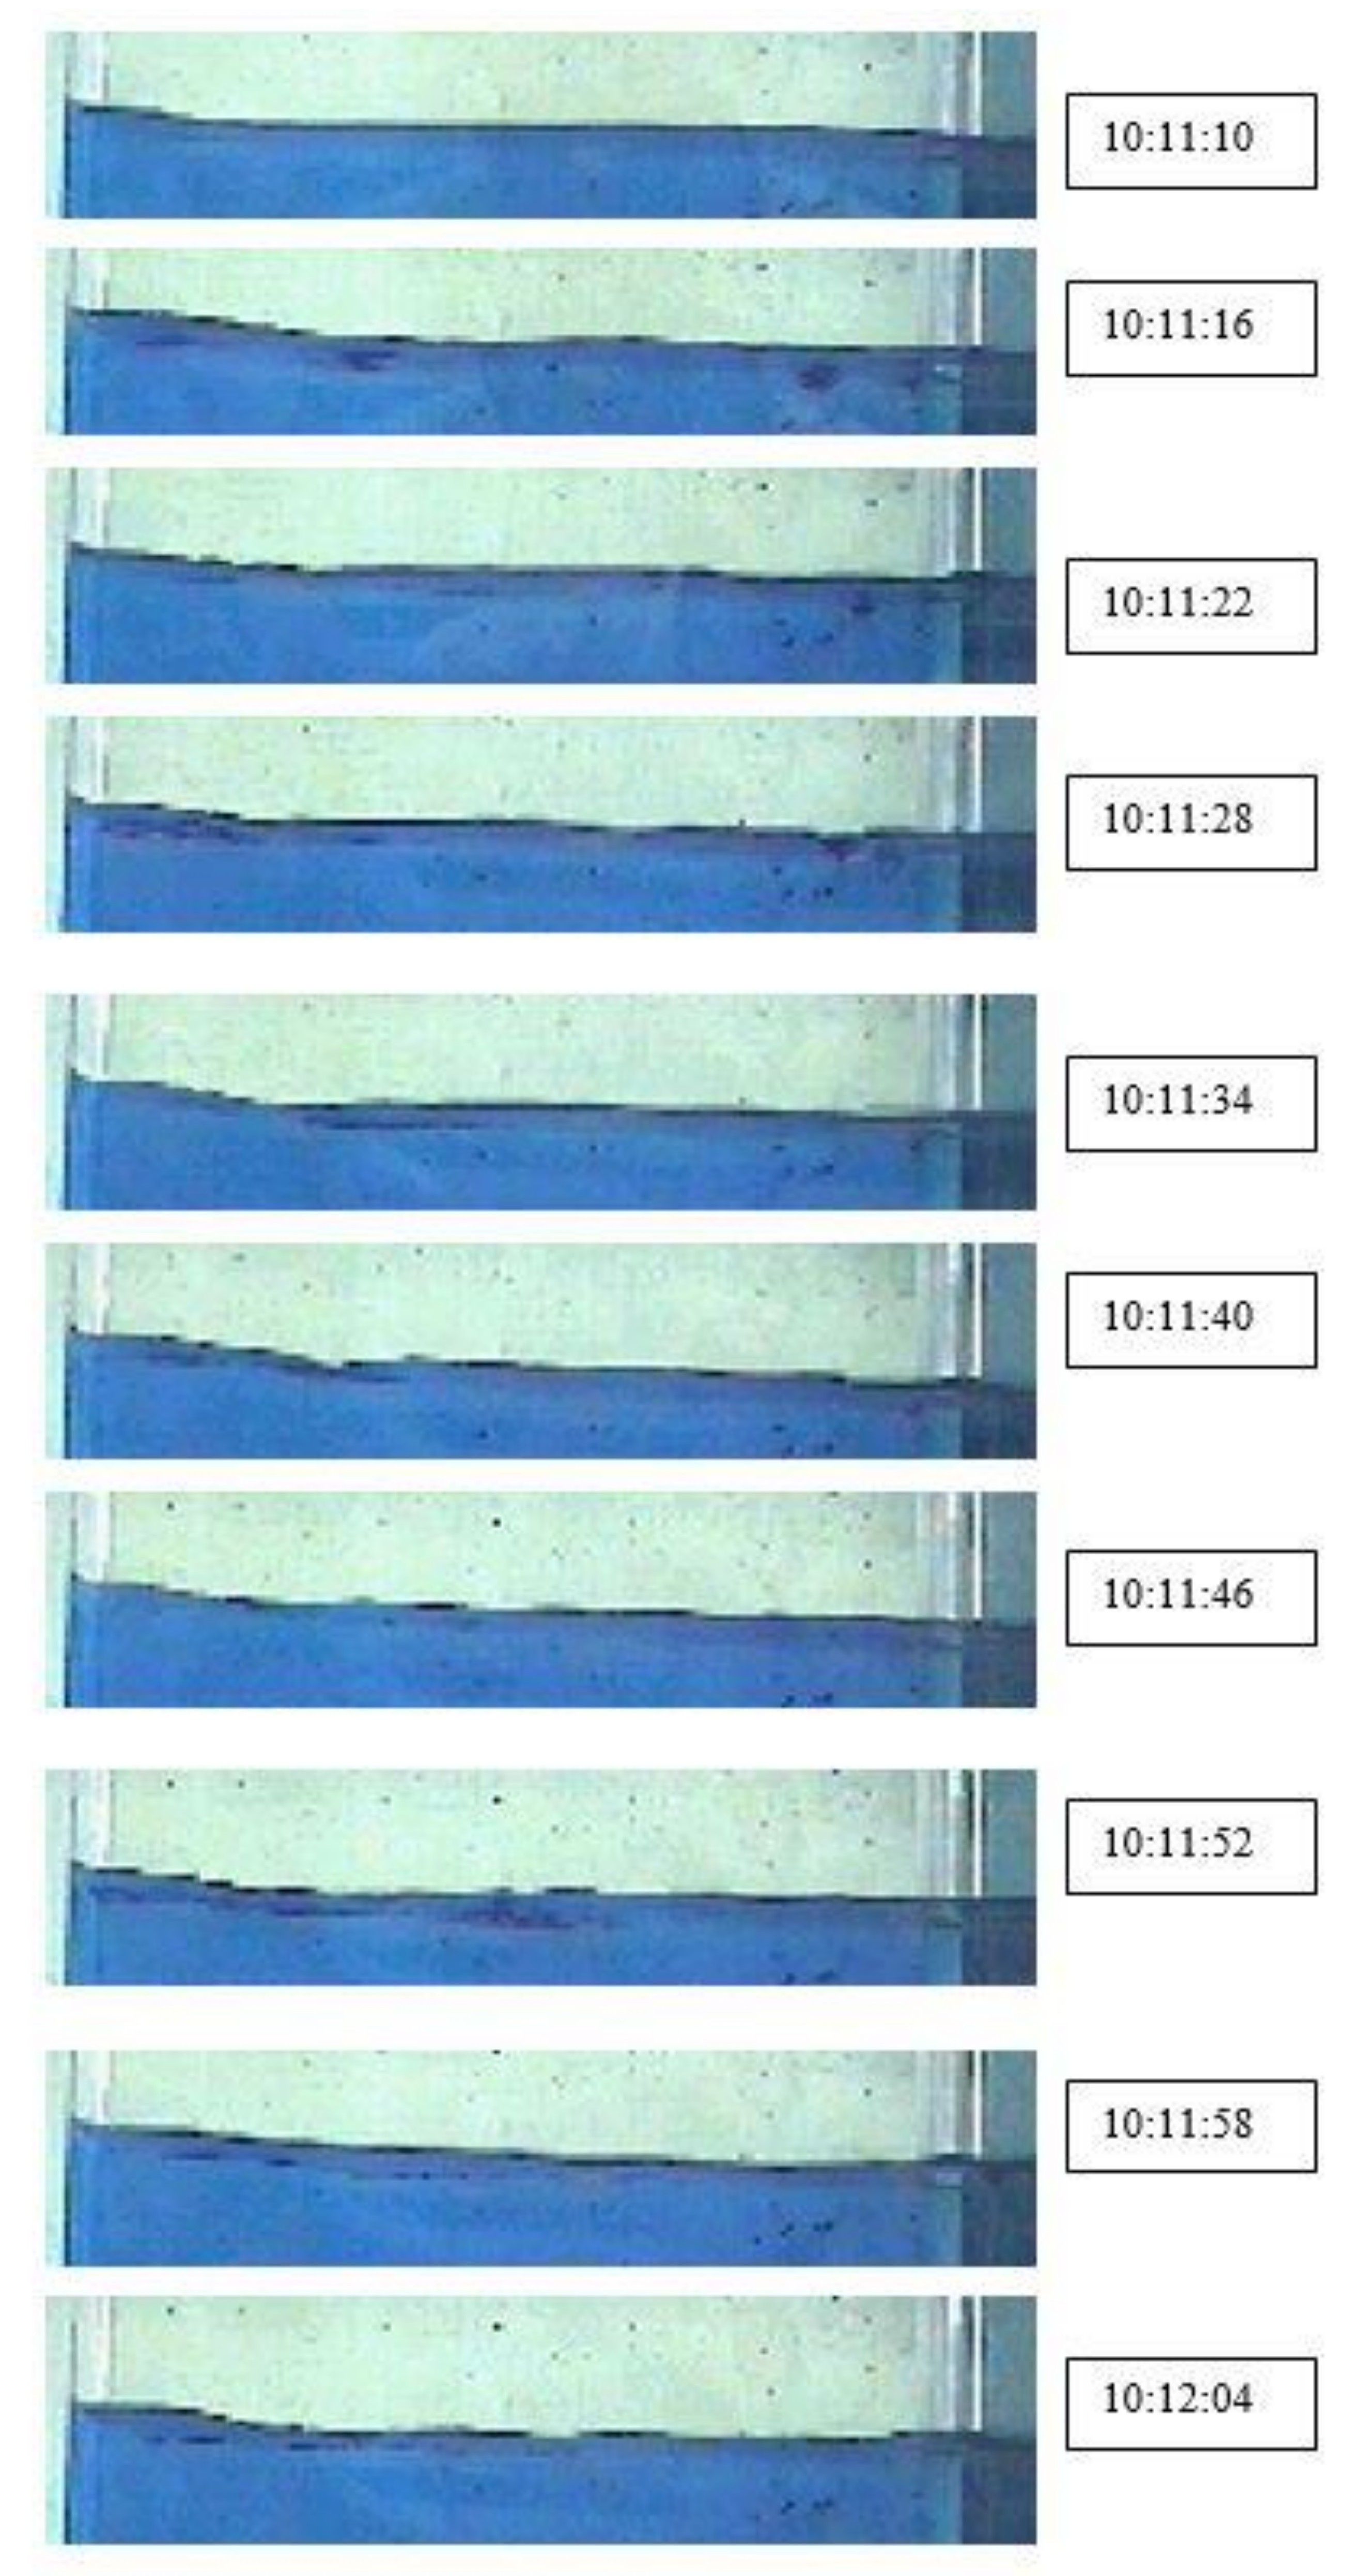
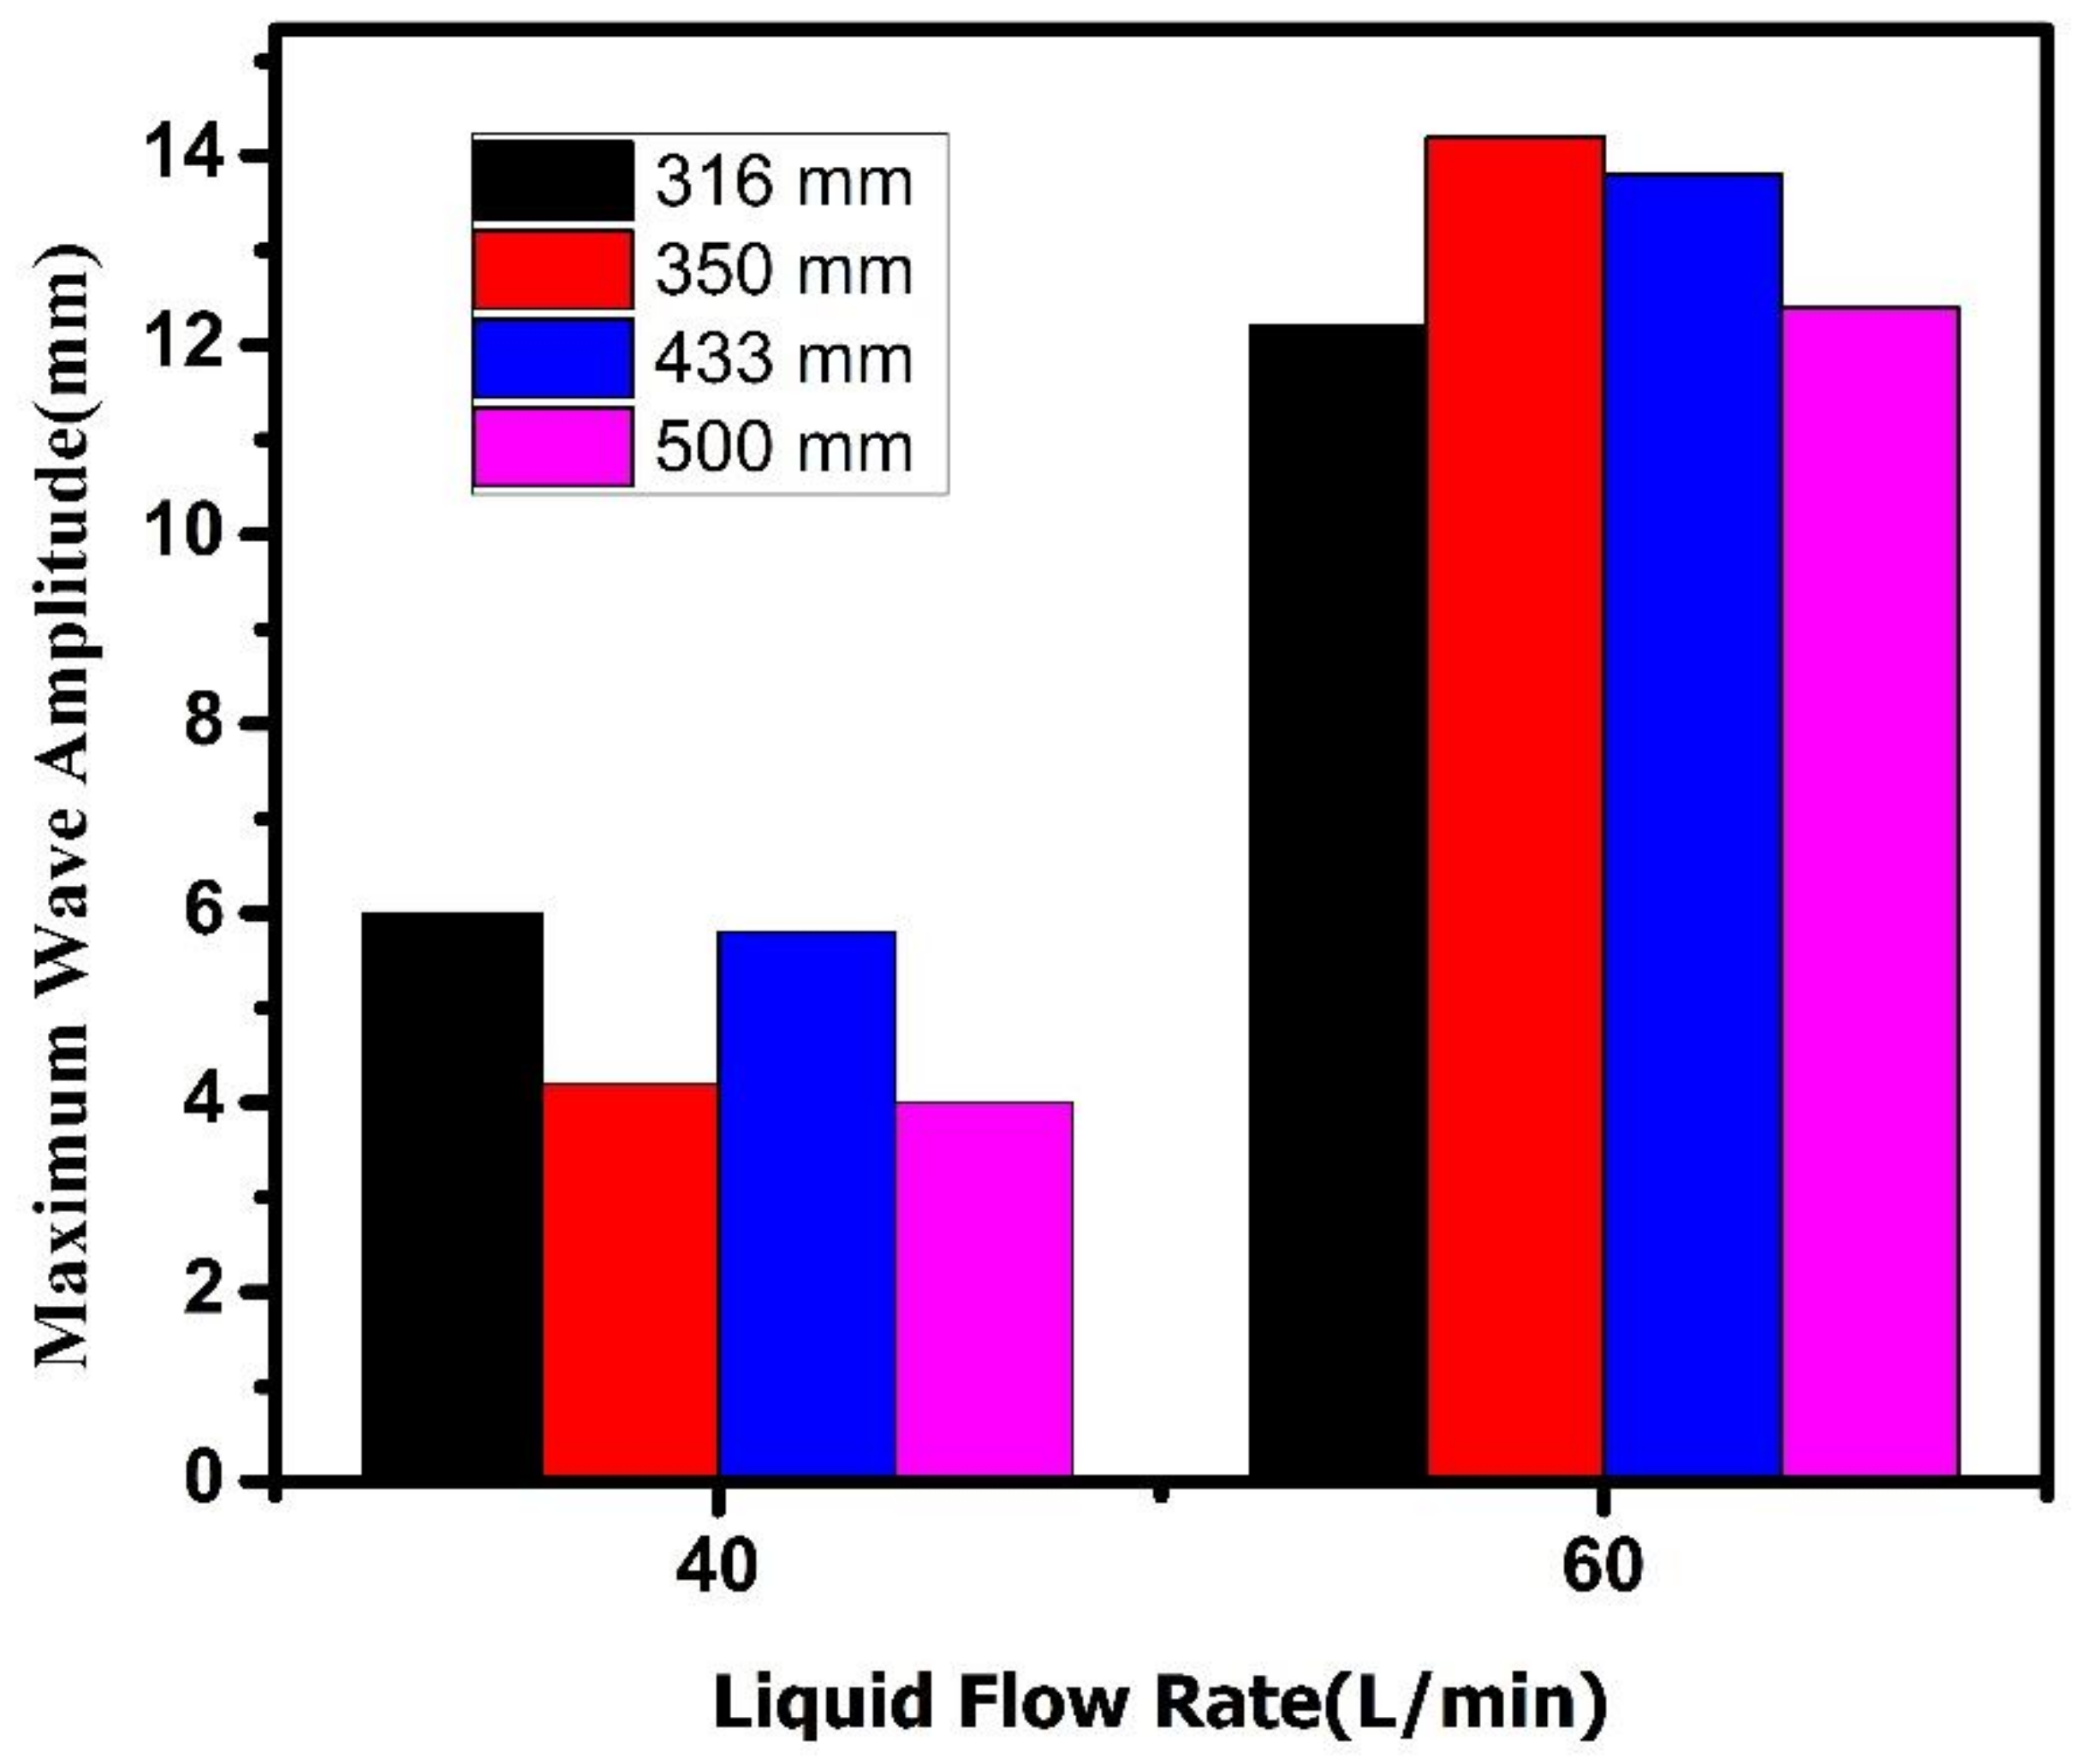
The maximum meniscus profile generated for each experiment was used to compute the maximum surface wave amplitude. From the recording, different photographs were taken out, and by using an image processor (MATLAB, R2012a, Mathworks, Natick, MA, USA), various images of meniscus fluctuation were obtained, as shown in
Figure 6. It was observed that at a high flow rate of 60 L/min when compared to 40 L/min, there was a clear change in the maximum wave amplitude.
4.2. Effect of Different Section Sizes on Surface Fluctuation
Experiments were performed for four different section sizes (500 mm, 433 mm, 350 mm, and 316 mm) with three different SEN
S (0°, 15° downward, and 15° upward ports) under different liquid flow rates from the SEN. Different conditions of liquid flow rates were 40 L/min and 60 L/min from SEN.
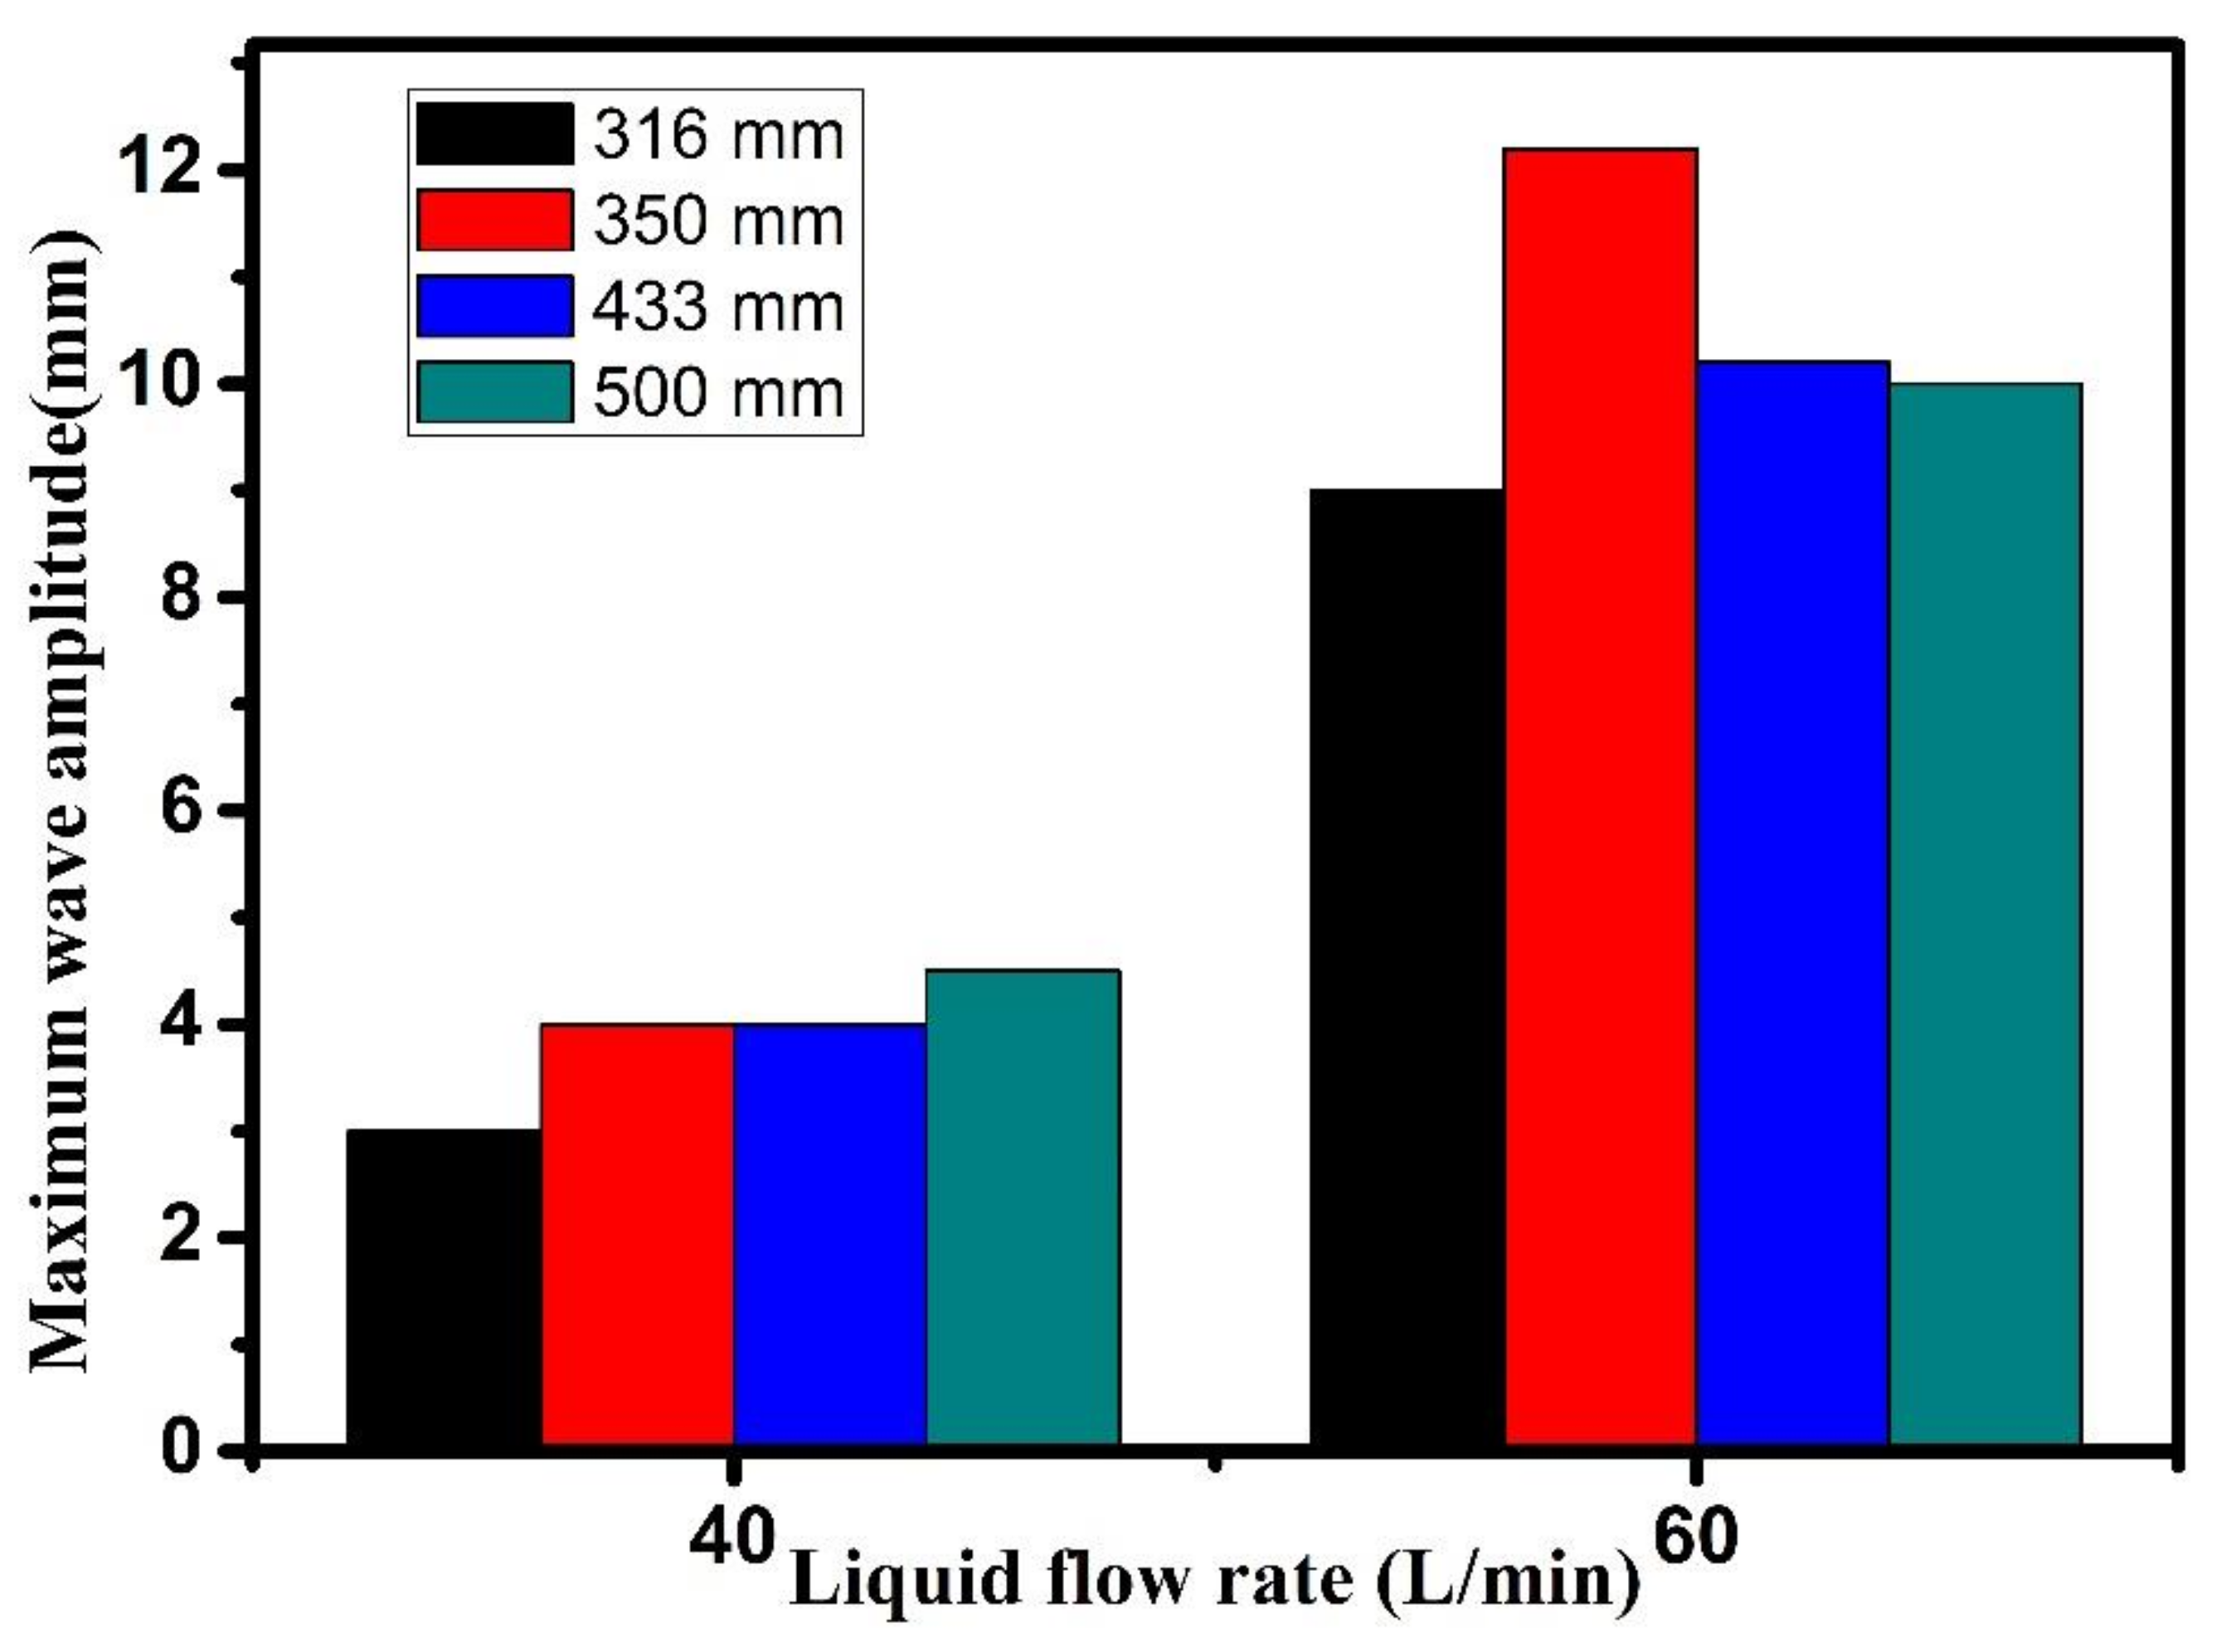
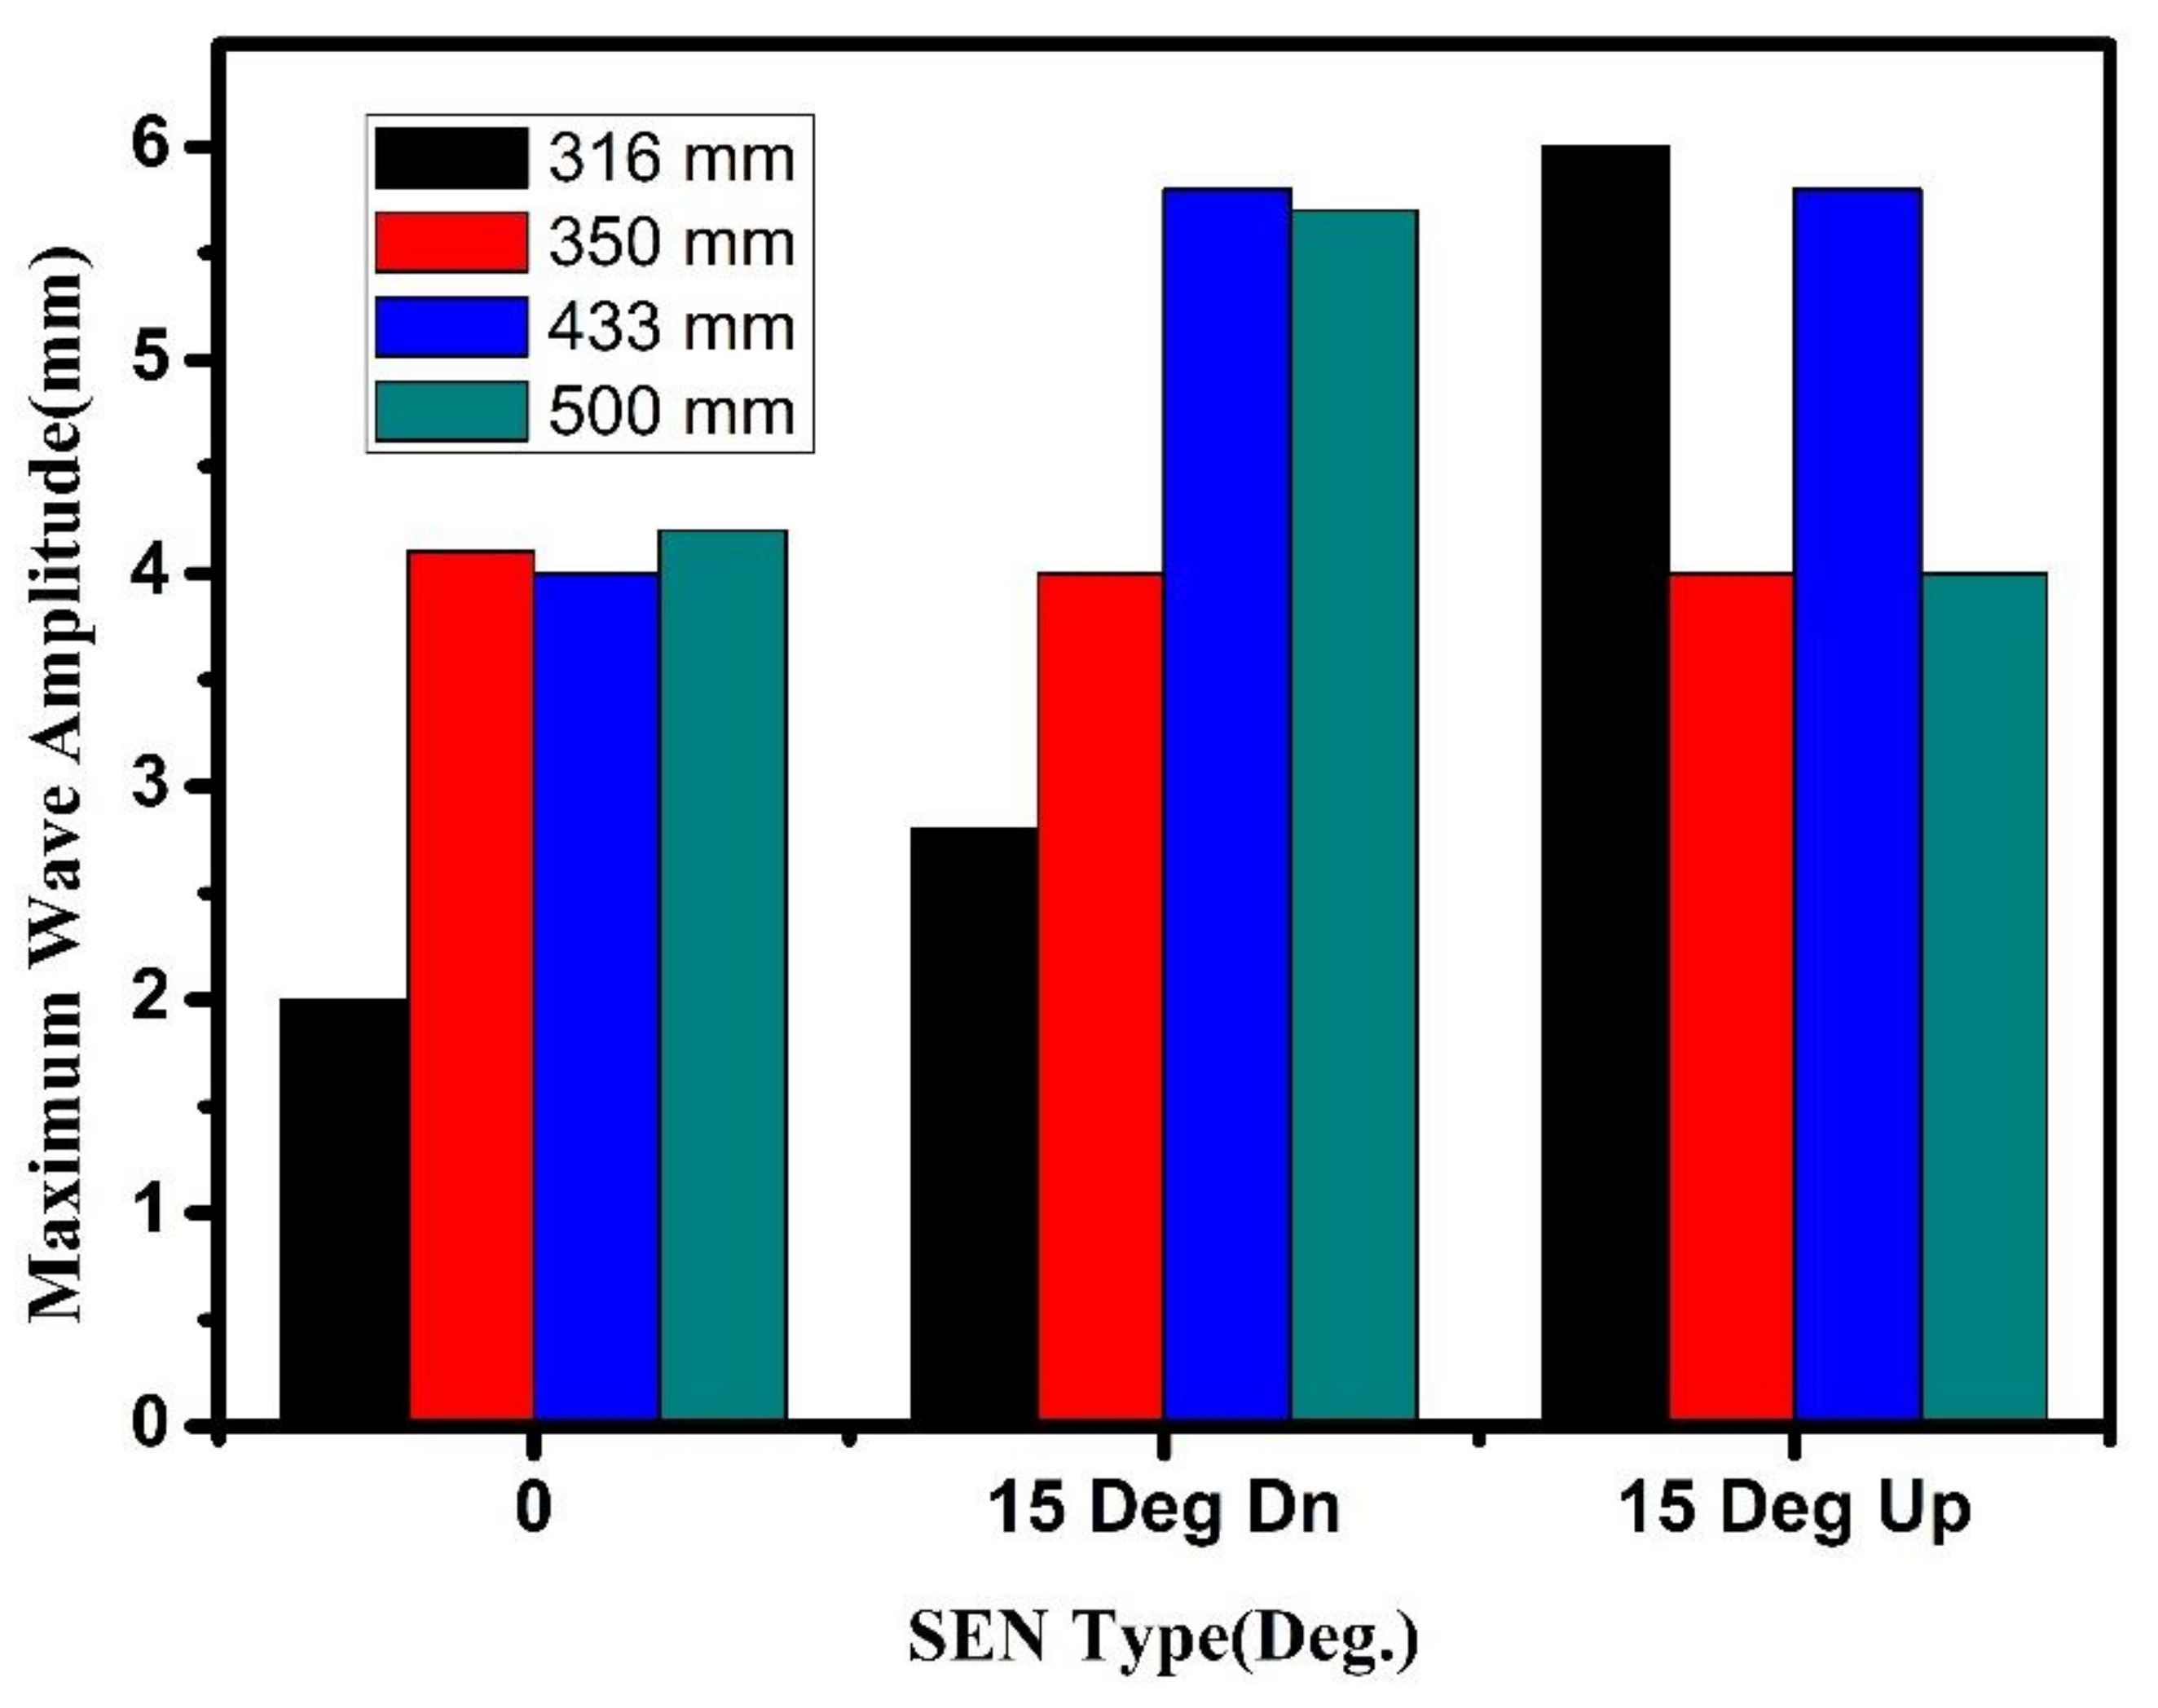
Figure 7 shows the maximum surface wave amplitude for a 0° port nozzle. The maximum surface wave amplitude increased with the increase of section size from 316 mm to 350 mm under all the conditions. However, an increase in the maximum wave amplitude with the liquid flow rate of 60 L/min from SEN was much higher when compared. From
Figure 7,
Figure 8 and
Figure 9 it can be seen that the nature of the curves remained very similar. The minimum wave fluctuation was found to be 2.8 mm at a flow rate of 40 L/min for the 0° port under the mould section of 316 mm. The maximum wave fluctuation found was to be 15.8 mm at a flow rate of 60 L/min for the 15° downward port under the mould section of 350 mm.
4.3. Effect of Different Submerged Entry Nozzles on Surface Fluctuations
Generally, it was expected that the nozzle with a downward angle would give lower meniscus fluctuation compared to the 0° port nozzle. It was found, though, that the nozzle with a downward angle gave a higher maximum fluctuation.
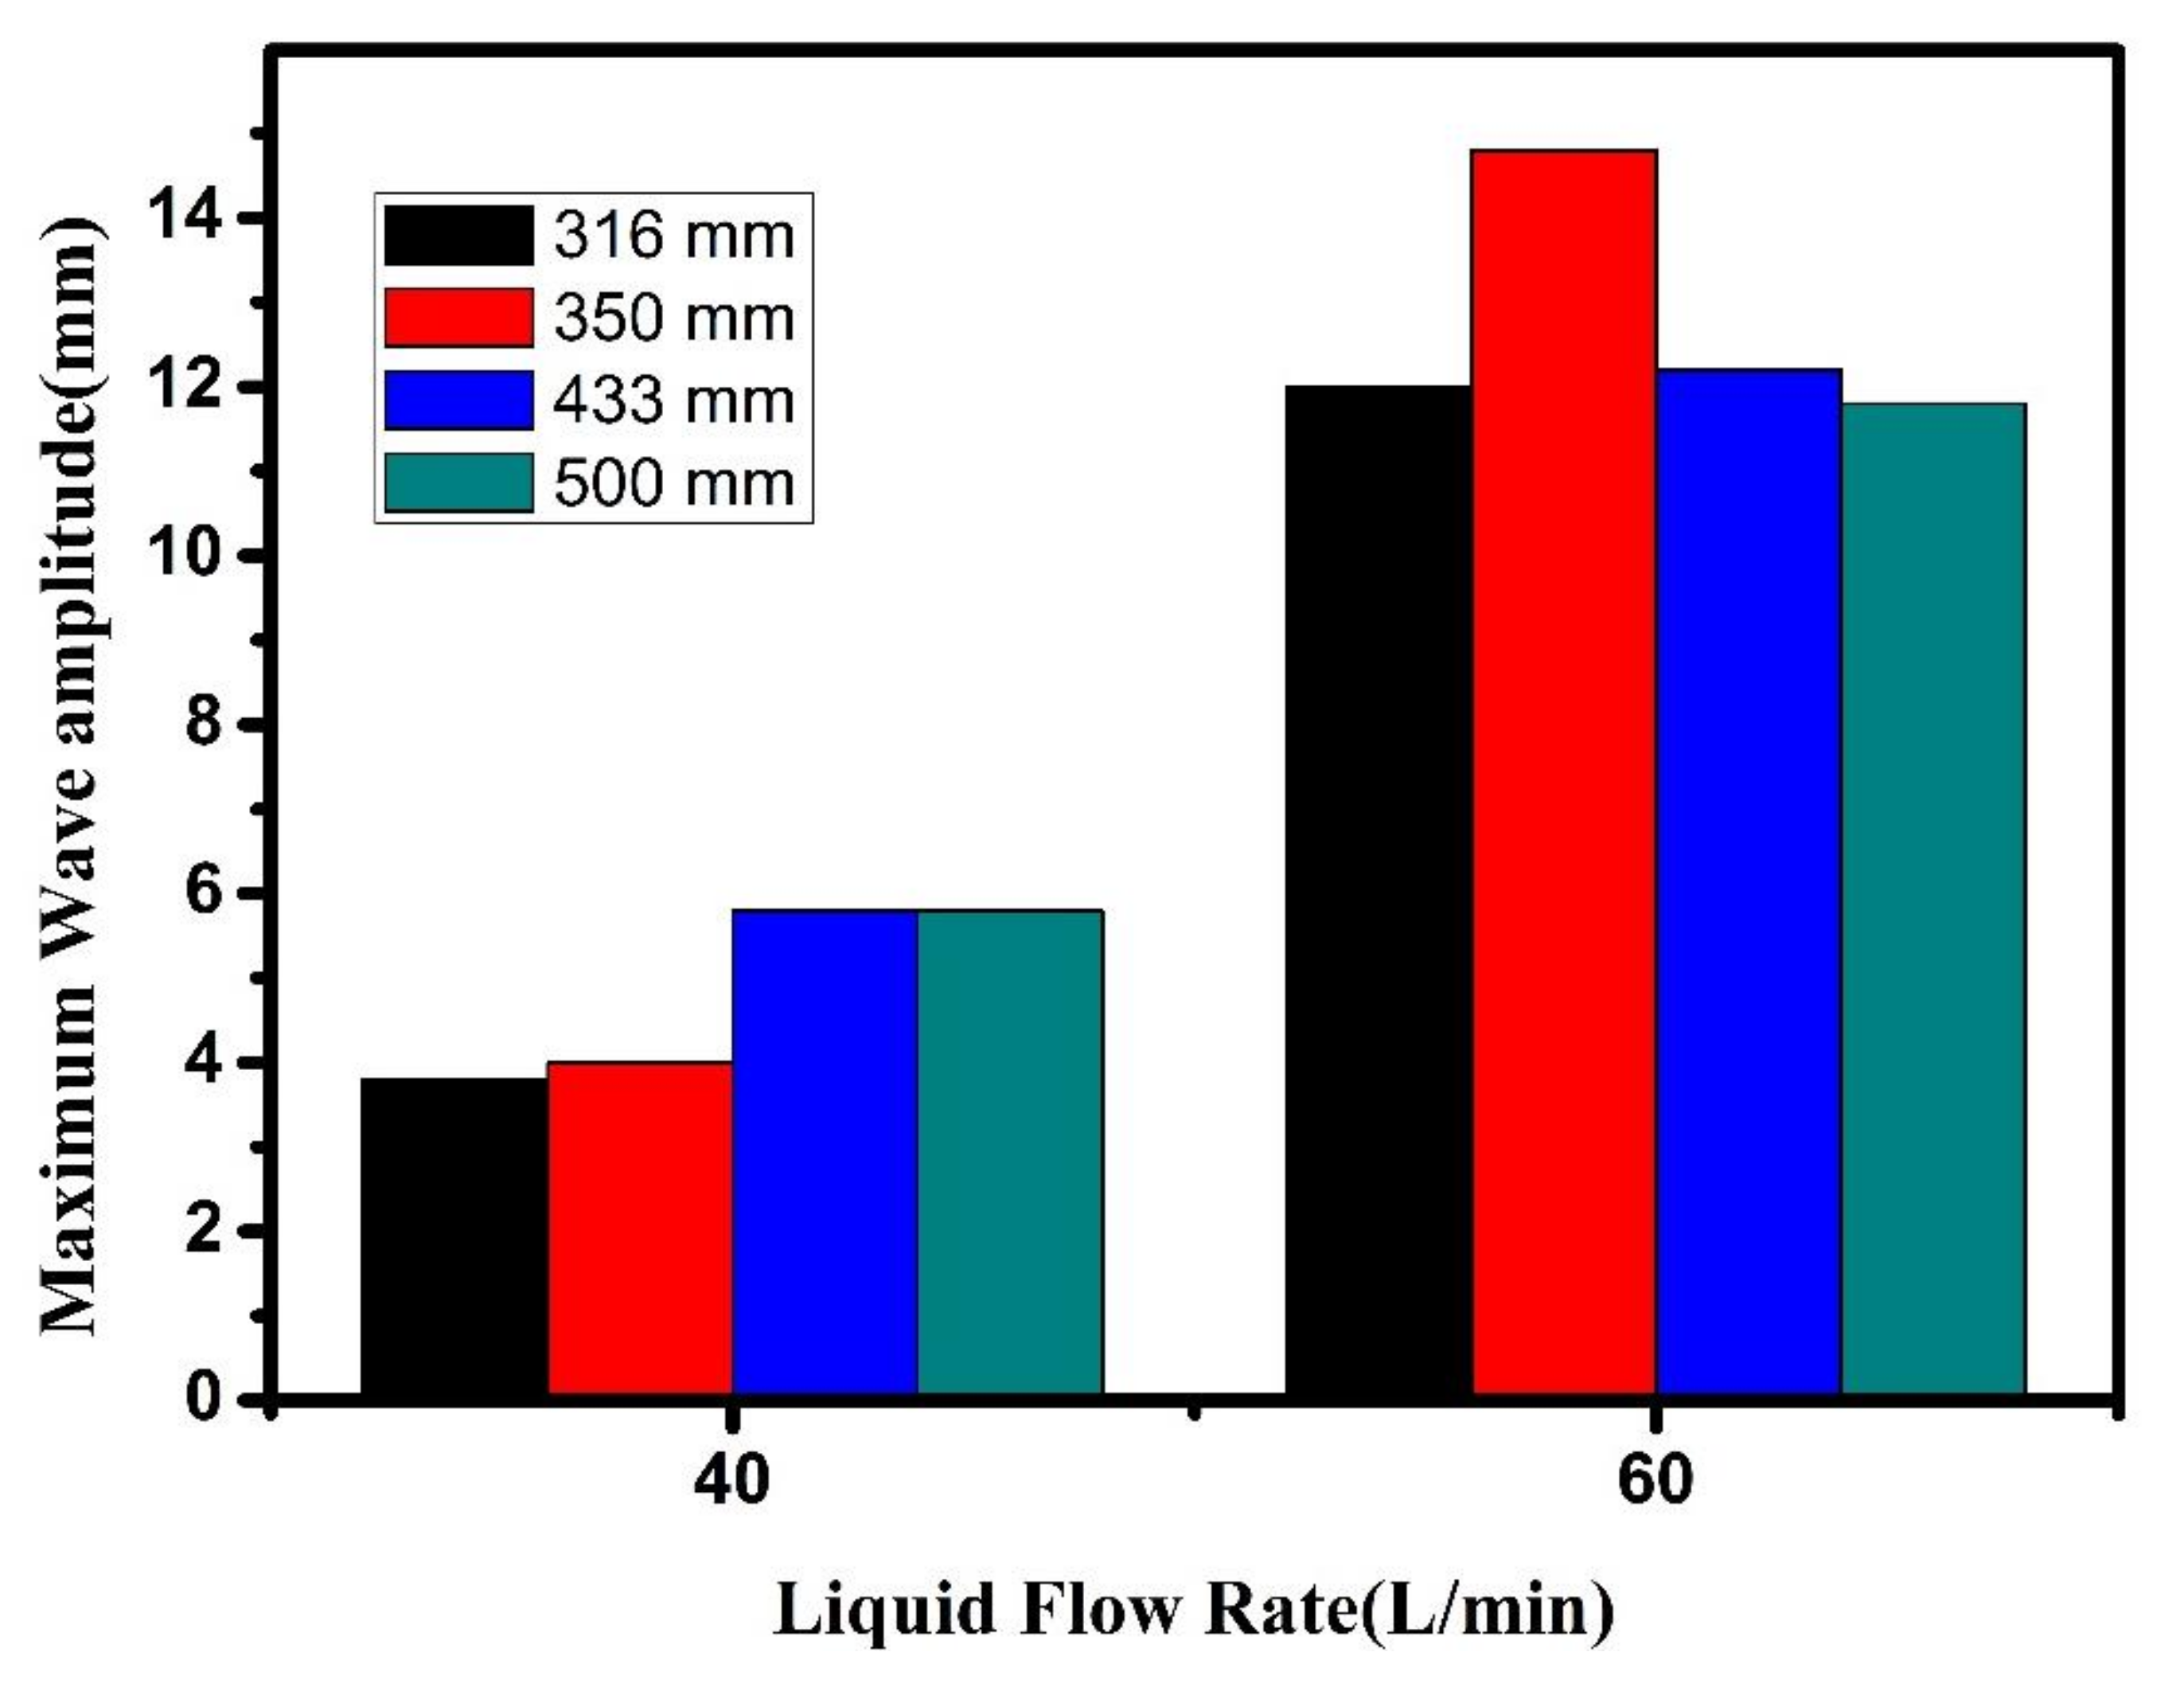
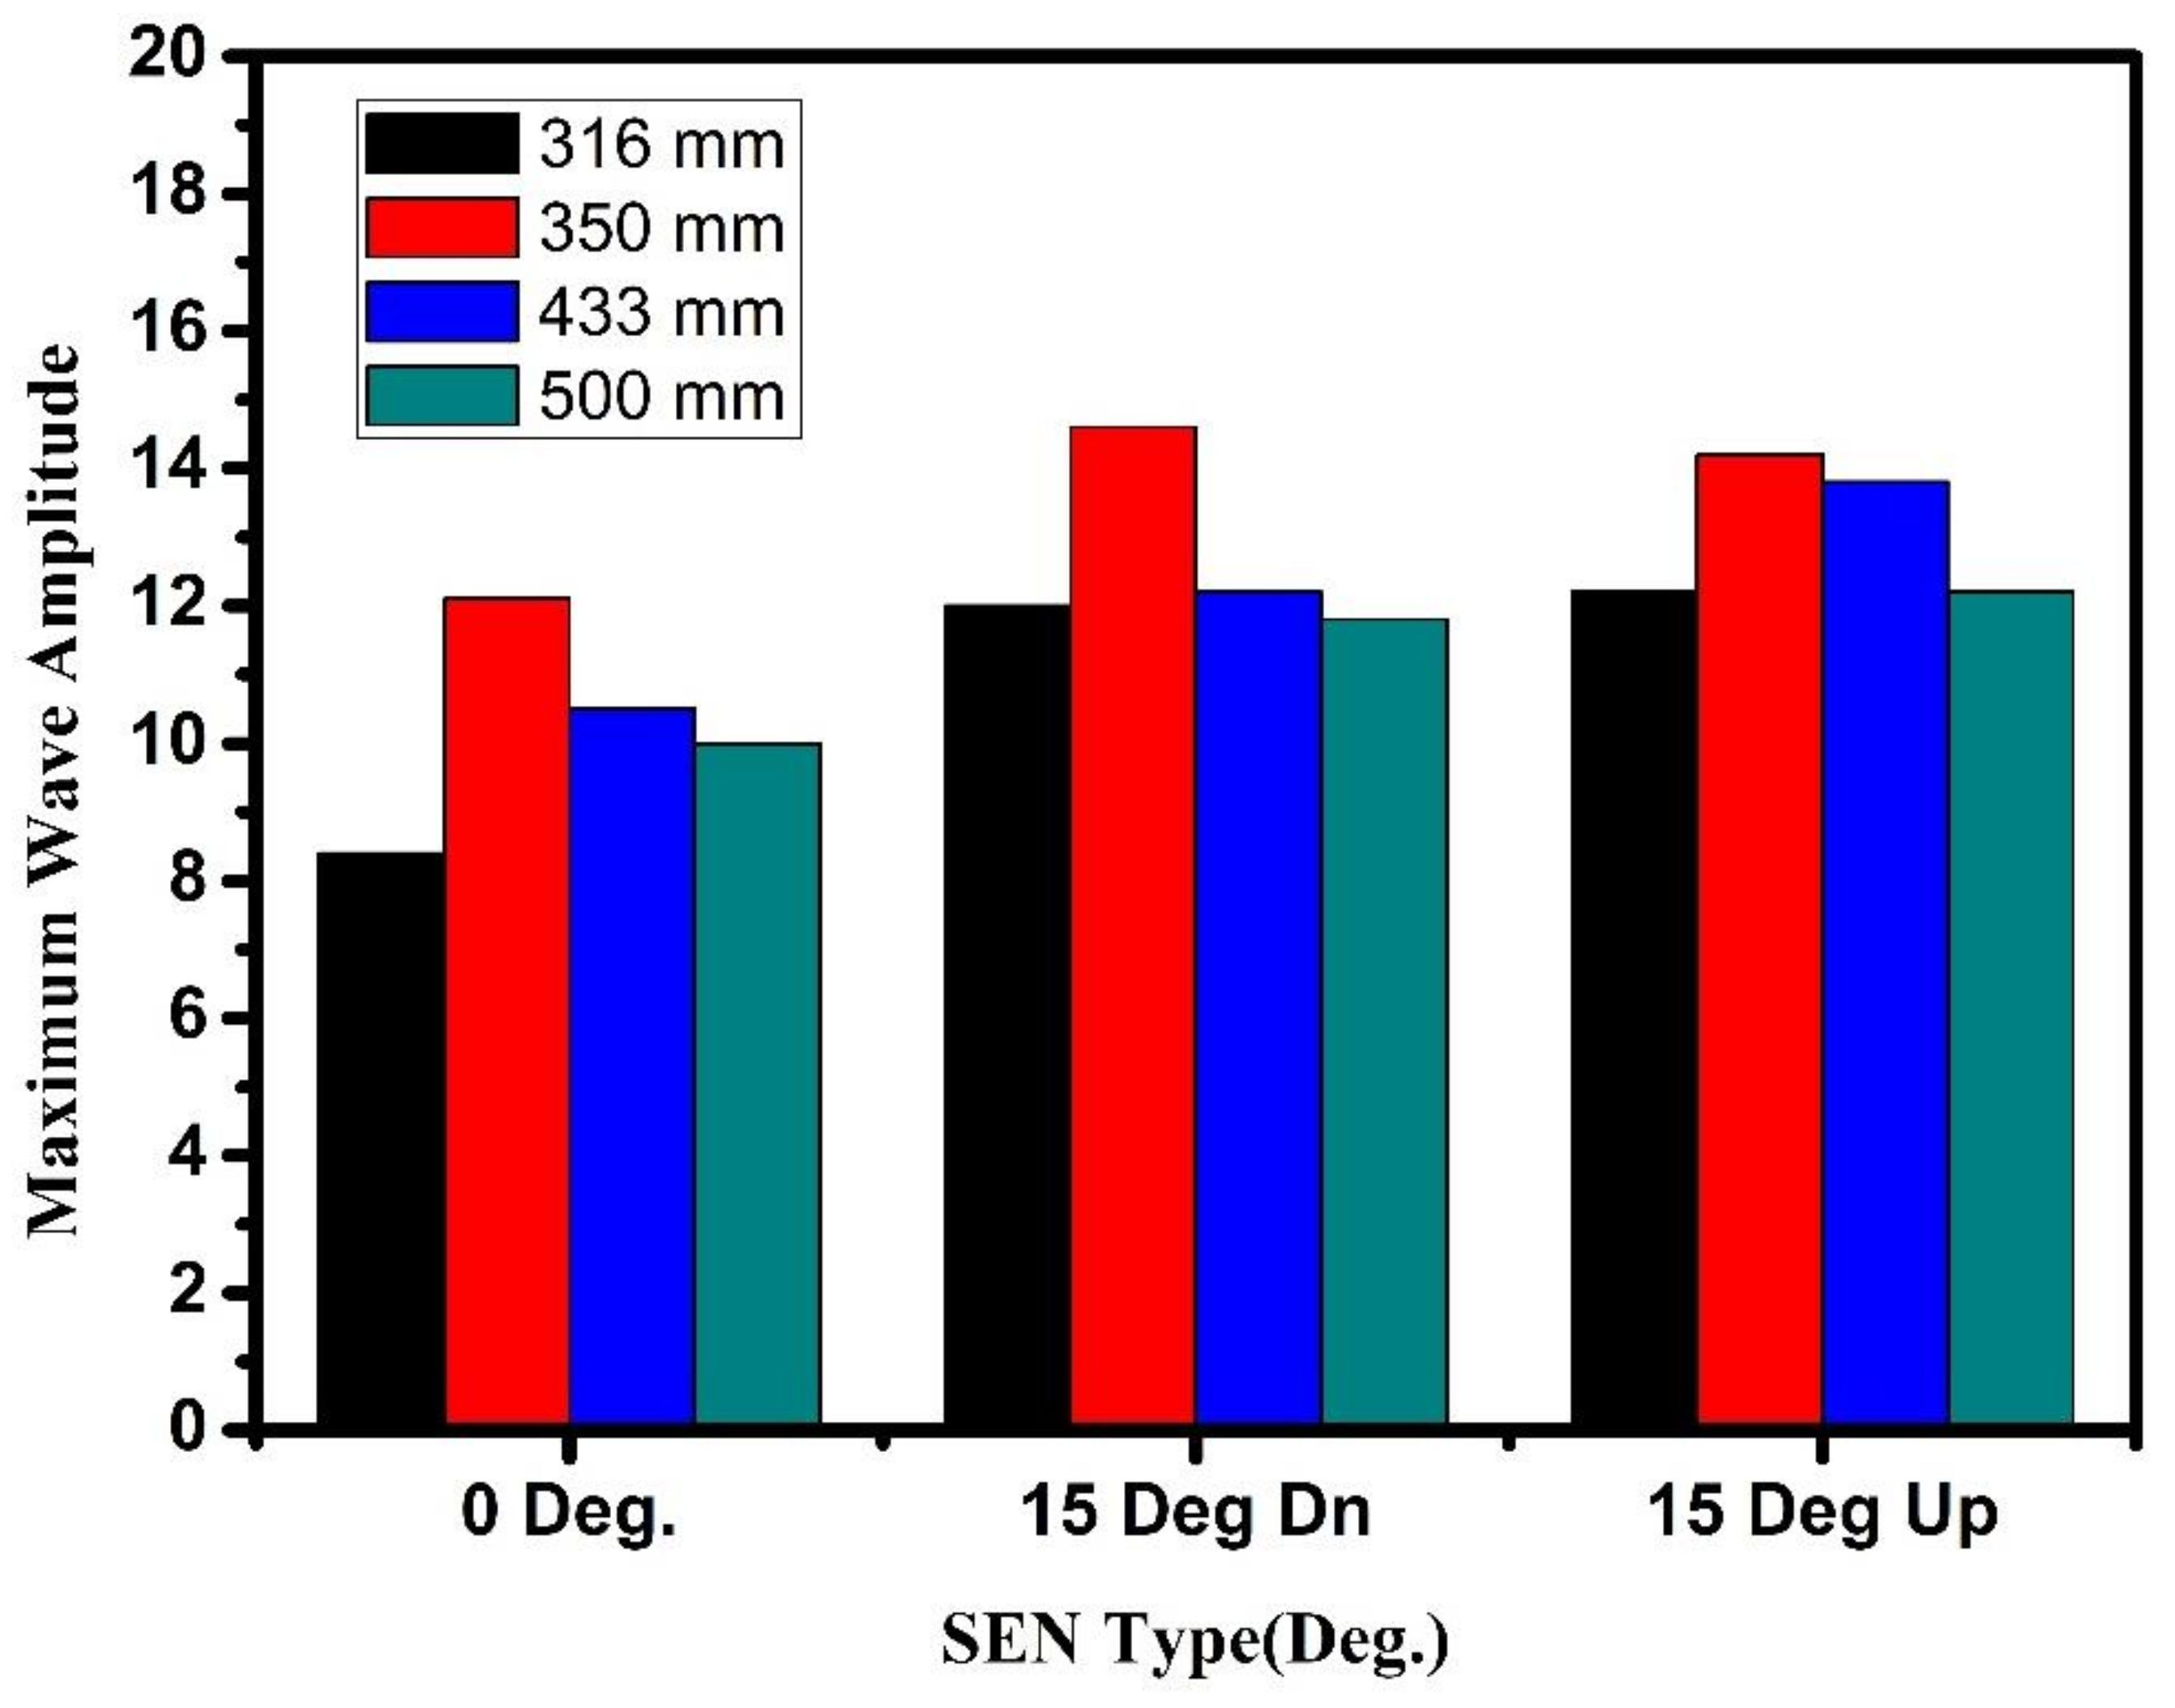
Figure 10 and
Figure 11 compare the performance of three different SEN
S, 0°, 15° downward, and 15° upward, at four different section sizes and operating conditions with respect to the maximum surface wave amplitude. It can be observed from the
Figure 10 and
Figure 11 that the maximum surface wave amplitude increased with the change of SEN from 0° to 15° downward with most of the section sizes. However, the maximum surface wave amplitude decreased with some of section size (350 mm) as the nozzle was changed from 0° to 15° downward nozzle.
At the liquid flow rate of 40 L/min from SEN, the maximum surface wave amplitude increased with the change of nozzle from 0° to 15° downward nozzle and section size beyond 350 mm. The maximum surface wave amplitude remained the same with a 15° upward nozzle as compared with a 15° downward nozzle with many of the operating conditions and section sizes. It was observed that the maximum surface wave amplitude at the lower section size (350 mm) either increased or remained constant with the change of nozzle to 15◦ upward compared to a 15° downward nozzle and at all the operating conditions considered. At a higher section size (350 mm and above), the maximum surface wave amplitude either remained constant or decreased with a 15° upward nozzle compared to a 15° downward nozzle at all operating conditions. A higher flow rate leads to a higher surface wave in the mould, which results in higher upward velocities. An increase in momentum of the liquid jet leads to an increase in surface wave amplitude [
22].
It can be concluded from
Figure 10 that a 0° nozzle gives lower maximum surface wave amplitude compared to a 15° downward nozzle for a mould section size more than 350 mm at lower liquid flow rates. The minimum wave fluctuation found was 2 mm at a 0° port nozzle at 40 L/min flow rates under a mould section size of 316 mm. The maximum wave fluctuation was 14.6 mm at a 15° downward port nozzle at 60 L/min flow rates under a mould section size of 350 mm.
5. Conclusions
In the present analysis, water model experiments were carried out in a model with a scale-down ratio of 0.33. The present investigation shows how different types of mould section size and different SEN port angles affect meniscus fluctuation and further provides necessary background information for the steel maker. Based on the experiment performed and the above analysis, the following conclusion has been made.
The meniscus profile was wavy with a crest and a trough on either side of the nozzle. It keeps on fluctuating at any casting speed.
The maximum and average wave amplitude was increasing with the decrease in submergence depth.
A submerged entry nozzle with a 0° port was found to be superior compared to 15° downward and 15° upward nozzles.
As the water flow rate increased, the maximum wave amplitude was found to be increasing, which results in more turbulence. It was clear from the observation that a 15° downward port nozzle has higher maximum wave amplitude compared to a 0° port nozzle. Due to a strong upper recirculation zone, the water reached to the meniscus with higher momentum and gave more fluctuations at the meniscus.
The maximum wave amplitude was found to be much higher at 60 L/min compared to a 40 L/min water flow rate. For all three nozzles (0°, 15° downward, and 15° upward), 15° downward and 15° upward nozzles were found to give a higher maximum wave amplitude compared to the 0° port at all the flow rates studied.
When the flow rate of liquid was 40 L/min, the maximum surface wave amplitude increased with the change of nozzle from 0° to 15° downward nozzle and section size beyond 350 mm.
It was observed that the maximum surface wave amplitude at the lower section size (316 mm) either increased or remained constant with the change of nozzle to 15° upward compared to a 15° downward nozzle and at all the operating conditions considered. At a higher section size (350 mm and above), the maximum surface wave amplitude either remained constant or decreased with a 15° upward nozzle compared to a 15° downward nozzle at all operating conditions.


