
Low-Energy Optical Conductivity of TaP: Comparison of Theory and Experiment


1
Max-Planck-Institut für Festkörperforschung, Heisenbergstr. 1, 70569 Stuttgart, Germany
2
1. Physikalisches Institut, Universität Stuttgart, 70569 Stuttgart, Germany
*
Author to whom correspondence should be addressed.
Crystals 2021, 11(5), 567; https://0-doi-org.brum.beds.ac.uk/10.3390/cryst11050567
Submission received: 25 March 2021
/
Revised: 10 May 2021
/
Accepted: 17 May 2021
/
Published: 19 May 2021
(This article belongs to the Special Issue Advances in Topological Materials)
Abstract
:The ab-plane optical conductivity of the Weyl semimetal TaP is calculated from the band structure and compared to the experimental data. The overall agreement between theory and experiment is found to be best when the Fermi level is slightly (20 to 60 meV) shifted upwards in the calculations. This confirms a small unintentional doping of TaP, reported earlier, and allows a natural explanation of the strong low-energy (50 meV) peak seen in the experimental ab-plane optical conductivity: this peak originates from transitions between the almost parallel non-degenerate electronic bands split by spin-orbit coupling. The temperature evolution of the peak can be reasonably well reproduce by calculations using an analog of the Mott formula.
1. Introduction
Weyl fermions [1] are known to be observed as elementary excitations in condensed-matter systems—the Weyl semimetals (WSMs) [2,3,4,5,6,7,8]. In WSMs, the valence and conduction bands touch each other at selected points of the Brillouin zone (BZ), the Weyl nodes.
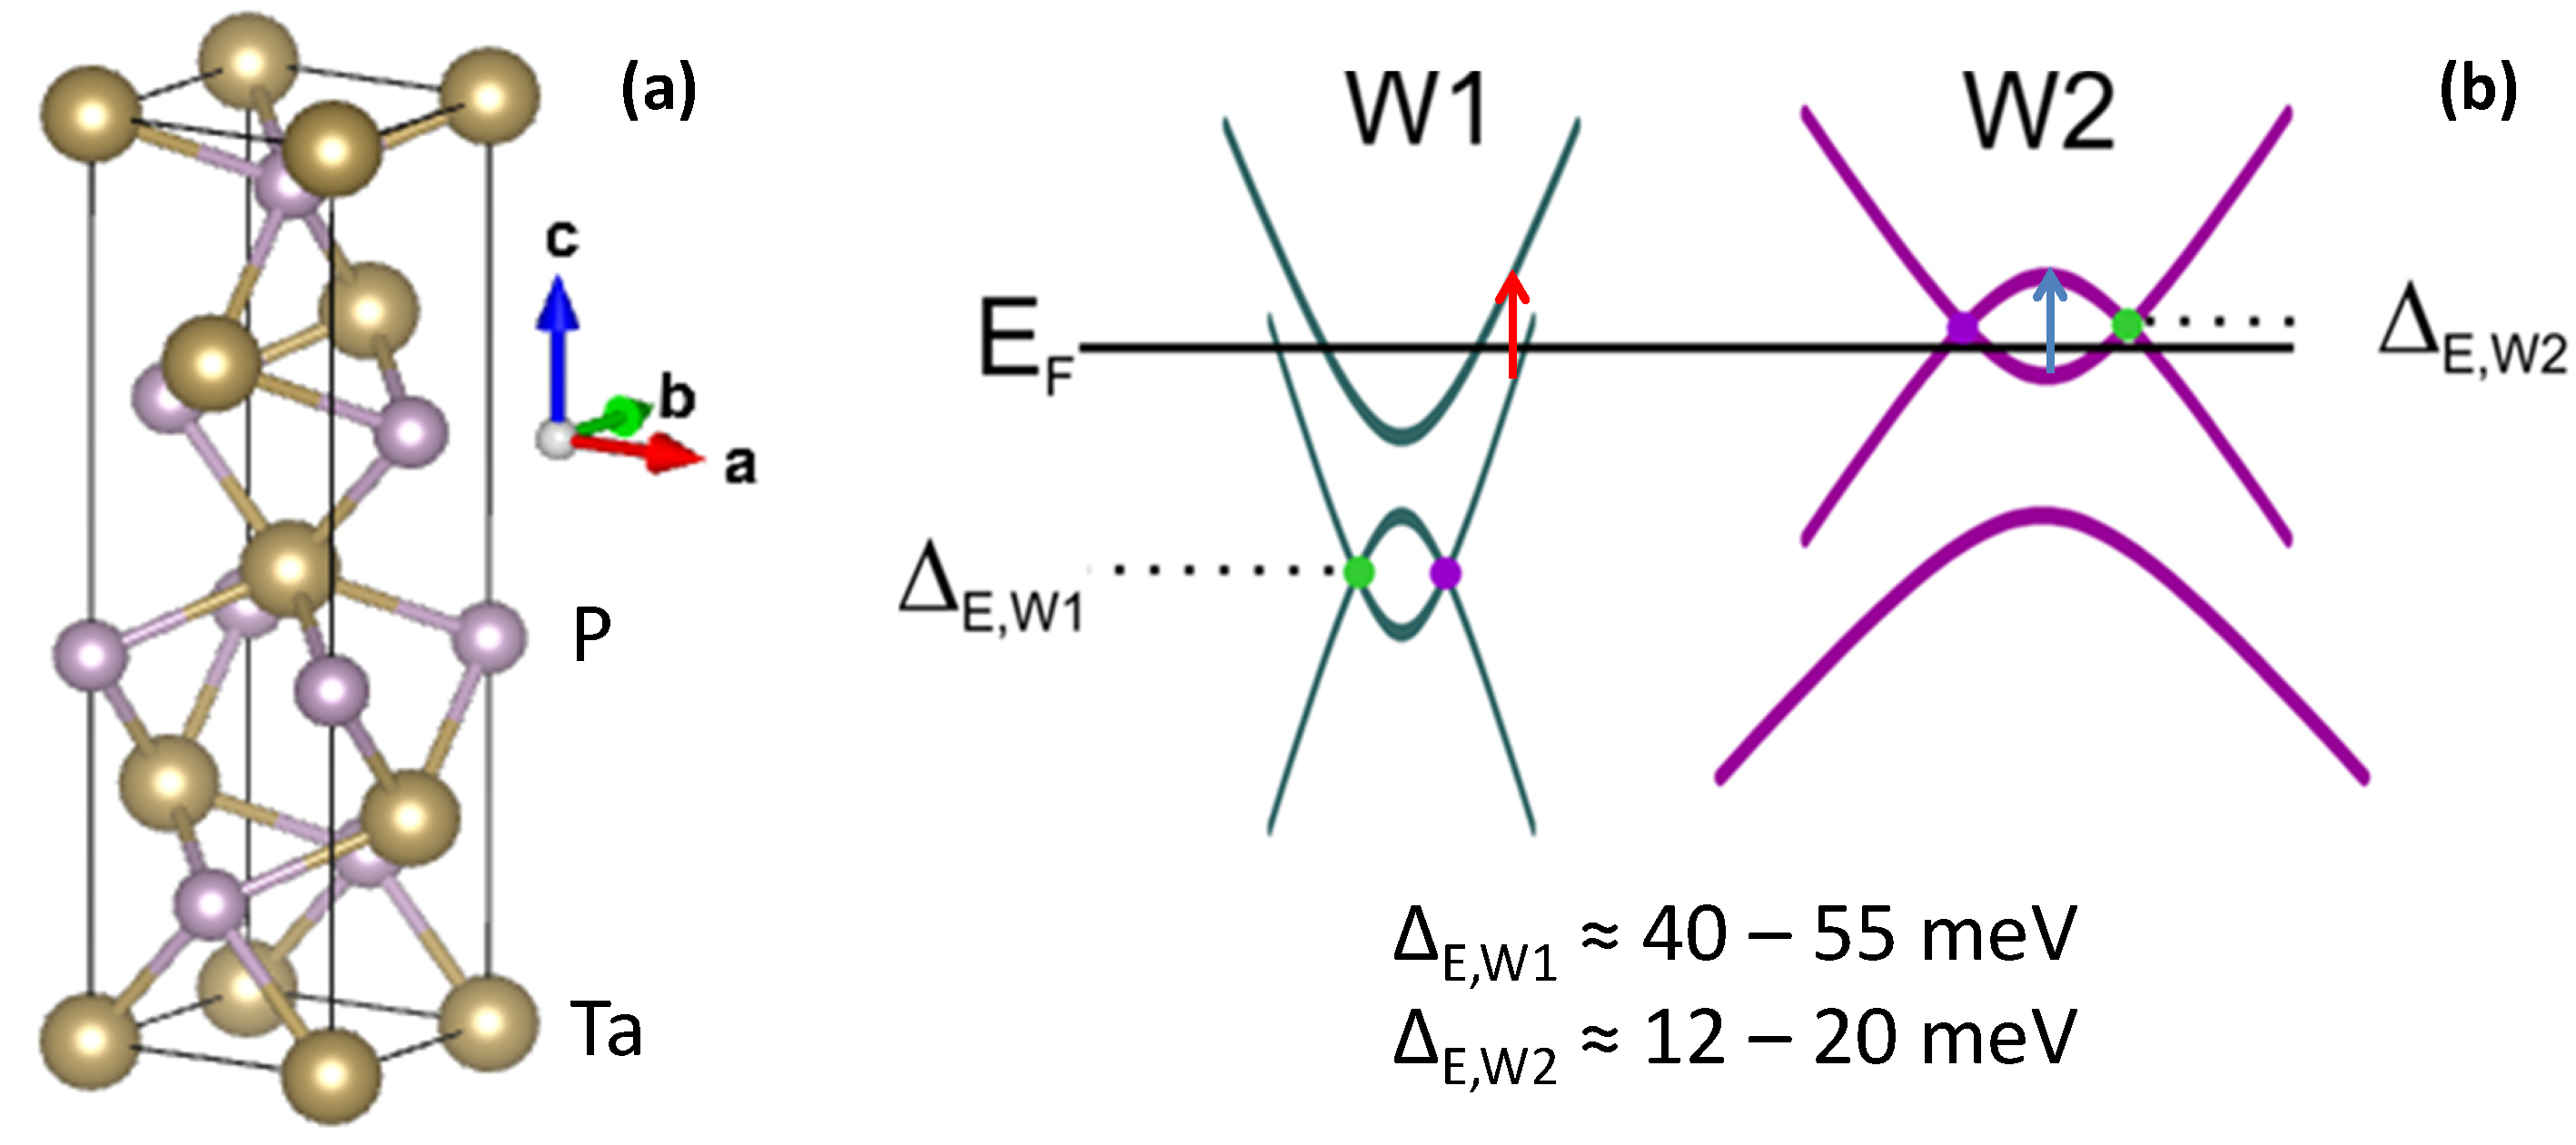
TaP belongs to the currently most studied family of WSMs, which also includes NbP, TaAs, and NbAs. These materials are nonmagnetic non-centrosymmetric WSMs with 24 Weyl nodes of two different types, usually dubbed as W1 (8 nodes) and W2 (16 nodes) [5,9,10,11,12,13]. The available band-structure calculations predict that in TaP the W1 nodes are situated some 40 to 55 meV below the Fermi level , while the W2 nodes are at 12 to 20 meV above it [11,12,13], see Figure 1.
The low-energy band structure of TaP and other WSMs determines their peculiar physical properties [14]. One way to experimentally probe the band structure at low energies is optical spectroscopy in the infrared (particularly, in the far-infrared) region [15]. The frequency-dependent conductivity, , of three-dimensional linear bands has been well studied theoretically using model Hamiltonians [16,17,18,19,20,21,22,23]. It has been shown that the interband portion of for a single isotropic Weyl band has to follow a linear frequency dependence [16,17,18]:
where is the band Fermi velocity (this formula is obtained assuming the electron-hole symmetry). Such linear behavior of at low energies has indeed been observed in a number of established three-dimensional Weyl and Dirac semimetals, as well as in candidate materials [24,25,26,27,28,29,30].
In many real materials of this type, however, the linear interband conductivity at low energies is (partly) masked by other features, such as intraband (Drude) conductivity or resonance-like interband contributions [30,31,32,33,34,35]. Particularly strong low-energy peak was observed in TaP [30,35]. In Ref. [30], this peak was assigned to electron-hole pair excitations near the saddle points of the crossing bands, which form the Weyl nodes (Figure 1). To our knowledge, this assignment doesn’t have a direct support from optical-conductivity calculations based on band structure. Also, the total number of states near the saddle points is relatively low. Hence, only relatively small kinks in the optical conductivity, rather than strong peaks, are expected in this situation [20,34]. On the other hand, our earlier study of the sister compound NbP [34] has demonstrated that the low-energy peaks, similar to the one in TaP, appear in NbP and are due to multiple transitions between almost parallel bands split by spin-orbit coupling (SOC). Based on our band structure calculations, we argue in this paper that the same explanation of its low-energy peak holds also for TaP.
2. Results and Discussion
In Figure 2, we plot our experimental optical spectra presented earlier in Ref. [35]. The measurements have been done on the isotropic ab plane of TaP (cf. Figure 1). The prominent low-energy peak is clearly seen in the real part of the optical conductivity at 50 meV (it corresponds to a deep in the optical reflectivity).
To gain insight into the origin of this peak, we carried out band structure calculations within the local density approximation (LDA) based on the experimental crystal structure of TaP [36]. The calculations were performed using the linear muffin-tin orbital (LMTO) method [37] with the Perdew-Wang exchange-correlation potential [38]. We used the relativistic PY LMTO computer code [39] with SOC added to the LMTO Hamiltonian in the variational step. BZ integrations were done using the improved tetrahedron method [40]. Additional empty spheres (E) were inserted at the 8b Wyckoff positions in order to minimize the effect of atomic sphere overlap. The Ta, P, and E states up to the maximal orbital quantum number , 2, and, 1, respectively, were included into the LMTO basis set which is essential for calculation of the dipole matrix elements for the interband transitions involving the Ta d- and the P p-derived bands. When calculating the real part of the optical conductivity, we used the tetrahedron method on a dense k-mesh in order to resolve interband transitions between the SOC-split bands close to Weyl points [31,34]. No broadening has been applied to the computed spectra.
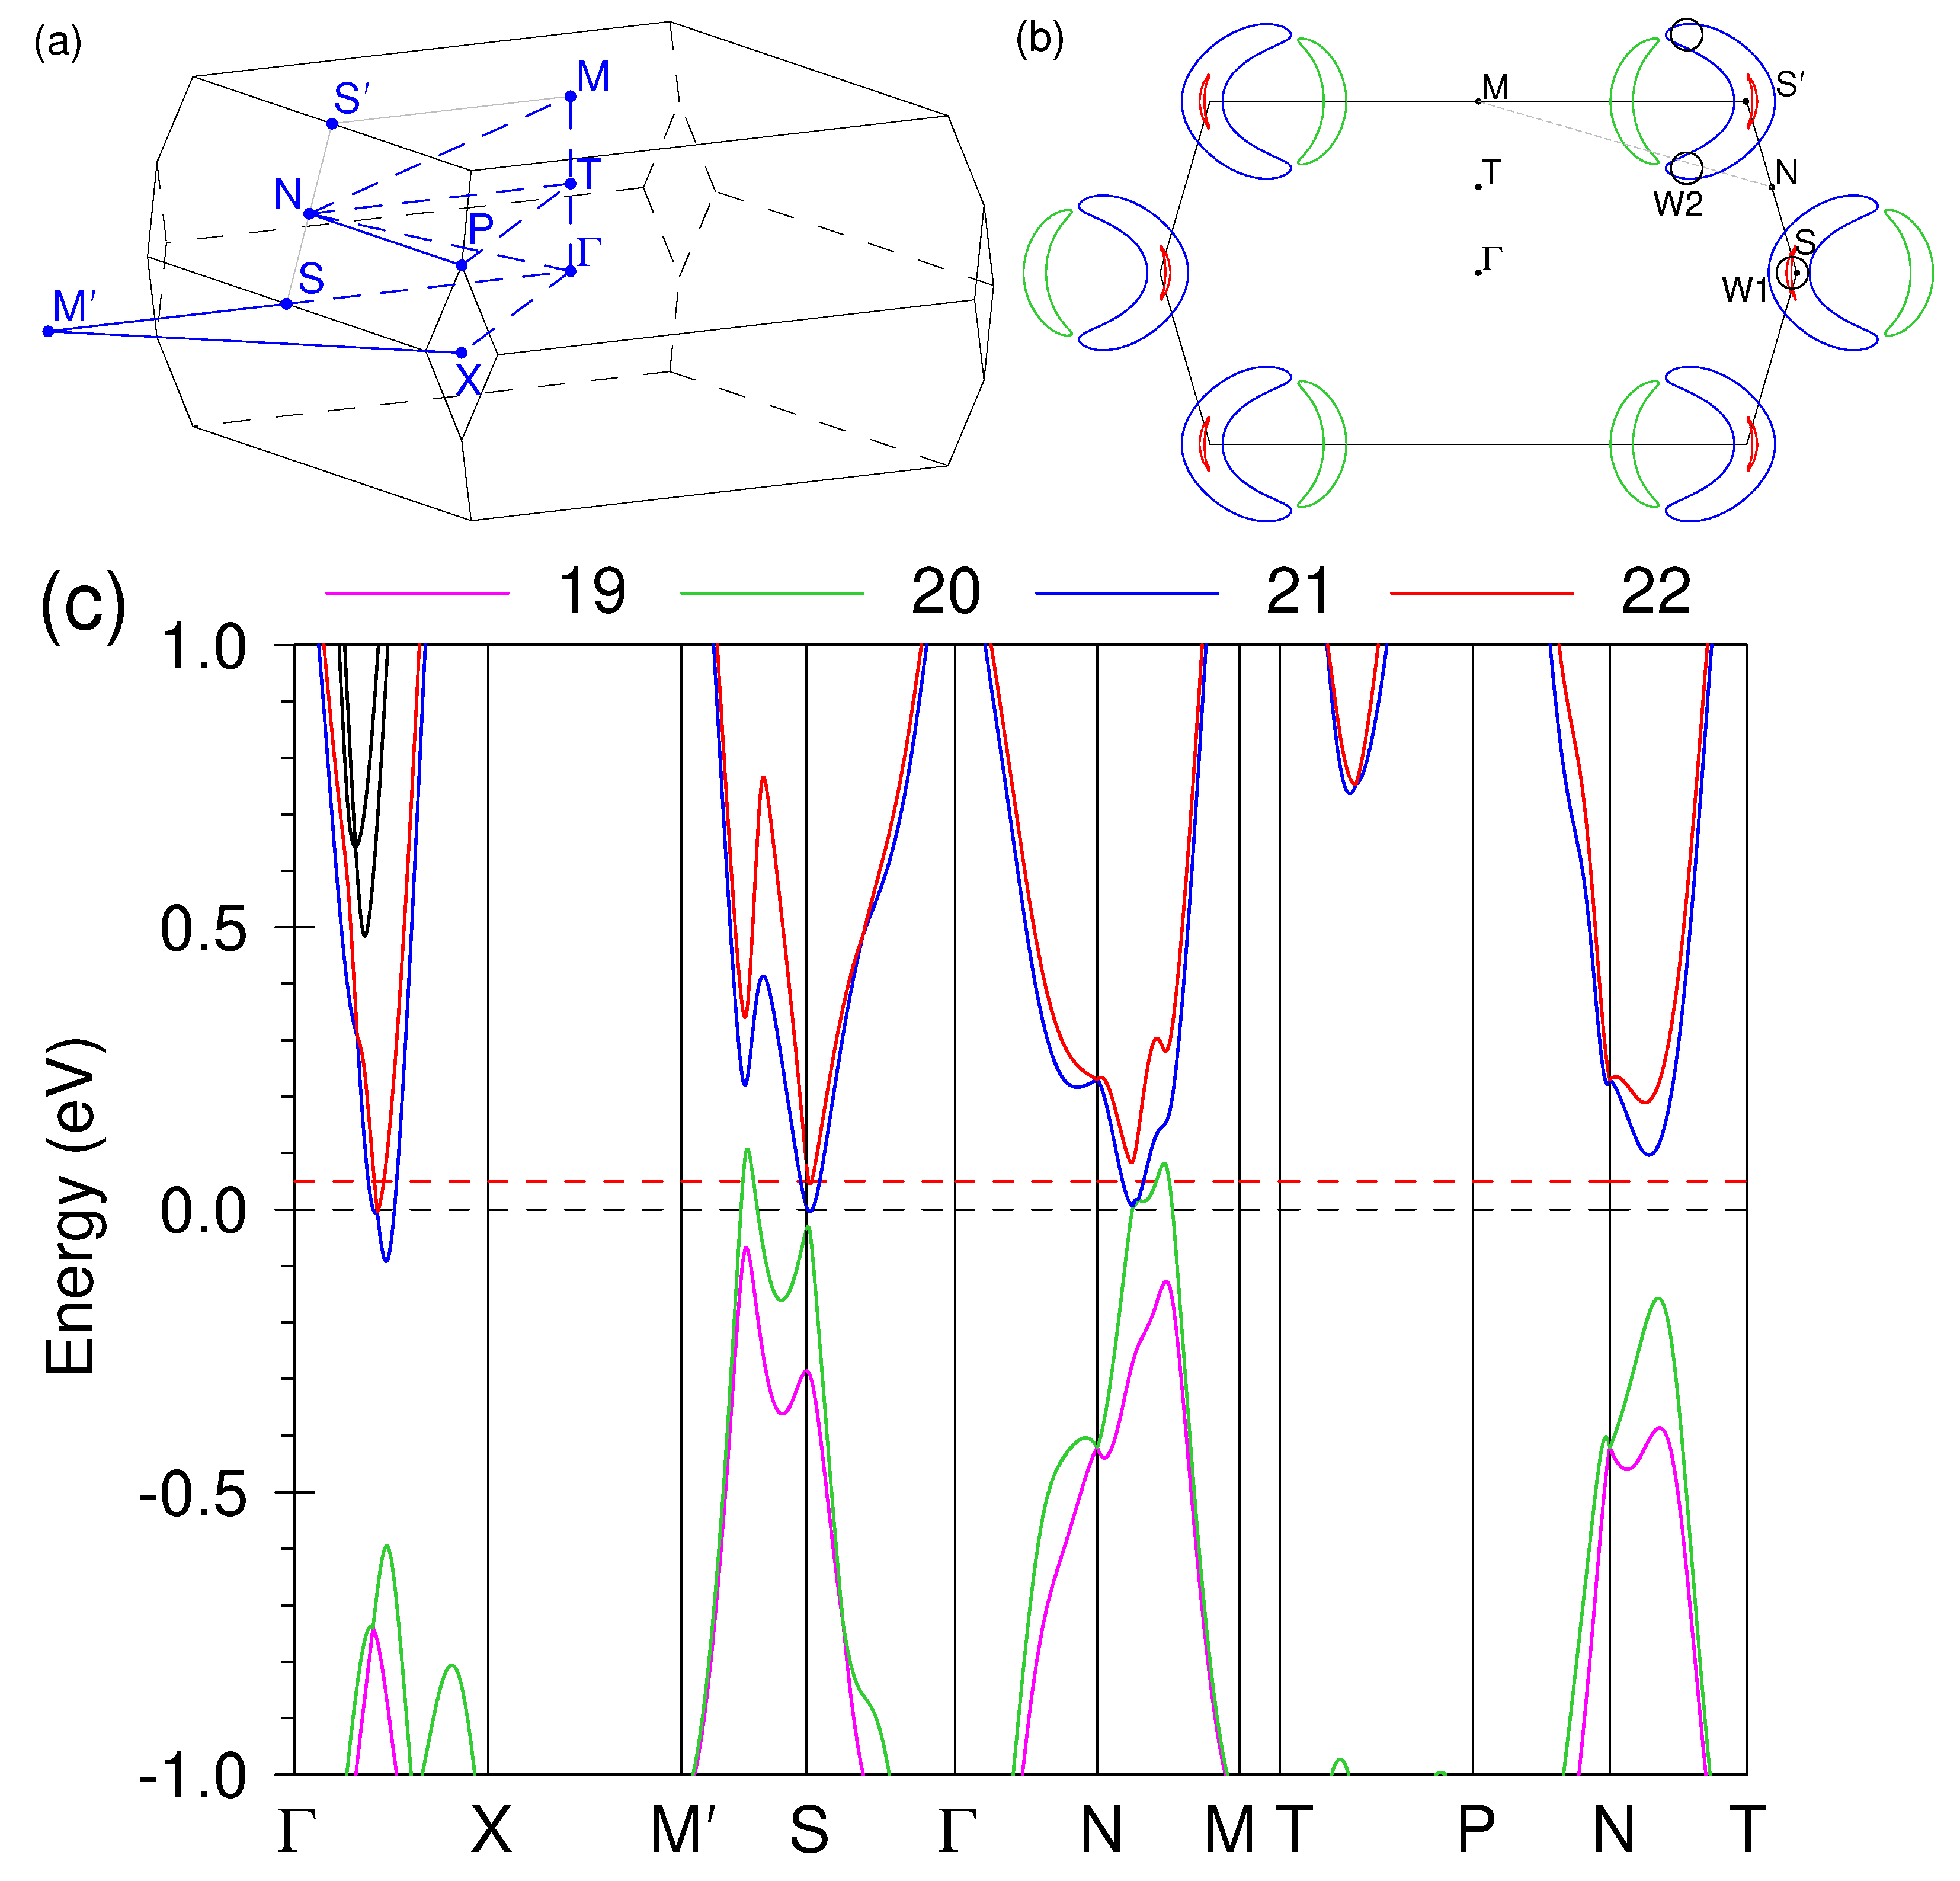
In Figure 3 we show the results of our band-structure calculations as well as the BZ of TaP. Four non-spin-degenerate bands, numbered 19 to 22, can be resolved in the vicinity of (at every given k point, the bands are numbered with increasing energy staring from the lowest calculated band). Note that the bands in each of the two pairs, (19, 20) and (21, 22), are split by SOC because of the lack of inversion symmetry. Our results reproduce well the published band structures of TaP calculated using the full-potential codes [11,13].
Before we discuss the calculated optical conductivity spectra, we would like to note that in WSMs the match between the measured and the calculated optical conductivity at low frequencies is typically only qualitative: the calculations catch the major features observed in the experimental spectra, but are unable to reproduce the exact frequency positions of the features and their spectral shapes [13,15,30,31,34].
Another important point to be mentioned here is the unintentional (self-)doping, which is inherent to many real materials, where impurities, crystallographic defects, and vacancies may slightly change the position of . Such unintentional doping, varying from sample to sample, has been shown to be relevant to TaP [41]. On the other hand, band structure calculations themselves have finite accuracy (cf. the spread in the calculated energy positions of the Weyl nodes, mentioned above). These considerations justify small variation of the position of to get a better match between theory and experiment. Hereafter, we vary the Fermi-level position within meV.
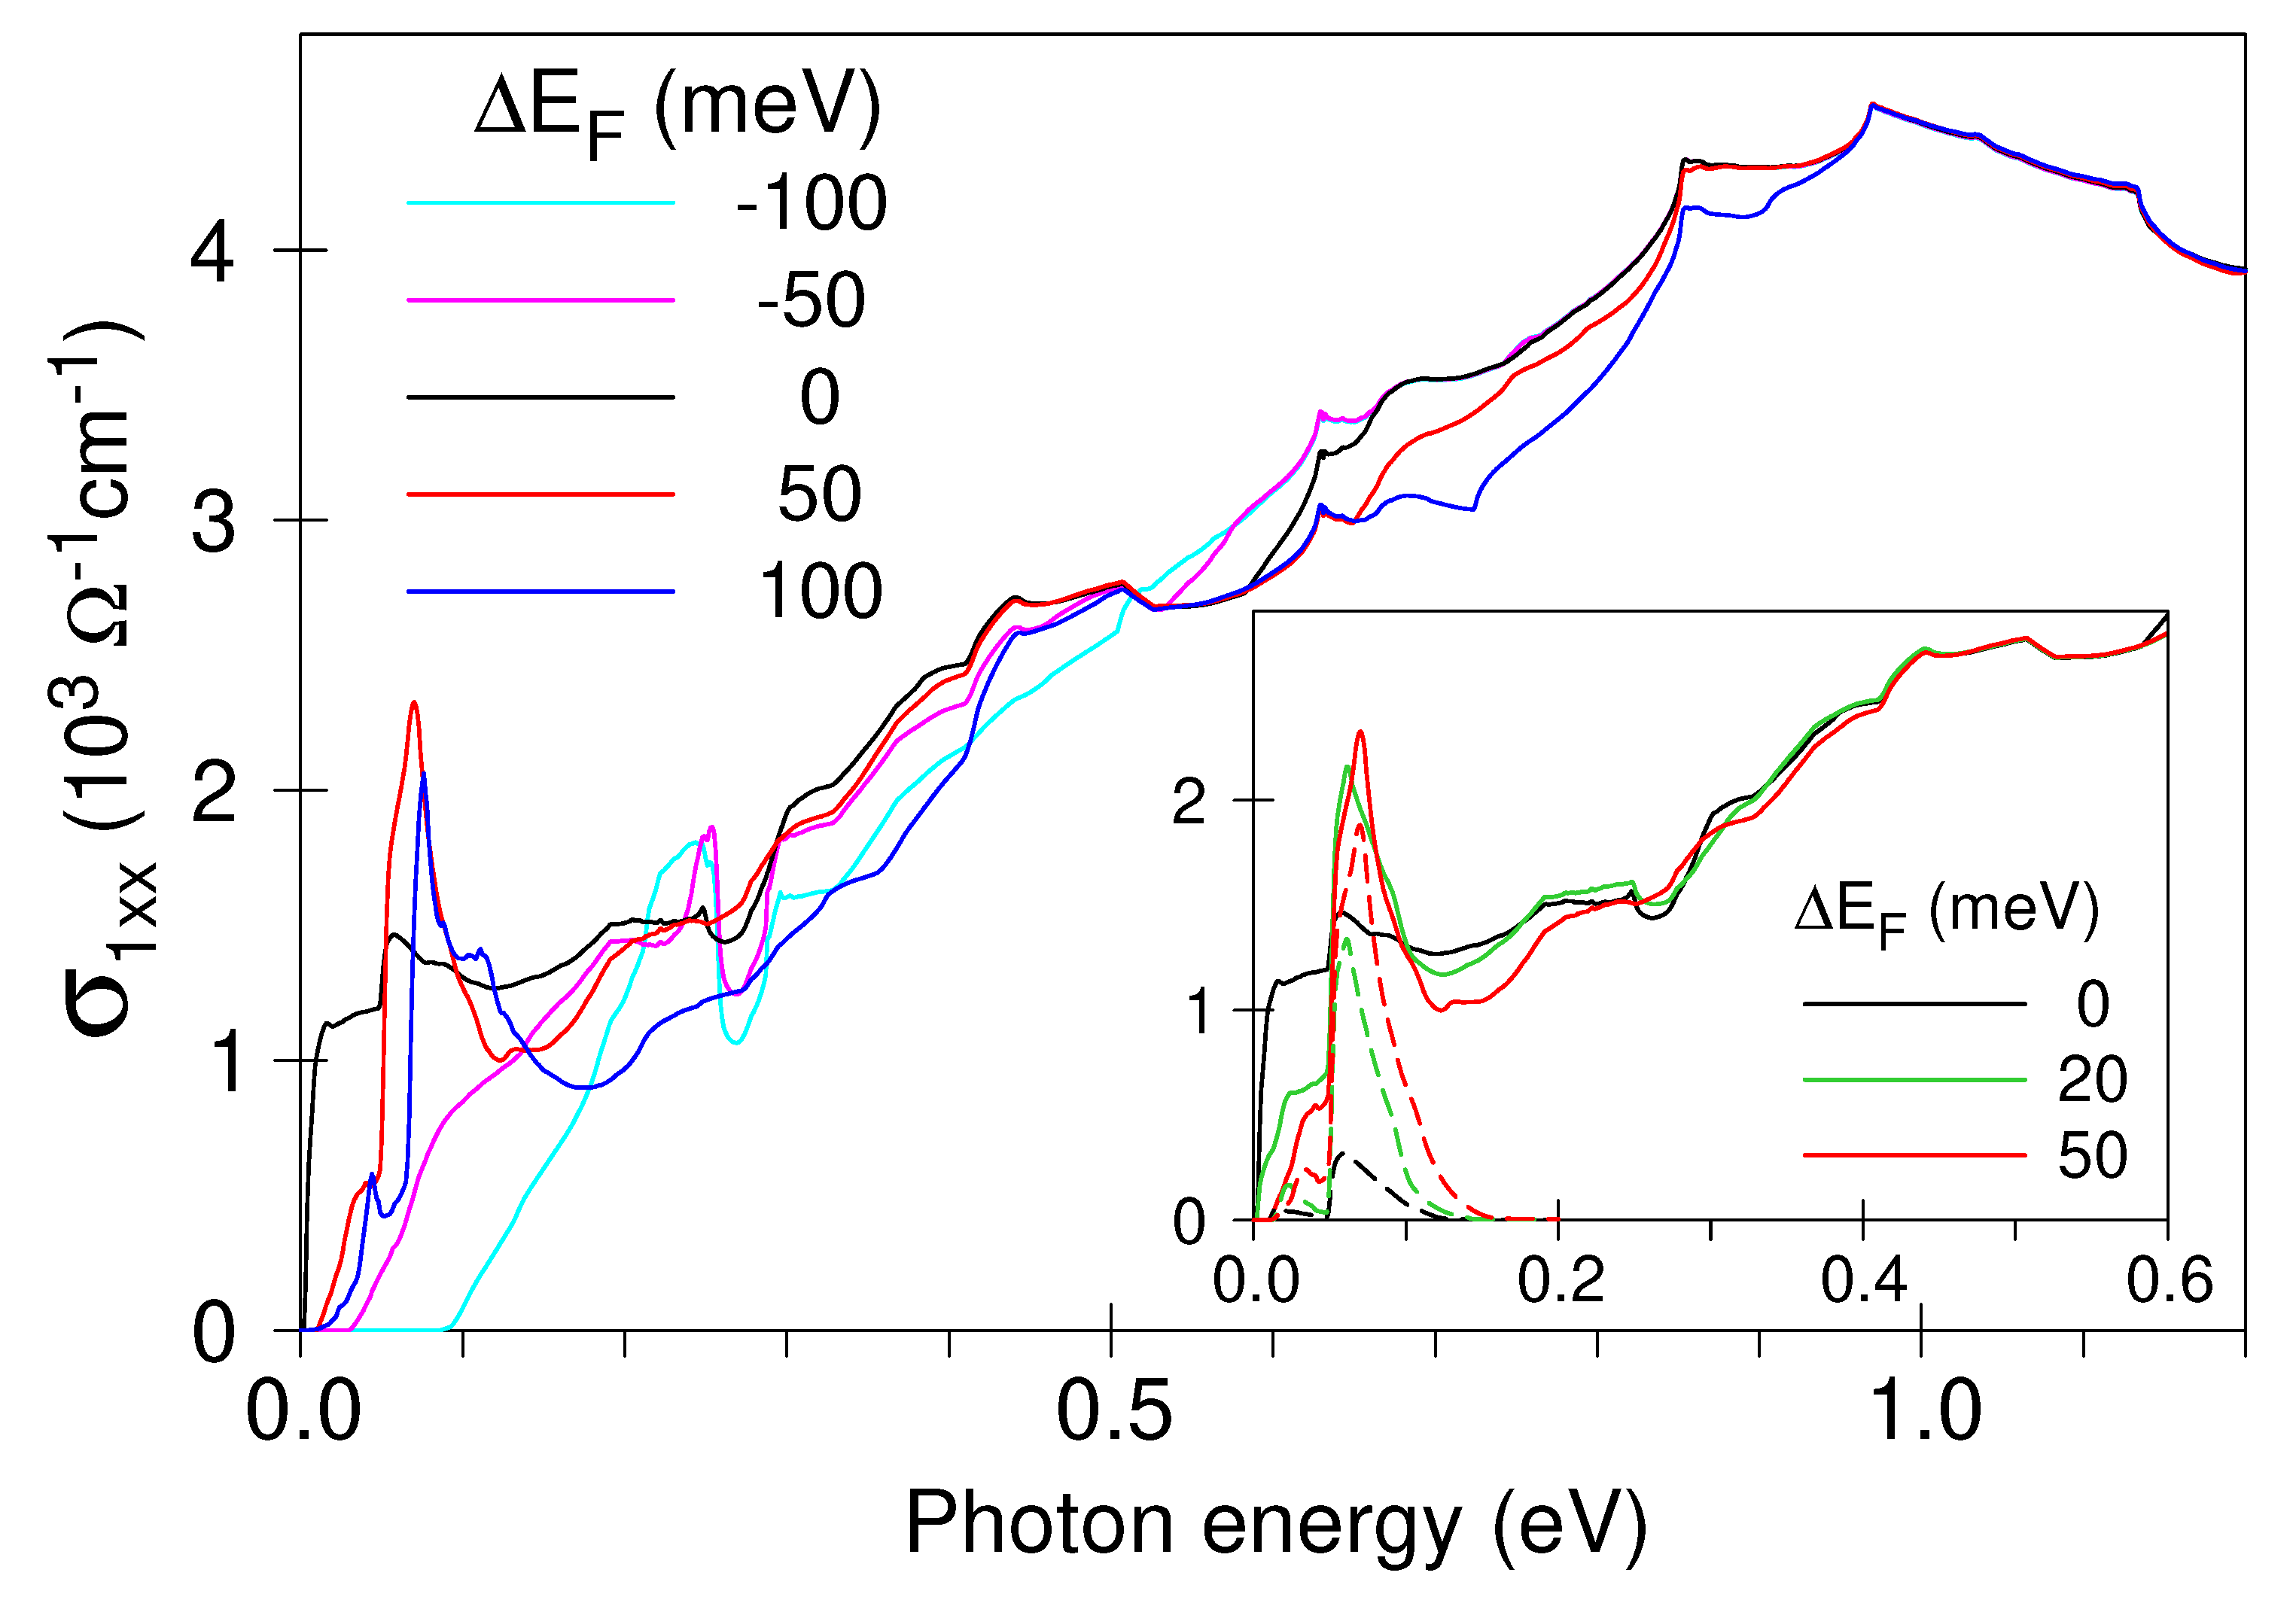
Figure 4 presents the results of our interband-conductivity calculations starting from the self-consistent band structure shown in Figure 3. The black solid line in Figure 4 shows obtained with as-calculated . The overall run of the experimental interband conductivity is well reproduced by this curve: increases with frequency and reaches a maximum at 1 eV (cf. Figure 2 and note that the intraband (Drude) contribution has not been taken into account in the band-structure computations). Nevertheless, no peak is visible in these computations at around 50 meV. A slight variation of provides such a peak, but only if the Fermi level is shifted upwards (red and blue curves). Shifting downwards does not change the spectra in the desirable way (magenta and cyan curves). The hight of the 50-meV peak reaches the experimental value of cm−1 at meV.
In the inset in Figure 4, we present an expanded view of the low-frequency optical conductivity calculated for small positive . It is obvious, that already a very small shift of 20 meV is sufficient to produce the 50-meV peak. Note, that for all three curves yet another experimental feature—a broad shoulder at 0.3–0.5 eV—is also evident in the calculated spectra. Thus, we can conclude that a tiny shift of the Fermi level allows one to obtain a very reasonable overall description of the experimental , including the strong peak at 50 meV.
To understand what interband optical transitions are responsible for this peak, one can take a look at Figure 3, where the original and shifted by 50 meV Fermi level positions are shown by black and red dashed lines, respectively. In the vicinity of Weyl points, i.e., near the S point and along the N–M line, band 21 is above the as-calculated . The low-frequency interband conductivity is dominated by the transitions between the initial band 20 and the final band 21. The shift of to higher energy leads to partial occupation of band 21. This suppresses the transitions at low energy and, at the same time, allows transitions from band 21 to band 22, which remains mostly empty. As these SOC-split bands are almost parallel, the energies of such transitions are expected to be roughly the same for different momenta. Thus, a sharp peak may occur in .
To confirm this observation, we performed band-resolved optical-conductivity calculations for the transitions between bands 21 and 22. The results of these calculations for three are plotted by dashed lines in the inset of Figure 4. It is apparent, that the transitions provide the major contribution to the 50-meV peak, confirming our proposition. A contribution coming from the volume near the middle of the –X line appears also for the as-calculated , but it is too weak to be responsible for the 50-meV peak.
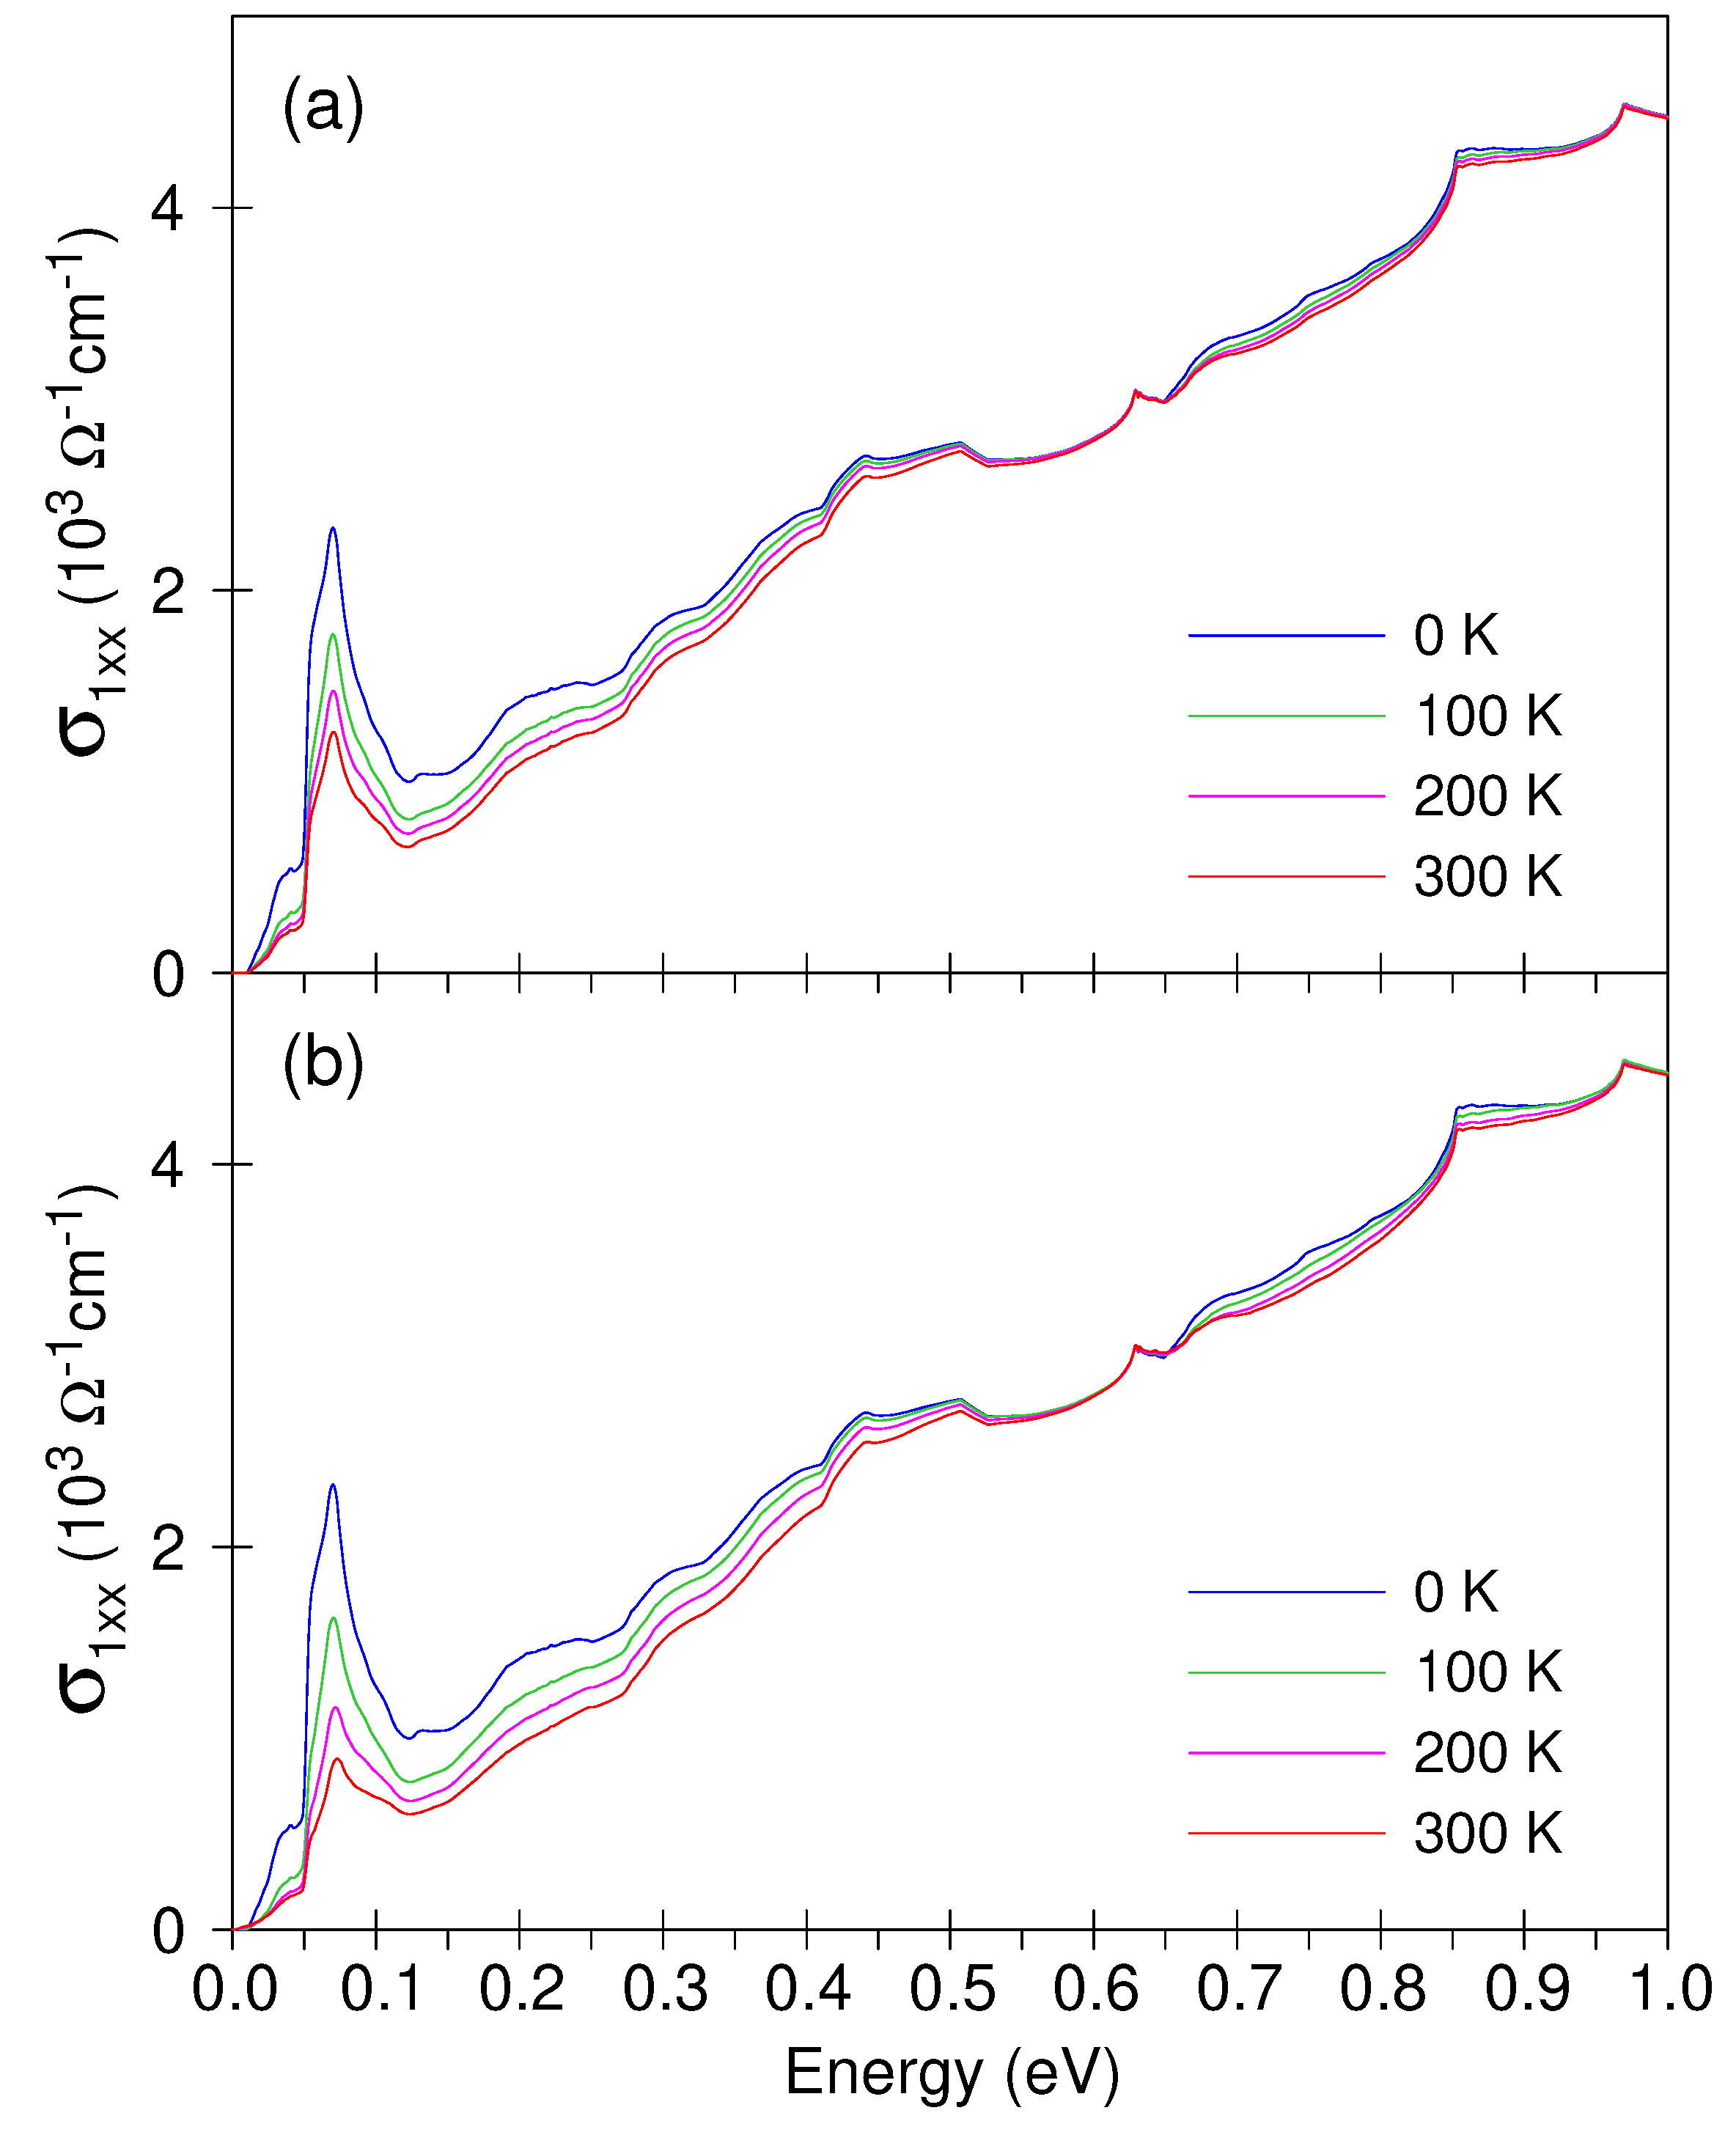
In order to model the experimentally observed temperature evolution of the 50-meV peak, we introduced a temperature dependence of the calculated interband optical conductivity by multiplying the interband transition probabilities with the factor , where is the Fermi-Dirac distribution function and and are the energies of initial and final states, respectively. Figure 5a shows that even this simple approach allows one to reproduce the experimentally observed reduction of the 50-meV peak with increasing temperature. A better agreement between theory and experiment is obtained, if the optical conductivity is calculated using an analog of the Mott formula [42], which is widely used to study the thermoelectric properties of metals. In this approximation,
where is the energy derivative of the Fermi-Dirac function and is calculated with E being the energy which discriminates between the initial and final bands, so that at . The results of these computations are shown in Figure 5b. We note that we compute the temperature dependence of the interband contribution only. In order to reproduce the upturn of the measured conductivity at low photon energies, one needs to consider the temperature dependence of the intraband Drude term, which is beyond the scope of this work.
Finally, we would like to emphasize the importance of the transitions between the SOC-split bands. Such transitions can be considered forbidden in some models [20], while in the real WSMs they play an important role, as we have shown earlier for NbP [34]. These transitions are allowed, because the electronic bands can be characterized by their well-defined spin polarization, , only for k-vectors faraway from the Weyl nodes; closer to the nodes, SOC is strong and spin polarization is much less perfect. Thus, transitions between any pair of bands are allowed there.
3. Conclusions
Summarizing, we have calculated the low-energy optical conductivity of the Weyl semimetal TaP (in the ab plane) and compared it to the experimental results. The best match between theory and experiment is found for a slightly shifted Fermi level (+20 to 60 meV). This shift confirms a small unintentional doping of TaP, discussed earlier [35,41], and offers a natural explanation of the strong low-energy (50 meV) peak reported in the experimental data [30,35]: the peak is due to transitions between the almost parallel non-degenerate electronic bands split by spin-orbit coupling.
Author Contributions
Conceptualization, A.Y. and A.V.P.; calculations, A.Y.; providing experimental data, A.V.P.; writing, A.Y. and A.V.P. All authors have read and agreed to the published version of the manuscript.
Funding
This research was funded in part by the Deutsche Forschungsgemeinschaft via grant number DR228/51-3.
Institutional Review Board Statement
Not applicable.
Informed Consent Statement
Not applicable.
Data Availability Statement
Data are available upon request to the corresponding author.
Acknowledgments
We thank Sascha Polatkan for technical assistance in manuscript preparation.
Conflicts of Interest
The authors declare no conflict of interest.
References
- Weyl, H. Electron and Gravitation. I. Z. Phys. 1929, 56, 330–352. [Google Scholar] [CrossRef]
- Murakami, S. Phase transition between the quantum spin Hall and insulator phases in 3D: Emergence of a topological gapless phase. New J. Phys. 2007, 9, 356. [Google Scholar] [CrossRef]
- Wan, X.; Turner, A.M.; Vishwanath, A.; Savrasov, S.Y. Topological semimetal and Fermi-arc surface states in the electronic structure of pyrochlore iridates. Phys. Rev. B 2011, 83, 205101. [Google Scholar] [CrossRef] [Green Version]
- Burkov, A.A.; Hook, M.D.; Balents, L. Topological nodal semimetals. Phys. Rev. B 2011, 84, 235126. [Google Scholar] [CrossRef] [Green Version]
- Huang, S.M.; Xu, S.Y.; Belopolski, I.; Lee, C.C.; Chang, G.; Wang, B.; Alidoust, N.; Bian, G.; Neupane, M.; Zhang, C.; et al. A Weyl Fermion semimetal with surface Fermi arcs in the transition metal monopnictide TaAs class. Nat. Commun. 2015, 6, 7373. [Google Scholar] [CrossRef] [PubMed]
- Xu, S.Y.; Belopolski, I.; Alidoust, N.; Neupane, M.; Bian, G.; Zhang, C.; Sankar, R.; Chang, G.; Yuan, Z.; Lee, C.C.; et al. Discovery of a Weyl fermion semimetal and topological Fermi arcs. Science 2015, 349, 613–617. [Google Scholar] [CrossRef] [PubMed] [Green Version]
- Burkov, A.A. Topological semimetals. Nat. Mater. 2016, 15, 1145–1148. [Google Scholar] [CrossRef]
- Armitage, N.P.; Mele, E.J.; Vishwanath, A. Weyl and Dirac semimetals in three-dimensional solids. Rev. Mod. Phys. 2018, 90, 015001. [Google Scholar] [CrossRef] [Green Version]
- Weng, H.; Fang, C.; Fang, Z.; Bernevig, B.A.; Dai, X. Weyl Semimetal Phase in Noncentrosymmetric Transition-Metal Monophosphides. Phys. Rev. X 2015, 5, 011029. [Google Scholar] [CrossRef]
- Sun, Y.; Wu, S.C.; Ali, M.N.; Felser, C.; Yan, B. Prediction of Weyl semimetal in orthorhombic MoTe2. Phys. Rev. B 2015, 92, 161107. [Google Scholar] [CrossRef] [Green Version]
- Lee, C.C.; Xu, S.Y.; Huang, S.M.; Sanchez, D.S.; Belopolski, I.; Chang, G.; Bian, G.; Alidoust, N.; Zheng, H.; Neupane, M.; et al. Fermi surface interconnectivity and topology in Weyl fermion semimetals TaAs, TaP, NbAs, and NbP. Phys. Rev. B 2015, 92, 235104. [Google Scholar] [CrossRef] [Green Version]
- Arnold, F.; Naumann, M.; Wu, S.C.; Sun, Y.; Schmidt, M.; Borrmann, H.; Felser, C.; Yan, B.; Hassinger, E. Chiral Weyl Pockets and Fermi Surface Topology of the Weyl Semimetal TaAs. Phys. Rev. Lett. 2016, 117, 146401. [Google Scholar] [CrossRef] [Green Version]
- Grassano, D.; Pulci, O.; Conte, A.M.; Bechstedt, F. Validity of Weyl fermion picture for transition metals monopnictides TaAs, TaP, NbAs, and NbP from ab initio studies. Sci. Rep. 2018, 8, 3534. [Google Scholar] [CrossRef]
- Wehling, T.O.; Black-Schaffer, A.M.; Balatsky, A.V. Dirac materials. Adv. Phys. 2014, 63, 1–76. [Google Scholar] [CrossRef] [Green Version]
- Pronin, A.V.; Dressel, M. Nodal Semimetals: A Survey on Optical Conductivity. Phys. Status Solidi B 2021, 258, 2000027. [Google Scholar] [CrossRef] [Green Version]
- Hosur, P.; Parameswaran, S.A.; Vishwanath, A. Charge Transport in Weyl Semimetals. Phys. Rev. Lett. 2012, 108, 046602. [Google Scholar] [CrossRef] [PubMed] [Green Version]
- Bácsi, A.; Virosztek, A. Low-frequency optical conductivity in graphene and in other scale-invariant two-band systems. Phys. Rev. B 2013, 87, 125425. [Google Scholar] [CrossRef] [Green Version]
- Ashby, P.E.C.; Carbotte, J.P. Chiral anomaly and optical absorption in Weyl semimetals. Phys. Rev. B 2014, 89, 245121. [Google Scholar] [CrossRef] [Green Version]
- Tabert, C.J.; Carbotte, J.P.; Nicol, E.J. Optical and transport properties in three-dimensional Dirac and Weyl semimetals. Phys. Rev. B 2016, 93, 085426. [Google Scholar] [CrossRef] [Green Version]
- Tabert, C.J.; Carbotte, J.P. Optical conductivity of Weyl semimetals and signatures of the gapped semimetal phase transition. Phys. Rev. B 2016, 93, 085442. [Google Scholar] [CrossRef] [Green Version]
- Carbotte, J.P. Dirac cone tilt on interband optical background of type-I and type-II Weyl semimetals. Phys. Rev. B 2016, 94, 165111. [Google Scholar] [CrossRef]
- Sánchez-Martínez, M.A.; de Juan, F.; Grushin, A.G. Linear optical conductivity of chiral multifold fermions. Phys. Rev. B 2019, 99, 155145. [Google Scholar] [CrossRef] [Green Version]
- Carbotte, J.P.; Nicol, E.J. Signatures of merging Dirac points in optics and transport. Phys. Rev. B 2019, 100, 035441. [Google Scholar] [CrossRef] [Green Version]
- Timusk, T.; Carbotte, J.P.; Homes, C.C.; Basov, D.N.; Sharapov, S.G. Three-dimensional Dirac fermions in quasicrystals as seen via optical conductivity. Phys. Rev. B 2013, 87, 235121. [Google Scholar] [CrossRef] [Green Version]
- Chen, R.Y.; Zhang, S.J.; Schneeloch, J.A.; Zhang, C.; Li, Q.; Gu, G.D.; Wang, N.L. Optical spectroscopy study of the three-dimensional Dirac semimetal ZrTe5. Phys. Rev. B 2015, 92, 075107. [Google Scholar] [CrossRef] [Green Version]
- Sushkov, A.B.; Hofmann, J.B.; Jenkins, G.S.; Ishikawa, J.; Nakatsuji, S.; Das Sarma, S.; Drew, H.D. Optical evidence for a Weyl semimetal state in pyrochlore Eu2Ir2O7. Phys. Rev. B 2015, 92, 241108. [Google Scholar] [CrossRef] [Green Version]
- Xu, B.; Dai, Y.M.; Zhao, L.X.; Wang, K.; Yang, R.; Zhang, W.; Liu, J.Y.; Xiao, H.; Chen, G.F.; Taylor, A.J.; et al. Optical spectroscopy of the Weyl semimetal TaAs. Phys. Rev. B 2016, 93, 121110. [Google Scholar] [CrossRef] [Green Version]
- Ueda, K.; Fujioka, J.; Tokura, Y. Variation of optical conductivity spectra in the course of bandwidth-controlled metal-insulator transitions in pyrochlore iridates. Phys. Rev. B 2016, 93, 245120. [Google Scholar] [CrossRef]
- Neubauer, D.; Carbotte, J.P.; Nateprov, A.A.; Löhle, A.; Dressel, M.; Pronin, A.V. Interband optical conductivity of the [001]-oriented Dirac semimetal Cd3As2. Phys. Rev. B 2016, 93, 121202. [Google Scholar] [CrossRef] [Green Version]
- Kimura, S.I.; Yokoyama, H.; Watanabe, H.; Sichelschmidt, J.; Suess, V.; Schmidt, M.; Felser, C. Optical signature of Weyl electronic structures in tantalum pnictides TaPn (Pn = P, As). Phys. Rev. B 2017, 96, 075119. [Google Scholar] [CrossRef] [Green Version]
- Chaudhuri, D.; Cheng, B.; Yaresko, A.; Gibson, Q.D.; Cava, R.J.; Armitage, N.P. Optical investigation of the strong spin-orbit-coupled magnetic semimetal YbMnBi2. Phys. Rev. B 2017, 96, 075151. [Google Scholar] [CrossRef] [Green Version]
- Schilling, M.B.; Löhle, A.; Neubauer, D.; Shekhar, C.; Felser, C.; Dressel, M.; Pronin, A.V. Two-channel conduction in YbPtBi. Phys. Rev. B 2017, 95, 155201. [Google Scholar] [CrossRef] [Green Version]
- Kemmler, R.; Hübner, R.; Löhle, A.; Neubauer, D.; Voloshenko, I.; Schoop, L.M.; Dressel, M.; Pronin, A.V. Free-carrier dynamics in Au2Pb probed by optical conductivity measurements. J. Phys. Condens. Matter 2018, 30, 485403. [Google Scholar] [CrossRef] [PubMed] [Green Version]
- Neubauer, D.; Yaresko, A.; Li, W.; Loehle, A.; Huebner, R.; Schilling, M.B.; Shekhar, C.; Felser, C.; Dressel, M.; Pronin Artem, V. Optical conductivity of the Weyl semimetal NbP. Phys. Rev. B 2018, 98, 195203. [Google Scholar] [CrossRef] [Green Version]
- Polatkan, S.; Goerbig, M.O.; Wyzula, J.; Kemmler, R.; Maulana, L.Z.; Piot, B.A.; Crassee, I.; Akrap, A.; Shekhar, C.; Felser, C.; et al. Magneto-Optics of a Weyl Semimetal beyond the Conical Band Approximation: Case Study of TaP. Phys. Rev. Lett. 2020, 124, 176402. [Google Scholar] [CrossRef] [PubMed]
- Willerstrom, J. Stacking Disorder In NbP, TaP, NbAs And TaAs. J. Less-Common Met. 1984, 99, 273–283. [Google Scholar] [CrossRef]
- Andersen, O.K. Linear methods in band theory. Phys. Rev. B 1975, 12, 3060–3083. [Google Scholar] [CrossRef] [Green Version]
- Perdew, J.P.; Wang, Y. Accurate and simple analytic represantation of the electron-gas correlation energy. Phys. Rev. B 1992, 45, 13244–13249. [Google Scholar] [CrossRef]
- Antonov, V.; Harmon, B.; Yaresko, A. Electronic Structure and Magneto-Optical Properties of Solids; Kluwer Academic Publishers: Dordrecht, The Netherlands; Boston, MA, USA; London, UK, 2004. [Google Scholar]
- Blöchl, P.E.; Jepsen, O.; Andersen, O.K. Improved Tetrahedron Method for Brillouin-zone Integrations. Phys. Rev. B 1994, 49, 16223–16233. [Google Scholar] [CrossRef]
- Besara, T.; Rhodes, D.A.; Chen, K.W.; Das, S.; Zhang, Q.R.; Sun, J.; Zeng, B.; Xin, Y.; Balicas, L.; Baumbach, R.E.; et al. Coexistence of Weyl physics and planar defects in the semimetals TaP and TaAs. Phys. Rev. B 2016, 93, 245152. [Google Scholar] [CrossRef] [Green Version]
- Cutler, M.; Mott, N.F. Observation of Anderson Localization in an Electron Gas. Phys. Rev. 1969, 181, 1336–1340. [Google Scholar] [CrossRef]
Figure 1.
(a) Crystallographic structure of TaP and (b) a schematic diagram of its Weyl bands. Possible transitions between the saddle points of the merging Weyl bands and between the SOC-split bands are indicated as arrows.
Figure 1.
(a) Crystallographic structure of TaP and (b) a schematic diagram of its Weyl bands. Possible transitions between the saddle points of the merging Weyl bands and between the SOC-split bands are indicated as arrows.

Figure 2.
(a) Experimental in-plane reflectivity and (b) the corresponding real part of the optical conductivity of TaP at selected temperatures [35]. The arrows mark the feature discussed in this paper. The increased at low energies is due to intraband (Drude-like) absorption.
Figure 2.
(a) Experimental in-plane reflectivity and (b) the corresponding real part of the optical conductivity of TaP at selected temperatures [35]. The arrows mark the feature discussed in this paper. The increased at low energies is due to intraband (Drude-like) absorption.

Figure 3.
(a) Brillouin zone of TaP. (b) Fermi surface cross sections calculated for meV. Black circles show approximate positions of projections of Weyl points onto plane. (c) Band structure of TaP. Four bands closest to (marked 19 to 22) are shown in different colors. Black and red horizontal dashed lines show the as-calculated position of and the Fermi level shifted upwards by meV, respectively.

Figure 4.
Low-energy optical conductivity of TaP calculated from its band structure. Lines of different colors correspond to different positions of the Fermi level, as indicated. The conductivity calculated for smaller positive is plotted in the inset. The contributions of transitions are shown by dashed lines.

Figure 5.
Temperature dependence of the optical conductivity calculated (a) by multiplying the interband transition probabilities with the Fermi-Dirac function and (b) using the Mott formula.
Figure 5.
Temperature dependence of the optical conductivity calculated (a) by multiplying the interband transition probabilities with the Fermi-Dirac function and (b) using the Mott formula.

Publisher’s Note: MDPI stays neutral with regard to jurisdictional claims in published maps and institutional affiliations. |
© 2021 by the authors. Licensee MDPI, Basel, Switzerland. This article is an open access article distributed under the terms and conditions of the Creative Commons Attribution (CC BY) license (https://creativecommons.org/licenses/by/4.0/).
Share and Cite
MDPI and ACS Style
Yaresko, A.; Pronin, A.V. Low-Energy Optical Conductivity of TaP: Comparison of Theory and Experiment. Crystals 2021, 11, 567. https://0-doi-org.brum.beds.ac.uk/10.3390/cryst11050567
AMA Style
Yaresko A, Pronin AV. Low-Energy Optical Conductivity of TaP: Comparison of Theory and Experiment. Crystals. 2021; 11(5):567. https://0-doi-org.brum.beds.ac.uk/10.3390/cryst11050567
Chicago/Turabian StyleYaresko, Alexander, and Artem V. Pronin. 2021. "Low-Energy Optical Conductivity of TaP: Comparison of Theory and Experiment" Crystals 11, no. 5: 567. https://0-doi-org.brum.beds.ac.uk/10.3390/cryst11050567
Note that from the first issue of 2016, this journal uses article numbers instead of page numbers. See further details here.