
Effects of Different Content of Phosphorus Slag Composite Concrete: Heat Evolution, Sulphate-Corrosion Resistance and Volume Deformation

1
Beijing Urban Construction Group Co., Ltd., Beijing 100000, China
2
Department of Civil Engineering, Tsinghua University, Beijing 100084, China
*
Author to whom correspondence should be addressed.
Crystals 2021, 11(11), 1293; https://0-doi-org.brum.beds.ac.uk/10.3390/cryst11111293
Submission received: 22 September 2021
/
Revised: 10 October 2021
/
Accepted: 20 October 2021
/
Published: 25 October 2021
(This article belongs to the Special Issue Advances in Sustainable Concrete System)
Abstract
:Phosphorus slag (PS) and limestone (LS) composite (PLC) were prepared with a mass ratio of 1:1. The effects of the content of PLC and the water/binder ratio on the mechanical properties, durability and dry shrinkage of concrete were studied via compressive strength, electric flux, sulfate dry/wet cycle method, saturated drainage method, isothermal calorimeter, adiabatic temperature rise instrument and shrinkage deformation instrument. The results show that PLC can greatly reduce the adiabatic temperature rise of concrete. The adiabatic temperature rise is 55 °C with 33 wt.% PLC, 10 °C lower than that of the control sample. The addition in the content of PLC does not affect the long-term strength of concrete. When the water/binder ratio decreases by 0.1–0.15, the long-term strength of concrete with PLC increases by about 10%, compared with the control group. At the age of 360 days, the chloride permeability of L-11 (i.e., the content of PLC was 20%, the water/binder ratio was 0.418) and L-22 (i.e., the content of PLC was 33%, the water/binder ratio was 0.39) decrease to the “very low” grade. The strength loss rate of L-11 and L-22 after 150 sulfate dry/wet cycles is about 18.5% and 19%, respectively, which is 60% of the strength loss rate of the control sample. The drying shrinkage of L-11 and L-22 reduces by 4.7% and 9.5%, respectively, indicating that PLC can also reduce the drying shrinkage.
1. Introduction
Phosphorus slag (PS), the abbreviation of granulated electric furnace phosphorus slag powder, is an industrial waste residue containing calcium silicate. It is produced in the process of industrial production of yellow phosphorus preparation from phosphorus ore, silica and coke at a high temperature of about 1400 °C in an electric furnace. The obtained melt is then quenched by water to form granules, and ground to obtain PS powder [1,2]. The main mineral phase of PS is amorphous glass with a little crystalline phase, such as calcium phosphate, calcium orthosilicate and anorthite [3,4].
Barnesp [5] believed that the hydration activity of PS itself is very low. However, under the action of calcium hydroxide, the Ca2+, [AlO4]5−, Al3+ and [SiO4]4− in the glass of PS dissolve into solution to form C-A-S-H gel. In addition, P2O5 and fluoride in PS may react with Ca(OH)2, resulting in the formation of the insoluble fluorohydroxyapatite. This precipitation wraps around the cement particles, therefore delaying the hardening and setting of the cement. On the other hand, when the content of PS is low, the formation of fluorohydroxyapatite is not enough to completely package around the cement particles, so that the hydration continues. With further hydration, the alkali concentration in the liquid gradually increases, while the osmotic pressure caused by the concentration difference enables H2O or OH− to penetrate into the coating of cement; then, the hydration continues and the strength increases. Li [6,7] et al. stated that with the addition of a certain amount of PS, the number of gel pores accumulates with the increase of hydration time. Meanwhile, new C-A-S-H continuously polymerizes with the decomposing of glass in PS. The crosslinking filling of ettringite and C-A-S-H gel makes the structure of cement paste more compact, resulting in the reduction of the pore sized > 50 nm and the increase of the strength. It is worth noting that the addition of PS alone is an easy way to reduce the early strength and prolong the setting time of concrete, which is an urgent problem to be solved in engineering application.
Limestone powder (LS) is a common concrete admixture. Its main chemical composition is CaO with a small amount of SiO2, Al2O3, MgO, Fe2O3, etc. The main mineral phase of limestone powder is crystalline CaCO3 (≥80%) with a small amount of quartz (≤10%) [8,9].
Rizwan et al. [10] found that neither limestone powder nor fly ash can improve the performance of self-leveling mortar, while the fluidity, strength, microstructure, relative water absorption and early volume stability of self-leveling mortar mixed with limestone powder and fly ash composite are better than those prepared with other admixtures. Li et al. [11] found that when the ultra-fine limestone powder is added to replace cementitious materials, the compressive strength of concrete was unchanged with the same water/binder ratio, while the tensile strength, stiffness, and durability of concrete are improved. Hu et al. [12] found that the 28-day compressive strength of concrete mixed with 20% ultra-fine fly ash and 10% limestone powder is very close to that of pure cement concrete. The test results of Temiz, et al. [13] showed that under the condition of low water/binder ratio (<0.4), the three-component concrete mixed with limestone powder, cement, FA (fly ash), or GGBS (granulated blast furnace slag) can obtain similar or even higher long-term strength than the two-component mud concrete (cement and FA or GGBS). We can know that LS can act together with other volcanic ash materials to play the role of “1 + 1 > 2”. However, it is rarely reported that LS and PS are used as admixtures in concrete at the same time. Whether PLC has an impact on durability and shrinkage performance is also a problem to be explored.
In this paper, phosphorus slag (PS) and limestone (LS) composite (PLC) were prepared with a mass ratio of 1:1. The effects of the content of PLC and the water/binder ratio on the mechanical properties, durability and dry shrinkage of concrete were studied via compressive strength, electric flux, sulfate dry/wet cycle method, saturated drainage method, isothermal calorimeter, adiabatic temperature rise instrument and shrinkage deformation instrument. The obtained results provide significance for theoretical and engineering guiding for the application of PLC in mass concrete and corrosion-resistant concrete.
2. Materials and Methods
2.1. Materials
The cement is P·O 42.5 ordinary Portland cement produced by Jinyu Group. Its basic performance is shown in Table 1, in accordance with the requirements of Chinese standard GB/T 175. The specific surface area and the chemical composition of PS and LS are shown in Table 2. The reaction formula of PS is shown as in Equation (1). The size of coarse aggregate is 5–25 mm, and other indexes meet the requirements of Chinese standard GB/T 14685. The fine aggregate is river sand, and the fineness modulus is 2.4. The water is tap water.
2Ca3(PO4)2 + 10C + 6SiO2→P4 + 10CO + 6(CaO·SiO2)
2.2. Sample Preparation
Table 3 shows the mix proportion of concrete with different content of PLC. The pure cement was taken as the control sample, and the mass ratio of PS to LS was 1:1. L-1 was using PLC to replace 20% of pure cement and the water/binder ratio was 0.425. L-11 was using PLC to replace 20% of pure cement, but the water/binder ratio was 0.418. The total amount of L-2 cementitious materials was 420 kg/m3. PLC accounted for 33% of the total cementitious materials, and the water/binder ratio was 0.405. Meanwhile, the water cement ratio of L-22 was reduced to 0.39 with the same content of PLC. The workability of concrete was adjusted by a water reducing agent to keep consistent slump. The effects of the content of PLC and water/binder ratio on the mechanical properties, shrinkage and durability of concrete were studied.
2.3. Test Methods
- (1)
- Mechanical property
The compressive strength of concrete was tested in accordance with Chinese standard GB/T 50,081 (standard for test methods of mechanical properties of ordinary concrete). Cube specimens of 100 mm × 100 mm × 100 mm were used to measure the compressive strength of concrete for 7 d, 28 d, 90 d and 360 d after curing to a specific age in a standard curing room (20 °C and 95 RH%).
- (2)
- Chloride permeability
After curing to a specific age in a standard curing room (20 °C and 95 RH%), the 100 mm × 100 mm × 100 mm cube specimens were cut into 100 mm × 100 mm × 50 mm specimens. The chloride permeability of concrete at 28 d and 360 d was measured according to ASTM C1202 (standard test method for chloride ion permeability resistance of concrete). The instrument model is CABR-RCP9. After installing the test block, 0.3 mol/L NaOH solution and 3 wt.% NaCl solution were prepared immediately (ensuring the accuracy of solution concentration), followed by injecting NaOH solution at the positive extreme and NaCl solution at the negative extreme without any liquid leakage. The measurement time was 6 h, and the electric flux of each group of concrete was recorded.
- (3)
- Sulphate-corrosion Resistance
The sulphate-corrosion resistance of 100 mm × 100 mm × 100 mm cube specimens was tested by the dry/wet cycle method [14]. Each sample was dried in an oven at 80 ± 5 °C for 6 h, cooled it for 2 h, and then soaked in Na2SO4 solution with concentration of 5%. This process is one cycle (i.e., one dry wet cycle is completed in one day). At the same time, the samples with the same ratio were placed in the standard curing room for curing. After 120 and 150 cycles, the compressive strength of the specimens in the standard curing room was measured as S1 and the compressive strength of concrete after the dry wet cycle was measured as S2. The strength loss rate was calculated according to the following Equation (2):
η = (S1 − S2)/S1 × 100%
- (4)
- Connected porosity
The connected porosity of concrete was measured by the “water saturation drying” method [15]. A piece of 10 cm × 10 cm × 2 cm concrete sheet was cut and prepared, the volume V of the test piece was measured by a drainage method, and the mass m1 of the test piece after vacuum water saturation was measured. The test piece was dried in an oven at 80 °C for 14 d, and the mass m2 after drying was measured. The connected porosity was calculated according to the following Equation (3):
where ρ is the density of water.
P = (m1 − m2)/ρV
- (5)
- Hydration heat release
The Calmetrix 8000 HPC isothermal calorimeter was used to determine the hydration heat release of the sample slurry [16]. The test method meets the requirements of ASTM C1702-2015. The temperature was set at 25 °C to determine the heat release rate and total heat release of C, L-11 and L-22 within 72 h.
- (6)
- Adiabatic temperature rise
Concrete (C, L-11 and L-22) prepared according to the mix proportion was put into the concrete adiabatic temperature rise instrument to measure its adiabatic temperature rise. The amount of concrete used for each test was 40~45 L. The temperature control error was less than ±0.1 °C, and the minimum temperature resolution was 0.02 °C. The automatic data acquisition system collected data every 5 min, and guaranteed the concrete center temperature to be 0.1 °C higher than the concrete outer wall temperature during the measurement process.
- (7)
- Shrinkage property
The shrinkage deformation of concrete (C, L-11 and L-22) was measured by contact method. 100 × 100 × 400 mm3 concrete specimen was molded. After demolding, the specimen was cured at room temperature for 7 days, and it was covered with plastic film to prevent moisture loss. After curing for 7 days, the plastic film was removed, then the deformation length was measured by a length comparator with a dial indicator (accuracy 0.001 mm) and calibrated before each measurement. The results were the mean of three groups of concrete.
3. Results and Discussion
3.1. Compressive Strength
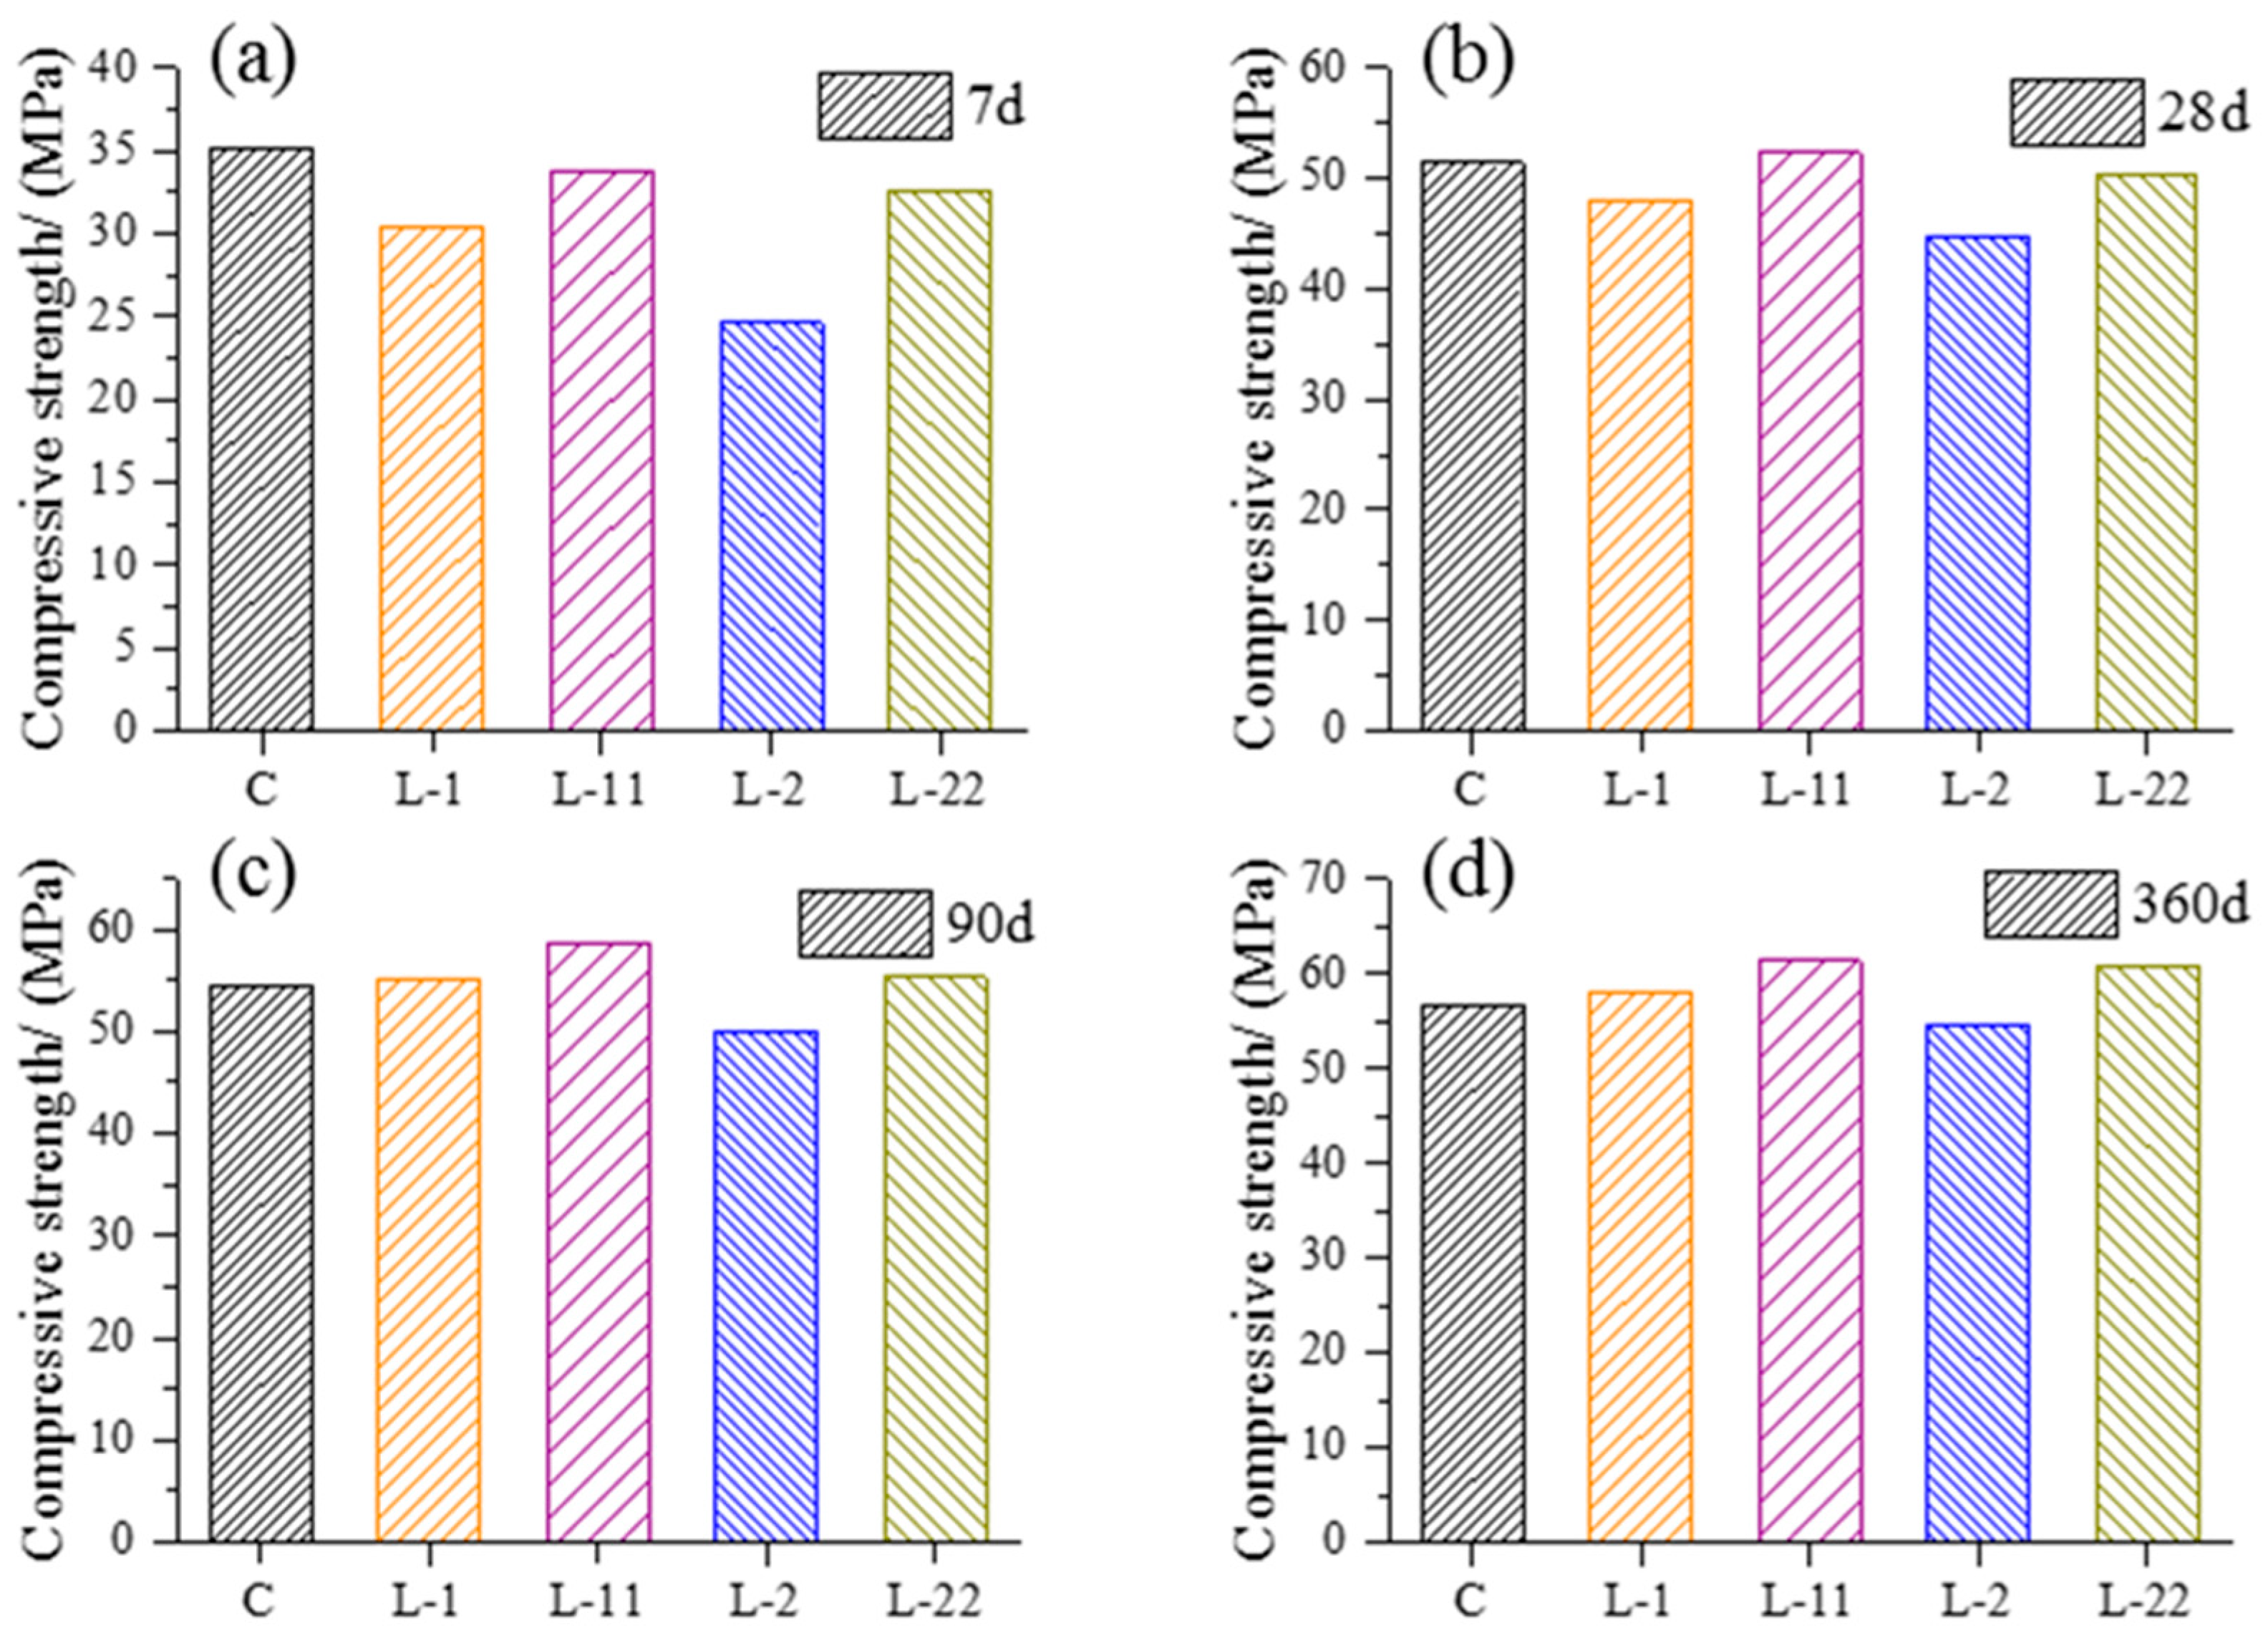
Figure 1 shows the compressive strength (a) 7 d (b) 28 d (c) 90 d (d) 360 d of concrete mixed with different content of PLC. The compressive strength of the control sample (C) was ~35 MPa at the age of 7 days. When 20% cement was replaced by PLC, the compressive strength of L-1 decreased to ~30 MPa. However, when reducing the water/binder ratio from 0.425 to 0.418, the compressive strength of L-11 increased from ~30 MPa to ~35 MPa. When 33% cement was replaced by PLC, the compressive strength of L-2 further reduced to ~25 MPa. By comparison, when lowing the water/binder ratio from 0.405 to 0.39, the compressive strength of L-22 increased from ~25 MPa to ~35 MPa accordingly, indicating that reduction of water can make up for the loss of the early strength of concrete caused by adding PLC to a certain extent. However, at the age of 90 days and 360 days, the compressive strength of concrete mixed with 20% and 33% PLC was all around 50 MPa, indicating that the addition of PLC does not affect the long-term strength of concrete. When the water/binder ratio decreased by 0.1–0.15, the long-term strength of concrete increased by ~10%, compared with the control sample.
3.2. Chloride Permeability, Sulfate Attack and Connected Porosity
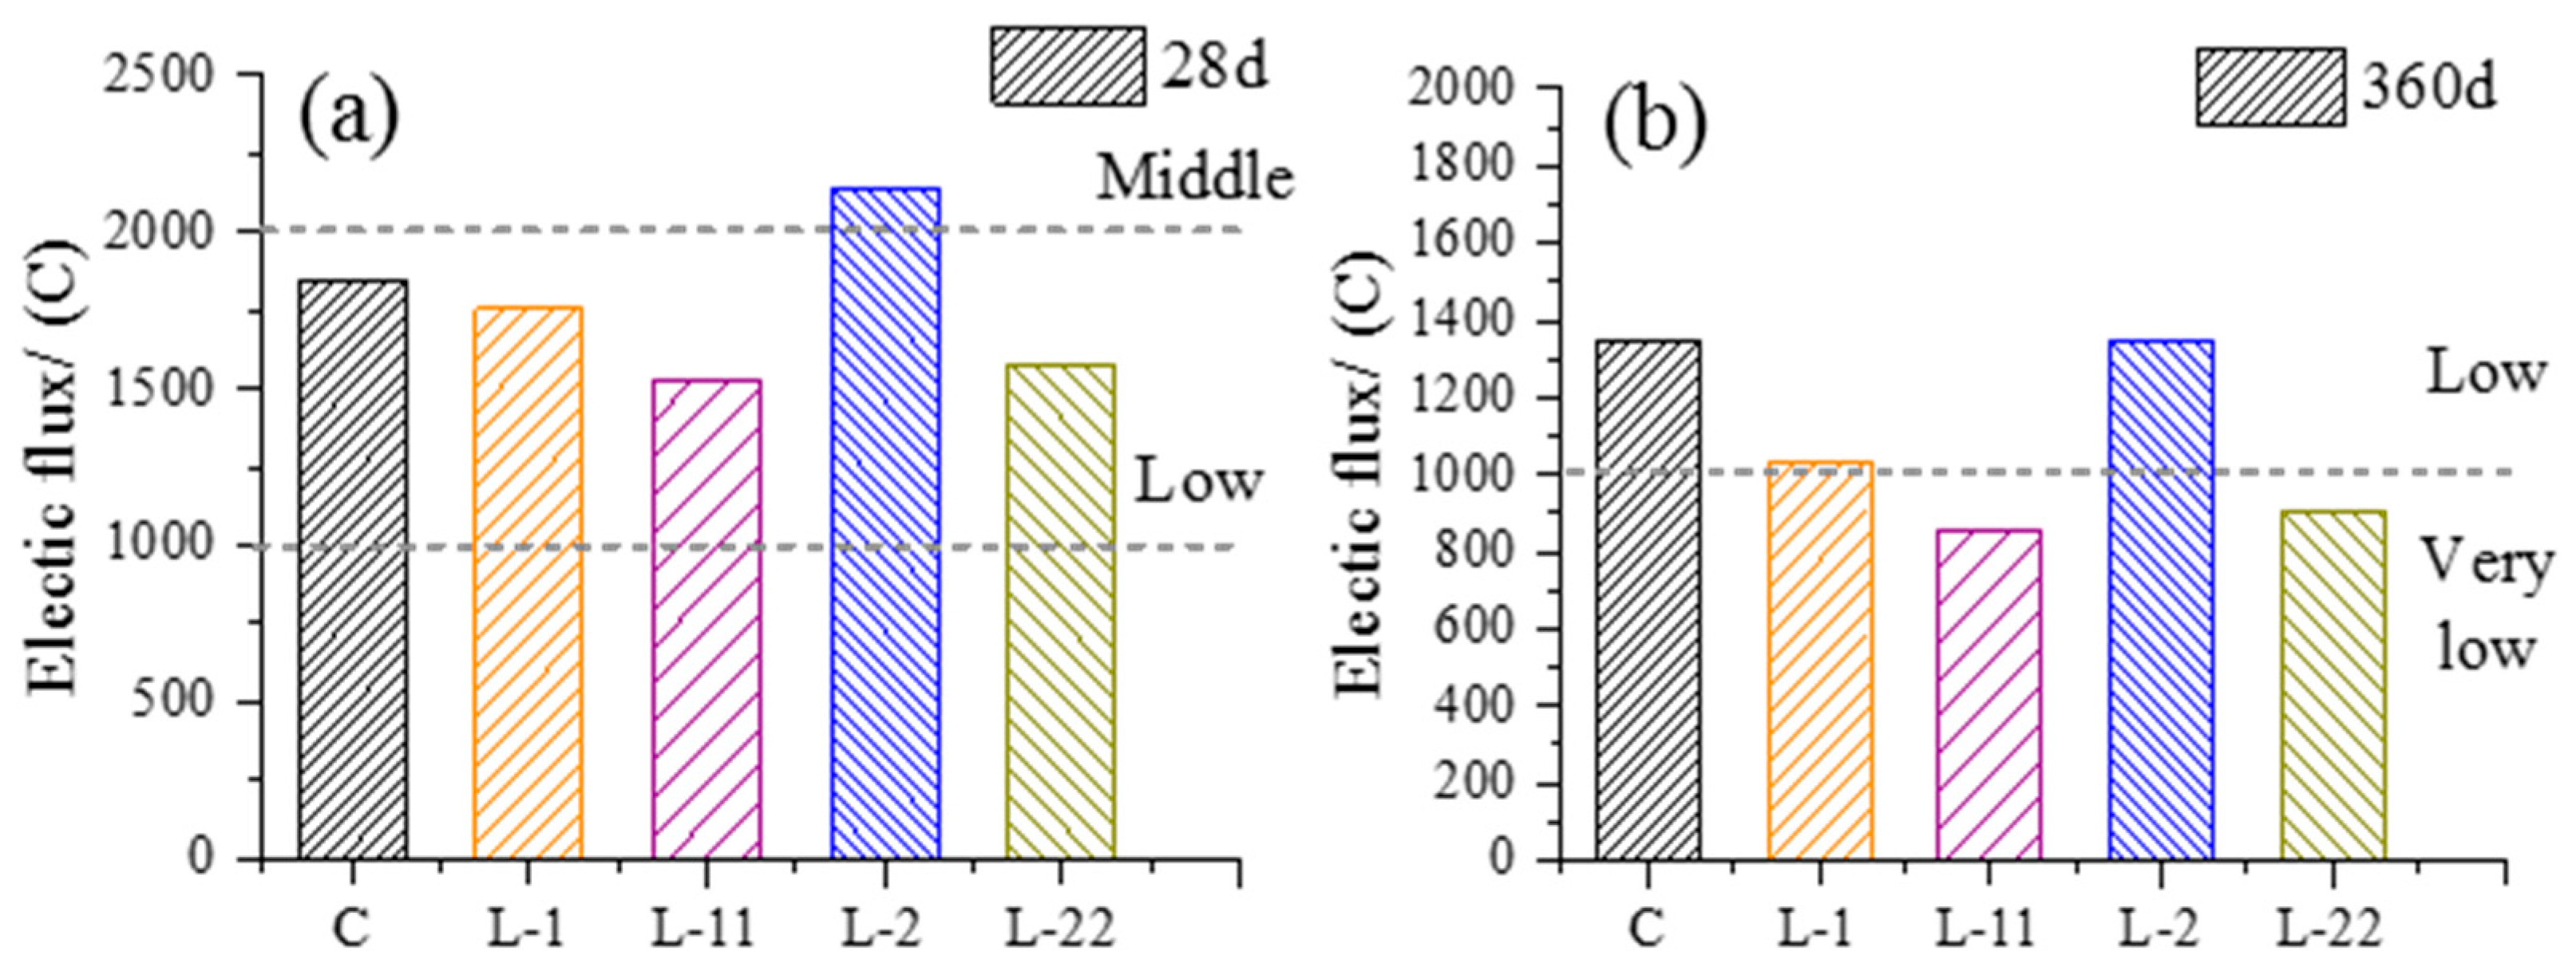
Figure 2 shows the chloride permeability (a) 28 d (b) 360 d of concrete mixed with different content of PLC. At the age of 28 days, the chloride permeability of the control sample (C), L-1, L-11 and L-22 was in the “low” grade, whereas the chloride permeability of L-2 (i.e., the content of PLC was 33%, and the water/binder ratio was 0.405) was in the “medium” grade. At the age of 360 days, the chloride permeability of L-11 (i.e., the content of PLC was 20%, the water/binder ratio was 0.418) and L-22 (i.e., the content of PLC was 33%, the water to binder ratio was 0.39) decreased to the “very low” grade. However, the chloride permeability of the control sample (C) and L-1 was still in the “low” grade.
Figure 3 shows the strength loss rate of concrete mixed with different content of PLC after sulfate immersion (a) 120 cycles (b) 150 cycles. The strength loss rate of the control sample (C) after 120 cycles was 17.5%, and its strength loss rate after 150 cycles was as high as 30.5%. The strength loss rates of L-11 and L-22 after 120 cycles were only one quarter of that of the control sample, that is, 3.8% and 3.6%, respectively. After 150 cycles, the strength loss rates of L-11 and L-22 were 18.5% and 19%, respectively, which was 60% of the strength loss rate of the control sample. This trend shows that PLC can effectively improve the sulfate resistance of concrete.
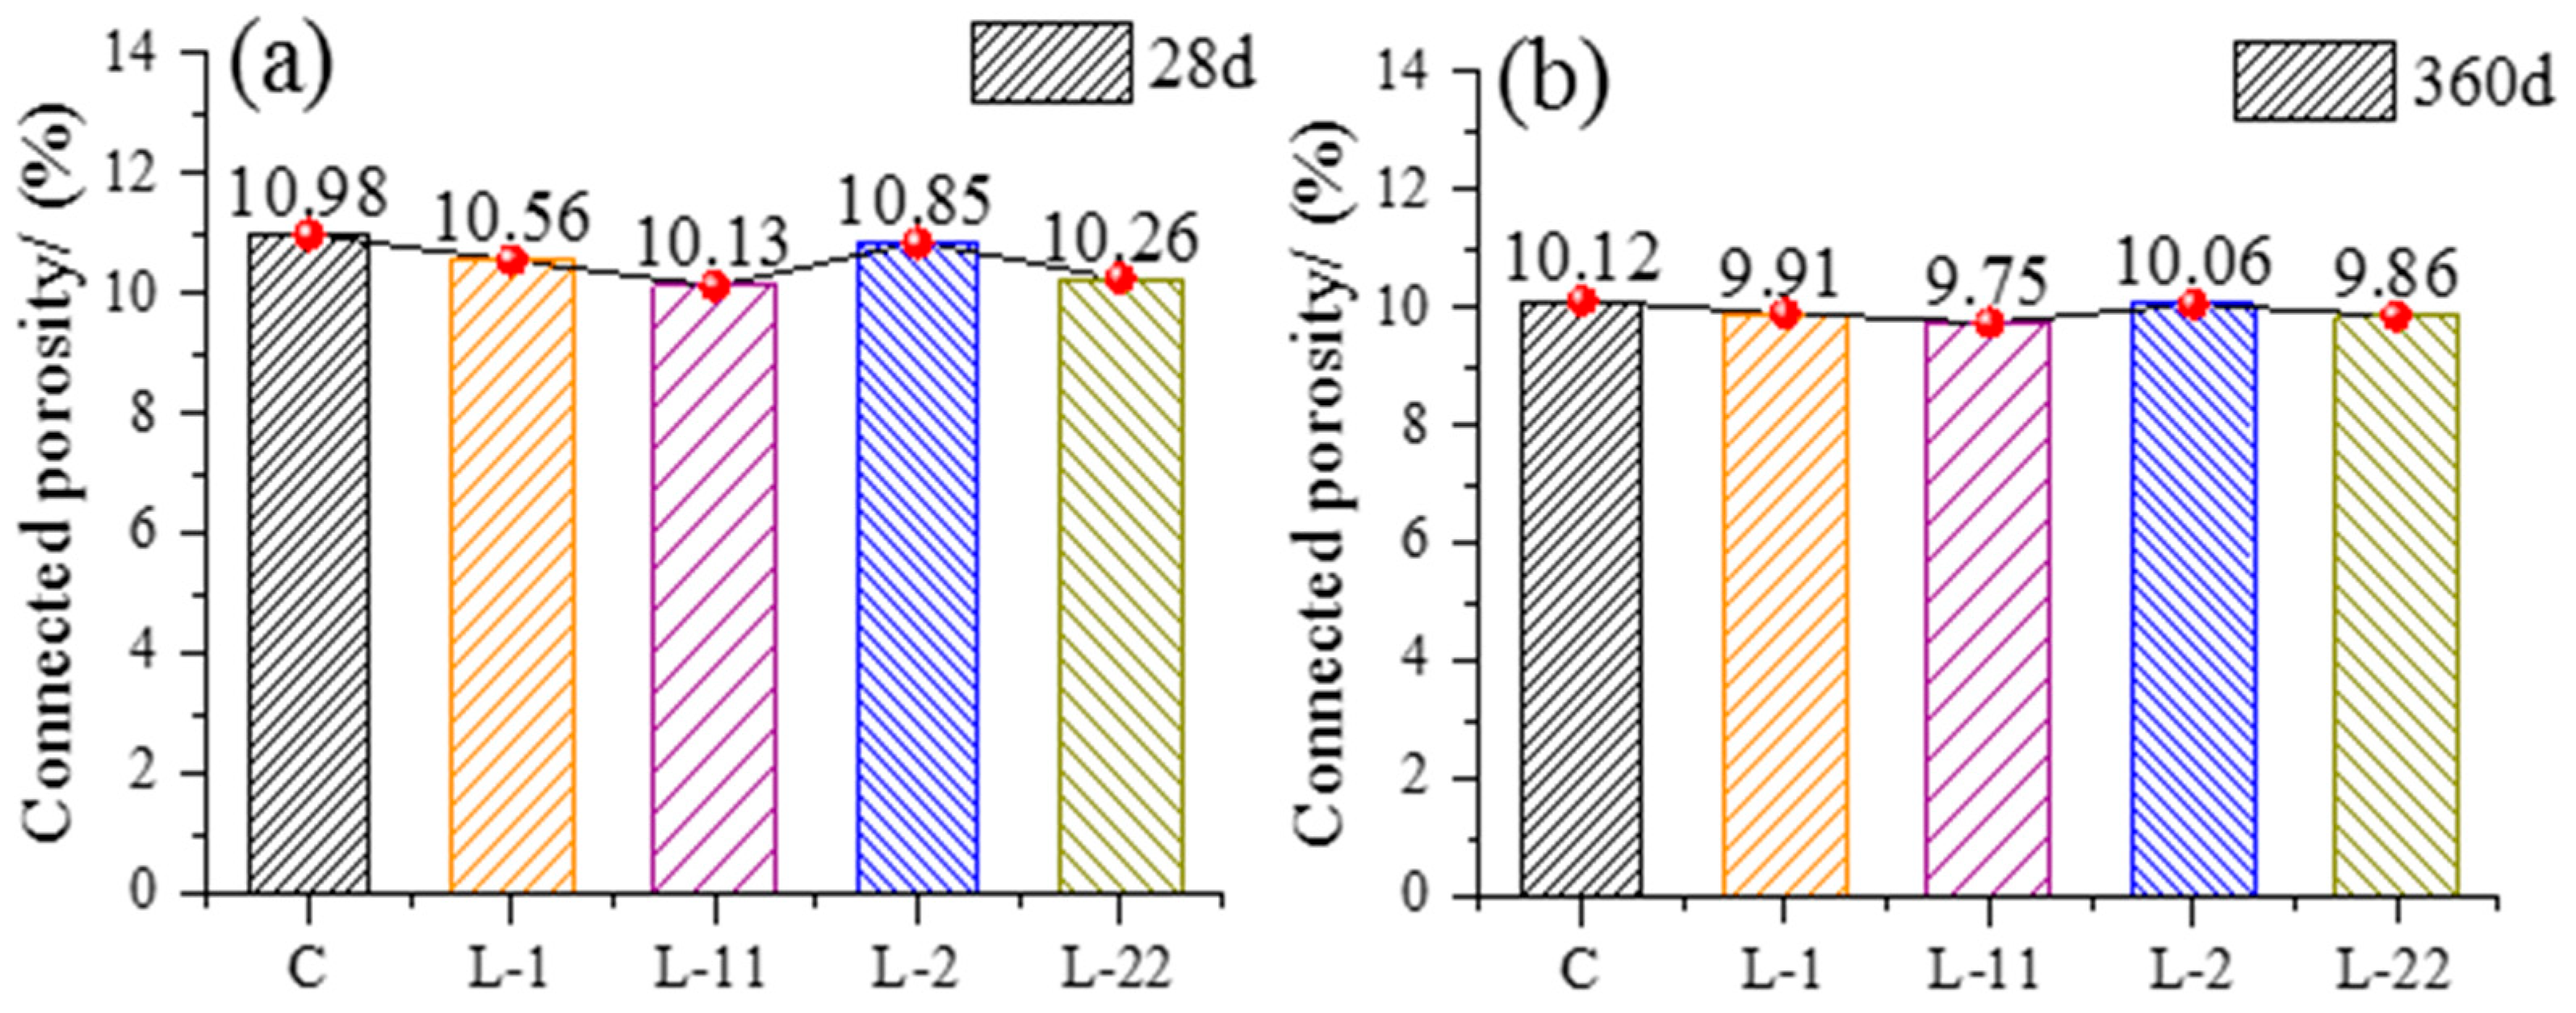
Figure 4 shows the connected porosity (a) 28 d (b) 360 d of concrete mixed with different content of PLC. The trend of chloride permeability can be explained by the trend of the connected porosity, that is, the lower the connected porosity, the better the chloride-attack resistance. At the age of 28 days, the connected porosity of the control sample (C) was 10.98. After adding 20% and 33% PLC, the connected porosity of L-1 and L-2 decreased to 10.56 and 10.85, respectively. The connected porosity of L-11 and L-22 decreased to 10.13 and 10.26, respectively, after a 0.1–0.15 reduction in water/binder ratio. Similarly, at the age of 360 days, the connected porosity of the samples showed the same trend, indicating that adding PLC or reducing the water/binder mass ratio can reduce the connected porosity of concrete, and the effect is the most positive when they are both performed at the same time.
3.3. Hydration Heat and Adiabatic Temperature Rise
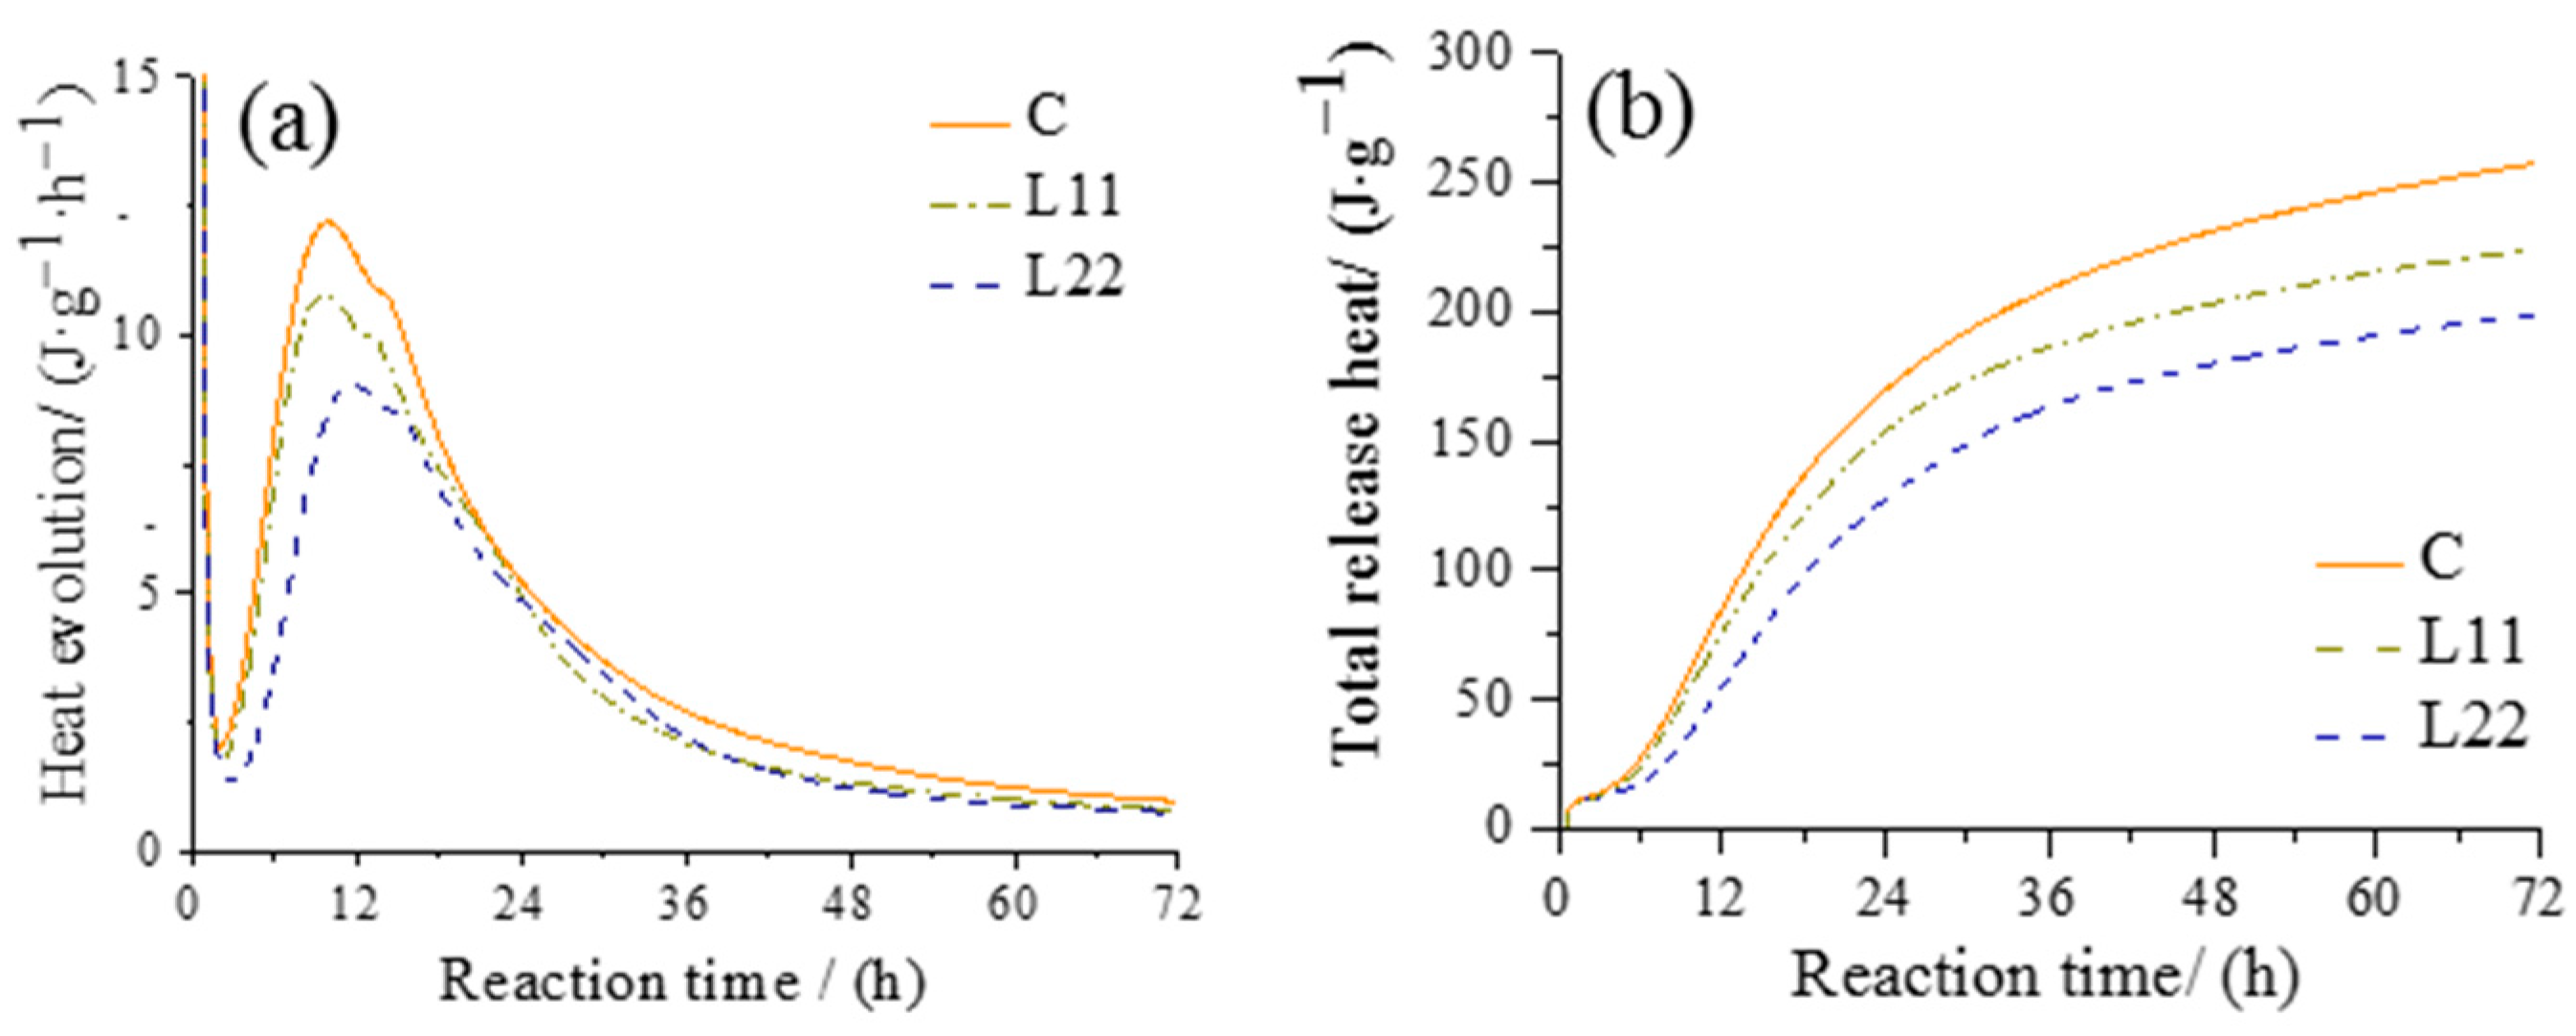
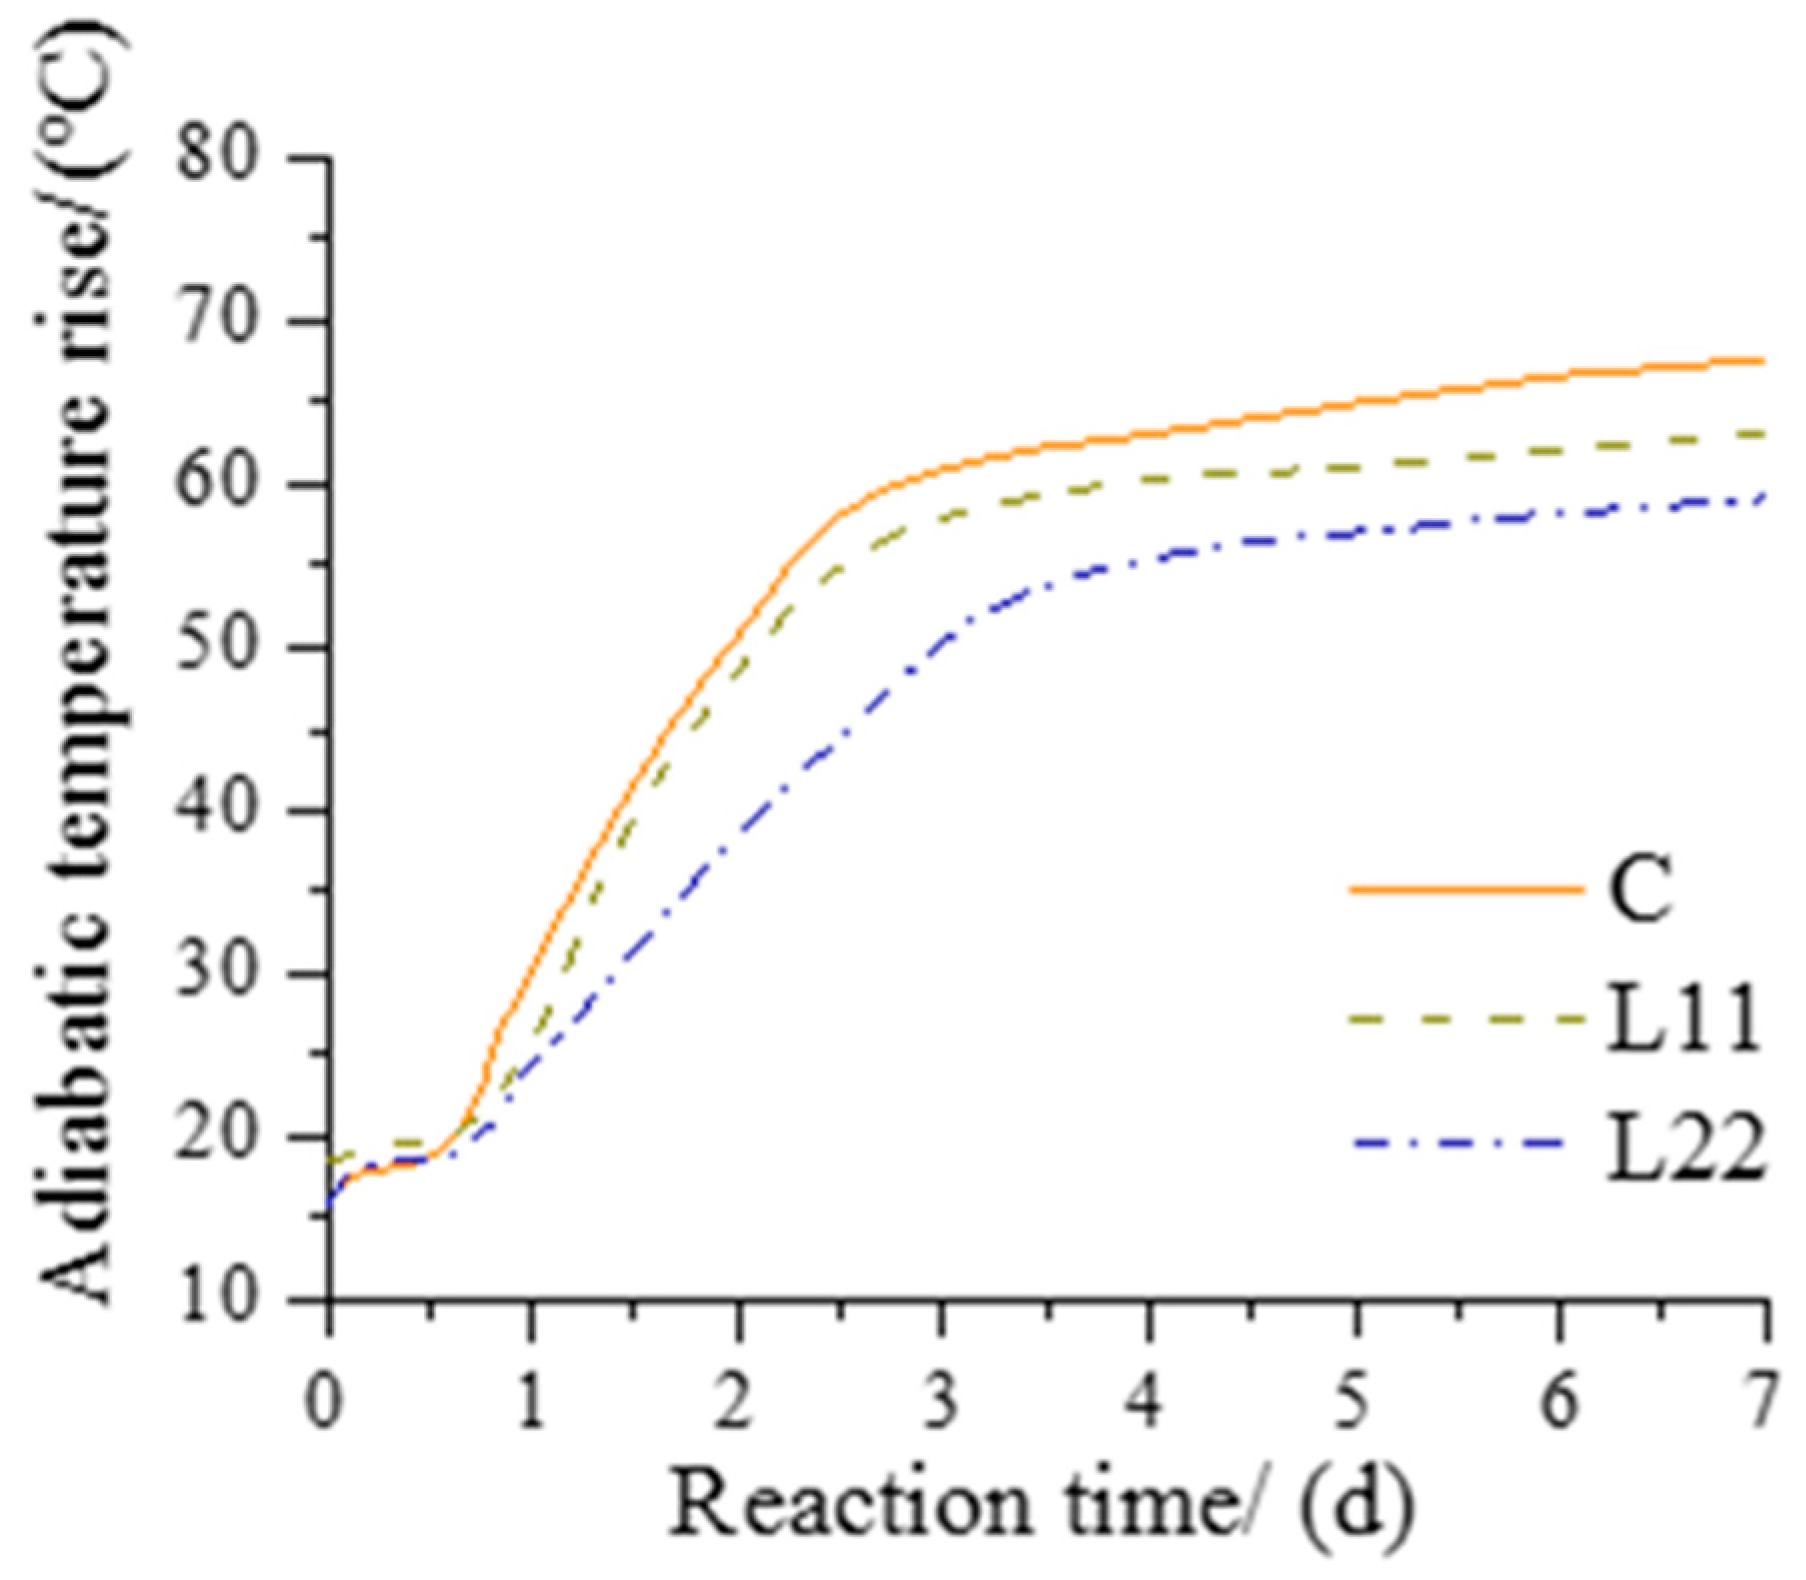
Figure 5 shows the (a) heat evolution and (b) total heat release of cement paste mixed with PLC. It can be seen from Figure 5a that the second exothermic peak of L-11 (i.e., the content of PLC was 20%, and the water/binder ratio was 0.418) was slightly earlier than that of the control sample, indicating that 20% of PLC can promote the reactivity of cement. However, the second exothermic peak of L-22 (i.e., the content of PLC was 33%, and the water/binder ratio was 0.39) was delayed, indicating that when the content of PLC is above certain threshold, the cement hydration will be weakened. It can be seen from Figure 5b that the total heat release of L-11 and L-22 decreased by 12% and 25%, respectively, indicating that PLC can significantly reduce the heat release of cement hydration. It can also be seen from Figure 6 that the adiabatic temperature rises of L-11 and L-22 were 60 °C and 55 °C, respectively, lower than that of the control sample (65 °C), which is consistent with the results of hydration heat release.
3.4. Drying Shrinkage
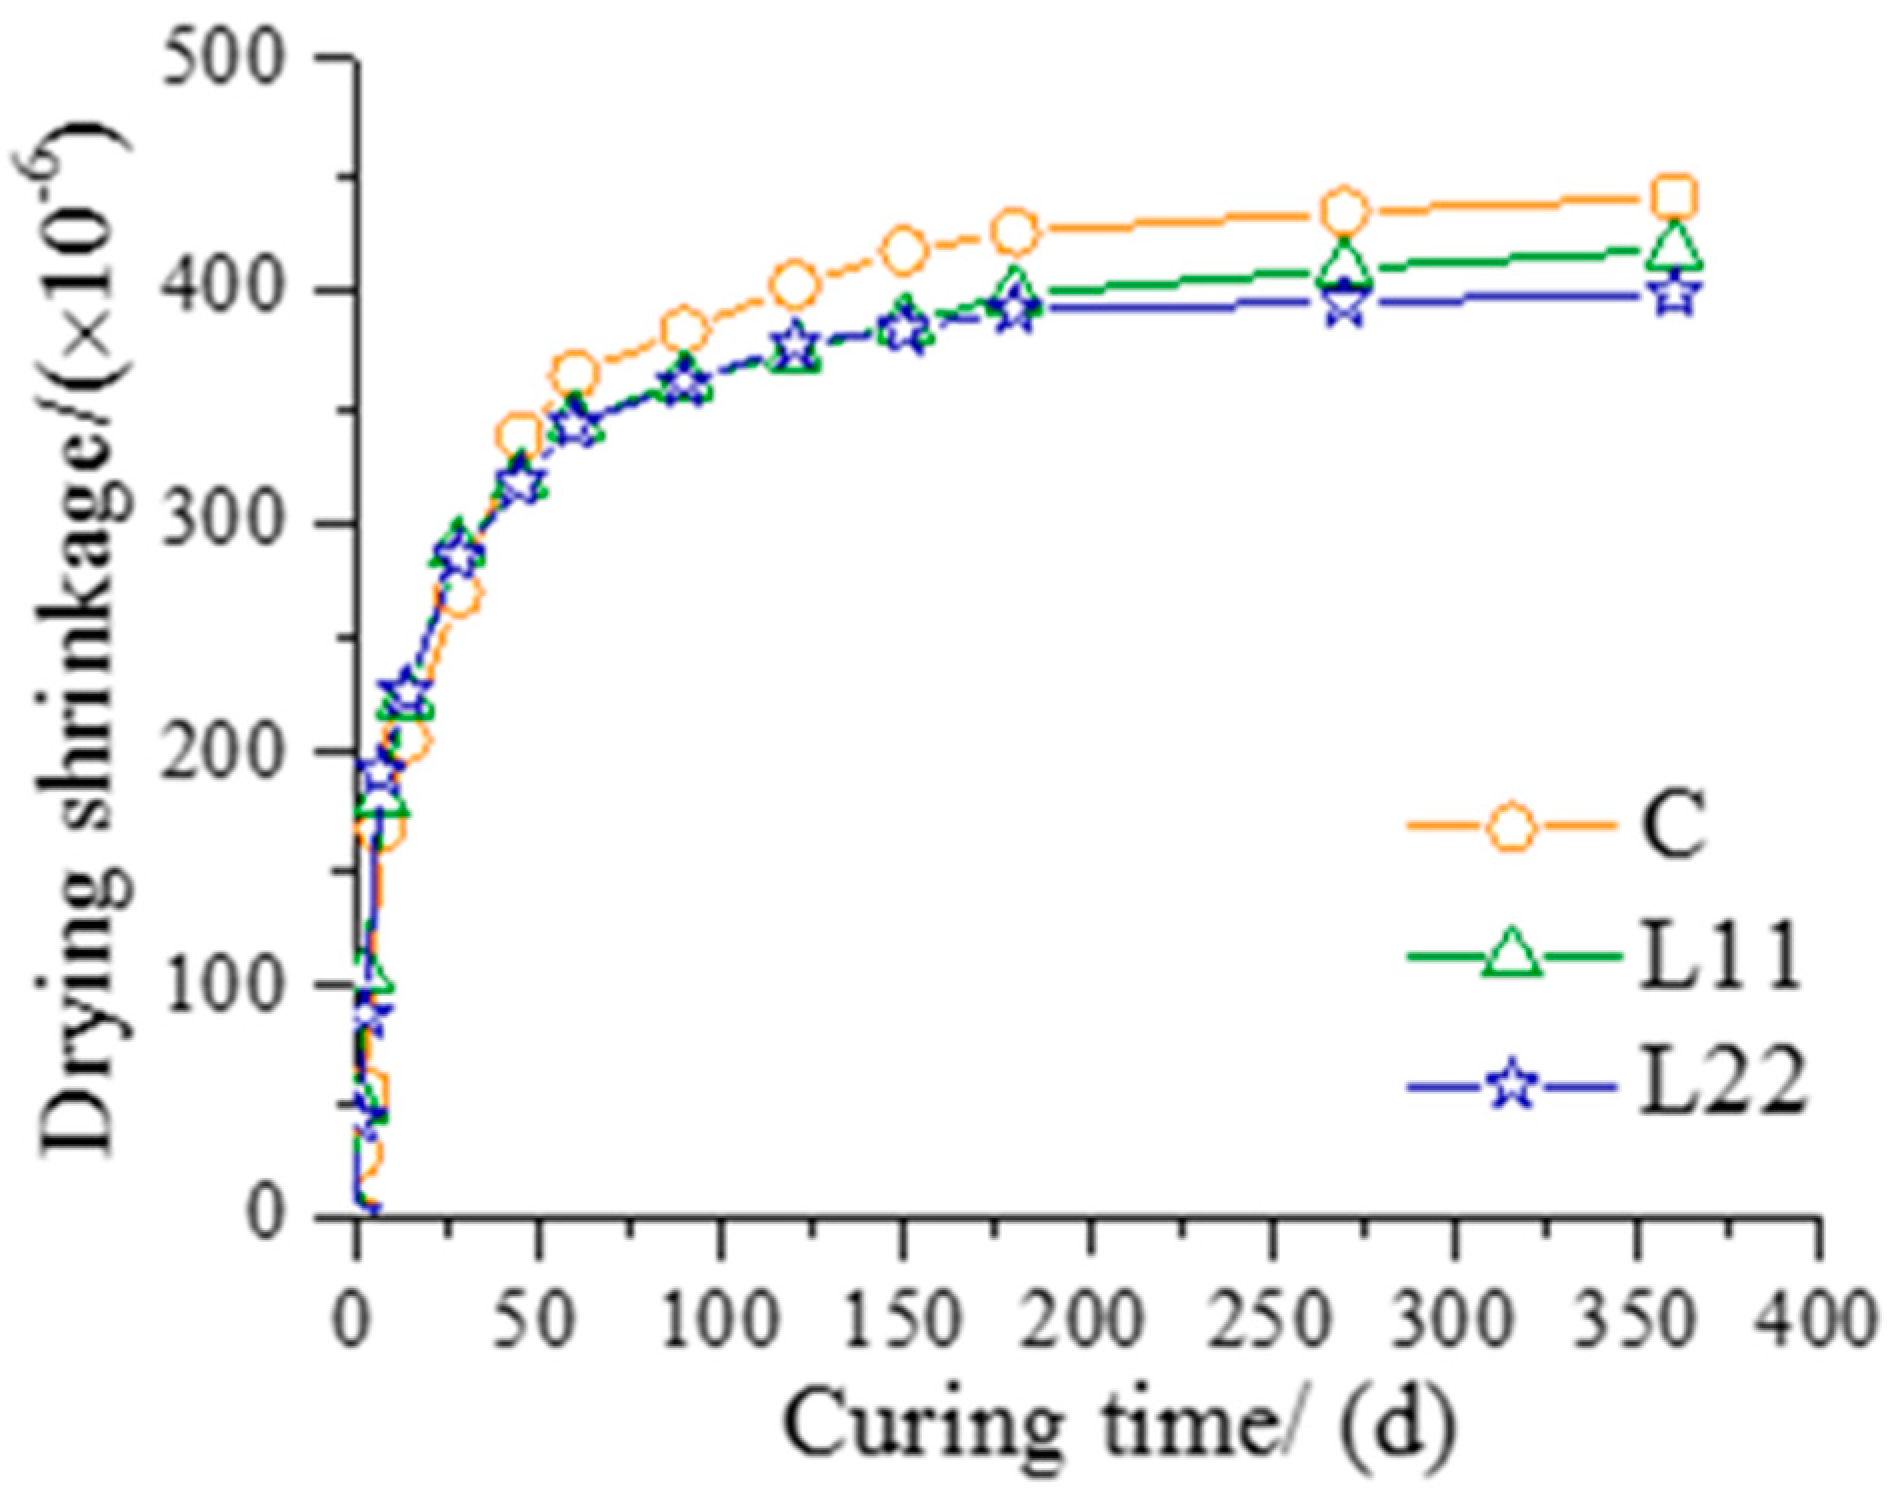
Figure 7 shows the drying shrinkage of concrete mixed with PLC. The drying shrinkage of both the control group and concrete mixed with PLC developed rapidly in the early stage. There is no obvious difference in the drying shrinkage curve between 1–50 days and their values were all around 350. From 50–150 days, the drying shrinkage (380) of concrete mixed with 33% PLC was less than that of the control group (420), and from 150–360 days, the drying shrinkage tended to be stable. The drying shrinkage rates of the control group C, L-11 (i.e., the content of PLC was 20%, and the water/binder ratio was 0.418) and L-22 (i.e., the content of PLC was 33%, and the water/binder ratio was 0.39) were 420, 400 and 380, respectively.
3.5. Reaction Mechanism
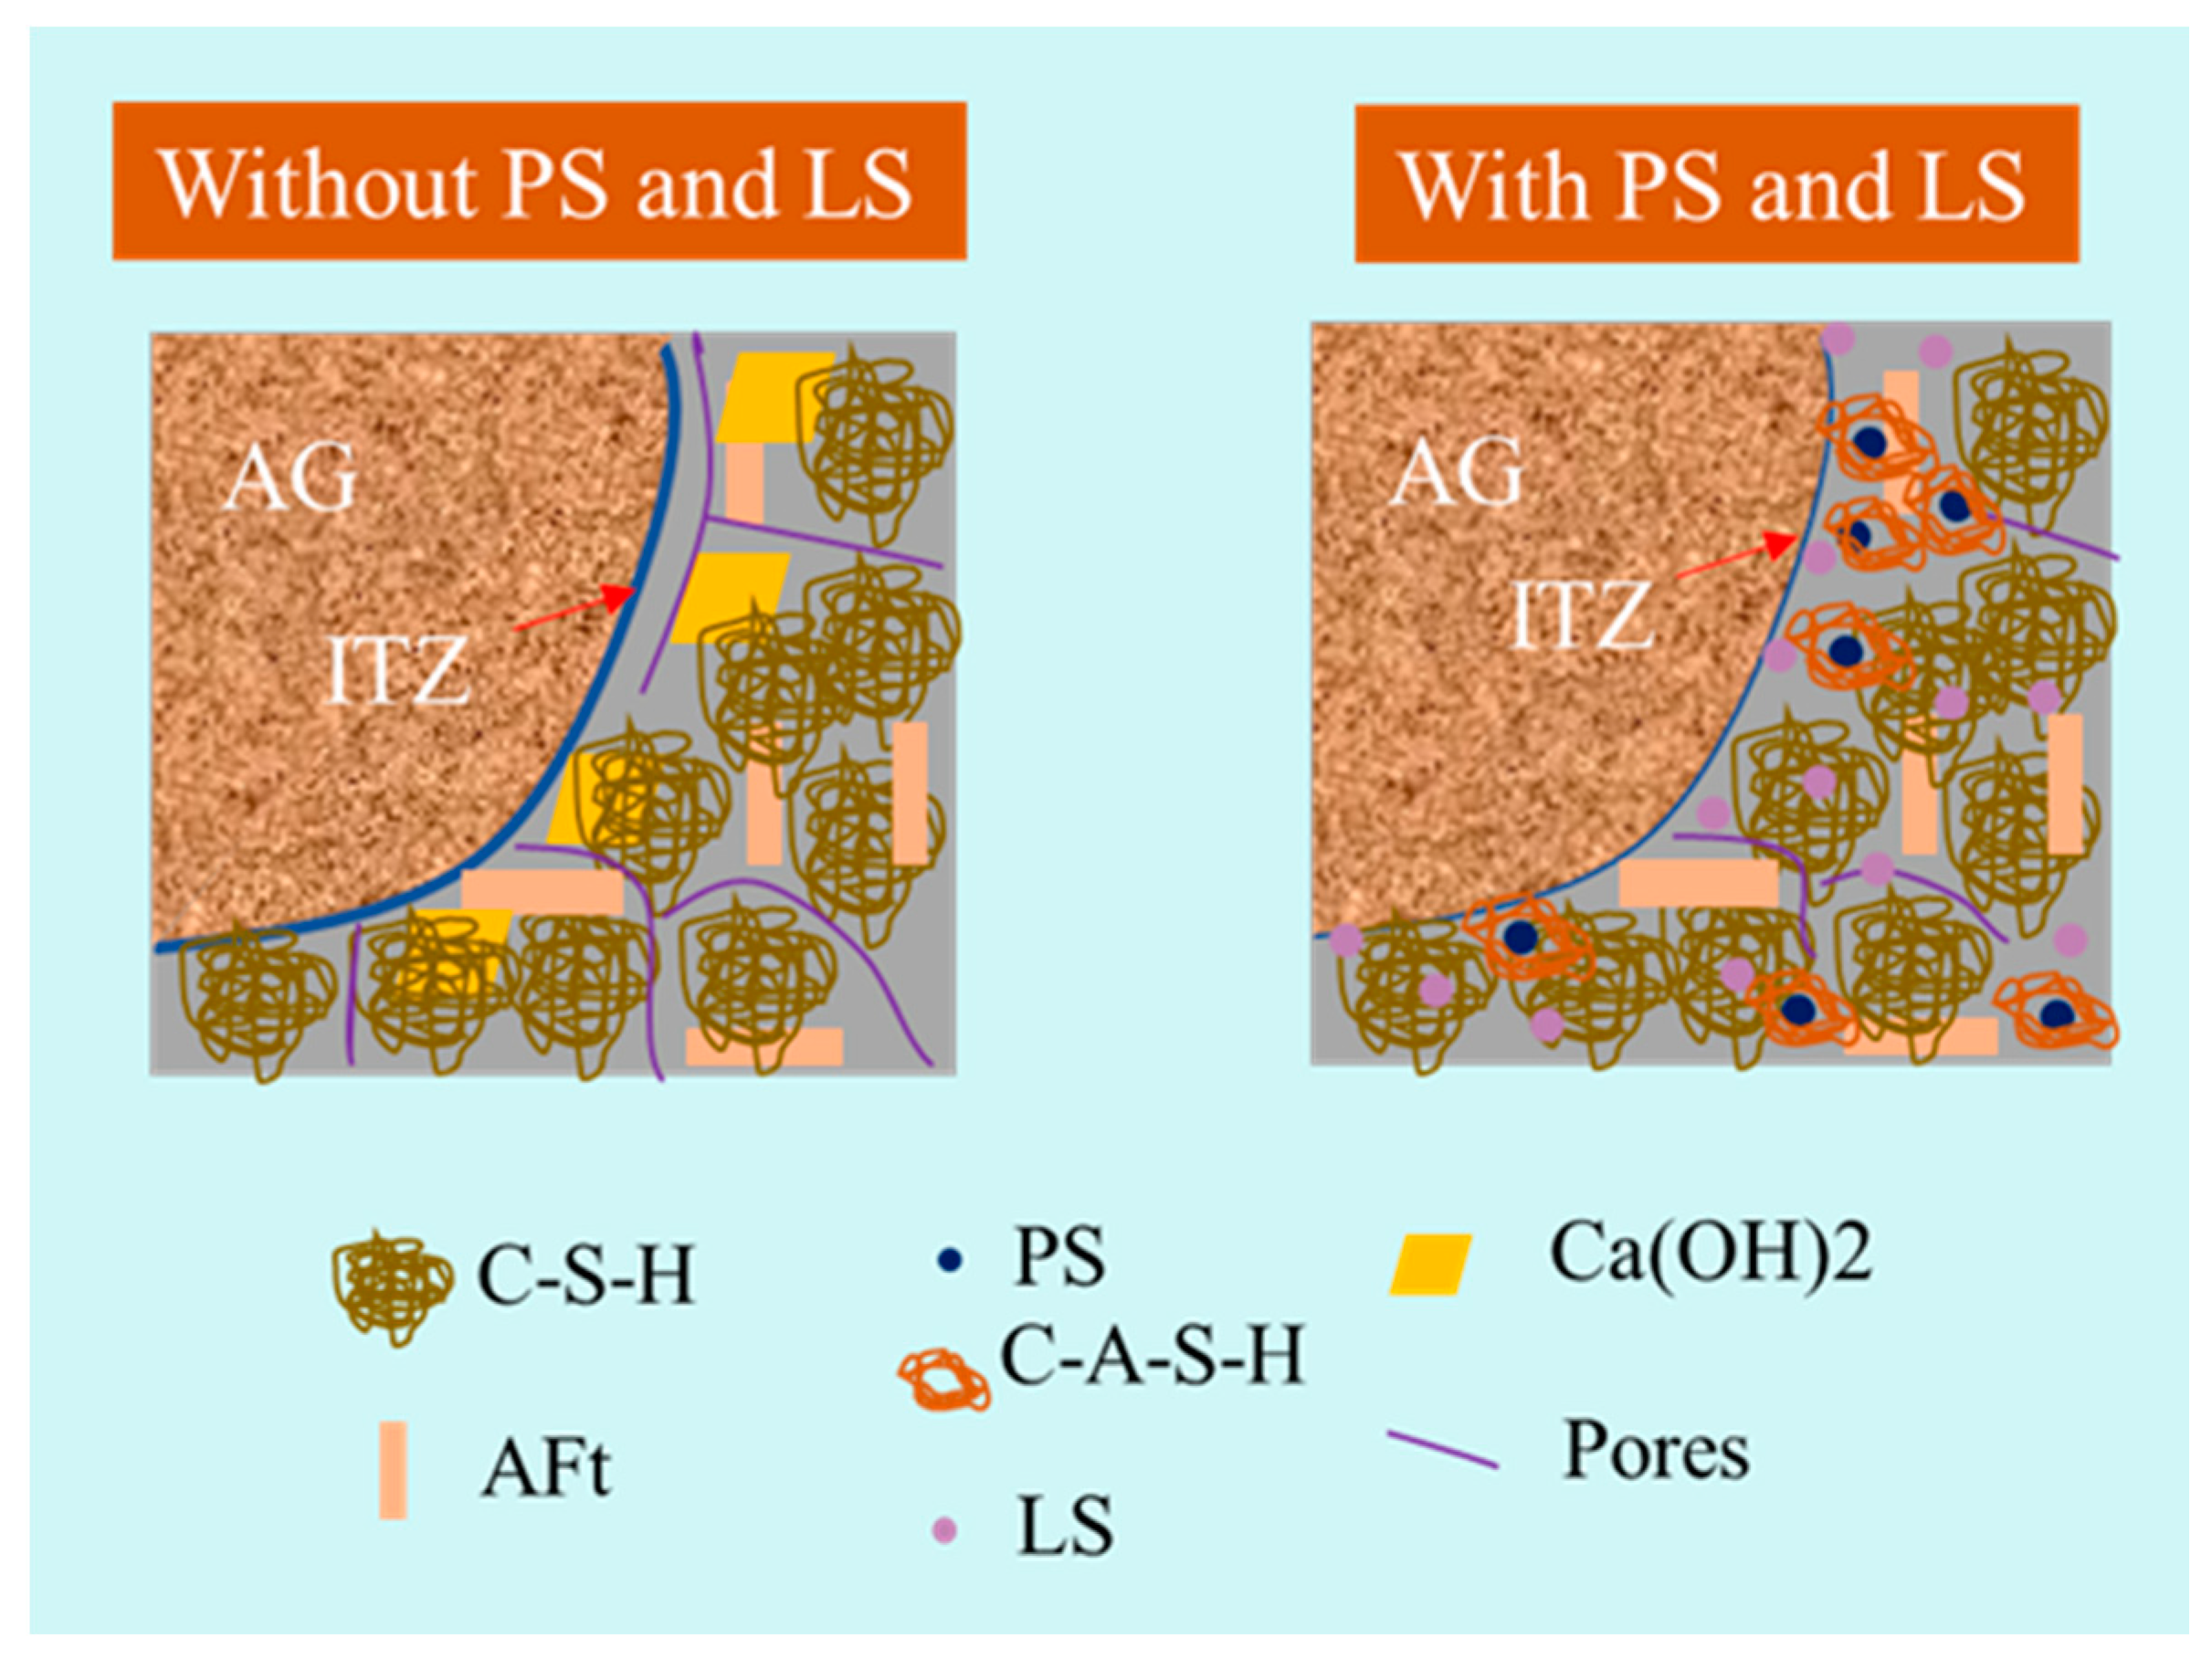
Figure 8 shows the reaction mechanism of PLC in concrete. When no PLC is added, as described in Equations (4)–(6), the reaction in concrete mainly produces C-A-S-H gel, ettringite and calcium hydroxide, among which calcium hydroxide is unfavorable for strength and durability. When the PLC is added, as described in Equations (7)–(10), the main reactions of PS in concrete are the pozzolanic reaction effect and filling effect. PS contains large amount of glass, which can react with calcium hydroxide produced by the hydration of cement to form C-A-S-H gel. These gels increase the compactness of concrete. At the same time, the reduction in the content of calcium hydroxide can enhance the sulfate resistance of concrete. The main functions of limestone in concrete are nucleation effect and filling effect. Due to the heterogeneous nucleation of cement hydration, the surface of LS particles can become the attachment point of the crystal nucleus, which make the low-energy crystal nucleus and nucleation matrix (particle surface of LS) a replacement of the high-energy crystal nucleus and liquid interface. This reduces the nucleation barrier, promotes the hydration of cement and accelerates the strength development of concrete. Meanwhile, both PS and LS have the filling effect. This is because the fineness of PS and LS is less than that of cement, which can supplement the fine particles missing in cement and form continuous gradation in cementitious materials, filling the pores in concrete. These filling effects can improve the pore size distribution of concrete and reduce the connected porosity of concrete so as to improve the durability of concrete.
- Without PS and LS:C3S + H2O→C-S-H + Ca(OH)2C2S + H2O→C-S-H + Ca(OH)2C3A + CŜH + H2O→AFt
- With PS and LS:C3S + H2O + LS→C-S-H (LS nucleation) + Ca(OH)2C2S + H2O + LS→C-S-H (LS nucleation) + Ca(OH)2SiO2·Al2O3(PS) +Ca(OH)2 +LS→C-A-S-H (LS nucleation)C3A + CŜH + H2O→AFt
4. Conclusions
Phosphorus slag (PS) and limestone (LS) composite (PLC) were prepared with a mass ratio of 1:1. The effects of the content of PLC and the water/binder ratio on the mechanical properties, durability and dry shrinkage of concrete were studied via compressive strength, electric flux, sulfate dry/wet cycle method, saturated drainage method, isothermal calorimeter, adiabatic temperature rise instrument and shrinkage deformation instrument.
(1) The adiabatic temperature rises of L-11 and L-22 are 60 °C and 55 °C, respectively, lower than that of the control sample C (65 °C). The addition of PLC does not affect the long-term strength of concrete. When the water/binder ratio decreases by 0.1–0.15, the long-term strength of concrete with PLC increases by about 10% compared with the control sample.
(2) At the age of 360 days, the chloride permeability of L-11 (i.e., the content of PLC was 20%, the water/binder ratio was 0.418) and L-22 (i.e., the content of PLC was 33%, the water/binder ratio was 0.39) decreases to the “very low” grade. After 150 cycles, the strength loss rates of L-11 and L-22 are about 18.5% and 19%, respectively, which is 60% of the strength loss rate of the control sample, indicating that PLC can effectively improve the sulfate resistance of concrete.
(3) The drying shrinkage of samples C, L-11 and L-22 are 420, 400 and 380, respectively. The addition of PLC can reduce the drying shrinkage. The obtained results provide theoretical and technical support for the application of PLC in mass concrete and corrosion-resistant concrete.
Author Contributions
Conceptualization, K.L. and Y.C.; methodology, K.L.; software, Y.C.; validation, K.L. and Y.C.; formal analysis, K.L.; investigation, K.L.; resources, Y.C.; data curation, Y.C.; writing—original draft preparation, K.L.; writing—review and editing, Y.C.; visualization, Y.C.; supervision, Y.C.; project administration, Y.C.; funding acquisition, Y.C. All authors have read and agreed to the published version of the manuscript.
Funding
This research was funded by the National Natural Science Foundation of China, grant number 51822807.
Institutional Review Board Statement
Not applicable.
Informed Consent Statement
Not applicable.
Data Availability Statement
All the data supporting reported results can be found in this manuscript.
Conflicts of Interest
The authors declare no conflict of interest.
References
- Lebedeva, O.E.; Dubovichenko, A.E.; Kotsubinskaya, O.I.; Sarmurzina, A.G. Preparation of porous glasses from phosphorus slag. J. Non-Crystal. Solids 2000, 277, 10–14. [Google Scholar] [CrossRef]
- Chen, J.S.; Zhao, B.; Wang, X.M.; Zhang, Q.L.; Wang, L. Cemented backfilling performance of yellow phosphorus slag. Int. J. Miner. Metal. Mater. 2010, 17, 121–126. [Google Scholar] [CrossRef]
- Chen, X.; Fang, K.; Yang, H.; Peng, H. Hydration kinetics of phosphorus slag-cement paste. J. Wuhan Univ. Techn.-Mater. Sci. Ed. 2011, 26, 142–146. [Google Scholar] [CrossRef]
- Ting, L.; Qiang, W.; Shiyu, Z. Effects of ultra-fine ground granulated blast-furnace slag on initial setting time, fluidity and rheological properties of cement pastes. Powder Technol. 2019, 345, 54–63. [Google Scholar] [CrossRef]
- Barnes, P.; Bensted, J. Structure and Performance of Cement; Wu, Z.; Wang, R., Translators; China Construction Industry Press: Beijing, China, 1991; pp. 248–262. [Google Scholar]
- Li, D.X.; Shen, J.L.; Mao, L.X.; Wu, X. The influence of admixture on the properties of phosphorous slag cement. Cem. Con. Res. 2000, 30, 1169–1173. [Google Scholar] [CrossRef]
- Li, D.X.; Shen, J.L.; Chen, L.; Wu, X. The influence of fast-setting/early-strength agent on high phosphorous slag content cement. Cem. Con. Res. 2001, 31, 19–24. [Google Scholar]
- Yan, P.; Mi, G.; Qiang, W. A comparison of early hydration properties of cement–steel slag binder and cement–limestone powder binder. J. Therm. Analy. Calor. 2014, 115, 193–200. [Google Scholar] [CrossRef]
- De Weerdt, K.; Haha, M.B.; Le Saout, G.; Kjellsen, K.O.; Justnes, H.; Lothenbach, B. Hydration mechanisms of ternary Portland cements containing limestone powder and fly ash. Cem. Con. Res. 2011, 41, 279–291. [Google Scholar] [CrossRef]
- Rizwan, S.A.; Bier, T.A. Blends of limestone powder and fly-ash enhance the response of self-compacting mortars. Constr. Build. Mater. 2012, 27, 398–403. [Google Scholar] [CrossRef]
- Li, L.G.; Kwan, A.K.H. Adding limestone fines as cementitious paste replacement to improve tensile strength, stiffness and durability of concrete. Cem. Con. Comp. 2015, 60, 17–24. [Google Scholar] [CrossRef]
- Hu, J.; Li, M.Y. The properties of high-strength concrete containing super-fine fly ash and limestone powder. Appl. Mech. Mater. 2014, 477, 926–930. [Google Scholar] [CrossRef]
- Temiz, H.; Kantarcı, F. Investigation of durability of CEM II B-M mortars and concrete with limestone powder, calcite powder and fly ash. Constr. Build. Mater. 2014, 68, 517–524. [Google Scholar] [CrossRef]
- Qiang, W.; Feng, J.J.; Yan, P.Y. An explanation for the negative effect of elevated temperature at early ages on the late-age strength of concrete. J. Mater. Sci. 2011, 46, 7279–7288. [Google Scholar]
- Zhang, Z.; Wang, Q.; Chen, H.; Zhou, Y. Influence of the initial moist curing time on the sulfate attack resistance of concretes with different binders. Constr. Build. Mater. 2017, 144, 541–551. [Google Scholar] [CrossRef]
- Wang, D.; Wang, Q.; Huang, Z. New insights into the early reaction of NaOH-activated slag in the presence of CaSO4. Comp. Part B Eng. 2020, 198, 108207. [Google Scholar] [CrossRef]
Figure 1.
Compressive strength of concrete mixed with PLC: (a) 7 d (b) 28 d (c) 90 d (d) 360 d.

Figure 2.
Chloride ion permeability of concrete mixed with PLC: (a) 28 d (b) 360 d.

Figure 3.
Strength loss rate of concrete mixed with different content of PLC after sulfate immersion: (a) 120 cycles (b) 150 cycles.
Figure 3.
Strength loss rate of concrete mixed with different content of PLC after sulfate immersion: (a) 120 cycles (b) 150 cycles.

Figure 4.
Connected porosity (a) 28 d (b) 360 d of concrete mixed with different content of PLC.

Figure 5.
(a) Heat release rate (b) total heat release of cement paste mixed with PLC.

Figure 6.
Adiabatic temperature rise of concrete mixed with PLC.

Figure 7.
Drying shrinkage of concrete mixed with PLC.

Figure 8.
The reaction mechanism of PLC in concrete.


Table 1.
Properties of cement.
| Cement Grade | Setting Time | Flexural Strength | Compressive Strength | Specific Surface Area | Requirement of Normal Consistency | |||
|---|---|---|---|---|---|---|---|---|
| Initial Setting | Final Setting | 3 d | 28 d | 3 d | 28 d | |||
| PO42.5 | 155 | 275 | 6.2 | 9.7 | 27.9 | 48.9 | 360 | 28% |
Table 2.
Chemical composition and specific surface area of phosphorus slag and limestone powder.
| Composition | SiO2 | Al2O3 | Fe3O4 | CaO | MgO | K2O | SO3 | P2O5 | F | Loss |
|---|---|---|---|---|---|---|---|---|---|---|
| PS | 38.53 | 5.65 | 0.05 | 44.2 | 1.24 | 1.46 | 3.12 | 3.13 | 1.72 | 0.58 |
| LS | 4.32 | 1.43 | 0.76 | 51.23 | 1.13 | 0.20 | - | - | - | 41.5 |
Table 3.
Mix proportion of concrete mixed with phosphorus slag powder and limestone powder (unit kg/m3).
Table 3.
Mix proportion of concrete mixed with phosphorus slag powder and limestone powder (unit kg/m3).
| Cement | PS | LS | Sand | Stone | Water | |
|---|---|---|---|---|---|---|
| C | 400 | 0 | 0 | 770 | 1010 | 170 |
| L-1 | 320 | 40 | 40 | 770 | 1010 | 170 |
| L-11 | 320 | 40 | 40 | 773 | 1010 | 167 |
| L-2 | 280 | 70 | 70 | 770 | 1010 | 170 |
| L-22 | 280 | 70 | 70 | 776 | 1010 | 164 |
Publisher’s Note: MDPI stays neutral with regard to jurisdictional claims in published maps and institutional affiliations. |
© 2021 by the authors. Licensee MDPI, Basel, Switzerland. This article is an open access article distributed under the terms and conditions of the Creative Commons Attribution (CC BY) license (https://creativecommons.org/licenses/by/4.0/).
Share and Cite
MDPI and ACS Style
Liu, K.; Cui, Y. Effects of Different Content of Phosphorus Slag Composite Concrete: Heat Evolution, Sulphate-Corrosion Resistance and Volume Deformation. Crystals 2021, 11, 1293. https://0-doi-org.brum.beds.ac.uk/10.3390/cryst11111293
AMA Style
Liu K, Cui Y. Effects of Different Content of Phosphorus Slag Composite Concrete: Heat Evolution, Sulphate-Corrosion Resistance and Volume Deformation. Crystals. 2021; 11(11):1293. https://0-doi-org.brum.beds.ac.uk/10.3390/cryst11111293
Chicago/Turabian StyleLiu, Kuisheng, and Yong Cui. 2021. "Effects of Different Content of Phosphorus Slag Composite Concrete: Heat Evolution, Sulphate-Corrosion Resistance and Volume Deformation" Crystals 11, no. 11: 1293. https://0-doi-org.brum.beds.ac.uk/10.3390/cryst11111293
Note that from the first issue of 2016, this journal uses article numbers instead of page numbers. See further details here.