
Nanocrystalline Surface Layer of WO3 for Enhanced Proton Transport during Fuel Cell Operation


 ,
,  , and
, and 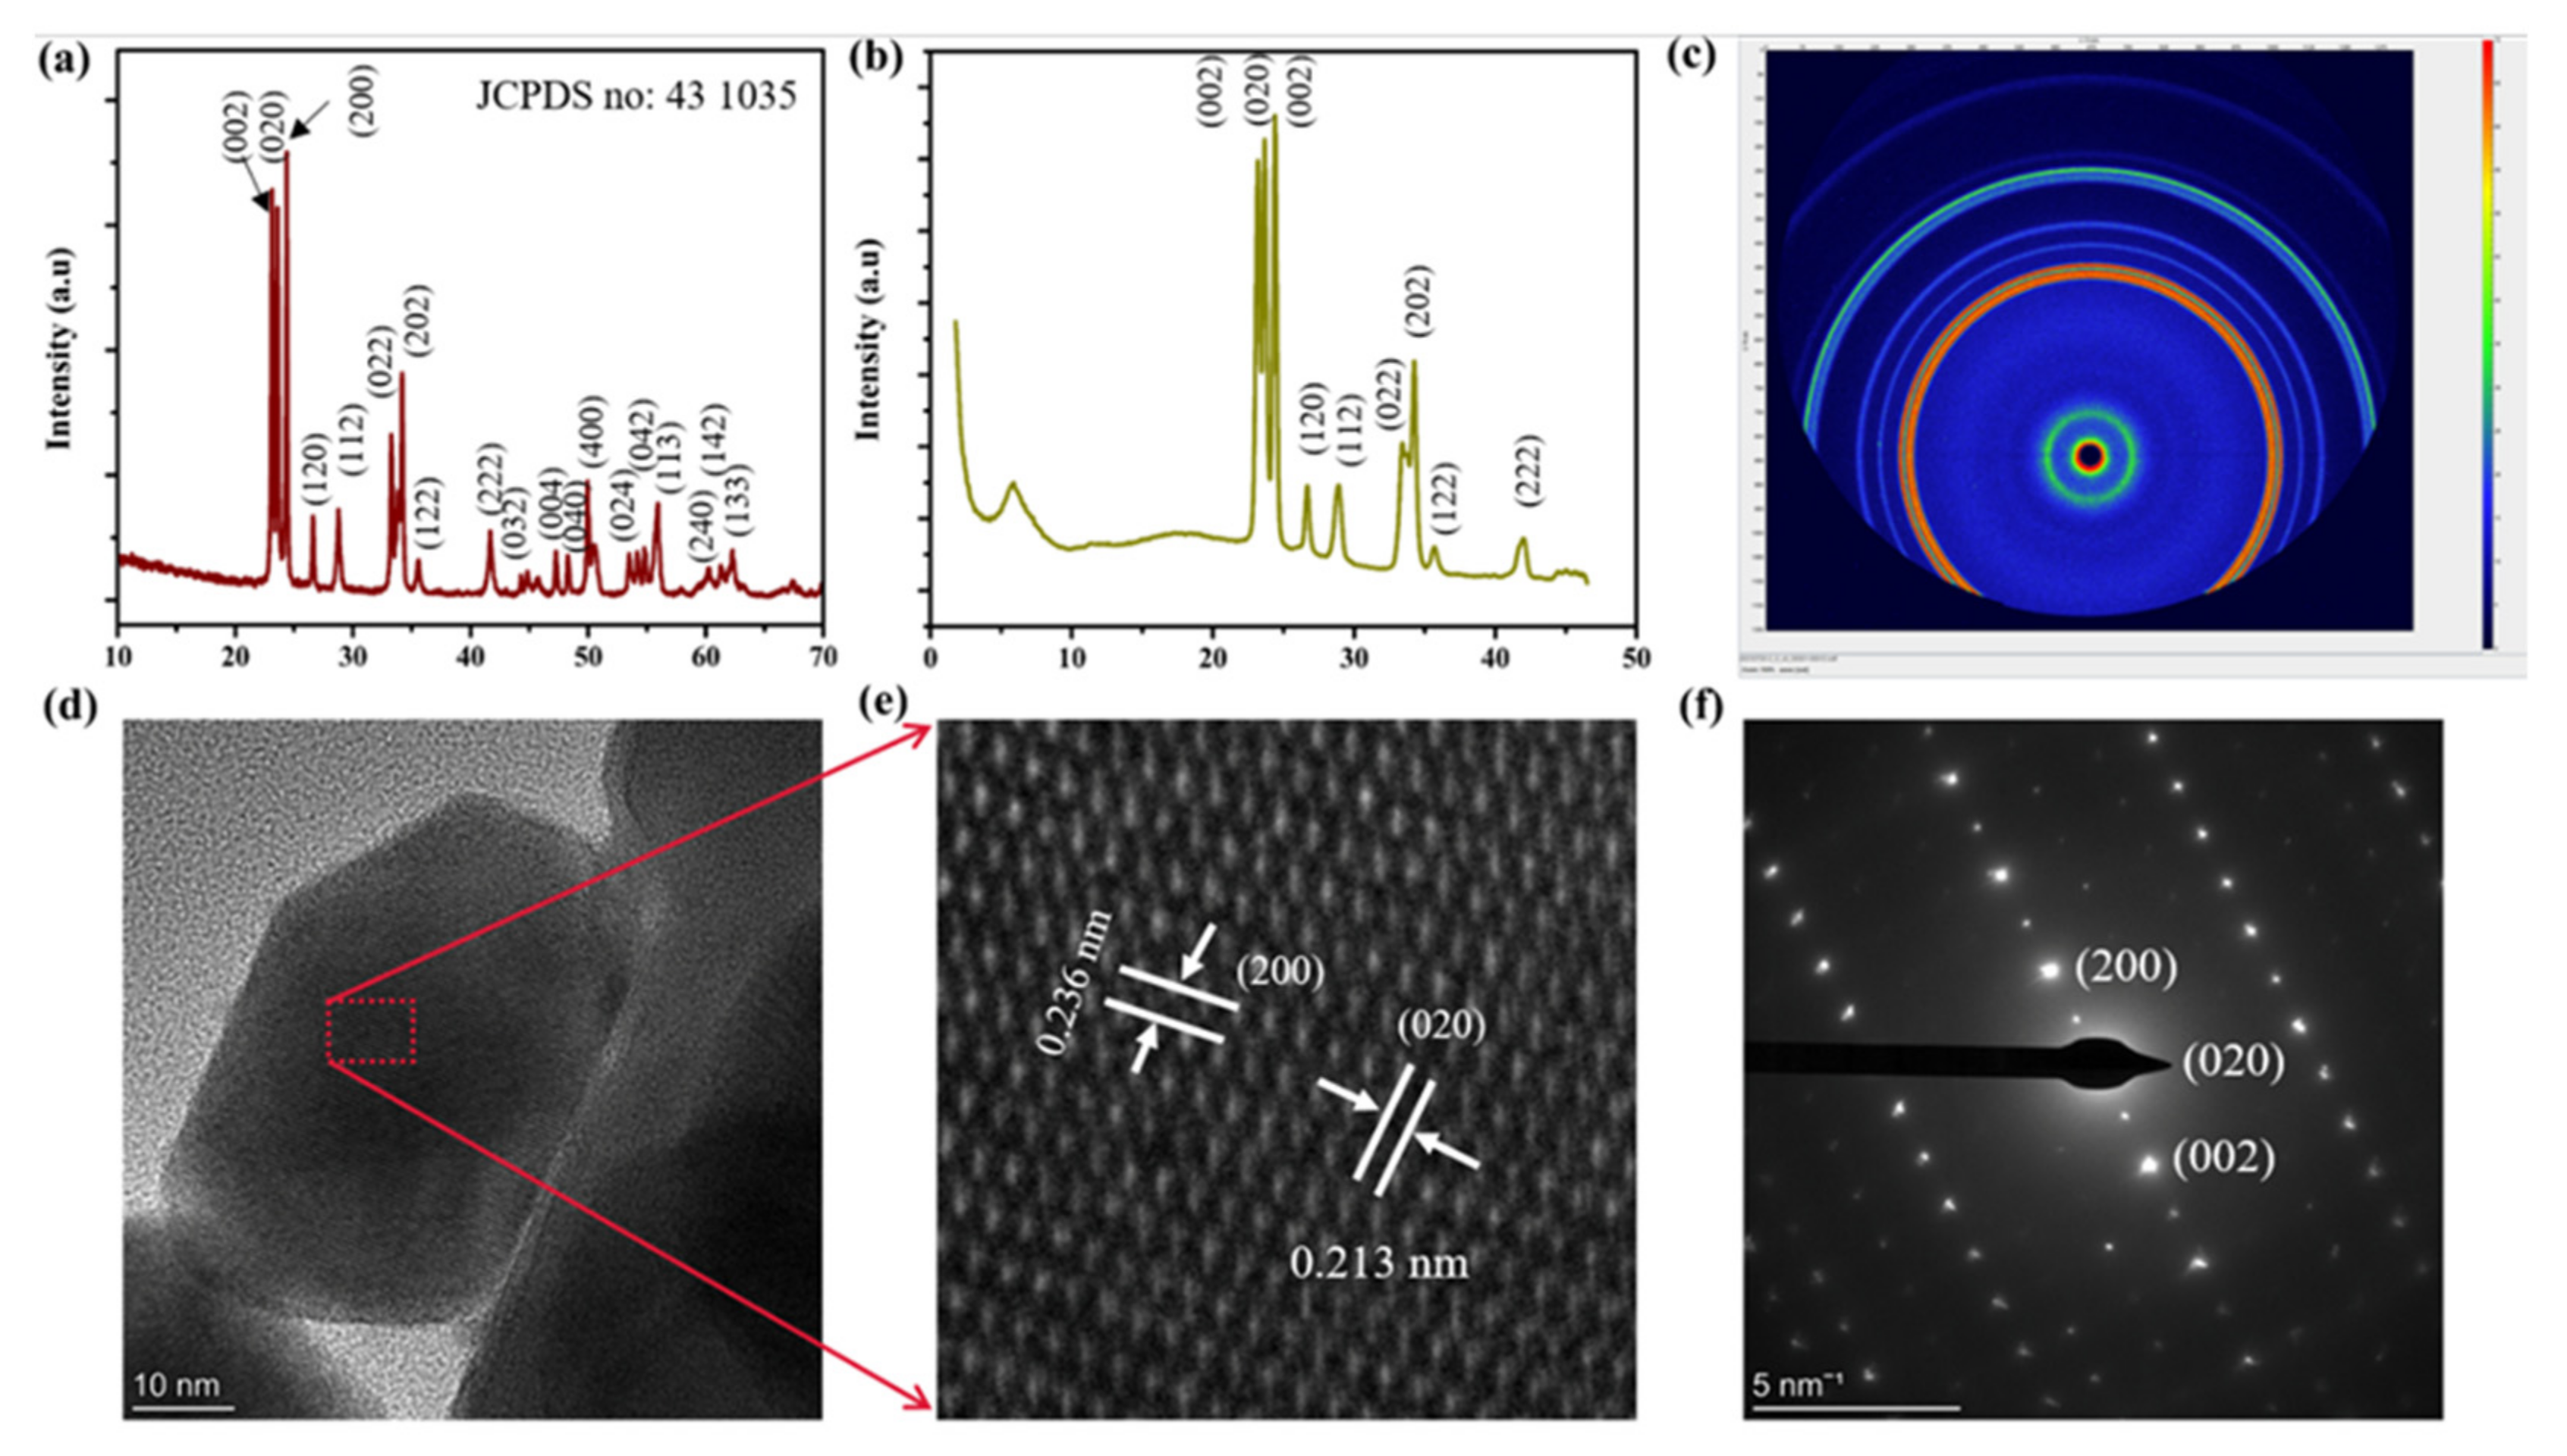
Abstract
:1. Introduction
2. Materials and Methods
2.1. Material Preparation Methods
2.2. Material Characterizations and Electrochemical Measurements
2.3. Fuel Cells Fabrication and Electrochemical Measurements
3. Results & Discussion
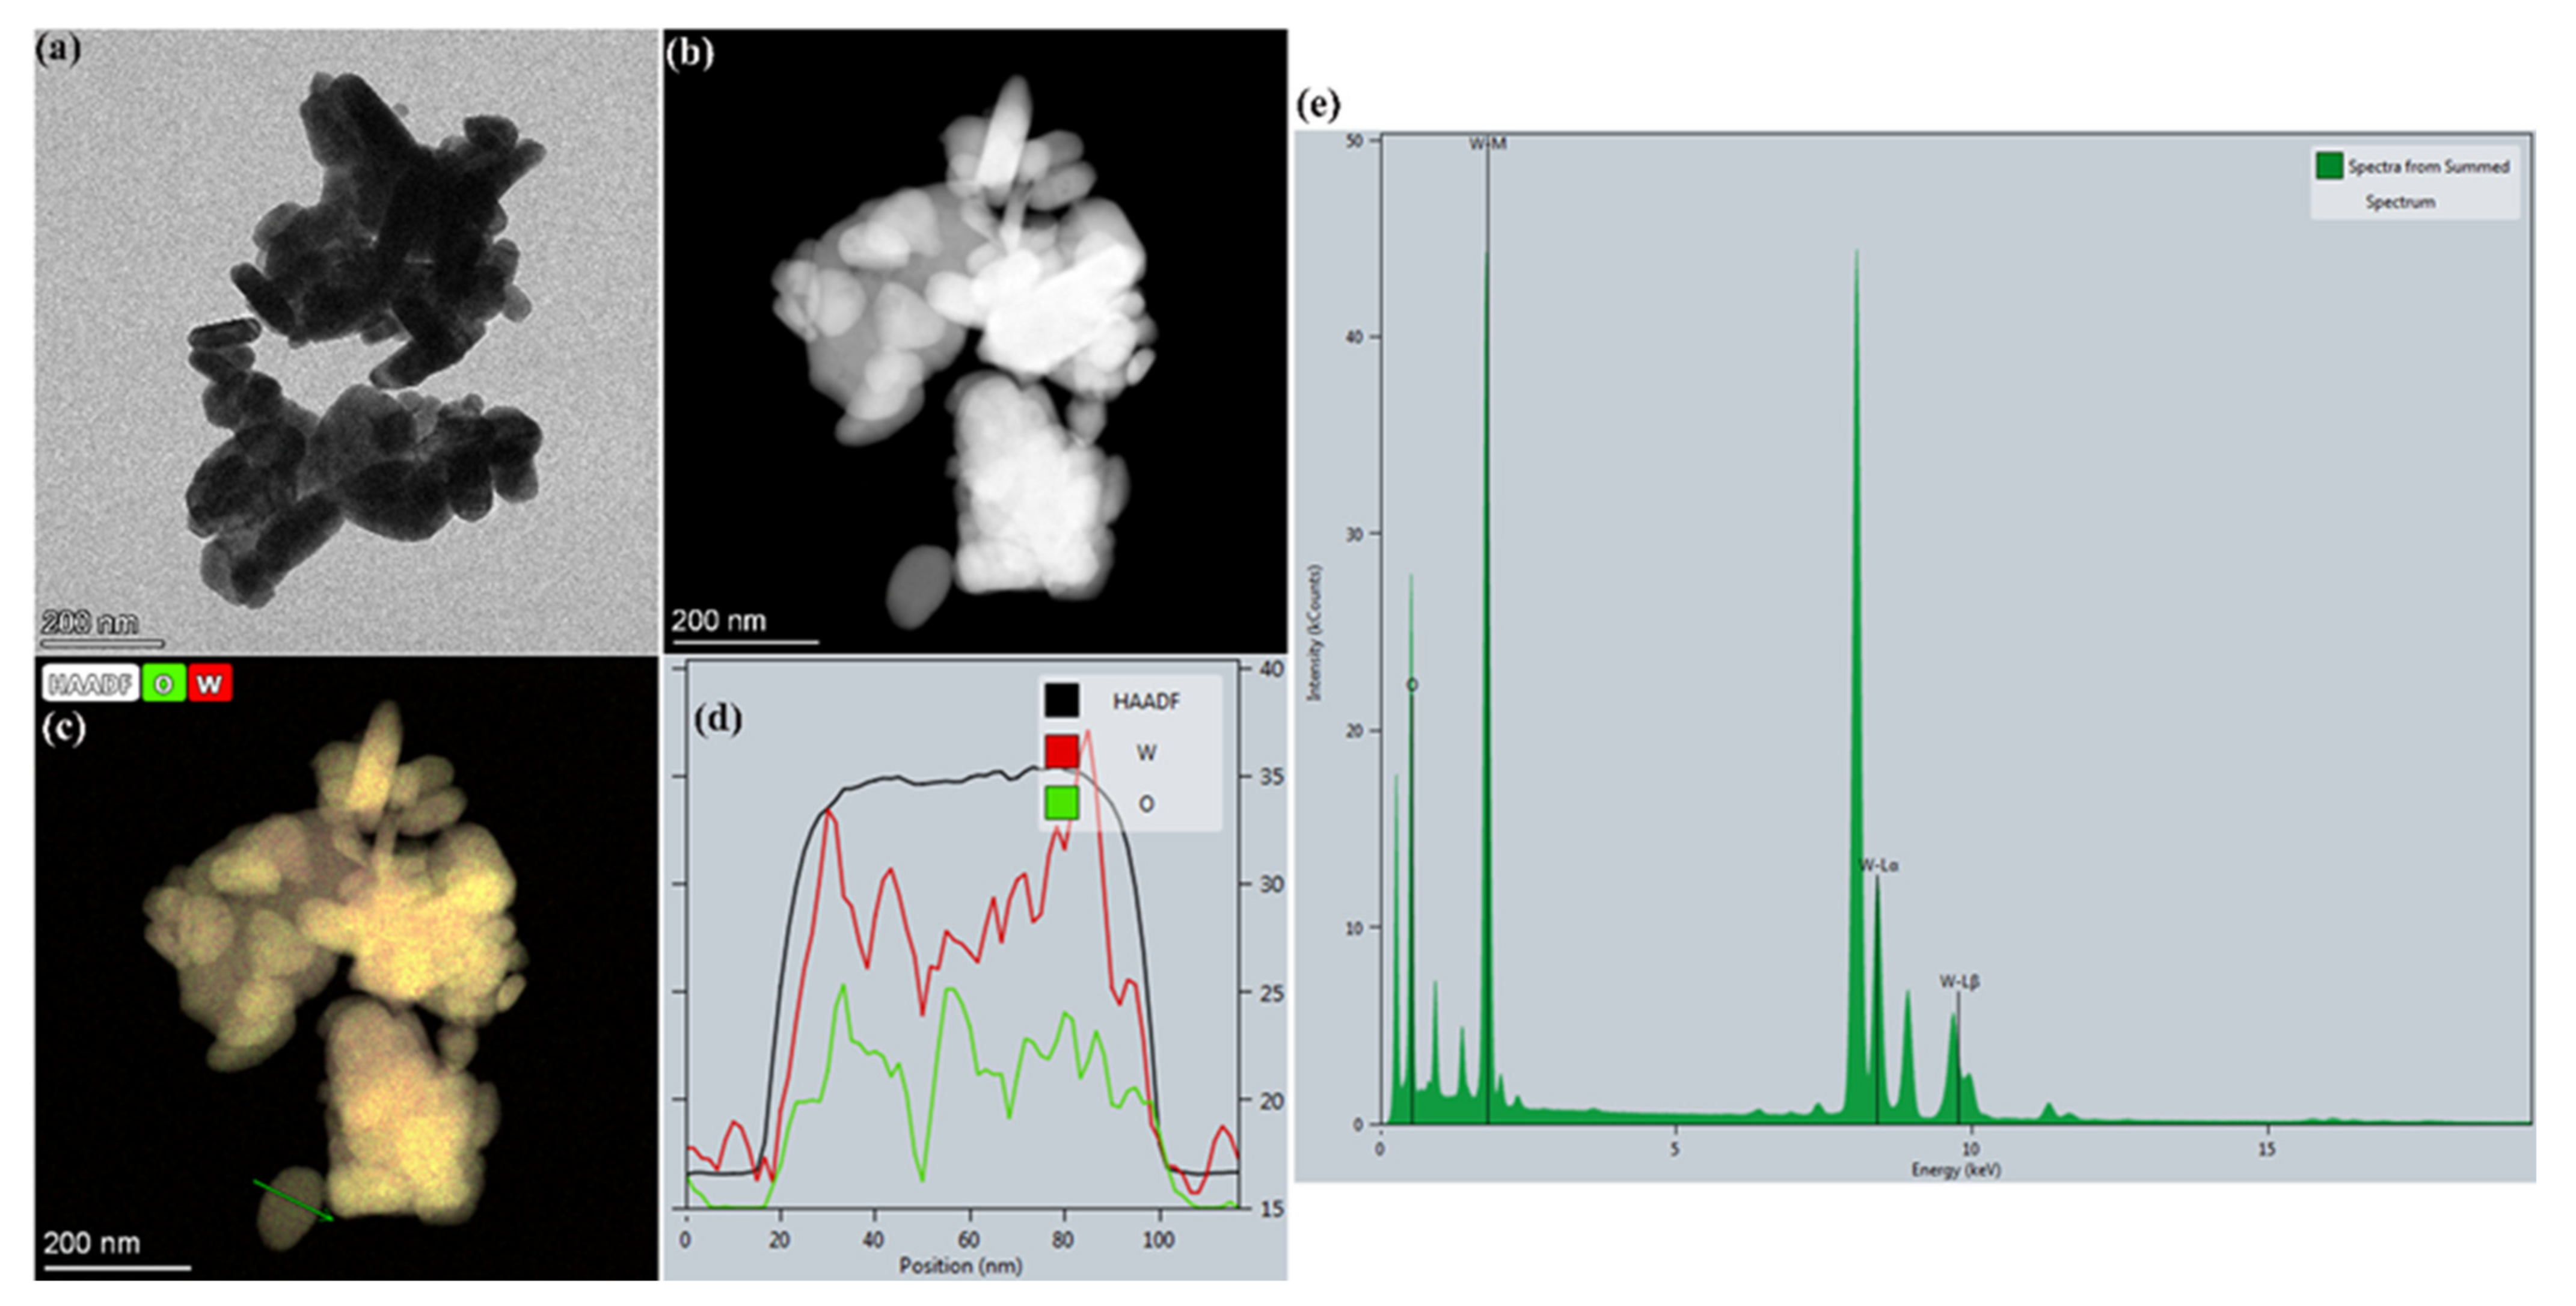
3.1. Structural and Compositional Study
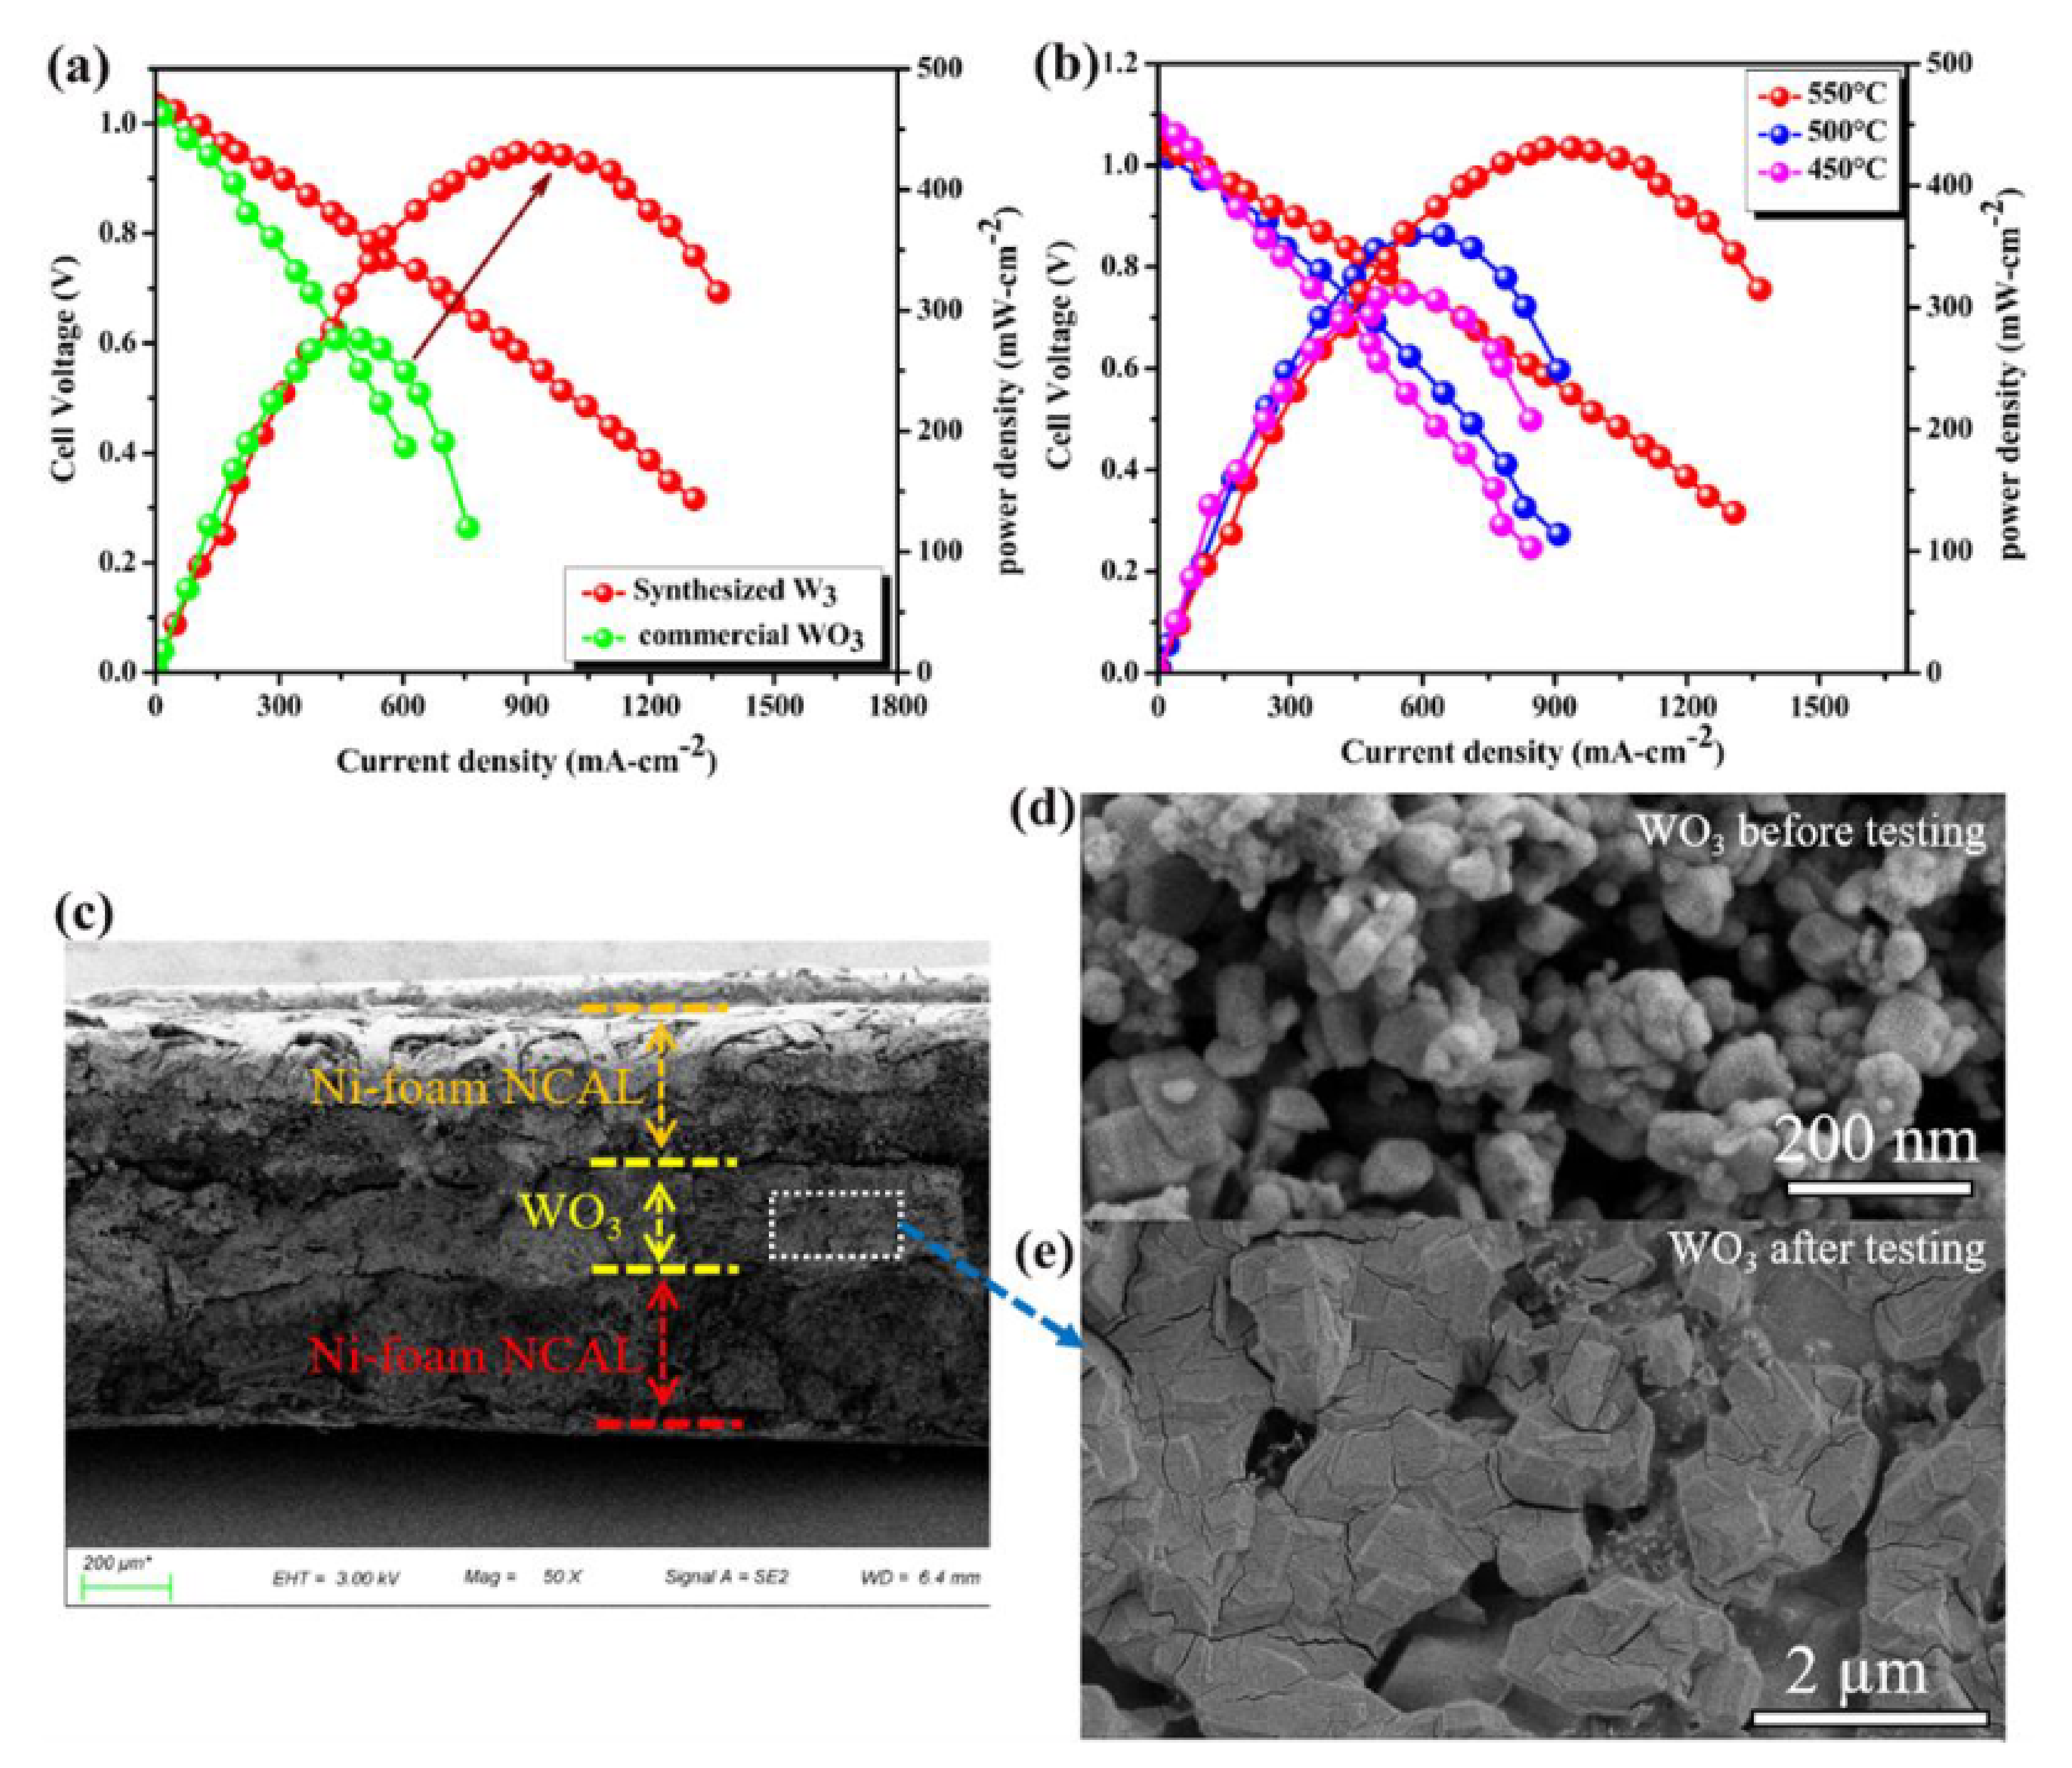
3.2. Electrochemical Performance Measurements
3.3. Electrochemical Impedance and Electrical Conductivity
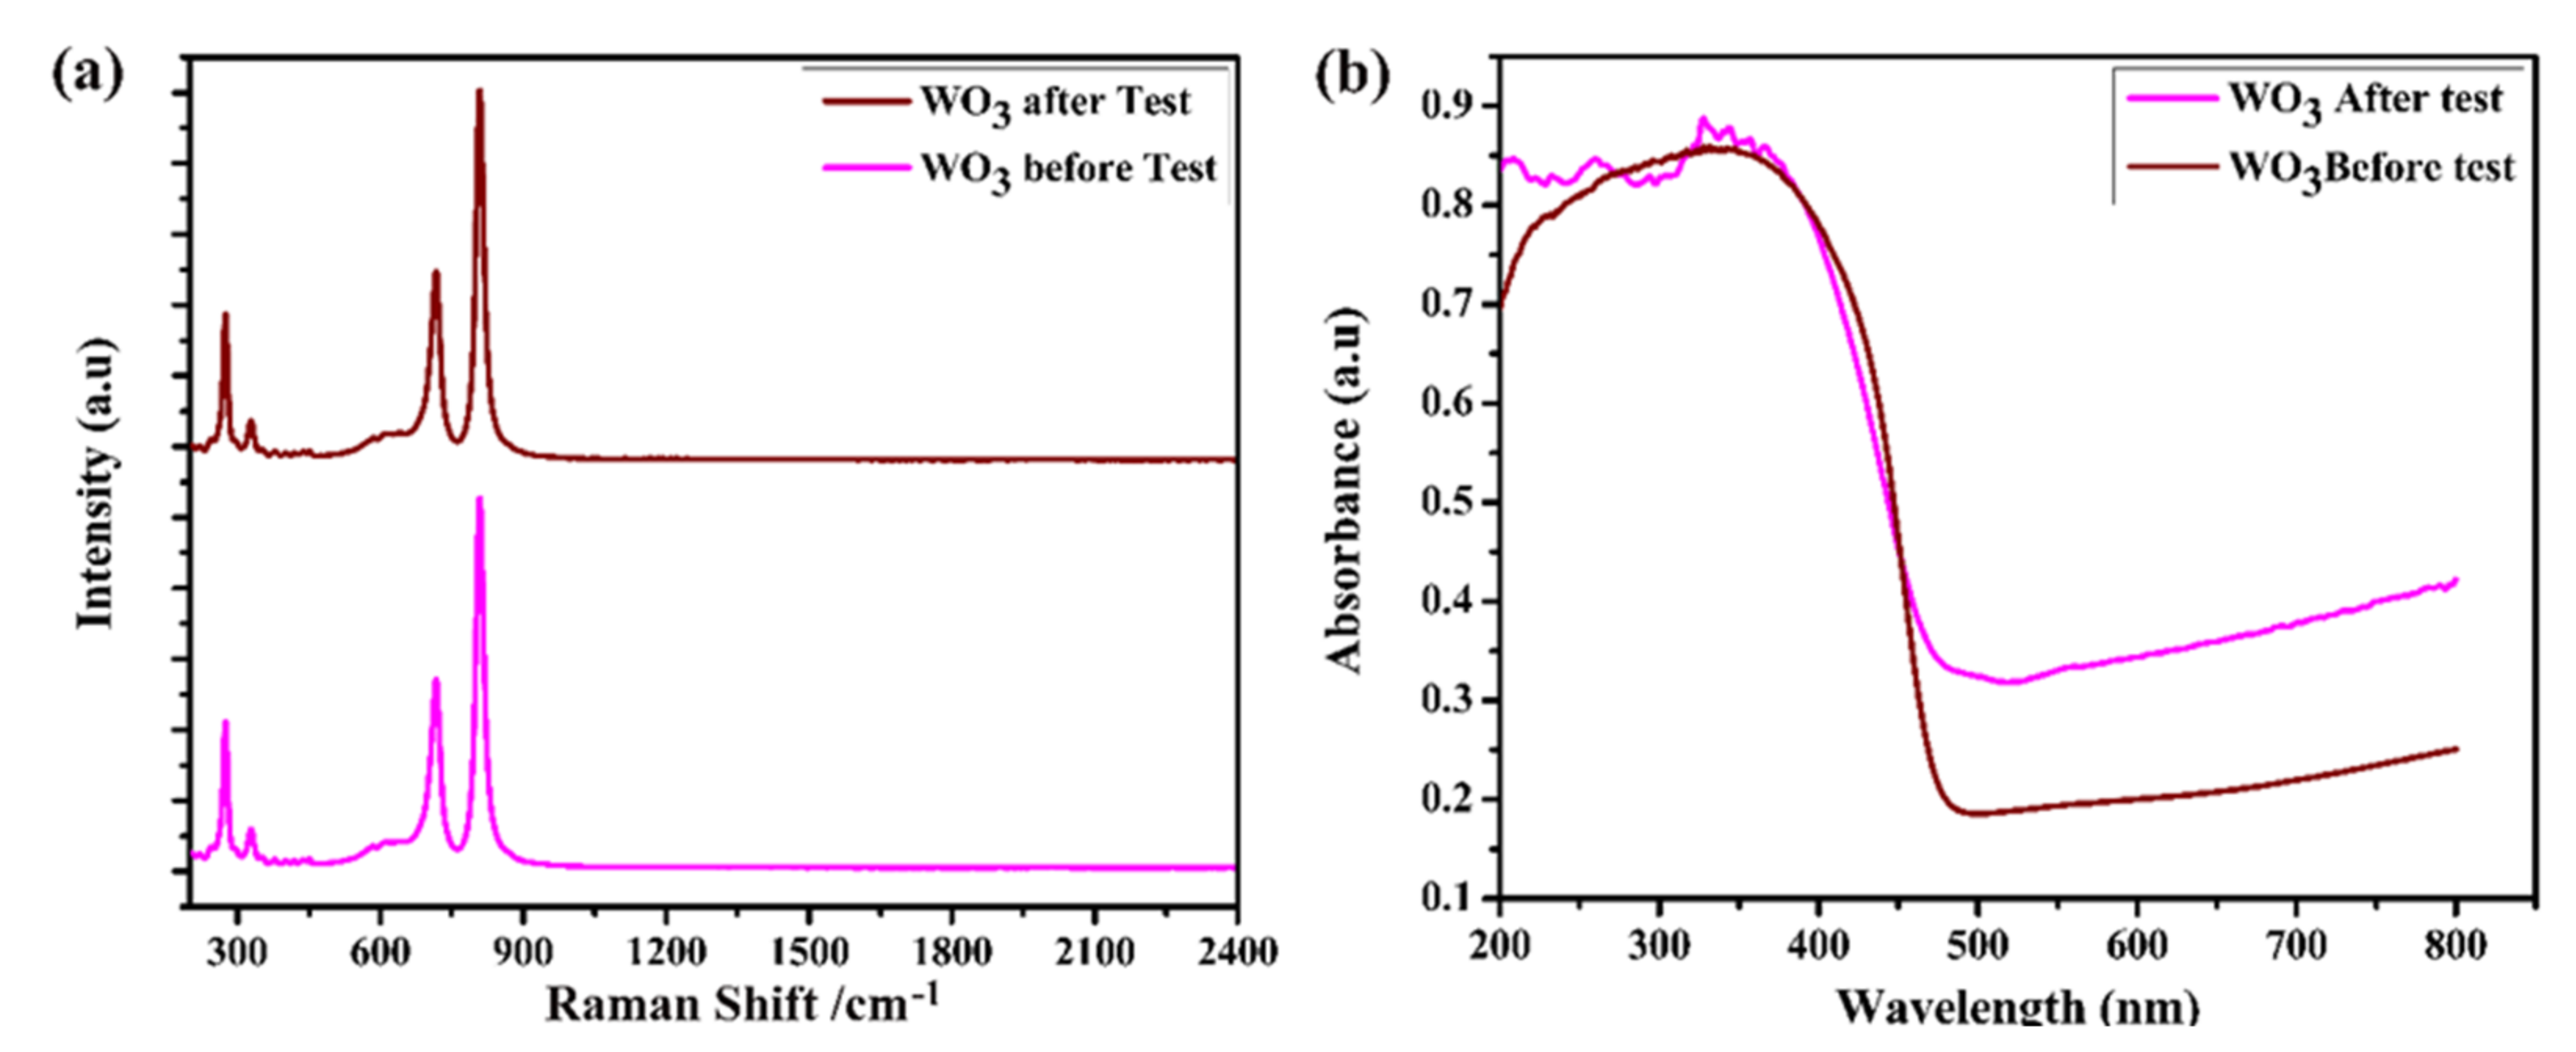
3.4. Spectroscopic Analysis
4. Conclusions
Author Contributions
Funding
Acknowledgments
Conflicts of Interest
References
- Duan, C.; Kee, R.J.; Zhu, H.; Karakaya, C.; Chen, Y.; Ricote, S.; Jarry, A.; Crumlin, E.J.; Hook, D.; Braun, R.; et al. Highly durable, coking and sulfur tolerant, fuel-flexible protonic ceramic fuel cells. Nature 2018, 557, 217–222. [Google Scholar] [CrossRef] [PubMed]
- Choi, S.; Kucharczyk, C.J.; Liang, Y.; Zhang, X.; Takeuchi, I.; Ji, H.-I.; Haile, S.M. Exceptional power density and stability at intermediate temperatures in protonic ceramic fuel cells. Nat. Energy 2018, 3, 202–210. [Google Scholar] [CrossRef] [Green Version]
- Malavasi, L.; Fisher, C.A.J.; Islam, M.S. Oxide-ion and proton conducting electrolyte materials for clean energy applications: Structural and mechanistic features. Chem. Soc. Rev. 2010, 39, 4370–4387. [Google Scholar] [CrossRef]
- Goodenough, J.B. Oxide-Ion Conductors by Design. Nature 1999, 404, 821–823. [Google Scholar] [CrossRef]
- Zhang, L.; Chae, S.-R.; Hendren, Z.; Park, J.-S.; Wiesner, M.R. Recent advances in proton exchange membranes for fuel cell applications. Chem. Eng. J. 2012, 204–206, 87–97. [Google Scholar] [CrossRef]
- Bi, L.; Da’As, E.H.; Shafi, S.P. Proton-conducting solid oxide fuel cell (SOFC) with Y-doped BaZrO3 electrolyte. Electrochem. Commun. 2017, 80, 20–23. [Google Scholar] [CrossRef]
- Hakim, M.; Yoo, C.-Y.; Joo, J.H.; Yu, J.H. Enhanced durability of a proton conducting oxide fuel cell with a purified yttrium-doped barium zirconate-cerate electrolyte. J. Power Sources 2015, 278, 320–324. [Google Scholar] [CrossRef]
- Muccillo, R.; Muccillo, E.N. Synthesis and Properties of BaZr0.1Ce0.7Y02-xMxO3-δ (x = 0, 0.1; M = Dy, Yb) Compounds. ECS Trans. 2011, 35, 1251. [Google Scholar] [CrossRef]
- Liu, Z.; Zhou, M.; Chen, M.; Cao, D.; Shao, J.; Liu, M.; Liu, J. A high-performance intermediate-to-low temperature protonic ceramic fuel cell with in-situ exsolved nickel nanoparticles in the anode. Ceram. Int. 2020, 46, 19952–19959. [Google Scholar] [CrossRef]
- Shah, M.Y.; Mushtaq, N.; Rauf, S.; Akbar, N.; Xing, Y.; Wu, Y.; Wang, B.; Zhu, B. Advanced fuel cell based on semiconductor perovskite La–BaZrYO3-δ as an electrolyte material operating at low temperature 550 °C. Int. J. Hydrog. Energy 2020, 45, 27501–27509. [Google Scholar] [CrossRef]
- Shah, M.A.K.Y.; Rauf, S.; Mushtaq, N.; Zhu, B.; Tayyab, Z.; Yousaf, M.; Hanif, M.B.; Lund, P.D.; Lu, Y.; Asghar, M.I. Novel Perovskite Semiconductor Based on Co/Fe-Codoped LBZY (La0.5Ba0.5Co0.2Fe0.2Zr0.3Y0.3O3−δ) as an Electrolyte in Ceramic Fuel Cells. ACS Appl. Energy Mater. 2021, 4, 5798–5808. [Google Scholar] [CrossRef]
- Lu, Y.; Mi, Y.; Li, J.; Qi, F.; Yan, S.; Dong, W. Recent Progress in Semiconductor-Ionic Conductor Nanomaterial as a Membrane for Low-Temperature Solid Oxide Fuel Cells. Nanomaterials 2021, 11, 2290. [Google Scholar] [CrossRef]
- Liu, Y.; Xia, C.; Wang, B.; Tang, Y. Layered LiCoO2–LiFeO2 Heterostructure Composite for Semiconductor-Based Fuel Cells. Nanomaterials 2021, 11, 1224. [Google Scholar] [CrossRef]
- Xu, D.; Yan, A.; Xu, S.; Zhou, Y.; Yang, S.; Zhang, R.; Yang, X.; Lu, Y. Self-Assembled Triple (H+/O2−/e−) Conducting Nanocomposite of Ba-Co-Ce-YO into an Electrolyte for Semiconductor Ionic Fuel Cells. Nanomaterials. 2021, 11, 2365. [Google Scholar] [CrossRef] [PubMed]
- Sailaja, J.M.; Murali, N.; Margarette, S.; Jyothi, N.K.; Rajkumar, K.; Veeraiah, V. Chemically stable proton conducting doped BaCeO3 by citrate-EDTA complexing sol-gel process for solid oxide fuel cell. S. Afr. J. Chem. Eng. 2018, 26, 61–69. [Google Scholar]
- Fabbri, E.; Bi, L.; Pergolesi, D.; Traversa, E. Towards the next generation of solid oxide fuel cells operating below 600 °C with chemically stable proton-conducting electrolytes. Adv. Mater. 2012, 24, 195–208. [Google Scholar] [CrossRef] [PubMed]
- Stevens, J.; Wieczorek, W.; Raducha, D.; Jeffrey, K. Proton conducting gel/H3PO4 electrolytes. Solid State Ion. 1997, 97, 347–358. [Google Scholar] [CrossRef]
- Yashima, M.; Tsujiguchi, T.; Sakuda, Y.; Yasui, Y.; Zhou, Y.; Fujii, K.; Torii, S.; Kamiyama, T.; Skinner, S.J. High Oxide-Ion Conductivity through the Interstitial Oxygen Site in Ba7Nb4MoO20-Based Hexagonal Perovskite Related Oxides. Nat. Commun. 2021, 12, 556. [Google Scholar] [CrossRef] [PubMed]
- Wang, B.B.; Zhong, X.X.; He, C.L.; Zhang, B.; Cvelbar, U.; Ostrikov, K. Solvent-dependent structures and photoluminescence of WO3-x nanomaterials grown in nonaqueous solutions. J. Alloy. Compd. 2021, 854, 157249. [Google Scholar] [CrossRef]
- Wang, Z.; Fan, X.; Li, C.; Men, G.; Han, D.; Gu, F. Humidity-sensing performance of 3DOM WO3 with controllable structural modification. ACS Appl. Mater. Interfaces 2018, 10, 3776–3783. [Google Scholar] [CrossRef]
- Shah, M.Y.; Rauf, S.; Zhu, B.; Mushtaq, N.; Yousaf, M.; Lund, P.D.; Xia, C.; Asghar, M.I. Semiconductor Nb-Doped SrTiO3 − δ Perovskite Electrolyte for a Ceramic Fuel Cell. ACS Appl. Energy Mater. 2021, 4, 365–375. [Google Scholar] [CrossRef]
- Mushtaq, N.; Xia, C.; Dong, W.; Wang, B.; Raza, R.; Ali, A.; Afzal, M.; Zhu, B. Tuning the energy band structure at interfaces of the SrFe0.75Ti0.25O3−δ–Sm0.25Ce0.75O2−δ heterostructure for fast ionic transport. ACS Appl. Mater. Interfaces 2019, 11, 38737–38745. [Google Scholar] [CrossRef] [PubMed]
- Wang, B.; Cai, Y.; Xia, C.; Kim, J.S.; Liu, Y.; Dong, W.; Wang, H.; Afzal, M.; Li, J.; Raza, R.; et al. Semiconductor-ionic membrane of LaSrCoFe-oxide-doped ceria solid oxide fuel cells. Electrochim. Acta 2017, 248, 496–504. [Google Scholar] [CrossRef] [Green Version]
- Shah, M.A.K.Y.; Zhu, B.; Rauf, S.; Mushtaq, N.; Yousaf, M.; Ali, N.; Tayyab, Z.; Akbar, N.; Yang, C.P.; Wang, B. Electrochemical properties of a co-doped SrSnO3−δ-based semiconductor as an electrolyte for solid oxide fuel cells. ACS Appl. Energy Mater. 2020, 3, 6323–6333. [Google Scholar] [CrossRef]
- Mushtaq, N.; Lu, Y.; Xia, C.; Dong, W.; Wang, B.; Shah, M.Y.; Rauf, S.; Akbar, M.; Hu, E.; Raza, R.; et al. Promoted electrocatalytic activity and ionic transport simultaneously in dual functional Ba0.5Sr0.5Fe0.8Sb0.2O3-δ-Sm0.2Ce0. 8O2-δ heterostructure. Appl. Catal. B: Environ. 2021, 298, 120503. [Google Scholar] [CrossRef]
- Shah, M.A.K.Y.; Mushtaq, N.; Rauf, S.; Xia, C.; Zhu, B. The semiconductor SrFe0.2Ti0.8O3-δ-ZnO heterostructure electrolyte fuel cells. Int. J. Hydrog. Energy 2019, 44, 30319–30327. [Google Scholar] [CrossRef]
- Shah, M.Y.; Tayyab, Z.; Rauf, S.; Yousaf, M.; Mushtaq, N.; Imran, M.A.; Lund, P.D.; Asghar, M.I.; Zhu, B. Interface engineering of bi-layer semiconductor SrCoSnO3-δ-CeO2-δ heterojunction electrolyte for boosting the electrochemical performance of low-temperature ceramic fuel cell. Int. J. Hydrog. Energy 2021, 46, 33969–33977. [Google Scholar] [CrossRef]
- Chen, G.; Liu, H.; He, Y.; Zhang, L.; Asghar, M.I.; Geng, S.; Lund, P.D. Electrochemical mechanisms of an advanced low-temperature fuel cell with a SrTiO3 electrolyte. J. Mater. Chem. A 2019, 7, 9638–9645. [Google Scholar] [CrossRef] [Green Version]
- Katrib, A.; Hemming, F.; Wehrer, P.; Hilaire, L.; Maire, G. The multi-surface structure and catalytic properties of partially reduced WO3, WO2 and WC + O2 or W + O2 as characterized by XPS. J. Electron Spectrosc. Relat. Phenom. 1995, 76, 195–200. [Google Scholar] [CrossRef]
- Efkere, H.I.; Gümrükçü, A.E.; Özen, Y.; Kınacı, B.; Aydın, S. Şebnem; Ates, H.; Özçelik, S. Investigation of the effect of annealing on the structural, morphological and optical properties of RF sputtered WO3 nanostructure. Phys. B Condens. Matter. 2021, 622, 413350. [Google Scholar] [CrossRef]
- Wang, B.; Zhu, B.; Yun, S.; Zhang, W.; Xia, C.; Afzal, M.; Cai, Y.; Liu, Y.; Wang, Y.; Wang, H. Fast ionic conduction in semiconductor CeO2−δ electrolyte fuel cells. NPG Asia Mater. 2019, 11, 1–12. [Google Scholar] [CrossRef] [Green Version]


Publisher’s Note: MDPI stays neutral with regard to jurisdictional claims in published maps and institutional affiliations. |
© 2021 by the authors. Licensee MDPI, Basel, Switzerland. This article is an open access article distributed under the terms and conditions of the Creative Commons Attribution (CC BY) license (https://creativecommons.org/licenses/by/4.0/).
Share and Cite
Song, X.; Guo, W.; Guo, Y.; Mushtaq, N.; Shah, M.A.K.Y.; Irshad, M.S.; Lund, P.D.; Asghar, M.I. Nanocrystalline Surface Layer of WO3 for Enhanced Proton Transport during Fuel Cell Operation. Crystals 2021, 11, 1595. https://0-doi-org.brum.beds.ac.uk/10.3390/cryst11121595
Song X, Guo W, Guo Y, Mushtaq N, Shah MAKY, Irshad MS, Lund PD, Asghar MI. Nanocrystalline Surface Layer of WO3 for Enhanced Proton Transport during Fuel Cell Operation. Crystals. 2021; 11(12):1595. https://0-doi-org.brum.beds.ac.uk/10.3390/cryst11121595
Chicago/Turabian StyleSong, Xiang, Weiqing Guo, Yuhong Guo, Naveed Mushtaq, M. A. K. Yousaf Shah, Muhammad Sultan Irshad, Peter D. Lund, and Muhammad Imran Asghar. 2021. "Nanocrystalline Surface Layer of WO3 for Enhanced Proton Transport during Fuel Cell Operation" Crystals 11, no. 12: 1595. https://0-doi-org.brum.beds.ac.uk/10.3390/cryst11121595