1. Introduction
In the context of the expected energy and food crisis, medium- and long-term forecasts have highlighted the need for finding synergetic solutions. An agrivoltaic system is proposed as a possible option that combines agriculture and the generation of photovoltaic energy, alleviating land competition or other spatial restrictions for energy production. A photovoltaic greenhouse must strike a balance between two complementary requirements: (i) maximizing the flow of Photosynthetic Active Radiation (PAR), the light of wavelengths between 430 and 700 nm, which is essential for the growth and photosynthesis of plants, by reducing the shading effect of photovoltaic panels [
1], and (ii) further enhancement of the production of energy that will ensure the energetic autonomy of the greenhouse.
The theoretically predicted power conversion efficiency (PCE) of the dye-sensitized solar cell (DSSC) is approximately 20% [
2], and in the last few decades, a lot of experiments have focused on continuing increasing the efficiency compared with the used Si-based solar cell, as well as the large modules installations for terrestrial power generation. In recent years, this limited objective has been extended to the advantages over the widely used Si-based solar cell, including higher energy conversion efficiency under weak and indirect illumination conditions. These advantages can compensate for the weaknesses of Si-based solar cells and together with the simple manufacturing process, low fabrication cost, flexibility in scaling, low material usage [
3,
4,
5], and low light level sensitivity, but mainly the variation in color and transparency of the photoanode together with that of the counter electrode [
6,
7], are essential characteristics that could make these cells the ideal candidate for greenhouse application [
8,
9].
The selection of the color of DSSC given by the dye can act as a plant growth regulator or serve as a photo selective covering adsorbed with dye to manipulate the light spectrum entering the greenhouse. Thus, this technology could deliver impressive benefits in contrast to conventional photovoltaic panels (the first and second generations of the solar cells) because of its solar radiation manipulation through the optimum choice of photosensitizer.
Making more efficient photoelectrodes is one of the key factors needed for the increased performance of DSSCs, being responsible for the dye loading capacity and the transfer pathway of electrons. For this, several strategies for the TiO
2 photoanode improvement were proposed, including the overlayer of TiO
2 substrate with CdSe particles for a better electron transfer [
10], the Ag doping of the TiO
2 material leading to a visible increase in
JSC [
11], and a polymer interlayer TiO
2-based DSSC for the prevention of charge recombination and to facilitate the ionic conduction [
12].
Our paper aims to propose and experimentally demonstrate an architecture of DSSC which shall be respected simultaneously: (i) partial absorption of solar UV radiation with a positive impact on plant growth and reduced plant pathogenicity [
13]; (ii) transparency throughout the PAR domain; (iii) water-based electrolytes, ensuring the realization of safe, less expensive, and environmentally friendly solar cells [
14]; and (iv) improvement of the energy performance of DSSC based on UV dyes for full sun and shading conditions. Each of the above requirements has been successfully fulfilled, namely: (i) an affordable commercial dye (DN-F01) and a natural curcumin dye that absorbs UV radiation; (ii) introduction of the water in a low-cost common electrolyte; (iii) design and optimization of the photoactive electrode based on the TiO
2 polymorphs for these dyes and water-based electrolyte; (iv) improving the energy performance of DSSC based on synthetic and natural UV dyes for full sun and shading conditions, without affecting PAR.
Thus, the photoactive TiO
2-based electrode with complex architecture was successfully optimized for UV dyes sensitization and tested using water-based electrolyte, yielding a photovoltaic efficiency 1.45 and 3 times higher than the best efficiency reported for synthetic and curcumin dye so far [
15,
16]. With a maximum of efficiency under 60 mW/cm
2 of illumination, excellent performance even under conditions of not optimal lighting was obtained.
2. Materials and Methods
2.1. Preparation of TiO2 Nanoparticles (TiO2_NP)
An amount of 2.13 mL of titanium (IV) isopropoxide (Sigma-Aldrich Co., Merck KGaA, Darmstadt, Germany) was added at room temperature and continuously stirred into a solution formed from 1 g of Pluronic P123 (Sigma-Aldrich) dissolved in 10 mL of isopropyl alcohol. The prepared solution was stirred for 3 h at 350 rpm, and after left to age for 24 h, until a solid gel was formed. The as obtained gel was then dried at 60 °C for 24 h and further sintered at 450 °C for 1 h, to obtain the white TiO2 particles.
2.2. Preparation of TiO2 Particles for Light Scattering (TiO2_LS)
In the first step, TiO2_LS1 were obtained by dissolving 5 mL of titanium (III) chloride solution (Sigma-Aldrich Co., Merck KGaA, Darmstadt, Germany) in 30 mL of water and stirred for 10 min at room temperature. 6 mL of supersaturated NaCl solution was then added to the previously prepared mixture and stirred for another 10 min. The resulting mixture was transferred to a 50% filled Teflon-lined autoclave and heated at 160 °C for 2 h. After the hydrothermal treatment a white precipitate was obtained, which was washed several times by centrifugation at 8000 rpm with Dl water and ethanol and air-dried at 30 °C for 24 h.
For the formation of nanosheet aggregates, another step of hydrothermal treatment was applied to a mixture consisting of 0.1 g of a previously made TiO2_LS1 precursor, and added into a solution of 5M NaOH, at 140 °C for 24 h. The resulting white sediment was washed by filtration with a 0.1 M HCl solution until an acidic pH of the rinse solution was obtained and further sintered at 400 °C for 30 min, to obtain the TiO2 nanosheet aggregates (TiO2_LS2) for light scattering.
The phase purity and crystal structure of the as-obtained powders were characterized by X-ray diffraction (XRD), using the PANalytical PW 3040/60 X’Pert PRO diffractometer (Malvern Panalytical, Malvern, United Kingdom), with a 1.5418 Å wavelength of the Cu-Kα radiation, in the range 2θ = 10–80°. Surface morphology was analyzed with the FEI Inspect S scanning electron microscope (SEM, FEI Company, Eindhoven, The Netherlands). A Lambda 950 UV-Vis-NIR (PerkinElmer, Waltham, CT, USA) spectrophotometer with a 150 mm integrating sphere was used to collect the diffuse reflectance spectra (DSR) in the wavelength range of 300–800 nm at room temperature, and the optical band gap of the oxide powders was estimated. The FTIR spectra were collected in the 4000–400 cm−1 range, with a JASCO-430 (Jasco Co., Tokyo, Japan) Fourier transform spectrometer and by using the KBr pellet technique.
2.3. Preparation of Curcumin Dye
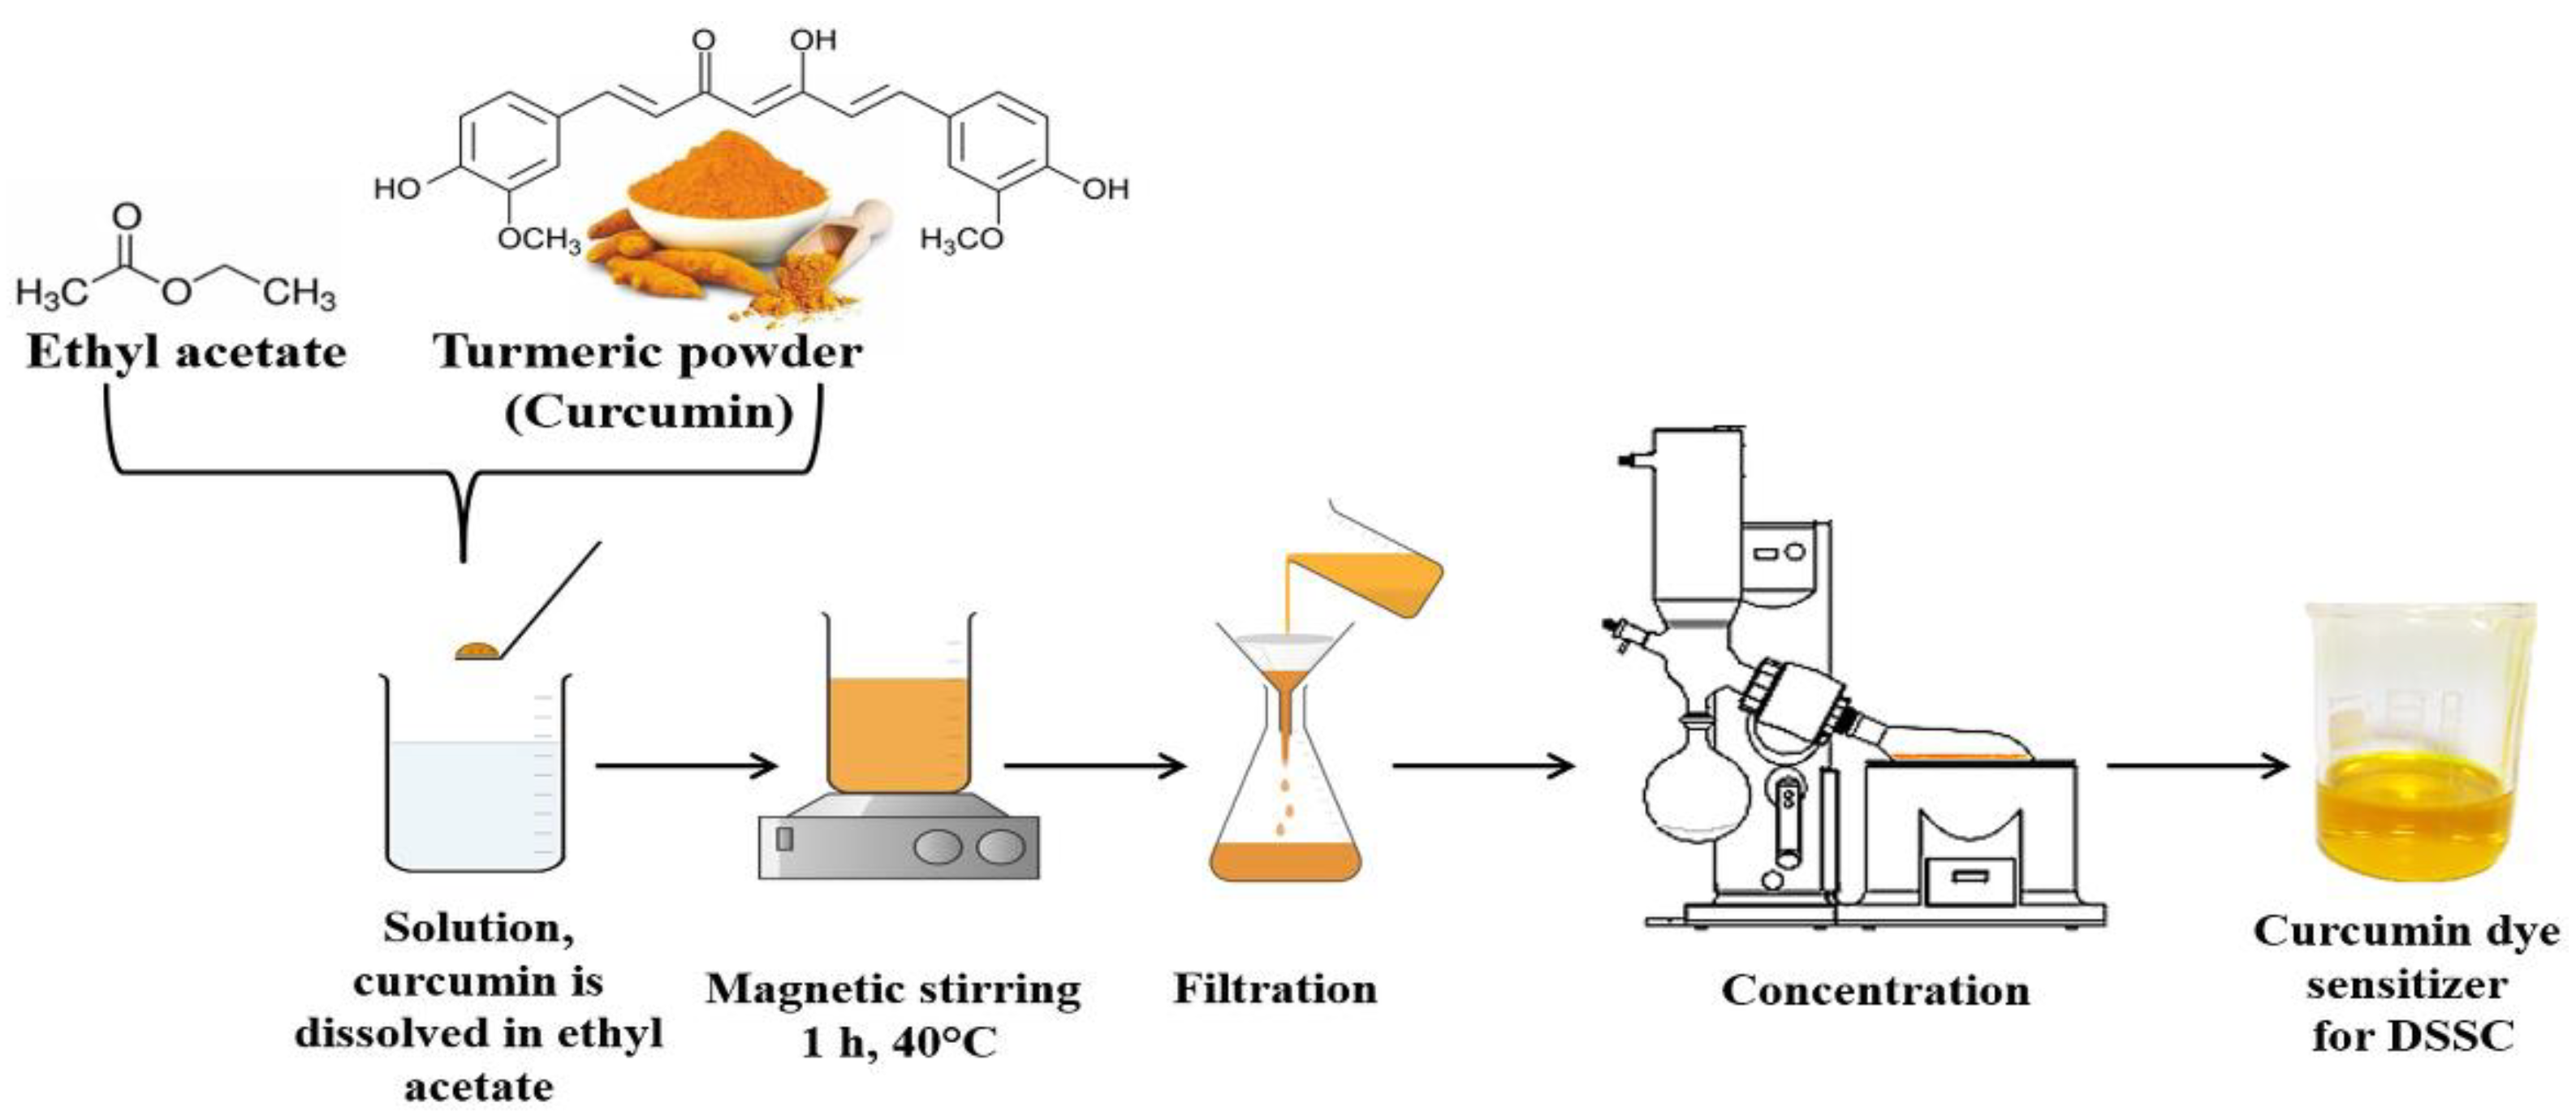
To obtain the curcumin dye, 4 g of turmeric powder was dissolved in 200 mL of ethyl acetate by magnetic stirring for 1 h at 40 °C. The extract was then filtered on filter paper three times to remove any solid particles. The concentration of the curcumin extract was made using a Heidolph Rotary Evaporator-Laborota 4000 (Heidolph Instruments, Schwabach, Germany), at a pressure of 160 mbar and a bath temperature of 40 °C. An amount of 40 mL of the concentrated natural curcumin dye was obtained and used as a photosensitizer in DSSC. The extraction of the natural dye from turmeric powder is described in
Figure 1.
The absorbance spectrum was collected using a Lambda 950 UV-Vis-NIR (PerkinElmer, Waltham, CT, USA) spectrophotometer in the wavelength range of 250–800 nm at ambient temperature.
2.4. Fabrication of DSSCs
TiO
2_NP and TiO
2_LS pastes were prepared as in our previous study [
17] using ethyl cellulose, α-terpineol, glacial acetic acid, and Dl water as paste constituents.
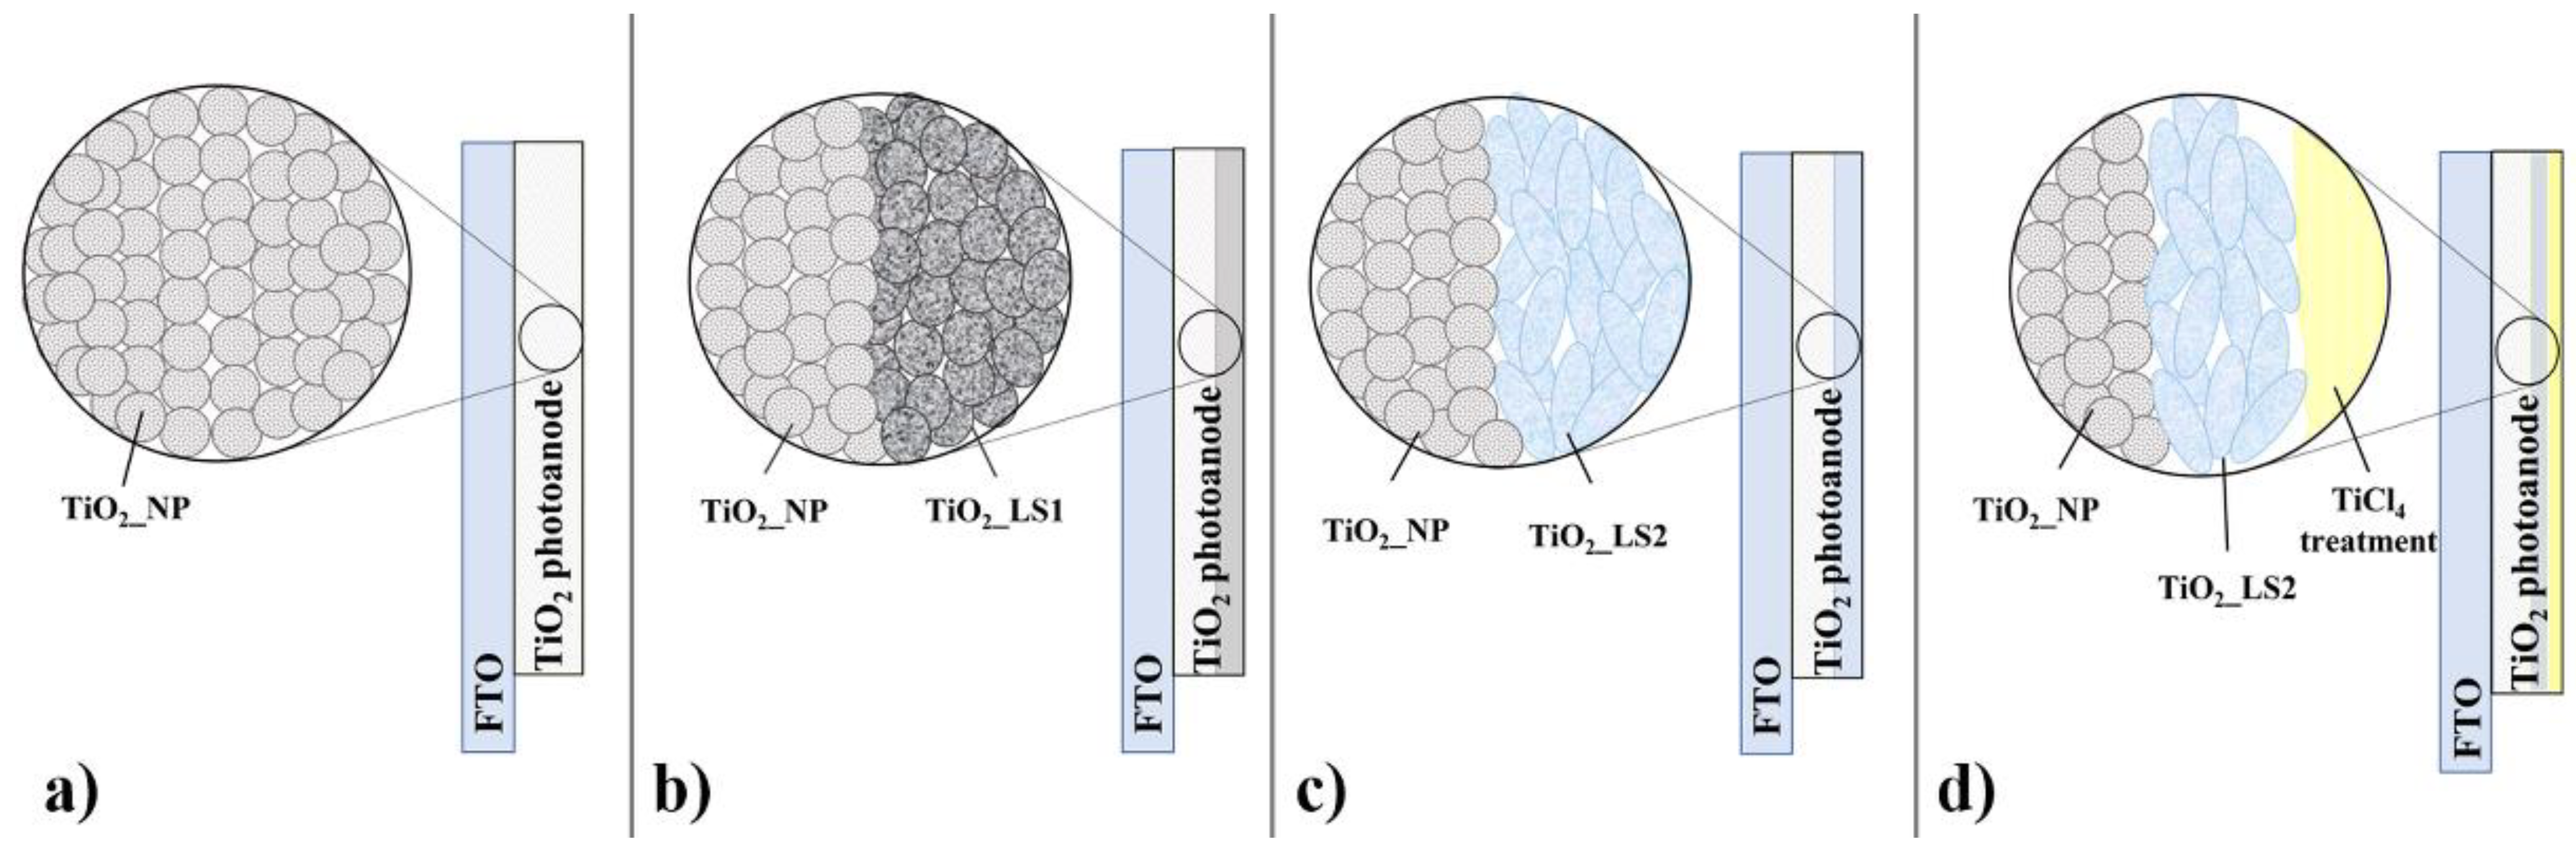
For the optimized photoanode realization, multiple layers of paste were deposited using the doctor blade technique on the previously cleaned and UV-Ozone-treated FTO glass substrate (Sigma Aldrich, with a surface resistivity of ~13 Ω sq−1). First, a TiO2_NP layer was deposited, followed by 2 layers of TiO2_LS (TiO2_LS1 or TiO2_LS2), after each deposited layer, a sintering process was applied at a temperature of 500 °C for 1 h with a 1 °C min−1 heating rate. Finally, the double-layered paste configuration was immersed in a 40 mM TiCl4 solution at 70 °C for 1 h and sintered at 450 °C for 1 h with a 1 °C min−1 heating rate.
The optimized configuration was determined by testing different photoanodes prepared with different functionalized layers. Photoanode 1 (PhA 1) consists of a single layer of TiO
2_NP, photoanode 2 (PhA 2) consists of TiO
2_NP and TiO
2_LS1 layers, photoanode 3 (PhA 3) consists of TiO
2_NP and TiO
2_LS2 layers, and photoanode 4 (PhA 4) consists of a TiO
2_NP layer, a TiO
2_LS2 layer, and TiCl
4 treatment. For a better understanding of the layer configuration, a schematic representation is presented in
Figure 2.
Two dyes were used for the sensitization of the photoanodes, a synthetic dye consisting of a 0.3 mM solution of DN-F01 (Dyenamo Yellow) in absolute ethanol (5 h immersion time) and a natural curcumin extract (1 h immersion time). The obtained sensitized photoanodes were fixed together with the counter electrodes produced by treating a H2PtCl6 solution at 400 °C, using a Meltonix 1170-60 thick spacer.
The electrolyte used and injected into the space between the electrodes consists of a solution of 0.6M 1-butyl-3-methyl-immidazolium iodide, 0.03 M I2, 0.10 M guanidinium thiocyanate and 0.5 M 4-tertbutylpyridine in acetonitrile/valeronitrile (85:15, v/v), hereinafter referred to as E. The water effect on the DSSC performance was also studied by replacing 10% of the solvent medium in the E electrolyte with water, named E10%.
The DSSCs produced based on the photoanodes will henceforth be called DSSC 1, DSSC 2, DSSC 3, and DSSC 4, respectively.
For determining the photovoltaic performances of the DSSCs, the photocurrent density vs. photovoltage curves were recorded on a Keithley 2450 source measure unit, keeping a scan rate equal to 1 mV and under different illumination conditions (20–100 mW cm−2). Electrochemical impedance spectroscopy (EIS) measurements were performed using a Voltalab potentiostat model PGZ 402, with VoltaMaster 4 software (version 7.09), under different illumination conditions and a frequency range from 0.001 to 10 kHz, using 10 mV of the magnitude for the modulation signal. The applied potentials were taken as the VOC values determined for the DSSC4 configuration tested with and without water content in the electrolyte, at two illumination intensities (60 and 100 mW cm−2), and by using both dyes’ sensitization (synthetic and natural).
3. Results
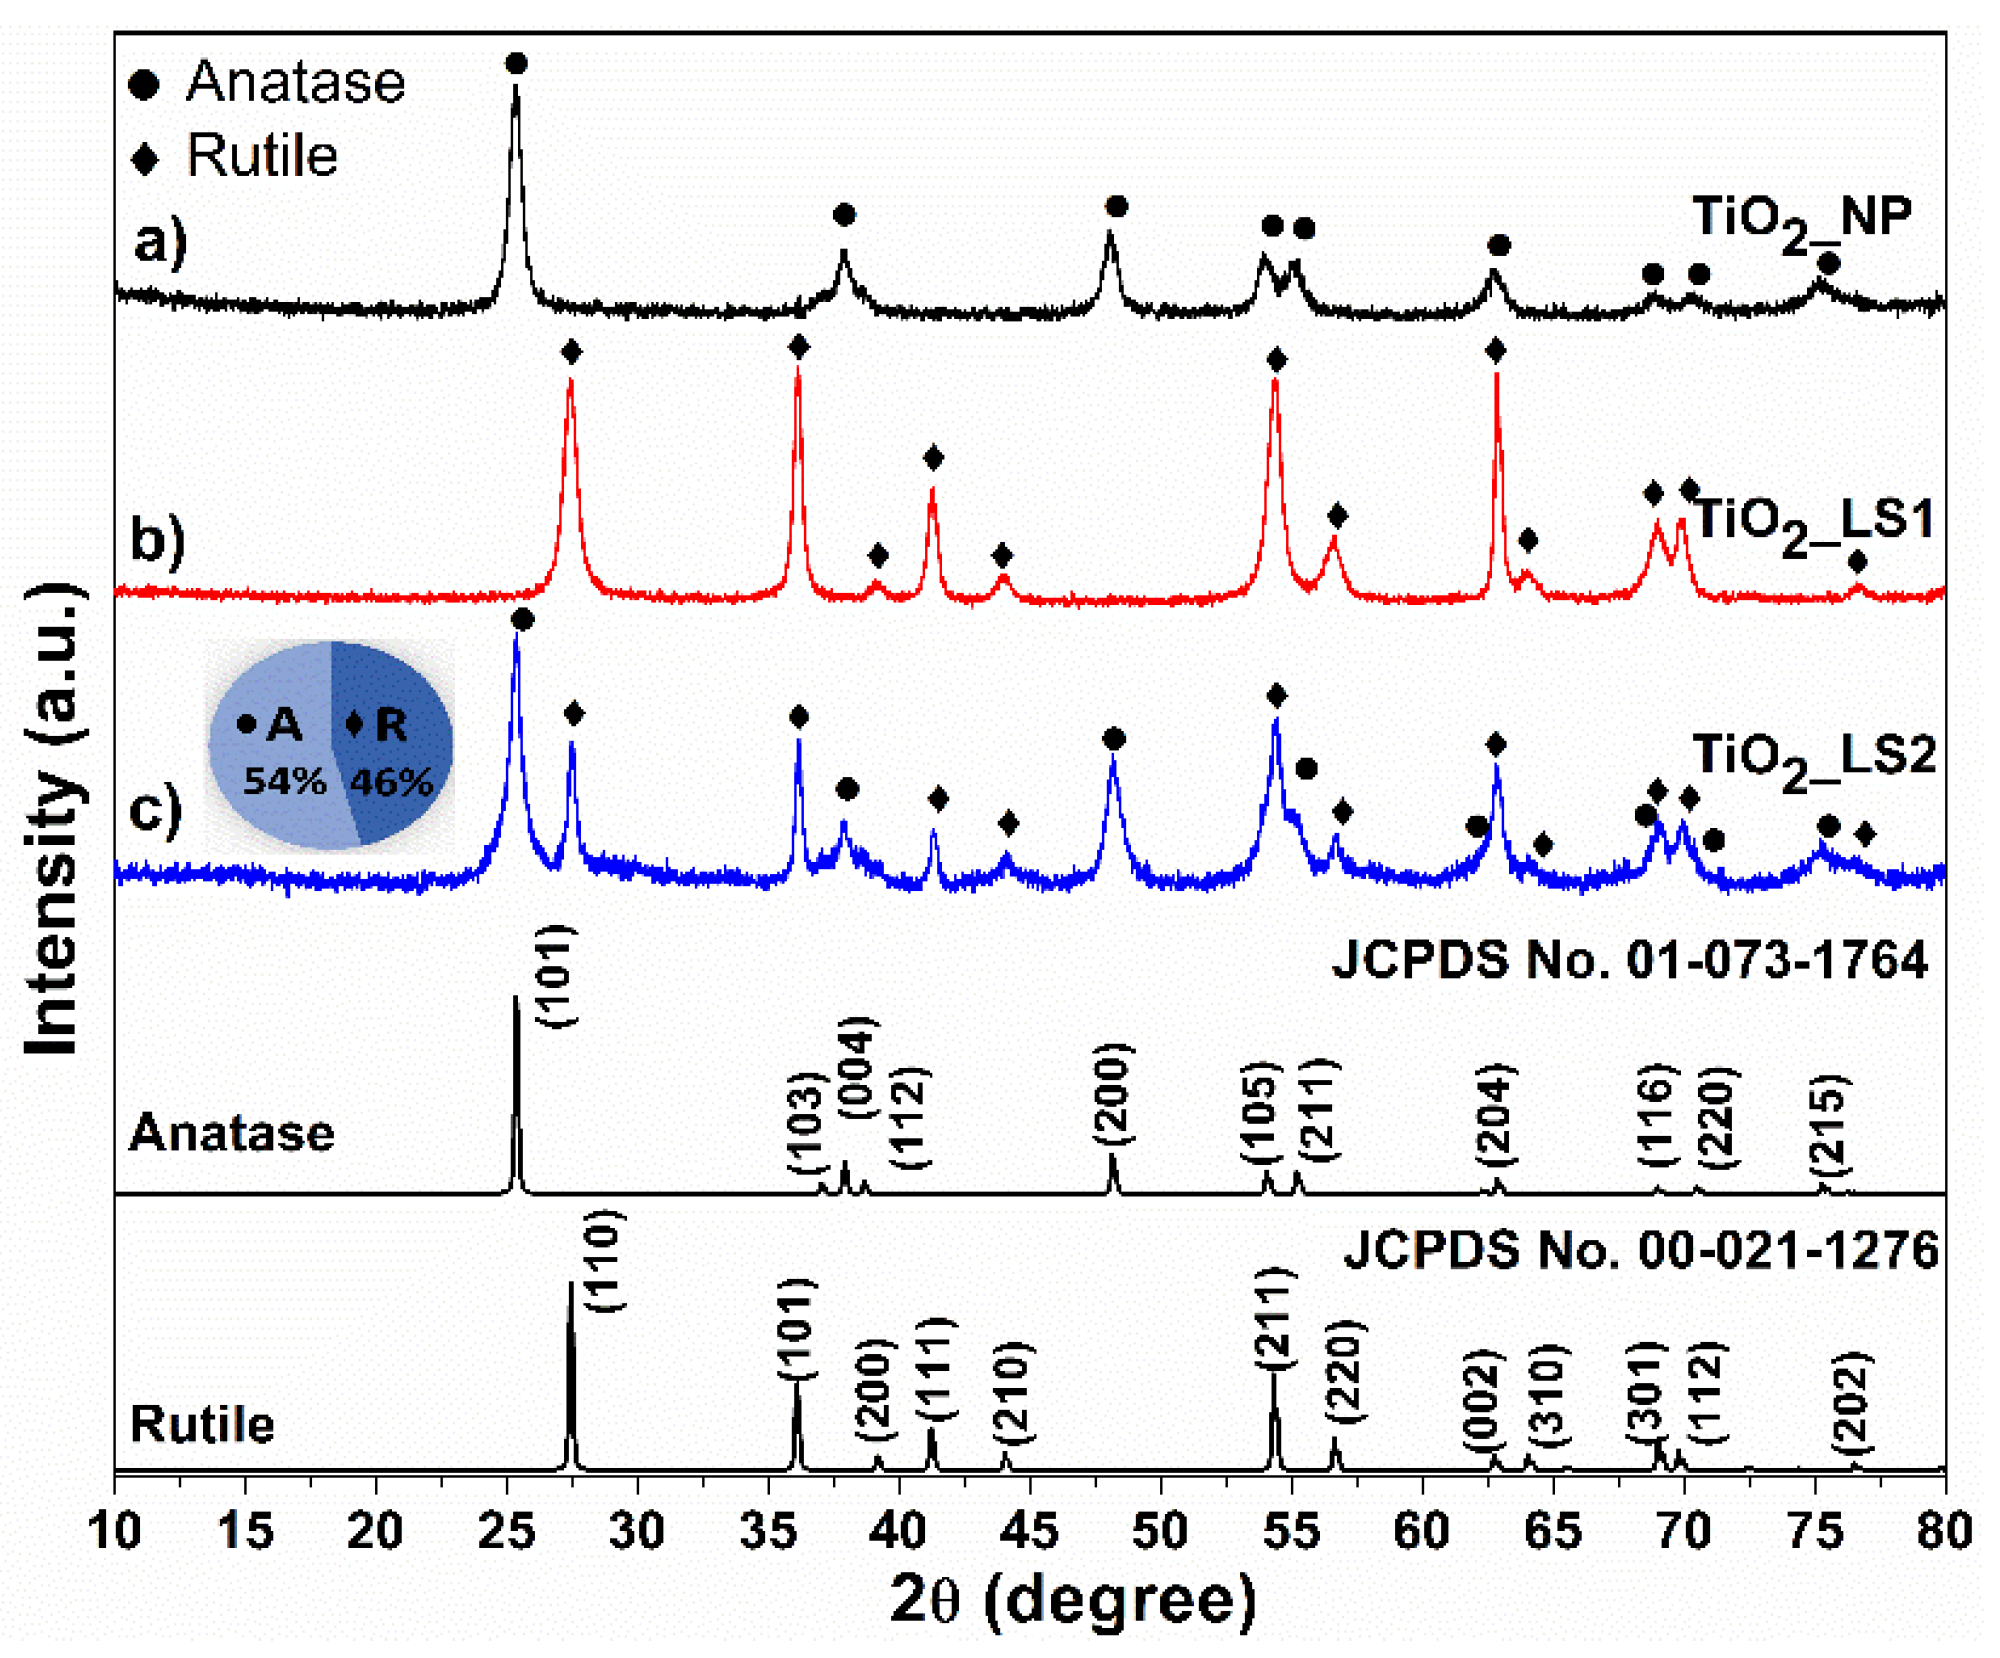
The XRD pattern of the TiO
2 nanoparticles obtained by a simple sol–gel procedure is shown in
Figure 3a. All diffraction peaks are indexed as TiO
2 crystallized in anatase form, having a tetragonal structure (space group: I41/amd; JCPDS No. 01-073-1764). No other TiO
2 crystalline phases such as rutile or brookite can be observed. The XRD patterns of the obtained microparticles used as scattering layers in the DSSC configurations are presented in
Figure 3b,c. In the case of the TiO
2_LS1 sample, a crystallization in rutile form with the tetragonal structure of the TiO
2 can be observed (space group: P42/mnm; JCPDS No. 00-021-1276). Furthermore, a mixture of polymorphic phases of ~46% rutile and ~54% anatase was obtained in the TiO
2_LS2 sample.
The crystallite sizes of the obtained TiO
2 powders were calculated using the Scherrer formula [
18]:
where
k is a constant (∼1),
B is the full width at half maximum (FWHM),
λ the wavelength of the
X-ray and
θ is the diffraction angle. The obtained crystallite sizes were of ~15 nm for the TiO
2_NP sample, of ~25 nm for the TiO
2_LS1 sample, and of ~33 nm and ~23 nm for the anatase and rutile phases of the TiO
2_LS2 sample, respectively.
Figure 4 presents the SEM images of the two architectures proposed for the light scattering effect, TiO
2_LS1 showing a solid microsphere structure, and a dendritic structure containing agglomerated nanorods was obtained for the TiO
2_LS2 sample.
The FT-IR spectra of the samples measured in the range of 4000–400 cm
−1 are presented in
Figure 5. The first two peaks observed at 3438 and 1630 cm
−1 correspond to the stretching vibrations of the hydroxyl group O-H of interlayer water molecules and the bending mode of water molecules δ(H
2O), respectively [
19]. The broad and intense band between 881 cm
−1 and 408 cm
−1 with maximum at 481 cm
−1 assigned to Ti-O and Ti-O-Ti stretching and bending vibrations is characteristic of the pure anatase polymorph of TiO
2 [
20]. In case of TiO
2_LS1, the intense band in the range of 881–452 cm
−1 with a maximum at 620 cm
−1 is attributed to the Ti-O vibration of pure rutile [
21]. In accordance with the XRD pattern of TiO
2_LS2, the band widening is extended in the range 1025–408 cm
−1 with two specific maxima for both anatase and rutile polymorphs. The high NaOH molarity used in TiO
2_LS2 preparation caused the formation of surface hydroperoxo species, TiOOH, that exhibits an absorption band at 970 cm
−1 due to vibration modes [
22].
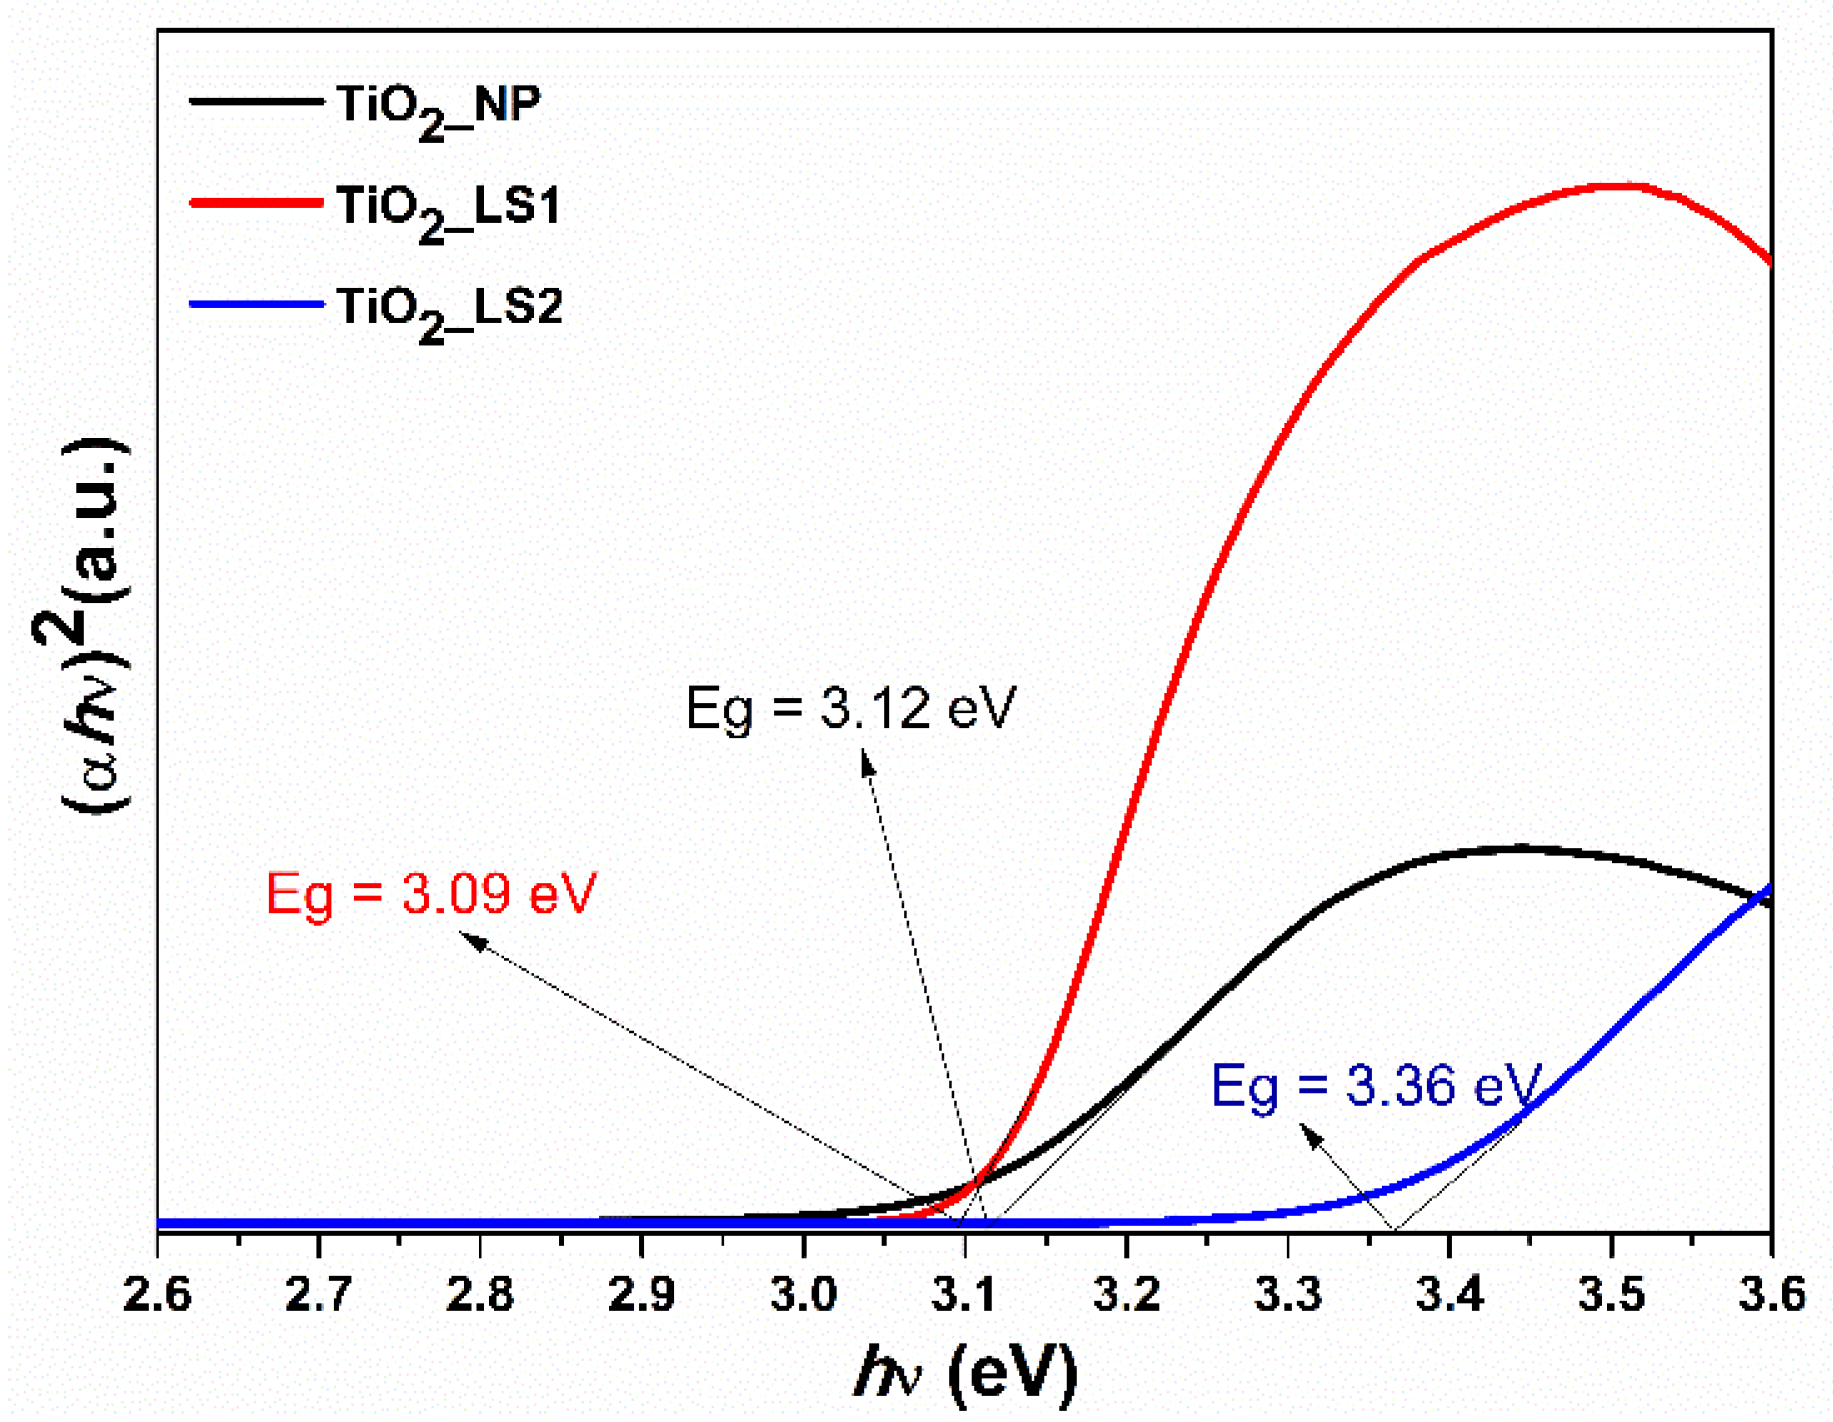
From the diffuse reflectance spectra, presented in
Figure 6, the optical direct band gaps of the TiO
2 photoelectrode materials were estimated by using the Tauc plot [
23], and intercepting the extrapolated linear fit for the plotted experimental data of (αhν)
2 versus incident photon energy (hν) near the absorption edge. The obtained values of 3.12 eV and 3.09 eV for TiO
2_NP and TiO
2_LS1, respectively, are comparable to the data reported in the literature for anatase and rutile polymorphs of TiO
2 structures [
24]. The value of 3.36 eV obtained for the TiO
2_LS2 sample is much higher than previously reported values of mixed anatase-rutile TiO
2 nanoparticles [
25]. In general, the value of Eg of a mixed TiO
2 nanoparticles with rutile and anatase structures decreases continuously with the increase in rutile content. In the case of TiO
2_LS2, a significant increase in the band gap was highlighted and could be correlated with the presence of the surface titanium hydroperoxo species revelated by FTIR spectra.
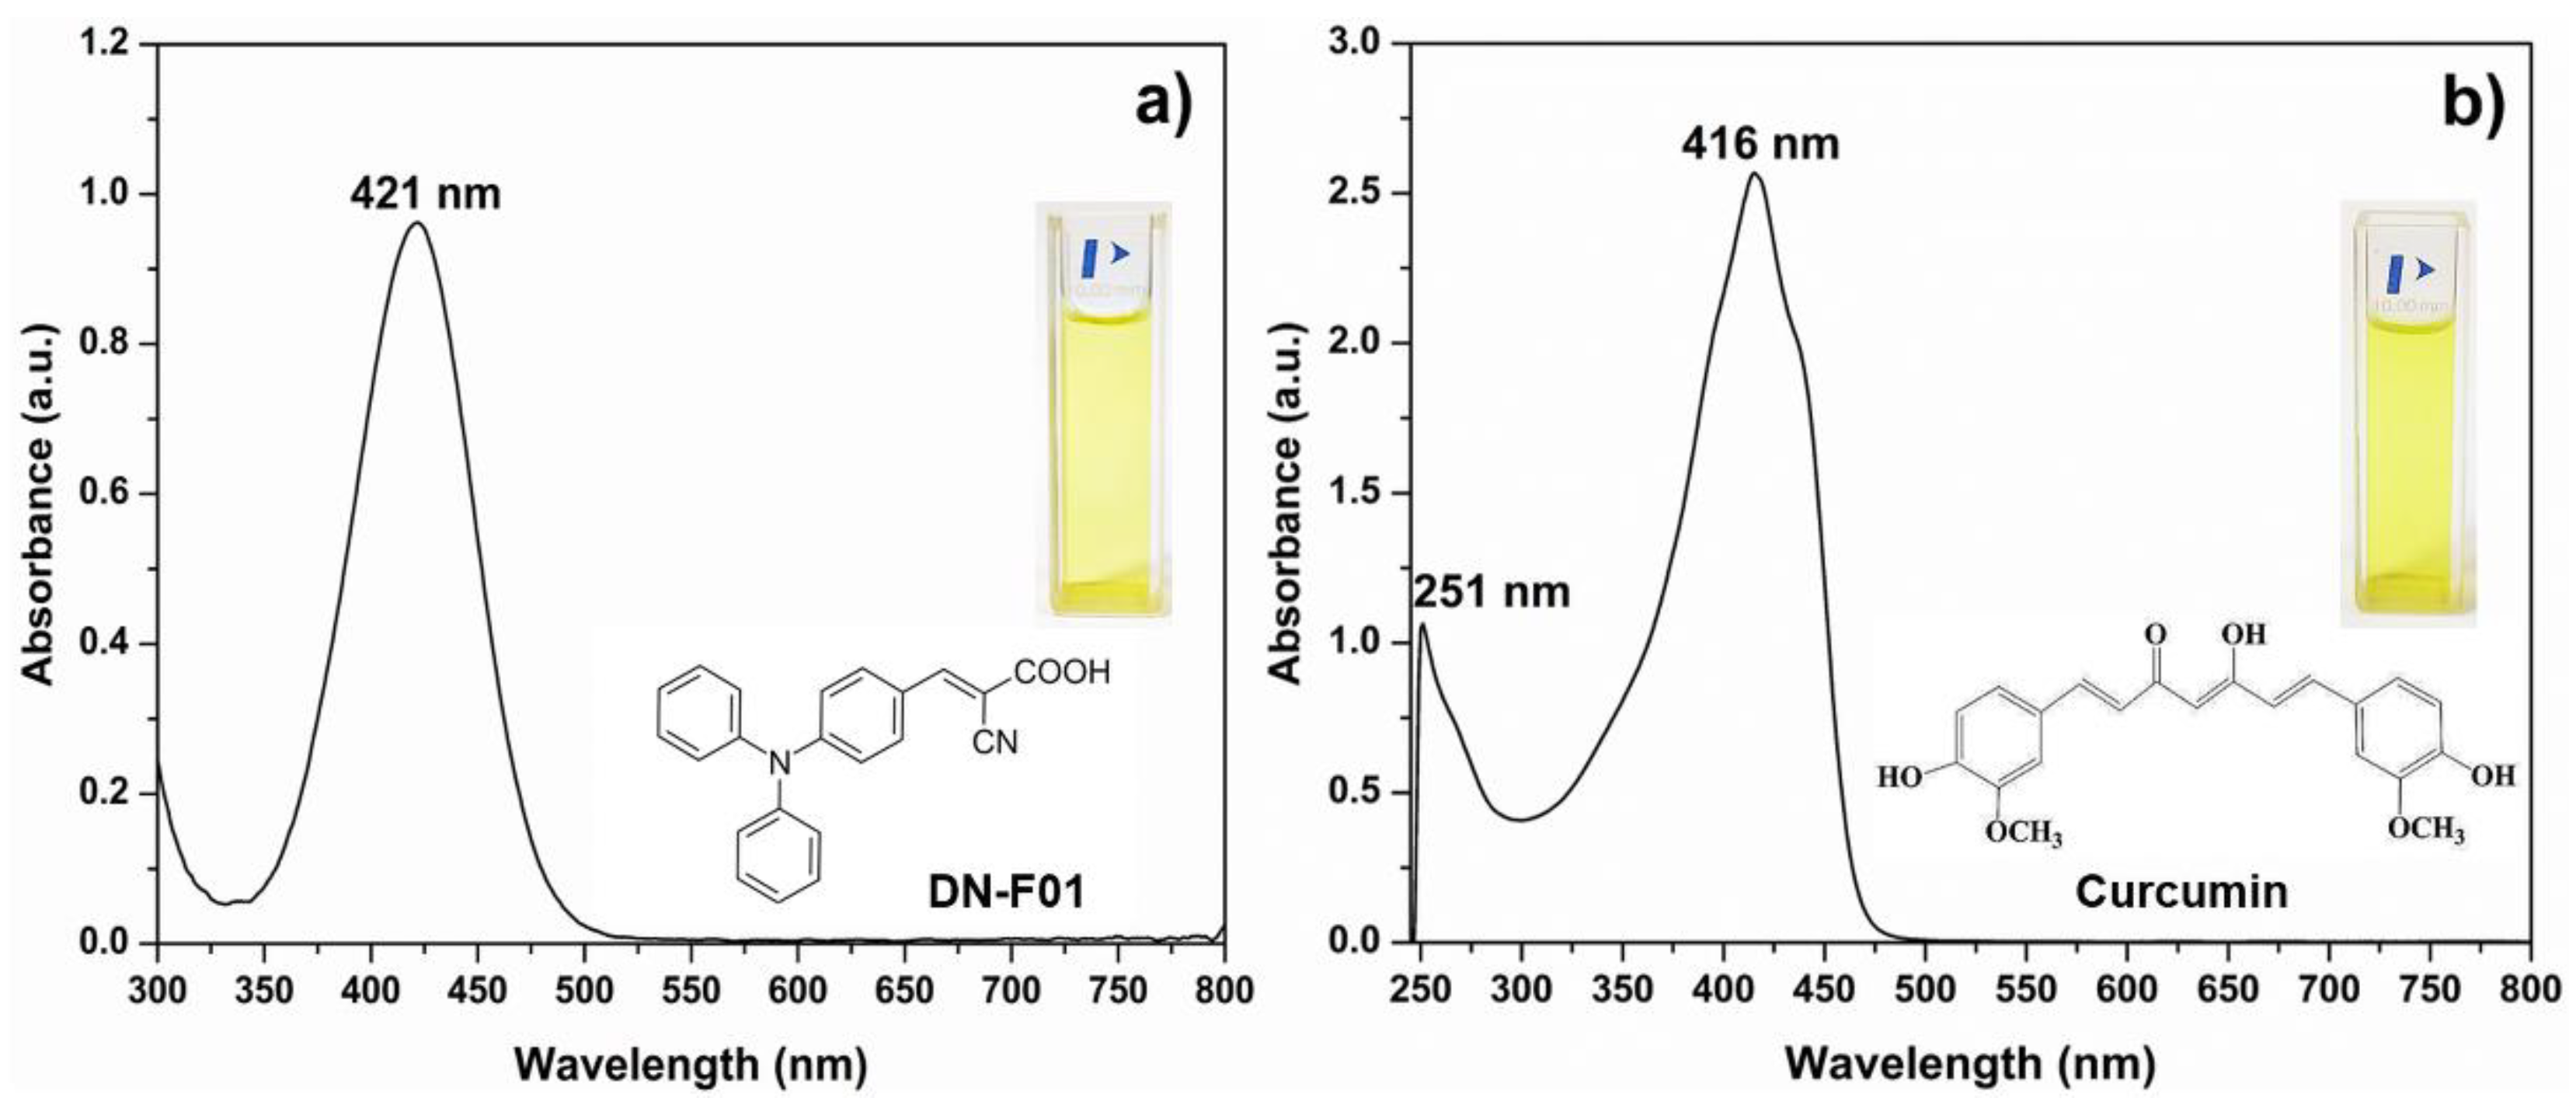
The UV-Vis spectrum of curcumin in ethyl acetate solution showed a broad absorption at around 300–450 nm with a maximum absorption band at a wavelength of 416 nm attributed to the electronic transitions n → π *, and a weak absorption band at 251 nm to the electronic transitions π → π *, respectively. The groups responsible for the absorption of the dye are the carbonyl groups in the structure of curcumin and the accumulation of groups grafted on the aromatic nucleus producing a bathochrome shift. The DN-F01 dye is similarly characterized by a broad absorption at around 350–480 nm with a maximum absorption band at a wavelength of 421 nm (
Figure 7).
The successful implementation of DSSC in an energetically independent greenhouse is conditioned by four main requirements, namely eco-friendly materials, transparency in the entire PAR domain, high UV absorption, good photovoltaic efficiency, and sustainability throughout the year. To simultaneously fulfil the above-mentioned objectives, four different architectures of TiO2 photoactive electrodes (PhA 1, PhA 2, PhA 3, and PhA 4) using synthetic and natural dyes, and water-based electrolytes were designed and tested.
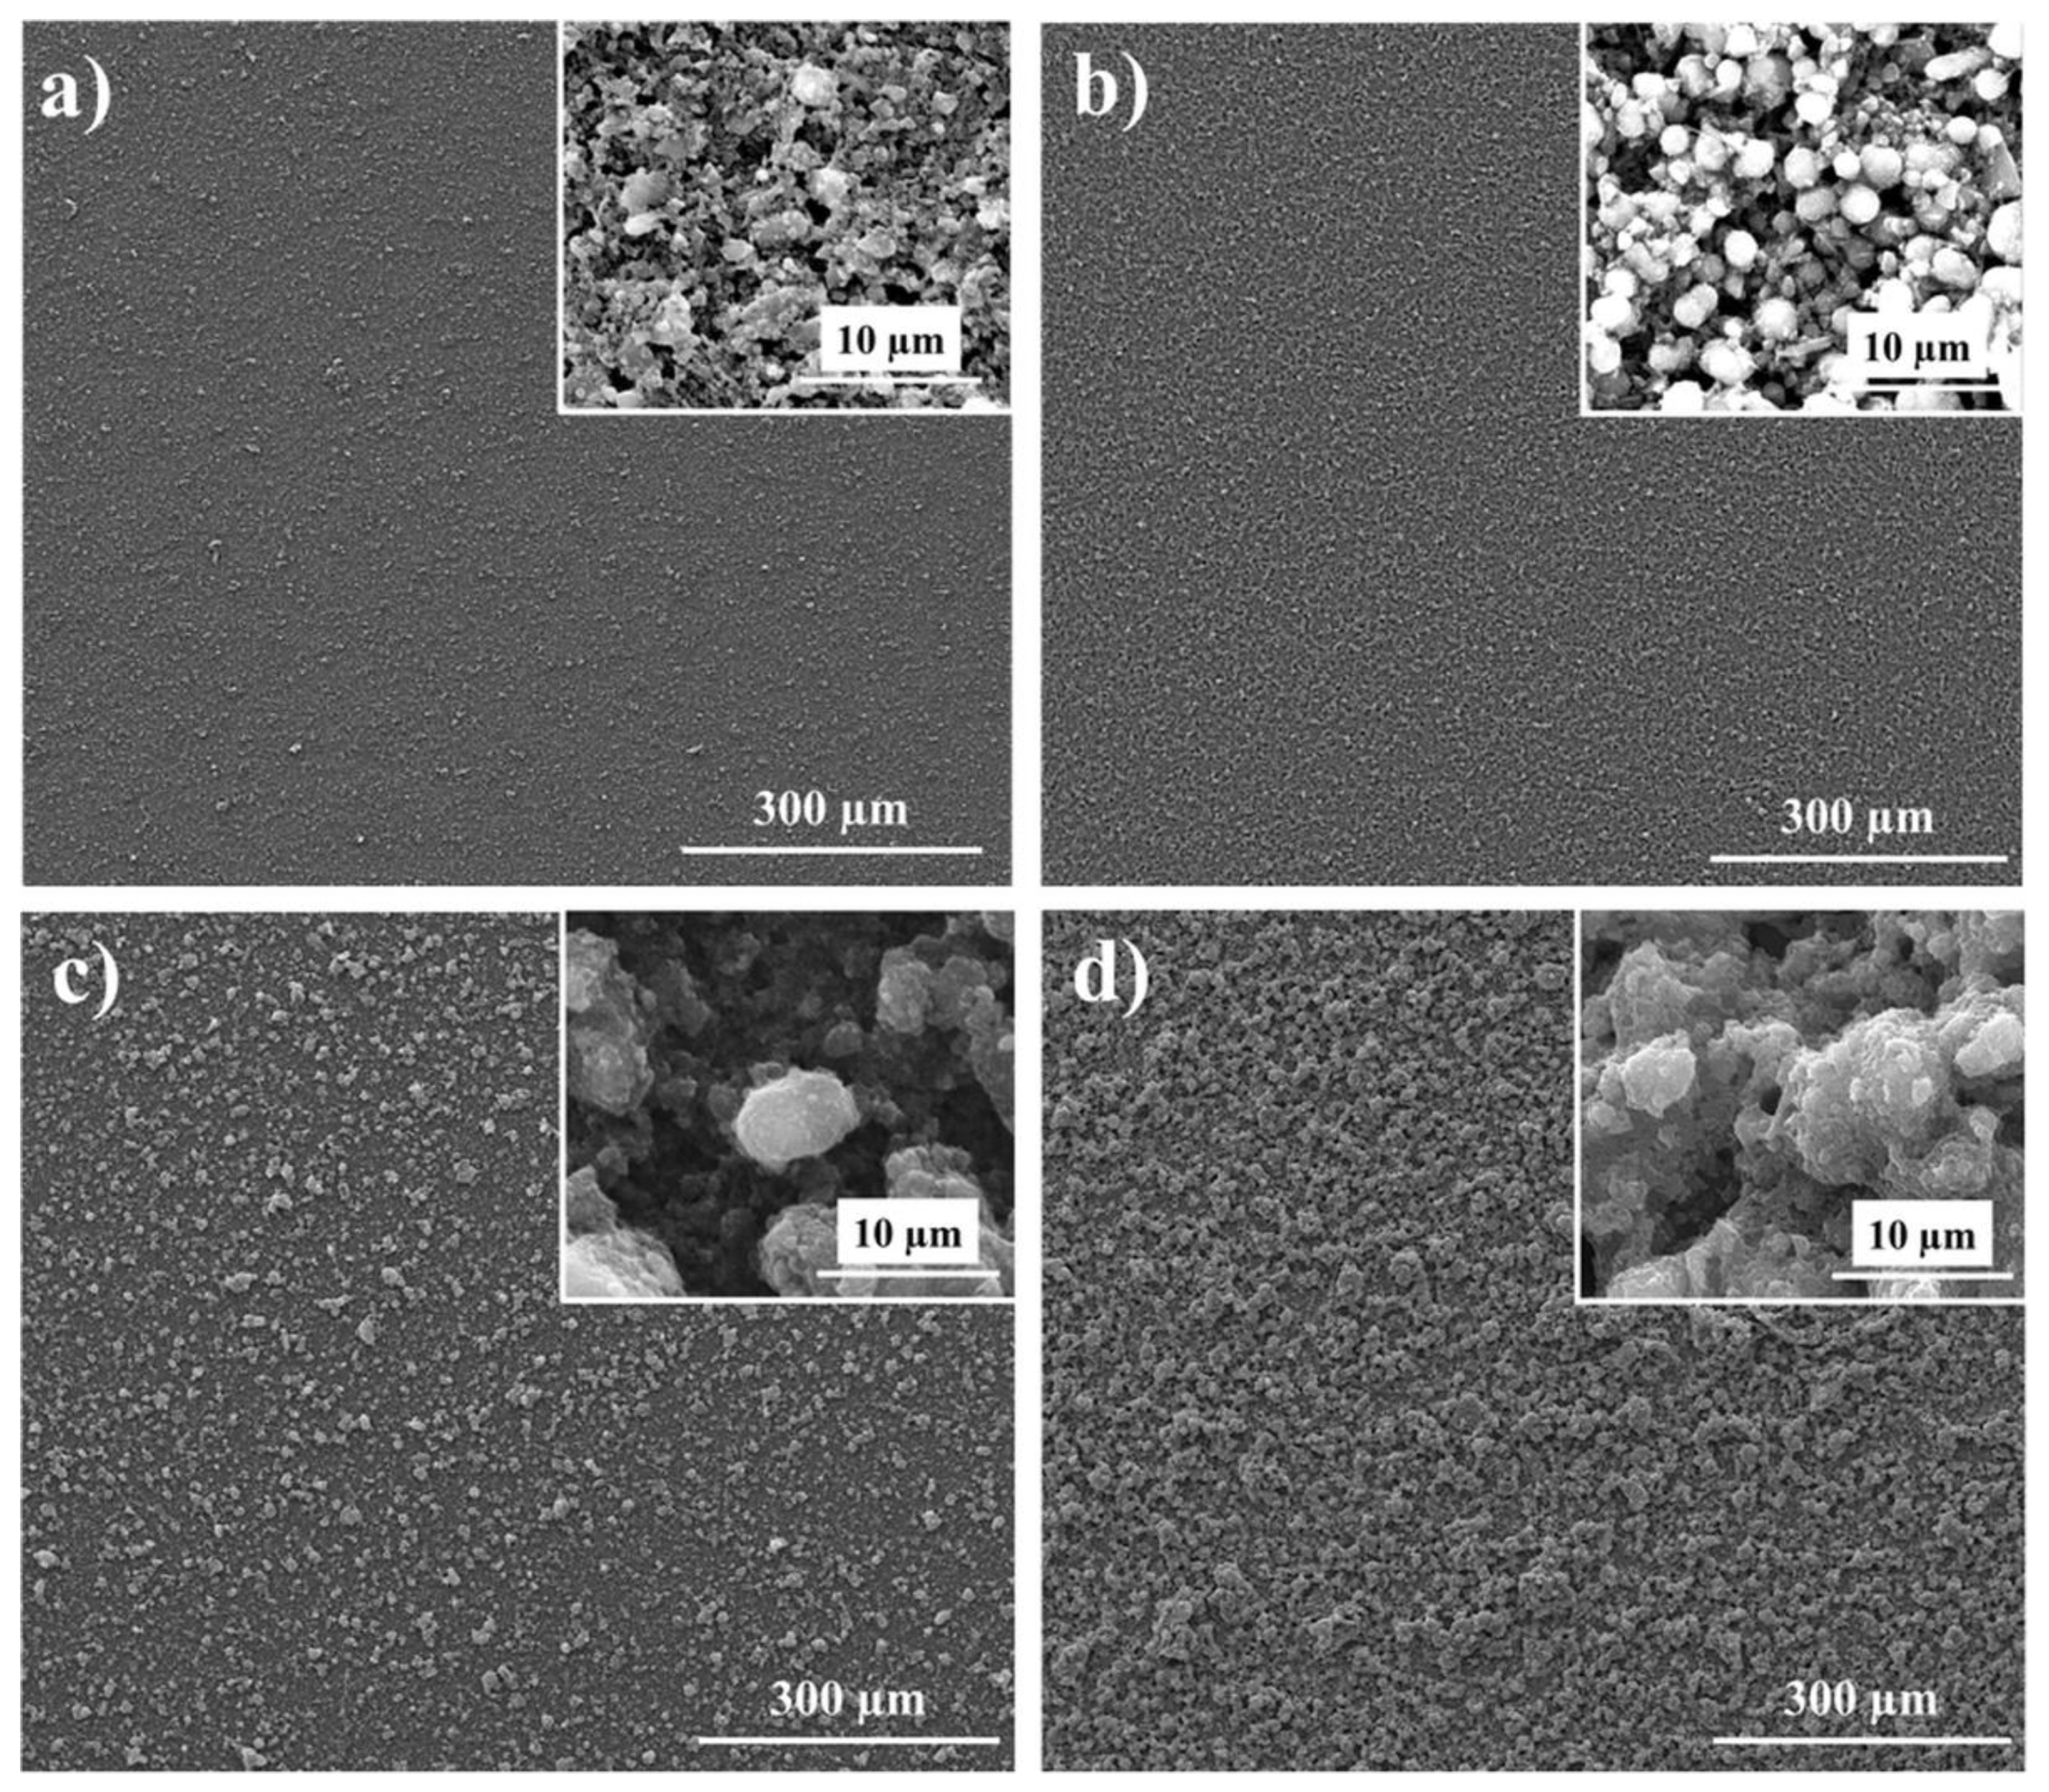
From the SEM images presented in
Figure 8a–d, the uniformity and surface morphology of the as-deposited TiO
2 thin films can be observed. As can be seen, the particle morphologies were preserved during the paste formation, deposition, and thermal treatment of photoanodes.
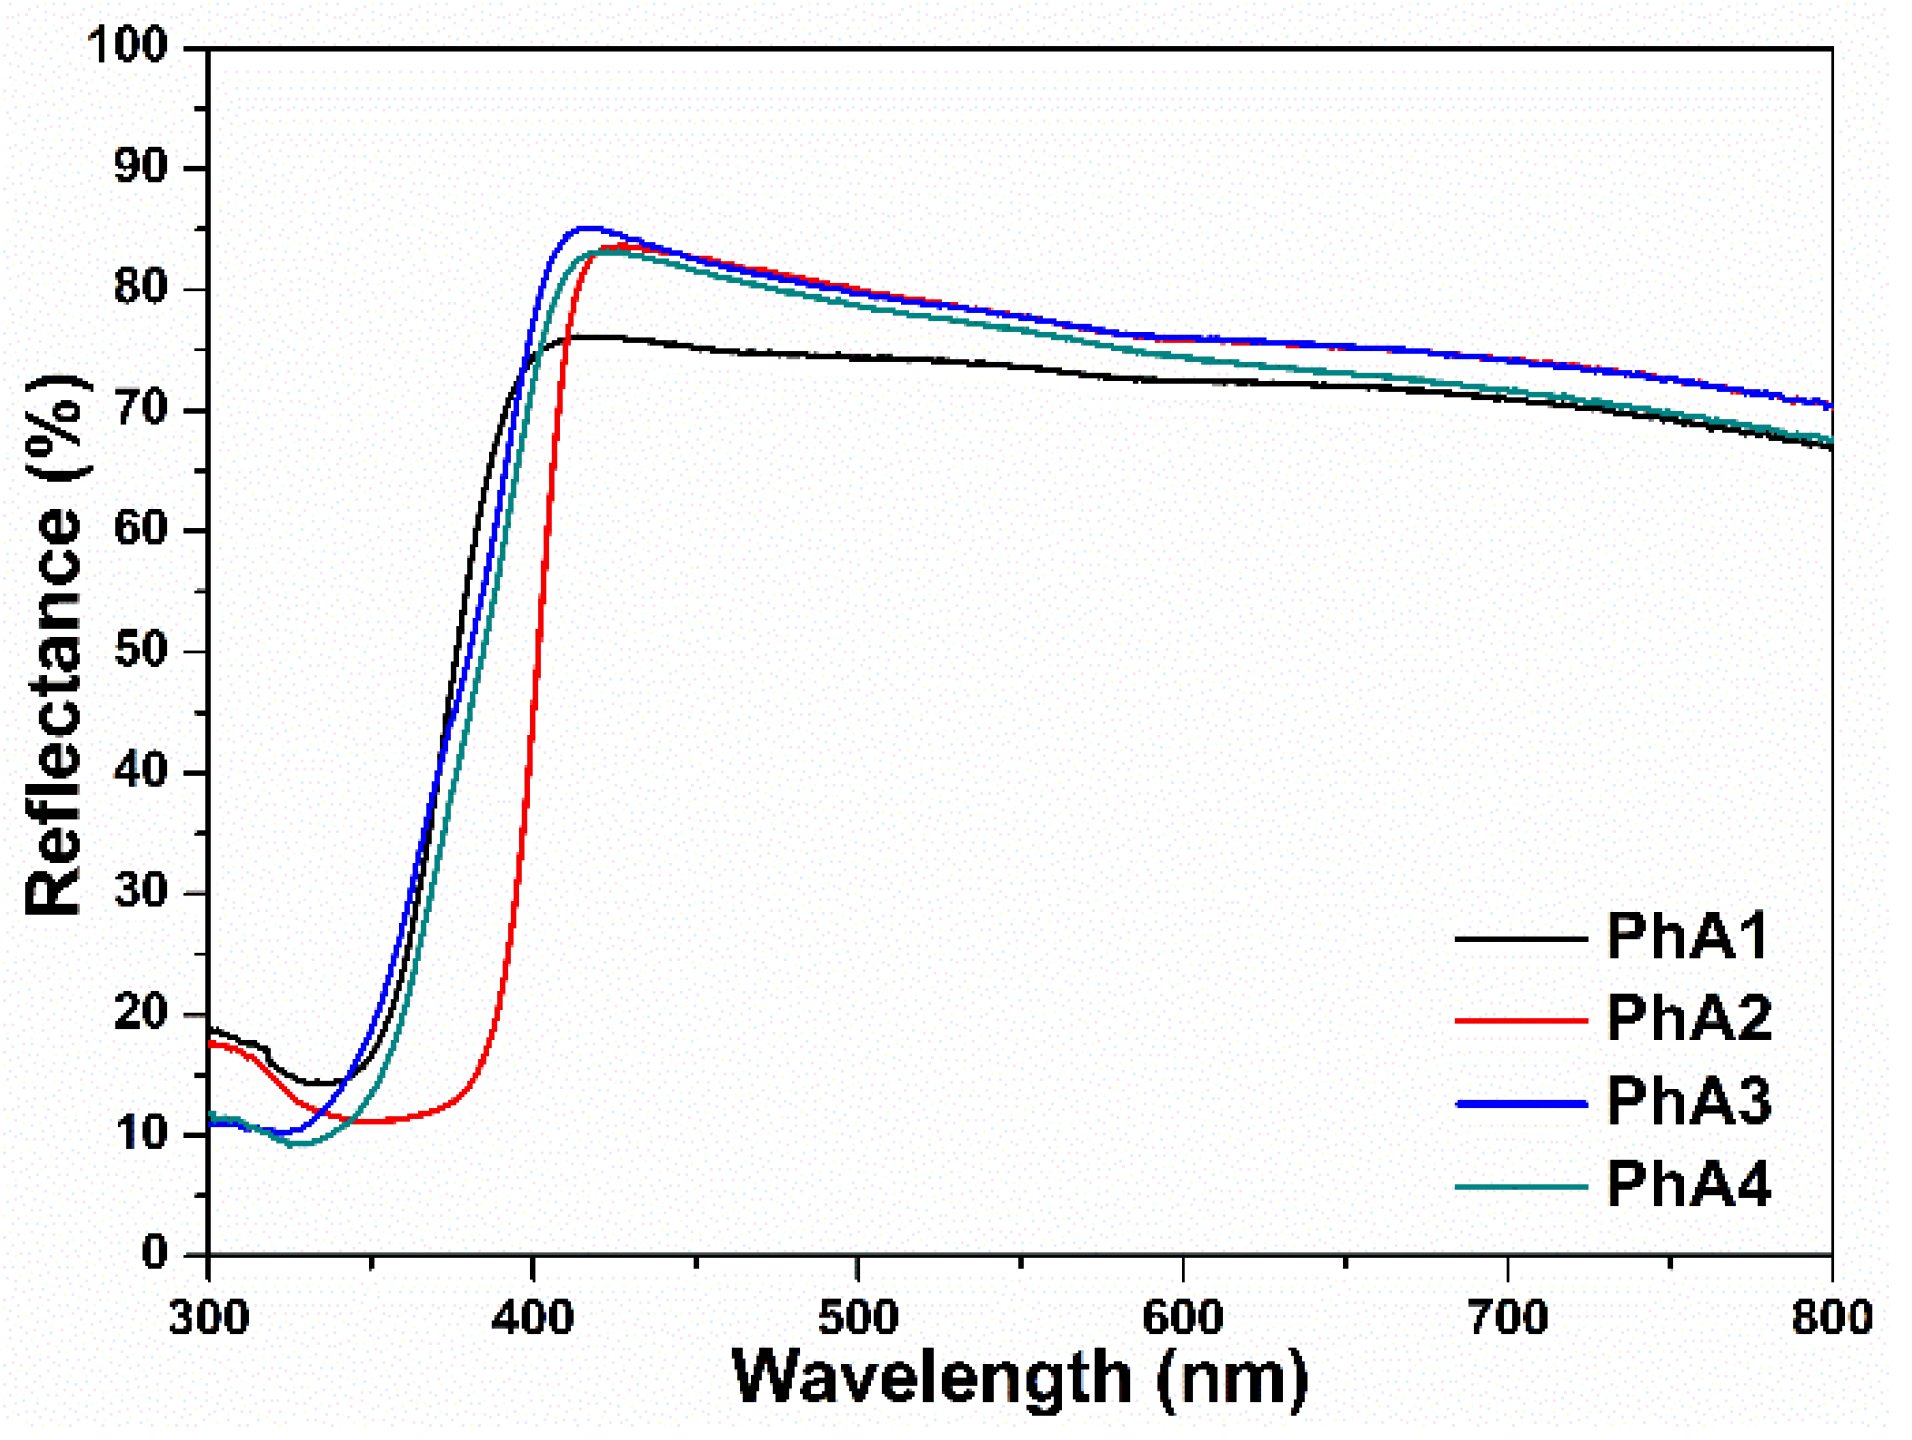
To investigate the light scattering effect of the TiO
2 particles synthesized for this purpose, the reflectance spectra of all photoelectrode configurations were studied (
Figure 9). A higher reflectance for the PhA 2, PhA 3, and PhA 4 photoelectrodes in the wavelength range of 400–800 can be observed compared with that of the TiO
2_NP particle film (PhA 1), confirming that spherical TiO
2 aggregate films have a higher light scattering capacity, due to their larger diameters, which are comparable to the wavelengths of visible light. The distance traveled by the incident light within the photoelectrode is significantly extended by the better scattering effect, with this increasing the photon harvesting by the dye molecules and leading to a relatively higher photocurrent [
26].
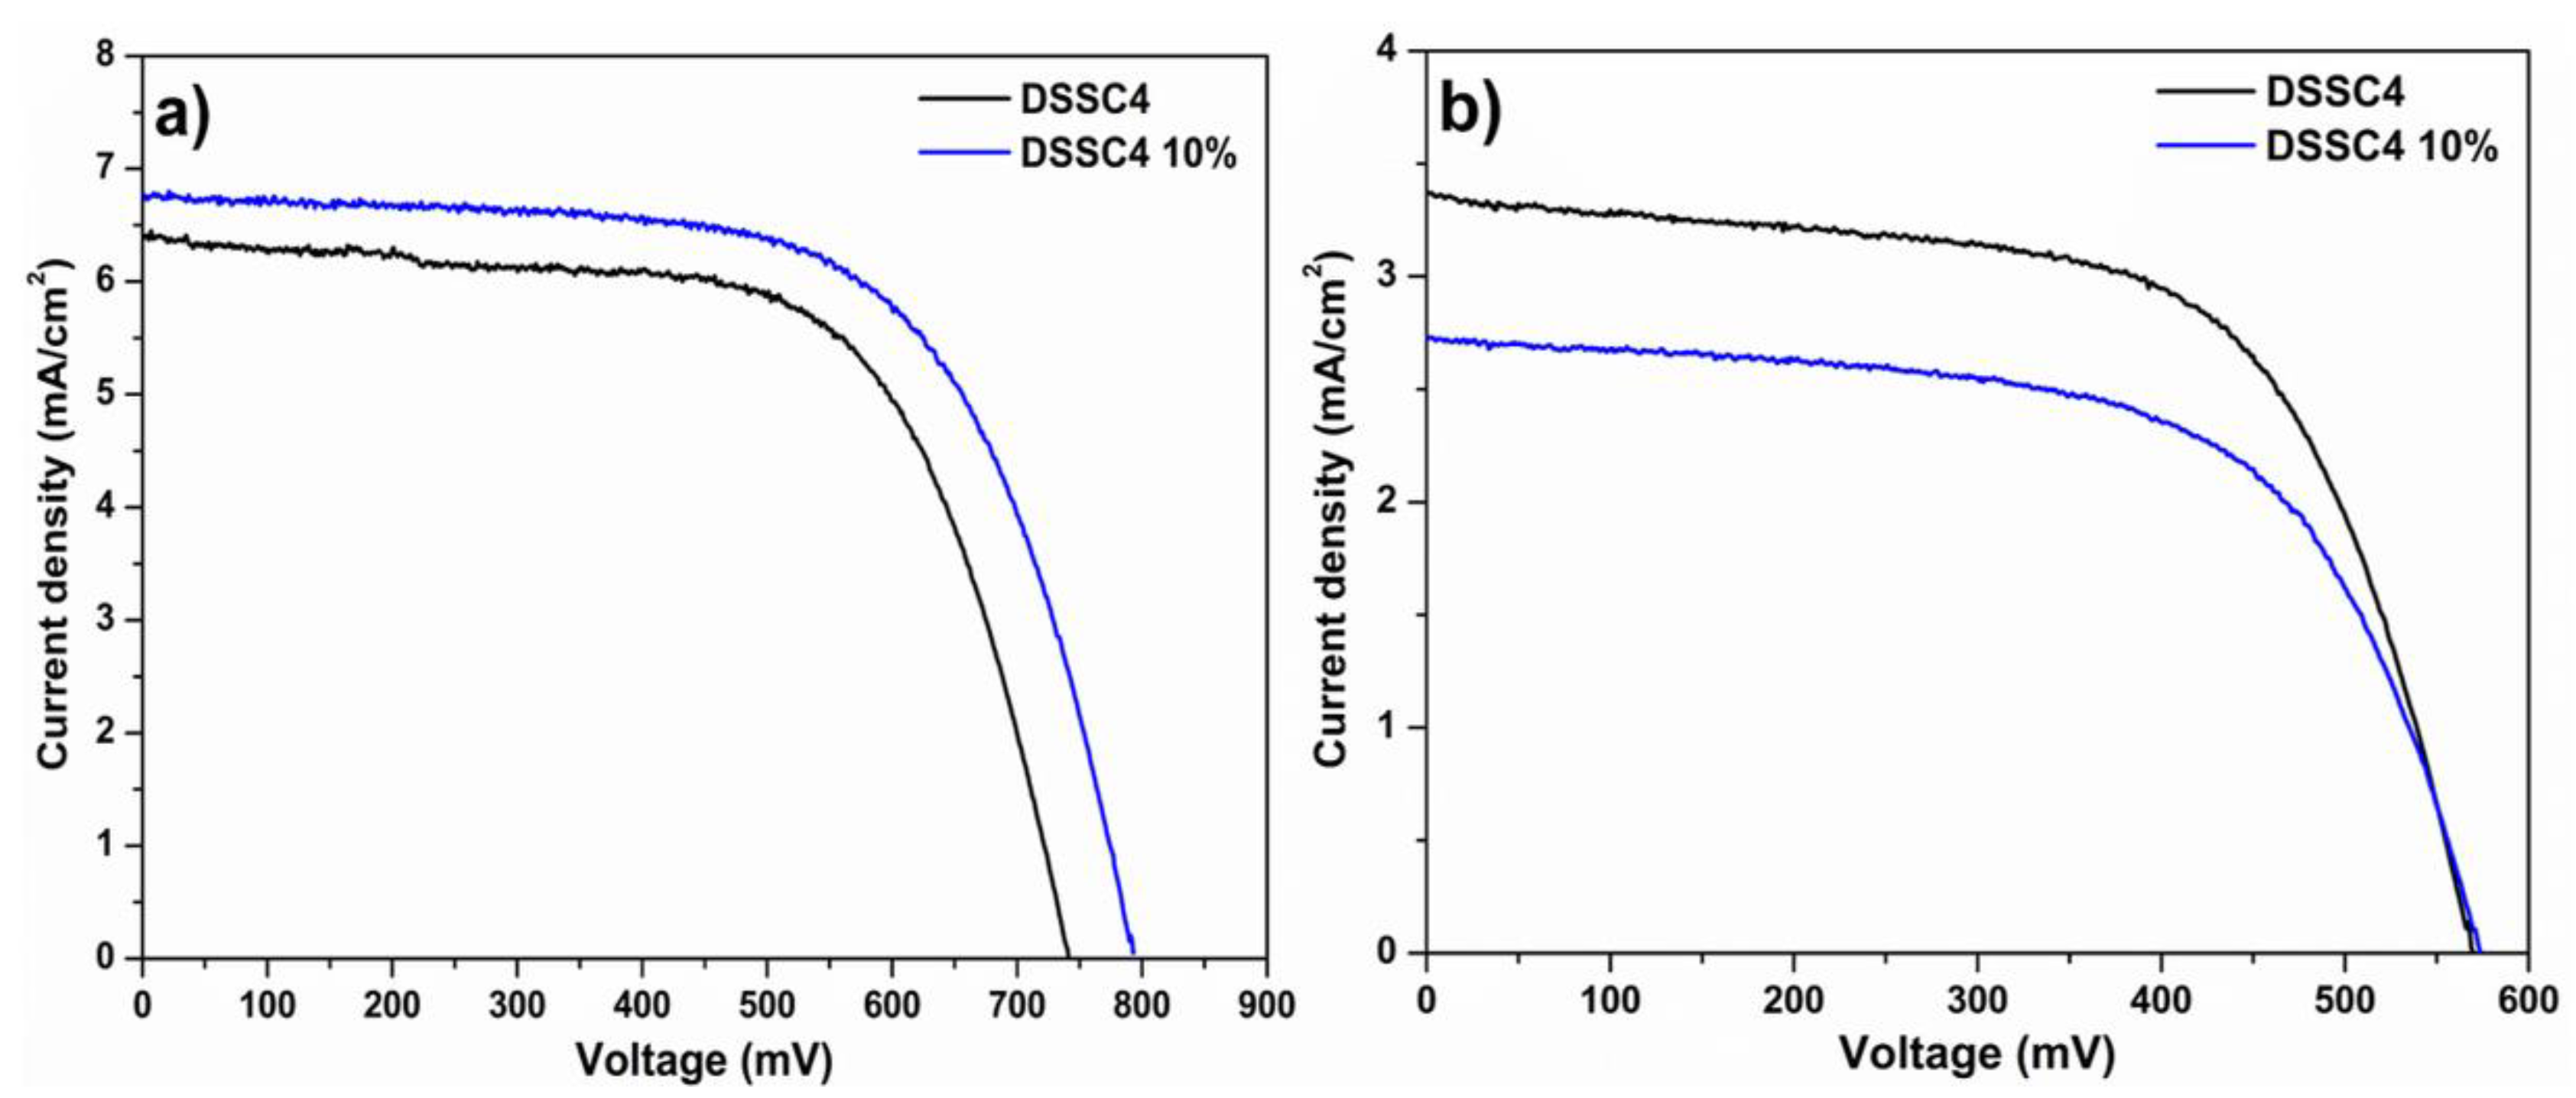
The J-V characteristics of the DSSCs using E and E10% electrolytes are presented in
Figure 10 and the detailed photovoltaic parameters (
JSC,
VOC,
FF, and
η) for both dyes are summarized in
Table 1. In the case of the synthetic dye and E electrolyte, a significant increase in the efficiency is correlated with the addition of the LS2 layer (50% more), and together with TiCl
4 treatment, 136% is achieved relative to DSSC1. The microsphere rutile structure of TiO
2_LS1 had a minor effect on the photovoltaic efficiency caused by the higher light-scattering capacity compared with TiO
2_NP. A positive effect of TiO
2_LS2 on the photovoltaic parameters is provided by the dendritic morphology presented in the mixture of rutile and anatase polymorphic phases along with the surface hydroperoxo species, TiOOH. The increase in
JSC (1.5 times) is directly determined by both the rutile phase of the TiO
2_LS2 microdendritic structure and the high refractive index (n
rutile = 2.8736) which reflects the incident sunlight onto the dye, increasing the light-absorbing capacity of the dye. Additionally, the presence of rutile content prompts the electron transfer from rutile to the anatase trapping sites; this synergistic effect inhibits the electron-hole recombination occurrence, thus leading to an increase in DSSC performance [
27]. The high anchoring of the dye molecule on the TiO
2 surface is due to the hydroxyl group (−OH) given by the TiOOH surface species and in addition to the TiCl
4 treatment have improved the dye loading capacity of the DSSC 4. Furthermore, the improvement of V
OC (more than 40 mV) is the result of the high bandgap energy (Eg) of the TiO
2_LS2 compared with the anatase phase (
Figure 6) which is only reflected in the most negative conduction band (CB) level, the valence band (VB) level being similar for both crystal phases, rutile and anatase polymorphs. A similar beneficial evolution of the photovoltaic parameters was observed for PhA 4 loaded with the curcumin dye, obtaining a photovoltaic efficiency three times higher than the best efficiency reported for this dye so far [
16].
Achieving photovoltaic efficiencies higher than the best efficiency reported so far for both dyes, the complex architecture of PhA4 is validated for the future optimization of the electrolyte, another important component of DSSC.
In an attempt to reduce the volatility, toxicity, flammability of the electrolyte, and at the same time, overcome this poor stability on moisture, one of the main steps to eco-friendly materials, the effect of water (
Table 1), has been studied in detail for the configuration of DSSC 4. A clear increase in efficiency can be observed with the addition of water in the electrolyte for the DN-F01 dye, which is especially attributable to the increases in
VOC with 51 mV by more than in the electrolyte without water. Due to the higher solubility in the water of I
−, compared with that of I
3−, the addition of water to the electrolyte leads to a positive shift of the potential [
28]. If no negative effect of water was observed in the case of the synthetic dye, the curcumin dye was affected and a decrease in the cell photocurrent, mostly due to the dye detachment from the semiconductors surface promoted by the water, was highlighted.
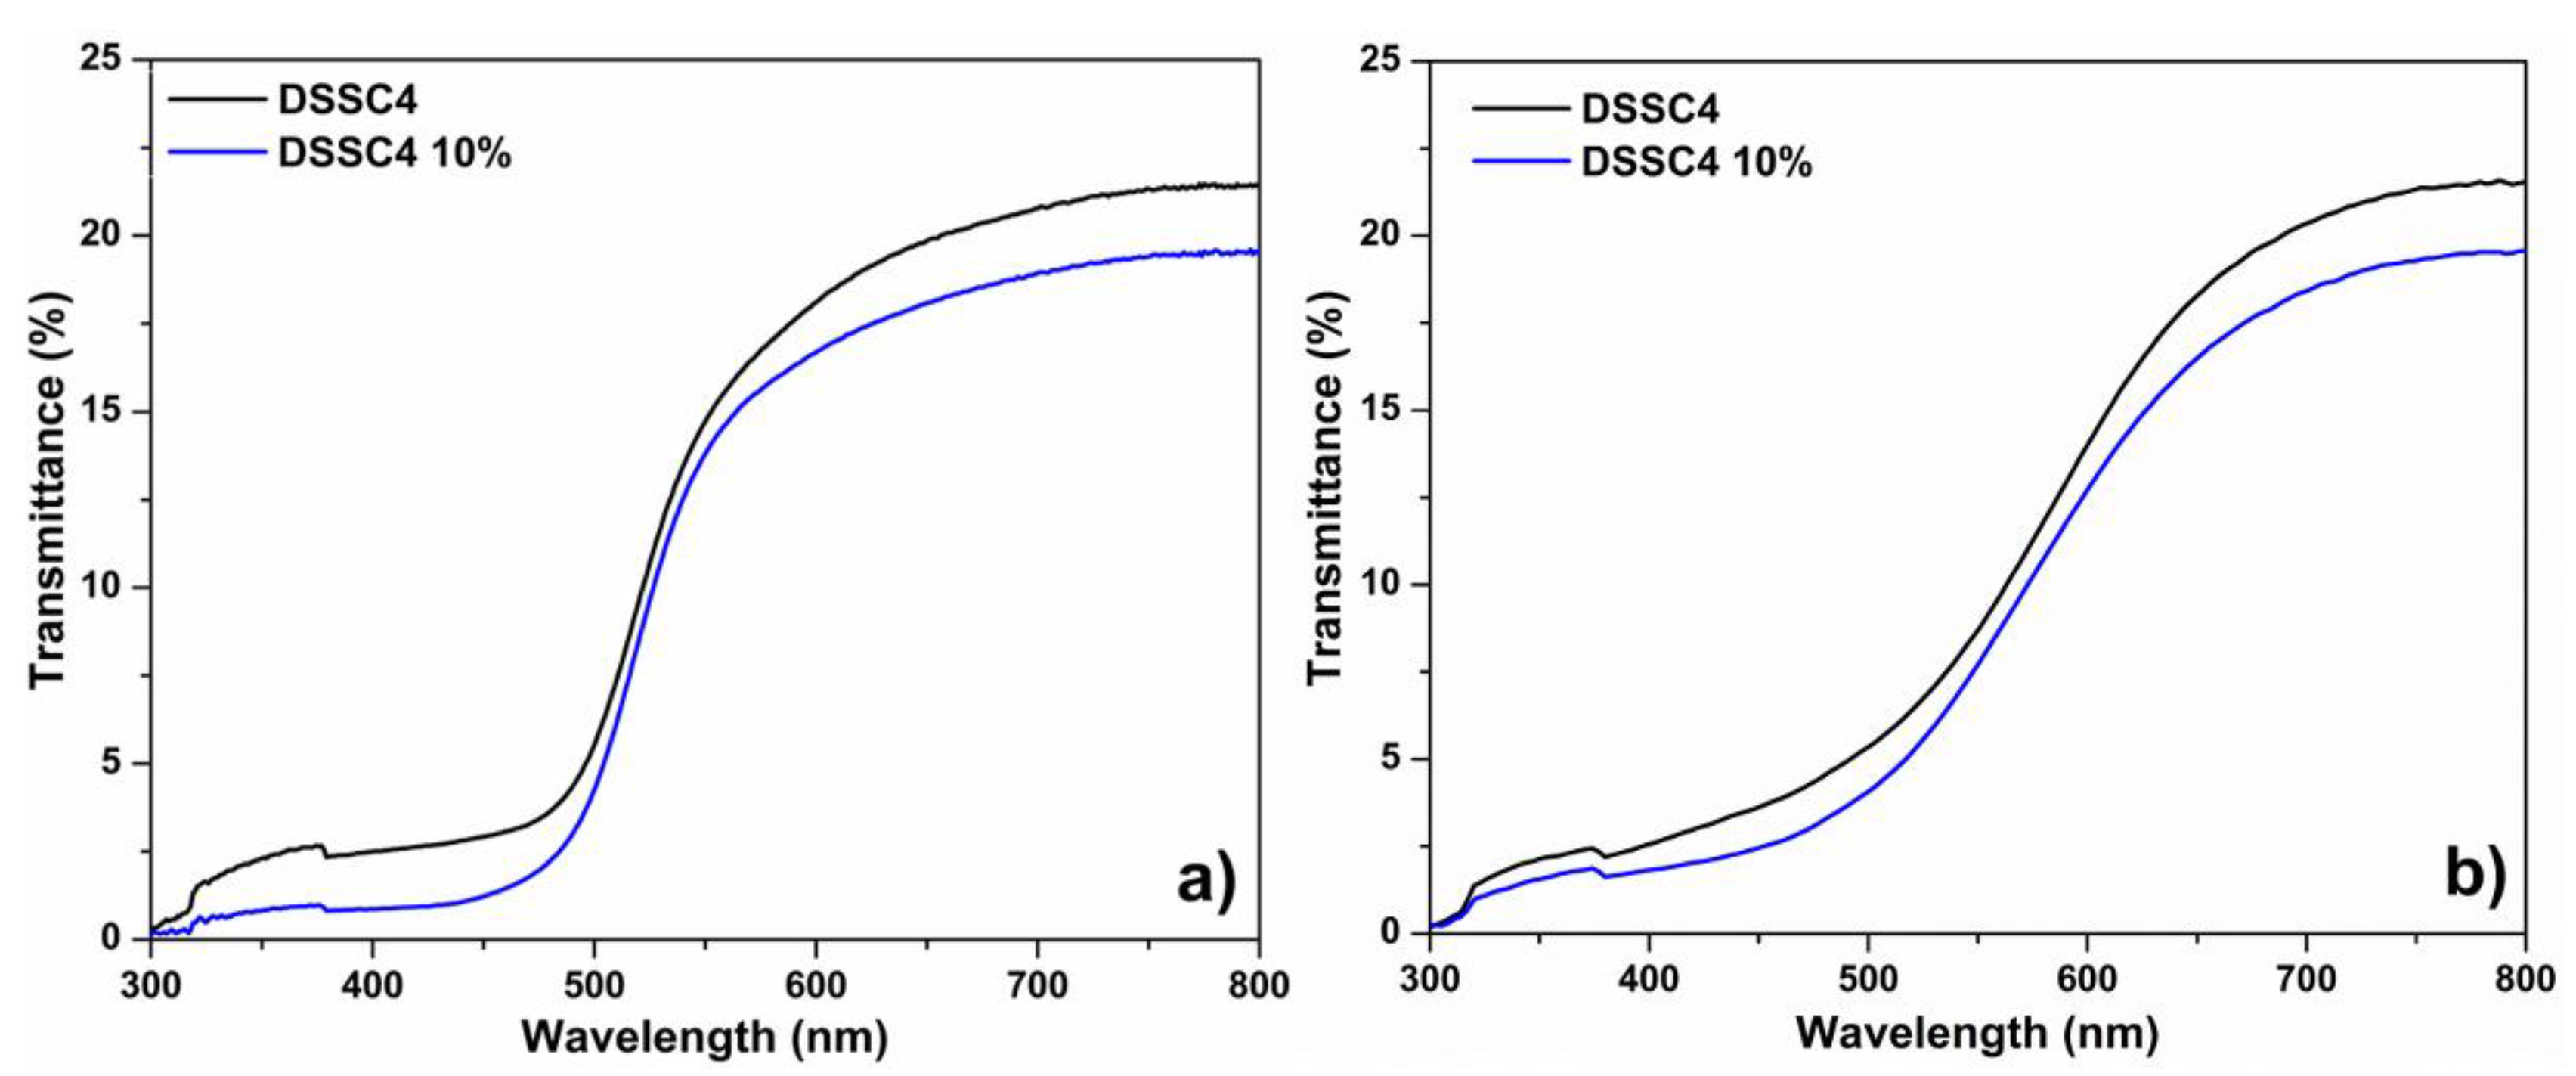
The transmittance spectra (
Figure 11) were similar for DSSC 4, characterized by a high absorption of UV radiation, close to 98% for DSSC 4 with E10% electrolyte and a transparency of the DSSCs on the entire PAR domain, in accordance with those reported in the literature [
29].
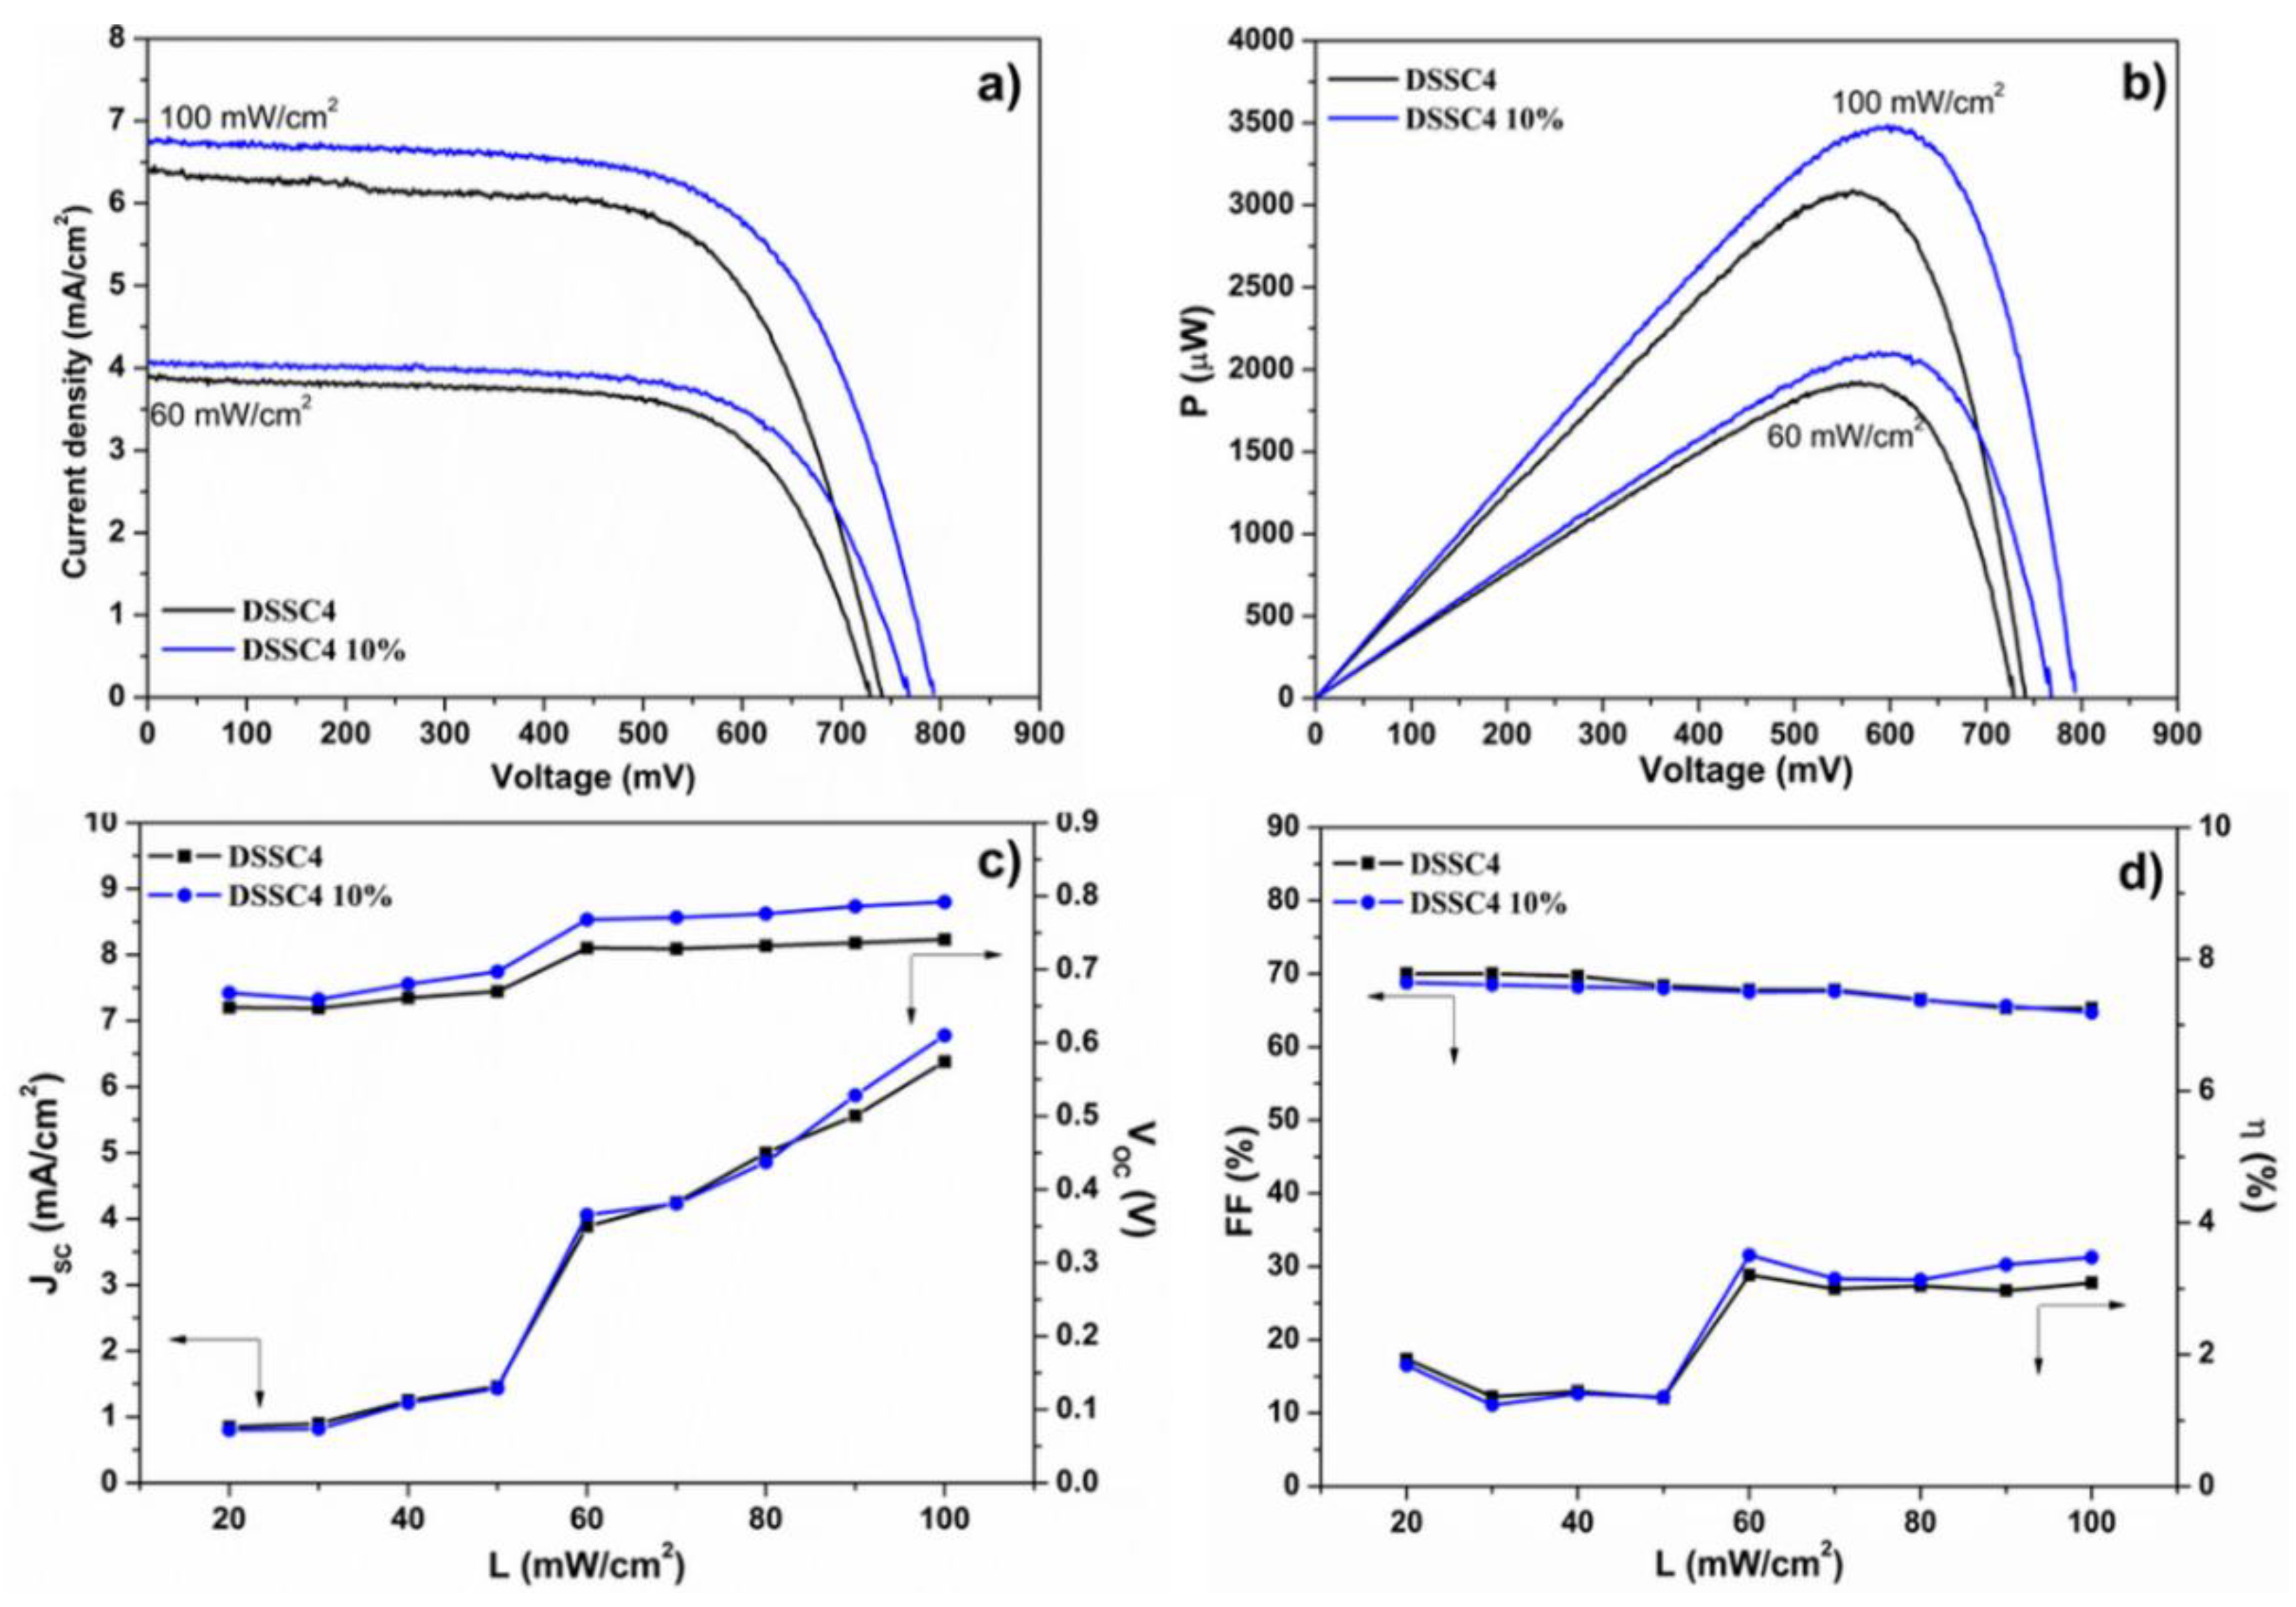
One of the most important advantages of the DSSCs is sustainability over the whole year, a prerequisite for successful implementation in a wavelength-selective greenhouse. The effect of different light intensities (ranging from 20 to 100 mW/cm
2) on the photovoltaic performance of DSSC 4 was investigated (
Table 2,
Figure 12 and
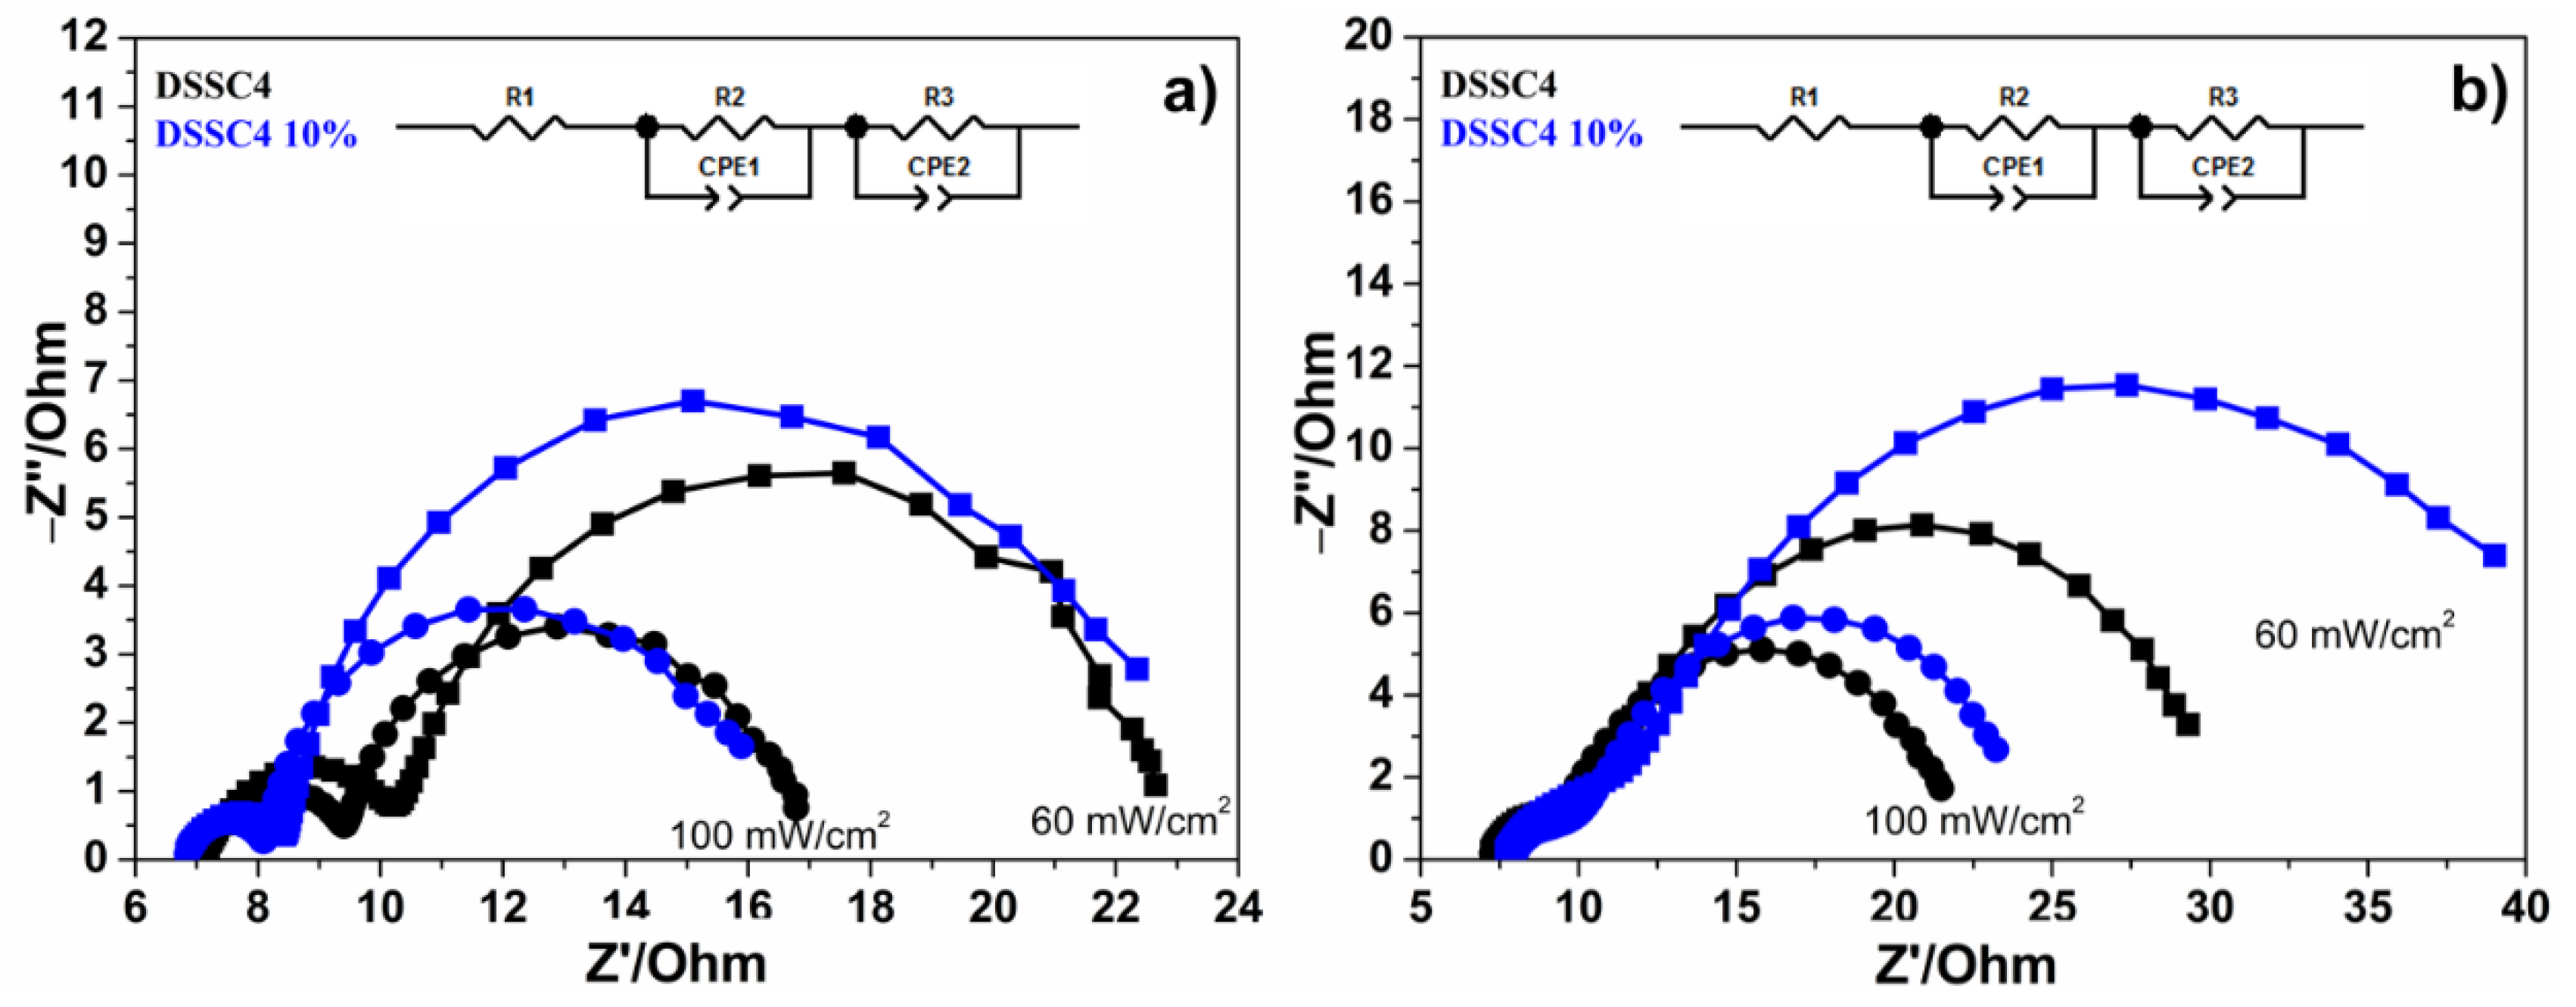
Figure 13). To give a better understanding of the charge dynamics involved in our DSSCs and the effect of the water, electrochemical impedance spectroscopy (EIS) analysis was performed at V
OC and under 1 sun illumination. In the equivalent circuit presented in the insets of
Figure 14,
R1 represents the intrinsic resistance of the assembled cells,
R2 is the charge transfer resistance at the CE/electrolyte interface, and
R3 represents the charge transfer resistance at the TiO
2 photoelectrode/dye/electrolyte interface.
Table 3 summarizes the fitted values of the resistance associated with each interfacial process in the DSSC.
In case of the synthetic dye (
Figure 12), under the illumination with different light intensities, the
JSC value varies almost identically for both DSSCs, without and with water, from approximately 0.8 to 6.7 mA/cm
2 with a steep increase to 60 mW/cm
2. EIS analysis highlighted that the evolution of
JSC is directly correlated with
R2 and
R3 (
Table 3), for example, in the case of 60 mW/cm
2 and 100 mW/cm
2, increasing
JSC is determined by reducing the charge transfer resistance at the TiO
2 photoelectrode/dye/electrolyte interface and the improved catalytic activity, more drastically for E10%. The open-circuit potential slightly increases with increasing illumination intensity and becomes almost constant after 60 mW/cm
2. The voltage dependence of the output power (
P = IV) under different illumination intensities is shown in
Figure 12. The power conversion increases with increases in the light intensity until 3087 µW for DSSC 4_E and 3474 µW for DSSC 4_E10%, respectively, at 100 mW/cm
2. The stability of our DSSCs with increasing light intensity is highlighted by the near-constant evolution of the fill factor, even with a 10% water content. DSSC 4_E10 demonstrates nearly 3.5% photovoltaic efficiency for illumination intensity between 60 mW/cm
2 and 100 mW/cm
2 with a maximum at 60 mW/cm
2.
In the case of the curcumin dye (
Figure 13), although the evolution of the photovoltaic parameters (
JSC,
VOC,
ff,
η) depending on the illumination intensity is similar to that of the synthetic dye, the water slightly affects the performance of the DSSC (increasing
R2 and
R3), but not the stability under illumination. The photovoltaic efficiency remains almost constant for illumination intensities between 60 mW/cm
2 and 100 mW/cm
2 with a maximum at 60 mW/cm
2.
Our water-based dye-sensitized solar cells loaded with synthetic and natural UV dyes have revealed excellent performance even under conditions of not-optimal lighting, which can usually occur in real outdoor applications, such as a greenhouse during of the day, month, or season.


 ,
, 


