Article

Exploring Nucleation Pathways in Distinct Physicochemical Environments Unveiling Novel Options to Modulate and Optimize Protein Crystallization

by
Mengying Wang
1,†,
Angélica Luana C. Barra
1,2,†,
Hévila Brognaro
1 and
Christian Betzel
1,*
1
Laboratory for Structural Biology of Infection and Inflammation, Institute of Biochemistry and Molecular Biology, University of Hamburg, Notkestrasse 85, c/o DESY, Build. 22a, 22603 Hamburg, Germany
2
Pólo TerRa, São Carlos Institute of Physics, University of São Paulo, Av. João Dagnone, 1100, Jd. Santa Angelina, São Carlos 13563-120, SP, Brazil
*
Author to whom correspondence should be addressed.
These authors contributed equally to this work.
Submission received: 1 March 2022 / Revised: 16 March 2022 / Accepted: 17 March 2022 / Published: 21 March 2022

Abstract

:
The scientific discussion about classical and nonclassical nucleation theories has lasted for two decades so far. Recently, multiple nucleation pathways and the occurrence and role of metastable intermediates in crystallization processes have attracted increasing attention, following the discovery of functional phase separation, which is now under investigation in different fields of cellular life sciences, providing interesting and novel aspects for conventional crystallization experiments. In this context, more systematic investigations need to be carried out to extend the current knowledge about nucleation processes. In terms of the data we present, a well-studied model protein, glucose isomerase (GI), was employed first to investigate systematically the early stages of the crystallization process, covering condensing and prenucleation ordering of protein molecules in diverse scenarios, including varying ionic and crowding agent conditions, as well as the application of a pulsed electric field (pEF). The main method used to characterize the early events of nucleation was synchronized polarized and depolarized dynamic light scattering (DLS/DDLS), which is capable of collecting the polarized and depolarized component of scattered light from a sample suspension in parallel, thus monitoring the time-resolved evolution of the condensation and geometrical ordering of proteins at the early stages of nucleation. A diffusion interaction parameter, KD, of GI under varying salt conditions was evaluated to discuss how the proportion of specific and non-specific protein–protein interactions affects the nucleation process. The effect of mesoscopic ordered clusters (MOCs) on protein crystallization was explored further by adding different ratios of MOCs induced by a pEF to fresh GI droplets in solution with different PEG concentrations. To emphasize and complement the data and results obtained with GI, a recombinant pyridoxal 5-phosphate (vitamin B6) synthase (Pdx) complex of Staphylococcus aureus assembled from twelve monomers of Pdx1 and twelve monomers of Pdx2 was employed to validate the ability of the pEF influencing the nucleation of complex macromolecules and the effect of MOCs on adjusting the crystallization pathway. In summary, our data revealed multiple nucleation pathways by tuning the proportion of specific and non-specific protein interactions, or by utilizing a pEF which turned out to be efficient to accelerate the nucleation process. Finally, a novel and reproducible experimental strategy, which can adjust and facilitate a crystallization process by pEF-induced MOCs, was summarized and reported for the first time.

1. Introduction

Regardless of the establishment of the nucleation theory for approximately a hundred years [1], the discussion between classical and nonclassical nucleation theories is still an ongoing topic in the field of crystallogenesis [2,3,4,5,6,7,8,9,10,11,12]. The most important characteristic of the classical nucleation theory (CNT) assumes a one-step nucleation of solute molecules directly from the supersaturated bulk solution, along with the simultaneous increase in two ordering parameters—concentration and structural arrangements guiding the three-dimensional (3D) ordering of a protein crystal [13]. However, proposed simulations have decoupled the development of the two ordering parameters leading towards a multi-step nucleation [14], termed as nonclassical nucleation theory (NCNT), which was supported subsequently by experimental discoveries [15,16,17,18]. In particular, the two-step nucleation theory has recently been receiving more attention since widespread observations of functional liquid-liquid phase separation (LLPS), part of the two-step nucleation process, were published in cellular biology, in the crystallization of inorganic [19,20,21,22,23] and organic particle system [24,25,26,27], and in the in vivo formation of crystals and fibers, which can also be involved in diseases [28,29,30,31]. According to the two-step nucleation theory, the homogeneous solution undergoes LLPS and firstly forms a liquid dense phase without internal order, after which the molecules within this liquid dense phase can rearrange to form nuclei [32,33]. This liquid dense phase is classified as a metastable intermediate, as its free energy level is lower than in the initial homogeneous solution, but higher than in the following crystalline phase [34]. By analyzing the impact of mesoscopic clusters in protein solutions in the context of the observed nucleation rate, Mike Sleutel and Alexander E. S. Van Driessche demonstrated that mesoscopic clusters can enhance the crystallization rate 10-fold for lysozyme and 100-fold for glucose isomerase [35]. With the recent options of time-resolved imaging at a molecular resolution, direct evidence of nucleation through multiple pathways was uncovered. For example, Houben et al. recorded utilizing Cryo-STEM tomography the formation of disordered ferritin aggregates, followed by a desolvation process which leads to a jointly continuous increase in density and order from the surface towards the center of aggregates [36]. This observed phenomenon is already beyond the original explanation of either CNT or NCNT. Van Driessche et al. observed, by means of Cryo-EM, the early nucleation events of GI with varying precipitants, showing no occurrence of liquid dense intermediates as a precursor of crystal nuclei, but driven by the oriented attachment of nanosized and ordered ‘building blocks’ emerged directly from the protein solution [7]. They revealed further the interplay between the earliest formed crystalline nano-assemblies and their effect of oriented attachment upon the nucleation process [37]. On the other hand, and complementarily, the group of Fajun reported the effect of multivalent ions capable of tuning protein interactions [38,39,40,41], and reviewed the interplay of specific and nonspecific interactions influencing the nucleation pathway which can contain metastable intermediate phases [9]. In this context, more comprehensive crystallization scenarios remain to be explored in more detail, applying complementary bioanalytical techniques to obtain more insights about the crystal nucleation pathways.
Here, we employed a well-studied model protein glucose isomerase (GI, 43.23 kDa) from Streptomyces rubiginosus to investigate systematically: (1) the early stages of protein phase transition and crystallization in a wide range of physicochemical scenarios, including varying salt conditions, crowding agent polyethylene glycol (PEG) and applying a pulsed electric field (pEF); (2) the mediating effect of mesoscopic ordered clusters (MOCs), which mostly have a dimension range of 10 to 1000 nm [42], induced by pEF on the crystallization process. Furthermore, a more challenging and complex biomacromolecular system, the pyridoxal 5-phosphate (vitamin B6) synthase (Pdx) complex of Staphylococcus aureus, was employed to verify the universal effect of pEFs and to verify the effect of MOCs on the crystallization process. The Pdx complex, as shown in Figure 1b, is formed by a dodecameric assembling of Pdx1 (32.12 kDa) attached to twelve monomers of Pdx2 (23.76 kDa) via a dynamic and transient complex formation that causes the crystallization to be most challenging for obtaining X-ray-suitable crystals [43]. To date, three-dimensional X-ray structures of Pdx complexes from four different organisms, but not S. aureus, have been reported and deposited in the protein data bank. Strohmeier and co-workers found that the H170N (H165N in Pdx2 from S. aureus) mutation in the catalytic site of Pdx2 from Bacillus subtilis stabilizes the complex in a fully saturated form, enabling and supporting crystallization and structural analysis [44]. Therefore, in our investigations, we also applied the Pdx2 mutant of S. aureus to prepare a Pdx1/Pdx2H165N (Pdx) complex for the experiments performed.
The main technique utilized in this work is non-invasive depolarized dynamic light scattering (DDLS) [46,47,48,49,50], which employs the birefringent optical property of crystalline materials to detect the early and nanoscale formation of nuclei not detectable via optical microscopes. The scattered DDLS signal intensity therefore rises with the ordering of a 3D structure in a solution exposed to laser light. Meanwhile, the polarized component of scattered light is collected by a separate detector as a conventional DLS signal, whose intensity depends only on particle dimension and density in solution. Hence, synchronously monitoring DLS and DDLS signal intensities allows us to identify and investigate the early-stage evolution of a crystal nucleation process time-resolved under different physicochemical conditions following both detected signals and corresponding derived parameters—condensing and ordering. In addition, we measured the diffusion interaction parameter KD, applying a different hardware system, to investigate the influence of different salt conditions to non-specific protein–protein interactions and to the resulting phase behaviors. Our results confirm the coexistence of different nucleation pathways by tuning the proportion of specific and non-specific protein–protein interactions and by introducing an external force–pulsed electric field. The application of pEF and the addition of pre-grown mesoscopic ordered clusters proved for both proteins applied in these investigations to be effective methods to support and improve protein nucleation towards obtaining X-ray suitable crystals.

2. Materials and Methods

The homotetrameric glucose isomerase (GI) from Streptomyces rubiginosus (Hampton Research, Aliso Viejo, CA, USA), with an isoelectric point of 5.0 and molecular weight of 43.23 kDa, was stabilized in 10 mM MES buffer, pH 6.5 with 1 mM dithiothreitol (DTT). The Pdx complex from Staphylococcus aureus, composed of twelve Pdx1 (32.12 kDa) and twelve Pdx2H165N (23.76 kDa) subunits, with an isoelectric point of 5.26, was expressed and purified as reported before [51] and stored in 20 mM Tris-HCl buffer, pH 8, 200 mM NaCl, 1 mM ethylenediaminetetraacetic acid (EDTA), 2 mM DTT and 10 mM L-glutamine. All the stock solutions of precipitants and salts applied were prepared in the same buffer with the corresponding proteins and filtered prior to use, applying either a 0.2 μm or a 0.45 μm filter (SARSTEDT, Nümbrecht, Germany). Prior to experiments, GI and the Pdx complex were centrifuged for 30 min at 21,130× g and 4 °C and the protein concentrations were determined applying a Nanodrop 2000 (Thermo Fisher Scientific, Bremen, Germany). All measurements were carried out at 20 °C.

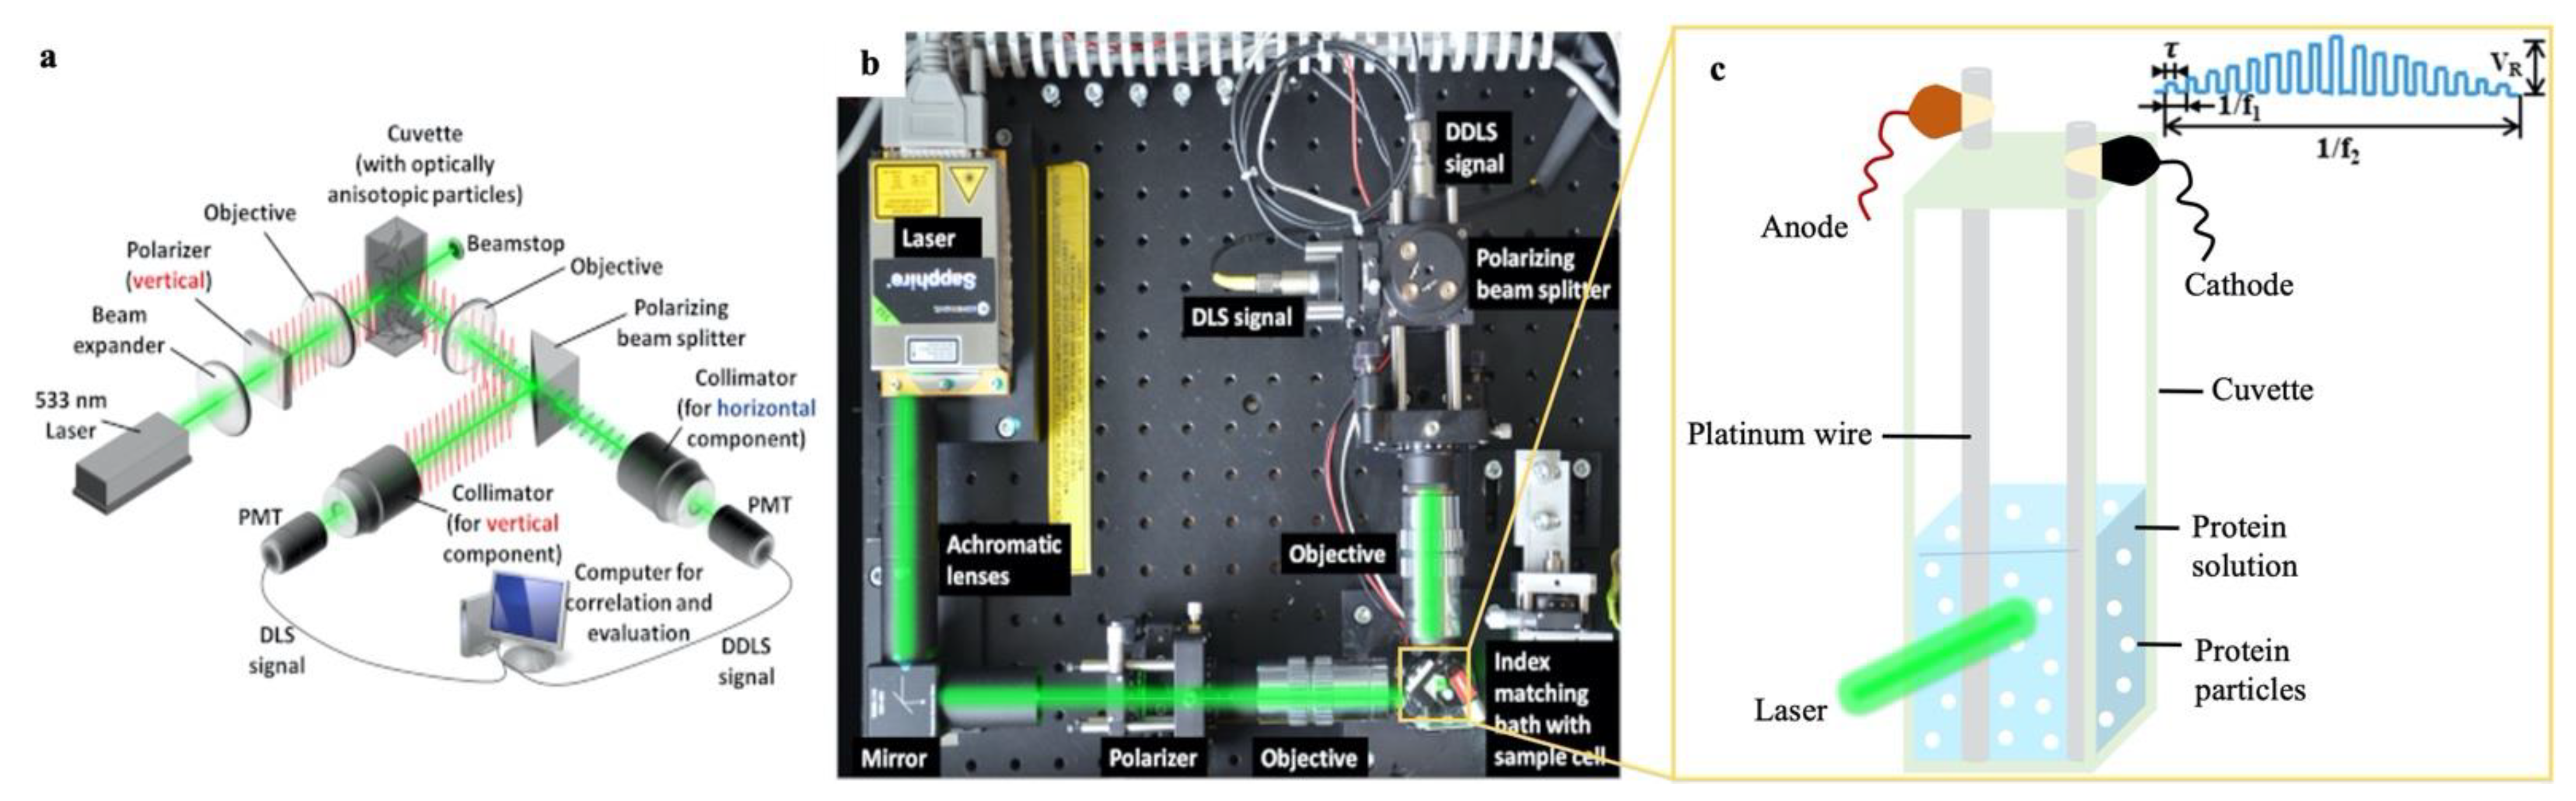
2.1. Polarized and Depolarized Dynamic Light Scattering (DLS/DDLS) Experiments

2.1.1. DDLS Instrument and Setup for Applying Pulsed Electric Field

As shown in Figure 2a,b, one custom-built light scattering instrument, which is capable of detecting simultaneously the vertical component (polarized) and horizontal component (depolarized) of scattered light from the sample, was designed and constructed in collaboration with XtalConcepts (Hamburg, Germany). The instrument provides a laser wavelength of 532 nm and a laser output power of 100 mW. The laser light was polarized by a vertical polarizer before passing through the sample. The vertical component of scattered light (DLS signal) was collected directly at 90° by an objective (Plan APO ELWD 20 × 0.42 WD = 20), and the horizontal component was separated from scattered light by a polarizing beam splitter (Qioptic Photonics, Göttingen, Germany) and collected as a DDLS signal. The autocorrelators of the instrument cover an acquisition time range from 0.4 ms to 30 s. A transparent quartz cuvette (101.015-QS, Hellma Analytics, Munich, Germany), with 3 mm × 3 mm inner cross-section and 21 mm height, was used as the sample container and immersed into an index matching bath with plane parallel walls (thickness 1 mm) and filled with ultrapure water. The design and setup for applying pEF to a sample suspension in the cuvette during DLS/DDLS measurements is shown in Figure 2c and was described in detail in a previous publication [52]. Two platinum (Pt) wires with 0.3 mm diameter, 25 mm length and a resistance (R) of approx. 37.5 mΩ at 20 °C (Sigma, Neustadt, Germany) were inserted at two opposite corners of the cuvette to generate a pEF. The applied pulsed waveform is with a pulse amplitude rising continuously in the first half period and decreasing gradually in the second half period of one waveform circle (Figure 2c), which was referred to waveform 4 (W4) in our previous publication. The maximum output pulse amplitude in each wave circle was 30 V and the minimum was no larger than 1 V on 500 Ω load. The pulse width (τ) of each single pulse was 0.6 ± 0.15 ms.

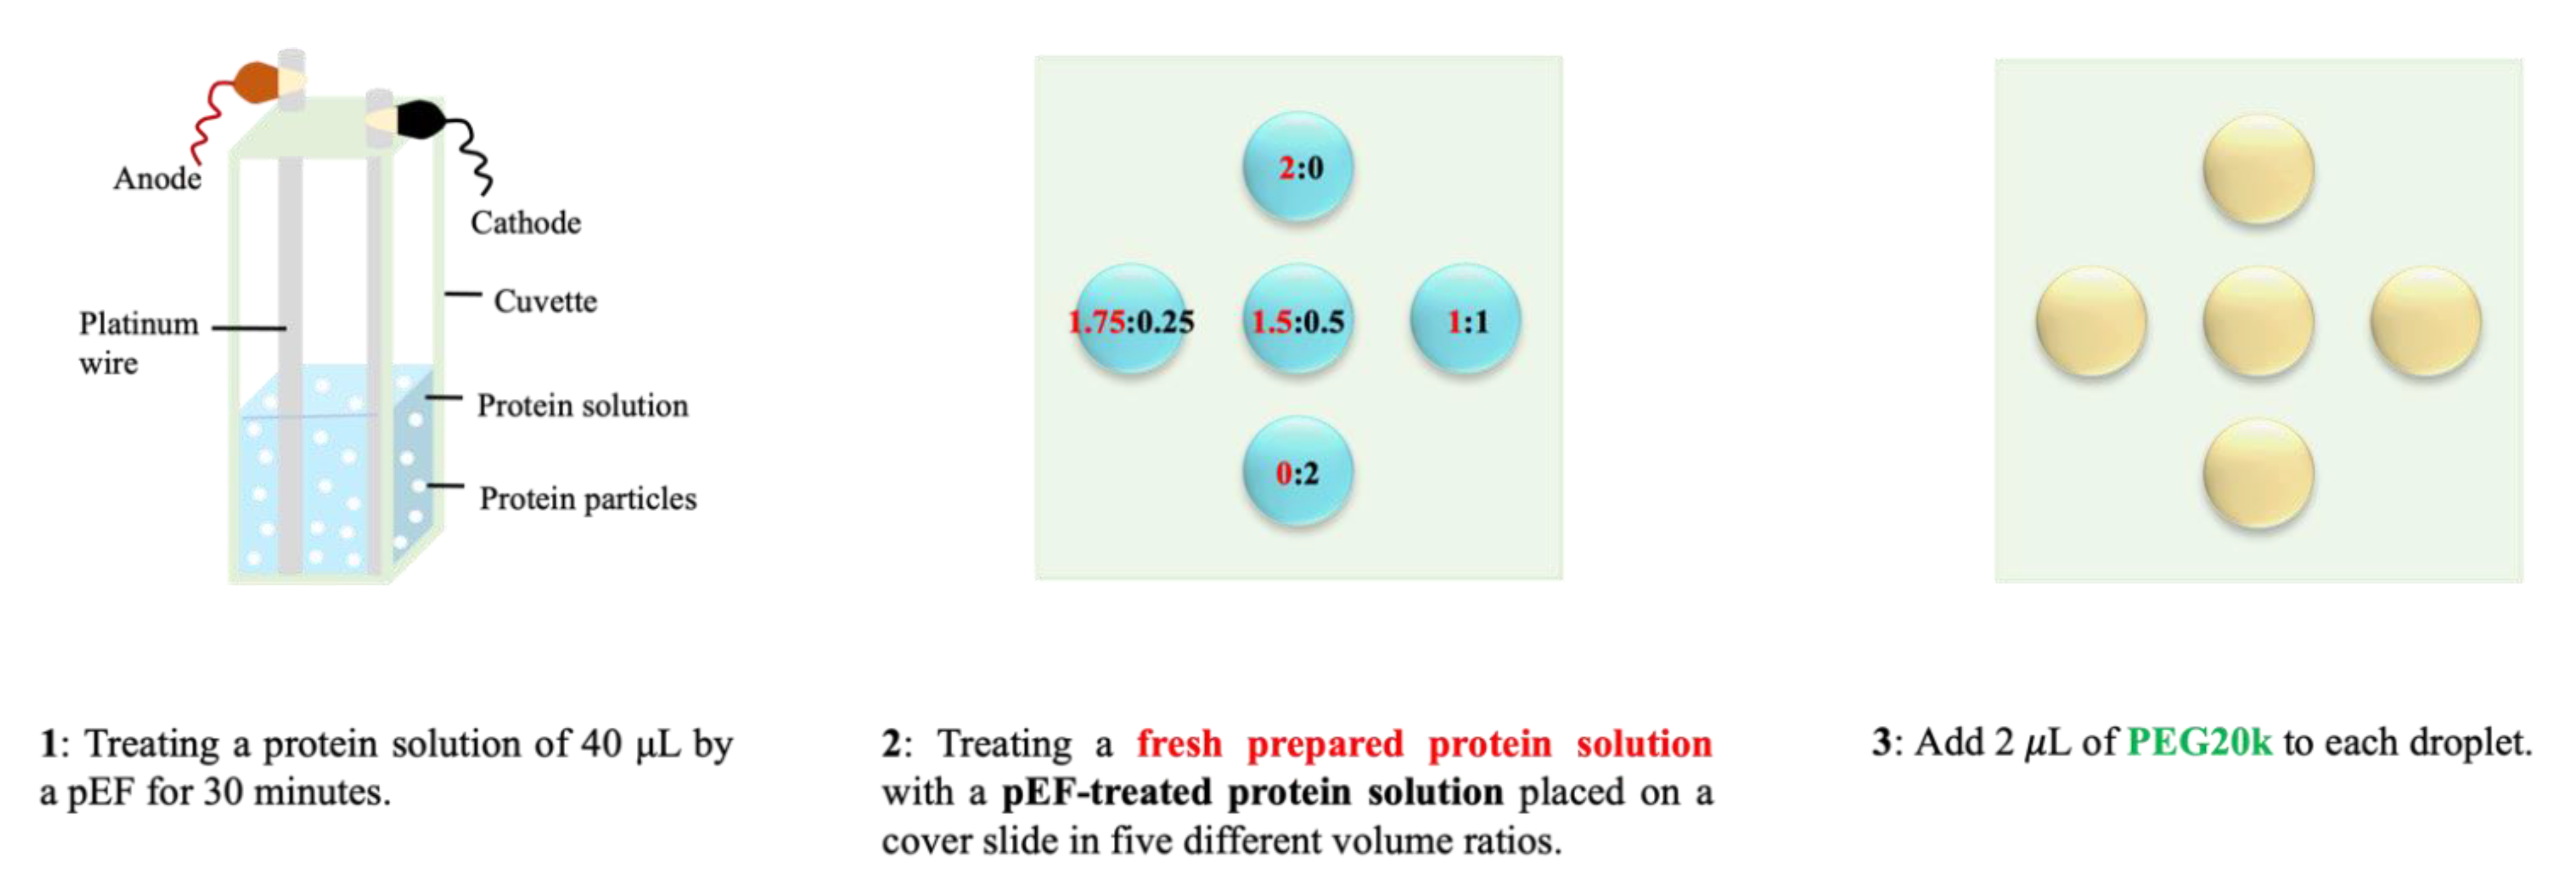
2.1.2. Sample Preparation and Experimental Methods for DLS/DDLS Measurements

Prior to DLS/DDLS measurements, the stock solutions of protein, salt and crowding agent were mixed according to the final concentration of each composite in the mixture with a final volume of 40 μL. The measured solutions were pipetted into the transparent quartz cuvette and sealed with a glass cover slid. To investigate the effect of a pEF on protein crystallization (Section 3.3 and Section 3.4), the pEF described in Section 2.1.1 and Figure 2c was applied to GI and Pdx samples of pEF groups continuously during the entire DDLS measurement. For GI, each data acquisition step was recorded for 20 s followed by a delay time of 20 s for a DLS/DDLS measurement of 1 h. For the Pdx complex, each measurement was recorded for 4 h with 20 s of acquisition time for each data point and 60 s of interval delay time between two data points. The decay time constants of the DLS signal (translational diffusion coefficient, Dt) and the DDLS signal (rotational diffusion coefficient, Dr) are obtained from the autocorrelation function (ACF) by using the CONTIN algorithm [54]. Appropriate viscosity of each solution was considered to calculate the hydrodynamic radii (Rh) based on the well-known Stokes–Einstein equation [55] (Equation (1)) and Stokes–Einstein–Debye equation [56] (Equation (2)):
D t = K B T 6 π η R h
D r = K B T 8 π η R h 3  
where Dt and Dr are the translational and rotational diffusion coefficients derived from the ACF of the DLS and the DDLS signal as a function of time, respectively. K B is the Boltzmann coefficient, T is the absolute temperature and η is the viscosity value of the solution.

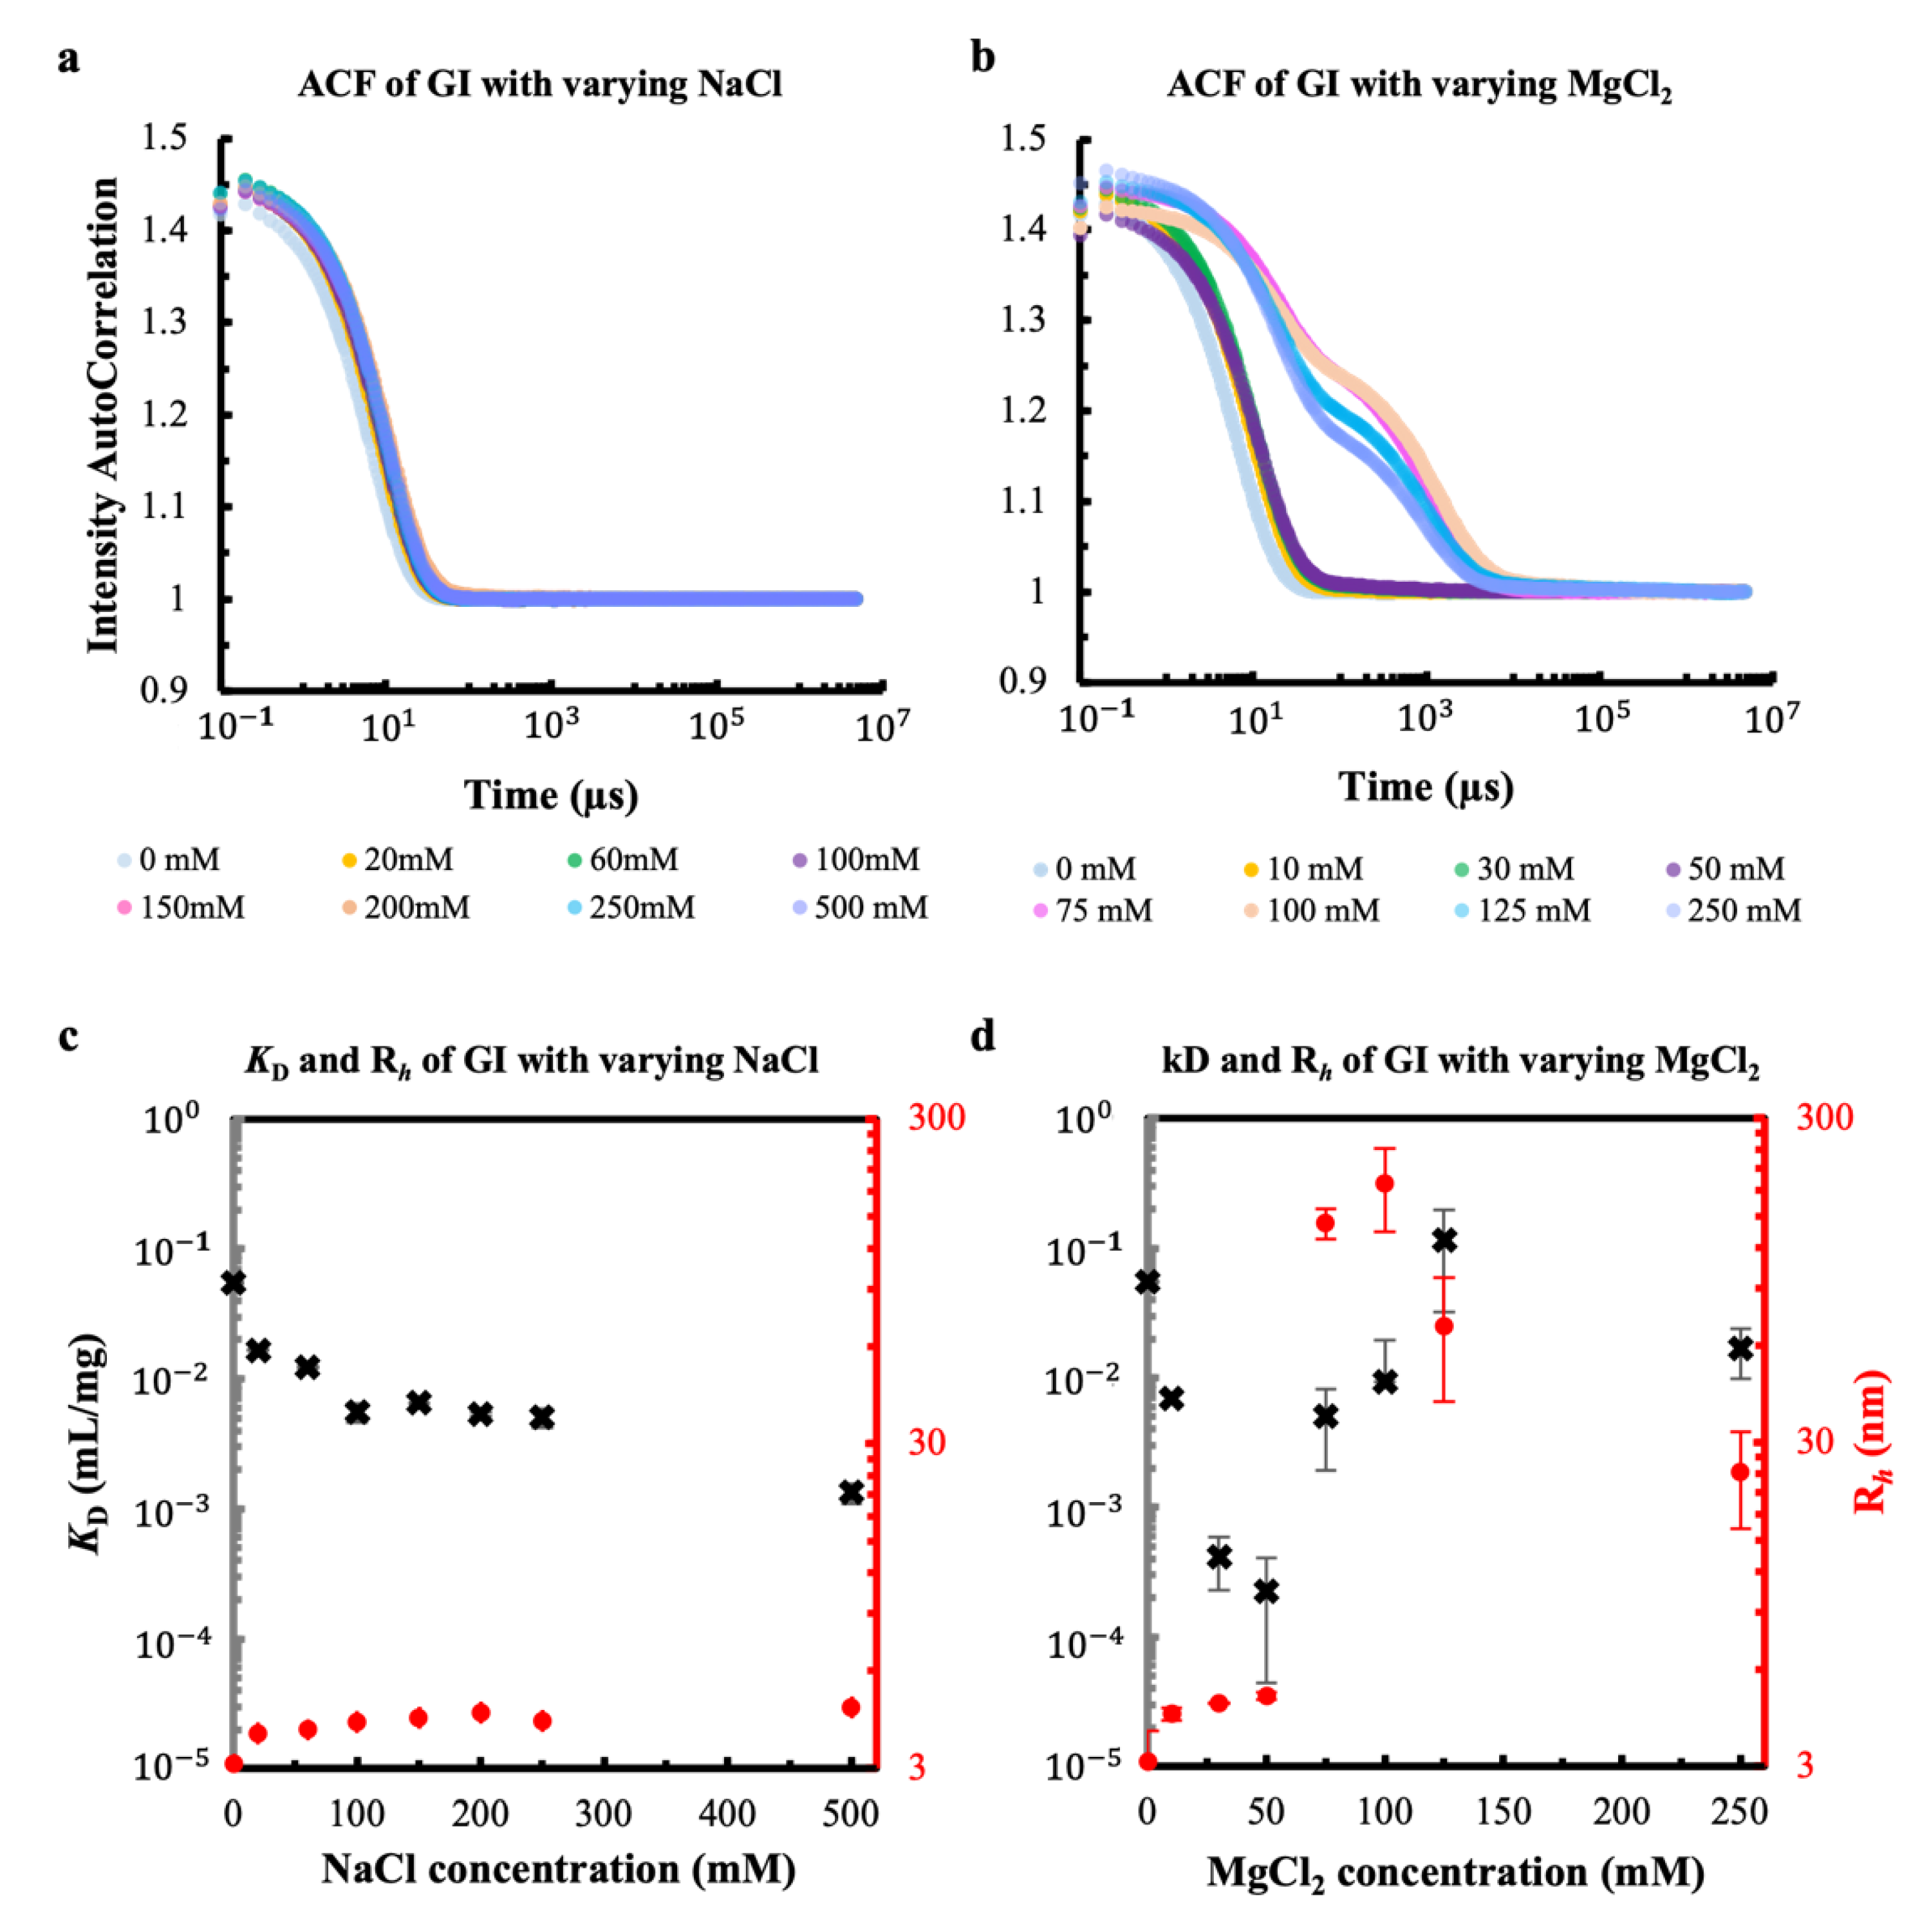
2.2. Measuring Diffusion Interaction Parameter—KD

To obtain information about the protein diffusion interaction parameter K D , a Wyatt Mobius instrument was applied (Wyatt Technology, Santa Barbara, CA, USA), which is a non-destructive and versatile light scattering instrument applied to measure particle dimensions and electrophoretic mobility of proteins/polymers. The translational diffusion coefficient Dt determined by DLS is a function of concentration c as shown in Equation (3) [57], from which the K D value was calculated:
D t = D 0   ( 1 + K D c )
where Dt is the measured transitional diffusion coefficient, D0 is the diffusion coefficient at infinite dilution, and c is the concentration of the protein in mg/mL, K D is the first-order diffusion interaction parameter, which is fundamentally related to the common indicator of protein–protein interactions—the second virial coefficient A2 [58]:
K D = 1.024 A 2 M   6.18
where M is the protein molecular weight.
For the determination of the KD values, six concentrations of the GI solution ranging from 1 to 20 mg/mL were applied and for the Pdx complex six solutions in the range of 0.5 to 5 mg/mL were prepared and measured. Before preparing the sample suspensions the concentrations of the stock protein solutions were measured after centrifugating them for 30 min at 21,130× g and 4 °C. Buffers were filtered, applying 0.2 μm filters. Then, 45 μL of the protein sample solution was pipetted into a quartz cuvette (WNQC45-00, Wyatt Technology, Santa Barbara, CA, USA) and recorded by DLS. The corresponding KD values were calculated and analyzed by applying the software DYNAMICS [57].

2.3. Hanging-Drop Crystallization of Protein with Mesoscopic Ordered Clusters (MOCs) Induced by pEF

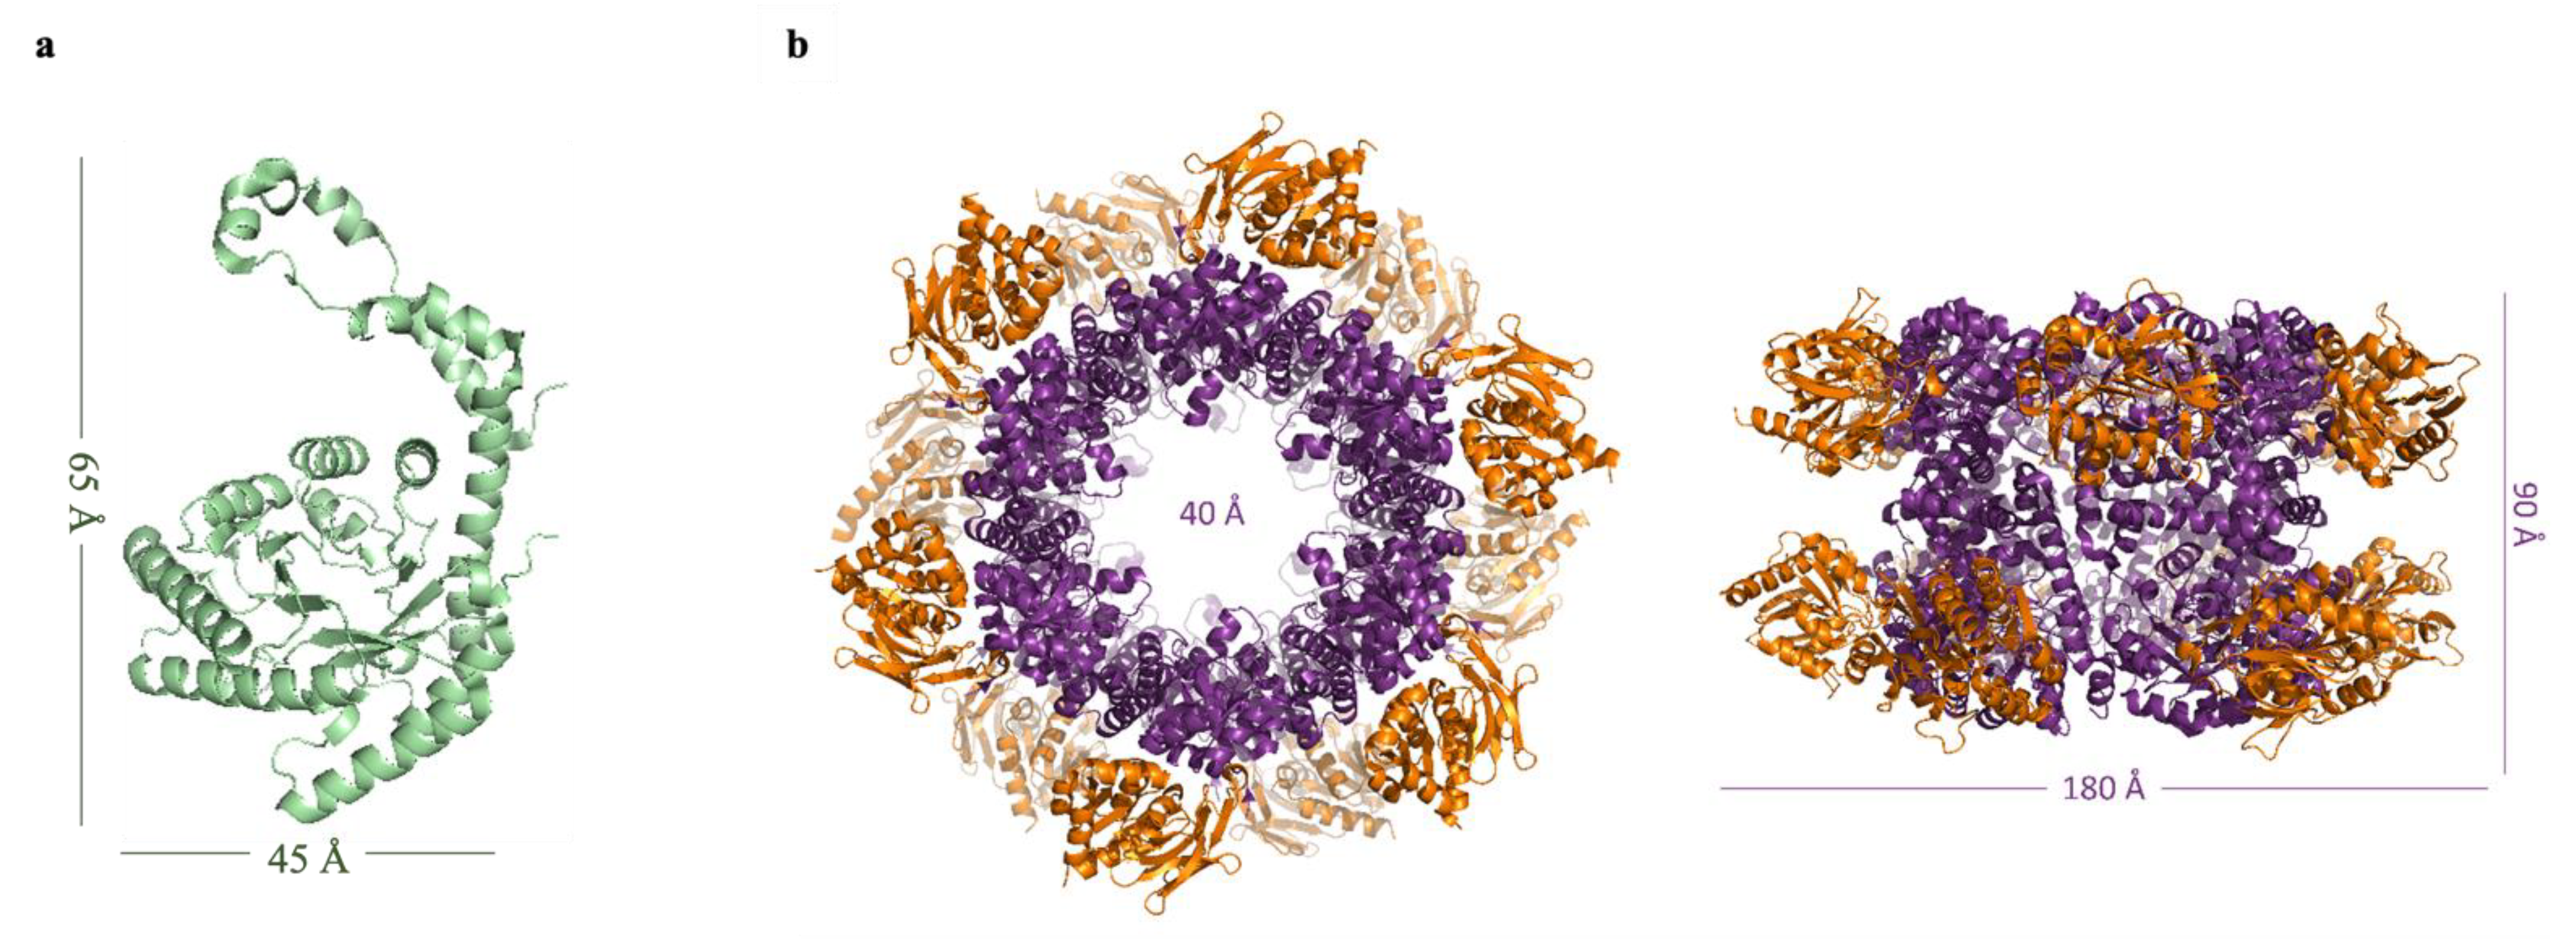
2.3.1. Glucose Isomerase

A 40 μL solution of 4 mg/mL GI in 10 mM MES pH 6.5, 1 mM DTT and 50 mM MgCl2 buffer was exposed to a pEF (parameters described in Section 2.1.1) for 30 min (Figure 3, Step 1). After, the pEF-treated protein solution containing MOCs was mixed on one cover slide with 4 mg/mL fresh protein solution in five different volume ratios to form a 2 μL protein droplet in total (Figure 3, Step 2). Finally, protein droplets on four cover slides were mixed with PEG20k in a 1:1 volume ratio (Figure 3, Step 3). Four concentrations of PEG20k (2%, 4%, 8% and 12%) were applied to droplets on different cover slides. Then, 500 μL of PEG20k at the same initial concentration as prepared for the 5 droplets on each slide was added to the reservoir of the hanging-drop 24-well crystallization plate (Jena Bioscience, Jena, Germany), and afterwards each cover slide with 5 droplets was turned over on individual crystallization reservoirs and sealed with silicone grease (Kurt Obermeier, Bad Berleburg, Germany). All experiments were performed in quadruplicate. The crystallization plates were placed at 20 °C and observed applying an OLYMPUS SZX12 Microscope (OLYMPUS, Tokyo, Japan).

2.3.2. Pdx Complex

A 40 μL solution of the Pdx complex at 5 mg/mL was mixed 1:1 with 10% PEG4K, 0.2 M ammonium citrate pH 7.0, 10 mM L-Glutamine and treated with pEF (parameters described before in Section 2.1.1) for 4 h as shown in step 1 of Figure 3. Afterwards, 0.5 μL of the pEF-treated protein solution containing mesoscopic ordered clusters was taken from the cuvette and mixed on a cover slide with 2 μL of 5 mg/mL of fresh Pdx solution to reach a final volume of 2.5 μL. Subsequently, 0.5 μL of 20% PEG4K was added to the droplet. For control, a 3 μL droplet was prepared and placed on a glass cover slide without pEF-treated protein solution but containing the same final concentration of Pdx and PEG4K. All experiments were prepared in quadruplicates. Each cover slide was turned over on one crystallization reservoir of the hanging-drop 24-well plate (Jena Bioscience, Jena, Germany) containing 500 μL of 20% PEG4K as the reservoir mother liquor and sealed with silicone grease (Kurt Obermeier, Bad Berleburg, Germany). The crystallization plate incubation and further analysis of droplets were carried as described for GI previously.

3. Results

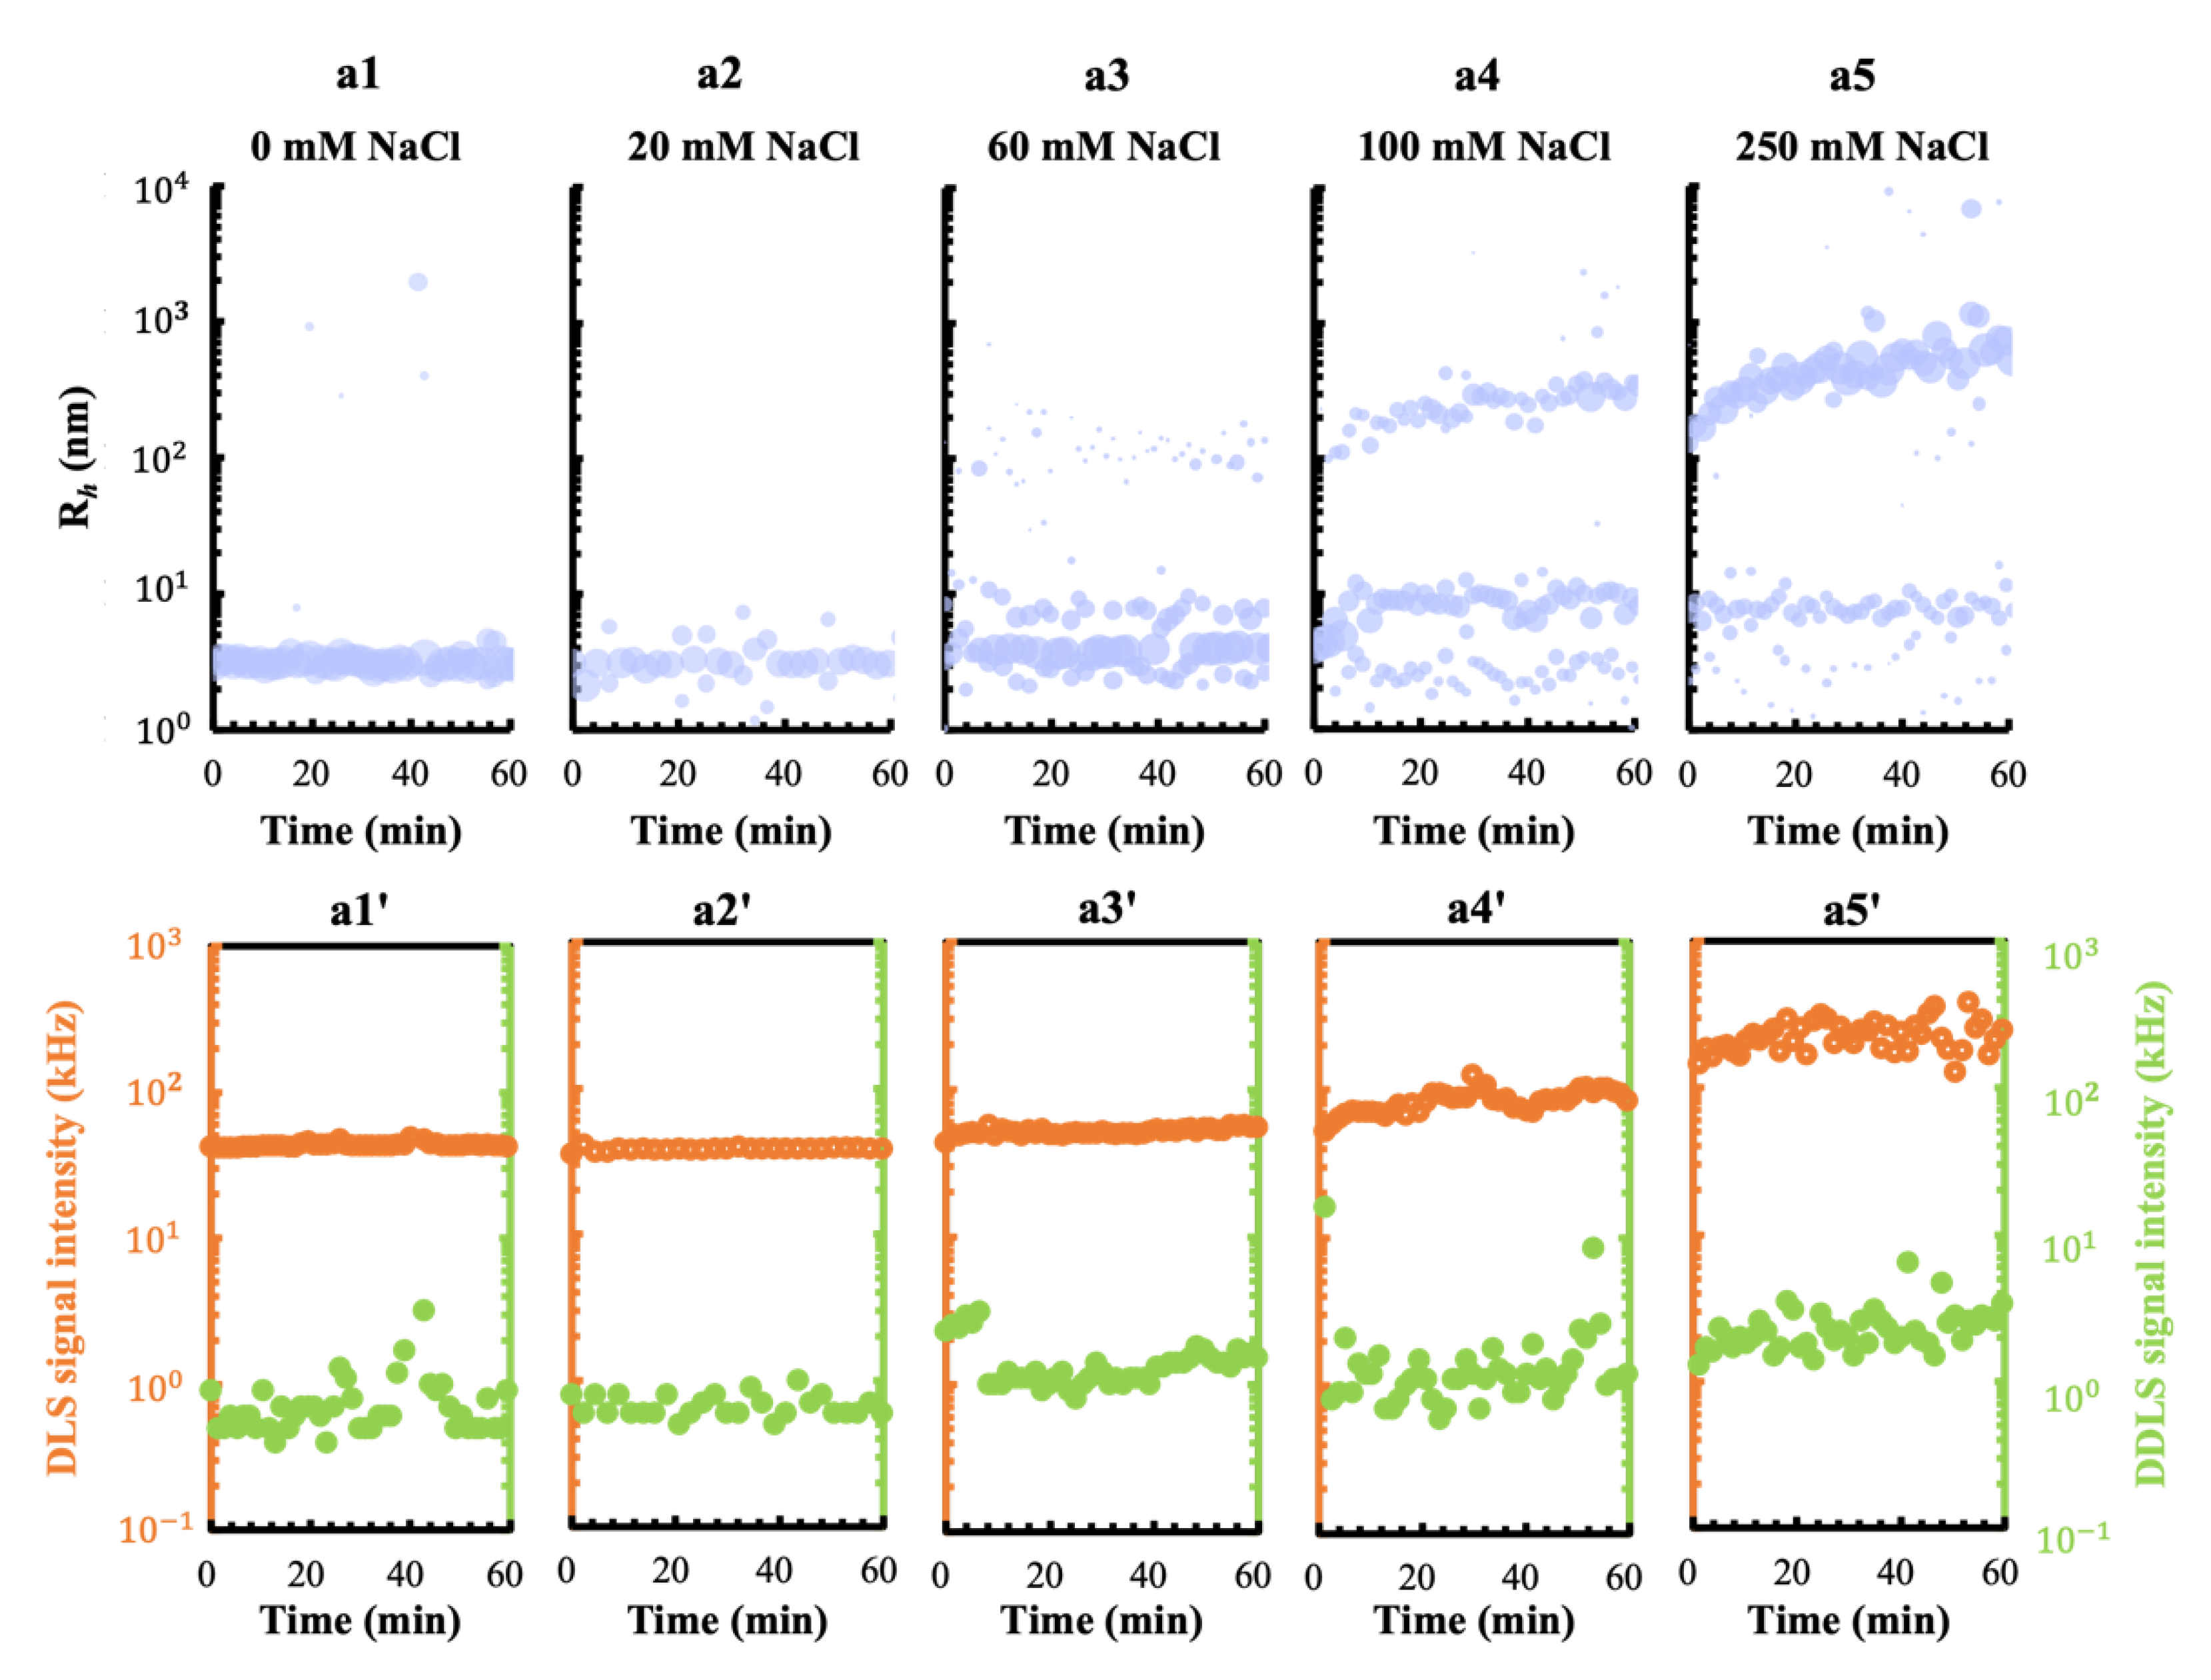
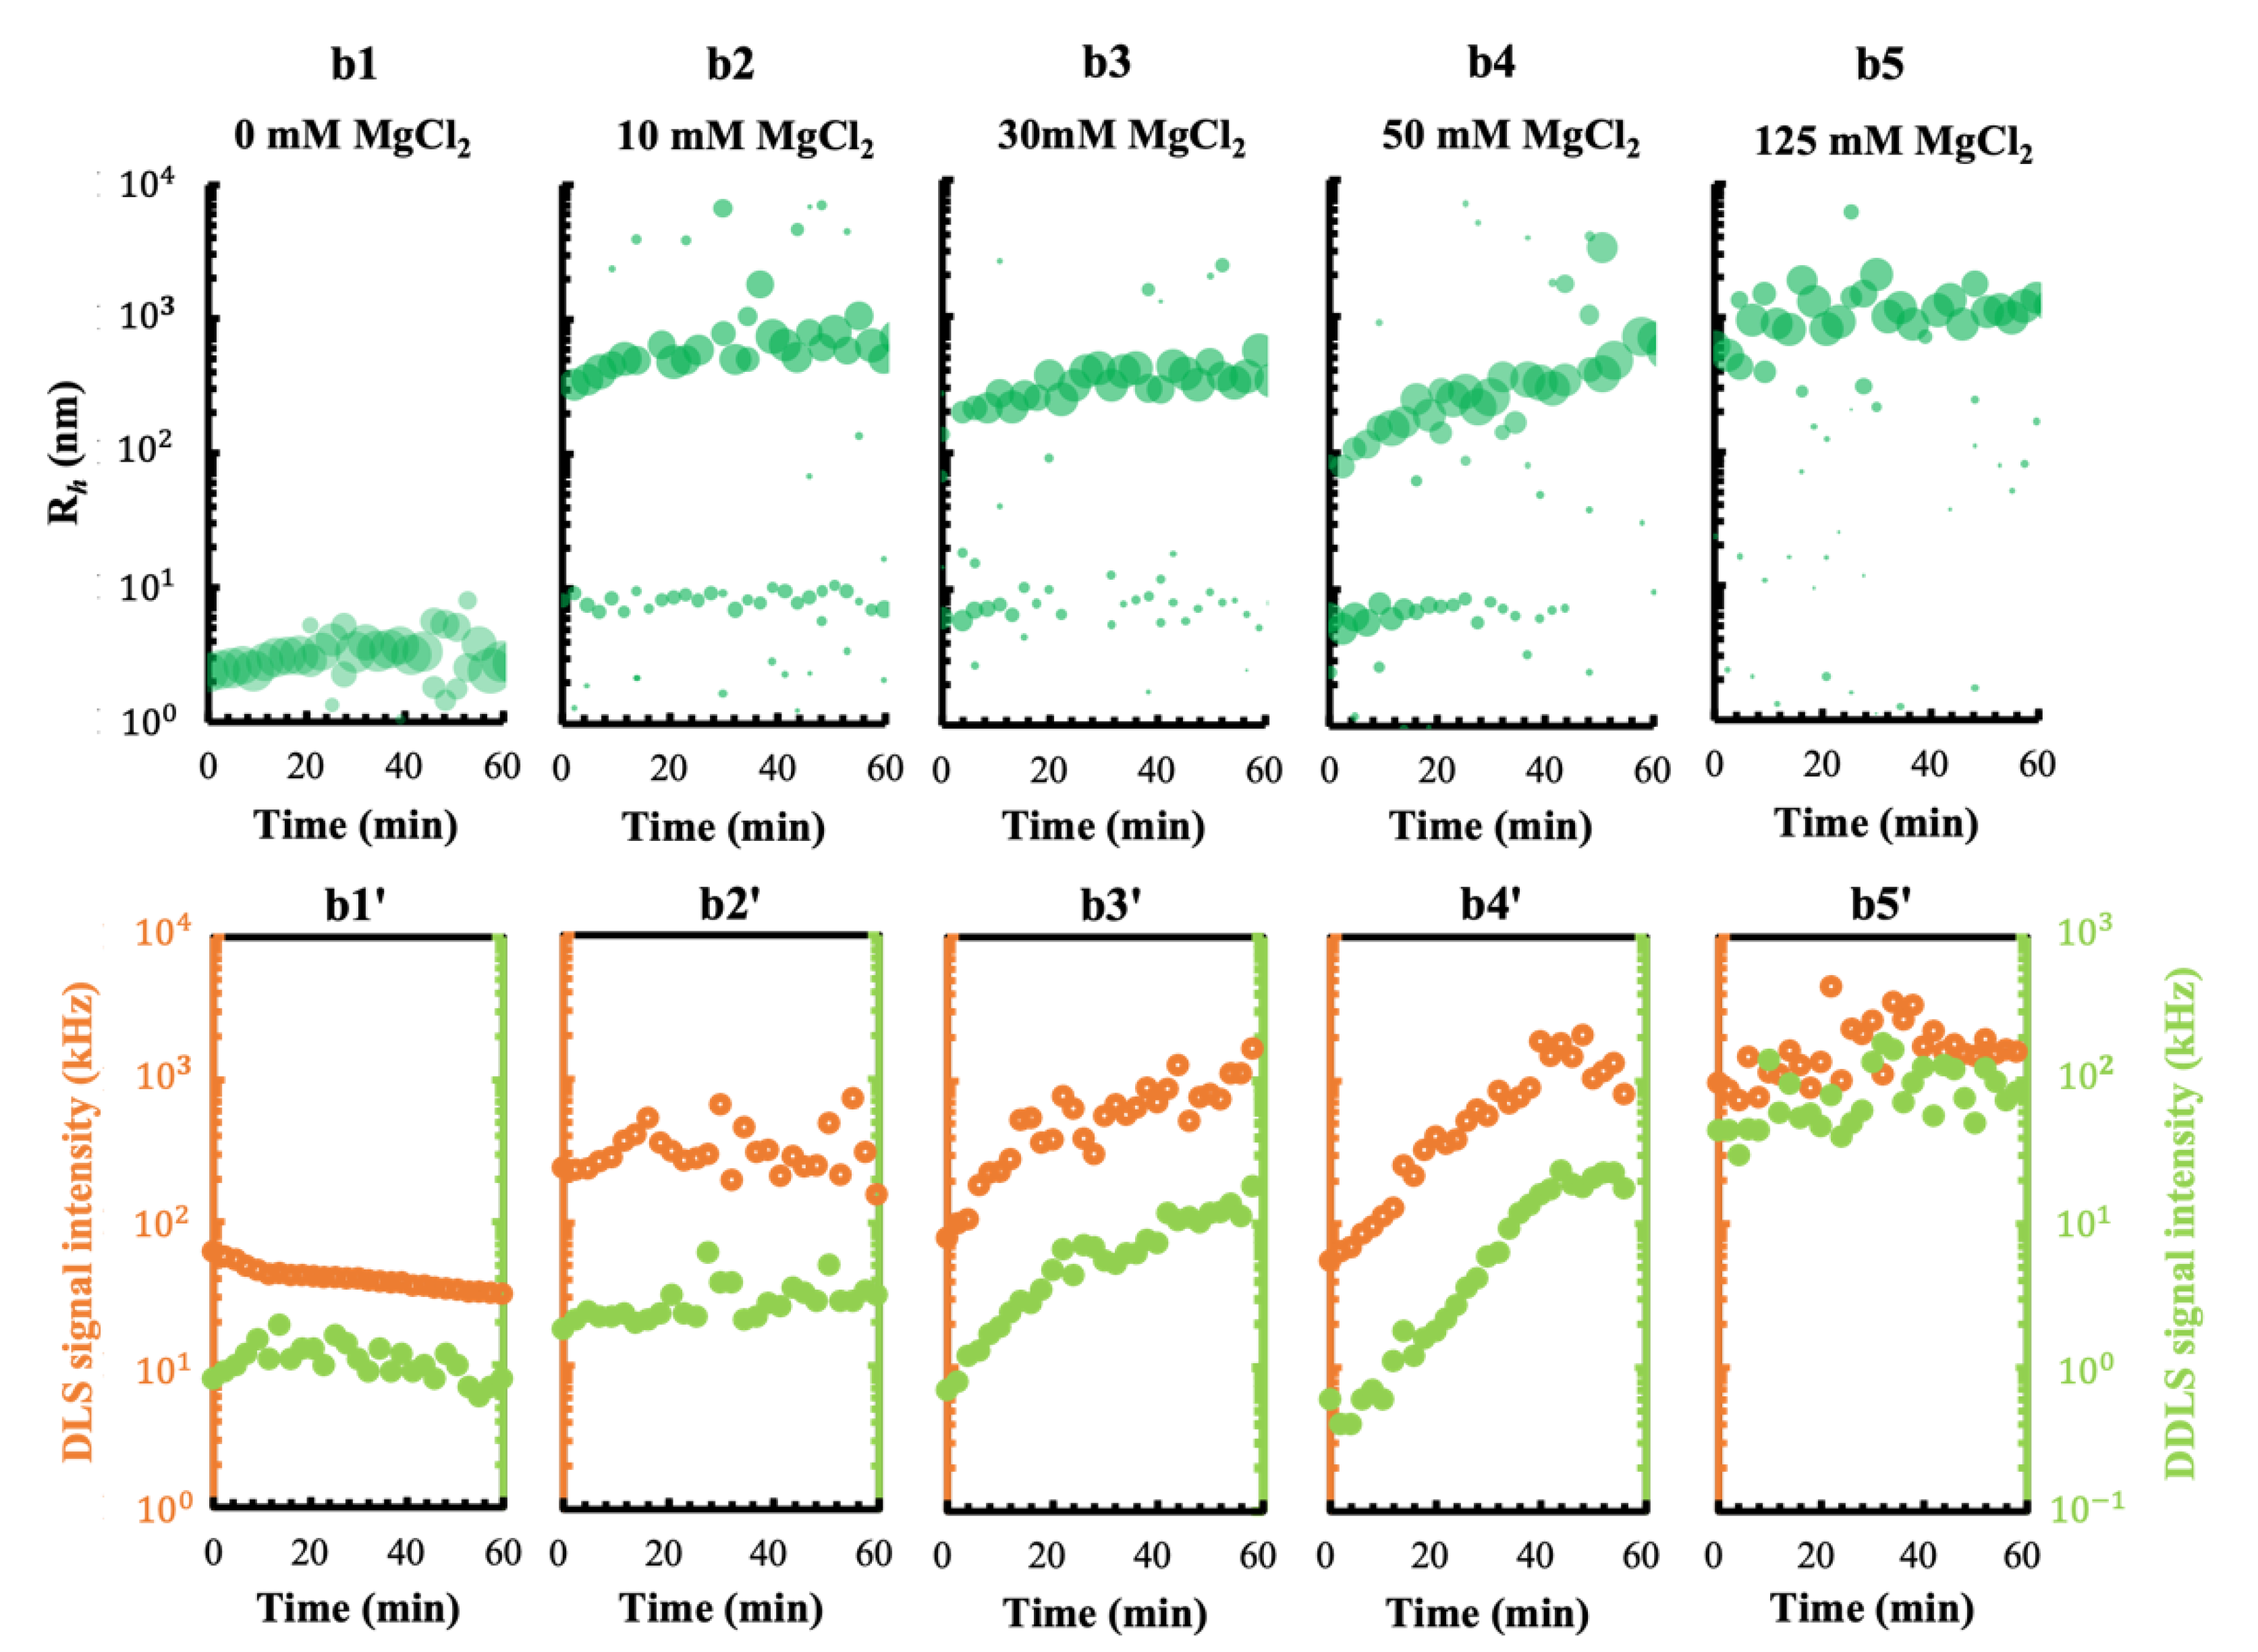
3.1. Effect of the Metal Cations Na+ and Mg2+ on Early Stage Condensing and Prenucleation Ordering of GI

To investigate GI prenucleation under the effect of different ions and ionic strength conditions, a GI solution at 2 mg/mL was mixed with 4% PEG20k acting as crowding agent in final concentration (Figure 4). The hydrodynamic radius (Rh) of tetrameric and negatively charged GI was stable during the 1-hour measurement and showed a value of approx. 3 nm (Figure 4a1), which is smaller than the reported tetrameric Rh of 4.4–5.0 nm [59,60,61], due to the hyper-diffusivity of proteins caused by the relative high repelling strength between proteins in solution at low concentrations of ions [57]. A slight fluctuation of GI Rh appeared after adding 20 mM NaCl (Figure 4a2); however, only NaCl at concentrations higher than 60 mM triggered the formation of nanoscale clusters with Rh of approx. 9 nm, which transformed along an increasing NaCl gradient towards mesoscopic clusters with initial dimensions of approx. 100 nm (Figure 4a3–a5). Clusters with larger dimensions as well an increasing clusters density were acquired applying 250 mM of NaCl, as demonstrated by the increase in the DLS signal intensity, although nonstructural ordering was detected according to the negligible increase in DDLS signal intensity within 1 h of measurement (Figure 4a5′).
The results shown in Figure 4b,b′ were obtained by adding different concentrations of MgCl2 into the mixtures of 2 mg/mL GI containing 4% PEG20k. The concentration of MgCl2 was selected based on the aim to keep the concentrations of chloride ions and cationic net valency the same as in the NaCl+GI assays (Figure 4a,a′). Compared with the effect of NaCl, even 10 mM MgCl2 induced the formation of nanoscale clusters with approx. Rh of 9 nm and mesoscopic clusters with radius of approx. 300–400 nm (Figure 4b2), accompanied by a strong increase in DLS signal intensity (Figure 4b2′). Interestingly, a synchronous rise in DDLS signal intensity showing changes in structural order also occurred at MgCl2 concentrations higher than 30 mM (Figure 4b′, 30–125 mM MgCl2), indicating the simultaneous evolution of structural ordering within condensing GI particles in solutions.
To explore the mechanisms caused by the NaCl and MgCl2 ions on the GI phase behaviors shown above, the diffusion interaction parameter KD of GI solutions in the corresponding gradients of NaCl (Figure 5c) and MgCl2 (Figure 5d) was measured subsequently. As an indicator of non-specific protein–protein interactions, positive KD values indicate repulsive intermolecular interactions, while negative values denote attractive interactions. The decreased KD value in Figure 5c (black crosses) demonstrated that an increasing NaCl concentration diminished the repulsive forces between negatively charged GI particles in solution. However, the divalent cation Mg2+ caused even stronger effects and obviously promoted more intermolecular interactions between GI molecules, and the KD values of GI were reduced more sharply in the concentration range of 0 to 50 mM Mg2+ (black crosses in Figure 5d) compared to those of Na+ ions in the concentration range of 0 to 100 mM (black crosses in Figure 5c). The positive KD values of GI at MgCl2 concentrations above 50 mM are higher than those of GI with MgCl2 at concentrations below 50 mM. In parallel, polydisperse R h values indicate the formation of aggregates at MgCl2 concentrations higher than 50 mM (red dots in Figure 5d), which were also accompanied by the presence of multiple decay steps of the corresponding ACF, as shown in Figure 5b. Therefore, the obtained KD values of GI in the presence of MgCl2 at concentrations above 50 mM probably do not reveal the real situation of protein interactions. These results correlate with the order of cations in the Hofmeister series—Na+ is in a higher order in the cation series than Mg2+ to enhance the ‘salting in’ effect and the solubility of protein at lower ionic strengths, while the ‘salting out’ effect appeared and caused the aggregation of the protein at a high concentration of Mg2+ [62]. It is worth pointing out that the subtle decline in GI R h with decreasing concentrations of 100 to 0 mM NaCl (red dots in Figure 5c) and 50 to 0 mM MgCl2 (red dots in Figure 5d) can be considered as a result of the hyper-diffusivity of the protein at low ionic strength, which is used to calculate R h based on Equation (1).

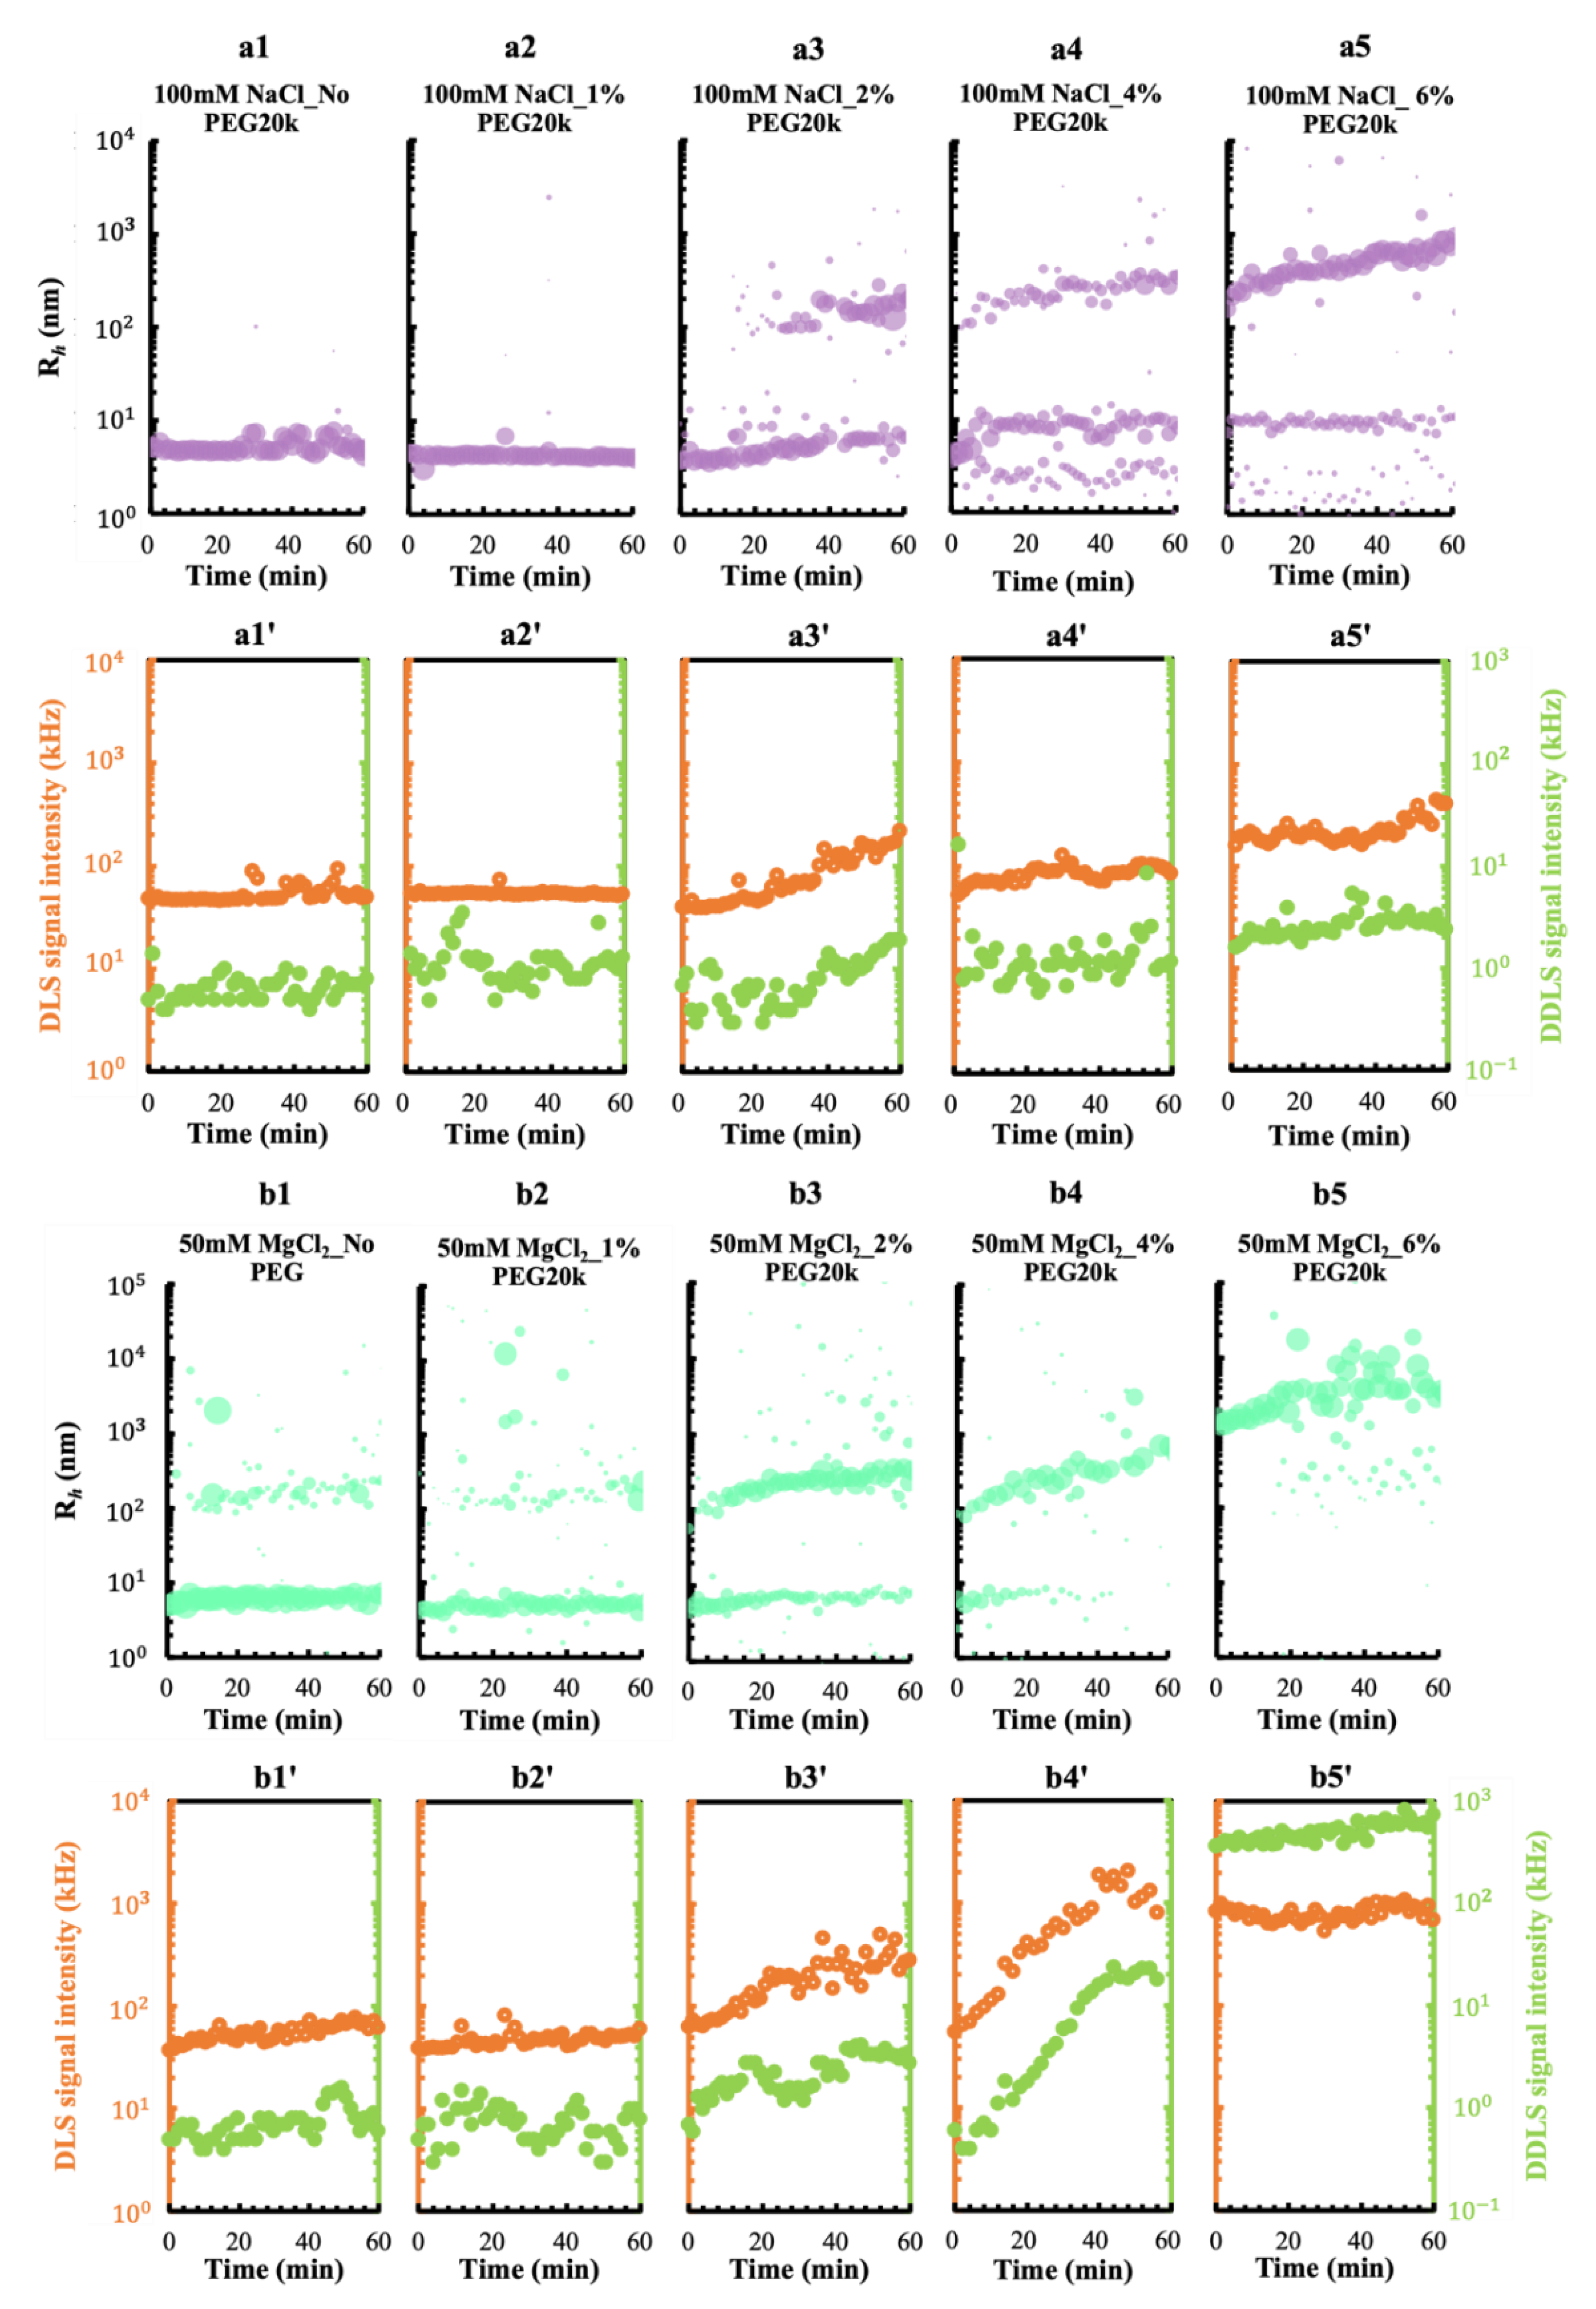
3.2. Effect of a Crowding Agent on Condensing and Prenucleation Ordering of GI

In a crowded environment, proteins are subjected to an entropic penalty if they form a large co-volume with impenetrable crowders, which occupy the solvent space and reduce the volume accessible to the protein [63]. How does volume exclusion affect the protein nucleation considering condensing and ordering? Here, we tried to answer this question by monitoring the phase behaviors of GI mixed with varying concentrations of PEG20k applying DLS/DDLS. Based on the results shown in Figure 4 and Figure 5, the 10 mM MES pH 6.5, 1 mM DTT buffer was prepared by (i) adding 100 mM NaCl and (ii) adding 50 mM MgCl2 to investigate the effect of varying PEG20k concentrations on GI phase behavior in different ionic systems. It is very noticeable, as shown in Figure 6a, that the condensation of GI in solutions with 100 mM NaCl was promoted gradually with the rise in PEG20k concentration from 0 to 6%, but no obvious structural ordering was detected as the DDLS signal intensities remained lower than 5 kHz, as shown in Figure 6a′.
However, evident structural ordering was observed in parallel with GI condensing under the effect of 4% and 6% PEG20k in the presence of 50 mM MgCl2 (Figure 6b4,b4′ and b5,b5′). The highest DDLS intensities of approx. 360 kHz were detected from the beginning onwards after mixing GI with 6% PEG20K, indicating a simultaneous trigger of condensing and structural ordering within the GI particles. Furthermore, 6% PEG 20k induced a different evolution pattern of R h , from which no nanoscale or mesoscopic (10–1000 nm) clusters were detected at the beginning of the mixing; however, after 15 min, a minor population of mesoscopic clusters approx. 200–400 nm in size occurred (Figure 6b5), and may represent the existence of a re-arranging nucleation mechanism leading to the re-directing and re-ordering of MOCs within the clusters during the nucleation process. This re-arranging nucleation mechanism was also confirmed by the increase in the corresponding DDLS signal intensities from 400 kHz to 700 kHz during the last 45 min of the measurement (Figure 6b5′). The slight drop in DLS signal intensities shown in Figure 6b4′,b5′ can be considered to be caused by the sedimentation of larger particles.

3.3. Effect of a pEF on the Crystallization Process of GI under Different Ionic and Crowding Conditions

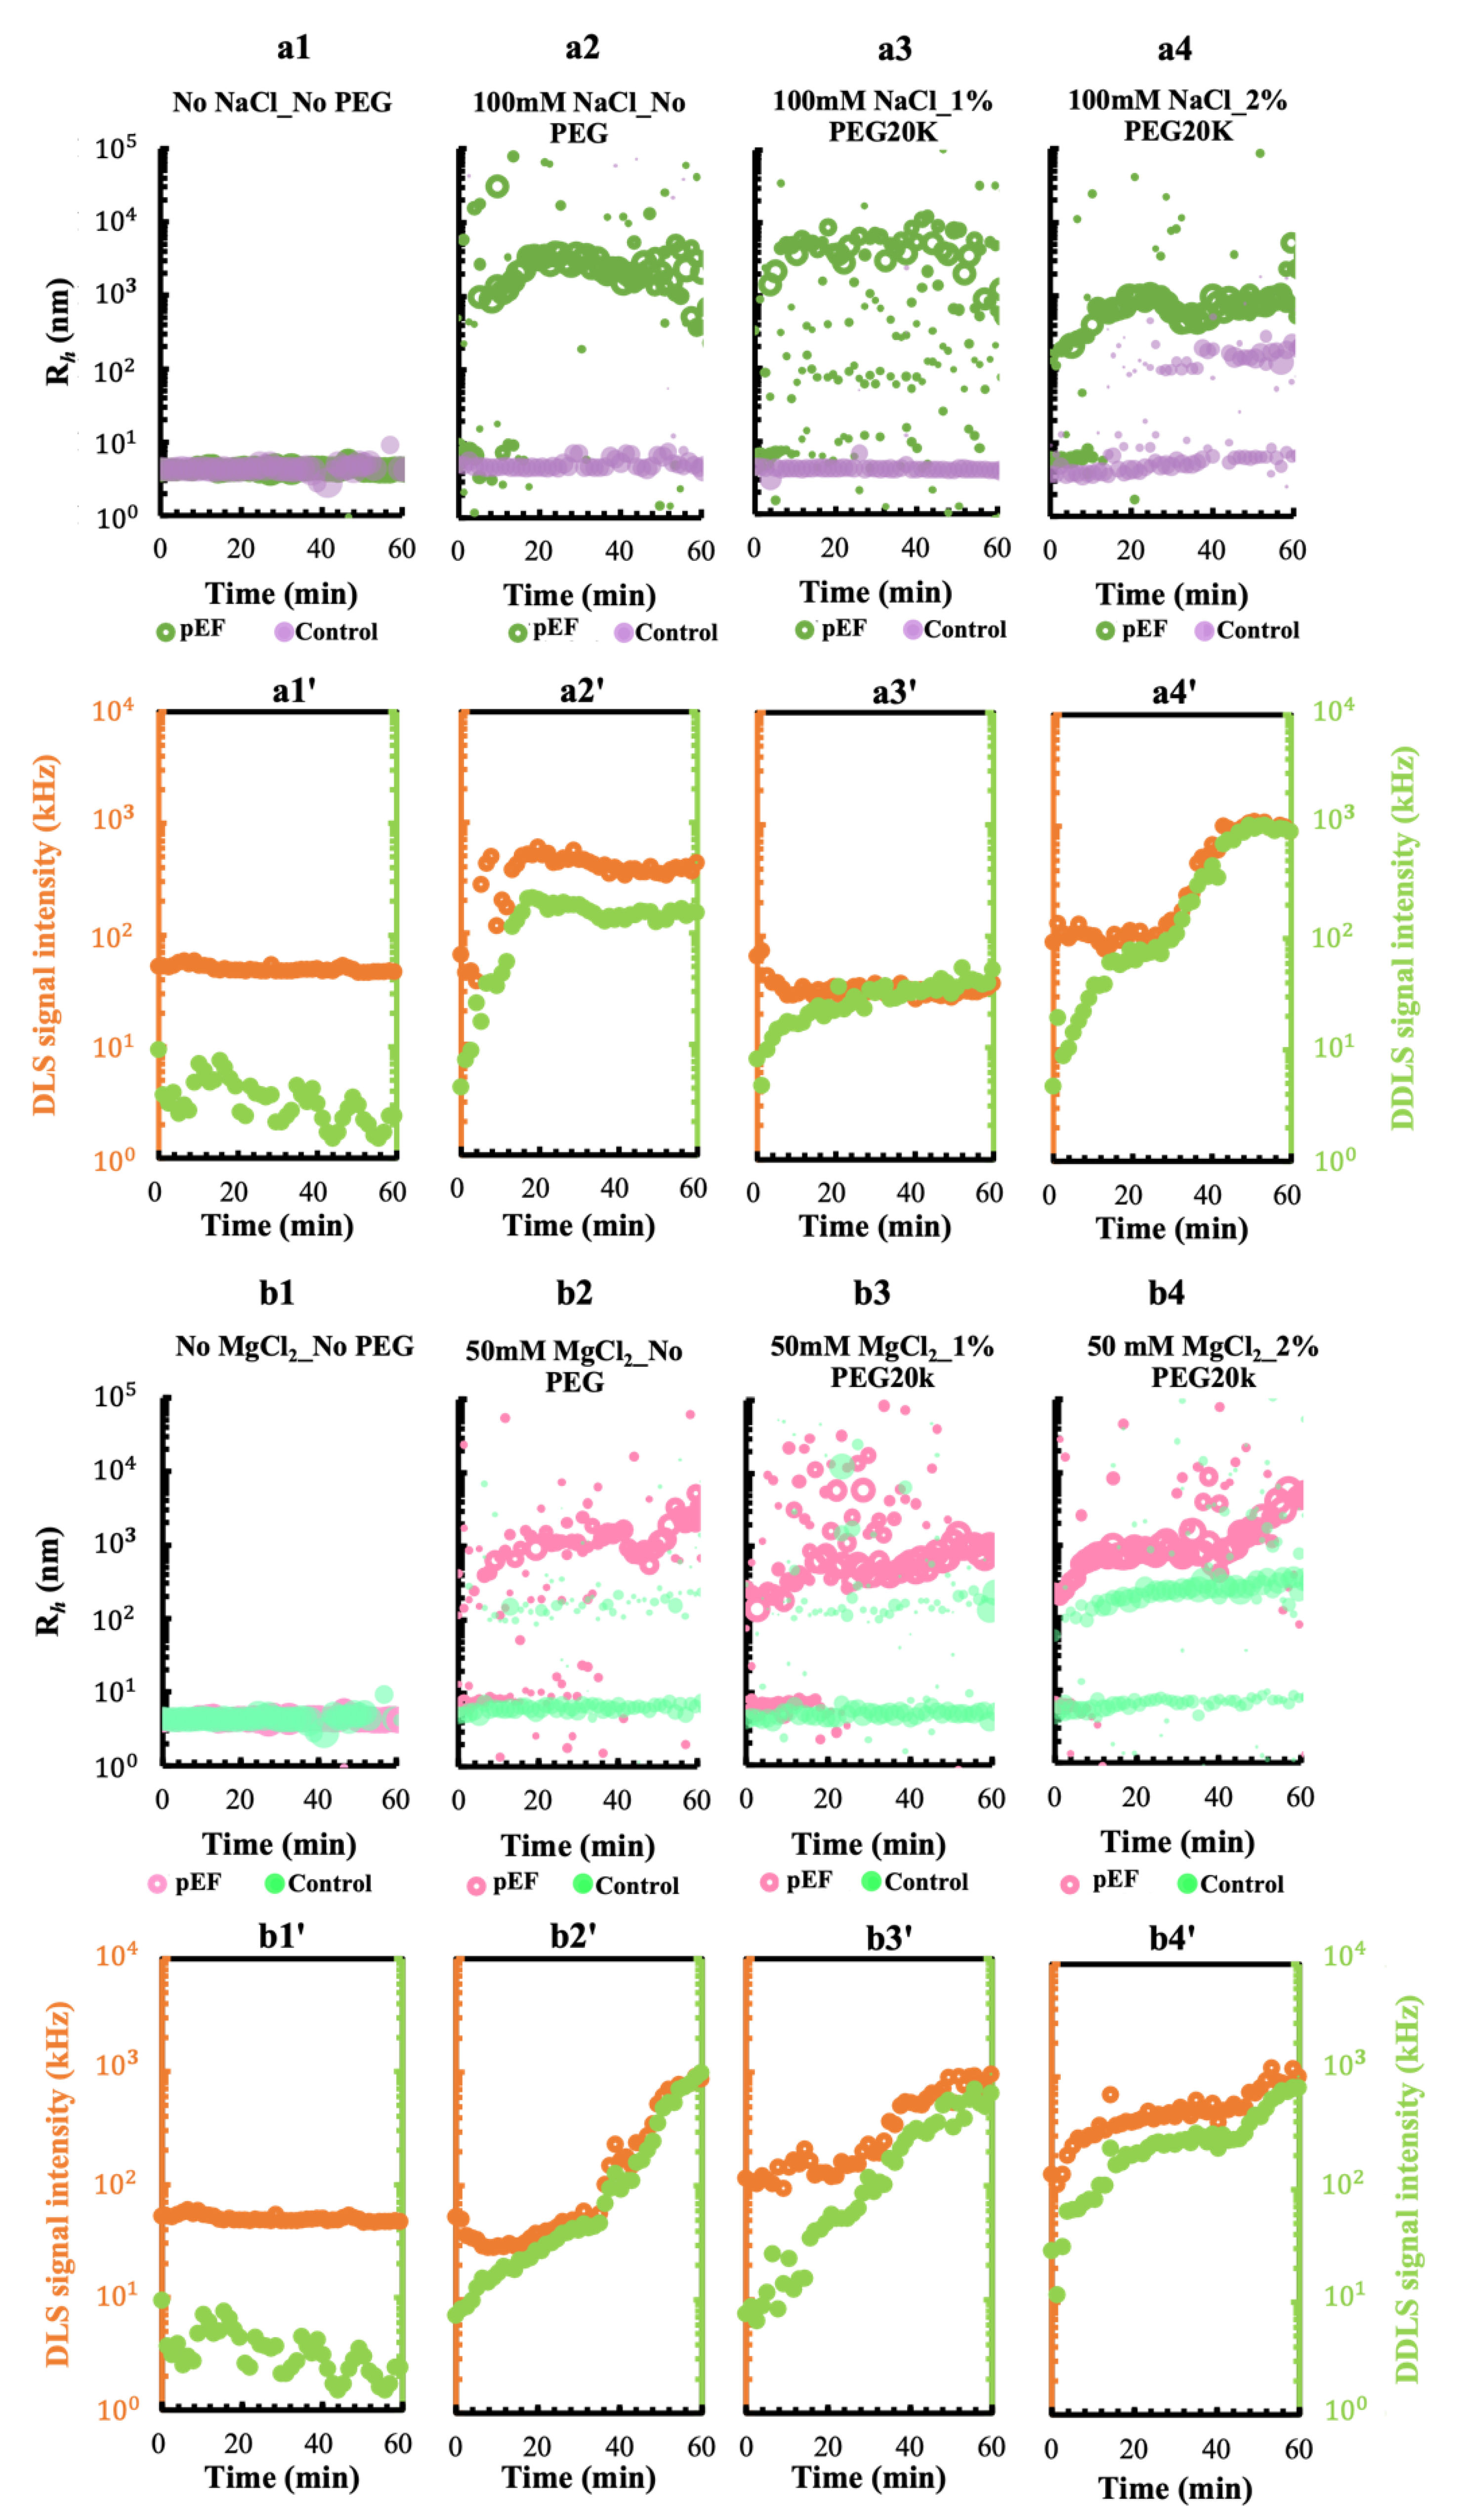
3.3.1. A pEF Modulate the Early Stage of Condensing and Prenucleation Ordering of GI

In a previous work, the effect of the pulsed electric field (pEF) on protein phase separation applying five different waveforms was investigated and demonstrated a gradient pulsed waveform (W4) can support the growth of liquid dense clusters and microcrystals with homogeneous dimensions and morphology [52]. In terms of the investigations, the identical setup with waveform 4 was applied to 2 mg/mL GI solutions containing varied ionic strength and PEG20k. The Rh evolution and DLS/DDLS signal intensities of GI in conditions without a pEF (control groups) are shown in Figure 6, but the Rh of each control group is plotted together with the Rh of the corresponding pEF group in Figure 7a1–a4,b1–b4, allowing direct comparison. For DLS and DDLS signal intensities, only the pEF groups of all conditions are shown in Figure 7a1′–a4′ and b1′–b4′, respectively.
Obviously, pEF had less or no functionality in the absence of ions, visualized by the overlap of GI Rh values between the control group (without pEF) and the pEF group (Figure 7a1). In the presence of 100 mM NaCl, the size evolution of GI with the application of pEF showed a similar pattern in Figure 7a2,a3; however, the detected DLS/DDLS intensities of GI with 1% PEG20k (Figure 7a3′) was much smaller than that of GI in both conditions without PEG (Figure 7a2′) and with 2% PEG20k (Figure 7a4′) under pEF conditions. This is because 1% PEG20k was too low to initiate GI condensation according to the size distribution in the control group of GI with 1% PEG20k (purple bubbles in Figure 7a3), although it can slow down the motion of molecules in the solution [64]. Conversely, the formation of mesoscopic GI clusters was initiated in 20 min when PEG20k reached a concentration of 2% in the solution (purple bubbles in Figure 7a4) and was accelerated after applying a pEF (green circles in Figure 7a4), the structural ordering within mesoscopic clusters was significantly induced by the pEF, indicated by a substantial rise in the DDLS signal intensities, up to 1000 kHz (Figure 7a4′). Interestingly, based on the time at which the DLS and DDLS signal intensities rose, a simultaneous development of condensing and three-dimensional ordering was stimulated by the pEF in a GI solution without PEG (Figure 7a2′); however, an ordering prior to a condensing process occurred in a GI solution containing 1% or 2% PEG20k under the effect of pEF (Figure 7a3′,a4′).
The applied pEF was shown to be more effective when Mg2+ ions were present in the solution analyzed. The kinetic evolution of GI showed similar clustering patterns in a solution of 50 mM MgCl2 without PEG20k (Figure 7b2) and a solution with 100 mM NaCl and 2% PEG20k (Figure 7a4). In both mixing conditions, GI tetramers were consumed while particles of approx. 1 µm were formed. Additionally, the DLS/DDLS signal intensities showed the same level of anisotropy, which may suggest that in the case of GI crystallization, a crowding agent in the crystallization solution can be replaced by a combination of applying Mg2+ ions and pEF. The addition of Mg2+ ions and PEG20k from 1% up to 2% and exposing the solution to a pEF triggered a similarly evolving pattern of size over time (Figure 7b2–b4); however, a high concentration of PEG20k accelerated the condensing and structural ordering process of GI under pEF according to the growth of DLS and DDLS signal intensities (Figure 7b2′–b4′), leading us to believe that a critical density of mesoscopic intermediates shall be reached for the nucleation, corresponding to 100 kHz of DLS signal, and may indicate the metastability of mesoscopic intermediates with respect to the crystalline phase.

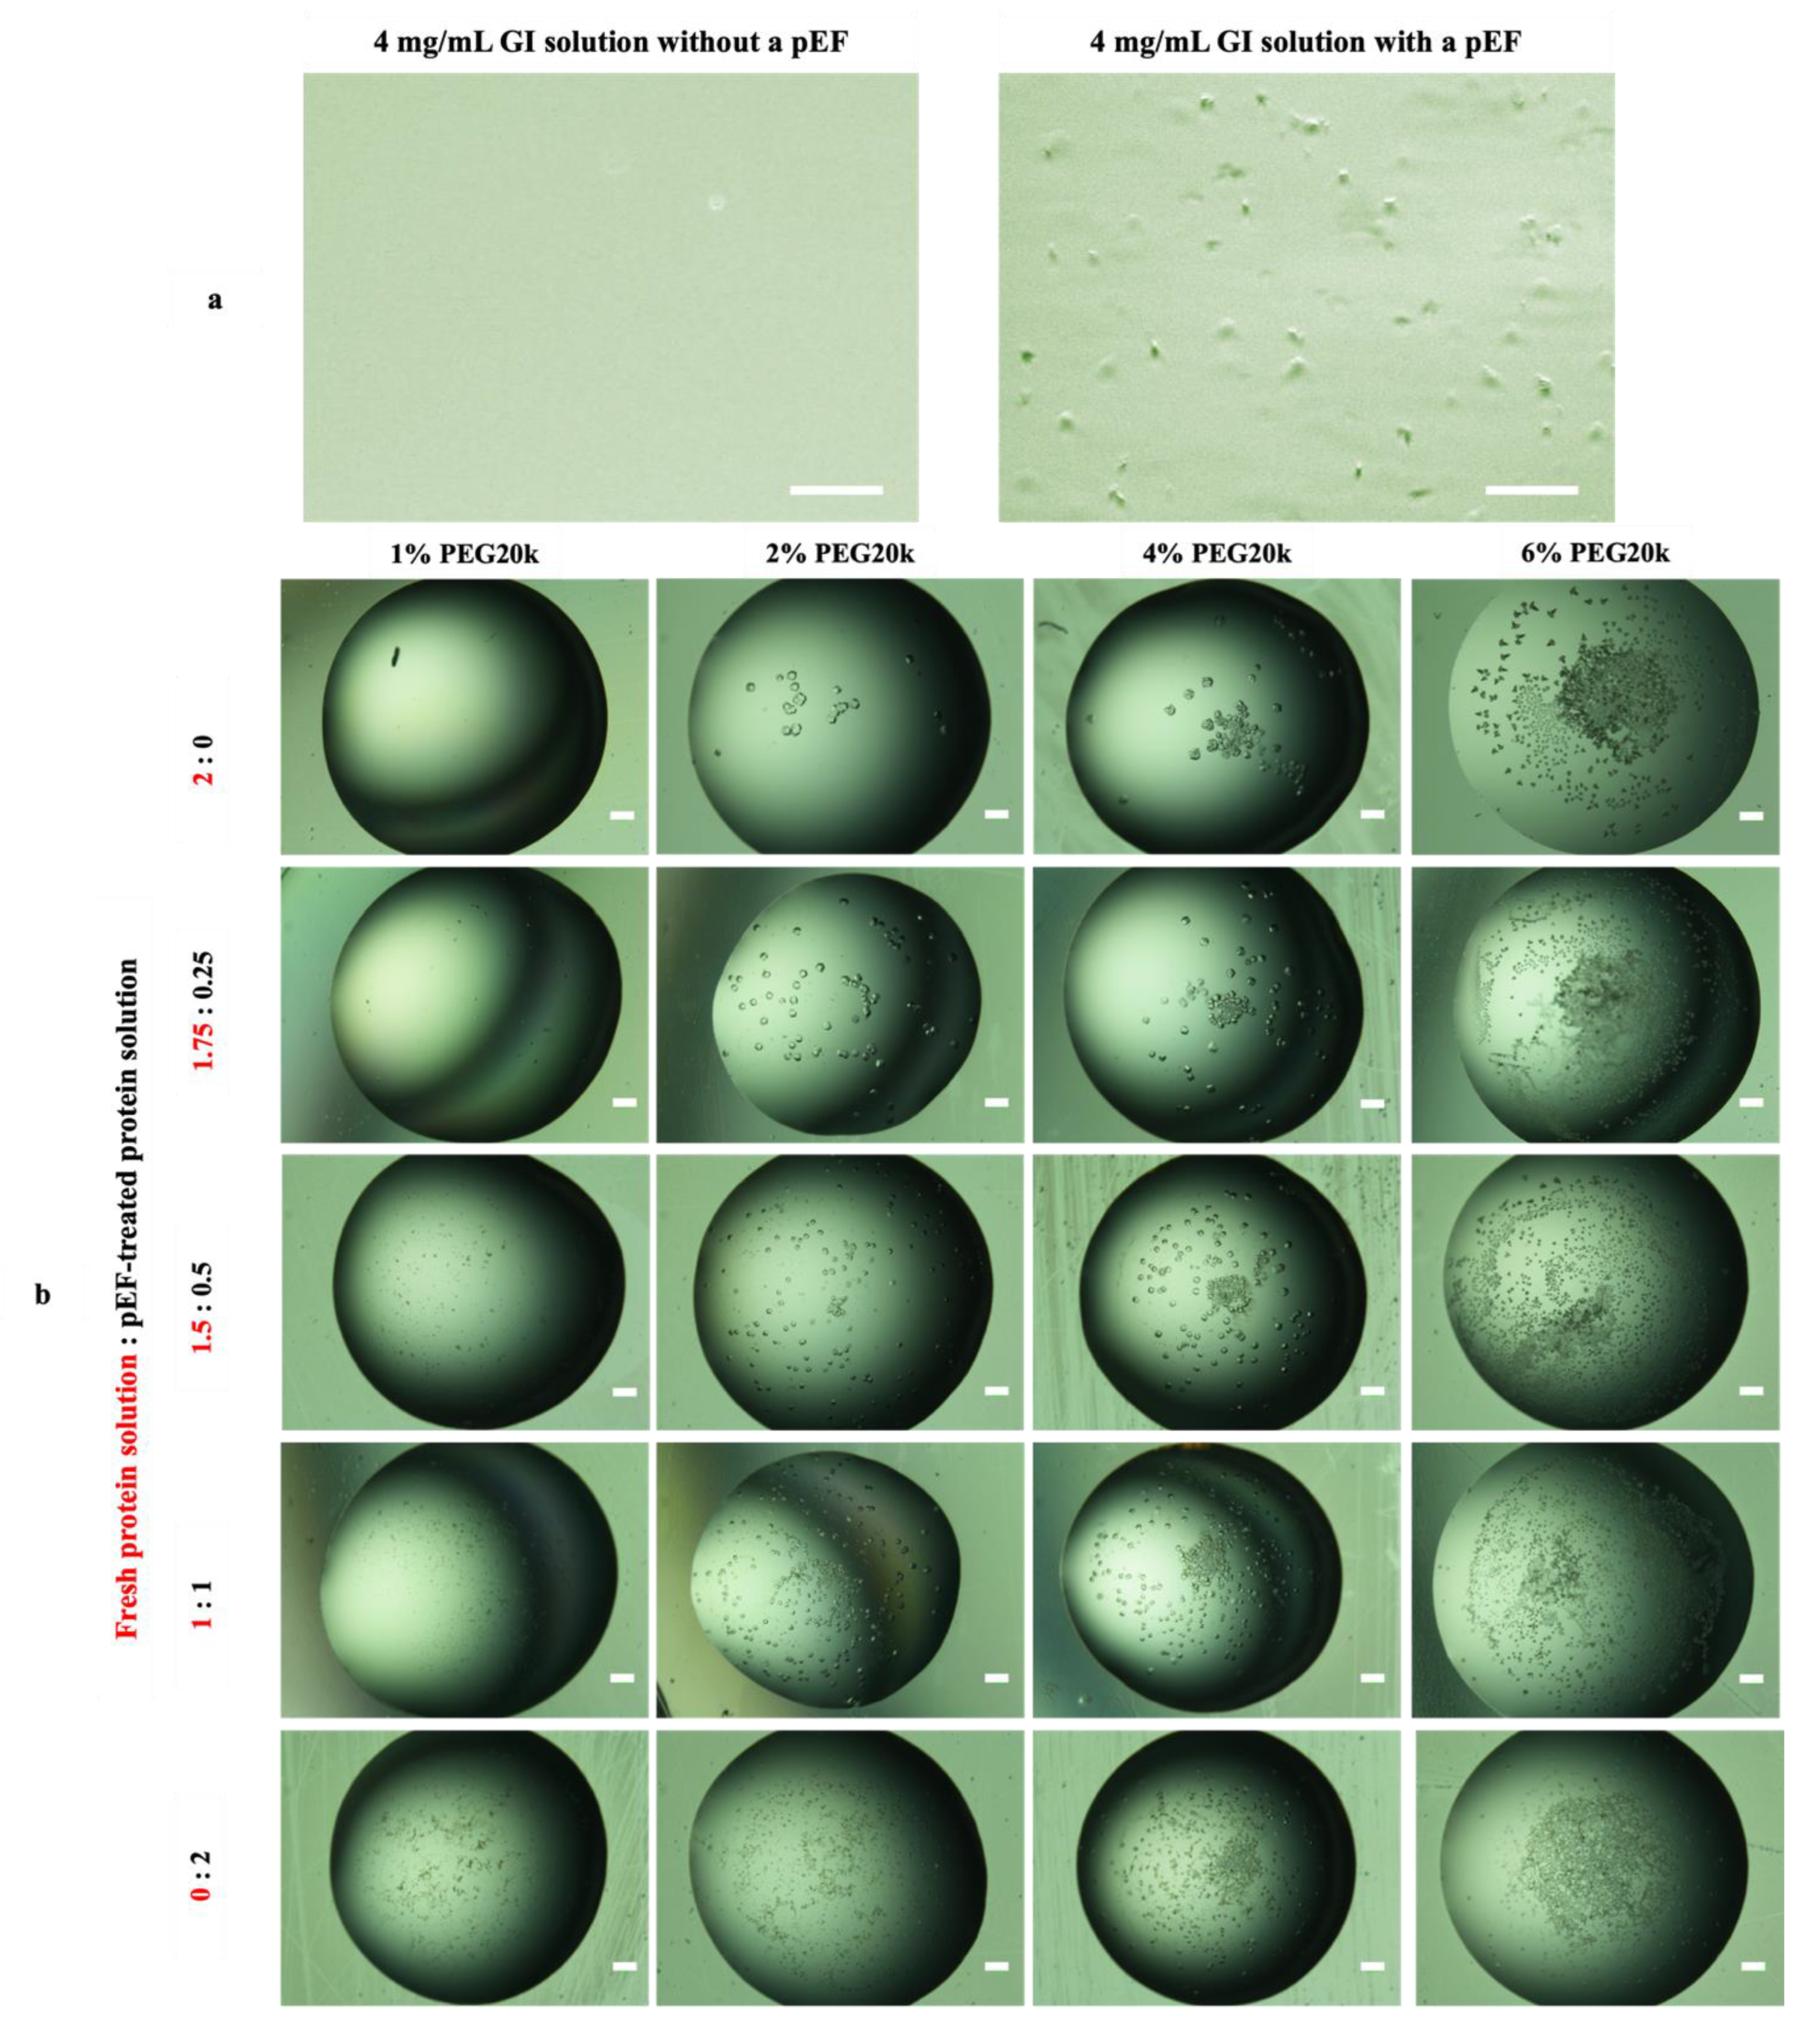
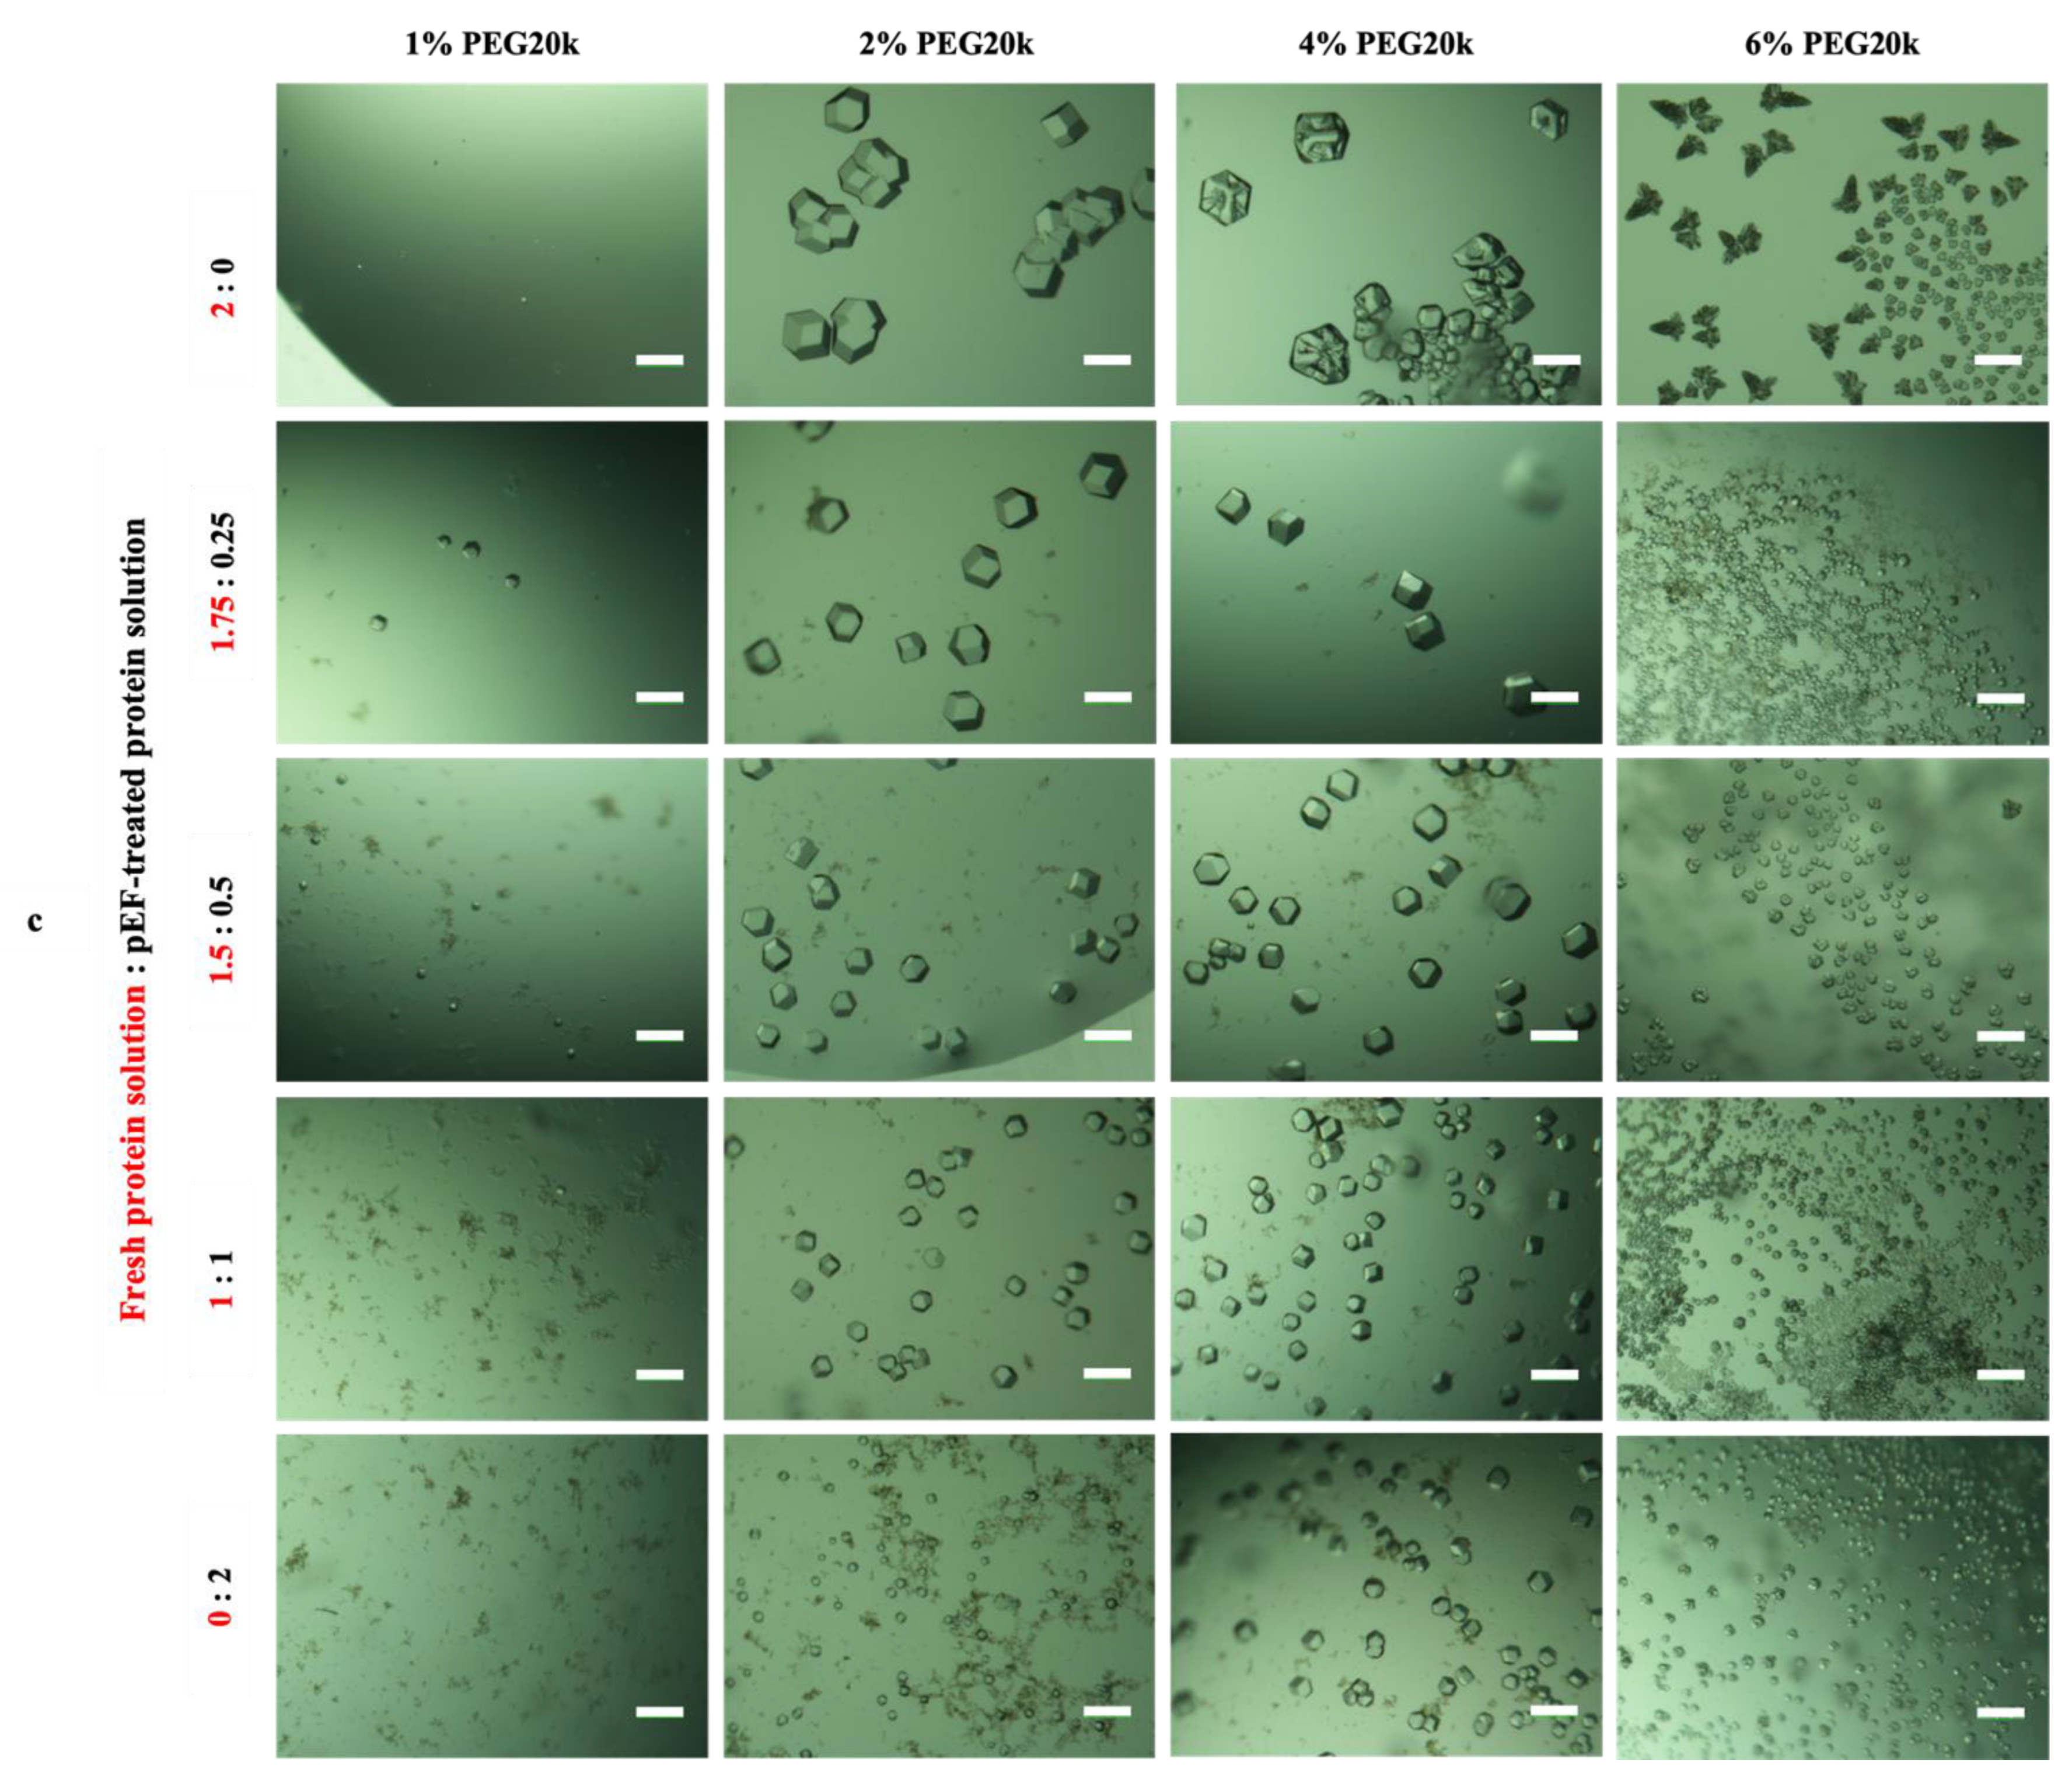
3.3.2. Effect of Mesoscopic Ordered Clusters (MOCs) Induced by a pEF on GI Crystallization

To explore the effect of mesoscopic ordered clusters (MOCs) in a crystallization process, we applied MOCs previously produced by a pEF in a quartz cuvette (right image in Figure 8a) by adding them into the crystallization droplets of GI. As shown in Figure 3, crystallization droplets were prepared by mixing 2 µL of the 4 mg/mL GI solution containing different volume ratios of MOCs, which served as crystallization seeds, and 2 µL of varying concentrations of PEG20k. Then, the droplets were compared considering aspects such as the number of crystals, crystal dimensions and morphology after 24-hour incubation at 20 °C. Interestingly, the results show that the number of obtained crystals increased (Figure 8b) but their size reduced (Figure 8c) after adding increased ratios (v/v) of MOCs in the droplet, keeping the PEG20k concentration constant. The crystal size and morphology in each droplet were kept homogenous for droplets where MOCs were placed prior to crystallization, compared to those where crystallization was performed without MOCs. This result is consistent with the assumption that increasing the number of structural ordered MOCs provided more crystallization nuclei in a droplet, and thus resulted in more crystals. However, the amount of protein molecules in a droplet is limited, and more nuclei serving as crystallization centers results in crystals with smaller dimensions. Moreover, the addition of MOCs enhanced the crystallization rate at a low concentration of PEG20k (Figure 8c, 1% PEG20k), and more crystals with homogeneous size and shape were obtained compared to the crystals formed without MOCs (Figure 8c, 4% PEG20k).

3.4. Effect of a pEF on Crystallizing the Pdx Complex from S. aureus

Large biological protein complexes, as the Pdx complex, are most of the time challenging to crystallize [43,51], thus are interesting targets to identify crystallization methods to overcome the bottleneck. Therefore, the prenucleation mechanism of a recombinant complex protein from S. aureus, Pdx1/Pdx2H165N (Pdx), applying the influence of a pEF was investigated to verify the general principle of the pEF to promote the biomolecular crystallization process.

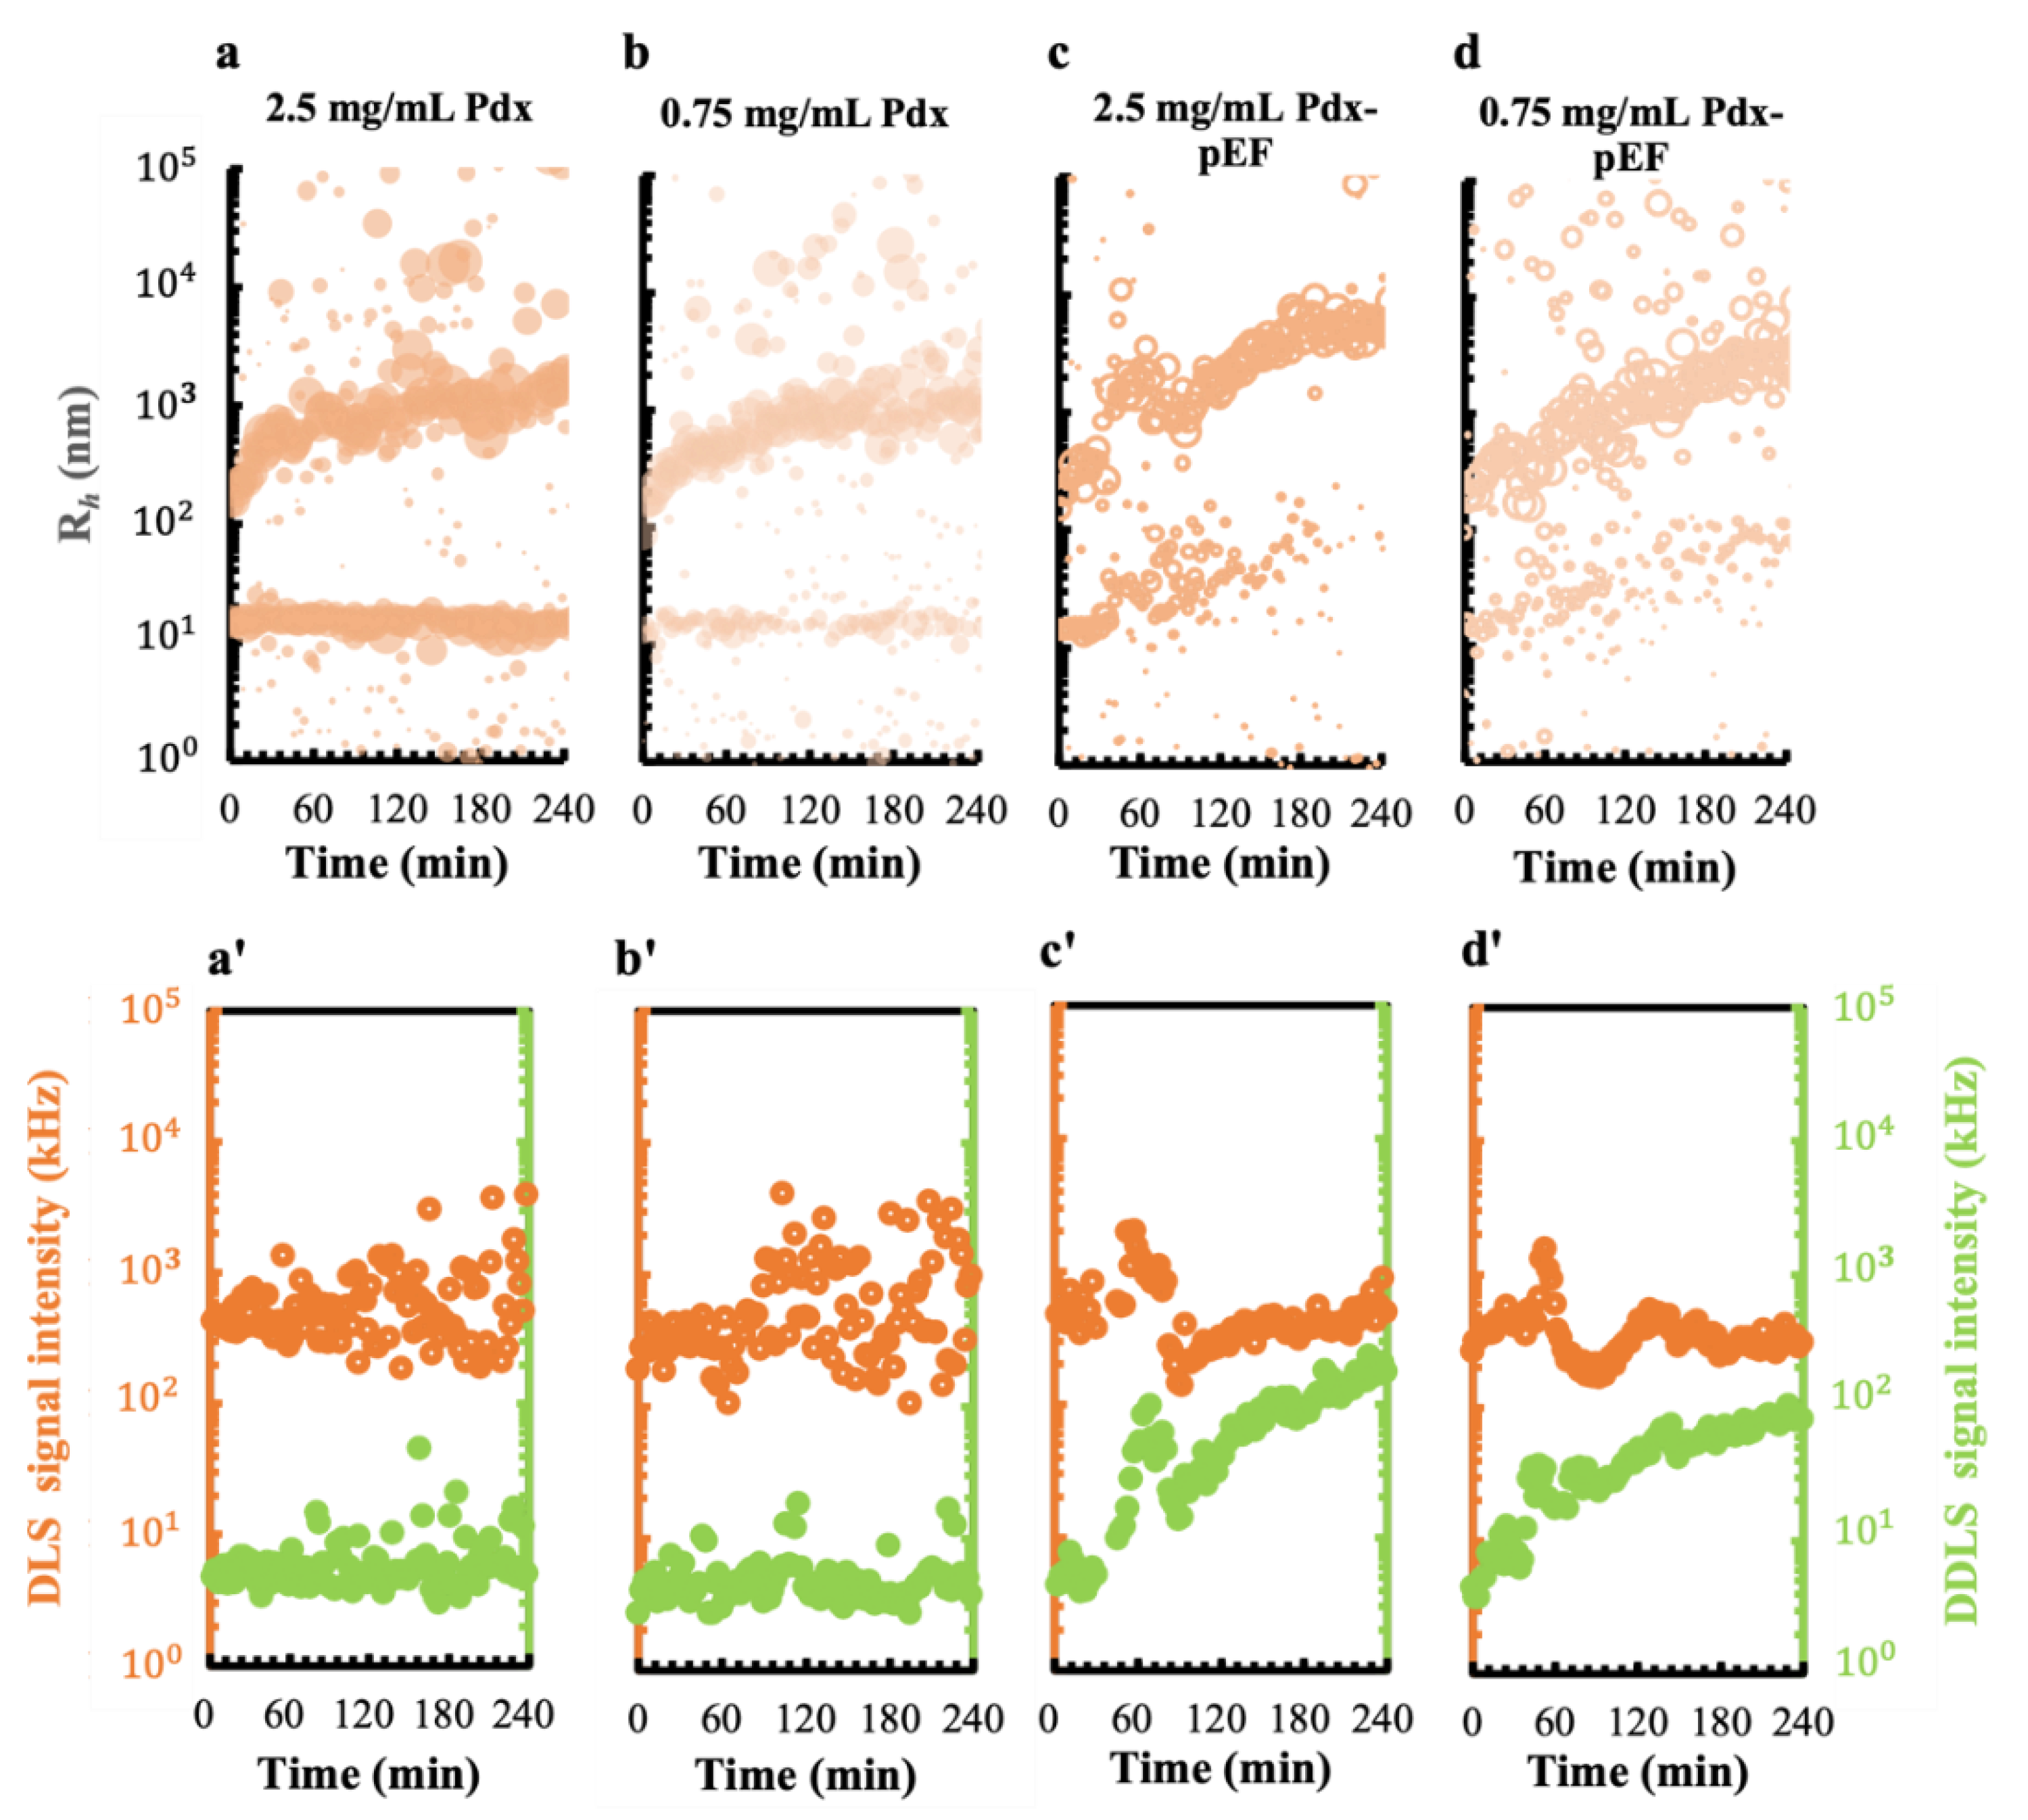
3.4.1. pEFs Promote the Early-Stage Ordering of Pdx Complex Nucleation

In crystallization screening experiments, crystals of the complex were obtained from a solution of 2.5 mg/mL Pdx with 5% PEG4000 after incubation of 2–5 days. The early stages of the crystallization process were monitored in the first 4 h via DLS/DDLS with and without the application of a pEF. To understand the effect of the pEF on the early-stage clustering of the Pdx complex, a Pdx crystallization concentration of 2.5 mg/mL as well as a lower concentration of 0.75 mg/mL were assessed. The Pdx complex showed a similar growth profile in terms of size evolution and density ordering at both concentrations without the application of a pEF (Figure 9a,b,a′,b′). The fraction with Rh of approx. 15 nm showed a single particle population of the Pdx complex as shown in Figure 1b. The mesoscopic clusters with an initial Rh of approx. 100 nm displayed a progressive growth (Figure 9a,b) accompanied with the rise of DLS (orange circles in Figure 9a′,b′) but not DDLS (green dots in Figure 9a′,b′) signal intensities in the first 2 h at both concentrations without the application of pEFs, indicating a condensing process of Pdx clusters without internal structural ordering within the first 4 h of the crystallization process.
The size development of Pdx mesoscopic clusters with an initial Rh of 100 nm at both protein concentrations exposed to a pEF (Figure 9c,d) showed comparable patterns with those of their corresponding control groups shown in Figure 9a,b. However, the single particle fraction of Pdx was growing steadily from approx. 15 nm to 100 nm in 4 h under the influence of the pEF (Figure 9c,d). The DDLS signal intensities fluctuated in the range of 4–20 kHz, despite the clusters growing in both control groups at 2.5 mg/mL (Figure 9a′) and 0.75 mg/mL Pdx (Figure 9b′), but increased noticeably to 200 kHz in a Pdx solution of 2.5 mg/mL (Figure 9c′) and to 100 kHz in a Pdx solution of 0.75 mg/mL applying the pEF for 4 h (Figure 9d′), evidencing the strong effect of the pEF on promoting the nucleation process of Pdx in a pathway where Pdx molecules ordering the three-dimension structure in parallel with condensing.

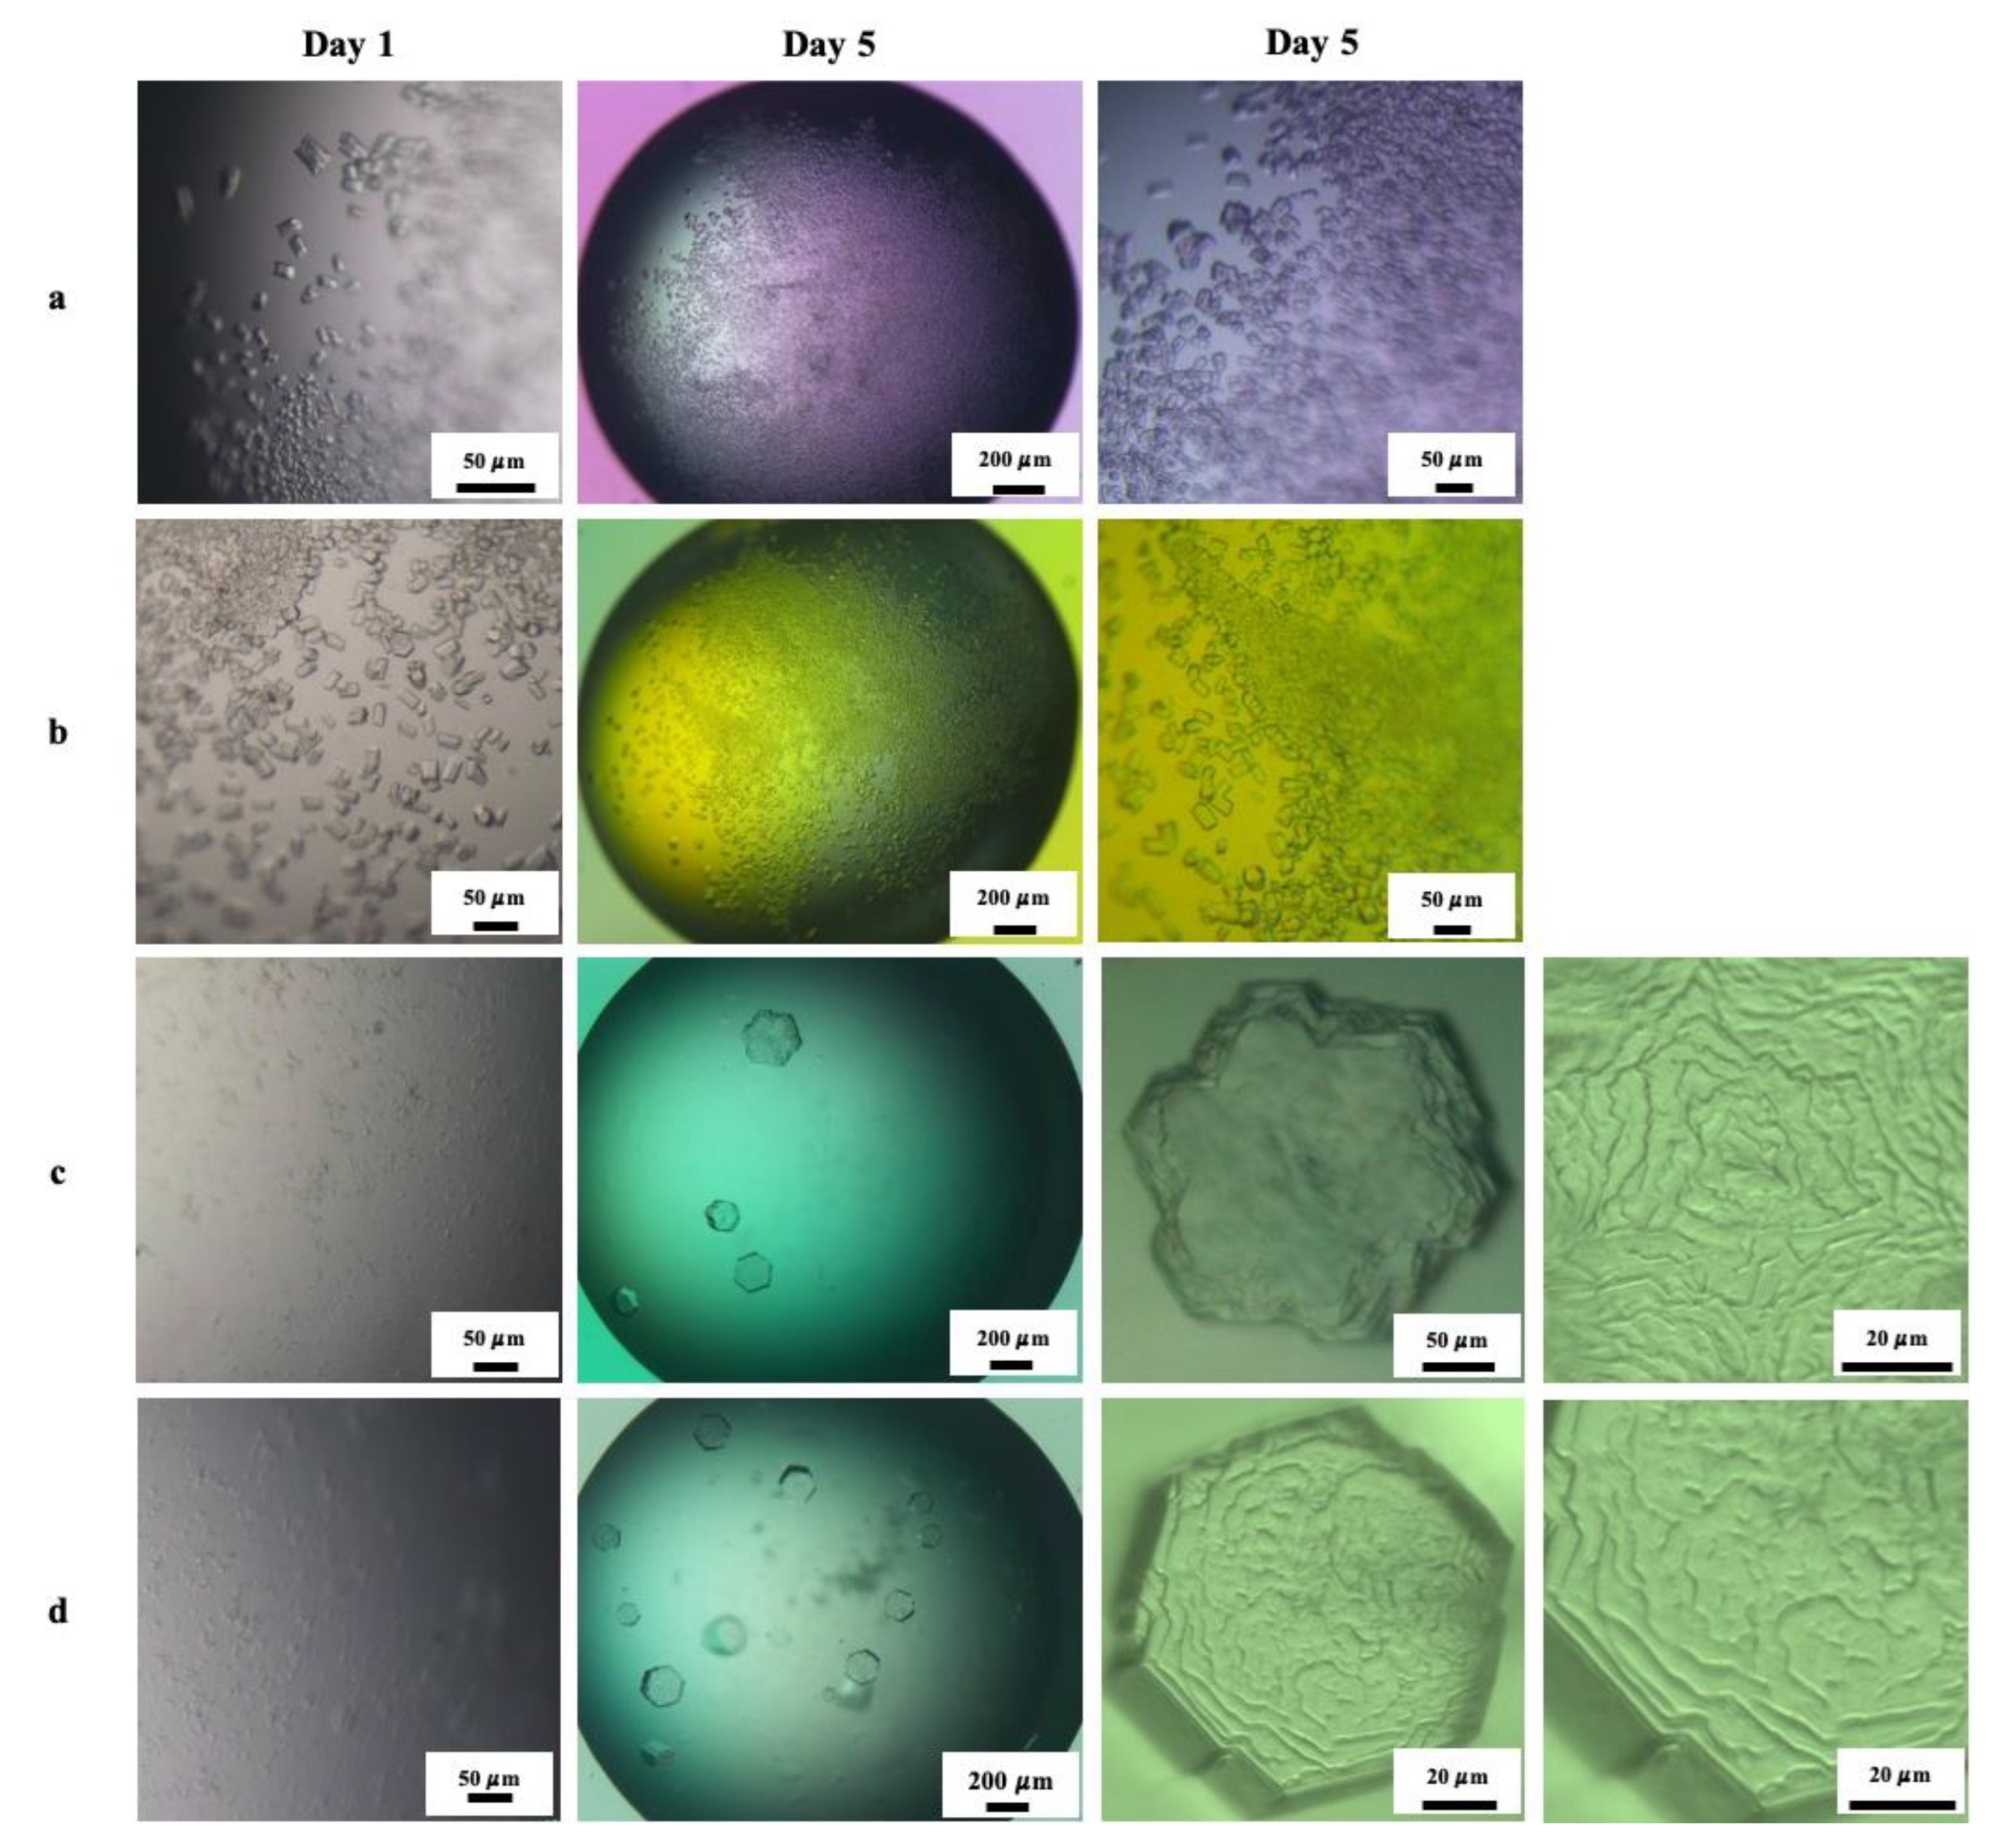
3.4.2. Effect of Mesoscopic Ordered Clusters (MOCs) Induced by a pEF on Pdx Crystallization

After monitoring the early stage of Pdx crystallization, applying the pEF for 4 h via DDLS, as shown in Figure 9c, 0.5 μL of the solution containing MOCs was taken from the cuvette and directly added as a seeding solution to the oversaturated Pdx crystallization droplets. Control droplets with the same Pdx concentration and precipitant but without the addition of MOCs were prepared and monitored in parallel. The resulting droplets of Pdx without MOCs showed numerous cubic crystals with tiny dimensions ranging from 5 up to 30 μm after 1 day (Figure 10a,b). In parallel, a different crystallization mechanism was observed in droplets prepared containing MOCs, which showed a lower number of homogeneous hexagonal crystals in droplets, compared to the control group after 1 day. Additionally, a lower number of larger crystals were observed after 5 days (Figure 10c,d). The crystals formed with MOCs are almost ten times larger than those formed without MOCs. Another interesting observation is the occurrence of three-dimensional multilayer stacks, also referred to as looped macrosteps visible on the surface of crystals formed with MOCs, as shown in Figure 10c,d. Those looped macrosteps on the crystals are probably caused by the fusion of mesoscopic liquid dense clusters with the macroscopic crystalline phase [35,65], characterizing the occurrence of a multiple-step nucleation of Pdx in the presence of a pEF.

4. Discussion

We investigated the phase and nucleation behavior of GI by monitoring time-resolved liquid phase separation, cluster formation and nucleation applying DLS/DDLS under several distinct concentrations of cations and PEG. The combined studies of the diffusion interaction parameters in solutions at different cationic conditions and the resultant phase behavior demonstrated how cationic ions and corresponding ionic strength influence protein interactions and the development of GI clusters. Positive KD values of GI at low ionic strength indicated strong repulsion between negatively charged GI molecules in solution. Changing a salt concentration in a protein solution at low ionic strength (<100 mM) can alter the electrostatic interactions between proteins [9]. The positive KD values of GI decreased continuously with increasing NaCl concentration and reached a plateau in the range of 100–250 mM NaCl (black crosses in Figure 5c), where GI proteins started to form liquid dense clusters in the presence of 4% PEG20k, as shown in Figure 4a4,a5. The plateauing of protein interaction parameters at a higher ionic strength (>100 mM) was also observed by Jordan W. Bye and Robin A [66]. For GI solutions containing MgCl2, the repulsive forces between proteins were substantially reduced at 10 mM MgCl2 (black crosses in Figure 5d), triggering the formation of mesoscopic clusters in the presence of 4% PEG20k (Figure 4b2). In an ionic strength range of 0–100 mM, KD values dropped more sharply under the effect of MgCl2 than that influenced by NaCl, indicating that the multivalent cation is more effective in interfering with protein surface charges, therefore modulating non-specific protein interactions. Moreover, Mg2+ was reported to reversibly bind and dissociate at the catalytic site of GI [67], and thereby the short-range attractive interaction between GI molecules was also enhanced with increasing Mg2+ concentration. The driving force of GI condensing can be both non-specific (diffusion interaction, volume exclusion) and specific interactions (short-range interaction) according to the development of Rh and DLS signal intensities of GI in the presence of NaCl and MgCl2 in Figure 4 and Figure 6. Nevertheless, to a certain extent, short-range interactions instead of only high-amplitude density fluctuations are necessary to promote structure ordering within GI clusters, as confirmed by the evolution of DDLS signal intensities of GI in a NaCl gradient and in a MgCl2 gradient, as shown in Figure 4 and Figure 6, under the same concentration of PEG20k. Roosen-Runge et al. proposed a model which is well known in protein crystal growth, stating that multivalent metal ions can support protein contacts and can stabilize a crystal lattice by bridging protein molecules [68], which also explains the shrinkage of initial Rh of GI mesoscopic clusters formed at 10 to 50 mM MgCl2, shown in Figure 4b, confirmed also by the increasing DDLS signal intensity, as shown in Figure 4b′. The data shown in Figure 4 and Figure 6 also prove theoretical investigations which suggested that the crystallization pathway can be altered by adjusting the proportion of the specific and nonspecific protein interactions [69,70,71]. We applied an external pulsed electric field (pEF) to study how a pEF can influence the nucleation pathway of GI in different solution conditions (varying salt and PEG). The Pdx complex of high molecular weight was employed to verify the capability of pEF to modulate the protein nucleation pathway. The results from GI show that pEFs can strongly drive the protein condensing and 3D ordering. An ‘ordering prior to condensing’ pathway was observed for GI solutions under the influence of pEFs, demonstrated by the early rise in DDLS signal intensities, as shown in Figure 7a3′,a4′ and b2′,b3′. This can be attributed to the effect of pEFs supporting the orientation of protein molecules and further nucleation. The substantial effect of pEFs promoting protein 3D ordering is particularly recognizable for Pdx solutions, which showed a comparative evolving pattern of an increasing size distribution (Figure 9a–d) accompanied by rising DLS signal intensities (orange open circles in Figure 9a′–d′), with a distinct rise in DDLS signal intensities in parallel (green bubbles in Figure 9c′,d′). Finally, the modulating effect of obtained mesoscopic ordered clusters (MOCs), induced by a pEF, on the crystallization pathway was investigated systematically for GI applying different volume ratios of MOCs and PEG concentrations. The results show that the number of crystals and crystal dimensions obtained in a droplet can be effectively affected by changing the number of MOCs added into a droplet (Figure 8). Except for enhancing the crystallization rate of GI at a low PEG concentration (Figure 8c, 1% PEG20k), MOCs can also support the crystals’ growth without crystal defects and with homogeneous size and shape for a GI solution with a high PEG concentration (Figure 8c, 4% and 6% PEG20k), probably by guiding protein molecules to attach to nuclei of pEF-induced MOCs. The universal effect of MOCs on adjusting protein crystallization was proved by applying them to the Pdx complex (Figure 10). Notably, looped multilayer stacks emerged on the surface of the Pdx crystals formed with pre-added MOCs but not on Pdx crystals formed without MOCs. This raised the following questions: which exact mechanism contributed to the crystallization pathway with the addition of pre-induced MOCs? Do the added MOCs attach to each other and consume protein molecules in one droplet, or do they attract newly formed liquid dense clusters which attach to them and re-order to form crystals? More techniques, such as the transmission electron microscope (TEM), which can monitor crystallization processes in situ and time-resolved at the nanoscale, are required to address these questions in future.

5. Conclusions

The obtained data and results from GI show that short-range attractions supported by multivalent cations are required to support protein orientation and alignment in an undersaturated solution, despite the contribution of non-specific protein interactions. The nucleation pathway of GI is adaptable to the changing proportions of specific and non-specific interactions in the system. In particular, a distinct pEF is effective in driving protein ordering and clustering in the presence of ions. The structure ordering of clusters always appeared after the condensing step of GI in the absence of short-range attractions or a pEF, indicating a two-step nucleation pathway. Conversely, an ordering prior to clustering or a synchronized increase in both parameters was observed in GI solutions with a relative high concentration of Mg2+ ions or via the application of a pEF. Here, we also report for the first time the use of mesoscopic ordered clusters (MOCs) as ‘seeds’ with homogeneous dimensions, obtained and induced by a pEF, to systematically investigate the effect of such MOCs on the crystallization process. The application of a pEF and MOCs on the Pdx complex confirmed the rather substantial effect of pEFs in accelerating the nucleation process and the role of MOCs in modulating the crystallization pathway. Compared to the traditional seeding method utilizing a suspension of crushed crystals, the production, quality and dimensions of pEF-MOCs are reproducible and controllable. In summary, the data presented show multiple pathways for crystal nucleation and growth in complex physicochemical scenarios, which so far have not been described. In particular, the method used to induce mesoscopic ordered clusters by a pEF, which act as crystallization seeds and can be applied efficiently to modify the crystallization pathway, is most innovative.

Author Contributions

All authors, M.W., A.L.C.B., H.B., C.B., as listed had made a substantial, direct, and intellectual contribution to the work. Conceptualization, M.W., H.B. and C.B.; Formal analysis, M.W. and H.B.; Funding acquisition, C.B.; Investigation, M.W. and A.L.C.B.; Methodology, M.W., A.L.C.B. and H.B.; Project administration, C.B.; Supervision, H.B. and C.B.; Validation, H.B. and C.B.; Writing—original draft, M.W. and A.L.C.B.; Writing—review & editing, M.W., A.L.C.B., H.B. and C.B. All authors have read and agreed to the published version of the manuscript.

Funding

The authors acknowledge the support of the Cluster of Excellence ‘Advanced Imaging of Matter’ of the Deutsche Forschungsgemeinschaft (DFG)—EXC 2056—project ID 390715994, and by DFG project BE1443/29-1, financial support by the China Scholarship Council—Project ID [2020]71. We also appreciate the support of the Federal Ministry of Education and Research (BMBF) via projects 05K2020, 05K19GU4, and Fundação de Amparo à Pesquisa do Estado de São Paulo (FAPESP) through grants 2015/26722-8, 2018/21213-6, 2019/26428-3.

Data Availability Statement

Not applicable.

Conflicts of Interest

The authors declare no conflict of interest.

References

  1. Volmer, M.; Weber, A. Keimbildung in übersättigten Gebilden. Z. Für Phys. Chem. 1926, 119, 277–301. [Google Scholar] [CrossRef]
  2. Li, C.; Liu, Z.; Goonetilleke, E.C.; Huang, X. Temperature-dependent kinetic pathways of heterogeneous ice nucleation competing between classical and non-classical nucleation. Nat. Commun. 2021, 12, 4954. [Google Scholar] [CrossRef] [PubMed]
  3. Zhang, F.; Gavira, J.A.; Lee, G.W.; Zahn, D. Nonclassical Nucleation—Role of Metastable Intermediate Phase in Crystal Nucleation: An Editorial Prefix. Crystals 2021, 11, 174. [Google Scholar] [CrossRef]
  4. Kashchiev, D. Classical nucleation theory approach to two-step nucleation of crystals. J. Cryst. Growth 2020, 530, 125300. [Google Scholar] [CrossRef]
  5. Jin, B.; Liu, Z.; Tang, R. Recent experimental explorations of non-classical nucleation. CrystEngComm 2020, 22, 4057–4073. [Google Scholar] [CrossRef]
  6. Brognaro, H.; Falke, S.; Mudogo, C.N.; Betzel, C. Multi-Step Concanavalin A Phase Separation and Early-Stage Nucleation Monitored Via Dynamic and Depolarized Light Scattering. Crystals 2019, 9, 620. [Google Scholar] [CrossRef] [Green Version]
  7. Van Driessche, A.E.S.; Van Gerven, N.; Bomans, P.H.H.; Joosten, R.R.M.; Friedrich, H.; Gil-Carton, D.; Sommerdijk, N.A.J.M.; Sleutel, M. Molecular nucleation mechanisms and control strategies for crystal polymorph selection. Nature 2018, 556, 89–94. [Google Scholar] [CrossRef] [Green Version]
  8. Sleutel, M.; Van Driessche, A.E.S. Nucleation of protein crystals–a nanoscopic perspective. Nanoscale 2018, 10, 12256–12267. [Google Scholar] [CrossRef]
  9. Zhang, F. Nonclassical nucleation pathways in protein crystallization. J. Physics Condens. Matter 2017, 29, 443002. [Google Scholar] [CrossRef]
  10. Sauter, A.; Roosen-Runge, F.; Zhang, F.; Lotze, G.; Jacobs, R.M.J.; Schreiber, F. Real-Time Observation of Nonclassical Protein Crystallization Kinetics. J. Am. Chem. Soc. 2015, 137, 1485–1491. [Google Scholar] [CrossRef]
  11. Prestipino, S.; Laio, A.; Tosatti, E. Systematic Improvement of Classical Nucleation Theory. Phys. Rev. Lett. 2012, 108, 225701. [Google Scholar] [CrossRef] [PubMed] [Green Version]
  12. Gebauer, D.; Cölfen, H. Prenucleation clusters and non-classical nucleation. Nano Today 2011, 6, 564–584. [Google Scholar] [CrossRef] [Green Version]
  13. Lee, J.; Yang, J.; Kwon, S.G.; Hyeon, T. Nonclassical nucleation and growth of inorganic nanoparticles. Nat. Rev. Mater. 2016, 1, 16034. [Google Scholar] [CrossRef]
  14. Ten Wolde, P.R.; Frenkel, D. Enhancement of Protein Crystal Nucleation by Critical Censity Fluctuations. Science 1997, 277, 1975–1978. [Google Scholar] [CrossRef] [Green Version]
  15. Galkin, O.; Vekilov, P.G. Control of protein crystal nucleation around the metastable liquid–liquid phase boundary. Proc. Natl. Acad. Sci. USA 2000, 97, 6277–6281. [Google Scholar] [CrossRef] [Green Version]
  16. Vekilov, P.G. Dense Liquid Precursor for the Nucleation of Ordered Solid Phases from Solution. Cryst. Growth Des. 2004, 4, 671–685. [Google Scholar] [CrossRef]
  17. Dumetz, A.C.; Chockla, A.M.; Kaler, E.W.; Lenhoff, A.M. Comparative Effects of Salt, Organic, and Polymer Precipitants on Protein Phase Behavior and Implications for Vapor Diffusion. Cryst. Growth Des. 2009, 9, 682–691. [Google Scholar] [CrossRef]
  18. Savage, J.R.; Dinsmore, A.D. Experimental Evidence for Two-Step Nucleation in Colloidal Crystallization. Phys. Rev. Lett. 2009, 102, 198302. [Google Scholar] [CrossRef]
  19. Gower, L.B.; Odom, D.J. Deposition of calcium carbonate films by a polymer-induced liquid-precursor (PILP) process. J. Cryst. Growth 2000, 210, 719–734. [Google Scholar] [CrossRef]
  20. Dai, L.; Douglas, E.P.; Gower, L.B. Compositional analysis of a polymer-induced liquid-precursor (PILP) amorphous CaCO3 phase. J. Non-Cryst. Solids 2008, 354, 1845–1854. [Google Scholar] [CrossRef]
  21. Zhu, J.; Huang, L.; Cui, M.; Ma, L.; Cao, F. A Cationic Polyelectrolyte-Controlled Liquid Mineral Precursor Process in the BaCO 3 System. Eur. J. Inorg. Chem. 2015, 2015, 1819–1826. [Google Scholar] [CrossRef]
  22. Li, Y.; Zhu, J.; Cui, M.; Wang, J.; Zha, J. Crystallization of the polymer induced liquid mineral precursor in the constraint nanopores. J. Cryst. Growth 2018, 507, 362–369. [Google Scholar] [CrossRef]
  23. Ha, T.; Kang, S. Crystallization Mechanism and Photoluminescence Properties of CaF2–Al2O3–SiO2: Eu Glass-Ceramics Based on Nano-Scale Phase Separation Phenomenon. J. Nanosci. Nanotechnol. 2020, 20, 6609–6615. [Google Scholar] [CrossRef] [PubMed]
  24. Schubert, R.; Meyer, A.; Baitan, D.; Dierks, K.; Perbandt, M.; Betzel, C. Real-Time Observation of Protein Dense Liquid Cluster Evolution during Nucleation in Protein Crystallization. Cryst. Growth Des. 2017, 17, 954–958. [Google Scholar] [CrossRef] [Green Version]
  25. Mosses, J.; Turton, D.A.; Lue, L.; Sefcik, J.; Wynne, K. Crystal templating through liquid–liquid phase separation. Chem. Commun. 2015, 51, 1139–1142. [Google Scholar] [CrossRef] [Green Version]
  26. Dai, H.; Chen, L.; Zhang, B.; Si, G.; Liu, Y.J. Optically isotropic, electrically tunable liquid crystal droplet arrays formed by photopolymerization-induced phase separation. Opt. Lett. 2015, 40, 2723–2726. [Google Scholar] [CrossRef]
  27. Trilisky, E.; Gillespie, R.; Osslund, T.D.; Vunnum, S. Crystallization and liquid-liquid phase separation of monoclonal antibodies and fc-fusion proteins: Screening results. Biotechnol. Prog. 2011, 27, 1054–1067. [Google Scholar] [CrossRef]
  28. Mudogo, C.N.; Falke, S.; Brognaro, H.; Duszenko, M.; Betzel, C. Protein phase separation and determinants of in cell crystallization. Traffic 2020, 21, 220–230. [Google Scholar] [CrossRef] [Green Version]
  29. Hasecke, F.; Miti, T.; Perez, C.; Barton, J.; Schölzel, D.; Gremer, L.; Grüning, C.S.R.; Matthews, G.; Meisl, G.; Knowles, T.P.J.; et al. Origin of metastable oligomers and their effects on amyloid fibril self-assembly. Chem. Sci. 2018, 9, 5937–5948. [Google Scholar] [CrossRef] [Green Version]
  30. Hardenberg, M.C.; Sinnige, T.; Casford, S.; Dada, S.T.; Poudel, C.; Robinson, E.A.; Fuxreiter, M.; Kaminksi, C.F.; Kaminski-Schierle, G.S.; Nollen, E.A.A.; et al. Observation of an α-synuclein liquid droplet state and its maturation into Lewy body-like assemblies. J. Mol. Cell Biol. 2021, 13, 282–294. [Google Scholar] [CrossRef]
  31. Sawner, A.S.; Ray, S.; Yadav, P.; Mukherjee, S.; Panigrahi, R.; Poudyal, M.; Patel, K.; Ghosh, D.; Kummerant, E.; Kumar, A.; et al. Modulating α-Synuclein Liquid–Liquid Phase Separation. Biochemistry 2021, 60, 3676–3696. [Google Scholar] [CrossRef] [PubMed]
  32. Kashchiev, D.; Vekilov, P.G.; Kolomeisky, A.B. Kinetics of two-step nucleation of crystals. J. Chem. Phys. 2005, 122, 244706. [Google Scholar] [CrossRef] [PubMed]
  33. Vekilov, P.G. The two-step mechanism of nucleation of crystals in solution. Nanoscale 2010, 2, 2346–2357. [Google Scholar] [CrossRef] [PubMed]
  34. Vekilov, P.G. Nucleation. Cryst. Growth Des. 2010, 10, 5007–5019. [Google Scholar] [CrossRef] [PubMed]
  35. Sleutel, M.; Van Driessche, A.E.S. Role of clusters in nonclassical nucleation and growth of protein crystals. Proc. Natl. Acad. Sci. USA 2014, 111, E546–E553. [Google Scholar] [CrossRef] [Green Version]
  36. Houben, L.; Weissman, H.; Wolf, S.G.; Rybtchinski, B. A mechanism of ferritin crystallization revealed by cryo-STEM tomography. Nature 2020, 579, 540–543. [Google Scholar] [CrossRef]
  37. Van Driessche, A.E.S.; Van Gerven, N.; Joosten, R.R.M.; Ling, W.L.; Bacia, M.; Sommerdijk, N.; Sleutel, M. Nucleation of protein mesocrystals via oriented attachment. Nat. Commun. 2021, 12, 3902. [Google Scholar] [CrossRef]
  38. Holloway, L.; Roche, A.; Marzouk, S.; Uddin, S.; Ke, P.; Ekizoglou, S.; Curtis, R. Determination of Protein-Protein Interactions at High Co-Solvent Concentrations Using Static and Dynamic Light Scattering. J. Pharm. Sci. 2020, 109, 2699–2709. [Google Scholar] [CrossRef]
  39. Da Vela, S.; Begam, N.; Dyachok, D.; Schäufele, R.S.; Matsarskaia, O.; Braun, M.K.; Girelli, A.; Ragulskaya, A.; Mariani, A.; Zhang, F.; et al. Interplay between Glass Formation and Liquid–Liquid Phase Separation Revealed by the Scattering Invariant. J. Phys. Chem. Lett. 2020, 11, 7273–7278. [Google Scholar] [CrossRef]
  40. Begam, N.; Matsarskaia, O.; Sztucki, M.; Zhang, F.; Schreiber, F. Unification of lower and upper critical solution temperature phase behavior of globular protein solutions in the presence of multivalent cations. Soft Matter 2020, 16, 2128–2134. [Google Scholar] [CrossRef]
  41. Braun, M.K.; Sauter, A.; Matsarskaia, O.; Wolf, M.; Roosen-Runge, F.; Sztucki, M.; Roth, R.; Zhang, F.; Schreiber, F. Reentrant Phase Behavior in Protein Solutions Induced by Multivalent Salts: Strong Effect of Anions Cl Versus NO3. J. Phys. Chem. B 2018, 122, 11978–11985. [Google Scholar] [CrossRef] [PubMed]
  42. Salje, E.K.H. Multi-scaling and mesoscopic structures. Philos. Trans. R. Soc. London. Ser. A Math. Phys. Eng. Sci. 2010, 368, 1163–1174. [Google Scholar] [CrossRef] [PubMed] [Green Version]
  43. Barra, A.L.C.; Dantas, L.D.O.C.; Morão, L.G.; Gutierrez, R.F.; Polikarpov, I.; Wrenger, C.; Nascimento, A.S. Essential Metabolic Routes as a Way to ESKAPE From Antibiotic Resistance. Front. Public Health 2020, 8, 26. [Google Scholar] [CrossRef] [Green Version]
  44. Strohmeier, M.; Raschle, T.; Mazurkiewicz, J.; Rippe, K.; Sinning, I.; Fitzpatrick, T.B.; Tews, I. Structure of a bacterial pyridoxal 5′-phosphate synthase complex. Proc. Natl. Acad. Sci. USA 2006, 103, 19284–19289. [Google Scholar] [CrossRef] [Green Version]
  45. Lobley, C.M.C.; Sandy, J.; Sanchez-Weatherby, J.; Mazzorana, M.; Krojer, T.; Nowak, R.P.; Sørensen, T.L.-M. A generic protocol for protein crystal dehydration using the HC1b humidity controller. Acta Crystallogr. Sect. D Struct. Biol. 2016, 72, 629–640. [Google Scholar] [CrossRef] [Green Version]
  46. Bolisetty, S.; Harnau, L.; Jung, J.-M.; Mezzenga, R. Gelation, Phase Behavior, and Dynamics of β-Lactoglobulin Amyloid Fibrils at Varying Concentrations and Ionic Strengths. Biomacromolecules 2012, 13, 3241–3252. [Google Scholar] [CrossRef] [PubMed]
  47. Schubert, R.; Meyer, A.; Dierks, K.; Kapis, S.; Reimer, R.; Einspahr, H.; Perbandt, M.; Betzel, C. Reliably distinguishing protein nanocrystals from amorphous precipitate by means of depolarized dynamic light scattering. J. Appl. Crystallogr. 2015, 48, 1476–1484. [Google Scholar] [CrossRef]
  48. Balog, S.; Rodriguez-Lorenzo, L.; Monnier, C.A.; Obiols-Rabasa, M.; Rothen-Rutishauser, B.; Schurtenberger, P.; Petri-Fink, A. Characterizing nanoparticles in complex biological media and physiological fluids with depolarized dynamic light scattering. Nanoscale 2015, 7, 5991–5997. [Google Scholar] [CrossRef] [Green Version]
  49. Chayen, N.; Dieckmann, M.; Dierks, K.; Fromme, P. Size and Shape Determination of Proteins in Solution by a Noninvasive Depolarized Dynamic Light Scattering Instrument. Ann. N. Y. Acad. Sci. 2004, 1027, 20–27. [Google Scholar] [CrossRef]
  50. Vailati, A.; Asnaghi, D.; Giglio, M.; Piazza, R. Depolarized dynamic light scattering from optically anisotropic reaction-limited aggregates. Phys. Rev. E 1993, 48, R2358–R2361. [Google Scholar] [CrossRef]
  51. Ullah, N.; Andaleeb, H.; Mudogo, C.N.; Falke, S.; Betzel, C.; Wrenger, C. Solution Structures and Dynamic Assembly of the 24-Meric Plasmodial Pdx1–Pdx2 Complex. Int. J. Mol. Sci. 2020, 21, 5971. [Google Scholar] [CrossRef] [PubMed]
  52. Wang, M.; Falke, S.; Schubert, R.; Lorenzen, K.; Cheng, Q.-D.; Exner, C.; Brognaro, H.; Mudogo, C.N.; Betzel, C. Pulsed electric fields induce modulation of protein liquid–liquid phase separation. Soft Matter 2020, 16, 8547–8553. [Google Scholar] [CrossRef] [PubMed]
  53. Schubert, R. Preparation and Scoring of Protein Nano- and Microcrystals for Synchrotron and Free-Electron Laser X-ray Radiation Sources. Ph.D. Thesis, University Hamburg, Hamburg, Germany, 2016; p. 157. [Google Scholar]
  54. Provencher, S.W. A constrained regularization method for inverting data represented by linear algebraic or integral equations. Comput. Phys. Commun. 1982, 27, 213–227. [Google Scholar] [CrossRef]
  55. Einstein, A. Theory of the Brownian movements. Ann. Phys. 1905, 17, 549. [Google Scholar] [CrossRef] [Green Version]
  56. Debye, P. Polar Molecules; The Chemical Catalog Company, Inc.: Dover, NY, USA, 1929. [Google Scholar]
  57. Kenrick, S.; Some, D. The Diffusion Interaction Parameter (kD) as an Indicator of Colloidal and Thermal Stability; Wyatt Technology Corporation: Santa Barbara, CA, USA, 2014; pp. 1–6. [Google Scholar]
  58. Roberts, D.; Keeling, R.; Tracka, M.; van der Walle, C.F.; Uddin, S.; Warwicker, J.; Curtis, R. The Role of Electrostatics in Protein–Protein Interactions of a Monoclonal Antibody. Mol. Pharm. 2014, 11, 2475–2489. [Google Scholar] [CrossRef]
  59. Kozak, M. Glucose isomerase from Streptomyces rubiginosus–potential molecular weight standard for small-angle X-ray scattering. J. Appl. Crystallogr. 2005, 38, 555–558. [Google Scholar] [CrossRef]
  60. Falke, S.; Brognaro, H.; Martirosyan, A.; Dierks, K.; Betzel, C. A multi-channel in situ light scattering instrument utilized for monitoring protein aggregation and liquid dense cluster formation. Heliyon 2019, 5, e03016. [Google Scholar] [CrossRef] [Green Version]
  61. Oberthuer, D.; Melero-García, E.; Dierks, K.; Meyer, A.; Betzel, C.; Garcia-Caballero, A.; Gavira, J.A. Monitoring and Scoring Counter-Diffusion Protein Crystallization Experiments in Capillaries by in situ Dynamic Light Scattering. PLoS ONE 2012, 7, e33545. [Google Scholar] [CrossRef] [Green Version]
  62. Hofmeister, F. Zur Lehre von der Wirkung der Salze. Naunyn-Schmiedebergs Arch. Exp. Pathol. Pharmakol. 1888, 24, 247–260. [Google Scholar] [CrossRef] [Green Version]
  63. Miklos, A.C.; Li, C.; Sharaf, N.G.; Pielak, G.J. Volume Exclusion and Soft Interaction Effects on Protein Stability under Crowded Conditions. Biochemistry 2010, 49, 6984–6991. [Google Scholar] [CrossRef] [Green Version]
  64. Zitserman, V.Y.; Stojilkovich, K.S.; Berezhkovskii, A.M.; Bezrukov, S.M. Electrical conductivity of aqueous solutions of polyethylene glycol. Russ. J. Phys. Chem. A 2005, 79, 1083–1089. [Google Scholar]
  65. McPherson, A.; Kuznetsov, Y.G. Mechanisms, kinetics, impurities and defects: Consequences in macromolecular crystallization. Acta Crystallogr. Sect. F Struct. Biol. Commun. 2014, 70, 384–403. [Google Scholar] [CrossRef] [PubMed]
  66. Bye, J.W.; Curtis, R.A. Controlling Phase Separation of Lysozyme with Polyvalent Anions. J. Phys. Chem. B 2018, 123, 593–605. [Google Scholar] [CrossRef] [Green Version]
  67. Bae, J.-E.; Hwang, K.Y.; Nam, K.H. Structural analysis of substrate recognition by glucose isomerase in Mn2+ binding mode at M2 site in S. rubiginosus. Biochem. Biophys. Res. Commun. 2018, 503, 770–775. [Google Scholar] [CrossRef] [PubMed]
  68. Roosen-Runge, F.; Zhang, F.; Schreiber, F.; Roth, R. Ion-activated attractive patches as a mechanism for controlled protein interactions. Sci. Rep. 2014, 4, 7016. [Google Scholar] [CrossRef] [PubMed] [Green Version]
  69. Staneva, I.; Frenkel, D. The role of non-specific interactions in a patchy model of protein crystallization. J. Chem. Phys. 2015, 143, 194511. [Google Scholar] [CrossRef] [Green Version]
  70. Hedges, L.O.; Whitelam, S. Limit of validity of Ostwald’s rule of stages in a statistical mechanical model of crystallization. J. Chem. Phys. 2011, 135, 164902. [Google Scholar] [CrossRef] [Green Version]
  71. Whitelam, S. Control of Pathways and Yields of Protein Crystallization through the Interplay of Nonspecific and Specific Attractions. Phys. Rev. Lett. 2010, 105, 88102. [Google Scholar] [CrossRef] [Green Version]
Figure 1. (a) The structure of monomeric glucose isomerase from Streptomyces rubiginosus (PDB: 4ZB2) [45]. (b) The Pdx1–Pdx2 complex from the homologue Bacillus subtilis (PDB: 2NV2) shown in two orientations rotated by 90°. Twelve Pdx1 synthase subunits form a double hexameric ring core (purple), to which twelve Pdx2 glutaminase subunits (orange) are attached [44].
Crystals 12 00437 g001
Figure 2. (a) Schematic [53] and (b) photographic [52] images of the DDLS instrument. (c) Illustration of the quartz cuvette with two Pt wires to apply a pulsed electric field during a DLS/DDLS measurement [52].
Crystals 12 00437 g002
Figure 3. Scheme showing the three-step experimental procedure to prepare hanging-drop crystallization droplets of GI with varying volume ratios of mesoscopic ordered clusters, prior prepared by treating a protein solution with a pEF.
Crystals 12 00437 g003
Figure 4. Monitoring phase transition of a 2 mg/mL GI solution by DLS and DDLS under the effect of Na+ and Mg2+ gradients in 10 mM MES pH 6.5 and 4% PEG20k buffer. (a1a5) Kinetic evolution of the hydrodynamic radius in the presence of a NaCl gradient (a1′a5′) showing the resultant DLS (left Y-axis, orange open circles) and DDLS (right Y-axis, green closed circles) signal intensities. (b1b5) Kinetic evolution of the hydrodynamic radius and (b1′b5′) corresponding DLS/DDLS signal intensities of a GI solution by mixing the solution with a MgCl2 gradient.
Crystals 12 00437 g004aCrystals 12 00437 g004b
Figure 5. The auto-correlation function of a GI solution (a) with varying NaCl and (b) with varying MgCl2. KD values (left Y-axis, black cross) and the hydrodynamic radii ( R h , right Y-axis, red dot) of GI as a function of (c) NaCl and (d) MgCl2 concentration.
Crystals 12 00437 g005
Figure 6. Time-resolved monitoring of GI phase transition in context of varying crowding environments. (a1a5) Kinetic evolution of the hydrodynamic radii and (a1′–a5′) corresponding DLS (left Y-axis, orange symbol)/DDLS (right Y-axis, green symbol) signal intensities of a 2 mg/mL GI solution mixed with a gradient of PEG20k in a buffer containing 100 mM NaCl. (b1b5) Kinetic evolution of the hydrodynamic radii and (b1′–b5′) corresponding DLS/DDLS signal intensities of a 2 mg/mL GI solution mixed with a gradient of PEG20k in a buffer containing 50 mM MgCl2.
Crystals 12 00437 g006
Figure 7. The effect of a pulsed electric field on the phase behavior of GI in a solution with different ions and PEG conditions. (a1a4) Development of the hydrodynamic radii of 2 mg/mL GI with PEG20k in a buffer containing10 mM MES pH 6.5, 100 mM NaCl exposed to a pEF (green open circles) and without pEF (purple bubbles). (a1′a4′) The corresponding DLS (left Y-axis, orange open circles) and DDLS (right Y-axis, green closed circles) signal intensities of the pEF group monitored with a buffer containing 100 mM NaCl. (b1b4) Evolution of the hydrodynamic radii of a 2 mg/mL GI solution mixed with PEG20k and buffer condition of 10 mM MES PH 6.5, 50 mM MgCl2 with a pEF (pink open circles) and without pEF (green bubbles). (b1′b4′) The corresponding DLS and DDLS signal intensities of the pEF group monitored in a buffer containing 50 mM MgCl2. DLS/DDLS signal intensities of each control condition without pEF are shown in Figure 6.
Crystals 12 00437 g007
Figure 8. (a) Forty microliters of 4 mg/mL GI in a buffer of 10 mM MES pH 6.5, 1 mM DTT and 50 mM MgCl2, incubated in a quartz cuvette for 30 min without and with the application of a pEF. The scale bar corresponds to 50 μm. (b) GI crystals obtained from droplets with a final concentration of 2 mg/mL GI, and different ratios (v/v) of fresh protein solution seeded with a pEF-treated protein solution in 10 mM MES pH 6.5, 1 mM DTT and 50 mM MgCl2 buffer. PEG20k in the same buffer with GI was applied as crystallization precipitant. Scale bar is 200 μm. (c) Magnified view of crystals formed in each droplet, and the scale bar corresponds to 100 μm. All droplets were recorded via an optical microscope after 24-hour incubation at 20 °C.
Crystals 12 00437 g008aCrystals 12 00437 g008b
Figure 9. The effect of pEFs on early stages of Pdx crystallization at different protein concentrations. Kinetic evolution of the hydrodynamic particle radii from mixtures of 2.5 mg/mL Pdx with 5% PEG4000 (a) without and (c) with the application of a pEF, and mixtures at a final concentration of 0.75 mg/mL Pdx, 5% PEG4000 (b) without and (d) with a pEF. The corresponding DLS (orange open circles) and DDLS (green bubbles) signal intensities of each condition are shown in (a′–d′).
Crystals 12 00437 g009
Figure 10. Crystallization of the Pdx complex (a,b) without and (c,d) with the addition of mesoscopic ordered clusters pre-induced by the pEF.
Crystals 12 00437 g010
Publisher’s Note: MDPI stays neutral with regard to jurisdictional claims in published maps and institutional affiliations.

