Review

The Growth and Properties of Lead-Free Ferroelectric Single Crystals

Key Laboratory of Inorganic Functional Material and Device, Shanghai Institute of Ceramics, Chinese Academy of Sciences, 215 Chengbei Road Jiading, Shanghai 201800, China
*
Author to whom correspondence should be addressed.
Submission received: 30 April 2014 / Accepted: 15 September 2014 / Published: 25 March 2015
(This article belongs to the Special Issue Piezoelectric Crystals)

Abstract

:
Much attention is drawn to the preparation, structure and properties investigation of lead-free ferroelectrics for the next generation of piezoelectric devices. (Na0.5Bi0.5)TiO3-BaTiO3 (NBT-BT) lead-free solid solution piezoelectric single crystals with composition x in the range of 0–0.05 as a materials with high piezoelectric properties were successfully grown from platinum crucible by using the top-seeded solution growth (TSSG) method. The dimensions of NBT-BT crystal is Ø40 × 10 mm2. X-ray powder diffraction patterns reveal that the crystal structure of NBT-BT crystal changes from rhombohedral to tetragonal symmetry with increasing amounts of BT(x). The dielectric, ferroelectric and piezoelectric properties of NBT-BT crystals with different compositions near the morphotropic phase boundary (MPB) were studied systematically. Ions (Mn, Eu, Zn) doped NBT and NBT-BT 95/5 crystals were also grown and studied. In addition, their piezoelectric and ferroelectric properties are investigated. Further, a high-quality and large-sized (K0.25Na0.75)NbO3 (KNN25/75) single crystal has been achieved by a carefully controlled TSSG method. The dimensions of the as-grown KNN25/75 single crystal reached up to Ø30 × 10 mm2. The obtained KNN crystals provided us a superb material for the dielectric, piezoelectric, ferroelectric and electromechanical coupling property characterization along different orientations.

1. Introduction

Relaxor-based ferroelectrics are a hot topic at present, in terms of their practical applications and the mechanism that explains their novel properties [1]. Take the lead-based ferroelectrics lead zirconium titanate (PZT) ceramics, for example. They have been used in numerous practical applications such as sensors, actuators, ultrasonic transducers, etc. [2,3,4]. Furthermore, the single crystals of these perovskite solid solutions such as Pb(Mg1/3Nb2/3)-PbTiO3 (PMNT) single crystal exhibit a several times larger piezoelectric effect than conventional ceramics, which make them promising for the next generation of piezoelectric devices [5]. However, due to the toxic nature of PbO, considerable recent studies have been focused on lead-free piezoelectric materials from an environmental protection viewpoint [6].
Among all kinds of lead-free piezoelectric systems, sodium bismuth titanate (Na0.5Bi0.5TiO3, abbreviated as NBT) is a strong ferroelectric and the piezoelectric performance can be enhanced by forming solid solutions with barium titanate (BaTiO3, abbreviated as BT) at the composition of hombohedral-tetragonal morphotropic phase boundary (MPB). Therefore, the (1−x)(Na0.5Bi0.5)TiO3-xBaTiO3 [abbreviated as NBT-BT 100(1−x)/100x or NBBT] solid solutions are considered to be a promising candidate for a lead-free piezoelectric material. Then NBT-BT single crystals will provide an opportunity to conveniently investigate the dielectric and piezoelectric properties [7,8,9,10,11].
However, these properties are still notably inferior to that of lead-based ones. In addition, relatively high leakage currents due to defects are another problem to overcome in NBT-BT, which can interfere with poling and polarization switching. Modest concentrations of dopants have been reported to be an effective method by which to enhance the resistivity of lead-based materials [12,13,14,15,16,17,18]. Then Mn, Eu and Zn doped NBT and NBT-BT crystals were grown and studied, and it have been found that ions substitution can produce local tetragonal distortions and change the domain structures. In addition, the piezoelectric and ferroelectric properties enhanced because the leakage current of NBT-BT crystals decreased notably upon ions substitution [19,20,21,22,23].
Moreover, as another kind of lead free materials, alkaline niobate (KxNa1−x)NbO3 (KNN)-based solid solutions have been attracting much attention as they are believed to provide a relatively high piezoelectric response, a high Curie temperature and a high acoustic velocity. Since the great breakthrough had been made by Saito in textured KNN-based ceramics, preparation of KNN ceramics with better piezoelectric properties has been extensively studied. It provided that texture engineering can lead to an improvement in piezoelectric properties, single crystals of KNN are also expected to have superior properties. In addition, free from the effect of the grain boundary in ceramics, single crystals are more appropriate for investigating the nature of materials.
In the present work, crystal growth, structure and electrical properties of NBT-BT crystal are systemically studied on samples for various contents and crystallographic cuts and it was found that enhanced piezoelectric properties can be obtained in NBT-BT single crystal by using the concept of engineered-domain configuration.

2. Growth, Properties and Phase Structure of Lead-Free Ferroelectric Single Crystals

2.1. NBT Based Single Crystals

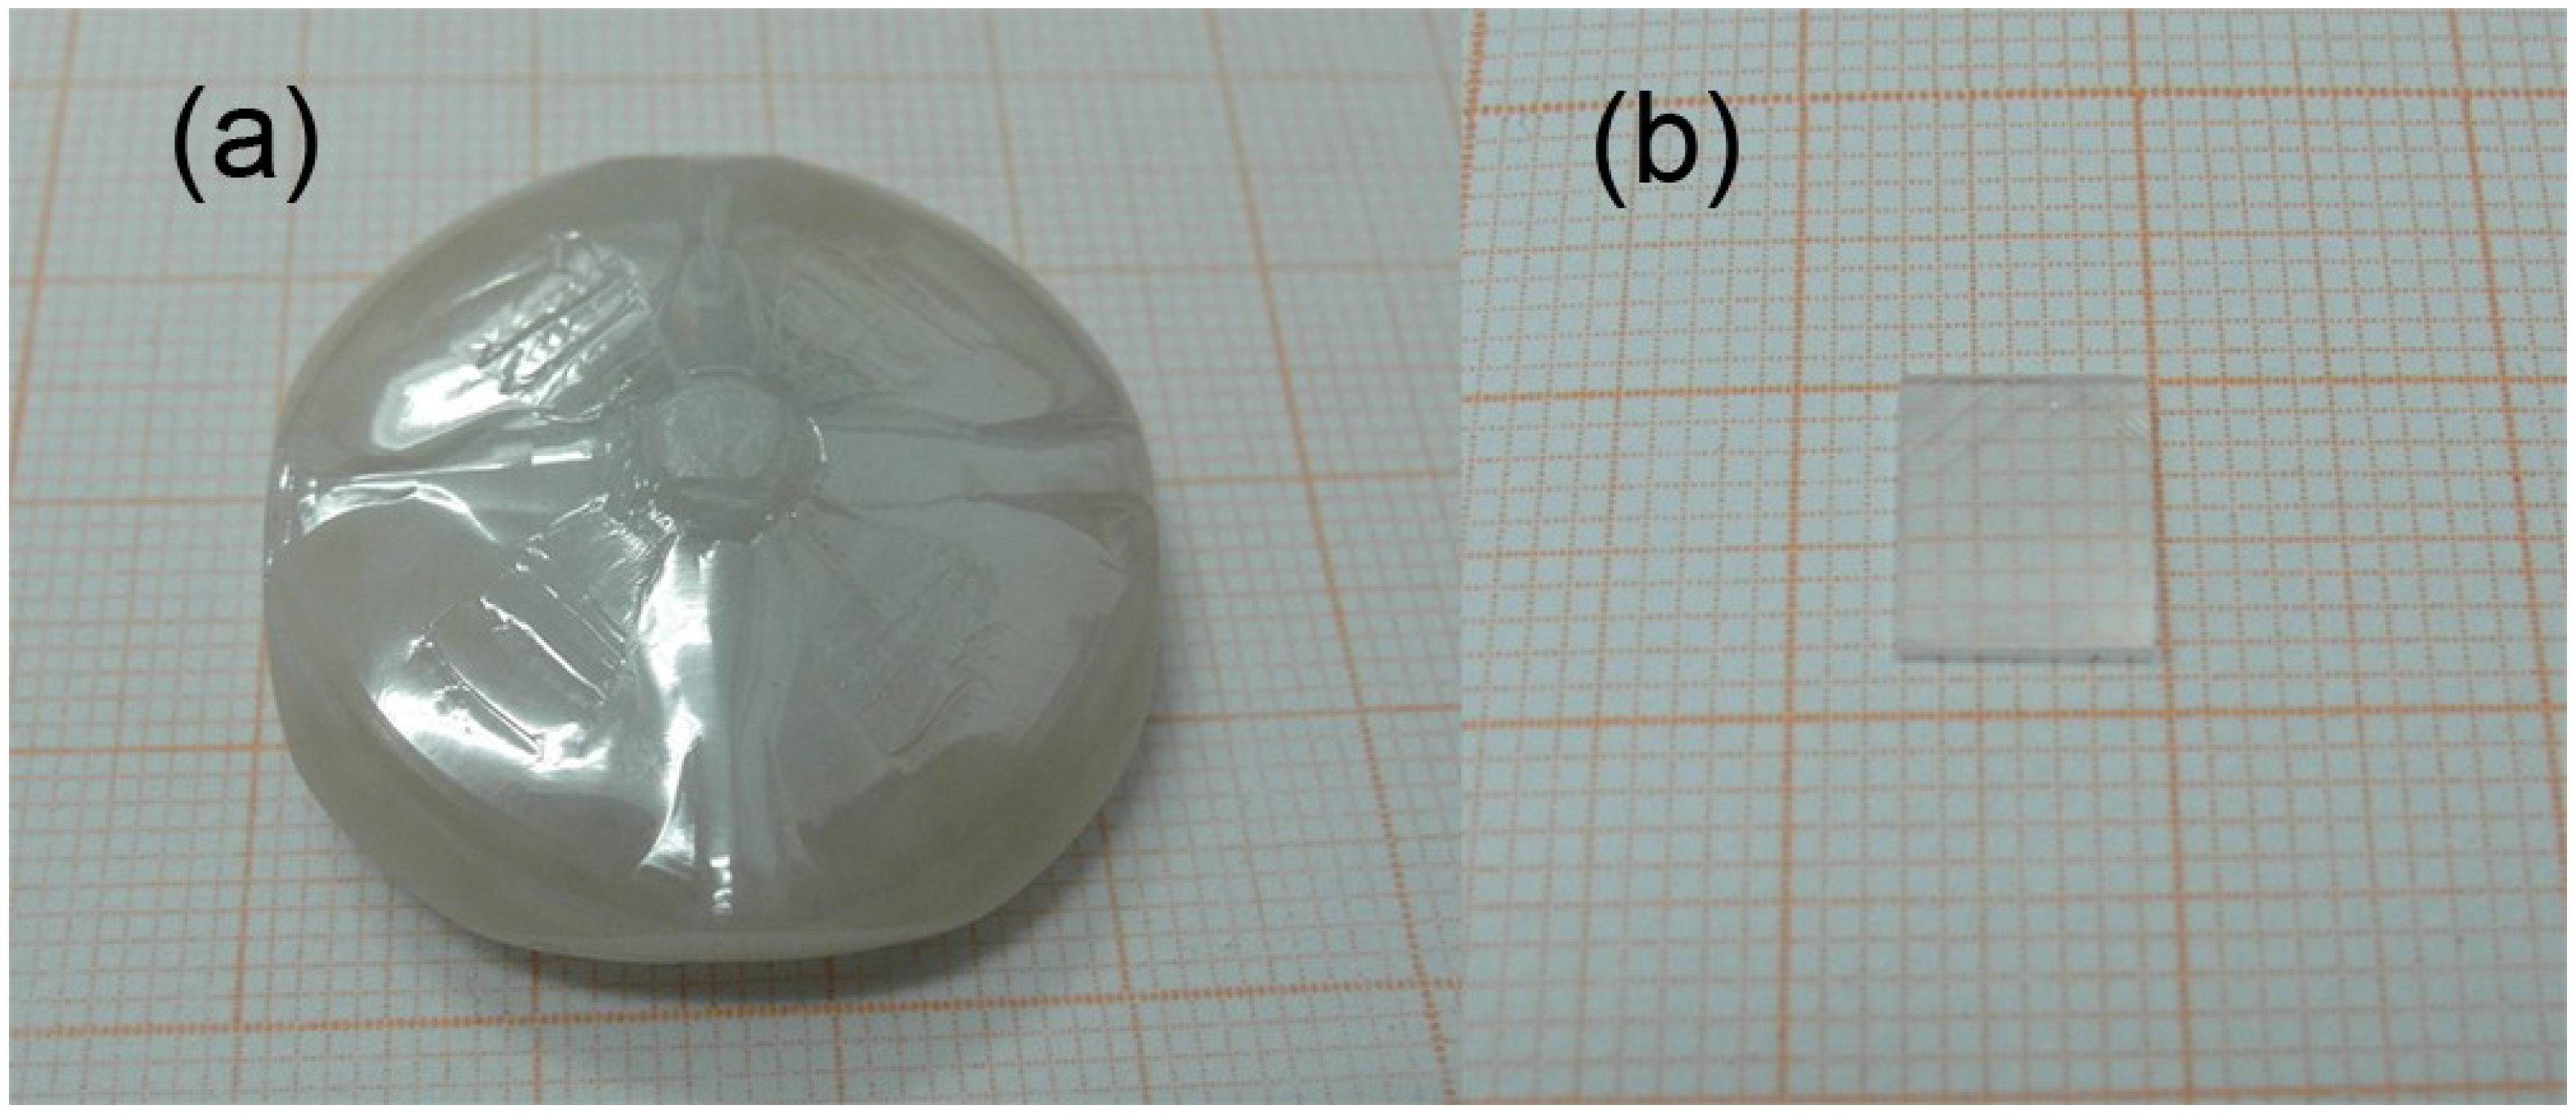
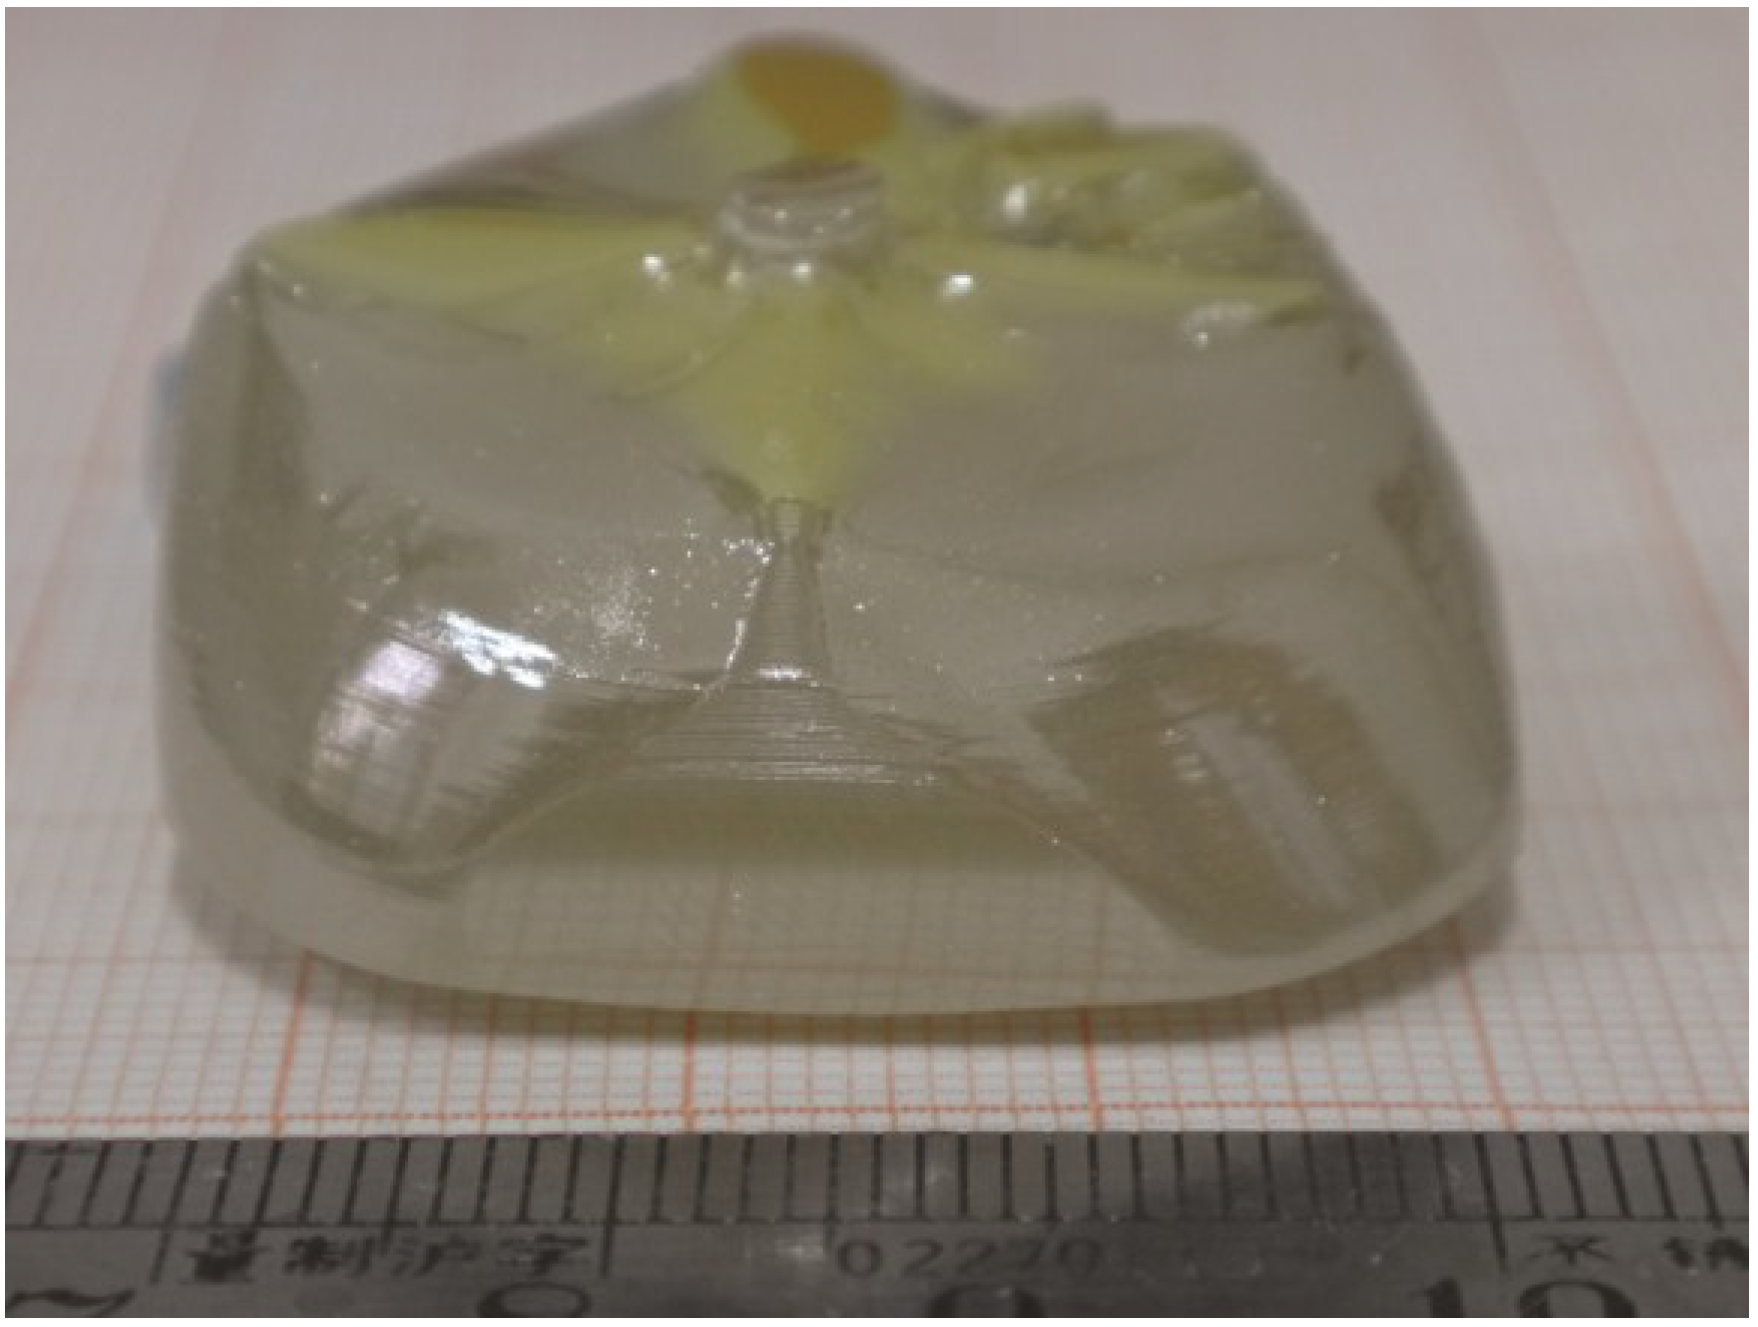
2.1.1. Crystal Growth of NBT-BT

Chemical materials of Na2CO3, Bi2O3, TiO2 and BaCO3 with 99.99% were used to synthesize the polycrystalline material of 0.94(Na0.5Bi0.5)TiO3-0.06BaTiO3 (abbreviated as NBT-BT94/6) by conventional solid-state reaction techniques. Before solid-state reaction, these compounds were weighed according to the following chemical reaction equation and characterized by TG-DTA experiments using a simultaneous thermal analyzer (NETZSCH STA 449C, Sasol, Hamburg, Germany) a heating rate of 10 °C/min in an air atmosphere. The TG-DTA curves of Na2CO3 + Bi2O3 + 4TiO2 and BaCO3 + TiO2 are shown in the following Figure 1.
Figure 1. TG-DTA curves of (a) Na2CO3 + Bi2O3 + 4TiO2; and (b) BaCO3 + TiO2.
Crystals 05 00172 g001
After these thermal measurements, the proper temperature to synthesize the polycrystalline material of NBT-BT 94/6 crystal was determined:
Na 2 CO 3   +   Bi 2 O 3   +   4 TiO 2 High temperature 4 ( Na 0.5 Bi 0.5 ) TiO 3   +   CO 2
BaCO 3   +   TiO 2 High temperature  BaTiO 3   +   CO 2
High purity Na2CO3, Bi2O3, TiO2 and BaCO3 were weighted according to stoichiometrical ratio of 0.94(Na0.5Bi0.5)TiO3-0.06BaTiO3. After these compounds were ground and mixed, they were put into platinum (Pt) crucible and heated to 1200 °C for 10 h to decompose the carbonate and form NBT-BT 94/6 polycrystalline material. Then the NBT-BT 94/6 polycrystalline materials were ground and mixed with 20 wt% of excess Na2CO3 and Bi2O3 as a self-flux for compensating the composition change. These mixtures were heated to 900 °C for an hour [24].
NBT-BT 94/6 single crystal was grown from a Pt crucible, which was heated by using a resistance furnace under air atmosphere. A platinum wire was used as the seed for crystal growth. In order to avoid the formation of poly-crystal in the crystal growth process, a temperature 30–50 °C higher than the melting temperature of polycrystalline material was required initially, to melt the micro-crystal particles in the Pt crucible and keep that temperature for 1 h. The temperature was then lowered to the melting temperature. Initially, a randomly oriented crystal was obtained by spontaneous nucleation on the end of a platinum wire by restricting the diameter of the crystalline material so that only one crystal should be grown. The pulling rate was 2–2.5 mm per day after the crystal diameter reached a certain value; the rotating rate was 10–30 rpm. After growth, the crystal was cooled to room temperature at a rate of 30–50 °C/h. Figure 2 shows the NBT-BT crystal boule grown by the TSSG method. The dimensions of the as-grown crystal are 25 mm in diameter and 10 mm in length [25].
Figure 2. The photograph of as-grown (Na0.5Bi0.5)TiO3-BaTiO3 (NBT-BT) crystal. Reprinted with permission from [24]. Copyright 2008 AIP Publishing LLC.
Crystals 05 00172 g002

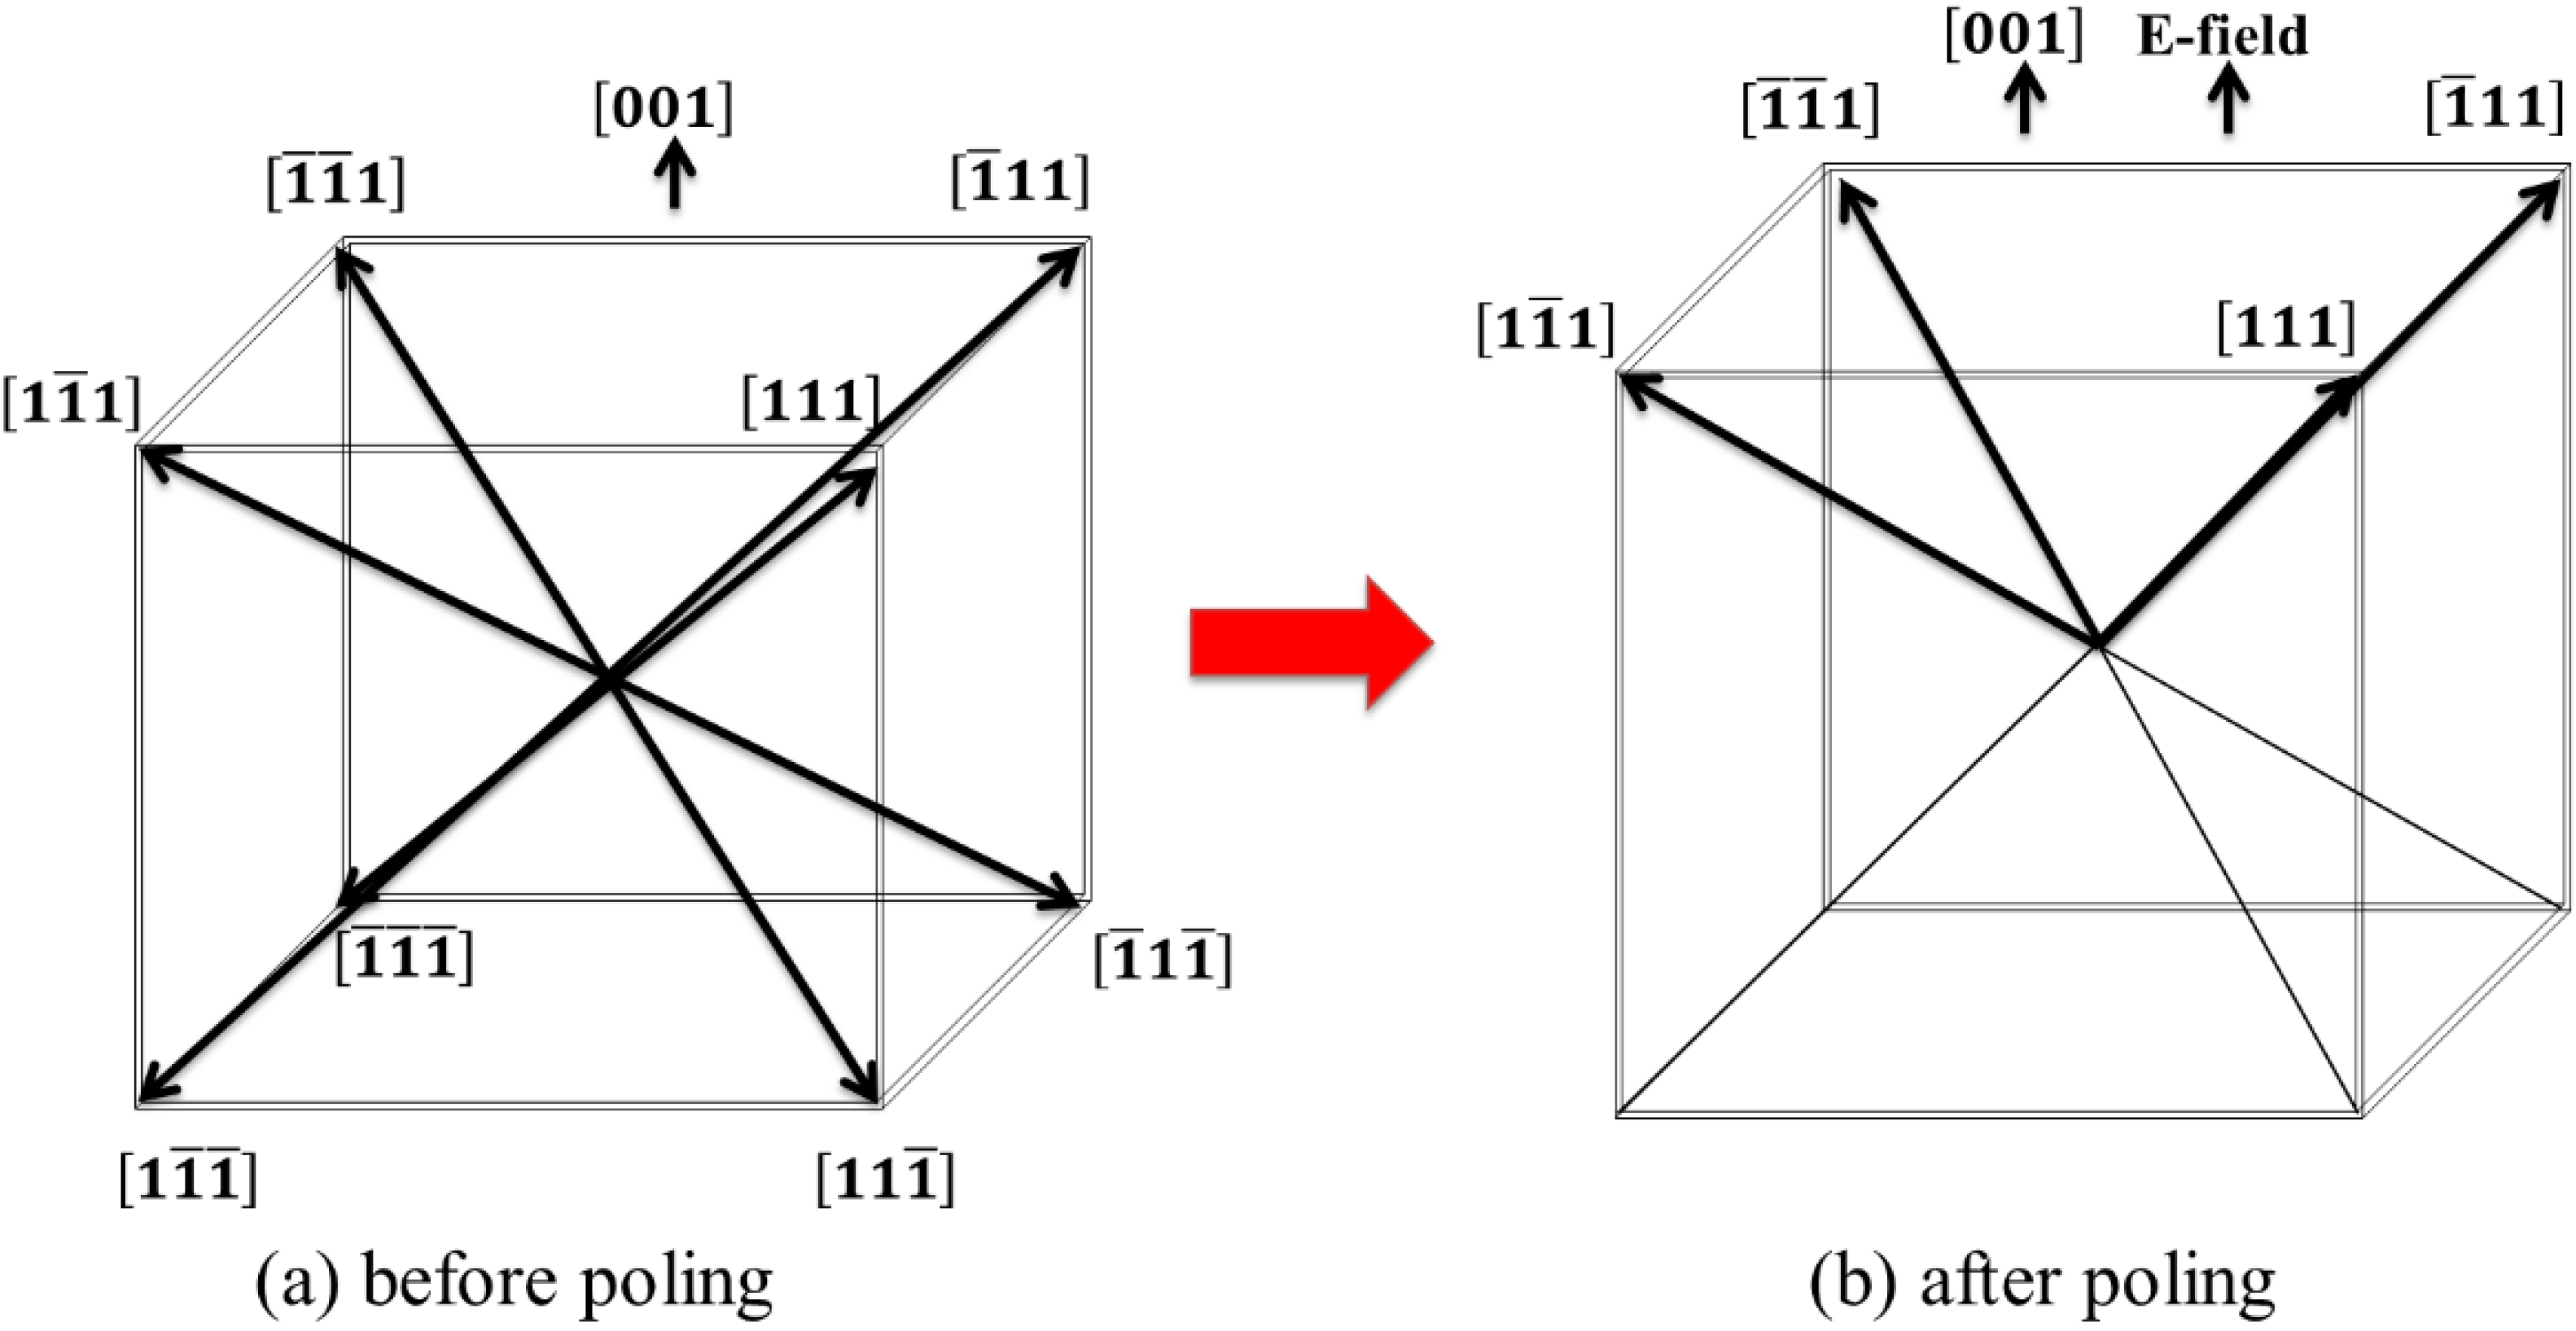
2.1.2. Phases and Domains in NBT

Figure 3a shows the X-ray powder diffraction (XRPD) patterns of the as-grown NBT-BT crystal. In addition, the XRPD patterns of BaTiO3 crystal which was grown by the TSSG method were also given in Figure 3b. It can be seen that these two crystals almost have the same XRPD patterns. Since the barium titanate is a typical perovskite-type structure compounds, it can be deduced that the as grown NBT-BT crystal also possess the perovskite-type structure. The unit-cell parameters were calculated through the TEROR programs according to the XRPD patterns. The unit-cell parameters of the as grown NBT-BT crystal are a = b = c = 3.8862 Å and α = β = γ = 89.2°, which are similar to the data of Na0.5Bi0.5TiO3 previously reported in the reference [26]. The diffraction indices corresponding to each diffraction peak are marked on the patterns. There is no splitting of peaks in the XRPD pattern of NBT-BT crystal, while the splitting of (002) and (200) peaks can be observed in the XRPD pattern of BaTiO3 crystal. These results indicate that the as grown NBT-BT crystal belongs to the rhombohedral crystal system and its rhombohedral unit cell are very close to the cubic ones and can be regarded as pseudo-cubic structure [24].
Figure 4 shows domain structures of [001]-oriented NBT and NBT: Mn crystals. The average domain width is estimated to be 50 μm for pure NBT crystal and 25 μm for NBT:Mn crystal, which means that domain size of pure NBT crystal decreases after Mn-doping [27]. It has been reported that the domain configuration of rhombohedral single crystals of PZNT will come into a more stable engineered domain state when it is poled along its nonpolar pseudocubic [001] direction, which can remarkably enhance the piezoelectric properties. The smaller the domain size, the easier the domain reorientation and engineered domain state are obtained. The NBT:Mn crystal also has a rhombohedral structure and possesses small domain size. Thus, we infer that the engineered domain state should be established much easier in NBT:Mn crystal than the case in pure NBT crystal. Consequently, the piezoelectric properties of NBT crystal are obviously improved by Mn doping.
Figure 3. X-ray powder diffraction patterns of (a) as grown NBT-BT crystal and (b) BaTiO3 crystal. Reprinted with permission from [24]. Copyright 2008 Elsevier.
Crystals 05 00172 g003
Figure 4. Room temperature domain structures of [001]-oriented NBT (a) and NBT:Mn (b) single crystals. Reprinted with permission from [27]. Copyright 2008 Elsevier.
Crystals 05 00172 g004

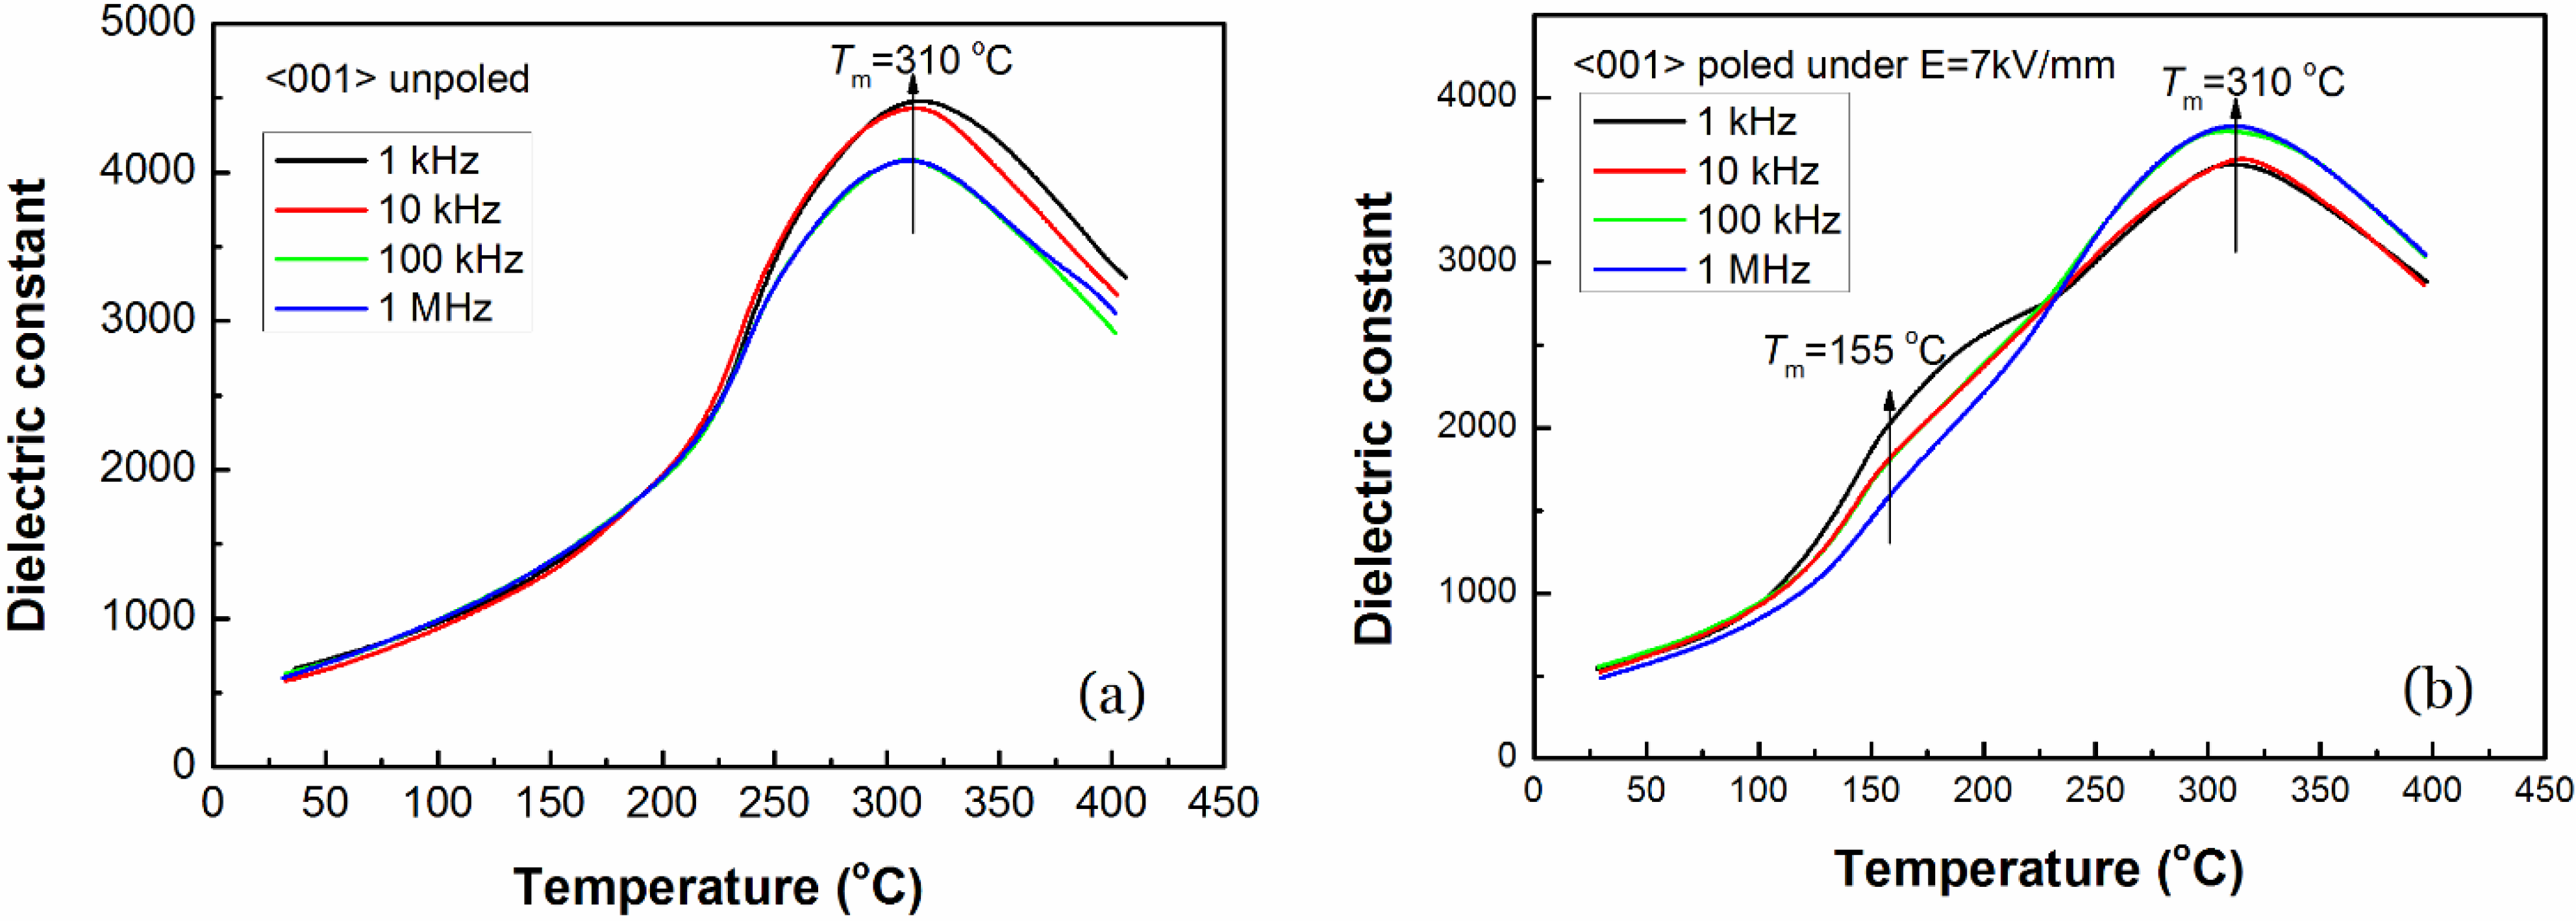
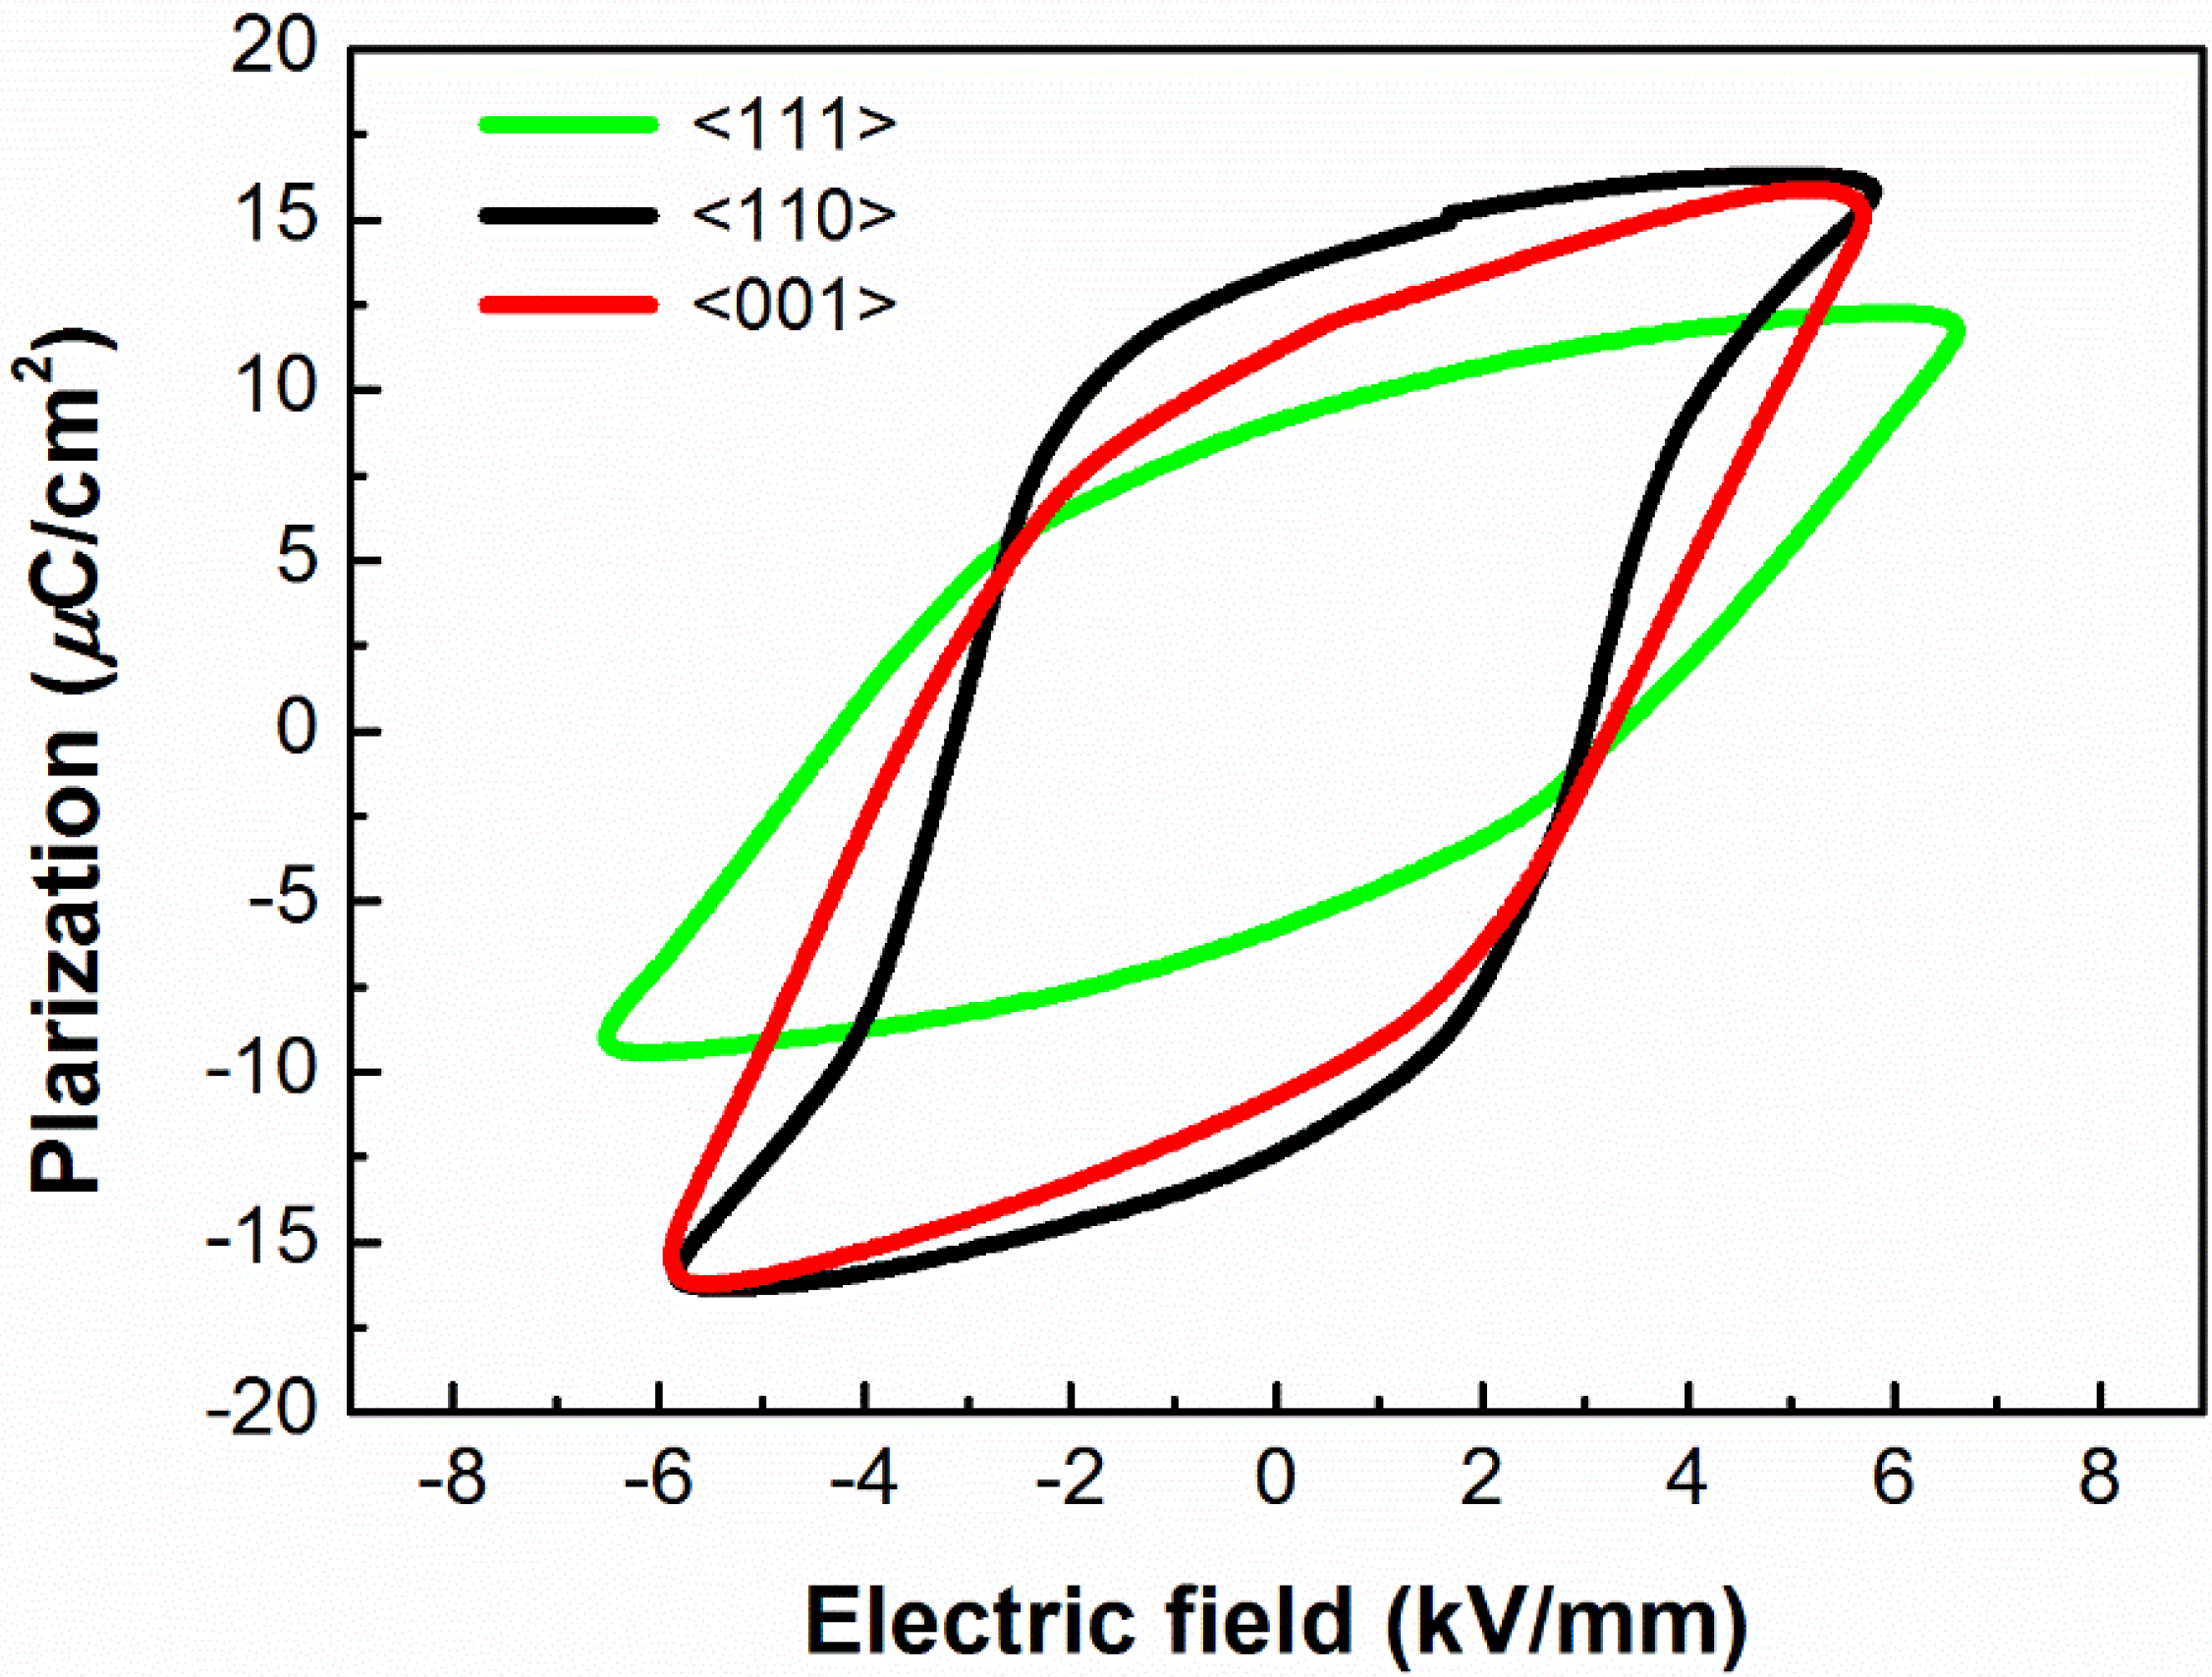
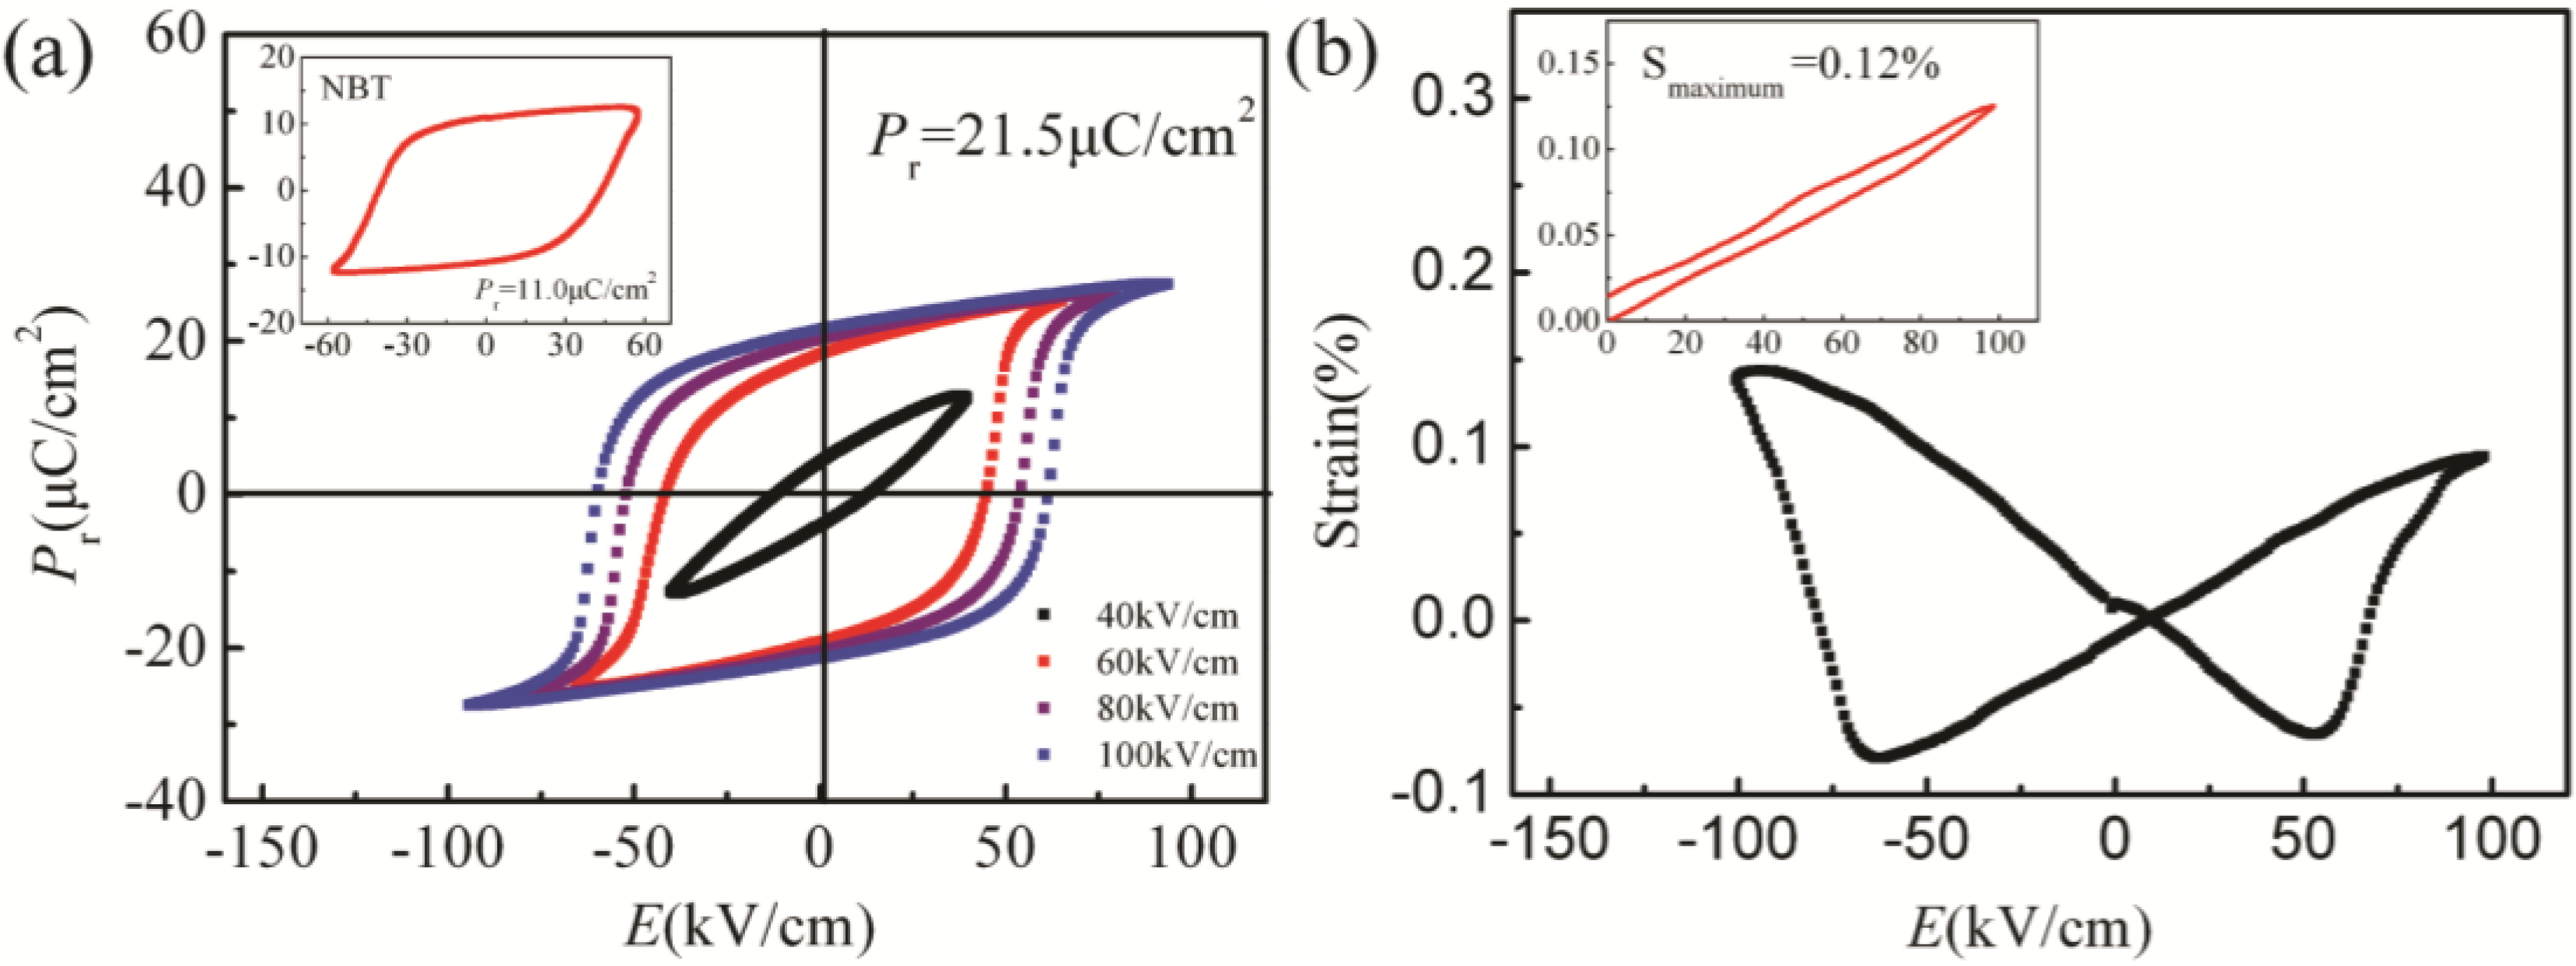
2.1.3. Dielectric, Piezoelectric, Ferroelectric Properties

Figure 5 shows the dielectric constants εr as a function of temperature at different frequencies for the poled and unpoled <001> oriented NBT-BT crystal. It can be seen that the dielectric constants show obvious frequency dispersion and exhibit broad dielectric peaks with a maximum at a Tm of 310 °C, which is connected with the transition towards the cubic paraelectric state, as previously reported in NBT-BT system ceramics. These results indicate that the as-grown NBT-BT 92/8 crystal is a relaxor ferroelectric and the Tm is 10 °C lower than that of pure (Na0.5Bi0.5)TiO3(NBT). At room temperature, the dielectric constant εr of <001> oriented NBT-BT crystal is 770 at 10 kHz and it decreases to 430 after poling. Compared with the unpoled sample, the temperature dependence of dielectric constants for the poled <001> oriented NBT-BT 98/2 crystal shows an obvious hump around 155 °C. The humps in the temperature range of 170–230 °C in the ε(T) curve were also reported in pure NBT, NBT-BT system ceramics and NBT-BT 94/6 crystal and these researchers all proposed that this hump results from the phase transition from rhombohedral ferroelectric to tetragonal antiferroelectric [24]. However, other experimental results such as X-ray diffraction, Raman and neutron scattering did not indicate the existence of antiferroelectric phase. Since the hump are only observed in the poled sample according to our experimental results, the possible origination of this phenomenon can be attributed to the macro-micro domains switching as it has been discussed in the Pb(Fe1/2Nb1/2)O3 and PLZT relaxor ferroelectric ceramics.
Figure 5. Dielectric constants as a function of temperature and frequency for (a) unpoled and (b) poled <001>oriented NBT-BT 98/2 crystal. Reprinted with permission from [24]. Copyright 2008 Elsevier.
Crystals 05 00172 g005
Figure 6 shows the piezoelectric constants d33 as a function of poling electric field for the <001>, <110> and <111> oriented NBT-BT 98/2 crystal samples. For <001> and <110> oriented NBT-BT 98/2 crystal samples, d33 increases firstly as the poling electric field increases and then decrease when the poling electric field exceeds 3 kV/mm. Maximum d33 values of 60 and 65 pC/N at the poling electric field of 3 kV/mm were obtained for <001> and <110> oriented NBT-BT 98/2 crystal. For <111> oriented NBT-BT 98/2 crystal samples, the d33 values increase moderately as the poling electric field increases. Maximum d33 value is 30 pC/N for <111> oriented NBT-BT crystal. Although <111> is the polar direction for rhombohedral NBT-BT crystal, such cuts exhibit low piezoelectric constants d33 as a function of poling electric field as shown in Figure 6. Since it has been reported that the piezoelectric in rhombohedral single crystal of Pb(Zn1/3Nb2/3)O3-PbTiO3 can be obviously enhanced when it was poled along its nonpolar pseudocubic <001> direction and come into engineered domain state. Perhaps the same mechanism enhances the piezoelectric properties of lead-free rhombohedral NBT-BT crystal as shown in Figure 7, which will be further studied combined with in situ domain observation under DC-bias using a polarizing microscope [24].
Figure 6. Piezoelectric constants d33 as a function of poling electric field for <001>, <110> and <111> oriented NBT-BT 98/2 crystal. Reprinted with permission from [24]. Copyright 2008 Elsevier.
Crystals 05 00172 g006
Figure 7. Schematics of domain configuration in the rhombohedral 0.92NBT-0.08KBT crystal: (a) before poling, and (b) after poling along the <001> direction. Reprinted with permission from [25]. Copyright 2011 AIP Publishing LLC.
Crystals 05 00172 g007
In the case of the [001] oriented NBT-BT single crystal, the domain configuration can be graphically represented, as shown in Figure 7. Before poling, the rhombohedral crystal has eight polar vectors with an equivalent magnitude and different [111] directions. After complete poling along one of the pseudocubic [001] directions, an engineered-domain state can be achieved, i.e., each domain has four possible polar directions ( [ 11 1 ¯ ] , [ 1 ¯ 1 1 ¯ ] , [ 1 ¯ 1 ¯ 1 ¯ ] , [ 1 1 ¯ 1 ¯ ] ) as shown in Figure 7b. Such an engineered domain state is more stable than the single domain state because the four types of domains are energetically equivalent and are equally populated under the [001] poling electric field. When the [001] oriented rhombohedral 0.92NBT-0.08KBT crystal with the engineered-domain configuration is actuated by an electric field along the [001] direction, the four possible polar directions are expected to incline close to the E field direction in each domain, which results in an increased rhombohedral lattice distortion and a high piezoelectric response. According to Figure 7a, the component of each polar vector along the <001> direction is completely equal to every other one and the remanent polarization of the <001> oriented rhombohedral 0.92NBT-0.08KBT crystal should be 1 : 3 that of the <111> oriented crystal. This inference can be confirmed by the polarization hysteresis loop measurements. Figure 8 shows the room-temperature polarization hysteresis loops of <001>, <110> and <111> oriented 0.92NBT-0.08KBT crystals. The ferroelectric parameters taken from Figure 8 are collected in Table 1. It can be seen that <001> oriented crystals have the smallest remnant polarization (Pr = 8.1 µC/cm2), while the <111> oriented crystals have the largest remnant polarization (Pr = 13.5 µC/cm2). The remanent polarization ratio of Pr<001>:Pr<110>:Pr<111> is 1:1.33:1.67; close to 1 : 2 : 3 [25].
Figure 8. (Color online) Polarization hysteresis loops of the <001>, <110>, and <111> oriented 0.92NBT-0.08KBT crystals at room temperature. Reprinted with permission from [25]. Copyright 2011 AIP Publishing LLC.
Crystals 05 00172 g008
Table 1. Dielectric parameters for the unpoled and poled 0.92NBT-0.08KBT single crystal (1 kHz) (poling condition: Ep = 3 kV/mm, Tp = 50 °C and tp = 15 min). Reprinted with permission from [25]. Copyright 2011 AIP Publishing LLC.
OrientationConditionεRMtanθεmTm (°C)
<001>unpoled8050.0404318316
poled6830.0314315316
<110>unpoled8630.0474160317
poled5670.0304154318
<111>unpoled9100.0464348318
poled4350.0384074316

2.2. KNN Single Crystal

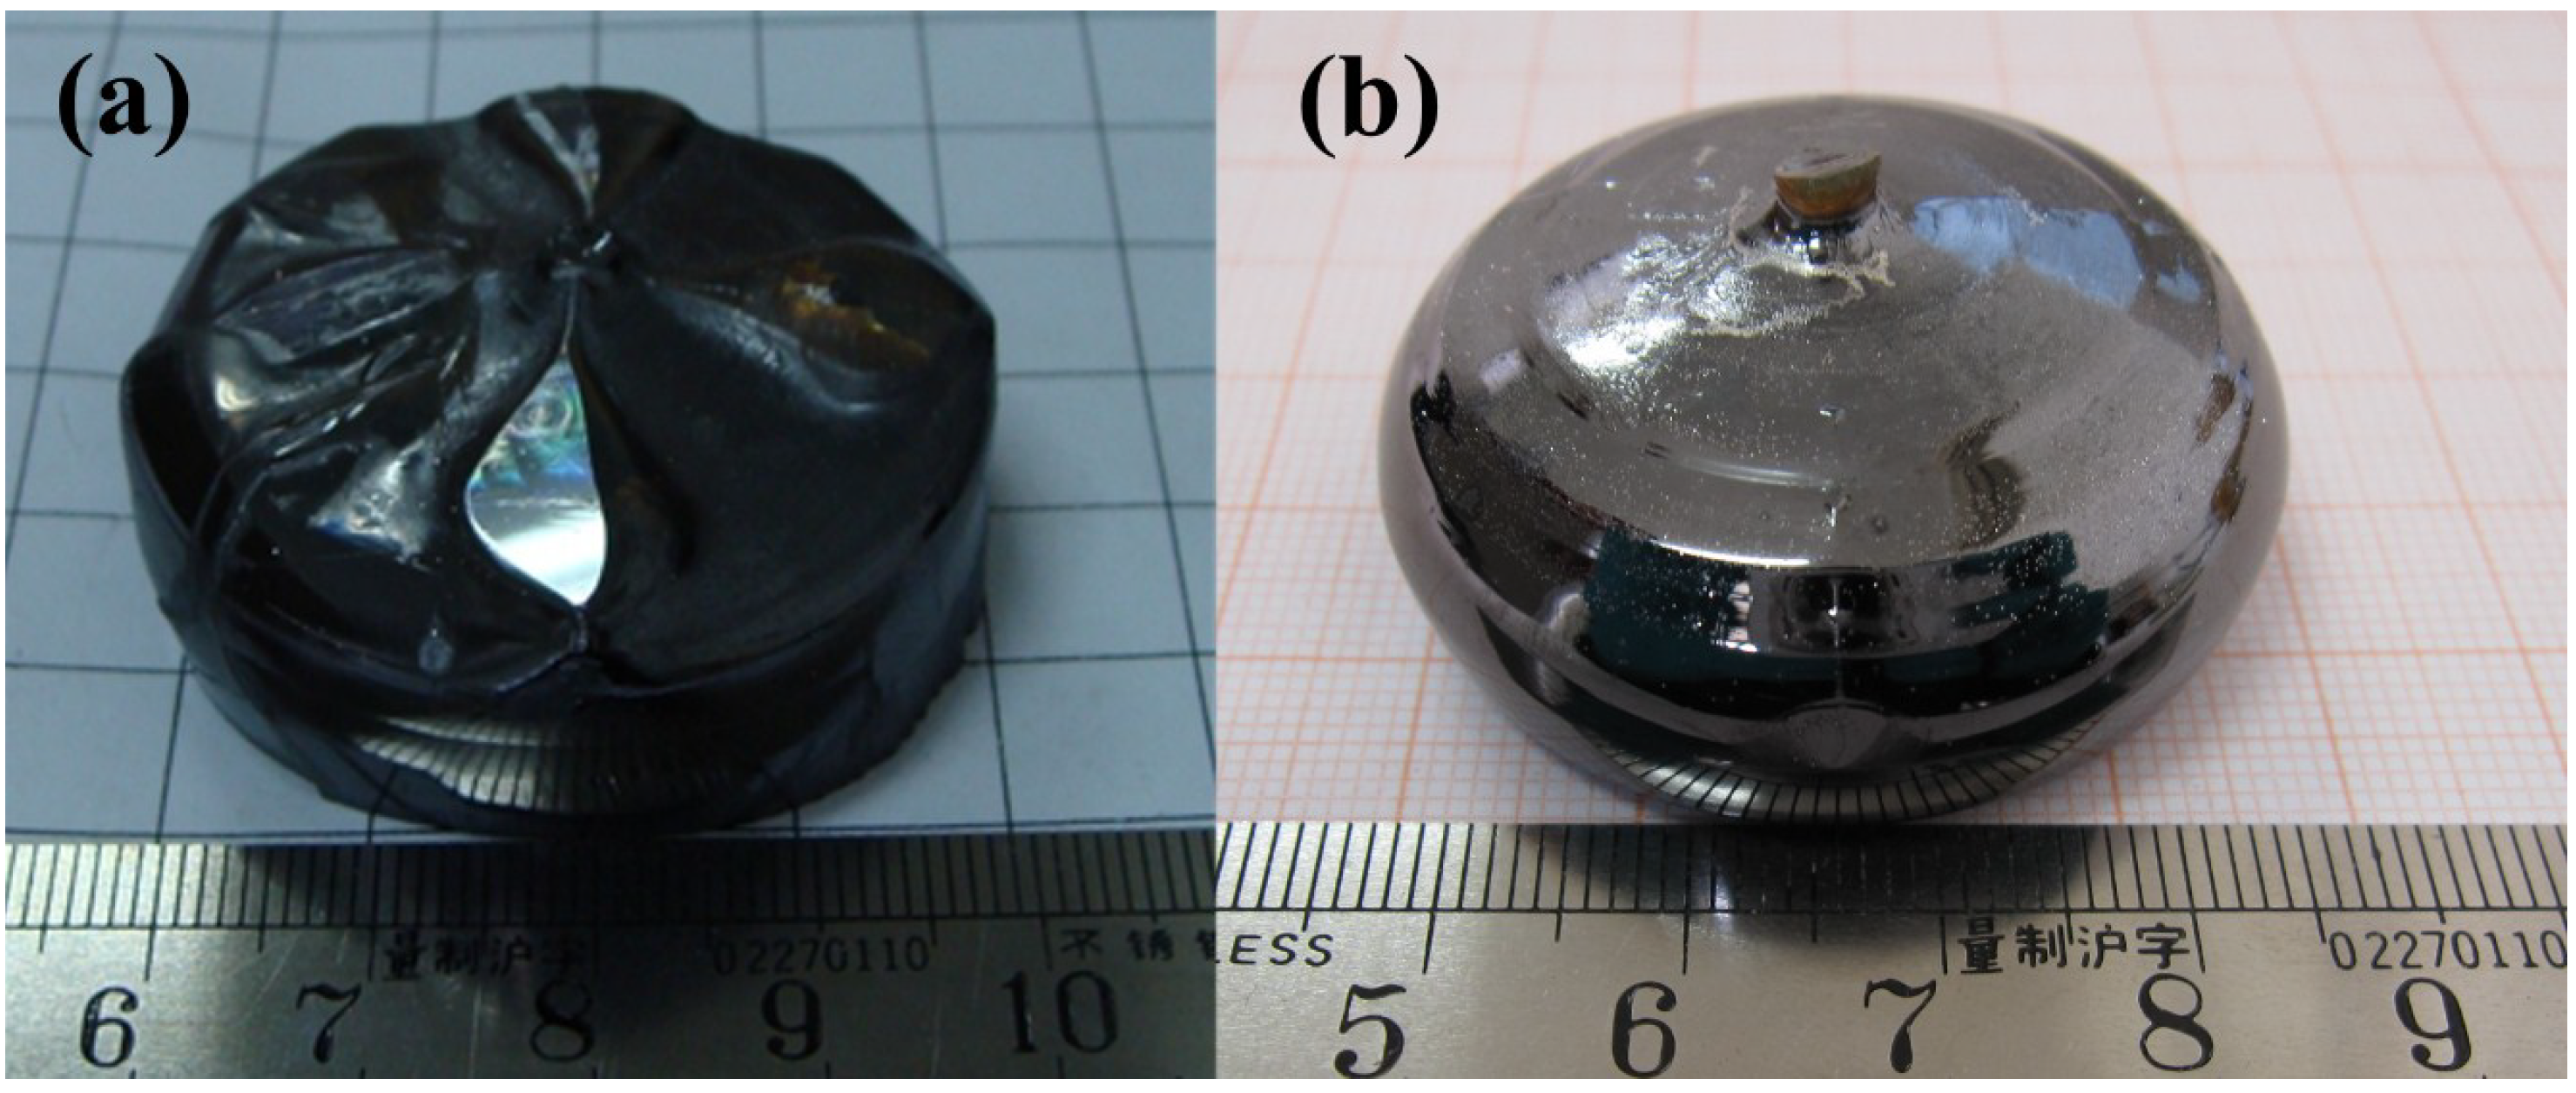
2.2.1. Crystal Growth of KNN

(K0.25Na0.75)NbO3 single crystals were grown by a carefully controlled TSSG technique. The raw materials of K2CO3 (99.99%), Na2CO3 (99.99%), and Nb2O5 (99.99%) were weighed according to the nominal ratio of 0.70KNbO3/0.30NaNbO3 to obtain KNN25/75 single crystals based on the KNbO3–NaNbO3 phase diagram in ref. [22]. Then the well mixed compounds were put into a platinum (Pt) crucible and calcined at 850 °C for 3 h in air to form the KNN70/30 polycrystalline precursor. Then the polycrystalline materials were ground and mixed with excess ~20 wt% Na2CO3 and K2CO3 as self-flux. When heated above 850 °C, both Na2CO3 and K2CO3 decomposed, so the real flux was Na2O–K2O. Single crystals were grown using a [001]pc direction seed in a Pt crucible, which was heated to ~1160 °C using a resistance furnace under an air atmosphere. The velocities of rotation and pulling of the rod with the seed crystal were, respectively, ~16 rpm and ~3.0 mm per day. At the end of the crystal growth, the crystals were separated from the flux–melt surface and then slowly cooled down to room temperature [28].
Figure 9a shows the photograph of the as-grown KNN25/75 single crystal pulled along the [001]pc direction, with dimensions of up to Ø30 × 10 mm2. The as-grown crystal is semi-transparent with no inclusions and exhibits four clear symmetrical growth ridges, indicating the cubic growth habit. A polished (100)pc wafer shown in Figure 9b is transparent with several domain walls visible in it.
Figure 9. Photographs of (a) the as-grown KNN25/75 single crystal and (b) the polished KNN25/75 single crystal wafer. Reprinted with permission from [28]. Copyright 2014 Royal Society of Chemistry.
Crystals 05 00172 g009

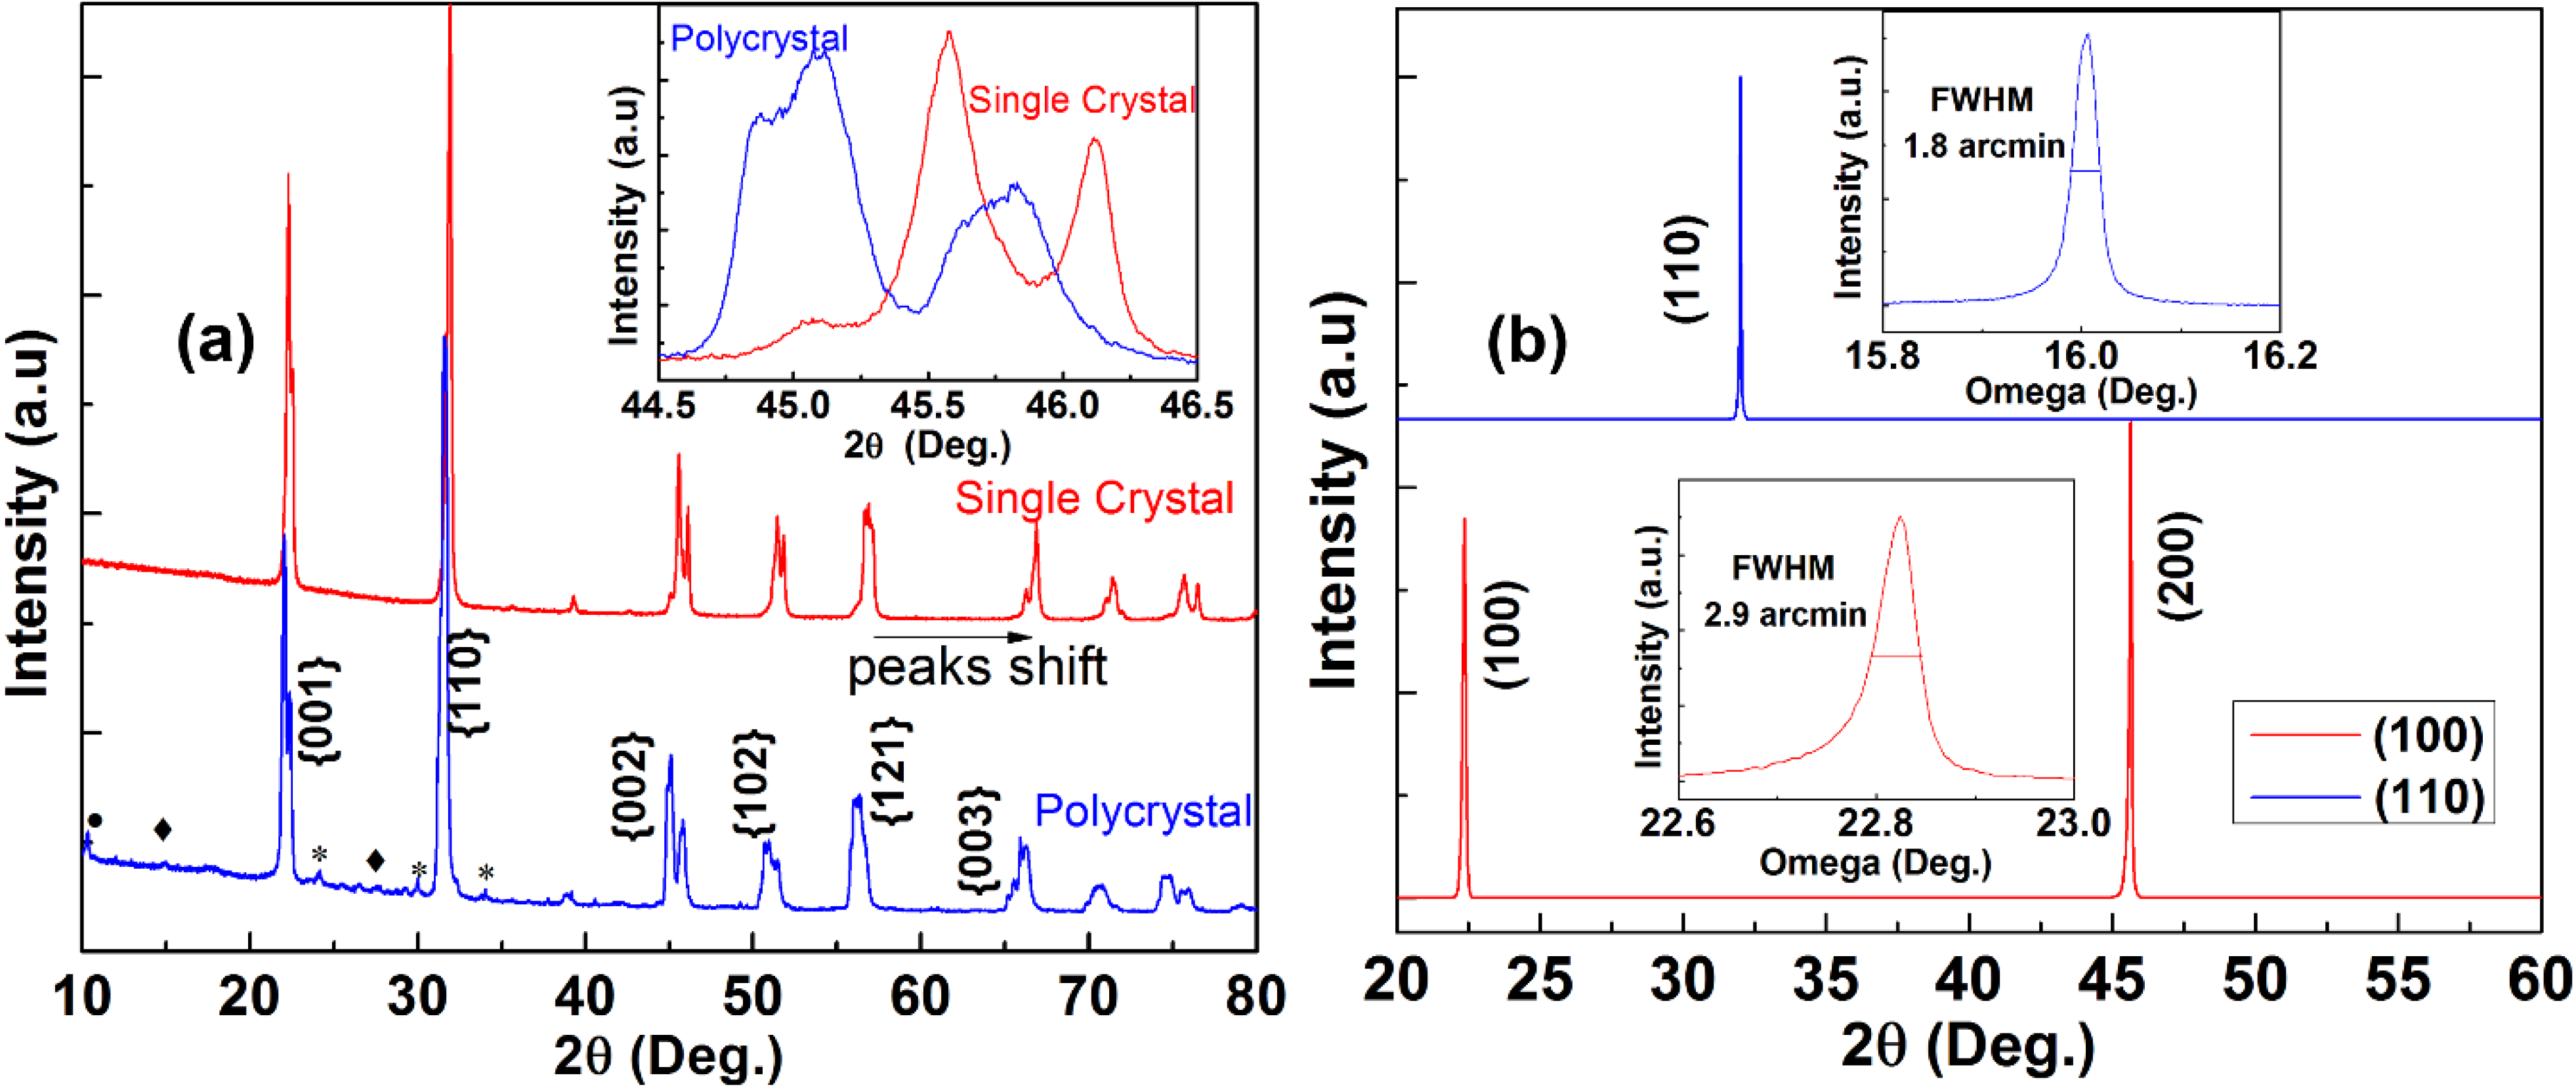
2.2.2. Phases and Domains in KNN

The lattice structure of the as-grown crystal was determined by X-ray diffraction which was carried out using a Huber-G670 X-ray diffractometer (Cu: Kα1, λ = 1.5406 Å, Karlsruhe, Germany). The diffractograms of the (100)pc and (110)pc oriented single crystals were obtained using a Bruker D8 Discover HRXRD system. The concentrations of K, Na, and Nb elements in the as-grown crystal were measured by X-ray fluorescence analysis (XRF). Based on the measured results, the effective segregation coefficients of K and Na were calculated.
The X-ray diffraction patterns of the KNN70/30 polycrystalline materials and powders of the as-grown single crystals are presented in Figure 10a. It is clear that both the raw materials and the KNN single crystals are of the perovskite-type structure. The splitting of the (200) cubic indexed peak at ~45°, indicates an orthorhombic symmetry of the KNN crystals. The peaks of the single crystal shifted to a higher angle compared with those of the starting polycrystalline powder, implying the volume decrease of the unit cell. Since the ionic radius of sodium is smaller than that of potassium, it is reasonable to consider that the decrease of the unit cell is induced by the decrease of potassium content in the single crystal caused by segregation. The effective segregation coefficients Keff, (Keff = CS/CL(∞)), of K and Na ions are calculated to be 0.36 and 2.8, respectively. The 2θ–ω scans of the (100)pc and (110)pc oriented single crystals are shown in Figure 10b. The XRD rocking curves of the (200)pc and (110)pc diffraction peaks have full width at half maximum (FWHM) of 2.9 and 1.8 arcmin, respectively, implying relatively high quality of the as-grown crystals [28].
Figure 10. (a) XRD patterns of the KNN70/30 polycrystalline material and the powder of as-grown KNN25/75 single crystals. (Minor peaks may be attributed to: “•”—K4Nb6O17 (PDF # 76-0977), “♦”—K3Nb7O19 (PDF # 78-1395), and “*”—KHCO3 (PDF # 12-0292)); (b) X-ray diffractograms of the (110)-oriented single crystal (top) and of the (100)-oriented single crystal (bottom). The insets show their respective rocking curves. Reprinted with permission from [28]. Copyright 2014 Royal Society of Chemistry.
Crystals 05 00172 g010

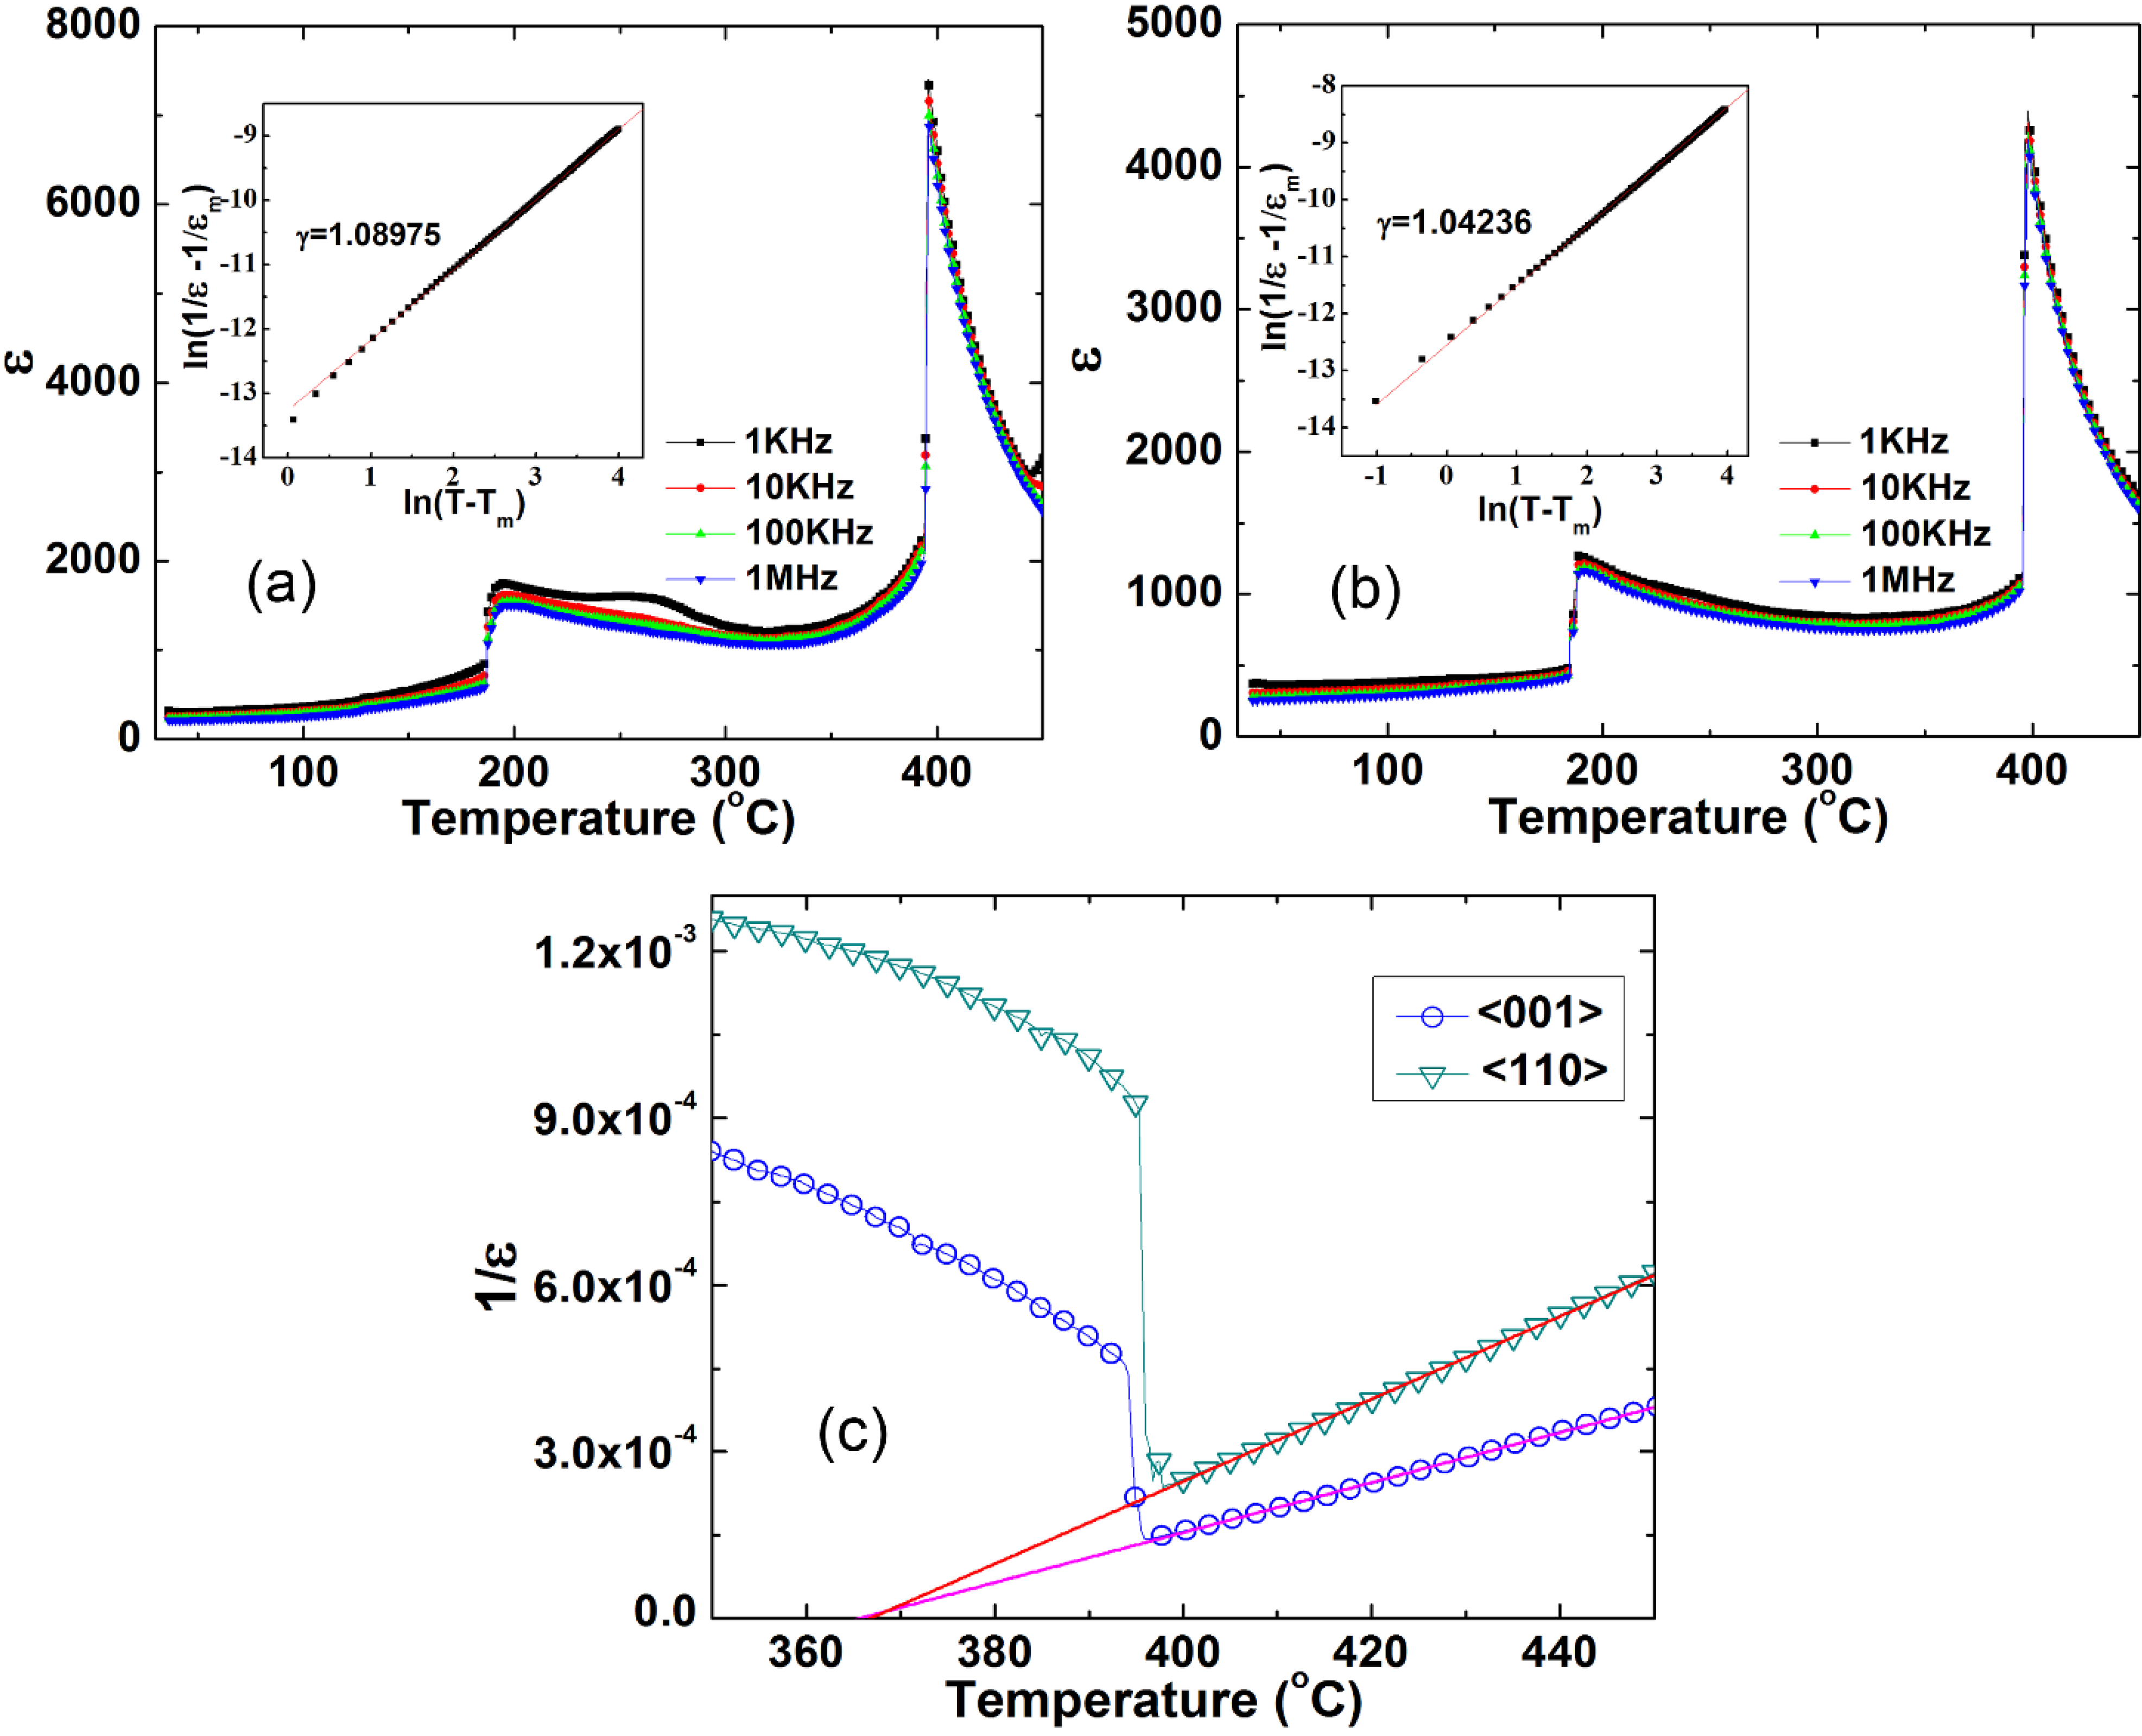
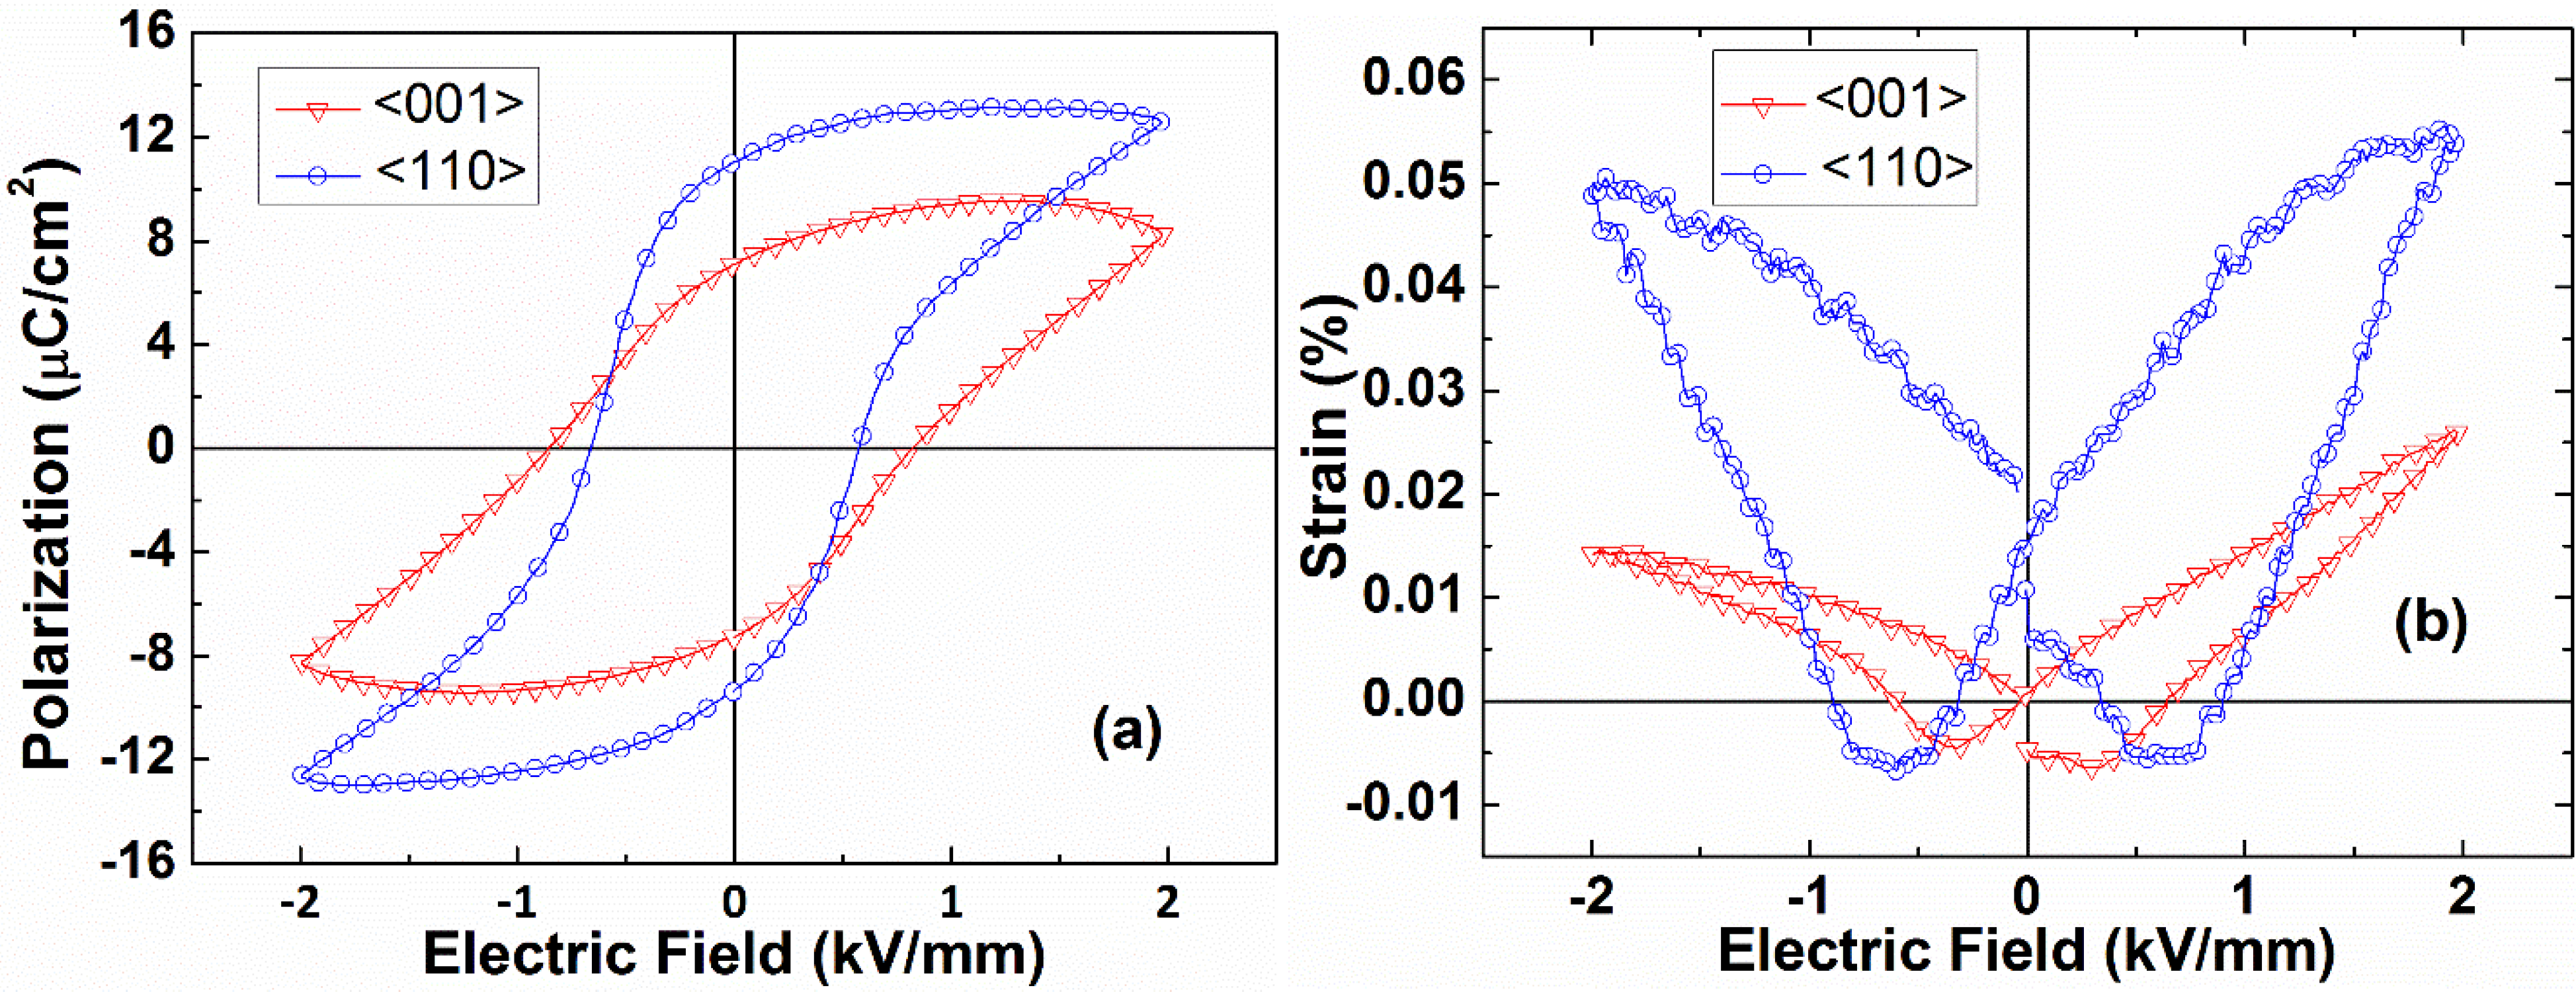
2.2.3. Dielectric, Piezoelectric, Ferroelectric Properties

For the electrical property measurements, the as-grown KNN single crystals were sliced into wafers with a thickness of ~0.48 mm, perpendicular to their pseudocubic [100]pc and [110]pc directions. Then, all of the samples were sputtered with gold electrodes. The temperature dependence of the dielectric properties of unpoled samples was analyzed in the temperature range of 30–450 °C using an Agilent 4294 A precision impedance analyzer. For the piezoelectric measurements, the crystal samples were poled in silicon oil at 180 °C for 15 min with a dc electric field of 40 kV/cm and then cooled to room temperature with half of the poling electric field. The d33 was tested using a Berlincourt quasistatic meter at 55 Hz. The electric field dependence of the polarization (P–E curves) and strain curves was characterized using a ferroelectric test system (aixACCT TF analyzer 1000) at room temperature.
Investigation into the dielectric properties of the KNN single crystals along different orientations reveals anisotropic behavior. Figure 11 illustrates the temperature dependence of the dielectric constant (ε) of the (100)pc and (110)pc oriented KNN25/75 crystals at different frequencies. The dielectric constants of both (100)pc and (110)pc plates show a sharp peak at ~396 °C, suggesting the ferro-to-paraelectric phase transition from the tetragonal (P4mm) to the cubic phase (Pm3m). Moreover, another dielectric anomaly peak appears at ~187 °C, which can be attributed to the phase transition from the orthorhombic (Amm2) to the tetragonal (P4mm) phase. The temperatures of every dielectric peak are consistent with each other at different orientations within experimental error. The detailed dielectric and piezoelectric properties of the single crystals are summarized in Table 2 [28].
Figure 11. Temperature dependence of the dielectric constants of (a) (100)pc and (b) (110)pc oriented KNN25/75 crystals at different frequencies. The insets show their respective ln(1/ε − 1/εm) vs. ln(TTm) curves; (c) 1/ε vs. T curves of (100)pc and (110)pc oriented KNN25/75 crystals. Reprinted with permission from [28]. Copyright 2014 Royal Society of Chemistry.
Crystals 05 00172 g011
Table 2. Dielectric, piezoelectric and ferroelectric properties of (100)pc and (110)pc orientated KNN25/75 single crystals (εrt represents the dielectric constant at room temperature). Reprinted with permission from [28]. Copyright 2014 Royal Society of Chemistry.
OrientationεrtεmPr (µC/cm2)Ec (kV/mm−1)d33 (pC/N)Strain (%)kt
(100)pc37574077.20.841450.0250.69
(110)pc423439510.20.61700.050.51
It can be seen in Figure 12 that the remanent polarization (Pr) of the (100)pc oriented crystals (7.2 μC/cm−2) is smaller than that of (110)pc (10.2 μC/cm−2). The ratio of remanent polarization along (100)pc to (110)pc is 1:1.42, which is very close to 1:2. On the other hand, the d33 value of the (100)pc samples is superior to that of (110)pc ones. Both these phenomena can be explained by the theory of the engineered domain configuration. The schematics of domain configurations for unpoled and poled (100)pc orthorhombic crystals are illustrated in Figure 13. For orthorhombic single crystals, the polar direction is along <110>pc. Unpoled orthorhombic single crystals have the configuration wherein the polar vectors are randomly orientated along equivalent <110>pc directions. When poled along [100]pc, the crystal reached a domain engineering state in which each domain has one of four possible polar directions ( [ 110 ] pc, [ 1 1 ¯ 0 ] pc, [ 1 ¯ 10 ] pc, [ 1 ¯ 1 ¯ 0 ] pc). Therefore, the remanent polarization of [100]pc should be the projection of the polarization vector along [110]pc. As for the (110)pc orientated crystal, a single domain state can be expected if the complete poling state is achieved. That is why the remnant polarization of (100)pc oriented KNN25/75 crystals should be 1 / 2 of that of the (110)pc oriented crystals. However, the single domain configuration is not stable because of the high elastic and electrostatic energy. The (110)pc oriented crystal would depolarize when the electric field is removed, which results in inferior electromchanical coupling coefficients and piezoelectric properties [28].
Figure 12. (Color online) (a) Polarization and (b) strain hysteresis loops of (100)pc and (110)pc oriented KNN25/75 single crystals at room temperature. Reprinted with permission from [28]. Copyright 2014 Royal Society of Chemistry.
Crystals 05 00172 g012
Figure 13. (Color online) (a) Schematics of domain configurations for (100)pc-oriented orthorhombic KNN25/75 crystals. The left panel: in the unpoled state, the polarization vectors are along twelve equivalent (110)pc directions. The right panel: poled along (100)pc, only 4 polarization directions are left; (b) The domain switching process of one domain in (100)pc crystals and (c) in (110)pc crystals. Reprinted with permission from [28]. Copyright 2014 Royal Society of Chemistry.
Crystals 05 00172 g013

3. The Properties Modifications by Ions Doping and Defects Structure in Lead-Free Crystals

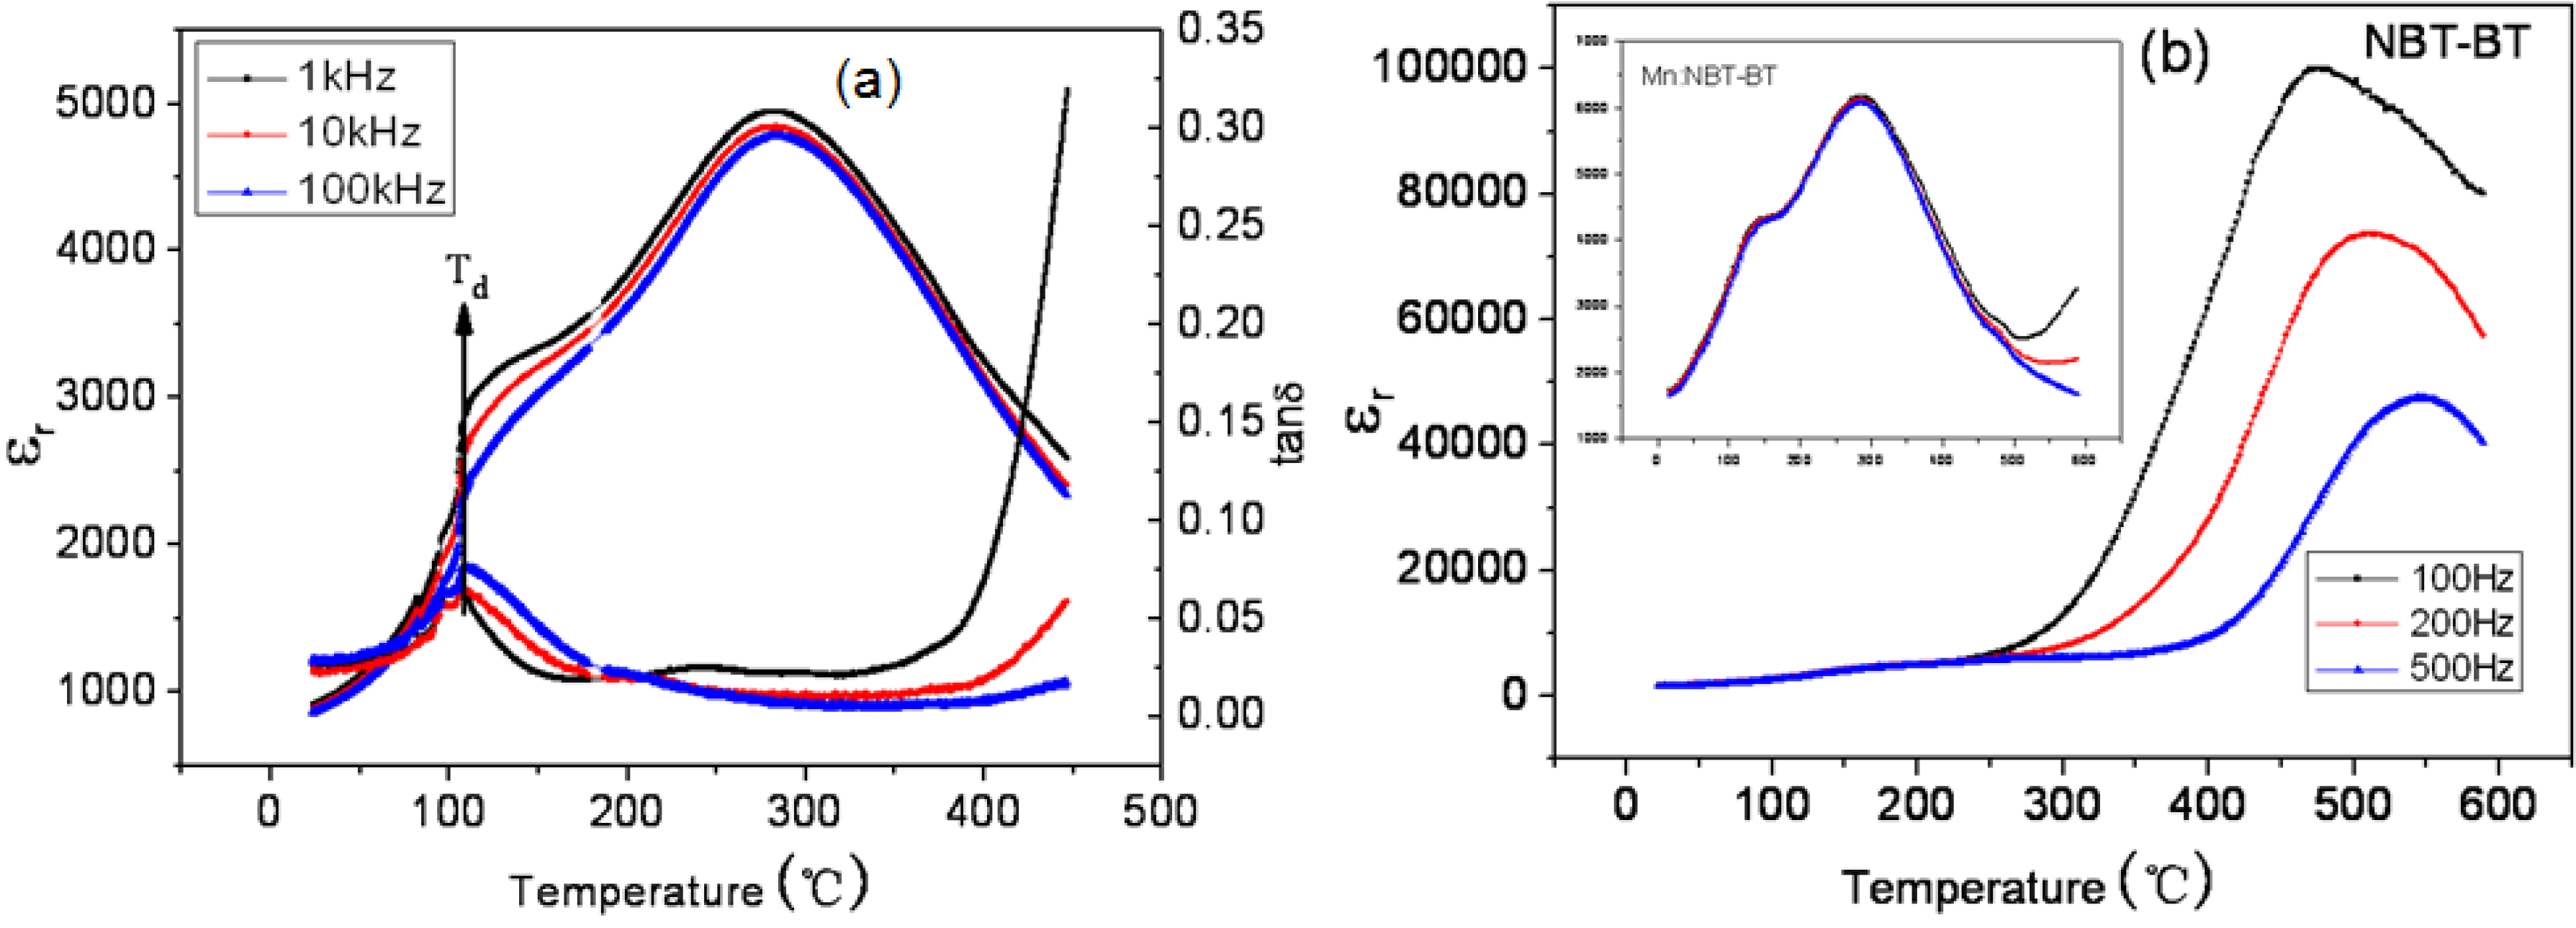
3.1. Mn-doped NBT-BT Single Crystals and Their Piezoelectric Properties

The electric properties of NBT-BT solid solutions might obviously be enhanced by doping and by optimizing preparation conditions. Values for the piezoelectric constant d33 of NBT-BT ceramics and single crystals have been reported to be as high as 205 pC/N and 280 pC/N, respectively [29]. However, these properties are still notably inferior to those of lead-based ones. In addition, relatively high leakage currents due to defects are another problem to overcome in NBT-BT, which can interfere with poling and polarization switching. Modest concentrations of Mn dopants have been reported to be an effective method by which to enhance the resistivity of lead-based materials.
Photos of as-grown Mn-doped crystals are shown in Figure 14. Analysis by ICP-AES of as-grown crystals revealed that the concentrations of Ba and Mn ions were 5.6 and 0.14 at%, respectively. The results indicate that Ba ions experienced notable composition segregation during crystal growth. Pure NBT-BT crystals with the same concentration of Ba ions were grown for comparisons.
Figure 14. (Color online) Photos of Mn-doped NBT-BT single crystals and samples (a) grown using <001> oriented seed (Mn:NBT-BT) and (b) grown using Pt wire as seed [Mn:NBT-BT]. Reprinted with permission from [29]. Copyright 2009 AIP Publishing LLC.
Crystals 05 00172 g014
Figure 15a shows the temperature and frequency dependence of εr and tanσ for a poled (001) oriented Mn:NBT-BT crystal. Two abnormal dielectric peaks can be seen, as indicated by Td and Tm. The depolarization temperature Td plays an important role with regard to practical applications of NBT-BT single crystals, as it was previously been reported as the temperature of a ferroelectric to antiferroelectric transformation, whereas Tm that of an antiferroelectric → paraelectric transition. In addition, the dielectric peak at Td is frequency dispersive, implying a relaxorlike character. Recently, other perspectives of the nature of the phase transition at Td were presented, and clearly further studies concerning the mechanism of depolarization are needed.
Figure 15. (Color online) Dielectric constant of <001> oriented poled Mn: NBT-BT and NBT-BT crystal samples as a function of temperature. (a) Mn:NBT-BT at the frequencies of 1, 10, and 100 kHz; (b) Low frequency (100–500 Hz) dielectric constant of Mn:NBT-BT and NBT-BT. Reprinted with permission from [29]. Copyright 2009 AIP Publishing LLC.
Crystals 05 00172 g015
Figure 15b shows the low frequency (100–500 Hz) dielectric constant as a function of temperature for NBT-BT, with the inset showing that for Mn:NBT-BT. These data reveal a dramatically enhanced dielectric constant for NBT-BT in the temperature range of 300–600 °C, yielding values in excess of 105, which were extremely frequency dispersive. These data give evidence of the presence of a space charge conduction mechanism at elevated temperatures as previously reported, which results in correspondingly high loss factors. It is important to note in this temperature range of 300–600 °C, that Mn was extremely effective in suppressing such conduction effects, as can be seen in the inset [29].
The P-E and S-E hysteresis loops at room temperatures under bipolar drive for (001) Mn:NBT-BT crystals are shown in Figure 16a,b, respectively. The remnant polarization was Pr = 45.3 μC/cm−2 for Mn:NBT-BT, grown with NBT-BT seeds, which was larger than the 35 μC/cm−2 of Mn:NBT-BT, grown with Pt-wire seeds. Because of improvement in crystal quality and a decrease in leakage current density, higher remnant polarizations Pr were found for Mn:NBT-BT relative to Mn:NBT-BT. We also found that the P-E hysteresis loops of Mn: NBT-BT had higher saturation polarizations than that previously reported for NBT-BT. Figure 16b shows the S-E curve for Mn:NBT-BT, where a maximum strain of 0.15% was found under 25 kV/cm. A comparative summary of the piezoelectric and ferroelectric properties for Mn:NBT-BT crystals with other piezoelectric materials is given in Table 3. This summary clearly shows that Mn:NBT-BT single crystals have notably superior electromechanical properties relative to that previously reported for PZT4 ceramics and for NBT-BT crystals. For our Mn:NBT-BT crystals, values of d33, kt, and k31 of 483 pC/N [29].
Figure 16. (Color online) (a) P-E hysteresis loops for Mn:NBT-BT samples compared with Mn:NBT-BT one; (b) strain vs. bipolar electric field curve for Mn:NBT-BT crystals at room temperatures. Reprinted with permission from [29]. Copyright 2009 AIP Publishing LLC.
Crystals 05 00172 g016
Table 3. Piezoelectric and ferroelectric properties of PZT4 ceramics and NBT-BT, Mn:NBT-BT, and Mn:NBT-BT single crystals. Reprinted with permission from [29]. Copyright 2009 AIP Publishing LLC.
Samplesd33 (pC/N)kt (%)k31 (%)d31 (pC/N)PrEc (kV/mm)
PZT42504833170
NBT-BT28016.443.27
Mn:NBT-BT(Pt)28756352.67
Mn:NBT-BT48355.639.715545.32.91

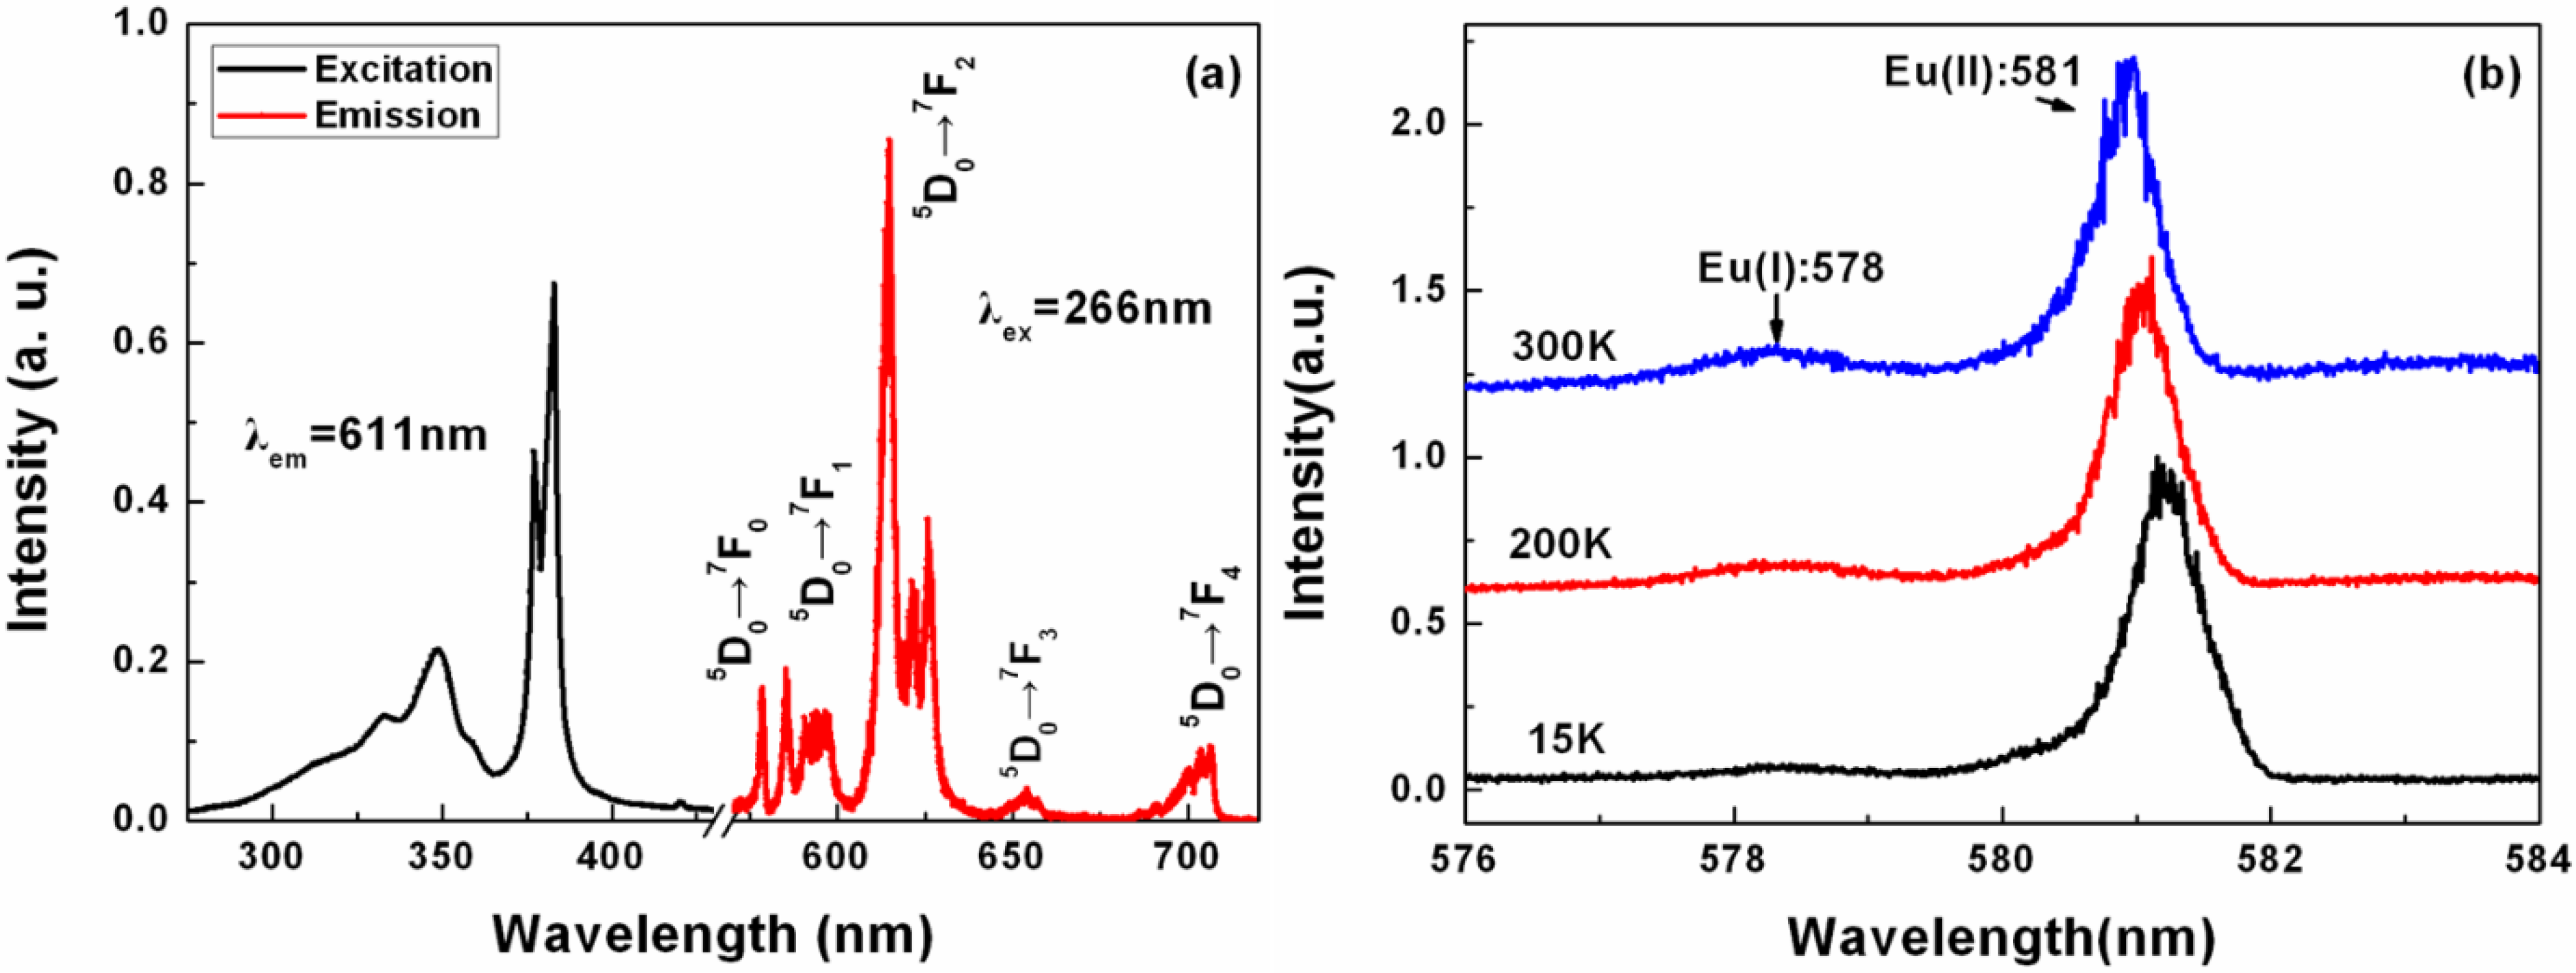
3.2. Eu-Doped NBT Single Crystals and Their Electrical Properties

Since the wavelength and positions of photoluminescence excitation and emission bands of Eu3+ strongly depend on the local structure, it was considered as a local chemical environment order probe. Therefore, a study on Eu3+ doped NBT single crystals will help to better understand the local crystal structure and hence guide the design of high property NBT-based materials. Eu3+-doped NBT single crystals were grown by a top-seeded solution growth (TSSG) method. Photoluminescence excitation and emission were measured. Temperature-dependent 7F0-5D0 excitation spectra and decay curves were characterized. The effects of Eu3+-doping on electrical properties were also studied [30].
Figure 17 shows the excitation spectra for the 7F0-5D0 transition, which is acquired by monitoring the total luminescence from Eu3+ in NBT single crystal at 15, 200 and 300 K. The presence of two peaks around 578 and 581 nm indicates that Eu3+ ions are incorporated into two adjacent crystallographic sites i.e., Bi3+ [Eu(I)] and Na+ [Eu(II)] sites. The strong Eu(I) peak reveals that Eu3+ Ions mainly substitute Bi3+ ions, while the broad feature of the Eu(II) peak demonstrates that Na+ ions displace in a disorder way.
Figure 17. (a) Room temperature excitation and emission spectra; (b) temperature dependent excitation spectra of 7F0-5D0 transition. Reprinted with permission from [30]. Copyright 2014 Springer.
Crystals 05 00172 g017
Electrical properties of NBT crystals are summarized in Table 4 [30]. Compared with pure NBT crystal, the dielectric and ferroelectric properties of Eu:NBT crystal are improved obviously: the dielectric loss decreases from ~0.040 to ~0.030, while the remnant polarization (Pr) and piezoelectric constant (d33) increase to 7.38 μC/cm−2 and 86 pC/N, respectively. Based on the photoluminescence results, the effects of Eu3+-doping on electrical properties can be naturally understood. The addition of Eu2O3 will compensate the volatilized Bi2O3 and hence reduce the concentration of Bi vacancies. Therefore, the leakage current will be effectively reduced, which facilitates the poling process and thus leads to improved piezoelectric properties. The decrease of Bi vacancies will relax the stress caused by lattice distortion. Besides, it also results in the decrease of the extrinsic structure/chemical heterogeneities in nanometer-scale. These mechanisms result in the depressed dielectric dispersion behavior in Eu:NBT single crystals.
Table 4. Electrical properties of NBT and Eu:NBT single crystals. Reprinted with permission from [30]. Copyright 2014 Springer.
Samplesεr (@1 Hz)tanσ (@1 Hz)Ec (kV/mm)Pr (C/cm2)d33 (pC/N)Tm (°C)Reference
NBT700–7500.037–0.0401.823.060–80358[21]
Eu:NBT7320.0273.247.3886333Present

3.3. Zn-doped NBT Single Crystals and Their Electrical Properties

Recent theoretical studies on Bi(Zn1/2Ti1/2)O3 (BZT) predicted that it could be a promising lead-free candidate ferroelectric material with a high c/a ratio of 1.21 and large calculated ferroelectric polarization of 150 μC/cm−2, whereas it is not stable in its pure form and can only be stabilized at high pressure. However, it is reported that BZT-containing solid solutions can be stable in atmospheric condition and still have enhanced c/a ratio, ferroelectric polarization, and increased Tc. Therefore, BZT could be an interesting alternative to some lead-free relaxor ferroelectrics for the purpose of composing binary or ternary solid solutions. Zhang et al. [31] reported that a rhombohedral-tetragonal MPB composition exists near Bi0.5Na0.5TiO3-3.75Bi(Zn0.5Ti0.5)O3 and the MPB composition shows improved electrical properties.
Raw powders of Na2CO3, Bi2O3, TiO2, and ZnO with purity more than 99.99% were used as the starting materials. The well-mixed powders with the composition of NBT-7BZT were calcined to synthesis polycrystalline material at 1000 °C for 10 h in air. Then, the powders mixed with excess 20 wt% Bi2O3 and Na2CO3 as self-fluxes were put into a platinum crucible. More details of crystal growth can be found in our previous work. Figure 18 shows the NBT-BZT single crystal boule 35 mm in diameter and 12 mm in length grown by the TSSG method. The as-grown crystal looks yellowish and transparent in color.
Figure 18. The as-grown NBT-1.5BZT single crystal (scale in mm). Reprinted with permission from [31]. Copyright 2014 John Wiley and Sons.
Crystals 05 00172 g018
Figure 19 shows the dielectric constant εr and loss factor tanσ as a function of temperature at 1 kHz for unpoled <001>-oriented NBT and NBT-1.5BZT crystals [31]. It can be seen that the NBT-1.5BZT sample exhibited higher value of εr at room temperature. However, the maximum value of εr was decreased compared with NBT sample. The phase transition temperature Tm corresponded to the maximum in the dielectric constant. It was found that the addition of BZT into NBT increased Tm slightly from 327 °C to 339 °C. A similar phenomenon was also observed in NBT-BZT ceramics. However, for other BZT-containing system such as BZT–PbTiO3, the large improvement of Tm or Curie temperature (Tc) was obtained when the mole ratio of BZT was up to 40%. This suggested that the Tm could be further improved if the content of BZT was increased in NBT-BZT system.
Figure 19. (a) Temperature and frequency dependence of dielectric constant and dielectric loss at 1 kHz; and (b) a plot of ln(1/εr – 1/εmax) vs. ln(TTm) for unpoled <001>-oriented NBT and NBT-1.5BZT crystals. Reprinted with permission from [31]. Copyright 2014 John Wiley and Sons.
Crystals 05 00172 g019
Figure 20a shows the room-temperature P-E hysteresis loops of unpoled <001>-oriented NBT-1.5BZT crystal under different electric fields. It can be seen that the remnant polarization (Pr) and coercive electric field (Ec) under 100 kV/cm. corresponded to 21.5 μC/cm−2 and 59.6 kV/cm, respectively. Meanwhile, the P-E loop of pure NBT crystal under 60 kV/cm is shown in the inset of Figure 20a. The Pr was determined to be 11.0 μC/cm−2, which was lower than that of NBT-1.5BZT crystal (Pr = 19.1 μC/cm−2) at the same field level. Figure 20b shows the S-E curve for NBT-1.5BZT crystal, where a net strain up to 0.23% was observed under 100 kV/cm. In addition, the unipolar strain was measured and is shown in the inset of Figure 20b. It was found that the maximum strain was 0.12%.The piezoelectric constant d33 value measured by a quasistatic Berlincourt meter was 121 pC/N for the <001>-oriented NBT-1.5BZT crystal. It is worth mentioning that the value of d33 in NBT-1.5BZT crystal exceeded that of NBT-3.75BZT ceramics around the MPB composition (d33 = 92 pC/N). Therefore, a better piezoelectric property could be expected if the real composition of as-grown NBT-BZT crystal is close to the MPB [31].
Figure 20. (a) P-E hysteresis loop and (b) S-E hysteresis loop for unpoled <001>-oriented NBT-1.5BZT crystal at room temperature. Reprinted with permission from [31]. Copyright 2014 John Wiley and Sons.
Crystals 05 00172 g020

4. Conclusions

The lead free relaxor-based ferroelectric single crystals NBT-BT with dimensions of Ø25 × 10 mm3 were grown by TSSG technique. The highest piezoelectric constant can be d33 ~ 280 pC/N. Mn-doped NBT-BT single crystals had superior piezoelectric and ferroelectric properties. We found values for d33 as high as 483 pC/N, which is competitive with conventional PZT ceramics. In addition, the leakage current of NBT-BT crystals decreased notably upon Mn substitution, allowing for a more complete poling. Lead-free NBT-BT crystals are promising as alternatives to conventional PZT piezoelectrics. High quality (K0.25Na0.75)NbO3 single crystals with dimensions of up to Ø30 mm × 10 mm were grown by a carefully controlled TSSG method. The piezoelectric constant d33 and the thickness electromechanical coupling factor kt are 145 pC/N and 69% for the (100)pc oriented crystal and 70 pC/N and 51% for the (110)pc oriented crystal, revealing a domain engineering effect.

Author Contributions

The paper wrote by Xiaobing Li, the experiments were carried by Chao Chen, Hao Deng and Haiwu Zhang, the analysis are contributed by Di Lin and Xiangyong Zhao, all the paper is directed by Haosu Luo.

Conflicts of Interest

The authors declare no conflict of interest.

References

  1. Cross, L.E. Relaxor ferroelectrics. Ferroelectrics 1987, 76, 241–267. [Google Scholar] [CrossRef]
  2. Ye, Z.G. Relaxor ferroelectric complex perovskites: Structure, properties and phase transitions. Key Eng. Mater. 1998, 81, 155–156. [Google Scholar]
  3. Noheda, B.; Cox, D.E.; Shirane, G.; Gonzalo, J.A.; Cross, L.E.; Park, S.E. A monoclinic ferroelectric phase in the Pb(Zr1−xTix)O3 solid solution. Appl. Phys. Lett. 1999, 74, 2059–2061. [Google Scholar] [CrossRef]
  4. Noheda, B.; Cox, D.E.; Shirane, G.; Guo, R.; Jones, B.; Cross, L.E. Stability of the monoclinic phase in the ferroelectric perovskite Pb(Zr1−xTix)O3. Phys. Rev. B 2000, 63. [Google Scholar] [CrossRef]
  5. Guo, R.; Cross, L.E.; Park, S.E.; Noheda, B.; Cox, D.E.; Shirane, G. Origin of the high piezoelectric response in Pb(Zr1−xTix)O3. Phys. Rev. Lett. 2000, 84, 5423–5426. [Google Scholar] [CrossRef] [PubMed]
  6. Wada, S.; Yako, K.; Kakemoto, H.; Tsurumi, T.; Kiguchi, T. Enhanced piezoelectric properties of barium titanate single crystals with different engineered-domain sizes. J. Appl. Phys. 2005, 98. [Google Scholar] [CrossRef]
  7. Suchanicz, J.; Kwapulinshi, J. X-ray diffraction study of the phase transitions in Na0.5Bi0.5TiO3. Ferroelectrics 1995, 165, 249–253. [Google Scholar] [CrossRef]
  8. Suchanicz, J. Investigation of the phase transitions in Na0.5Bi0.5TiO3. Ferroelectrics 1995, 172, 455–458. [Google Scholar] [CrossRef]
  9. Suchanicz, J. Peculiarities of phase transitions in Na0.5Bi0.5TiO3. Ferroelectrics 1997, 190, 77–81. [Google Scholar] [CrossRef]
  10. Suchanicz, J.; Poparwski, R.; Maryjasik, S. Some properties of Na0.5Bi0.5TiO3. Ferroelectrics 1997, 192, 329–333. [Google Scholar] [CrossRef]
  11. Suchanicz, J. Behavior of Na0.5Bi0.5TiO3 ceramics in the A.C. electric fieled. Ferroelectrics 1998, 209, 561–568. [Google Scholar] [CrossRef]
  12. Isupov, V.; Pronin, I. Temperature dependence of birefringence and opalescence of Na0.5Bi0.5TiO3 crystals. Ferroelectr. Lett. 1984, 2, 205–208. [Google Scholar] [CrossRef]
  13. Jones, G.O.; Thomas, P.A. Investigation of the structure and phase transitions in the novel A-site substituted distorted perovskite compound Na0.5Bi0.5TiO3. Acta Crystallogr. Sect. B 2002, 58, 168–178. [Google Scholar] [CrossRef]
  14. Takenaka, T.; Maruyama, K.I.; Sakata, K. Na0.5Bi0.5TiO3-BaTiO3 system for lead-free piezoelectric ceramics. Jpn. J. Appl. Phys. 1991, 30, 2236–2239. [Google Scholar] [CrossRef]
  15. Chiang, Y.M.; Farrey, G.W.; Soukhojak, A.N. Lead-free high-strain single-crystal piezoelectrics in the alkaline-bismuth-titanate perovskite family. Appl. Phys. Lett. 1998, 73, 3683–3685. [Google Scholar] [CrossRef]
  16. Zhou, T.S.; Huang, R.X.; Shang, X.Z.; Peng, F.; Gu, H.S. Lead-free In2O3-doped (Bi0.5Na0.5)0.93Ba0.07TiO3 ceramics synthesized by direct reaction sintering. Appl. Phys. Lett. 2007, 90. [Google Scholar] [CrossRef]
  17. Feng, C.D.; Xiang, P.H.; Li, H.D. Electrical Properties of La-Doped (Na0.5Bi0.5)0.94Ba0.06TiO3 Ceramics. Jpn. J. Appl. Phys. 2003, 42, 7387–7391. [Google Scholar] [CrossRef]
  18. Zhu, M.K.; Liu, L.Y.; Hou, Y.D.; Wang, H.; Yan, H. Microstructure and Electrical Properties of MnO-Doped (Na0.5Bi0.5)0.92Ba0.08TiO3 Lead-Free Piezoceramics. J. Am. Ceram. Soc. 2007, 90, 120–124. [Google Scholar] [CrossRef]
  19. Wang, X.X.; Chan, H.L.W.; Choy, C.L. Piezoelectric and dielectric properties of CeO2-added 0.94NBT-0.06BT lead-free ceramics. Solid State Commun. 2003, 125, 395–399. [Google Scholar] [CrossRef]
  20. Yi, J.Y.; Lee, J.K.; Hong, K.S. The role of Cation Vacancies on Microstructure and Piezoelectricity of Lanthanum-Substituted NBT Ceramics. Jpn. J. Appl. Phys. 2004, 43, 6188–6192. [Google Scholar] [CrossRef]
  21. Herabut, A.; Safari, A. Processing and Electromechanical Properties of La-doped NBT Ceramics. J. Am. Ceram. Soc. 1997, 80, 2954–2958. [Google Scholar] [CrossRef]
  22. Nagata, H.; Takenaka, T. Additive effects on electrical properties of (Bi0.5Na0.5)TiO3 ferroelectric ceramics. J. Eur. Ceram. Soc. 2001, 21, 1299–1302. [Google Scholar] [CrossRef]
  23. Zhou, X.Y.; Gu, H.S.; Wang, T.Y.; Li, W.Y.; Zhou, T.S. Piezoelectric properties of Mn-doped (Na0.5Bi0.5)0.92Ba0.08TiO3 ceramics. Mater. Lett. 2005, 59, 1649–1652. [Google Scholar] [CrossRef]
  24. Ge, W.W.; Liu, H.; Zhao, X.Y.; Pan, X.M.; He, T.H.; Lin, D.; Xu, H.Q.; Luo, H.S. Growth and characterization of Na0.5Bi0.5TiO3-BaTiO3 lead-free piezoelectric crystal by the TSSG method. J. Alloy. Compd. 2008, 456, 503–507. [Google Scholar] [CrossRef]
  25. Sun, R.B.; Zhao, X.Y.; Zhang, Q.H.; Fang, B.J.; Zhang, H.W.; Li, X.B.; Luo, H.S. Growth and orientation dependence of electrical properties of 0.92Na0.5Bi0.5TiO3–0.08 K0.5Bi0.5TiO3 lead-free piezoelectric single crystal. J. Appl. Phys. 2011, 109. [Google Scholar] [CrossRef]
  26. Smolensky, G.A.; Isupov, V.A.; Agranovskaya, A.I.; Krainik, N.N. New ferroelectrics of complex composition. Sov. Phys. Solid State 1961, 2, 2651–2654. [Google Scholar]
  27. Liu, H.; Ge, W.W.; Jiang, X.P.; Zhao, X.Y.; Luo, H.S. Growth and characterization of Mn-doped Na1/2Bi1/2TiO3 lead-free ferroelectric single crystal. Mater. Lett. 2008, 62, 2721–2724. [Google Scholar] [CrossRef]
  28. Deng, H; Zhao, X.Y.; Zhang, H.W.; Chen, C.; Li, X.B.; Luo, H.S. Orientation dependence of electrical properties of large-sized sodium potassium niobate lead-free single crystals. CrystEngComm 2014, 16, 2760–2765. [Google Scholar] [CrossRef]
  29. Zhang, Q.H.; Zhang, Y.Y.; Wang, F.F.; Wang, Y.J.; Lin, D.; Zhao, X.Y.; Luo, H.S. Enhanced piezoelectric and ferroelectric properties in Mn-doped Na0.5Bi0.5TiO3-BaTiO3 single crystals. Appl. Phys. Lett. 2009, 95, 2760–2765. [Google Scholar] [CrossRef]
  30. Zhang, H.W.; Zhao, X.Y.; Deng, H.; Chen, C.; Lin, D.; Li, X.B.; Luo, H.S. Photoluminescence and electrical properties of Eu-doped (Na0.5Bi0.5)TiO3 ferroelectric single crystals. Appl. Phys. A 2014, 114, 357–361. [Google Scholar] [CrossRef]
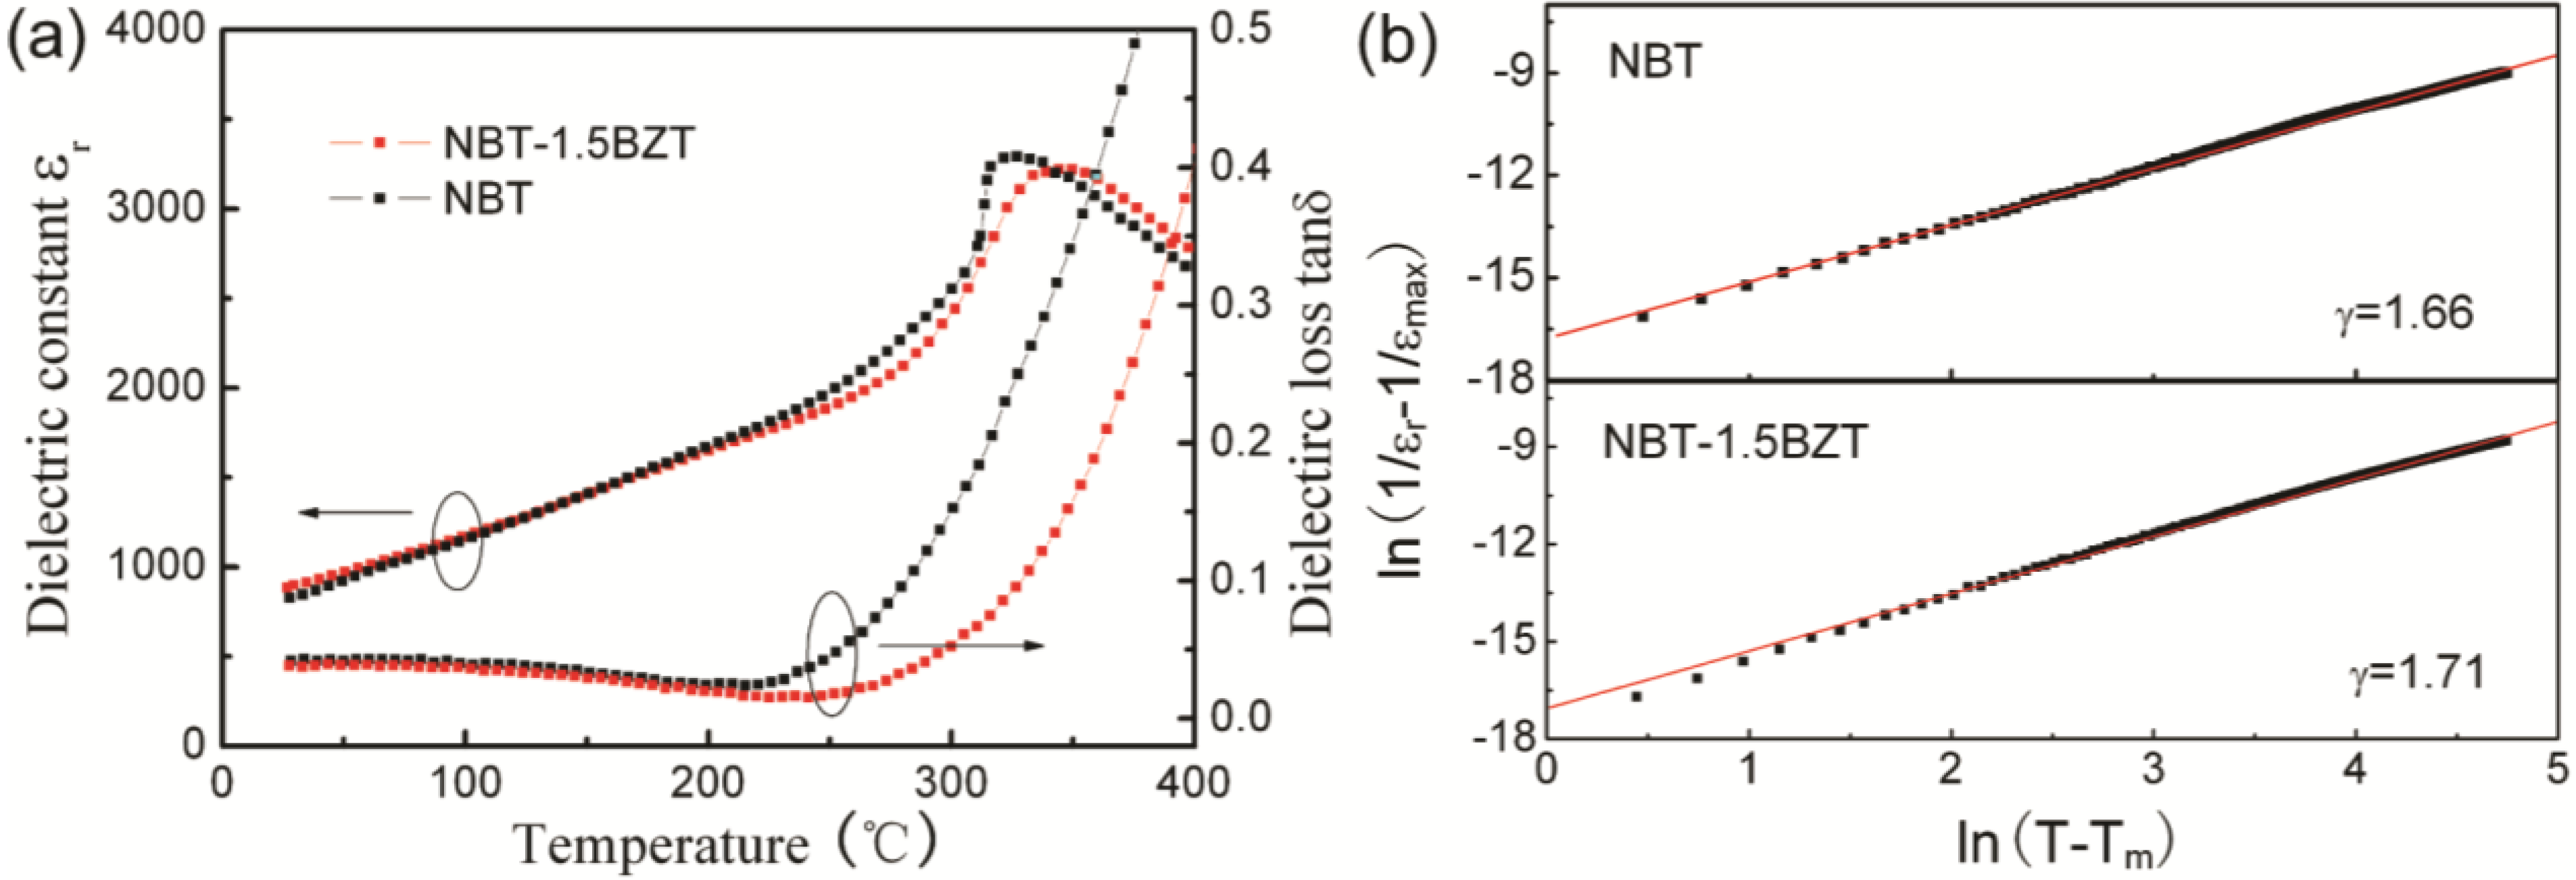
  31. Chen, C.; Zhang, H.W.; Zhao, X.Y.; Deng, H.; Li, X.B.; Luo, H.S. Structure, Electrical, and Optical Properties of (Na1/2Bi1/2)TiO3–1.5at.%Bi(Zn1/2Ti1/2)O3 Lead-free Single Crystal Grown by a TSSG Technique. J. Am. Ceram. Soc. 2014, 97, 1–5. [Google Scholar] [CrossRef]

