Preparation, Thermal, and Physical Properties of Perovskite-Type (C3H7NH3)2CdCl4 Crystals

1
Analytical Laboratory of Advanced Ferroelectric Crystals, Jeonju University, Jeonju 55069, Korea
2
Department of Science Education, Jeonju University, Jeonju 55069, Korea
3
Korea Basic Science Institute, Seoul Western Center, Seoul 120-140, Korea
4
Department of Chemistry, Kyungpook National University, Daegu 41566, Korea
*
Author to whom correspondence should be addressed.
Crystals 2019, 9(2), 108; https://0-doi-org.brum.beds.ac.uk/10.3390/cryst9020108
Submission received: 14 December 2018
/
Revised: 12 February 2019
/
Accepted: 14 February 2019
/
Published: 19 February 2019
Abstract
:To investigate the thermal and physical properties of perovskite-type (C3H7NH3)2CdCl4, its temperature-dependent chemical shifts and spin–lattice relaxation times are measured using thermogravimetric analysis (TGA), differential scanning calorimetry (DSC), magic angle spinning nuclear magnetic resonance (MAS NMR), and static NMR methods. Above 300 K, two phase transitions are observed at 398 K and 538 K. Each proton and carbon in the (C3H7NH3) cation is distinguished in the MAS NMR results. The environments around 1H, 13C, and 14N do not change with temperature according to the NMR spectra. In contrast, the resonance frequency of 113Cd in the CdCl6 octahedra decreases with increasing temperature, indicating an environmental change. The uniaxial rotations for 1H and 13C have high mobility at both high and low temperatures, and these are related to the phase transitions. In addition, the molecular motion of 113Cd in the anion becomes activated upon raising the temperature.
1. Introduction
Organic–metal hybrid compounds provide many opportunities for potential applications [1,2,3,4,5,6]. In these materials, a large number of organic and metal moieties with different properties can be combined within a single structure. Hybrid organic–metal compounds based on the perovskite structures were first reported in 1976, and recently there is increasing interest in them due to their potential as substitutes for perovskite [7,8]. Especially, layered perovskite-type compounds with the formula (CnH2n+1NH3)2MX4 (M = divalent metal, X = halogen ion) have interesting physical properties [9,10,11,12,13,14,15,16]. These compounds consist of inorganic layers of corner-sharing MX6 octahedra and organic layers of alkylammonium ions. N–H···X hydrogen bonds are formed between the NH3+ polar heads of the alkylammonium and the halogen atoms, and the polar heads occupy cavities among the octahedra [17]. In these materials, the cation dynamics and ion–ion interactions through hydrogen bonds affect the physical properties and thermal properties of structural phase transitions.
Previous studies have shown that the compound, when n = 3 and X = Cl, (C3H7NH3)2CdCl4, undergoes three phase transitions below 300 K [16,17,18]. At 183 K, 156 K, and 105 K, they move from normal (N) to incommensurate (IC) to commensurate (C), and to another commensurate (C’) phases respectively with the decreasing temperature. The N phase at room temperature has an orthorhombic structure, and its space group is Abma (Z = 4). In addition, at a higher temperature (535 K), a ferroelastic transition was reported to occur from the tetragonal phase (point group 4/mmm) to the ferroelastic orthorhombic phase (point group mmm) [19,20]. The lattice constants of the latter were a = 7.585 Å, b = 7.359 Å, and c = 25.053 Å [21,22]. The NH3 polar head of the alkylammonium chain points toward the layer of CdCl6 to form hydrogen bonds with Cl− in CdCl6, while the alkyl chains point away from the CdCl6 layer [23].
Using nuclear magnetic resonance (NMR) techniques, Blinc et al. [24] and Suzuki et al. [17] reported the spin–lattice relaxation times in the laboratory frame T1 for 1H and 2H in (C3H7NH3)2CdCl4 at low temperatures. However, the protons in C3H7 and NH3 were not distinguished from each other. The structural phase transition at low temperature was reported to be connected with a change in the motion of the alkyl groups. The cation motion associated with the molecular axis was found to become activated at higher temperatures.
Solid state 13C magic angle spinning (MAS) NMR, has proven to be a very powerful tool for studying the difference of the C–H vectors at different sites. The 13C spin–lattice relaxation time in the rotating frame T1ρ is not influenced by spin diffusion due to the weak dipolar coupling, which results from the low natural abundance and large separation of the nuclei [25]. The T1ρ measured by MAS NMR allows a probing molecular motion in the kHz range, whereas that in the laboratory frame T1 measured by static NMR reflects motion in the MHz range. Although the structural phase transitions of (C3H7NH3)2CdCl4 at low temperature have been examined by a few research groups [17,24], the corresponding phenomena at high temperatures have not been fully studied.
Here, we discuss the organic–metal hybrid (C3H7NH3)2CdCl4 crystal that was grown. The thermal and physical properties are discussed using thermogravimetric analysis (TGA), differential scanning calorimetry (DSC), and MAS NMR. The chemical shifts and T1ρ of (C3H7NH3)2CdCl4 were measured using 1H MAS NMR, 13C cross-polarization (CP)/MAS NMR, and 14N MAS NMR in order to clarify the structural geometry and dynamics of the cation. Each proton and carbon in the (C3H7NH3) cation was distinguished by MAS NMR. Additionally, the chemical shift and T1 value for 113Cd were obtained as a function of temperature. The dynamics of the cation and anion near the phase transition temperatures are discussed. In addition, the ferroelastic domain walls were observed by optical polarizing microscopy.
2. Experimental Section
Single crystals of (C3H7NH3)2CdCl4 were grown by slowly evaporating an aqueous solution containing C3H7NH3Cl and CdCl2 in 2:1 molar ratio at 27 °C. The obtained single crystals were transparent with a thin-plate shape. In addition, to determine the phase transition temperatures, DSC was carried out on the crystals with a Dupont 2010 DSC instrument under a heating rate of 10 K/min.
The NMR signals and the T1ρ values of (C3H7NH3)2CdCl4 were obtained for powder materials by solid state 1H MAS NMR, 13C CP/MAS NMR, and 14N MAS NMR at the respective Larmor frequencies of ω0/2π = 400.13, 100.61, and 43.34 MHz. The instruments were the Bruker 400 MHz NMR and Unity INOVA 600 MHz NMR spectrometers at the Korea Basic Science Institute, Western Seoul Center. The chemical shifts were referenced to tetramethylsilane (TMS) and NH4Cl. For all 1H, 13C, and 14N measurements, the powder sample was loaded into a 4-mm CP/MAS probe, and the MAS rate was set to 10 kHz to minimize spinning sideband overlap. The 1H T1ρ values were obtained using a π/2−t sequence by varying the spin-locking pulse durations. The 13C T1ρ values were obtained by changing the duration of the spin-locking pulse applied after the CP preparation period. The width of the π/2 pulse used for measuring T1ρ of 1H and 13C was 3.7 μs, and the spin-locking field was 67.56 kHz. The 14N MAS NMR signals were recorded using a π/2−t sequence, and the pulse width was 4 µs. The 113Cd NMR spectra and the T1 values of the single crystals were measured using a Bruker 400 MHz NMR spectrometer. The static magnetic field was 9.4 T, and the central radio frequency was set to ω0/2π = 88.73 MHz. The T1 value of 113Cd was measured using saturation recovery pulse sequence sat−t−π/2. Nuclear magnetizations of 113Cd nuclei at time t after the sat pulse were determined following the π/2 excitation pulse, and the π/2 pulse was 4.2 µs wide. The NMR spectra were recorded at temperatures of 180–430 K. Relaxation time outside this range could not be measured because of the limitations of the spectrometer used.
3. Results and Discussion
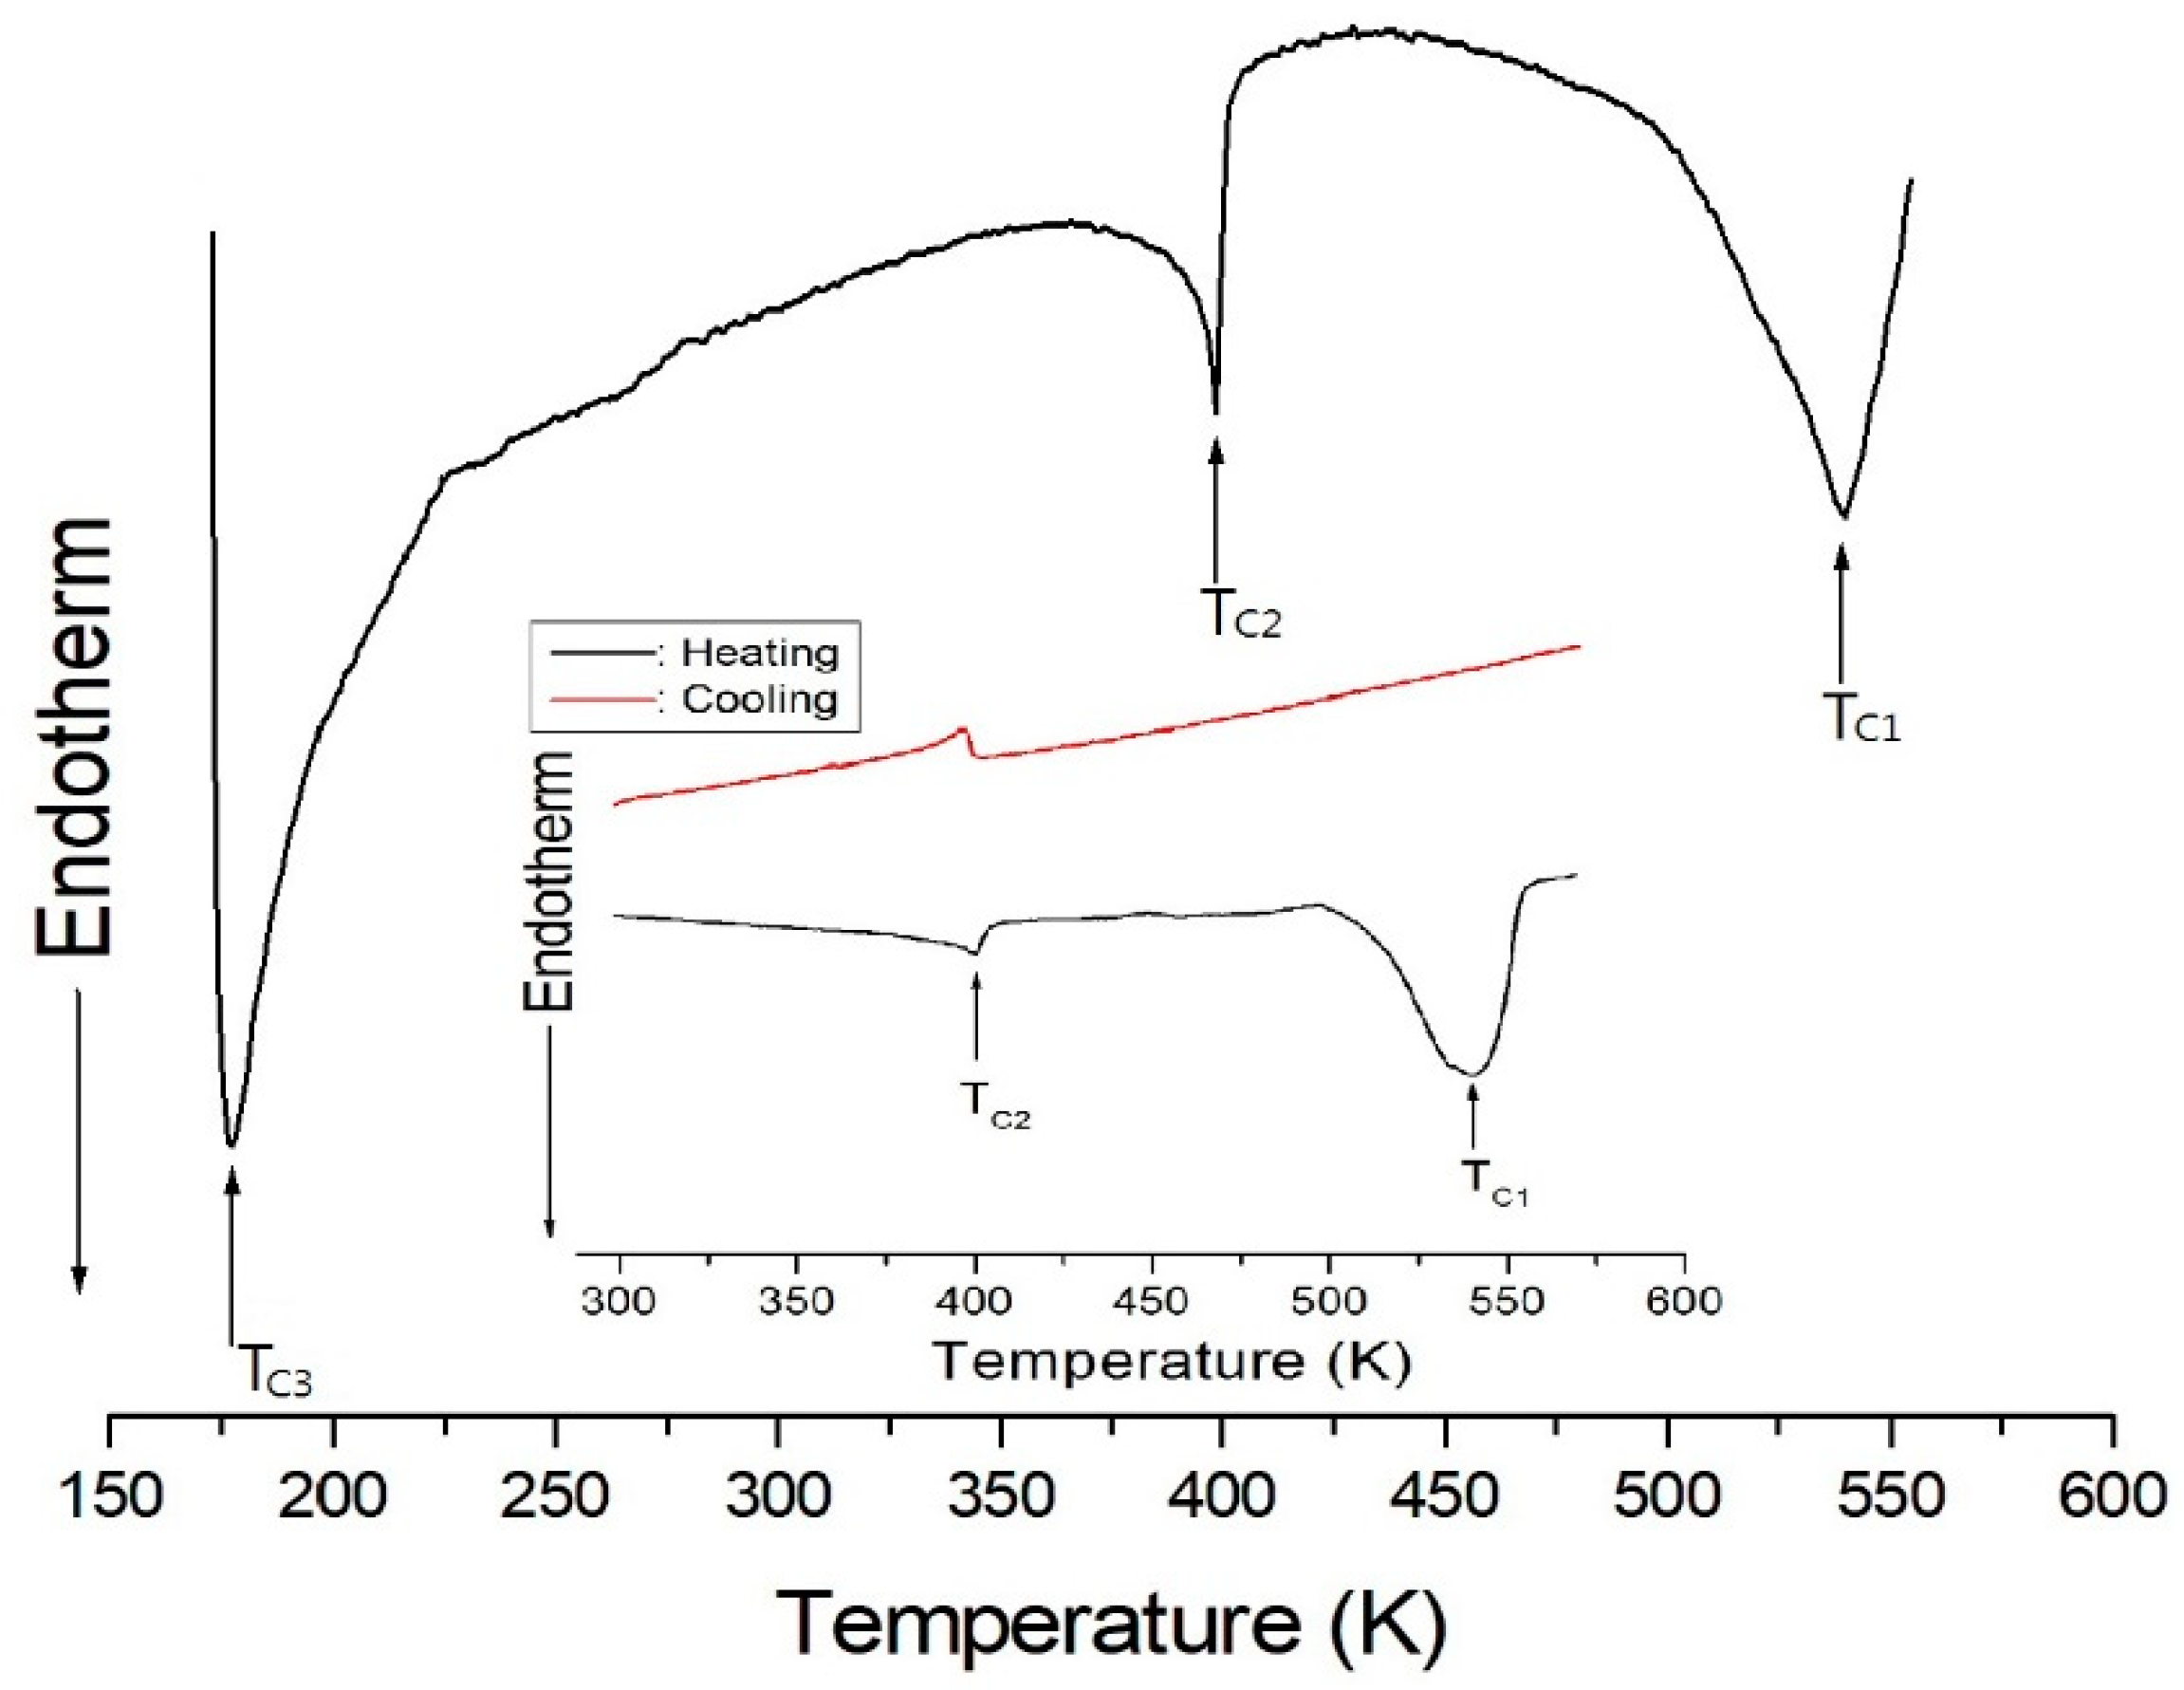
DSC analysis was used to determine phase transition temperatures of the (C3H7NH3)2CdCl4 crystal. Three endothermic peaks related to phase transitions were observed at 178 K (TC3), 398 K (TC2), and 538 K (TC1), as shown in Figure 1. Here, the transition temperatures of 178 K and 538 K are consistent with those reported by White et al. [26] and Ecolivet and Kusto [19], respectively. Meanwhile, the phase transition corresponding to the endothermic peak at 398 K has not been reported on before. On the other hand, DSC analysis at above 300 K was used to understand the temperature dependence. The curves reveal two endothermic peaks (TC2 and TC1) during heating, and one exothermic peak (TC2) during cooling, as shown in the inset of Figure 1. This change is irreversible with respect to temperature.
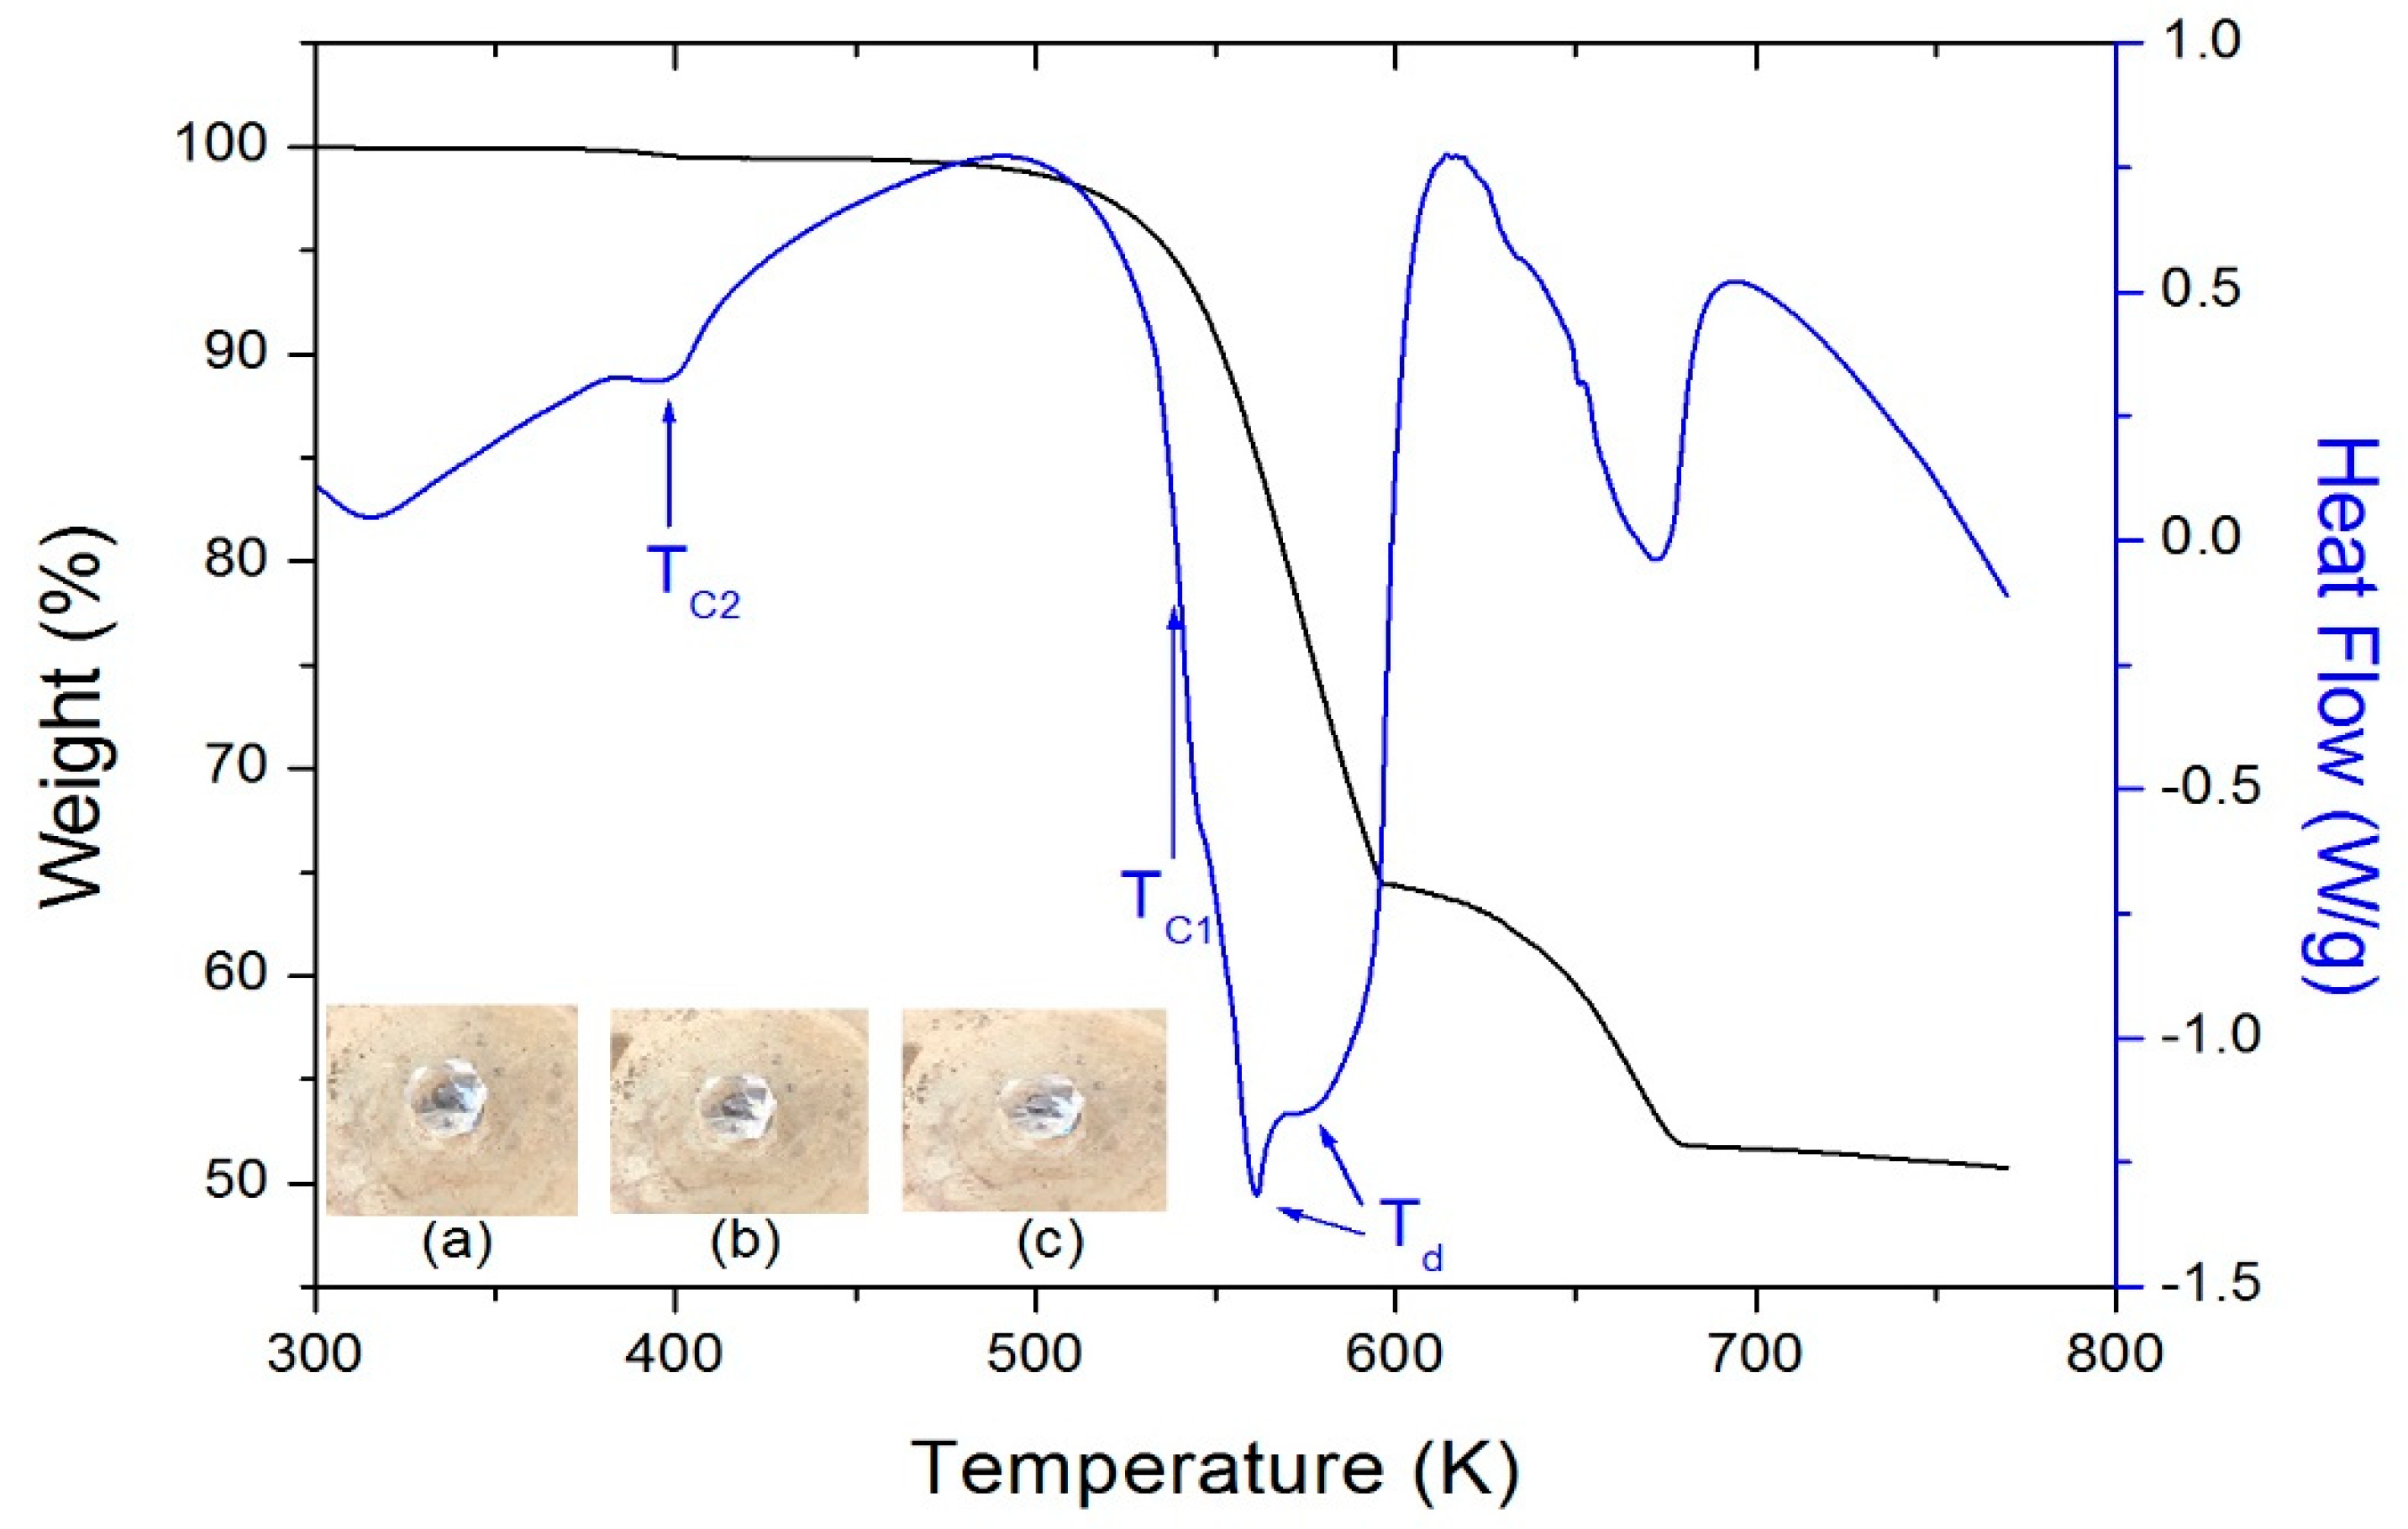
Figure 2 shows the TGA and DSC curves under a N2 atmosphere above 300 K. Minor weight loss of 1% is observed in the TGA for (C3H7NH3)2CdCl4 at a temperature as low as 398 K, which is ascribed to the onset of partial thermal decomposition. There is a sudden weight loss at 538 K and it is attributed to the beginning of C3H7NH2 and HCl evaporations. The weight loss was sharp between 540 and 617 K, with a corresponding weight loss of 36.5%. The DSC study results were used to confirm the presence of structural transitions below the melting/decomposition temperature. In the DSC curve, the endothermic peak at 398 K corresponds to a phase transition, while the endothermic peaks at 561 and 576 K (=Td) indicate the decomposition of (C3H7NH3)2CdCl4. Optical polarizing microscopic images (Figure 2a–c) showed that the crystals were colorless and transparent at 293–473 K.
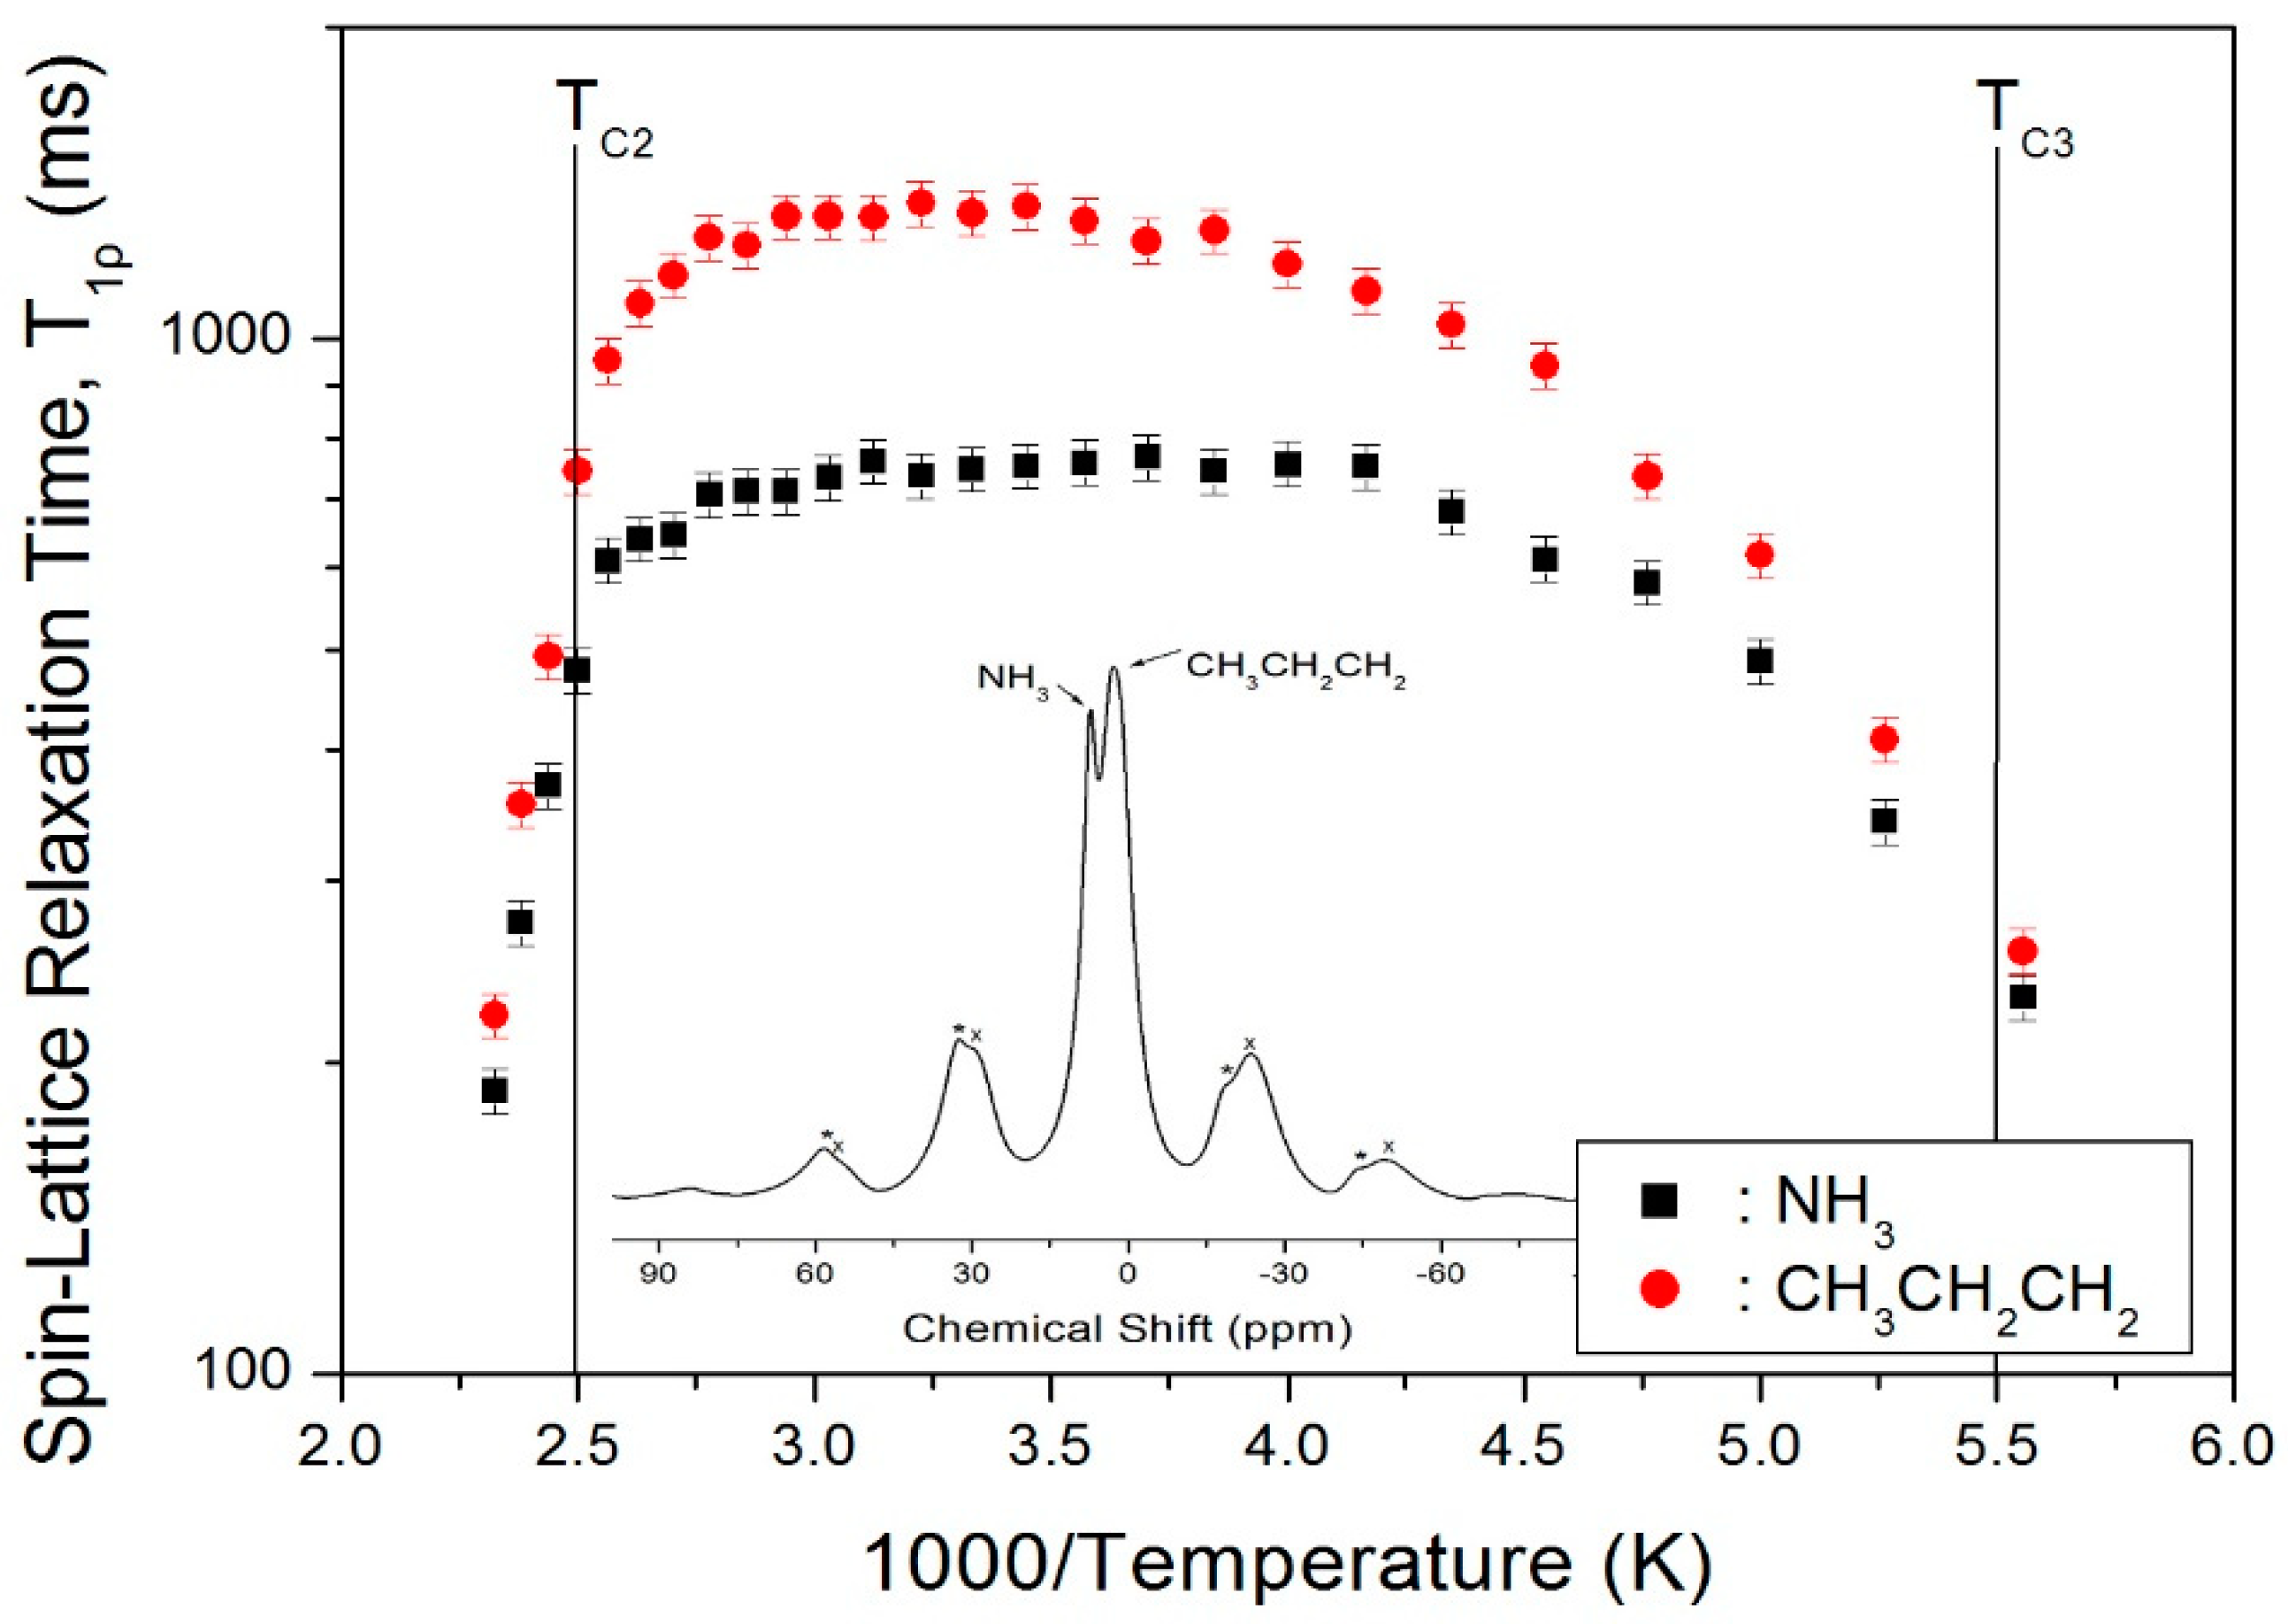
The 1H NMR spectra were obtained by MAS NMR, and the spectrum at 300 K shows two peaks (inset in Figure 3). The spinning sidebands are denoted with crosses and asterisks. The spectrum consists of two distinct peaks at δ = 2.77 and 7.18 ppm, which are assigned to the 1H in C3H7 and NH3, respectively. Both of these peaks have nearly constant chemical shift upon increasing the temperature; therefore, the local structures of the different 1H atoms remained similar.
The nuclear magnetization decay of 1H is single exponential S(t)/S0 = exp(−t/T1ρ), and the value of T1ρ can be determined by fitting the traces [25,27,28]. The recovery curves for various delay times were measured at given temperatures, and the recovery traces have different slopes. This way, we could obtain the T1ρ values for each proton in C3H7 and NH3, and plot them vs. 1000/T in Figure 3. The 1H T1ρ data all show similar trends with temperature, although the values are smaller for NH3 than for C3H7. The T1ρ values abruptly decreases when the temperature approaches TC2 = 398 K, and the values above TC2 were short at hundreds of ms. Additionally, when the temperature decreases to near 180 K (TC3), T1ρ also becomes very short, like the case above 398 K, due to the impending phase transition. Therefore, although the local environments of 1H suggested by the chemical shifts do not change with temperature, the molecular motion according to T1ρ is very active at both high and low temperatures.
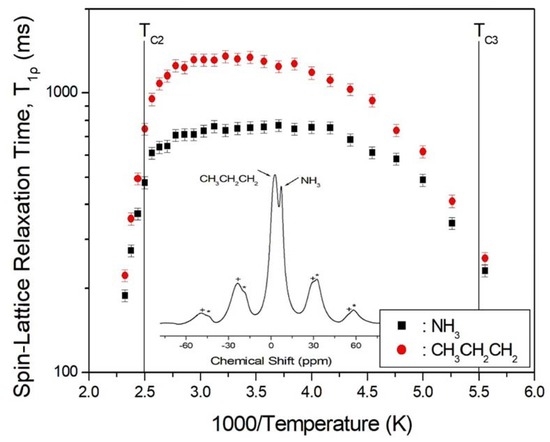
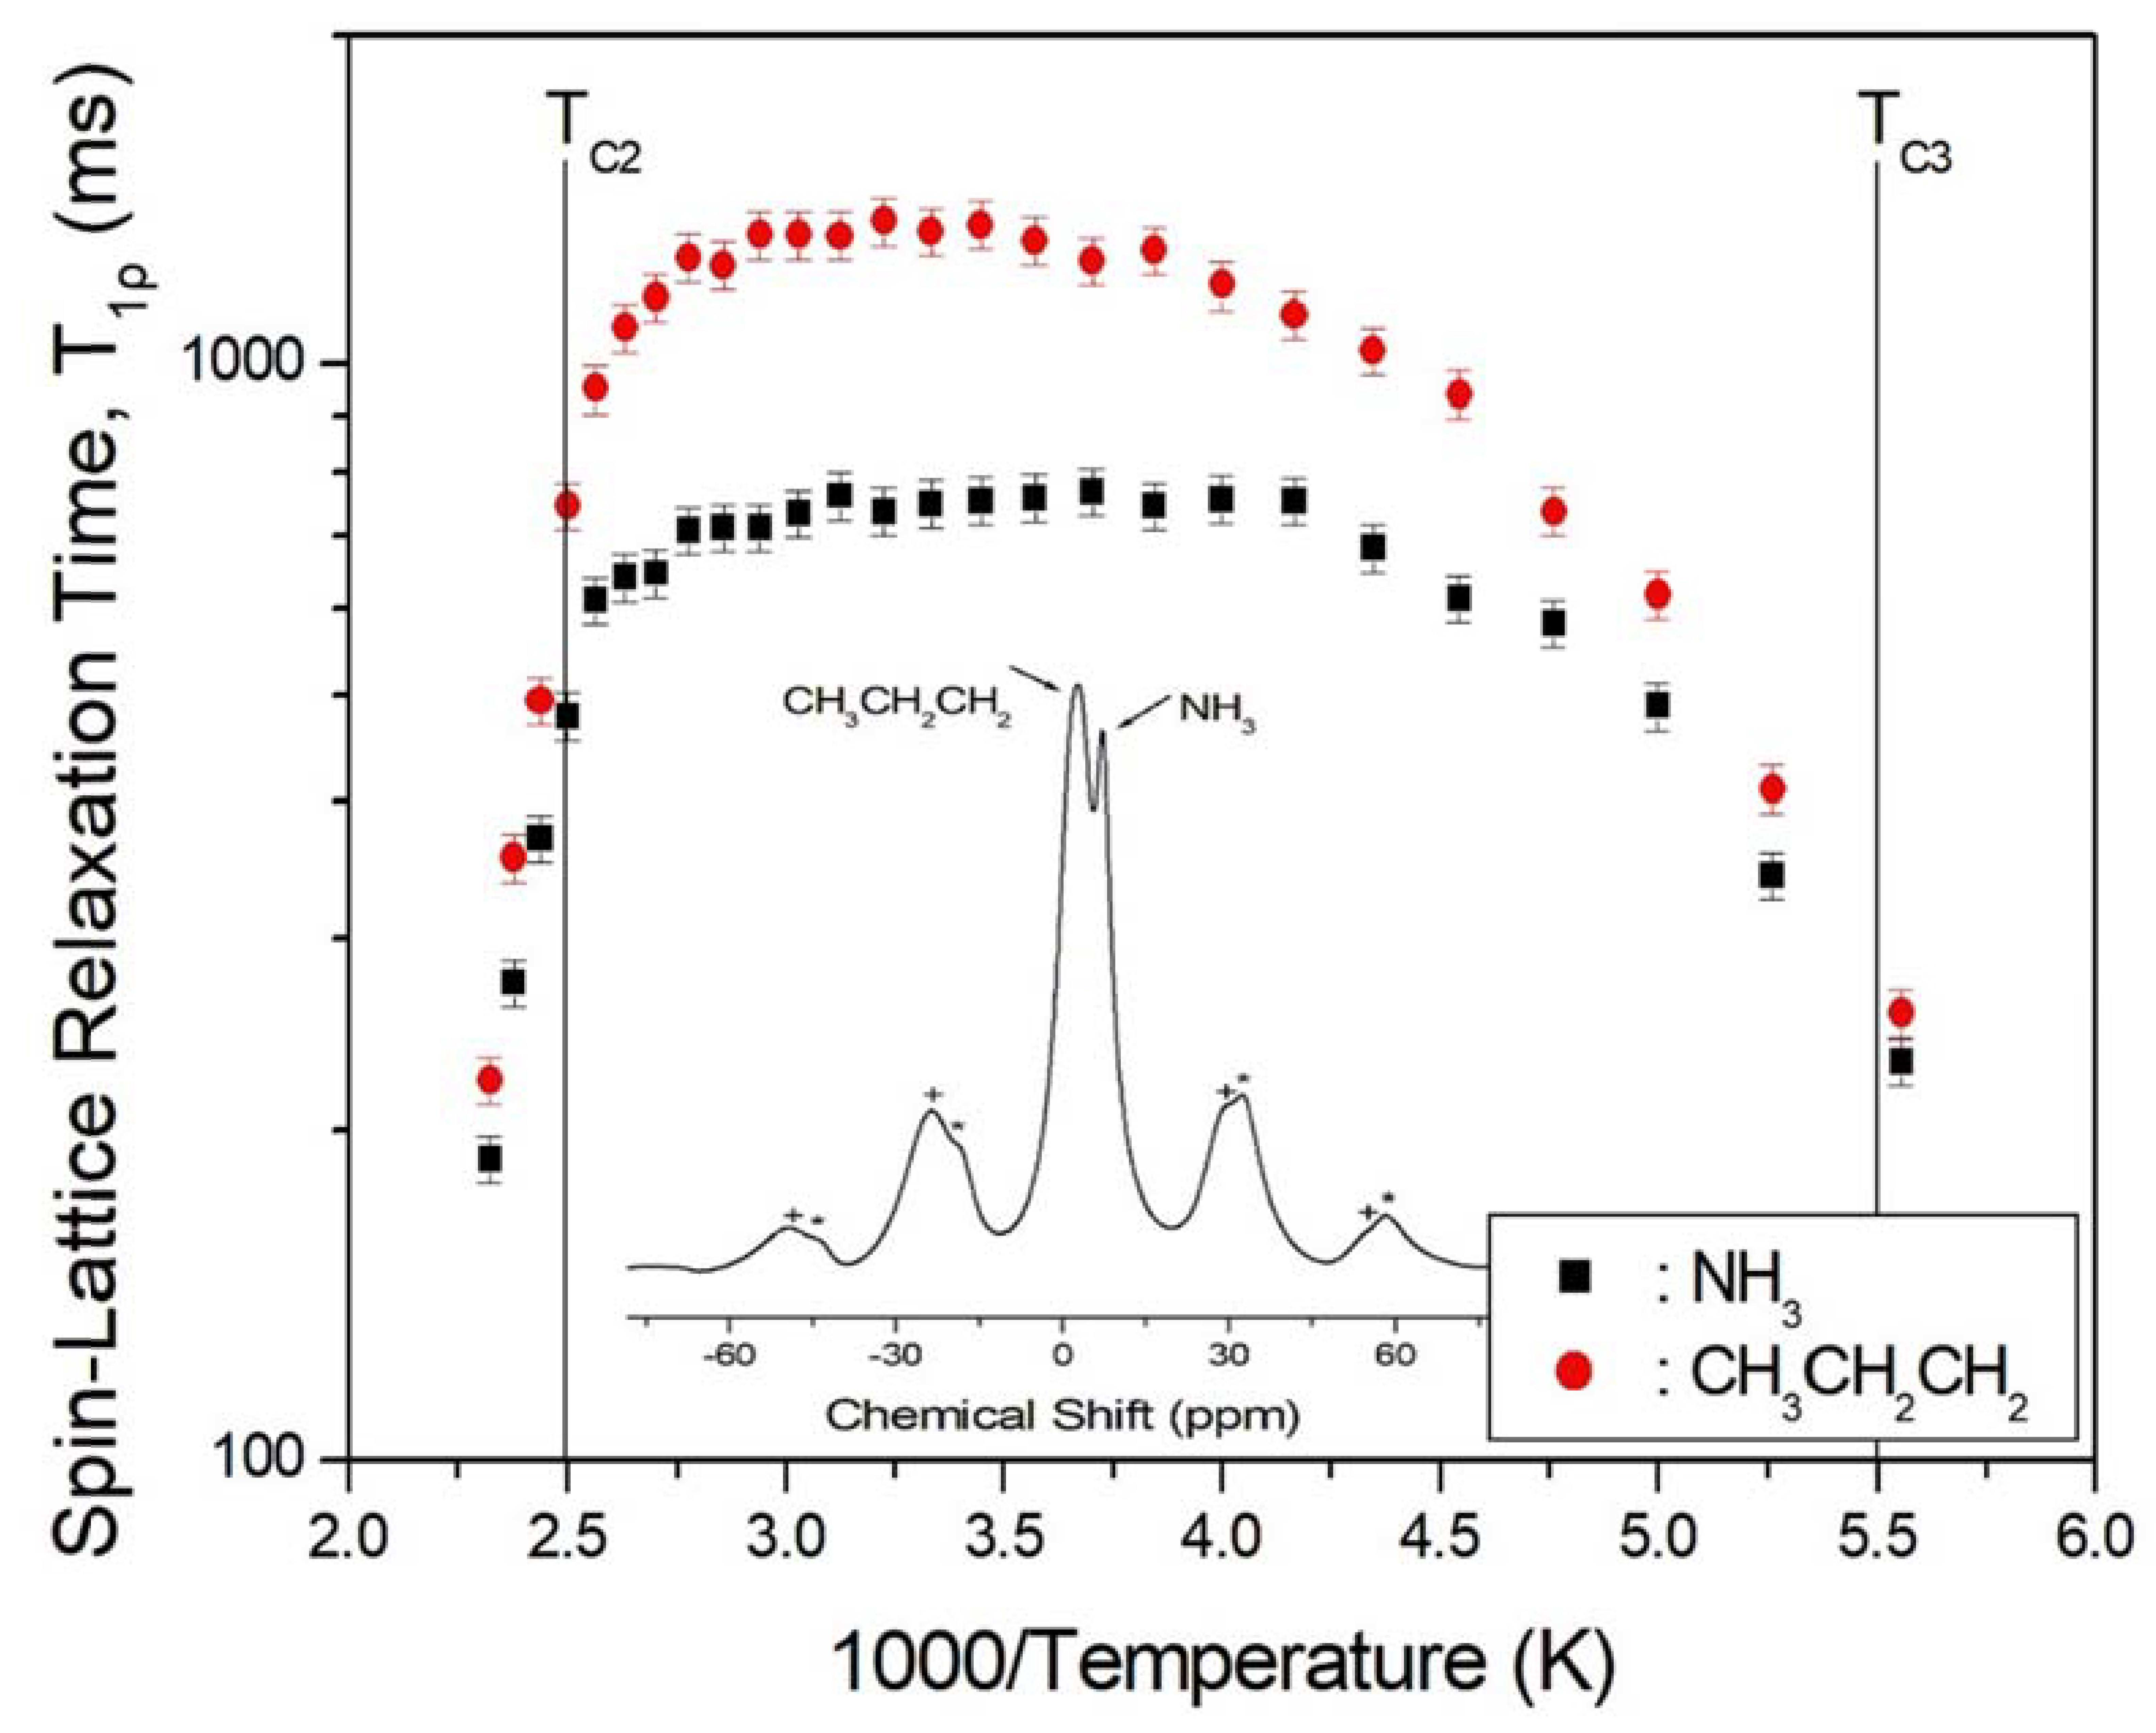
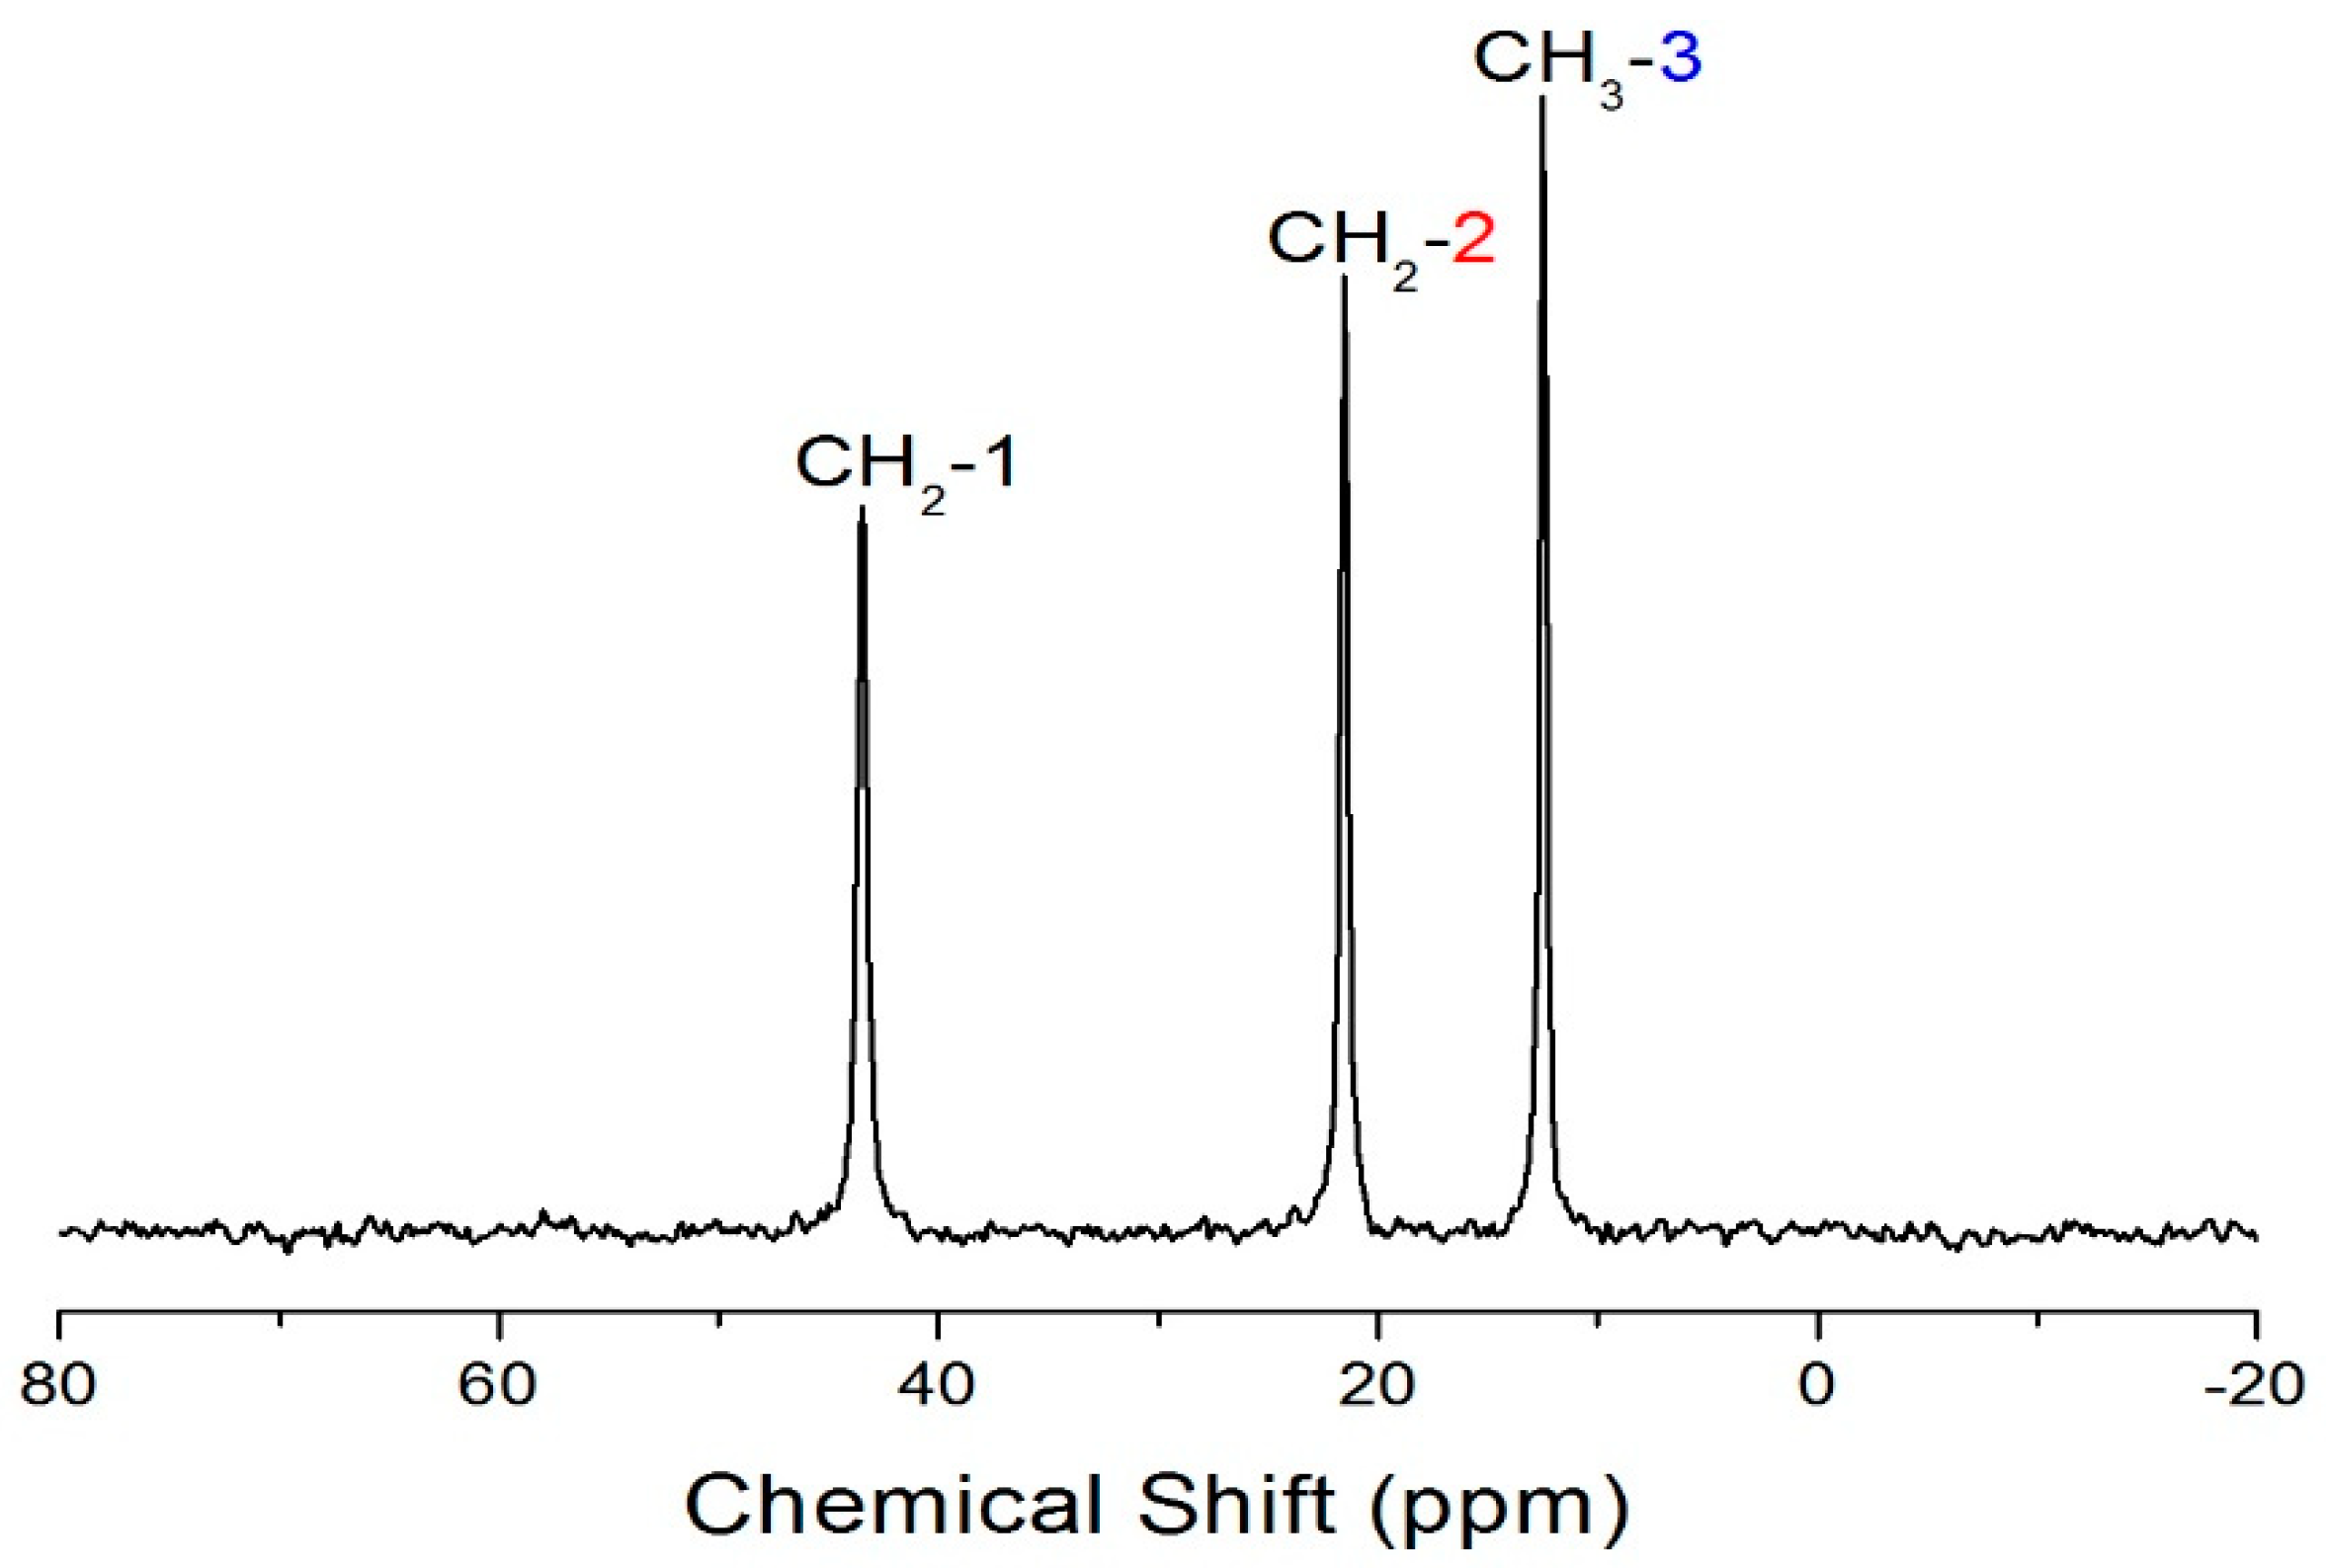
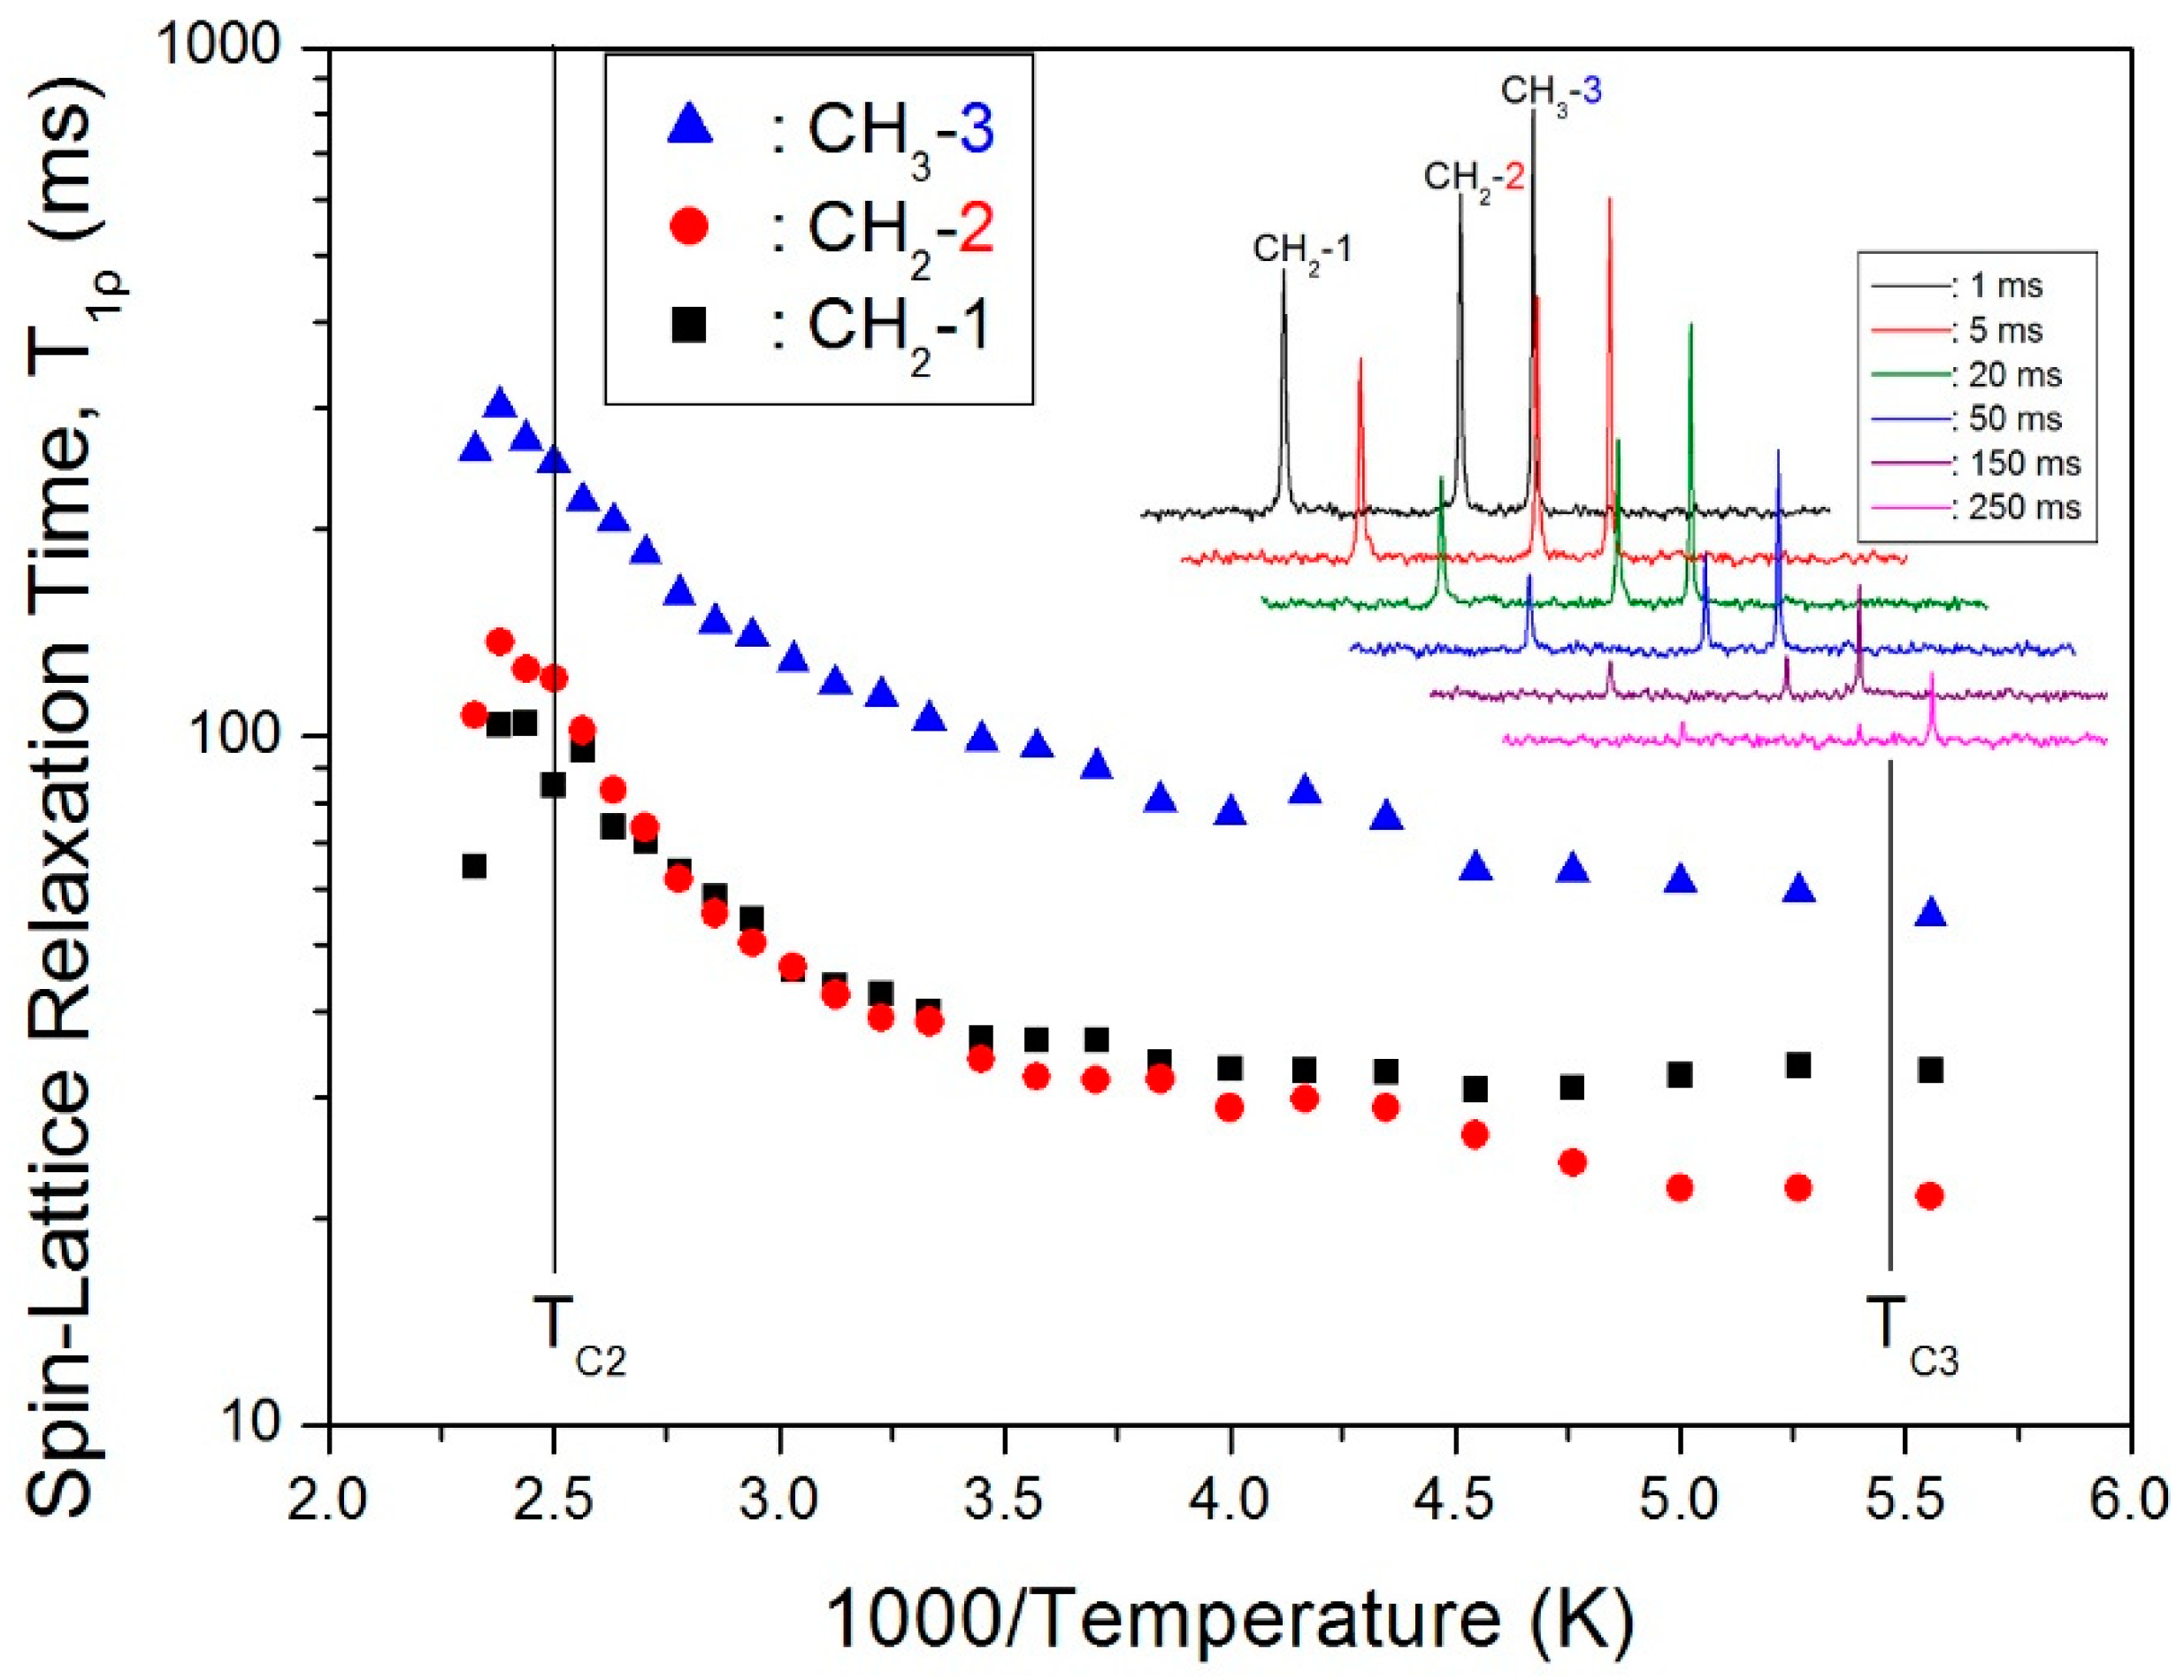
The 13C CP/MAS NMR spectrum of (C3H7NH3)2CdCl4 at room temperature shows three peaks at 12.42, 21.46, and 43.41 ppm that are assignable to CH3-3, CH2-2, and CH2-1, respectively, as shown in Figure 4. The crystal structure is confirmed from the chemical shifts obtained by the 13C MAS NMR method, and it is also consistent with the report by Suzuki et al. [17]. The peak of CH3-3 at 12.42 ppm is relatively stronger, and all three 13C chemical shifts are temperature-independent. Therefore, the local environments of 13C do not change with the temperature based on the chemical shifts of (C3H7NH3) cations. To obtain the 13C T1ρ values, the nuclear magnetization is also measured as a function of delay time at several temperatures, and the 13C NMR spectrum at 300 K is shown in the inset of Figure 5. The signal intensity in the 13C nuclear magnetization recovery curves can be described by a single exponential function at all temperatures. For each carbon in (C3H7NH3)2CdCl4, the calculated T1ρ values are plotted vs. 1000/T in Figure 5. The T1ρ values for CH3-3, CH2-2, and CH2-1 all increase similarly with increasing temperature. At 398 K (TC2), the spin–lattice relaxation time abruptly decreases with temperature like the case of 1H T1ρ, and this is related to the phase transition. On the other hand, the 13C T1ρ values near TC3 are more or less continuous. The T1ρ values are 105.9, 38.5, and 40 ms for CH3-3, CH2-2, and CH2-1 at 300 K, respectively. The much longer T1ρ of CH3-3 is consistent with the fact that the dipolar relaxation is made more efficient when there are more bound protons. The side chains have additional mobility because of the internal rotation.
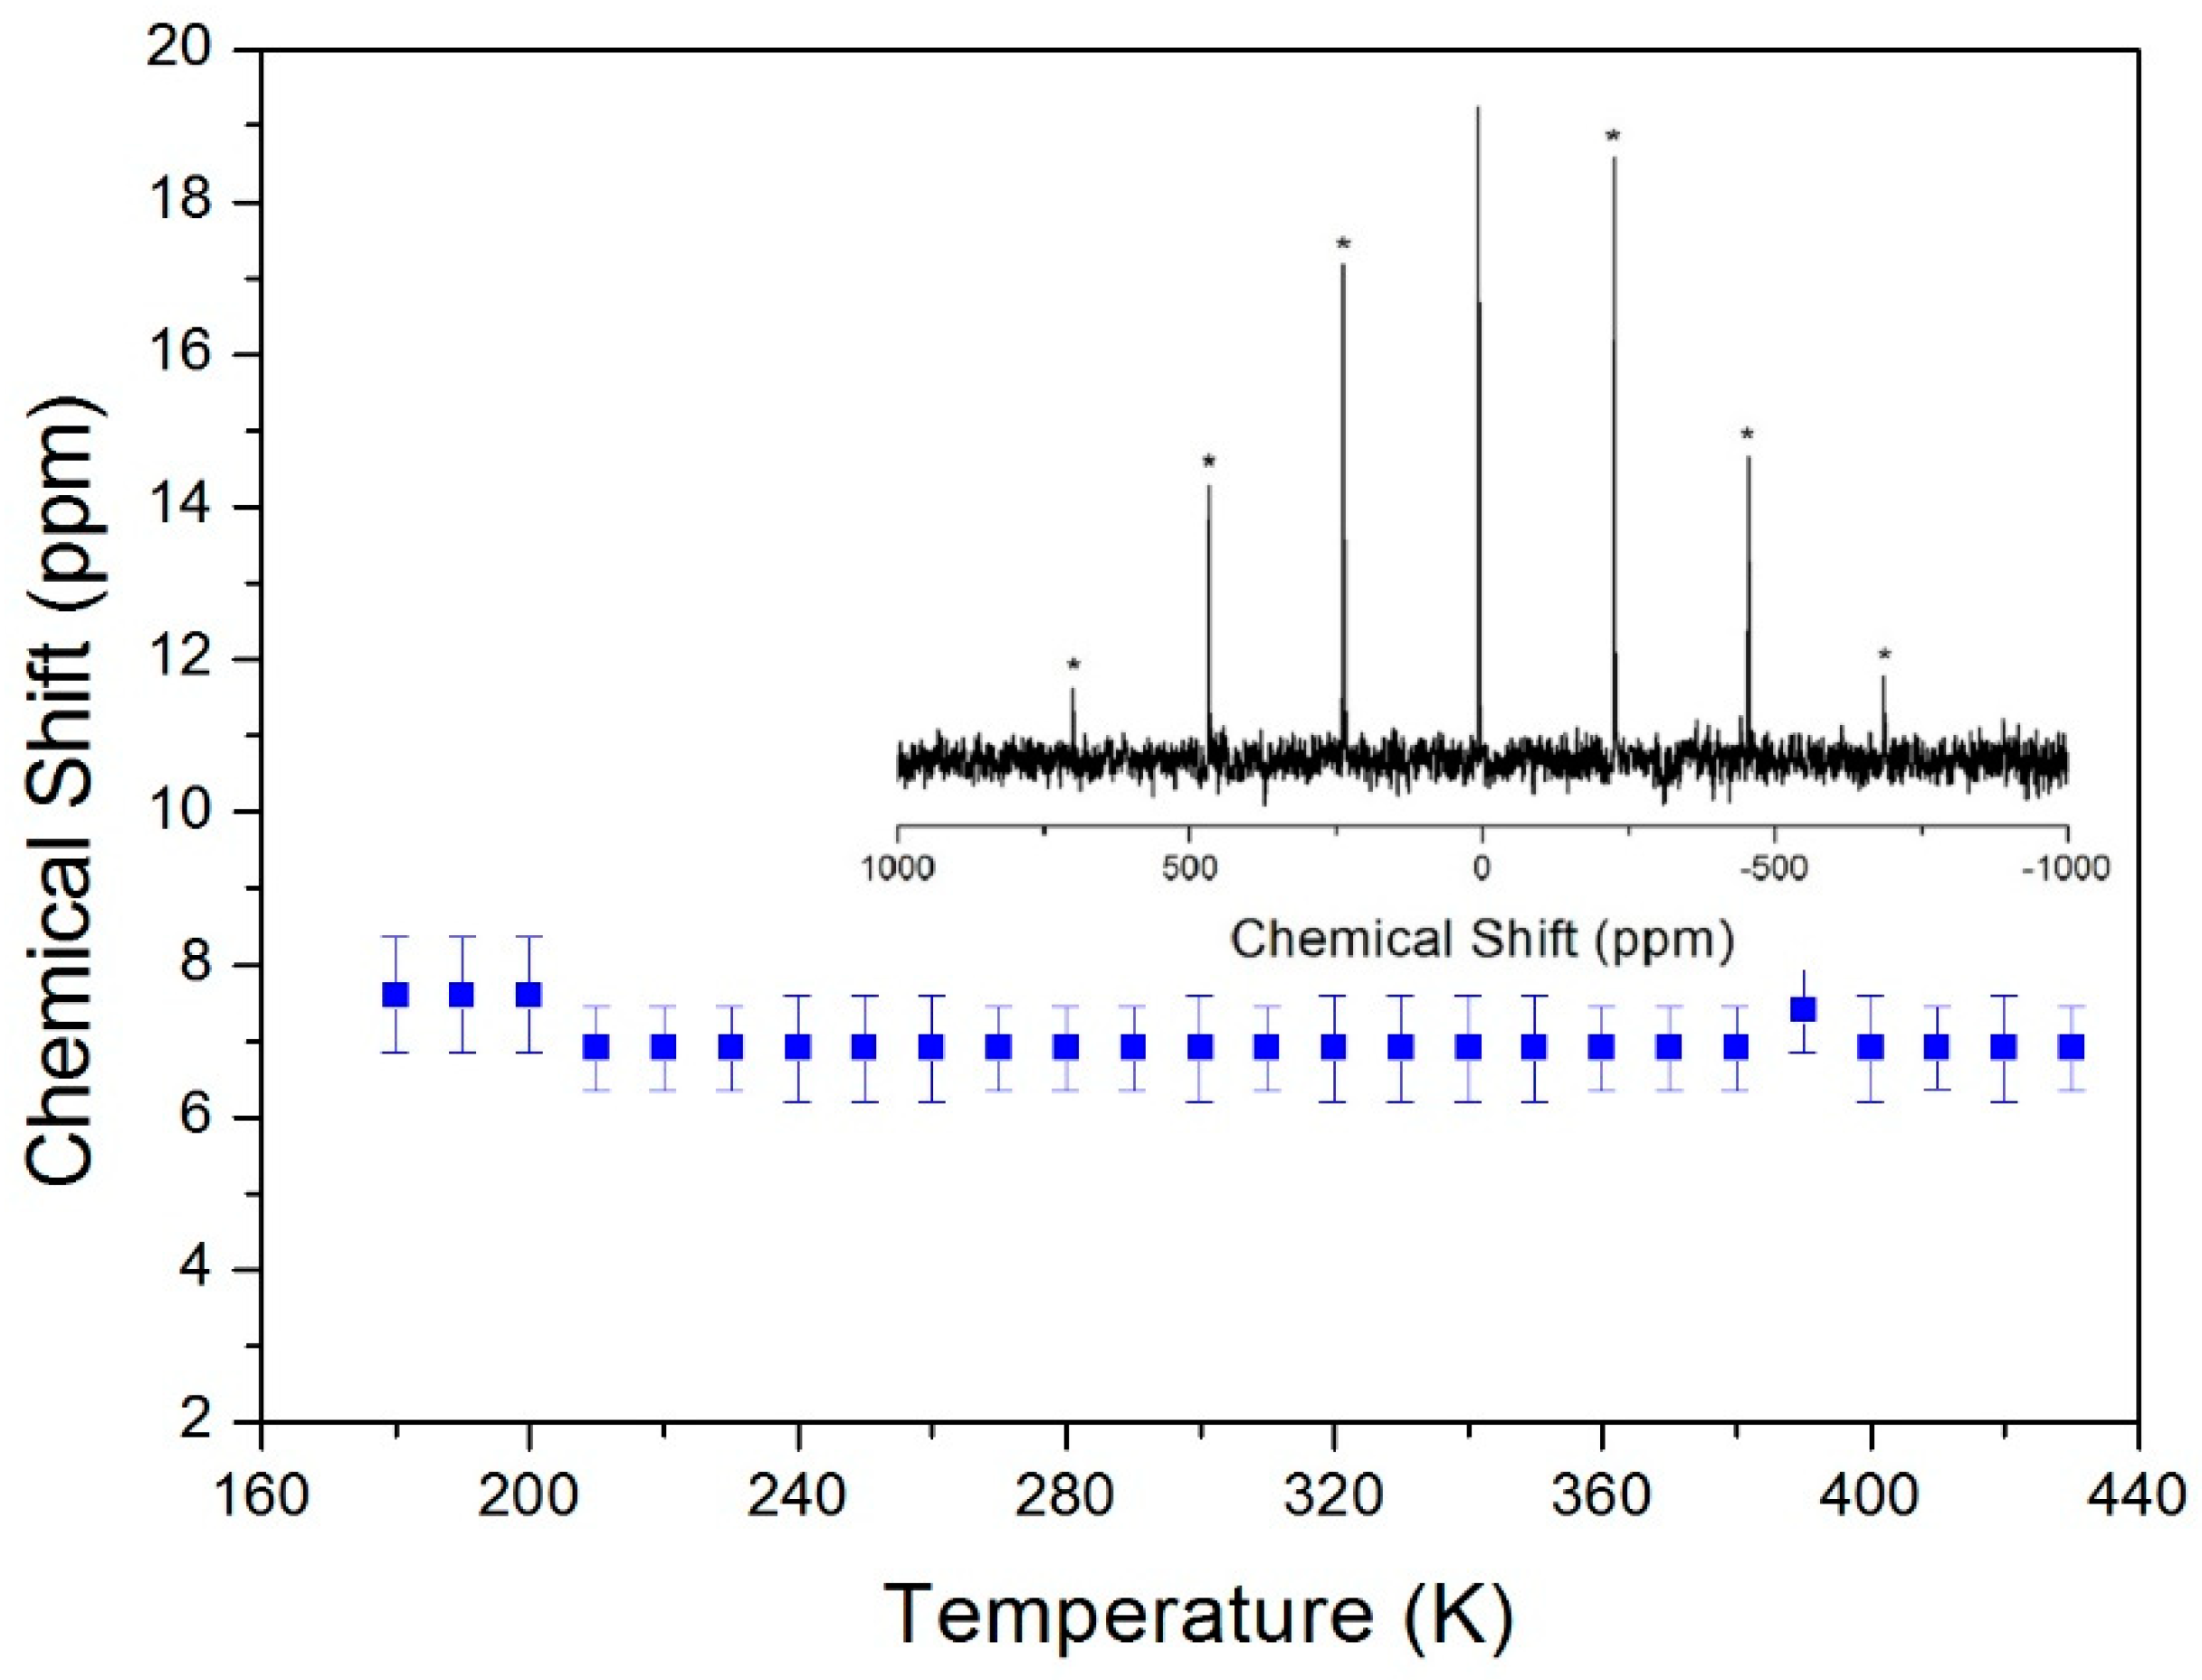
Chemical shifts of 14N in (C3H7NH3)2CdCl4 were also studied using 14N MAS NMR. The room-temperature spectrum shows one signal at δ = 6.71 ppm when referenced to NH4Cl (inset in Figure 6). This signal shows no temperature dependence, indicating that the local environment surrounding 14N in the NH3+ group hardly changes.
113Cd has a spin of I = 1/2 and its natural abundance is 12.3%. 113Cd NMR experiments have been employed to examine the structure and dynamics of several organic and inorganic materials [29]. We did not perform the 113Cd MAS NMR experiment because the 113Cd NMR signals are well detected with single crystals despite the low natural abundance ratio. The 113Cd static NMR spectrum consists of one peak at all temperatures. As shown in the inset of Figure 7, from 180 K to 420 K this resonance frequency for 113Cd signal decreases almost linearly. This result indicates that the environment of chloride surrounding the Cd is changed. The chemical shift of the Cd resonance lines is due to the contributions of the Cl ions [22]. The 113Cd saturation recovery plots of (C3H7NH3)2CdCl4 single crystals were obtained at several temperatures by using a static NMR method, and were fitted with a single exponential function S(∞)‒S(t)/S(∞)=exp(‒Wt)=exp(‒t/T1) [30]. The T1 value, given by T1=1/W, decreases upon increasing the temperature, as shown in Figure 7. At low temperatures, T1 is very long in the order of 1000 s, but shortened to approximately 400 s at high temperatures. This temperature dependence of T1 follows a single Arrhenius relation, T1=T0exp(‒Ea/RT), where T0 is a pre-exponential factor, T is the temperature, R is the gas constant, and Ea is the activation energy. From the log T1 vs. 1000/T plot, the Ea value for the molecular motion was found to be 3.64 ± 0.14 kJ/mol.
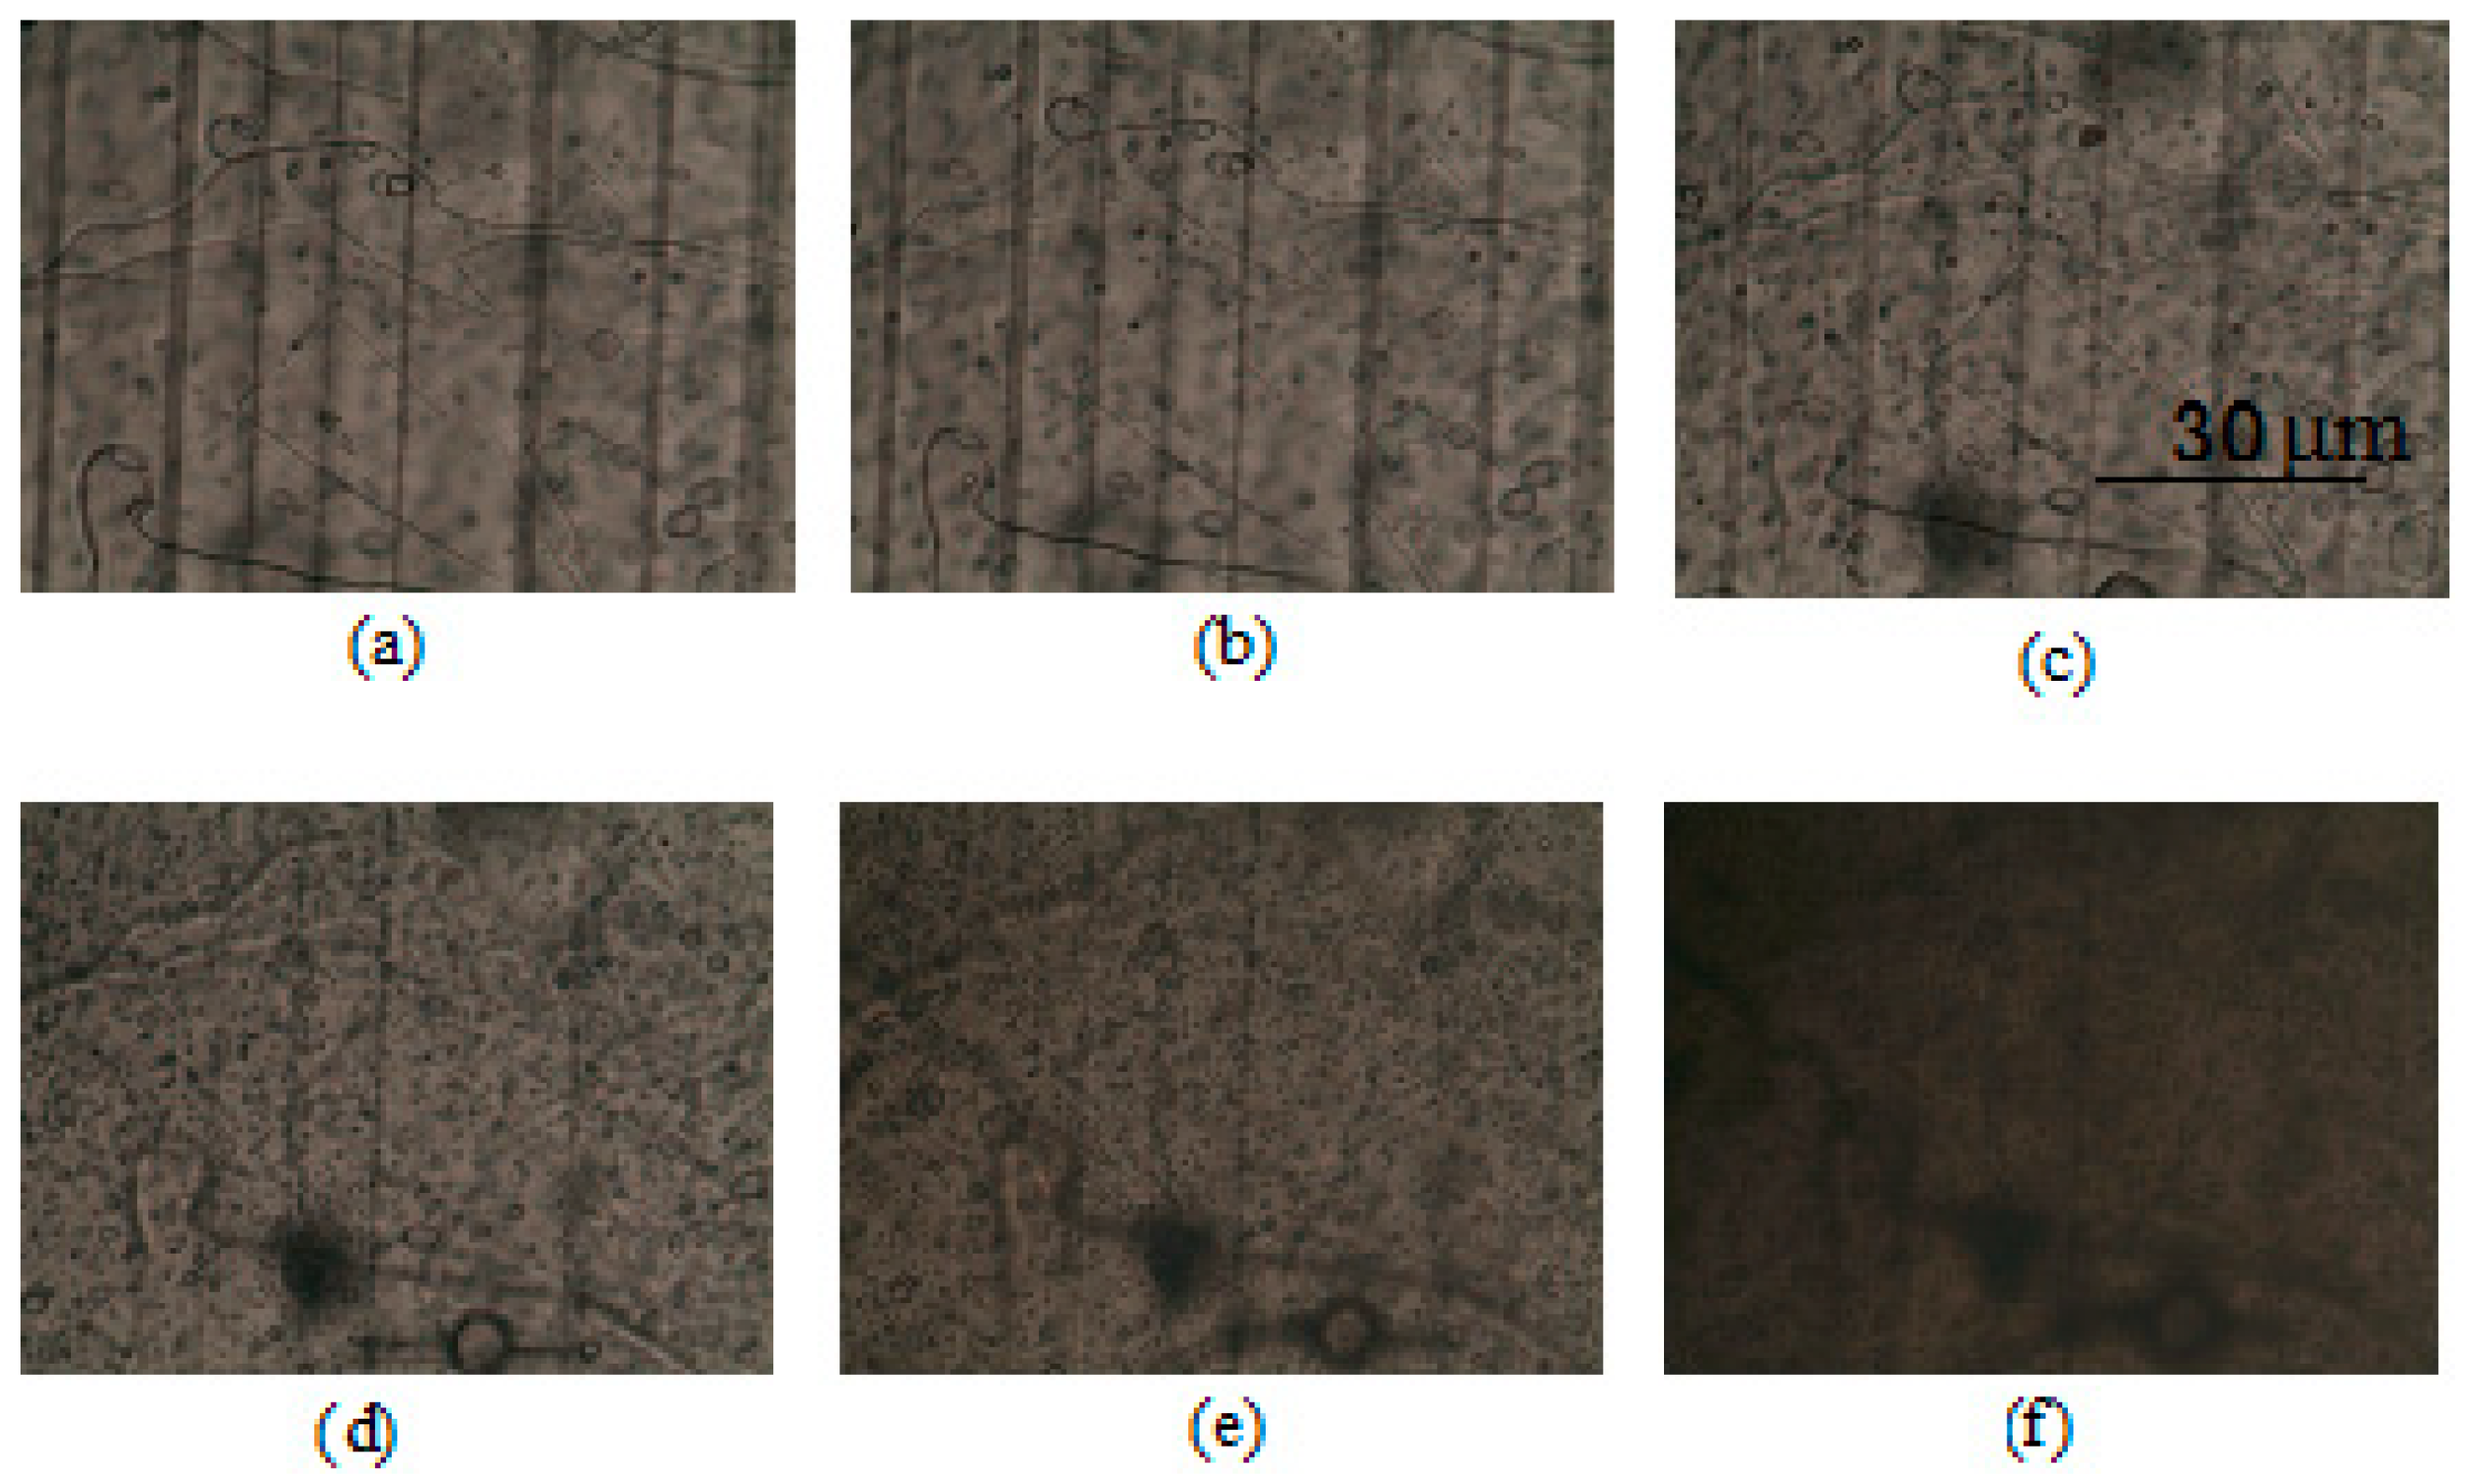
A crystal is ferroelastic if (1) it has two or more stable orientation states in the absence of mechanical stress or an electric field and (2) transition between these orientation states can be induced by the application of mechanical stress [31]. Upon heating, the ferroelastic effect usually disappears at a well-defined temperature. The domain structures at several temperatures are observed by optical polarizing microscopy. Figure 8 shows the domain patterns at (a) 300 K, (b) 350 K, (c) 400 K, (d) 450 K, (e) 480 K, and (f) 500 K. The microscopic domain walls represented by parallel lines are due to the ferroelastic property [32]. A magnification of 200x was used to take pictures of the domain walls. The domain pattern at high temperature became dimmer and faded out. Additionally, ferroelastic domains exist in all ferroelastic crystals because of the reduction in symmetry between the paraelastic and ferroelastic phases [33,34]. To change from a tetragonal structure (point group 4/mmm) to an orthorhombic one (point group mmm), the domain wall orientations can be expressed as x = 0 and y = 0. These equations of twin boundaries indicate the ferroelasticity of the 4/mmmFmmm species, where 4/mmm is the symmetry above 538 K, mmm is the symmetry below 538 K, and F represents the ferroelastic phase.
4. Conclusions
The thermal and physical properties of perovskite-type (C3H7NH3)2CdCl4 were investigated by TGA, DSC, MAS NMR, and static NMR methods. Above room temperature, two phase transitions were observed at 398 K and 538 K. The C3H7 and NH3 in (C3H7NH3) were separated in the 1H MAS NMR spectra, and the CH3, CH2, and CH2 units in CH3CH2CH2NH3+ were clearly distinguished in the 13C CP/MAS NMR spectra. The chemical shifts of 1H, 13C, and 14N signals were constant at all temperatures, whereas those of 113Cd decreased upon increasing the temperature. From these results, it is evident that the crystal geometries surrounding 1H, 13C, and 14N do not change with temperature, whereas that surrounding 113Cd does. Further information about the dynamics of this crystal can be derived from the T1ρ values of 1H and 13C, and the results show that these atoms have higher mobility at high temperatures. The 13C T1ρ in CH3 increased with temperature, and the same trend was observed in alkyl chains attached to the (C3H7NH3) cation due to a greater mobility toward the free end. In addition, the T1 value of 113Cd was obtained, and it was very active at high temperatures. Overall, the cationic motion is associated with fluctuation of the uniaxial rotation and becomes more excited with increasing temperature. The dynamics of 113Cd ions in Cd–Cl bonds of CdCl6 octahedra were strongly activated at higher temperatures, and these results are consistent with the rotational disorder of the CdCl4 planes found by X-ray diffraction [22].
Author Contributions
A.R.L. interpreted the TGA, DSC, and NMR measurements, and designed the research and wrote the manuscript. S.H.K. performed the NMR experiments.
Funding
This research was supported by the Basic Science Research program through the National Research Foundation of Korea (NRF), funded by the Ministry of Education (2018R1D1A1B07041593).
Conflicts of Interest
The authors declare no conflicts of interest.
References
- Xu, C.Q.; Kondo, T.; Sakakura, H.; Kumata, K.; Takahashi, Y.; Ito, R. Optical third-harmonic generation in layered perovskite-type material (C10H21NH3)2PbI4. Solid State Commun. 1991, 79, 245–248. [Google Scholar] [CrossRef]
- Papavassiliou, G.C. Three-and low-dimensional inorganic semiconductors. Prog. Solid State Ch. 1997, 25, 125–270. [Google Scholar] [CrossRef]
- Mitzi, D.B. A layered solution crystal growth technique and the crystal structure of (C6H5C2H4NH3)2PbCl4. J. Solid State Chem. 1999, 145, 694–704. [Google Scholar] [CrossRef]
- Zhou, H.C.; Long, J.R.; Yaghi, O.M. Introduction to metal-organic frameworks. Chem. Rev. 2012, 112, 673–674. [Google Scholar] [CrossRef] [PubMed]
- Strank, S.D.; Eperon, G.E.; Grancini, G.; Menelaou, C.; Alcocer, M.J.P.; Leijtens, T.; Herz, L.M.; Petrozza, A.; Snaith, H.J. Electron-hole diffusion lengths exceeding 1 micrometer in an organometal trihalide perovskite absorber. Science 2013, 342, 341–344. [Google Scholar] [CrossRef] [PubMed]
- Xing, G.C.; Mathews, N.; Sun, S.Y.; Lim, S.S.; Lam, Y.M.; Gratzel, M.; Mhaisalkar, S.; Sum, T.C. Long-range balanced electron- and hole-transport lengths in organic-inorganic CH3NH3PbI3. Science 2013, 342, 344–347. [Google Scholar] [CrossRef] [PubMed]
- Elseman, A.M.; Shalan, A.E.; Sajid, S.; Rashad, M.M.; Hassan, A.M.; Li, M. Copper-substituted lead perovskite materials constructed with different halides for working (CH3NH3)2CuX4-based perovskite solar cells from experimental and theoretical view. ACS Appl. Mater. Inter. 2018, 10, 11699–11707. [Google Scholar] [CrossRef] [PubMed]
- Aramburu, J.A.; Garcia-Fernandez, P.; Mathiesen, N.R.; Garcia-Lastra, J.M.; Moreno, M. Changing the usual interpretation of the structure and ground state of Cu2+ layered perovskite. J. Phys. Chem. C 2018, 122, 5071–5082. [Google Scholar] [CrossRef]
- De Jongh, L.J.; Botterman, A.C.; de Boer, F.R.; Miedema, A.R. Transition temperature of the two-dimensional Heisenberg ferromagnet with s = 1/2. J. Appl. Phys. 1969, 40, 1363–1365. [Google Scholar] [CrossRef]
- Petersson, E.R.; Willett, R.D. Crystal structure of (CH3CH2CH2NH3)2MnCl4. J. Chem. Phys. 1972, 56, 1879–1882. [Google Scholar] [CrossRef]
- Arend, H.; Hofmann, R.; Waldner, F. New phase transition in (CnH2n+1NH3)2MnCl4. Solid State Commun. 1973, 13, 1629–1632. [Google Scholar] [CrossRef]
- Yamazaki, H. Interlayer exchange field in (CnH2n+1NH3)2CuCl4 with n = 1−6 and (C6H5CmH2mNH3)2 CuCl4 with m = 1, 2 determind by parallel pumping experiment. J. Phys. Soc. Jpn. 1976, 41, 1911–1917. [Google Scholar] [CrossRef]
- Jahn, I.R.; Knorr, K.; Ihringer, J. The Jahn-Teller effect and orientational order in (CnH2n+1NH3)2 CuCl4, n = 1,2,3. J. Phys. Condens. Matt. 1989, 1, 6005–6018. [Google Scholar] [CrossRef]
- Lucken, A.; Hagemann, H.; Bill, H. Raman study of the incommensurate layer crystal (CH3CH2CH2NH3)2MnCl4 (=PAMnC) from 10 to 300 K. J. Phys. Condens. Matt. 1991, 3, 5085–5098. [Google Scholar] [CrossRef]
- Narita, N.; Yamada, I. Nonlinear magnetic-susceptibility of two-dimensional magnets (CnH2n+1NH3)2CuCl4 with n = 1, 2 and 3. J. Phys. Soc. Jpn. 1996, 65, 4054–4061. [Google Scholar] [CrossRef]
- Manaka, H.; Yamada, I.; Goto, T. Disappearance of the weak ferromagnetic moment under high pressure observed in the two-dimensional antiferromagnet (C3H7NH3)2CuCl4 through magnetic susceptibility measurements. J. Phys. Soc. Jpn. 2002, 71, 2822–2823. [Google Scholar] [CrossRef]
- Suzuki, K.-I.; Fujimori, H.; Asaji, T.; Ishimaru, S.; Ikeda, R.Z. 1H, 2H and 13C NMR studies of cation dynamics in a layered perovskite-type incommensurate compound (n-C3H7NH3)2CdCl4. Naturforsch 1976, 57, 451. [Google Scholar] [CrossRef]
- Levstik, A.; Filipic, C.; Blinc, R.; Arend, H.; Kind, R. Dielectric properties of (CnH2n+1NH3)2CdCl4 and (NH3(CH2)nNH3)CdCl4 perovskite layer compounds. Solid State Commun. 1976, 20, 127–130. [Google Scholar] [CrossRef]
- Ecolivet, C.; Kusto, W. Brillouin scattering in (C3H7NH3)2CdCl4. Ferroelectrics 1990, 105, 285–290. [Google Scholar] [CrossRef]
- Kusto, W.J.; Rivera, J.-P.; Schmid, H. Birfringence of low-temperature phases of ferroelastic bis(n-propylammonium) tetrachlorocadmate. Ferroelectrics 1992, 15, 191–196. [Google Scholar] [CrossRef]
- Chapuis, G. Study of the first-order phase transition of (C3H7NH3)2CdCl4 at 183K by X-ray diffraction of the two phases. Acta Cryst. B 1978, 34, 1506–1512. [Google Scholar] [CrossRef]
- Doudin, B.; Chapuis, G. Study of the modulated phase of (C3H7NH3)2CdCl4 by single-crystal X-ray diffraction. Acta Cryst. B 1988, 44, 495–502. [Google Scholar] [CrossRef]
- Yoshinari, T.; Matsuyama, T.; Achiwa, N.; Yamaoka, H.; Aoyagi, K. ESR and optical studies on Cl2− in single crystals of (CnH2n+1NH3)2CdCl4 with n = 1,2 and 3. J. Phys. Soc. Jpn. 1987, 56, 3354–3361. [Google Scholar] [CrossRef]
- Blinc, R.; Burgar, M.; Lozar, B.; Seliger, J.; Slak, J.; Rutar, V.; Arend, H.; Kind, R. Proton NMR study of the structural phase transition in perovskite layer compounds: (CnH2n+1NH3)2CdCl4 and (NH3-(CH2)n-NH3)CdCl4. J. Chem. Phys. 1977, 66, 278–287. [Google Scholar] [CrossRef]
- Koenig, J.L. Spectroscopy of Polymers; Elsevier: New York, NY, USA, 1999. [Google Scholar]
- White, M.A.; Granville, N.W.; Davies, N.J.; Staveley, L.A.K. The heat capacity of the layer compounds (CH3CH2CH2NH3)2MnCl4 and (CH3CH2CH2NH3)2CdCl4 from 10 K to 300 K. J. Phys. Chem. Solids 1981, 42, 953–965. [Google Scholar] [CrossRef]
- Lim, A.R. Behavior of H2O surrounding NH4+ and Al3+ in NH4Al(SO4)2·12H2O by 1H MAS NMR, 14N NMR, and 27Al NMR. RSC Adv. 2017, 7, 55276–55281. [Google Scholar] [CrossRef]
- Mcbrierty, V.J.; Packer, K.J. Nuclear Magnetic Resonance in Solid Polymers; Cambridge University Press: Cambridge, UK, 1993. [Google Scholar]
- Sakida, S.; Kawamoto, Y. 113Cd MAS and static NMR study of halogenocadmate crystals. J. Phys. Chem. Solids 2002, 63, 151–161. [Google Scholar] [CrossRef]
- Abragam, A. The Principles of Nuclear Magnetism; Oxford University Press: Oxford, UK, 1961. [Google Scholar]
- Abrahams, S.C. Ferroelasticity [ferroelectrics, magnetics and superconductors]. Mater. Res. Bull. 1971, 6, 881–890. [Google Scholar] [CrossRef]
- Salje, E.K.H. Phase Transitions in Ferroelastic and Co-Elastic Crystals; Cambridge University Press: Cambridge, UK, 1990. [Google Scholar]
- Aizu, K. Determination of the state parameters and formulation of spontaneous strain for ferroelastics. J. Phys. Soc. Jpn. 1970, 28, 706–716. [Google Scholar] [CrossRef]
- Sapriel, J. Domain-wall orientations in ferroelastics. Phys. Rev. B 1975, 12, 5128–5140. [Google Scholar] [CrossRef]
Figure 1.
DSC thermogram of (C3H7NH3)2CdCl4 crystal.

Figure 2.
TGA and DSC curves of (C3H7NH3)2CdCl4 crystals. Insets show color of the crystal at (a) 293 K, (b) 393 K, and (c) 473 K.
Figure 2.
TGA and DSC curves of (C3H7NH3)2CdCl4 crystals. Insets show color of the crystal at (a) 293 K, (b) 393 K, and (c) 473 K.

Figure 3.
T1ρ values of 1H in the C3H7 and NH3 groups vs. 1000/T. Inset: 1H MAS NMR spectrum of (C3H7NH3)2CdCl4 at 300 K. The spinning sidebands are marked with crosses and asterisks.
Figure 3.
T1ρ values of 1H in the C3H7 and NH3 groups vs. 1000/T. Inset: 1H MAS NMR spectrum of (C3H7NH3)2CdCl4 at 300 K. The spinning sidebands are marked with crosses and asterisks.

Figure 4.
13C CP/MAS NMR spectrum of (CH3CH2CH2NH3)2CdCl4 at 300 K.

Figure 5.
Spin–lattice relaxation times in the rotating frame T1ρ for each group of carbon in (CH3CH2CH2NH3)2CdCl4 vs. 1000/T. Inset: Recovery trace for each carbon at different delay times and 300 K.
Figure 5.
Spin–lattice relaxation times in the rotating frame T1ρ for each group of carbon in (CH3CH2CH2NH3)2CdCl4 vs. 1000/T. Inset: Recovery trace for each carbon at different delay times and 300 K.

Figure 6.
Chemical shift in 14N MAS NMR spectra in (C3H7NH3)2CdCl4 vs. temperature. Inset: Spectrum at 300 K, and the spinning sidebands are marked with asterisks.
Figure 6.
Chemical shift in 14N MAS NMR spectra in (C3H7NH3)2CdCl4 vs. temperature. Inset: Spectrum at 300 K, and the spinning sidebands are marked with asterisks.

Figure 7.
Spin–lattice relaxation times in the laboratory frame T1 for 113Cd in (C3H7NH3)2CdCl4 crystals vs. 1000/T. Inset: Resonance frequency of 113Cd in (C3H7NH3)2CdCl4 crystals at different temperatures.
Figure 7.
Spin–lattice relaxation times in the laboratory frame T1 for 113Cd in (C3H7NH3)2CdCl4 crystals vs. 1000/T. Inset: Resonance frequency of 113Cd in (C3H7NH3)2CdCl4 crystals at different temperatures.

Figure 8.
Optical polarizing microscopy images of (C3H7NH3)2CdCl4 single crystals at (a) 300 K, (b) 350 K, (c) 400 K, (d) 450 K, (e) 480 K, and (f) 500 K. The ferroelastic domain walls are represented as parallel lines.
Figure 8.
Optical polarizing microscopy images of (C3H7NH3)2CdCl4 single crystals at (a) 300 K, (b) 350 K, (c) 400 K, (d) 450 K, (e) 480 K, and (f) 500 K. The ferroelastic domain walls are represented as parallel lines.

© 2019 by the authors. Licensee MDPI, Basel, Switzerland. This article is an open access article distributed under the terms and conditions of the Creative Commons Attribution (CC BY) license (http://creativecommons.org/licenses/by/4.0/).
Share and Cite
MDPI and ACS Style
Lim, A.R.; Kim, S.H. Preparation, Thermal, and Physical Properties of Perovskite-Type (C3H7NH3)2CdCl4 Crystals. Crystals 2019, 9, 108. https://0-doi-org.brum.beds.ac.uk/10.3390/cryst9020108
AMA Style
Lim AR, Kim SH. Preparation, Thermal, and Physical Properties of Perovskite-Type (C3H7NH3)2CdCl4 Crystals. Crystals. 2019; 9(2):108. https://0-doi-org.brum.beds.ac.uk/10.3390/cryst9020108
Chicago/Turabian StyleLim, Ae Ran, and Sun Ha Kim. 2019. "Preparation, Thermal, and Physical Properties of Perovskite-Type (C3H7NH3)2CdCl4 Crystals" Crystals 9, no. 2: 108. https://0-doi-org.brum.beds.ac.uk/10.3390/cryst9020108
Note that from the first issue of 2016, this journal uses article numbers instead of page numbers. See further details here.