Solvent-Mediated Polymorphic Transformation of Famoxadone from Form II to Form I in Several Mixed Solvent Systems


Shanghai Key Laboratory of Chemical Biology, Laboratory of Pharmaceutical Crystal Engineering & Technology, School of Pharmacy, East China University of Science and Technology, No. 130, MeiLong Road, XuHui District, Shanghai 200237, China
*
Authors to whom correspondence should be addressed.
Crystals 2019, 9(3), 161; https://0-doi-org.brum.beds.ac.uk/10.3390/cryst9030161
Submission received: 2 March 2019
/
Accepted: 13 March 2019
/
Published: 20 March 2019
(This article belongs to the Special Issue Pharmaceutical Crystals)
Abstract
:This paper discloses six polymorphs of famoxadone obtained from polymorph screening, which were characterized by XRPD, DSC, and SEM. A study of solvent-mediated polymorphic transformation (SMPT) of famoxadone from the metastable Form II to the stable Form I in several mixed solvent systems at the temperature of 30 °C was also conducted. The transformation process was monitored by Process Analytical Technologies. It was confirmed that the Form II to Form I polymorphic transformation is controlled by the Form I growth process. The transformation rate constants depended linearly on the solubility difference value between Form I and Form II. Furthermore, the hydrogen-bond-donation/acceptance ability and dipolar polarizability also had an effect on the rate of solvent-mediated polymorphic transformation.
1. Introduction
Crystallization is the widely-used method for isolation pf a solid-state chemical compound from solution at the manufacturing scale, and it is governed and affected by thermodynamic and kinetic factors [1,2,3,4,5,6]. Polymorphs crystallization often follows Ostwald’s rule of stages [7], which postulates that system polymorphic crystallization is carried out from the supersaturated state stage to the equilibrium state in stages. Thus, the metastable form is crystallized first, and then, this system undergoes every possible polymorphic structure before the thermodynamically-stable polymorph crystallizes from the solution [8]. Solvent-mediated polymorphic transformation (SMPT) is a process where the metastable polymorph interacts with the solvent and subsequently transforms to a more stable polymorph by dissolution and crystallization. SMPT is interpreted as a three-step process: dissolution of the metastable polymorph, nucleation of the stable polymorph, and growth of the stable polymorph [9]. The driving force of this process is the difference value between the solubility of the two corresponding polymorphs [10], which consequently determines the supersaturation level during the crystallization process of the thermodynamically-stable form [11]. SMPT has been extensively studied over the years. It is useful for producing the thermodynamically-stable polymorph [12]. On the other hand, in general, if the metastable polymorph is desired as that of a pharmaceutically-active compound, SMPT is also helpful because SMPT is usually a metastable polymorph transform to a stable polymorph, so we need to study the SMPT influencing factor to suppress the SMPT process and obtain the expected metastable polymorph [13]. However, there are no comprehensive studies on the effect and mechanism of solvent in SMPT [14].
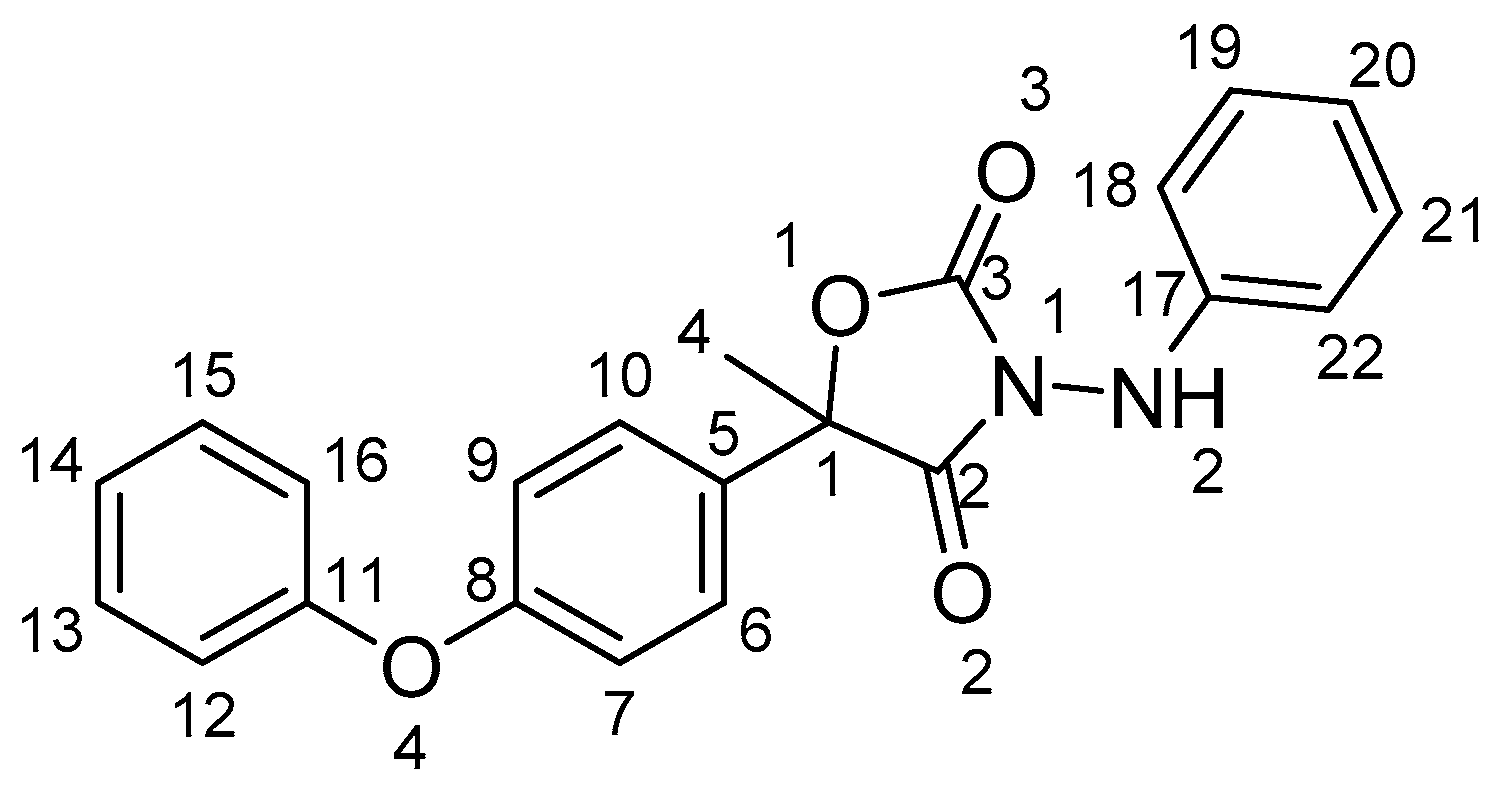
Famoxadone (CAS No. 131807-57-3), 3-anilino-5-methyl-5-(4-phenoxyphenyl)-1,3-oxazolidine-2,4-dione (Figure 1), is a high-efficiency wide-spectrum pesticide produced by DuPont (USA) [15]. Famoxadone is a member of a new class of oxazolidinone fungicides that demonstrate excellent control of plant pathogens in the Ascomycete, Basidiomycete, and Oomycete classes that infect grapes, cereals, tomatoes, potatoes, and other crops [15,16]. There is no literature reporting the polymorphs of famoxadone.
In this work, six polymorphs were obtained by polymorph screening and defined as Form I–Form VI. The related research showed that Form I is the most thermodynamically-stable form among them. Besides, the SMPT of the famoxadone metastable Form II to the thermodynamically-stable Form I in several mixed solvent systems has been studied, corresponding to mixed solvent systems including nitromethane/toluene, nitromethane/isopropylbenzene, acetone/m-xylene, acetone/toluene, acetone/o-xylene, acetone/p-xylene, and acetone/mesitylene.
2. Experimental Section
Materials. Form I was obtained by synthesis [16] in the laboratory (purity > 95%, HPLC) and used without further purification. A single crystal of famoxadone Form I was crystallized from methyl tert-butyl ether and n-heptane. Acetone, nitromethane, toluene, isopropyl-benzene, o-xylene, m-xylene, p-xylene, and mesitylene of analytical reagent grade (purity > 99%) were purchased from Sinopharm Chemical Reagent Co. Ltd., Shanghai, China. Deionized water was prepared by Ming-che D 24 UV, China.
Form II was prepared by dissolving 100 mg of famoxadone in 1 mL of chloroform followed by adding 10 mL of n-heptane. A large amount of white solid precipitated, then the solid powders were filtered and dried over 24 h under vacuum at room temperature.
Form III was prepared by evaporation of the saturated solution of famoxadone in chlorobenzene during two weeks at room temperature. Then, the solid powders were filtered and dried over 24 h under vacuum at room temperature.
Form IV was prepared by dissolving 100 mg of famoxadone in 1 mL N,N-dimethylacetamide followed by adding 10 mL of formic acid. A large amount of white solid precipitated immediately, then the solid powders were filtered and dried over 24 h under vacuum at room temperature. Another method for preparing Form IV was from dissolving 100 mg famoxadone in 2 mL of 2-methyltetrahydrofuran followed by adding 20 mL of n-butyl ether. A large amount of white solid precipitated after resting for a while, then the solid powders were filtered and dried over 24 h under vacuum at room temperature.
Form V was prepared by dissolving 250 mg of famoxadone in 3 mL of 2-butanone, then adding this solution to 10 mL of 2,2,2-trifluoroethanol at a controlled temperature of 4 °C. A large amount of white solid precipitated immediately, then the solid powders were filtered and dried over 24 h under vacuum at room temperature.
Form VI was prepared by dissolving 100 mg famoxadone in 1 mL of tetrahydrofuran, followed by adding 10 mL of trifluorotoluene. A large amount of white solid precipitated, then the solid powders were filtered and dried over 24 h under vacuum at room temperature.
Apparatus and Instruments.X-ray Technology. XRPD patterns were obtained using a Rigaku Ultima IV X-ray diffractometer (Cu-Kα radiation) [17]. The voltage and current of the generator were set to 40 kV and 40 mA, respectively. Data over the 2θ angular range of 5°–45° were collected at a scan rate of 20°/min at ambient temperature. The data were imaged and integrated with RINT Rapid, and the peaks were analyzed with Jade 6.0 from Rigaku.
XRPD calibration was performed using the mixtures containing 5%, 10%, 20%, 50%, 80%, 90%, and 95% Form I in Form II (~0.3 g total sample weight). The mixtures were weighed by using an analytical balance, and the samples were heterogeneous solid-state mixed. Quantitative solid phase analyses were performed using fundamental parameter-based Rietveld software BGMN [18]. Structure data necessary for quantitative analysis were acquired from the experimental data of famoxadone Form I and Form II. XRPD patterns of calibration samples and experiment samples collected were recorded and analyzed identically.
SXRD. Single-crystal X-ray diffraction for famoxadone Form I were collected on a Bruker SMART-APEX DUO diffractometer (USA) equipped with a graphite monochromator and Mo-Kα fine-focus sealed tube (λ = 0.71073 Å). Data processing was performed using Bruker SAINT Software. X-ray diffraction intensities were corrected for absorption using SADABS [19], and the structure was refined using SHELXL-97 [20]. All non-hydrogen atoms were refined anisotropically [21]. Hydrogen atoms on heteroatoms were located from different electron density maps, and all C-H hydrogens were fixed geometrically. Hydrogen bond geometries were determined by Platon software. Crystal structures may be accessed at www.ccdc.cam.ac.uk/data_request/cif (CCDC No. 1560380).
Thermal Analysis. Differential scanning calorimetry (DSC, Q2000, TA Instruments, New Castle, DE, USA) was used to measure the fusion enthalpies and melting points of the polymorphs. Samples weighing 3–5 mg were placed in crimped and sealed aluminum sample pans and heated from 30 °C–200 °C at a rate of 10 °C/min. The instrument was calibrated against with the melting characteristics of indium by a standard procedure. Each sample was analyzed in triplicate with RSD < 2%.
Morphology Observation. The shapes and morphologies of the polymorphs of famoxadone were examined on a Carl Zeiss model Merlin Compact 6027 FESEM (Oberkochen, Germany) with a beam voltage of 3 kV [22]. The FESEM imaging of sample was spread on a carbon-coated copper grid in order to enhance the conductivity.
Process Analytical Techniques. FBRM® (Focused Beam Reflectance Measurement) was used to monitor the chord length of particle change. The FBRM® probe (Particle Track G400, Mettler Toledo, Switzerland) with a chord length measurement range of 1–1000 μm and was set as 10-s sampling intervals [23]. The ReactIRTM system was used to calibrate standard solutions and utilized to record the change of concentration of the solution during SMPT processes. The ReactIRTM probe (ReactIRTM 15, Mettler Toledo) was used with 15-s sampling intervals [24]. All transformation experiments were performed in a 100-mL Easy-Max vessel (Mettler Toledo, Greifensee, Switzerland) in conjunction with iControl Easy-max software [25]. The accuracy of temperature control on this system was 0.01 °C.
Solubility Measurements. An excess amount of thermodynamically-stable Form I was added to 15 mL of solvent and then left to slurry overnight at 30 ± 1 °C. The saturated solution was filtered through a 0.22-μm syringe filter, and the clear solution was transferred to a preweighed glass vial. The solution was left to evaporate at room temperature and weighed, and the solubility was calculated [26]. To determine the solubility of Form II, a certain amount of solvent was introduced to the vessel previously, and the solution was stirred continuously at 200 rpm under 30 °C. Then, a small amount of Form II was added gradually, and a small amount was continuously added after Form II completely dissolved, the mass of each addition being about 2 mg. If Form II was not completely dissolved within 30 min after the last addition of it, the solution was regarded as a saturated one. The total addition was recorded, and the range of the solubility could be determined. Two parallel experiments were performed for each measurement.
Slurry Experiments. Slurry experiments were designed to investigate the influence of solvent conditions in the solvent-mediated polymorphic transformation (SMPT) process.
SMPT was investigated in nitromethane/toluene (1:1), nitromethane/isopropyl benzene (1:1), acetone/m-xylene (1:1), acetone/toluene (1:1), acetone/o-xylene (1:1), acetone/p-xylene (1:1), and acetone/mesitylene (1:1). For each experiment, about 60 mL of saturated solution of Form I were added to the vessel under 30 °C, and then, preweighed Form II was added to this solution. Agitation speed was set at 200 rpm, and the system temperature was controlled by Easy-max. In addition, it was assumed that the insertion of PAT analyzers had no influence on the nature of the transformation mechanism.
The solid polymorphic composition (~10 mg) was determined by using a disposable plastic dropper from the suspension, and this collected solid phase was quickly filtered through 2–3-μm filter paper with a Büchner flask under reduced pressure. The quantity of Form I in the sample was monitored and quantified via ex situ powder X-ray diffraction (XRPD) analysis (Figure S1 in the supplementary materials).
3. Results and Discussion
3.1. The Characterization of Starting Materials
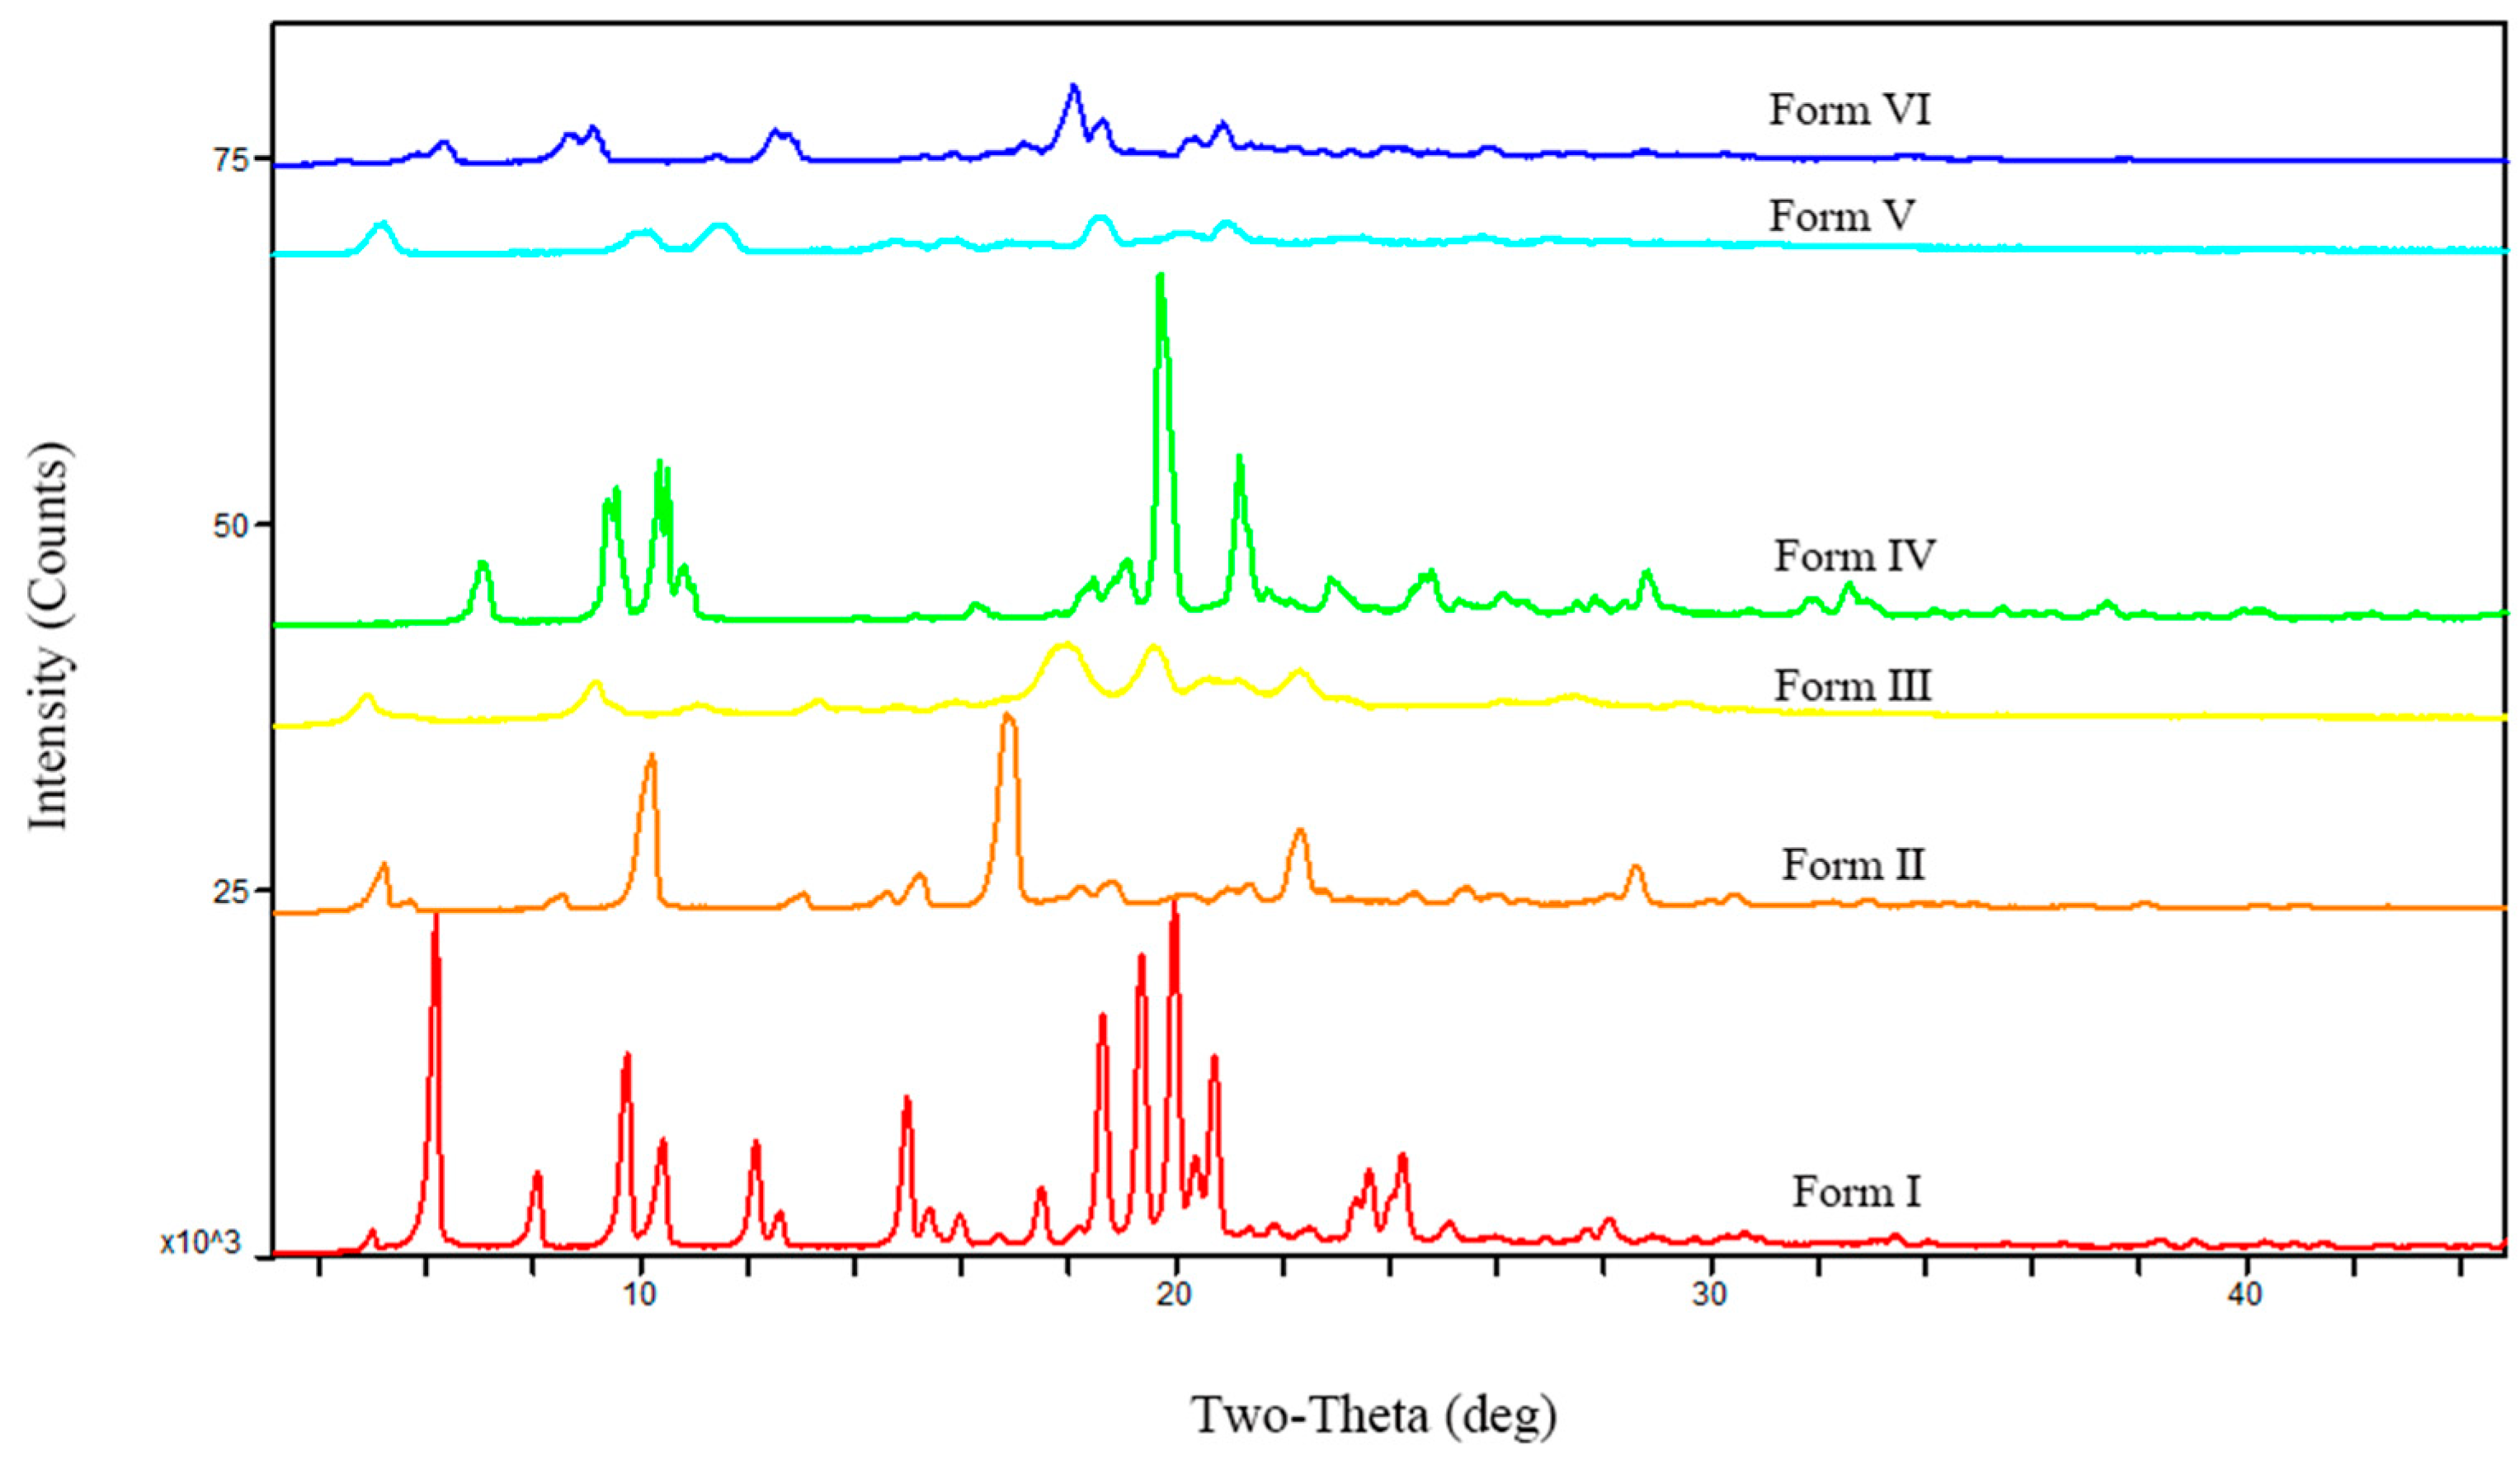
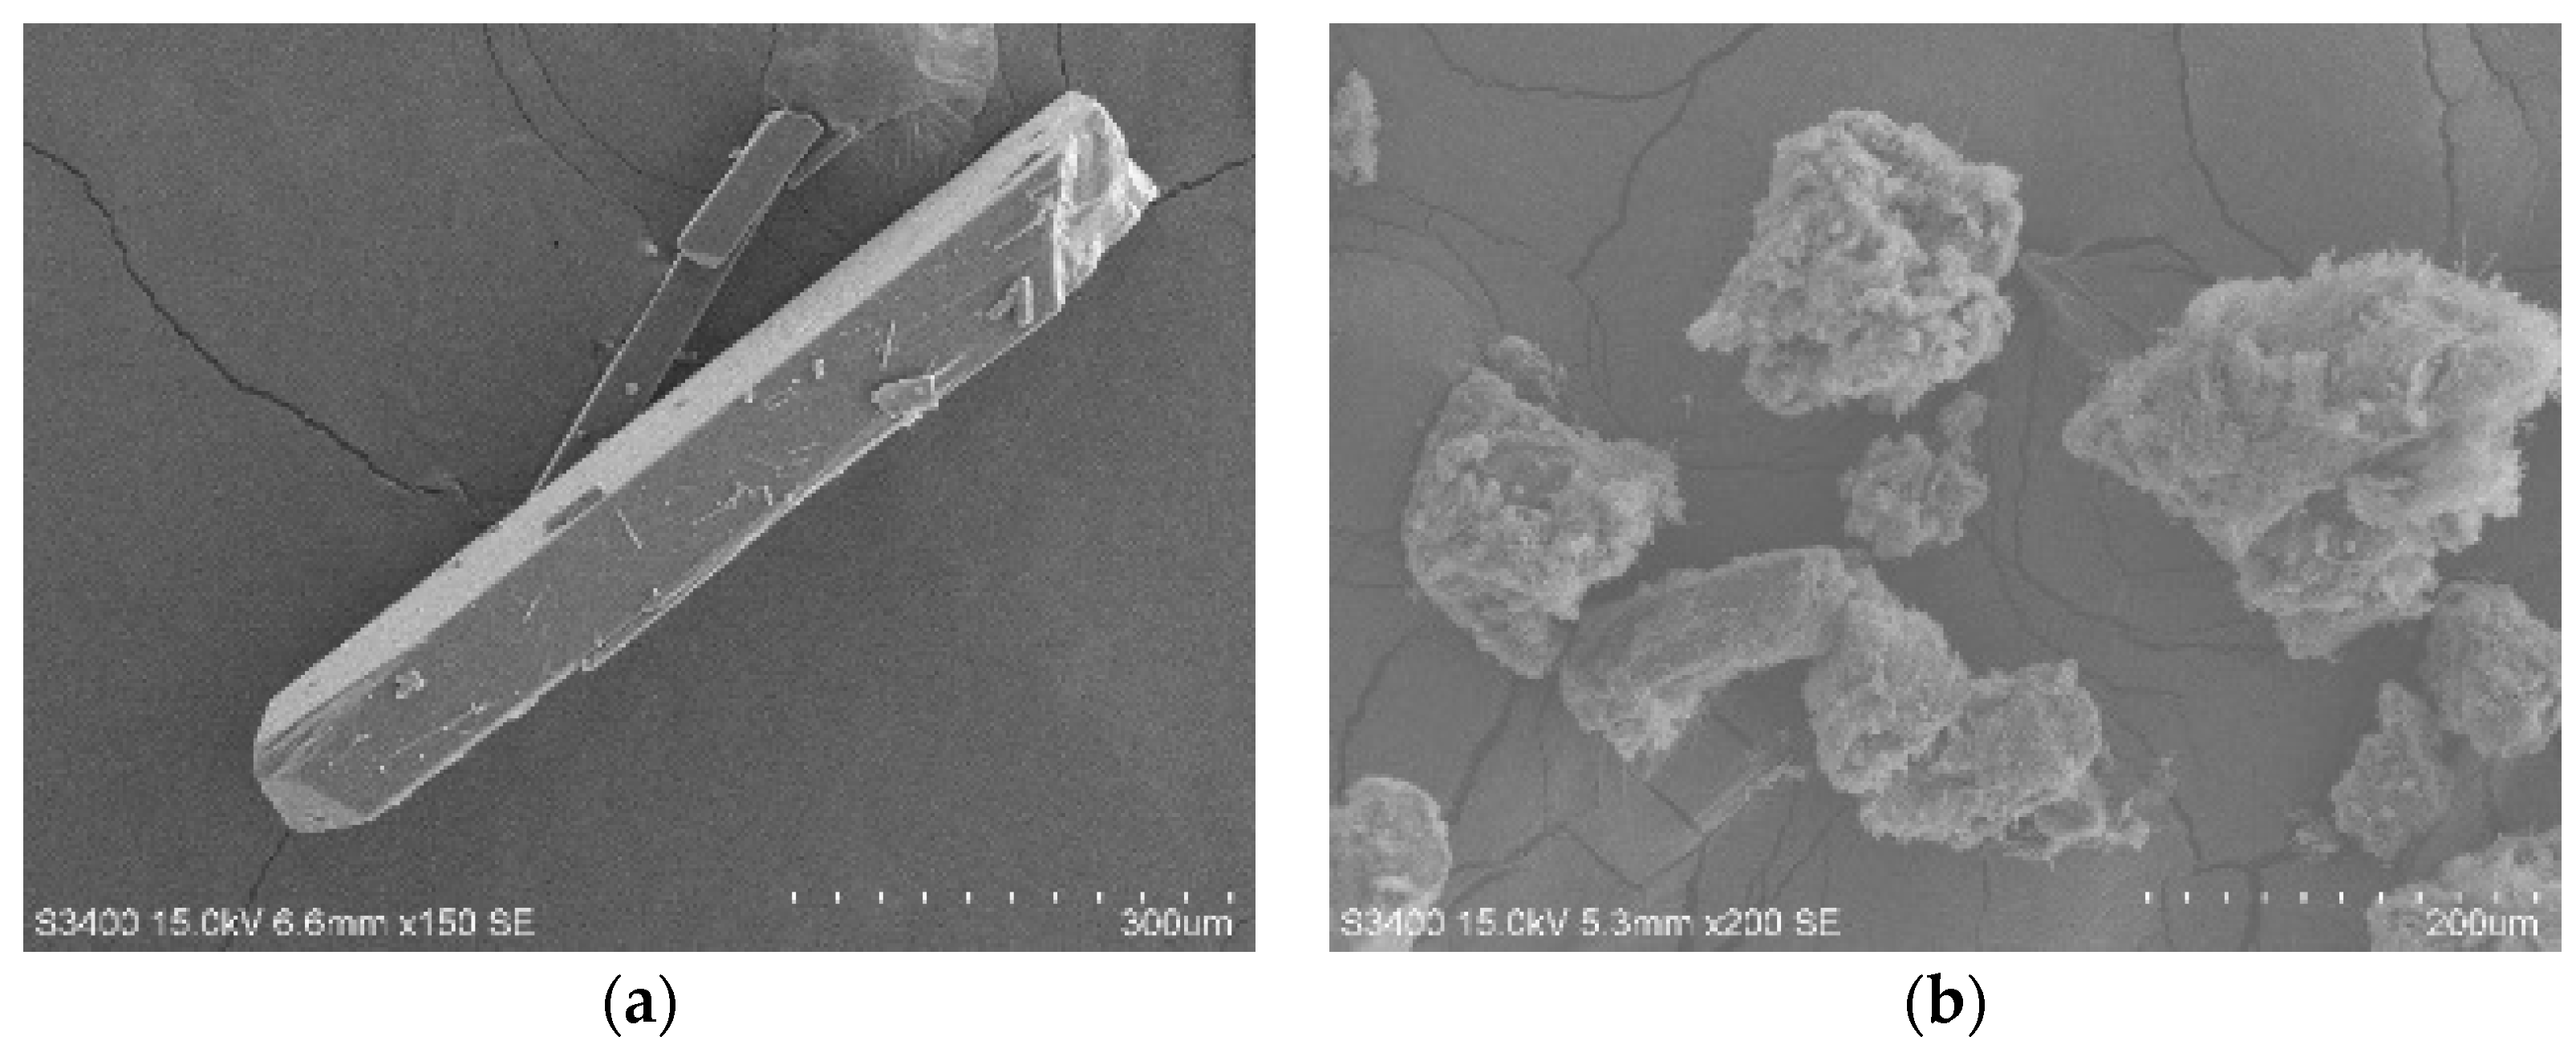
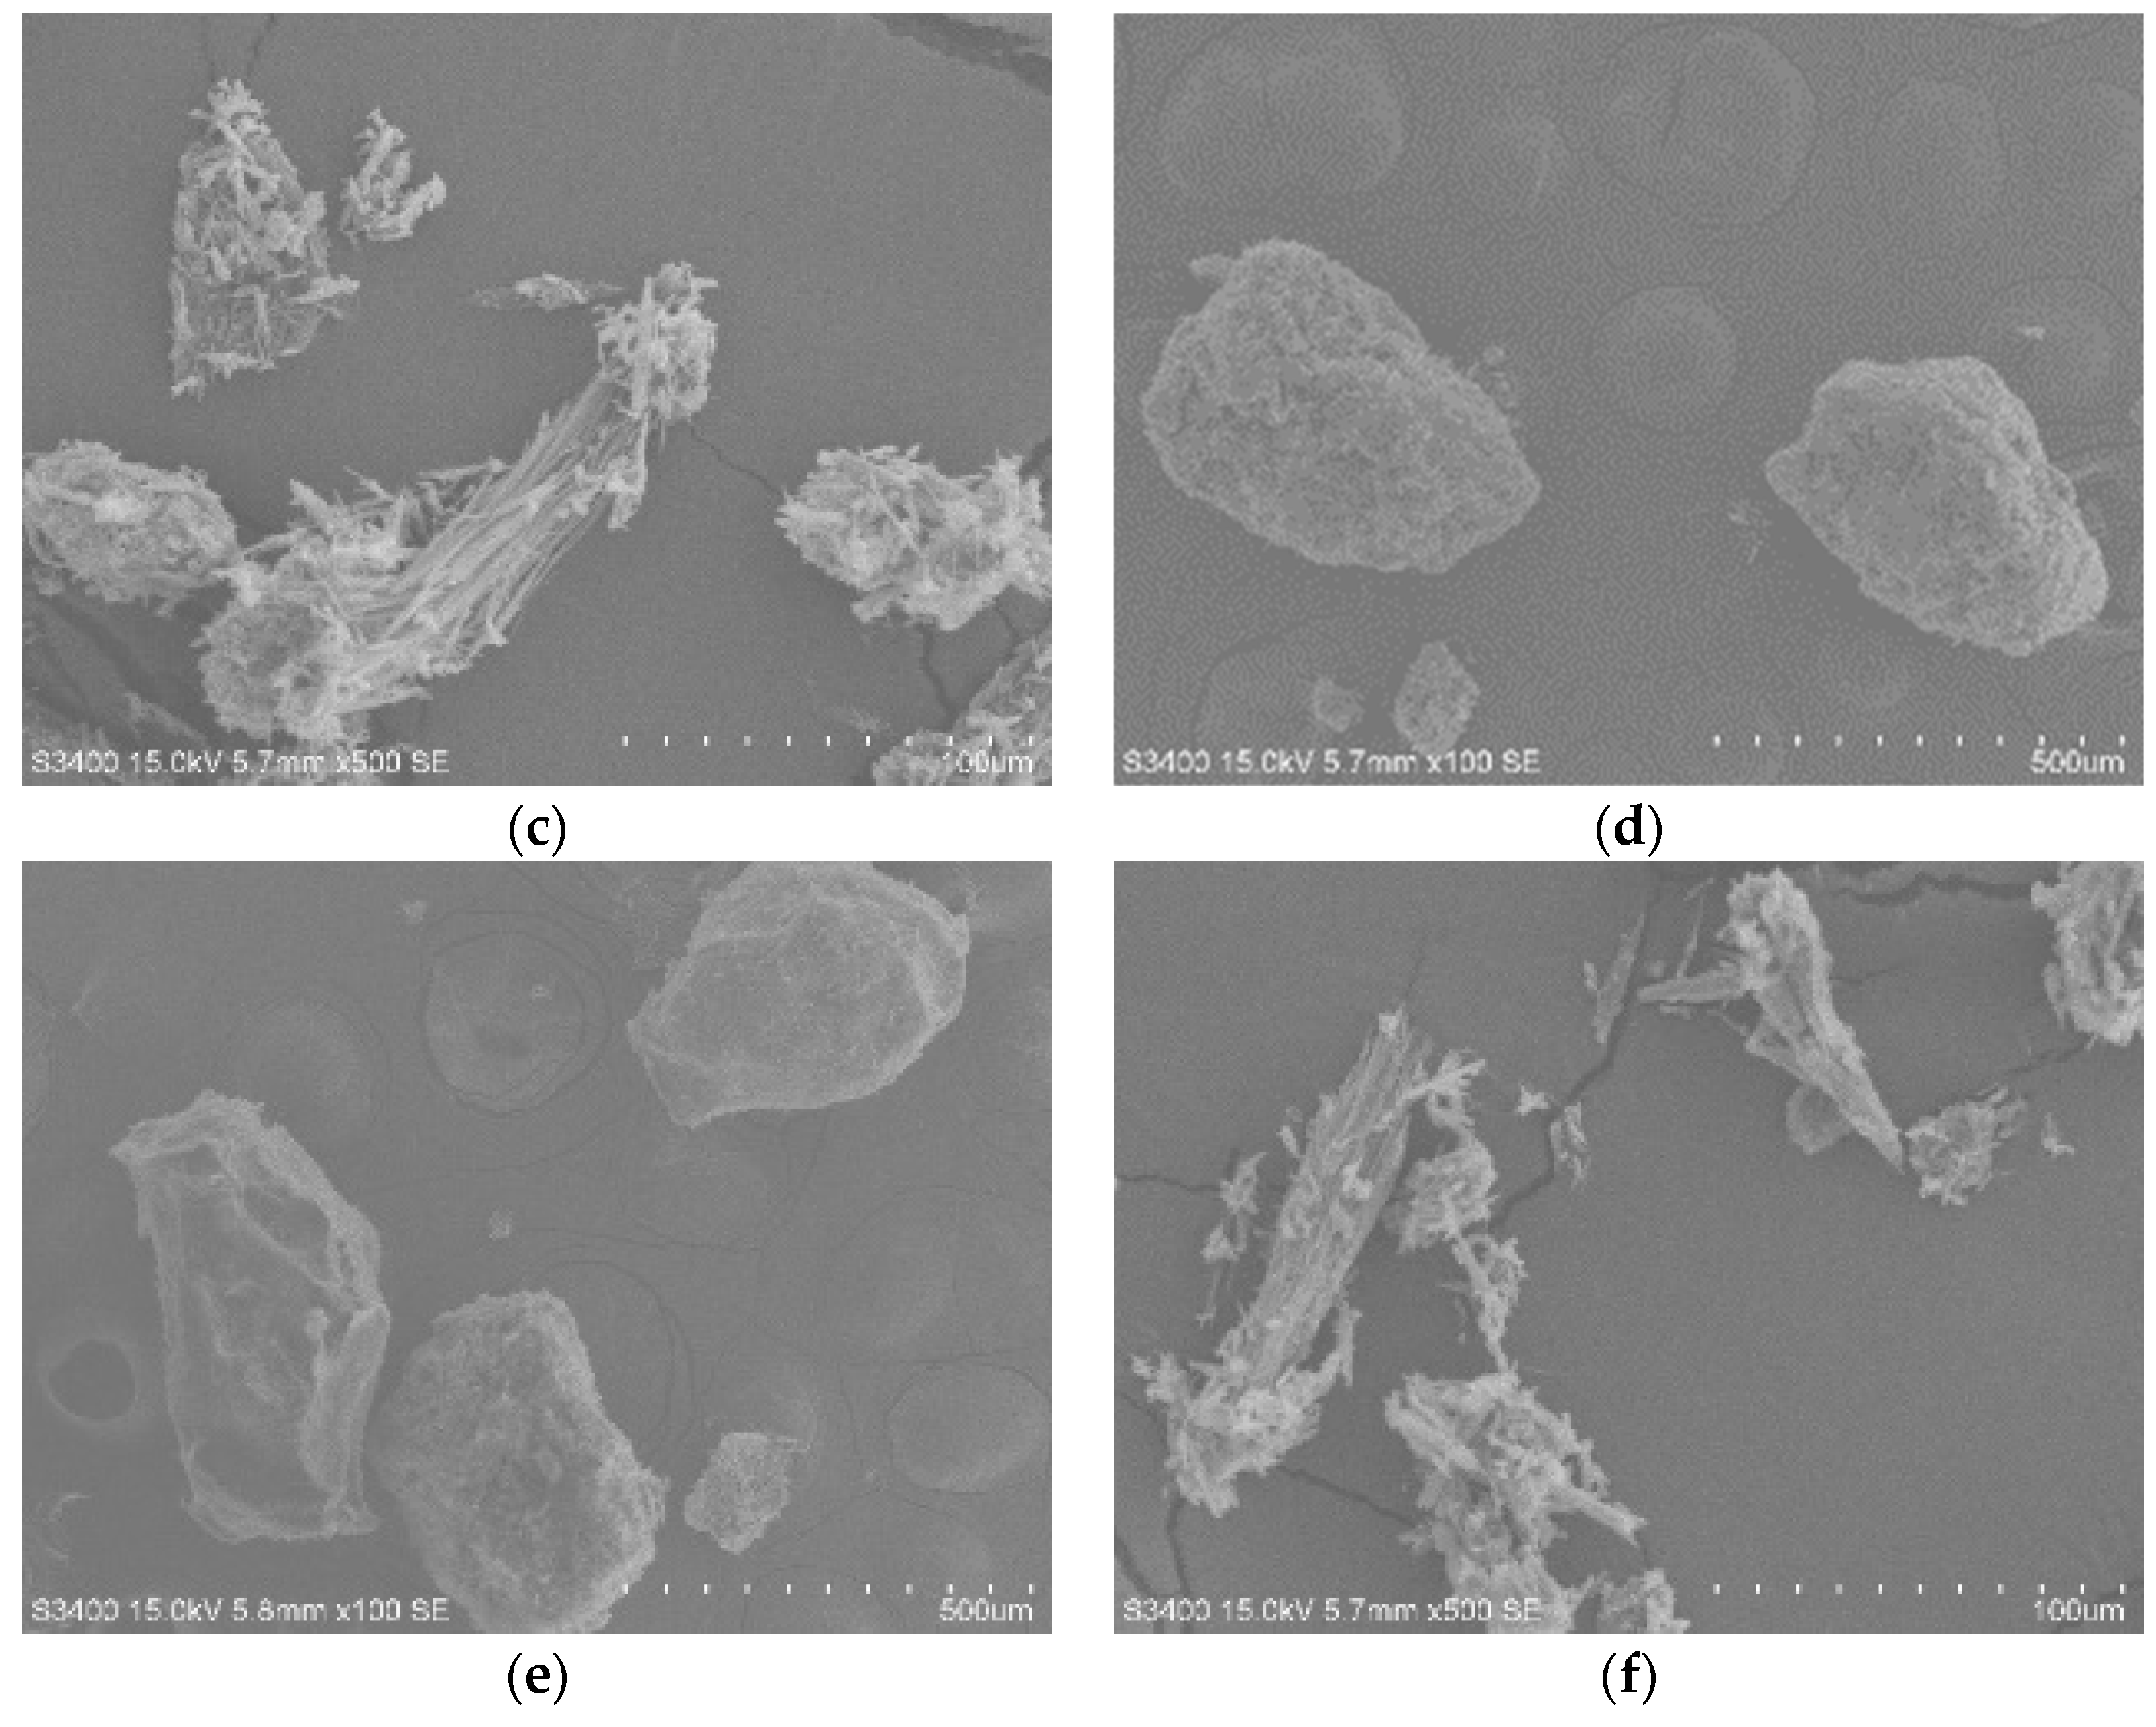
The characterization of starting materials. The six polymorphs were readily distinguished by their unique XRPD patterns (Figure 2) and can be identified by the diagnostic peaks for Form I at 2θ = 6°, 7.9°, 9.6°, 10.2°, 12°, 14.8°, 17.3°, 18.5°, 19.2°, 19.8°, and 20.5°; for Form II at 2θ = 10°, 16.7°, 18.1°, 20.2°, 20.8°, 21.2°, 22.2°, 24.3°, and 28.5°; for Form III at 2θ = 4.9°, 9.2°, 13.4°, 15.9°, 18°, 19.6°, 20.5°, 21.2°, and 22.3°; for Form IV at 2θ = 7°, 9.5°, 10.4°, 18.5°, 19.1°, 19.7°, 21.2°, 23.1°, and 28.8°; for Form V at 2θ = 5.2°, 10.1°, 11.5°, 14.8°, 15.9°, 18.6°, 20°, 20.9°, and 23.5°; for Form VI at 2θ = 6.3°, 8.7°, 9.1°, 12.5°, 17.2°, 18.1°, 18.6°, 20.9°, and 25.8°. Images of SEM of the polymorphs are shown in Figure 3. Detailed data of the peaks in PXRD patterns are listed in Tables S1–S6.
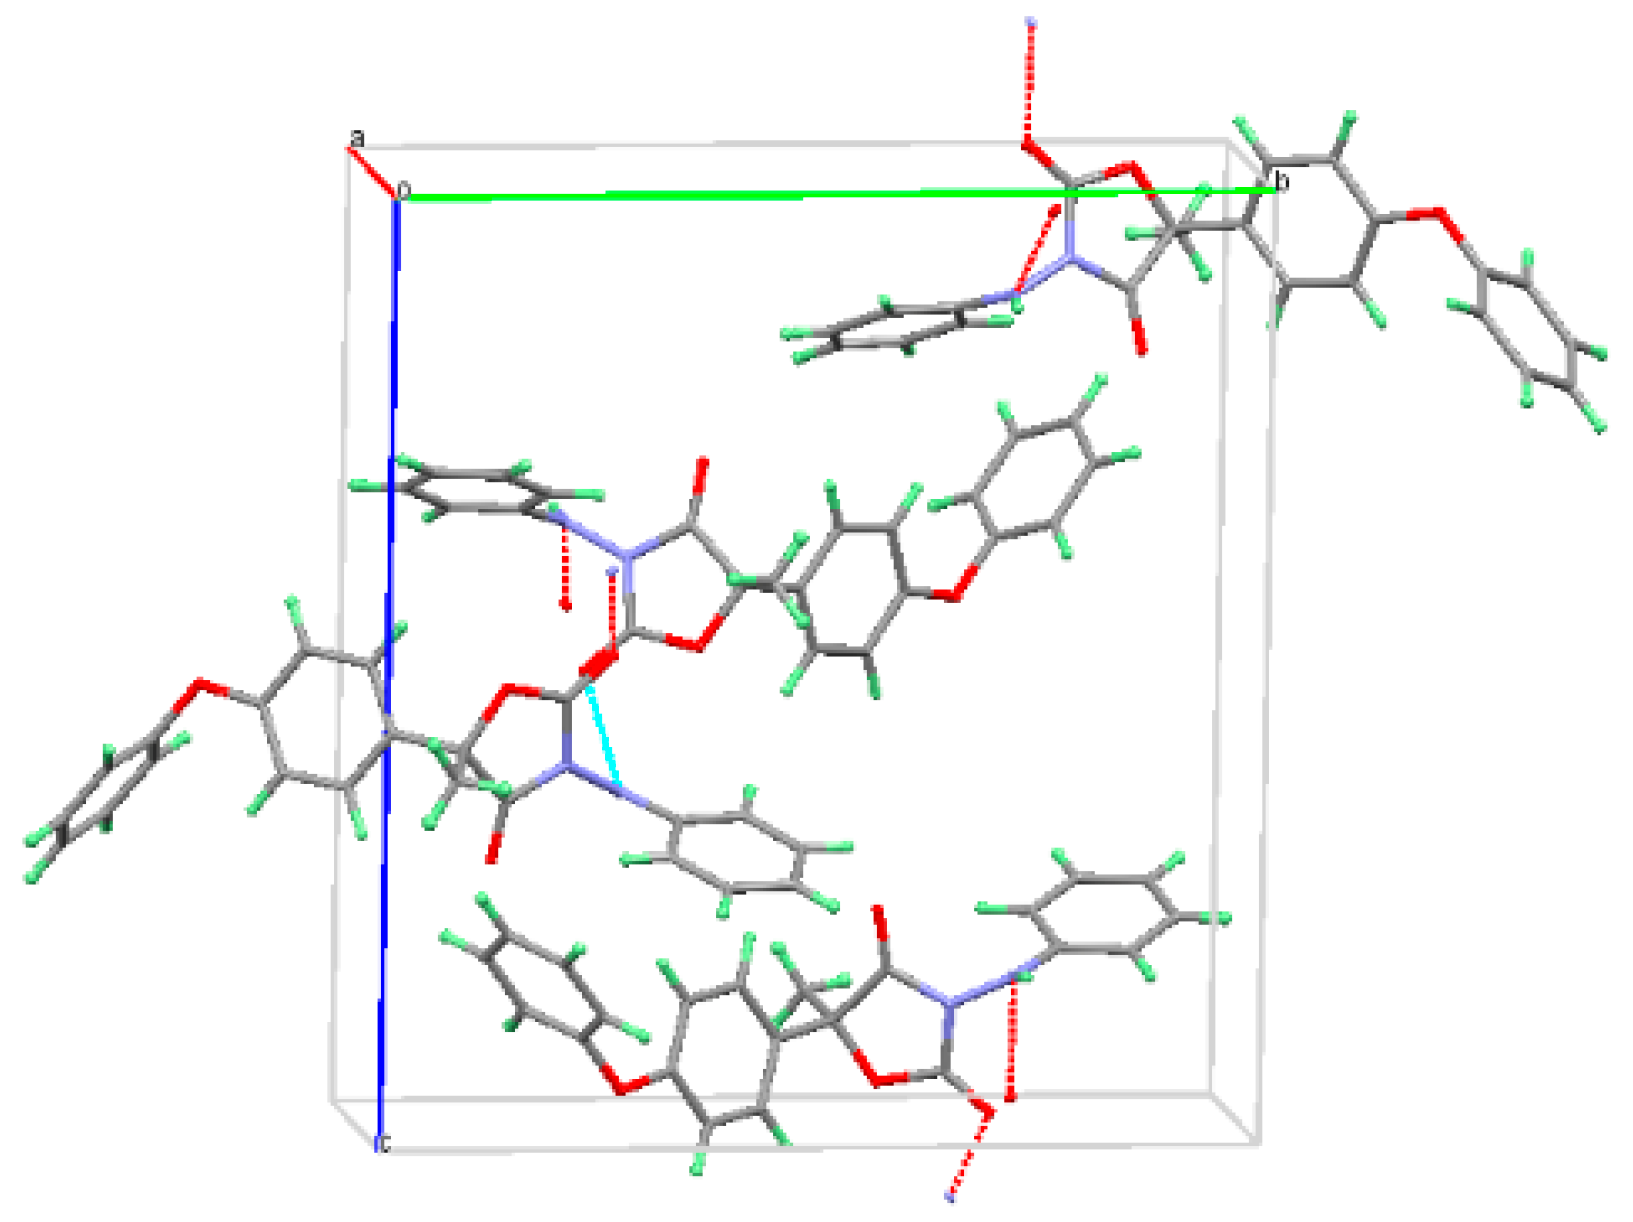
The crystal structure of Form I was determined by the orthorhombic P212121 space group (Z = 4, Z′ = 1) (Figure 4). Crystallographic data of Form I are summarized in Table 1. There were hydrogen-bonding interactions between O(3) of the carbonyl-group and N(2) of the imino group in adjacent Form I molecules. The hydrogen bonding distance of N(2)−H···O(3) was 2.512 Å. There was one literature report about the crystal structure of (S)-famoxadone [16]; the crystallographic data in the literature and the data obtained in this paper were compared, and it was found that the crystallographic data parameters of these two forms were approximately the same.
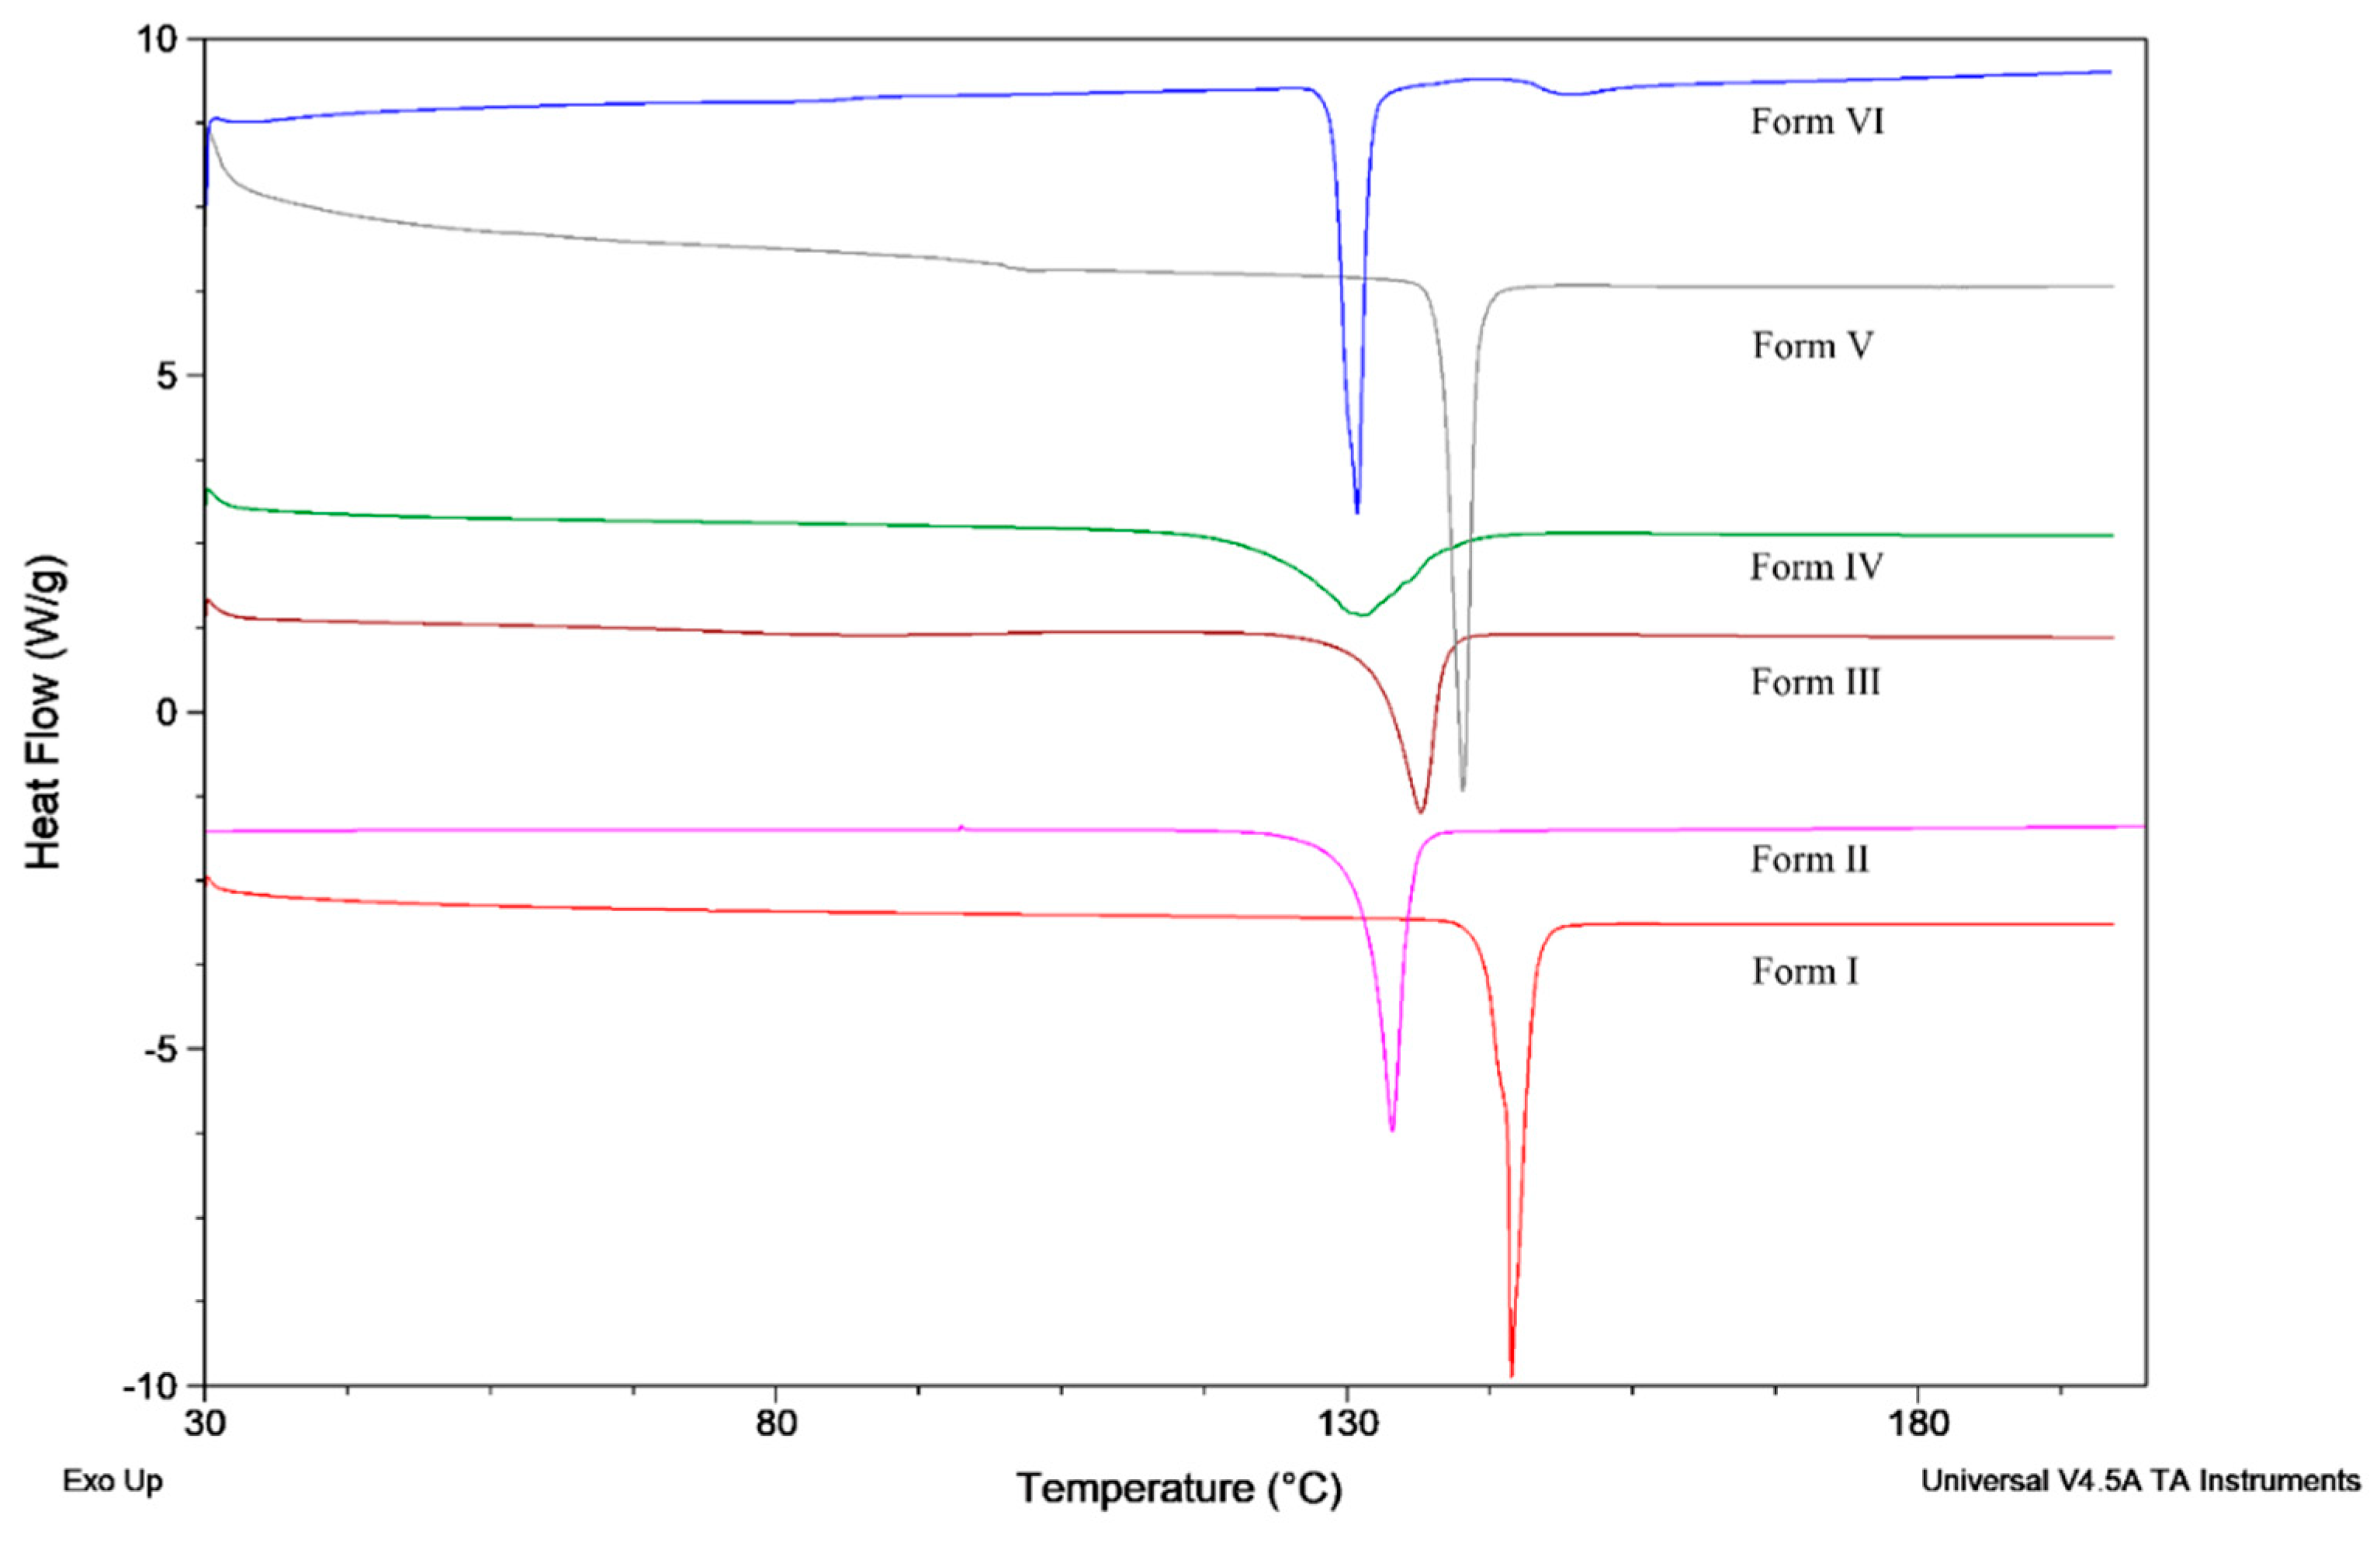
Polymorphs of famoxadone were also detected by DSC and are shown in Figure 5. The melting data are listed in Table 2. According to the heat of fusion rule [27], it was demonstrated that Form I is the most thermodynamically-stable polymorph. Based on the relevant thermodynamic data and phenomenon, Form I and Form II are in monotropic system [28]; thus, the transformation from Form II to Form I should proceed spontaneously. The stability experiments of the six famoxadone polymorphs are shown in Figures S2–S4. The experimental results showed that six polymorphs were stable under high temperature, high humidity, and strong light conditions for ten days and without polymorph change.
3.2. Solvent-Mediated Polymorphic Transformation Experiments
In the actual research process, it was found that Form I and Form II were easy to prepare and had good commercial application value. Therefore, a series of experiments was carried out to investigate the transformation process of Form II to Form I, and the basic experimental parameters are listed in Table 3. The mass of Form II added in each experiment was determined by initial supersaturation equivalent, which refers to the same ratio of the actual concentration of the solute that exceeds the saturated concentration over the saturated concentration. The formula was defined as σ = (C–C0)/C0, where σ is supersaturation, C is the actual concentration and C0 is the saturated concentration.
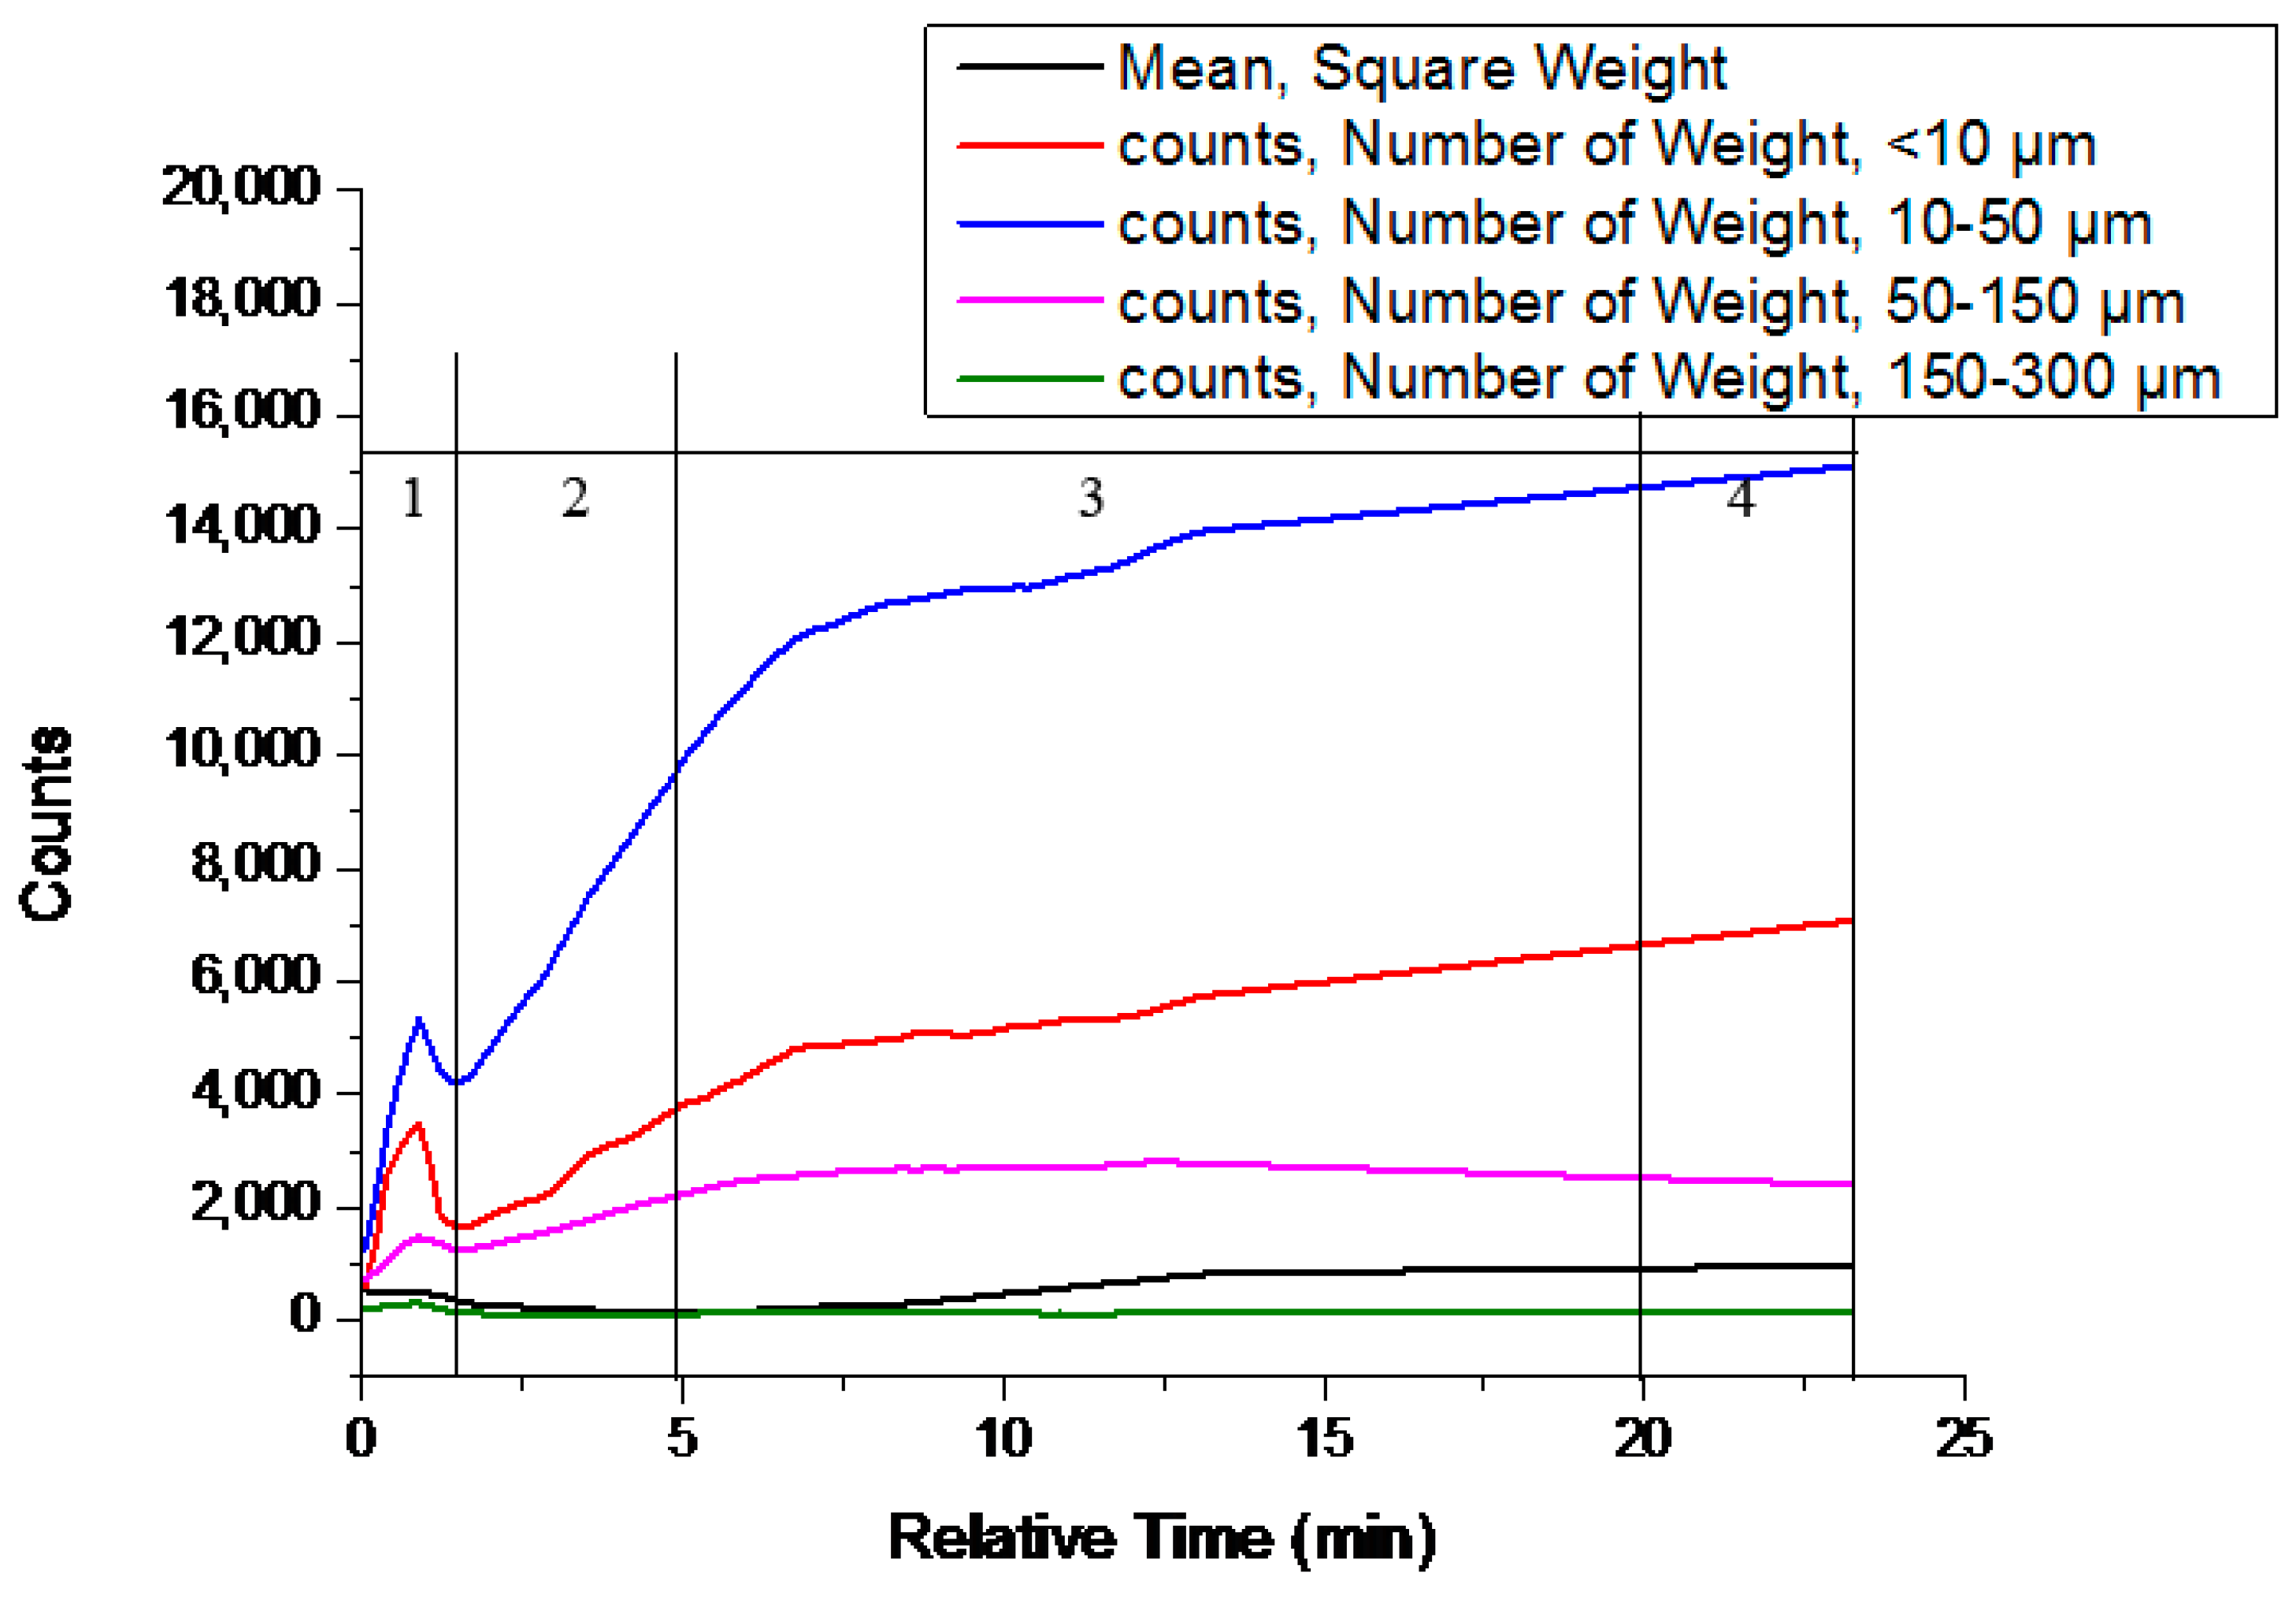
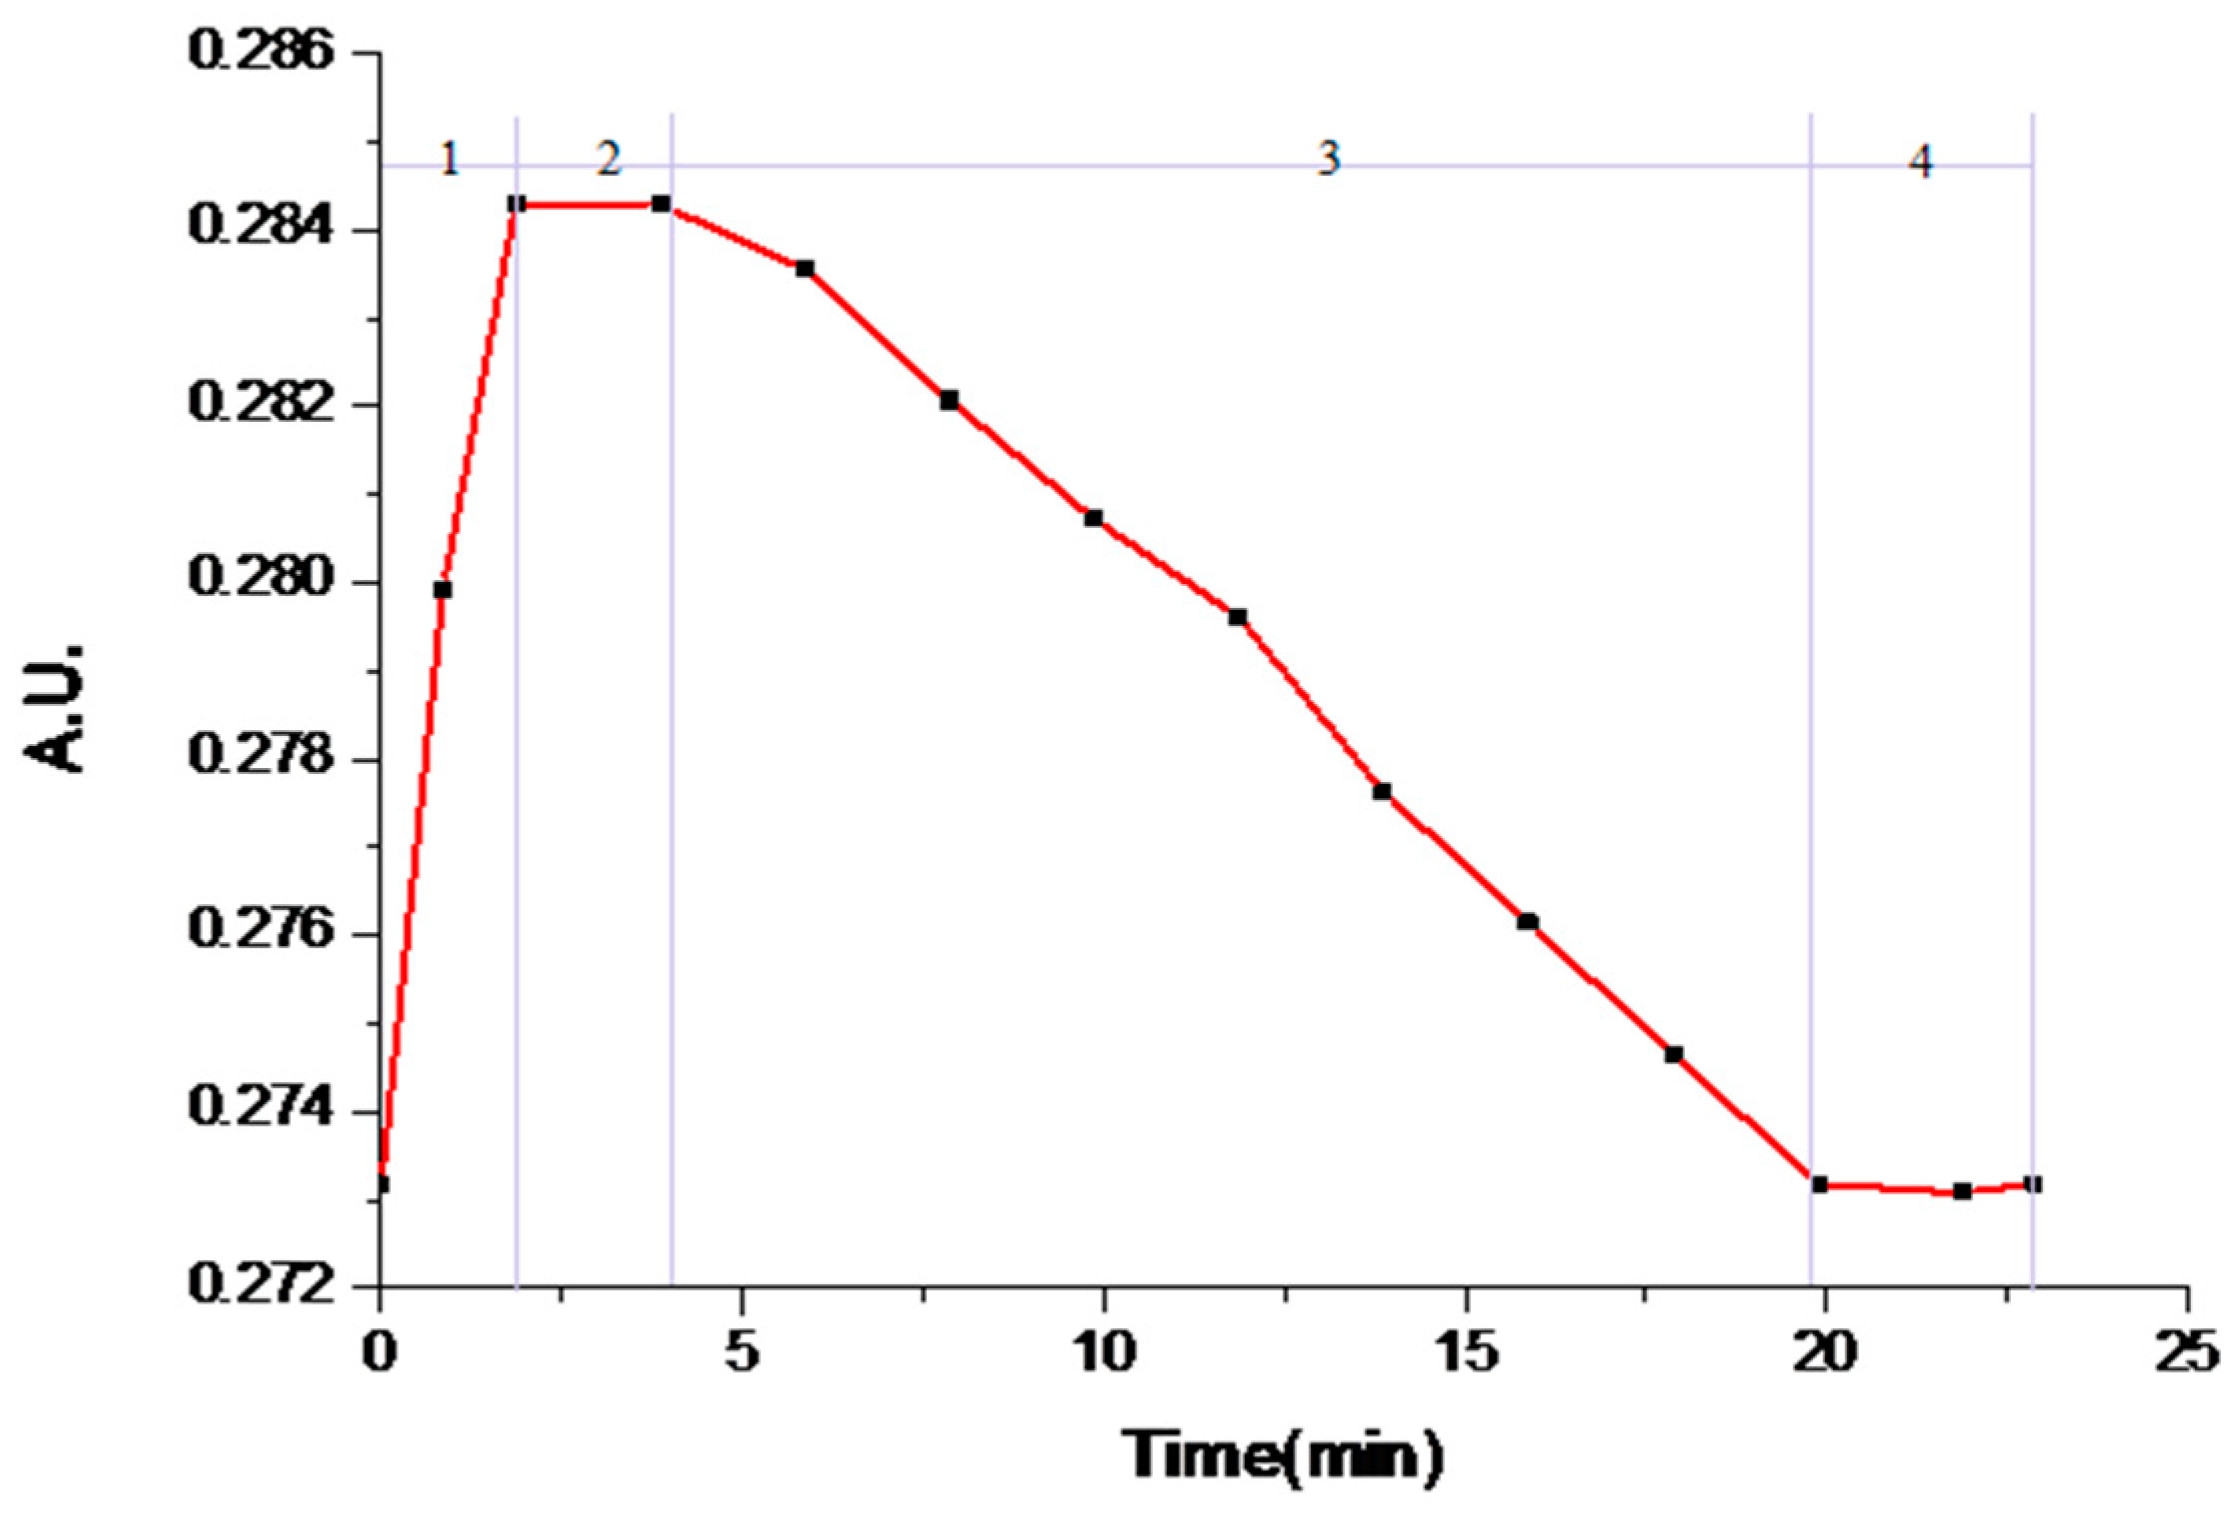
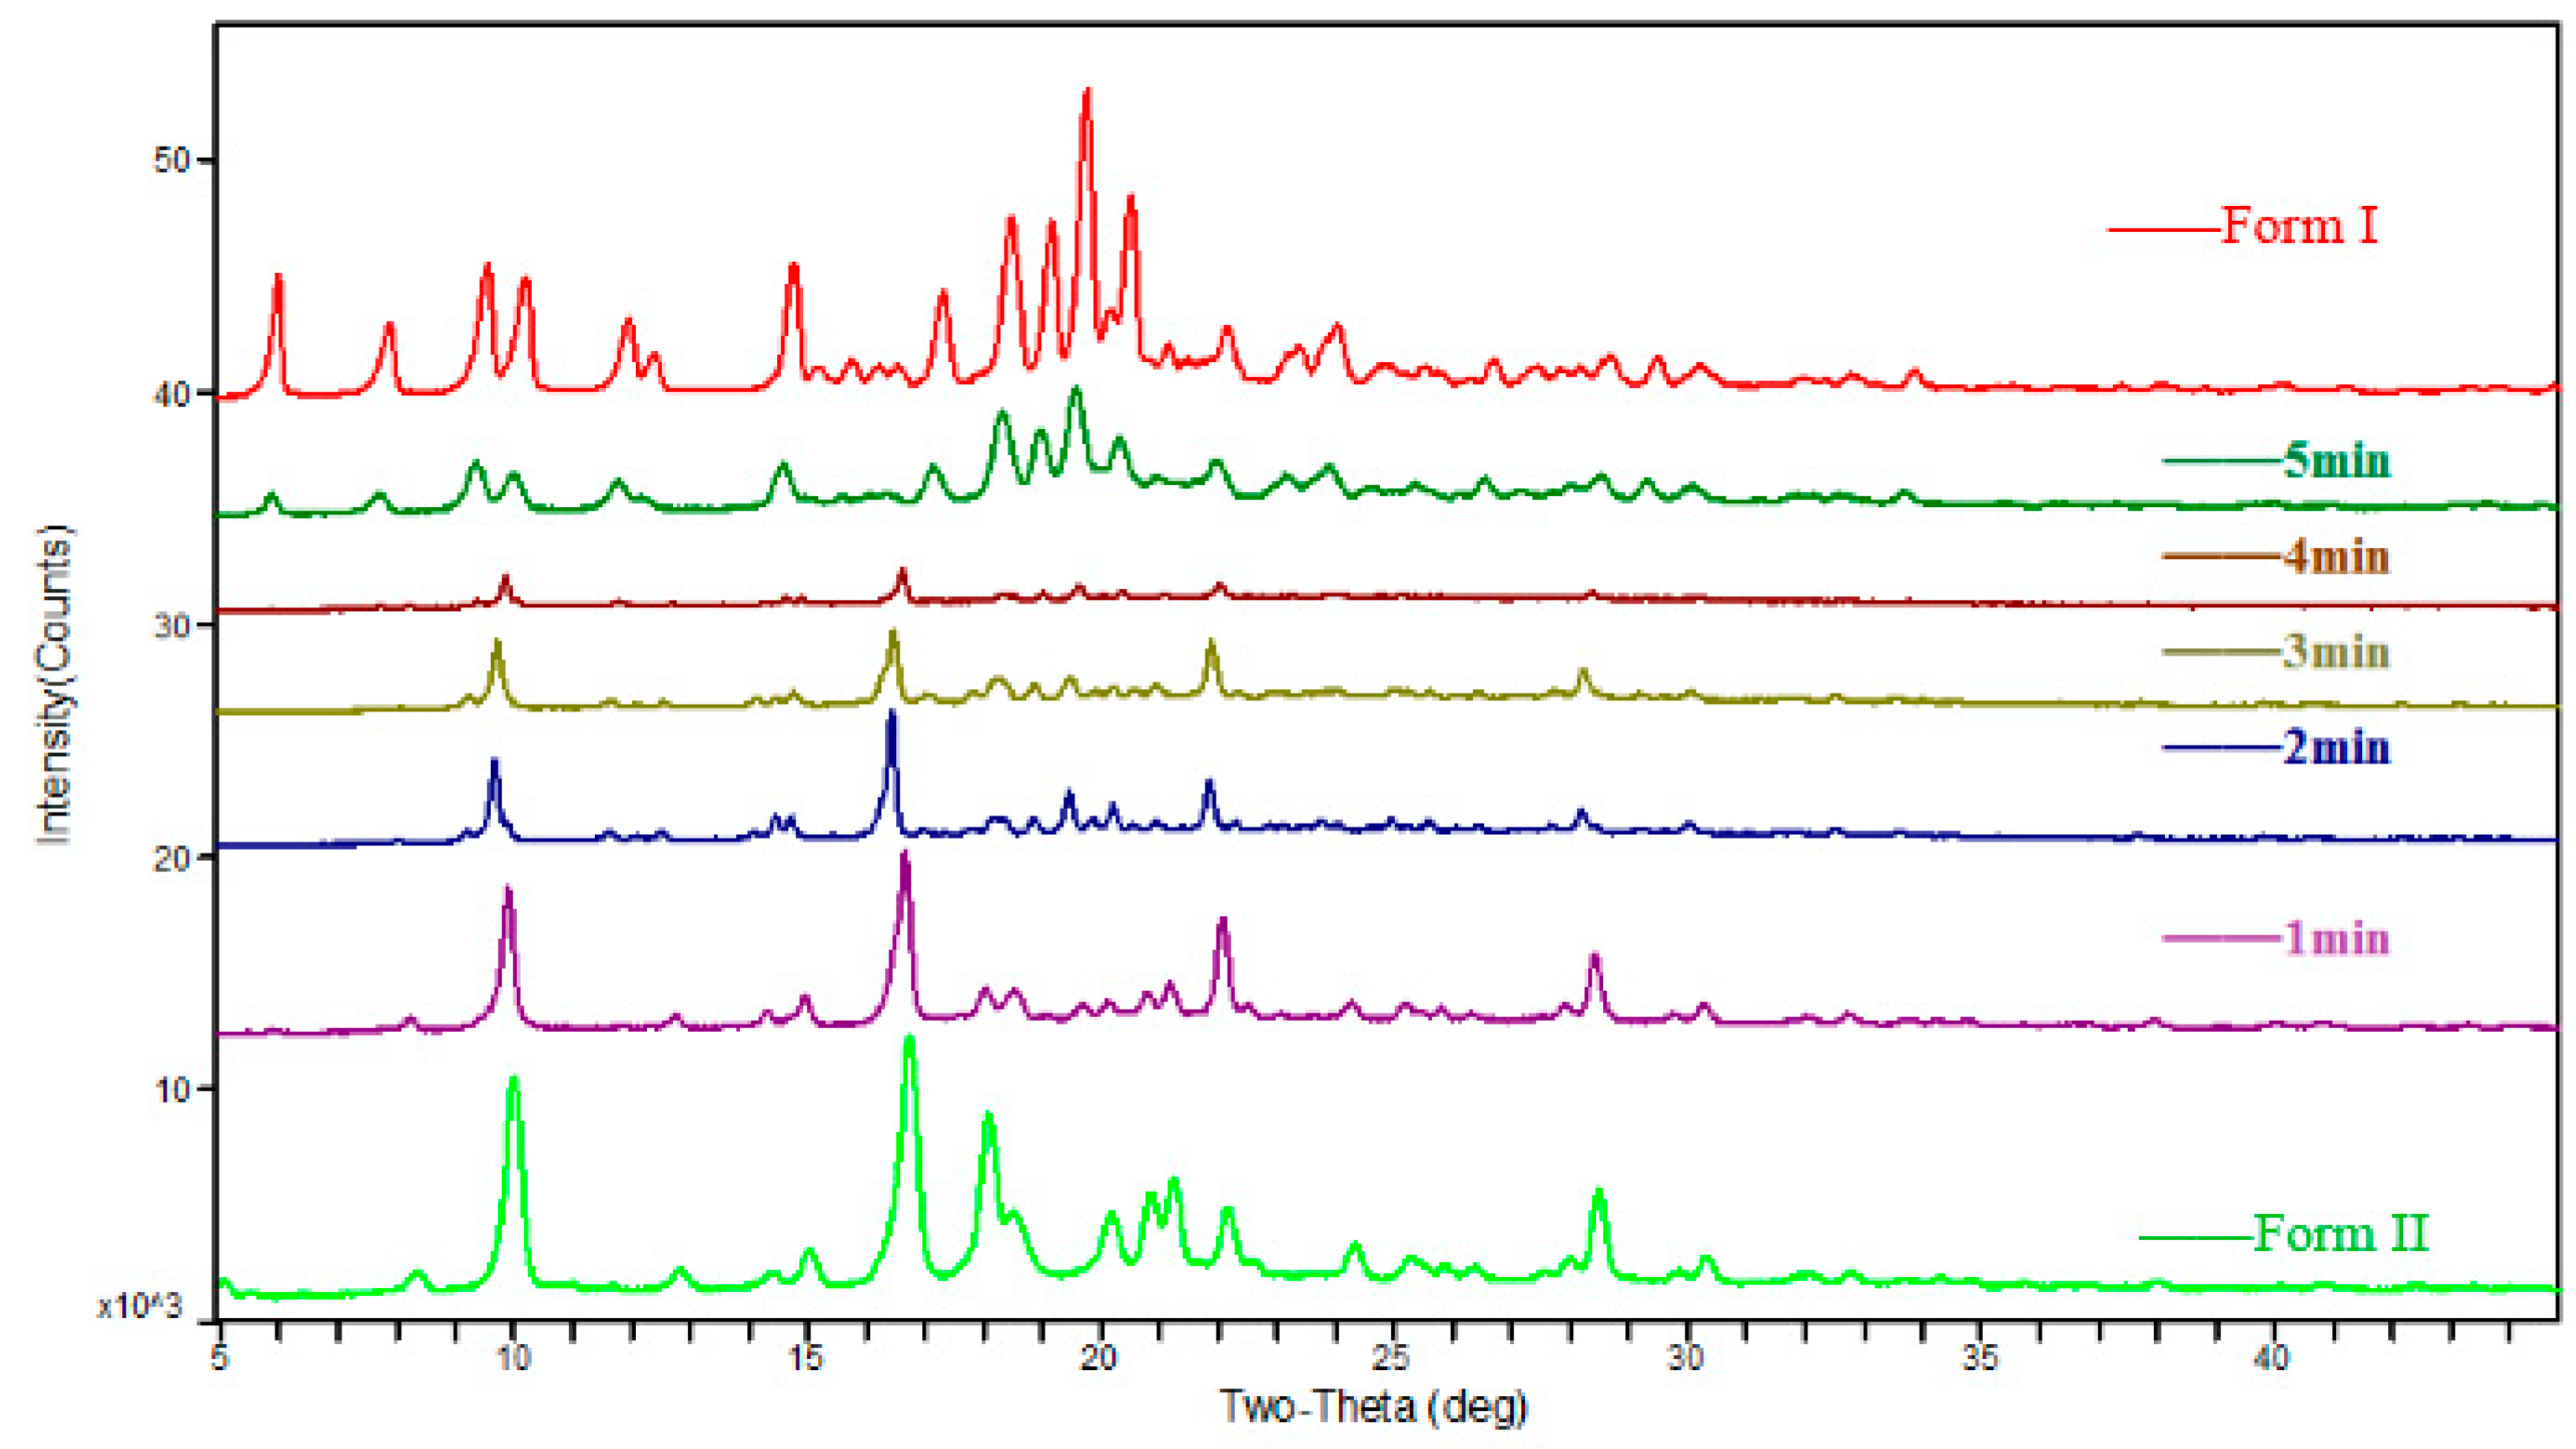
Experiment #4 was chosen as an example to study the transformation. The relevant variation curves of particle counts are shown in Figure 6. The solution concentration of famoxadone in the slurry is shown in Figure 7. The proper amount of solids was sampled from the slurry at different times and examined by XRPD, and the relevant patterns are shown in Figure 8. Other experiments’ relevant variation curves of particle counts are shown in Figures S5–S10.
At the beginning of the experiment, there was a process of adding Form II as Stage (1) in Figure 7 showed: the solution concentration of famoxadone increased rapidly until the dissolution equilibrium of Form II was reached, which was recorded by ReactIRTM. As the Stage (1) curve of Figure 6 shows, the particle counts of suspensions increased firstly and then decreased because of the adding of Form II and subsequently the dissolution of it. There was no polymorph change in Stage (1), which can be seen from the XRPD patterns.
In Stage (2), the nucleation and growth of Form I occurred. As Figure 6 shows, from t = 1.4 min, the 0–150-μm counts increased, while the 150–300-μm counts decreased. The mean chord length decrease meant the appearance of some small crystal nuclei. The characteristic peak of Form I (2θ = 19.78 ± 0.2°) was first observed in the XRPD pattern of the separated sample, which meant the suspensions solid phase was the mixture of Form I and Form II, as the XRPD pattern shown in Figure 8. The solution concentration remained at a platform, and the continual dissolution of metastable Form II would supply the driving force of the nucleation and growth of stable Form I. Cardew and Dawey [29] proposed a theory by means of the solution concentration platform value to deduce the rate-determining step. If the solution concentration platform value is near the metastable form’s solubility, the nucleation and growth of the stable form would determine the rate of SMPT. Conversely, the dissolution process of the metastable form would be the rate-determining step when the platform value is near to the solubility of the stable form. In this experiment, the solution concentration platform value was approximately equal to the solubilities of metastable Form II through the conversion between the ReactIRTM intensity and the corresponding solution concentration, and the induction times for all experiments were very short. From these, it can be concluded that the growth process of Form I is the rate-determining step.
After t = 5 min, it would be considered as Stage (3). The suspended Form II disappeared, and only Form I existed, as shown in the XRPD patterns in Figure 8. In this period, the mean chord length increased as shown in Figure 6, and this was due to the growth of Form I. As Form II was completely consumed, with the growth of Form I, the solution concentration and supersaturation level began to decrease rapidly, as shown in Figure 7.
Stage (4) is the end of transformation process. In this period, the solution concentration remained invariant, and the mean chord length increased due to the secondary process (aging, aggregation, breakage, etc.) of Form I.
The results of the kinetic experiments performed at the experimental temperature (30 ± 1 °C) represent a series of plots documenting the composition of the solid polymorph during SMPT, as detected by the XRPD method. Figure 8 shows the composition of the solid sampled from the slurry during the SMPT in the acetone/toluene (1:1) system. The reaction rates of each mixed solvent system were compared using this approach. This figure clearly demonstrates that the polymorphic transformation models were similar in all of the solvents, and the only factor that changed was the polymorphic transformation rate.
Considering that the limiting step in nucleation and growth is the transportation of the famoxadone molecule to the crystallization zone, famoxadone molecules diffused at a constant rate during the course of polymorph transition. Besides, the polymorph transition from Form II to Form I accorded with the classical nucleation theory [13] and because it occurred in the saturated solution of Form I. Taking all this into account, the nucleation and growth rate can be assumed to be constant. In order to compare SMPT rates quantitatively in different mixed solvent systems, experimental data were fitted with an appropriate kinetic model [30,31]. Solid-state kinetic models are theoretical, mathematical descriptions of experimental data and are usually expressed as rate equations [32]. The experimental data were in agreement with those for power solid-sate kinetic models [33] (Figure S11). The best correlation was observed when the experimental data points were fitted to the power model P2:
where k is the nucleation and growth rate constant, α is the weight fraction of Form I in the sample, and t is time. The correlations of the experimental data with the theoretical model in each solvent are given in Table S7. Rate constants were calculated based on the least squares method by using MS Excel Solver optimization software [34]. Corresponding nucleation growth rate constants k for each set of experiment calculated are listed in Table 4.
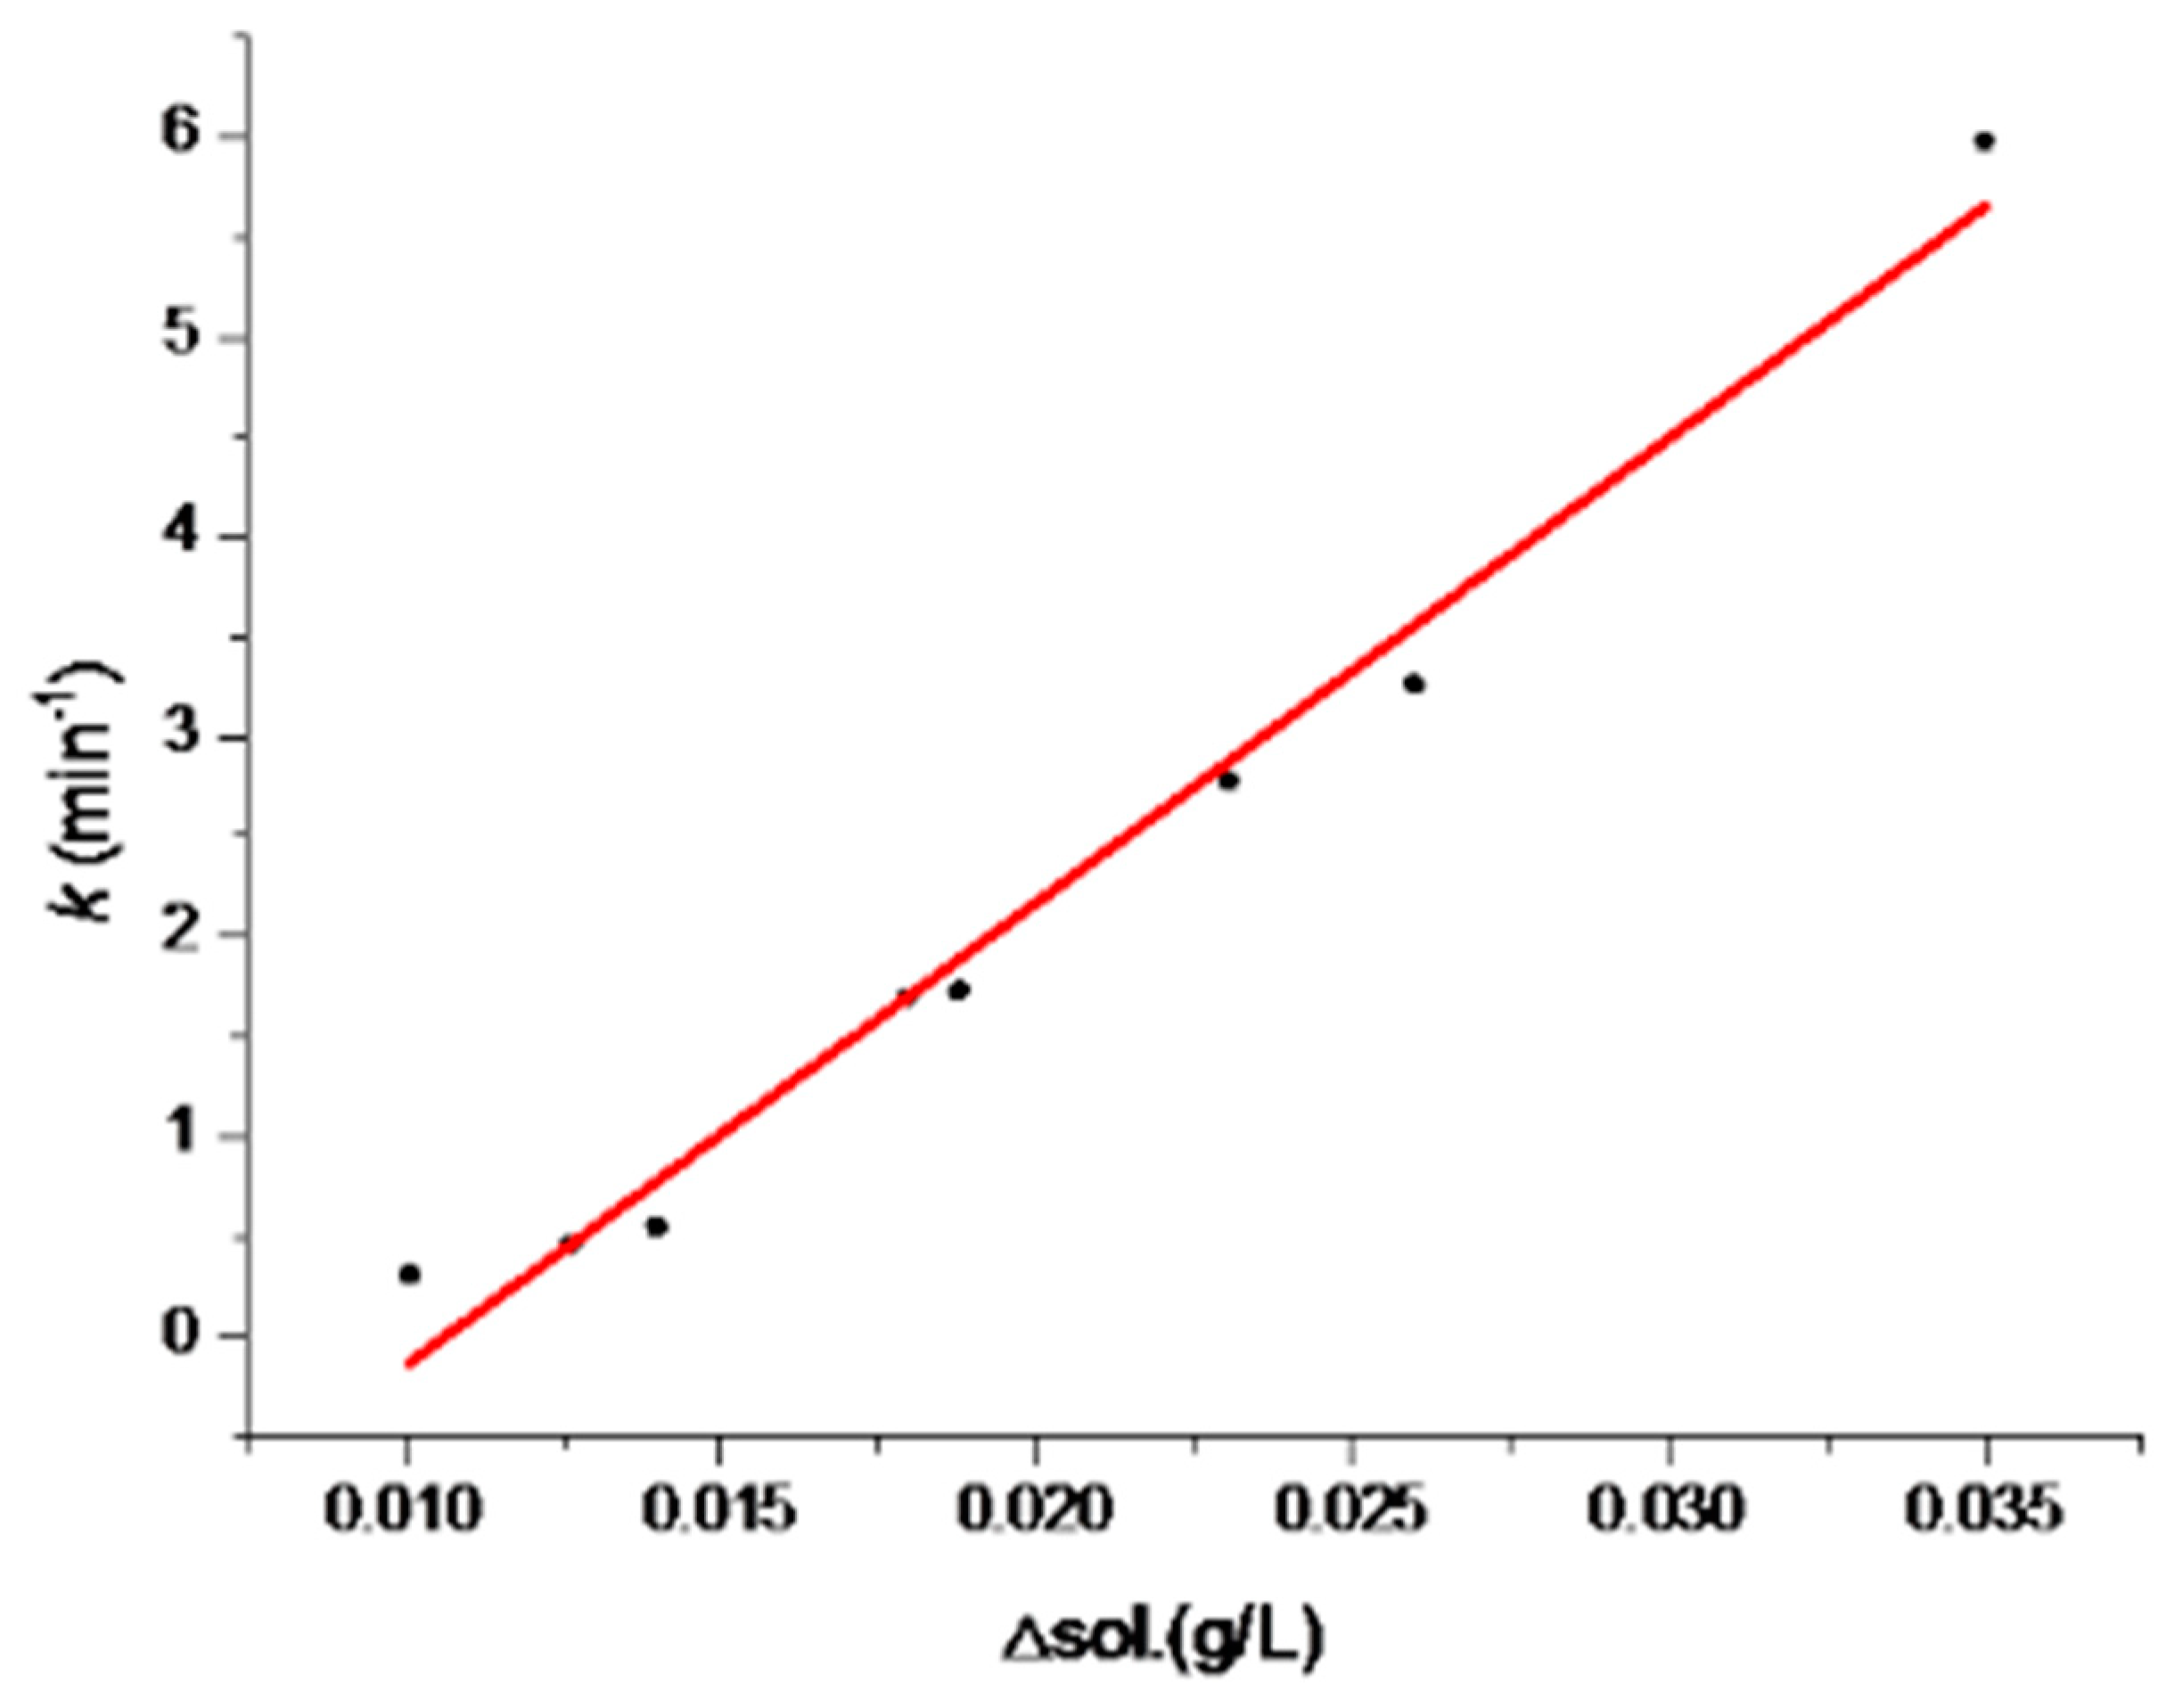
The solubility data of Form I and Form II are also listed in Table 4. The correlation of SMPT rate constant and the difference value between Form I and Form II solubilities were analyzed (Figure 9). This trend in SMPT from Form II to Form I is described by the equation:
where ΔS is the solubility difference value between Form I and Form II and k is the rate constant for SMPT. The correlation coefficient was R2 = 0.991. This means that there was a good correlation between the SMPT driving force solubility difference value ΔS and the nucleation growth rate constant k.
k = 10790.8819 ΔS + 0.1532
According to the classical nucleation theory, the metastable polymorph has higher nucleation rate in a solvent with higher solubility, and thus, the polymorphic transformation rate is faster [13]. However, the polymorphic transformation from Form II to Form I in this experiment obtained non-conforming results, indicating that the solute–solvent interaction also may have had an important effect on crystallizing kinetics.
The solute–solvent interaction may influence the nucleation and crystal growth rate in two ways. Firstly, the solvent interacted with dissolved molecules, which is called solvation. During the nucleation and crystal growth step, the solvated solute must precede the desolvation process and then integrate into the stable polymorph crystal lattice. Secondly, the solvent molecules are adsorbed on the surface of nuclei or a growing crystal cluster. The incoming solute molecules must replace the solvent molecules to become a part of stable polymorph crystal lattice [35]. For these two reasons, the stronger the solute–solvent interactions, the greater the retardation of nucleation and crystal growth and the slower the polymorphic transformation rate in the solution [36,37]. In this case, the famoxadone nucleation and crystal growth process was affected by the nature of the mixed solvent systems.
The solute–solvent interactions are mainly composed of van der Waals forces and hydrogen bonding [13]. The strength of van der Waals interactions between solute and solvent is determined by the dipolar polarizability, π* [38]. The strength of solute–solvent hydrogen-bonding interactions is determined by the hydrogen-bond-donation (HBD) ability α and the hydrogen-bond-acceptance (HBA) ability β [39]. The values of π* and β of solvents used in the experiments are listed in Table 5. Considering the hydrogen bond combination mode, the imino group in famoxadone has the biggest advantage to form hydrogen-bond as a hydrogen-bond-donor. Therefore, the strongest hydrogen-bond-receptor ability mixed solvent system will have the strongest solute–solvent interactions with famoxadone and retard the polymorph transformation process. In Experiments #1 and #4, the difference of the solvent was nitromethane and acetone. They have similar π*, but different β; acetone has a stronger hydrogen-bond-acceptance ability, so it has strong solute–solvent interactions with famoxadone, leading to a longer transformation time in Experiment #4. For Experiments #3–#7, the acetone was identical, and we only needed to compare another solvent. Toluene, xylene, and mesitylene all have similar β, so the dominant role is the strength of π*. Different solvents have different van der Waals interaction strengths with famoxadone, which will affect the time of polymorph transformation. It is noteworthy that Experiments #3 and #4 had opposite experimental results, and this may be due to the effect of the viscosity (μ) of the solvent, μ (m-xylene) = 0.7500 mPa s (25 °C), μ (toluene) = 0.5866 mPa s (25 °C). Viscosity may affect solvent-mediated polymorph transformation by affecting the mass transfer process [40,41].
4. Conclusions
In this paper, six polymorphs of famoxadone were prepared and characterized through XRPD and thermal analysis. In the polymorphic screening process, we only obtained the single crystal structure of Form I, and the other five polymorph single crystals were not obtained by careful cultivation. The single crystal data obtained in this paper were compared with the literature data. The solvent-mediated polymorphic transformation of famoxadone from Form II to Form I in several mixture solvent systems at 30 °C was also studied. The results show that Form I is the most stable form among the polymorphs from the thermodynamic point of view. The SMPT process could be divided into four periods, and was controlled by the growth of the stable Form I. The rate constants for this process were in the range from 0.31 min−1–5.98 min−1 and depended linearly on the solubility difference value between the two polymorphs.
It is concluded that the acetone/mesitylene mixture solvent system had the strongest interactions with famoxadone molecules compared to the others because of its higher hydrogen-bond-acceptance ability and lower dipolar polarizability, thereby retarding the nucleation and growth of Form I during the transformation process.
Supplementary Materials
The following is available at https://0-www-mdpi-com.brum.beds.ac.uk/2073-4352/9/3/161/s1. Additional data and figures: Crystallographic information, descriptions of some experimental details, tables, and graphs. Accession Codes: CCDC 1560380 contains the supplementary crystallographic data for this paper. These data can be obtained free of charge via www.ccdc.cam.ac.uk/data_request/cif, or by emailing [email protected], or by contacting The Cambridge Crystallo-graphic Data Centre, 12, Union Road, Cambridge CB2 1EZ, U.K.; fax: +44 1223 336033.
Author Contributions
D.D. participated in the design of this study, collected important background information, literature search, performed the statistical analysis, acquisition of data, data analysis and interpretation, and drafted the manuscript. G.-B.R. carried out the study and guided background information; M.-H.Q. participated in the design of this study, data analysis and interpretation, and revised the manuscript. Z.L. carried out the study and guided background information. X.-Y.X. participated in the design of this study, carried out the concepts, and performed manuscript review and revise.
Funding
This work was supported by the National Key Research Program of China (No. 2017YFD0200505), the National Natural Science Foundation of China (No. 21706064), and the Fundamental Research Funds for the Central Universities (No. 222201718004, No. 222201814049).
Conflicts of Interest
The authors declare no competing financial interest.
References
- Maciej, P.; Piotr, C.; Maciej, P.; Dorota, Z.; Miroslaw, K. On the origin of surface imposed anisotropic growth of salicylic and acetylsalicylic acids crystals during droplet evaporation. J. Mol. Model. 2015, 21, 49. [Google Scholar]
- Gagniere, E.; Mangin, D.; Puel, F. Formation of co-crystals: Kinetic and thermodynamic aspects. J. Cryst. Growth 2009, 311, 2689–2695. [Google Scholar] [CrossRef]
- Cysewski, P.; Przybyłek, M.; Miernik, T.; Kobierski, M.; Ziółkowska, D. On the origin of surfaces-dependent growth of benzoic acid crystal inferred through the droplet evaporation method. Struct. Chem. 2015, 26, 705–712. [Google Scholar] [CrossRef]
- Terry, T. Crystallisation of Polymorphs: Thermodynamic Insight into the Role of Solvent. Org. Process Res. Dev. 2000, 4, 384–390. [Google Scholar]
- Bhugra, C.; Pikal, M.J. Role of thermodynamic, molecular, and kinetic factors in crystallization from the amorphous state. J. Pharm. Sci. 2008, 97, 1329–1349. [Google Scholar] [CrossRef] [PubMed]
- Clavaguera, N.; Clavagueramora, M.T.; Crespo, D.; Pradell, T. Thermodynamic and kinetic factors driving primary crystallization. In Proceedings of the Fifth International Workshop on Non-Crystalline Solids, Santiago de Compostela, Spain, 2–5 July 2015; pp. 272–277. [Google Scholar]
- Stoica, C.; Tinnemans, P.; Meekes, H.; Vlieg, E.; Hoof, P.J.C.M.V.; Kaspersen, F.M. Epitaxial 2D Nucleation of Metastable Polymorphs: A 2D Version of Ostwald’s Rule of Stages. Cryst. Growth Des. 2005, 5, 975–981. [Google Scholar] [CrossRef]
- Chen, C.; Cook, O.; Nicholson, C.E.; Cooper, S.J. Leapfrogging Ostwald’s Rule of Stages: Crystallization of Stable γ-Glycine Directly from Microemulsions. Cryst. Growth Des. 2011, 11, 2228–2237. [Google Scholar] [CrossRef]
- Murphy, D.; Rodrı́Guez-Cintrón, F.; Langevin, B.; Kelly, R.C.; Rodrı́Guez-Hornedo, N. Solution-mediated phase transformation of anhydrous to dihydrate carbamazepine and the effect of lattice disorder. Int. J. Pharm. 2002, 246, 121. [Google Scholar] [CrossRef]
- Nguyen, D.L.T.; Kim, K.J. Solvent-Mediated Polymorphic Transformation of α-Taltirelin by Seeded Crystallization. Chem. Eng. Technol. 2016, 39, 1281–1288. [Google Scholar] [CrossRef]
- Liu, Y.; Gao, H.; Xu, H.; Ren, F.; Ren, G. Influence of Temperature, Solvents, and Excipients on Crystal Transformation of Agomelatine. Org. Process Res. Dev. 2016, 20, 1559–1565. [Google Scholar] [CrossRef]
- Yang, L.; Hao, H.; Zhou, L.; Wei, C.; Hou, B.; Xie, C.; Yin, Q. Crystal Structures and Solvent-Mediated Transformation of the Enantiotropic Polymorphs of 2,3,5-Trimethyl-1,4-diacetoxybenzene. Ind. Eng. Chem. Res. 2013, 52, 17667–17675. [Google Scholar] [CrossRef]
- Gu, C.H.; Young, V.; Grant, D.J.W. Polymorph screening: Influence of solvents on the rate of solvent-mediated polymorphic transformation. J. Pharm. Sci. 2001, 90, 1878–1890. [Google Scholar] [CrossRef] [PubMed]
- Schöll, J.; Bonalumi, D.; Lars Vicum, A.; Mazzotti, M.; Müller, M. In Situ Monitoring and Modeling of the Solvent-Mediated Polymorphic Transformation of l-Glutamic Acid. Cryst. Growth Des. 2006, 6, 881–891. [Google Scholar] [CrossRef]
- Sternberg, J.A.; Geffken, D.; Adams, J.B.; Pöstages, R.; Sternberg, C.G.; Campbell, C.L.; Moberg, W.K. Famoxadone: The discovery and optimisation of a new agricultural fungicide. Pest Manag. Sci. 2001, 57, 143–152. [Google Scholar] [CrossRef]
- Zheng, Y.-J.; Shapiro, R.; Marshall, W.J.; Jordan, D.B. Synthesis and structural analysis of the active enantiomer of famoxadone, a potent inhibitor of cytochrome bc1. Bioorg. Med. Chem. Lett. 2000, 10, 1059–1062. [Google Scholar] [CrossRef]
- Macaluso, R.T.; Wells, B.; Wangeline, C.; Cochran, K.; Greve, B.K. Powder X-ray diffraction and electron microscopy studies of polycrystalline Au2PrIn. Polyhedron 2016, 114, 313–316. [Google Scholar] [CrossRef] [Green Version]
- Oishi, R.; Yonemura, M.; Nishimaki, Y.; Torii, S.; Hoshikawa, A.; Ishigaki, T. Rietveld analysis software for j-parc. Nucl. Instrum. Methods Phys. Res. 2009, 600, 94–96. [Google Scholar] [CrossRef]
- Fedushkin, I.L.; Nevodchikov, V.I.; Bochkarev, M.N.; Dechert, S.; Schumann, H. Reduction of 2,5-di-tert-butylcyclopentadienone and pyridine with thulium diiodide. Structures of the complexes TmI2(THF)2[η5-But2C5H2O]TmI2(THF)3 and [TmI2(C5H5N)4]2(μ2-N2C10H10). Russ. Chem. Bull. 2003, 52, 154–159. [Google Scholar] [CrossRef]
- Beghidja, C.; Rogez, G.; Kortus, J.; Wesolek, M.; Welter, R. Very strong ferromagnetic interaction in a new binuclear mu-methoxo-bridged Mn(III) complex: Synthesis, crystal structure, magnetic properties, and DFT calculations. J. Am. Chem. Soc. 2006, 128, 3140–3141. [Google Scholar] [CrossRef]
- Powell, D.R. Review of X-Ray Crystallography. In X-Ray Crystallography; Girolami, G.S., Ed.; University Science Books: Mill Valley, CA, USA, 2015; 300p, ISBN 9781891389771. (hardcover). [Google Scholar]
- Dieterich, M.; Kutchko, B.; Goodman, A. Characterization of Marcellus Shale and Huntersville Chert before and after exposure to hydraulic fracturing fluid via feature relocation using field-emission scanning electron microscopy. Fuel 2016, 182, 227–235. [Google Scholar] [CrossRef] [Green Version]
- Xu, X.; Abhay, G.; Sayeed, V.A.; Khan, M.A. Process analytical technology to understand the disintegration behavior of alendronate sodium tablets. J. Pharm. Sci. 2013, 102, 1513–1523. [Google Scholar] [CrossRef]
- Kennemur, J.G.; Desousa, J.D.; Martin, J.D.; Novak, B.M. Reassessing the Regioregularity of N-(1-Naphthyl)-N′-(n-octadecyl)polycarbodiimide Using Solution Infrared Spectroscopy. Macromolecules 2015, 44, 5064–5067. [Google Scholar] [CrossRef]
- Costa, I.C.R.; Leite, S.G.F.; Leal, I.C.R.; Miranda, L.S.M.; Souza, R.O.M.A.D. Thermal effect on the microwave assisted biodiesel synthesis catalyzed by lipases. J. Braz. Chem. Soc. 2011, 22, 1993–1998. [Google Scholar] [CrossRef] [Green Version]
- Hamilton, D.L.; Oxtoby, S. Solubility of Water in Albite-Melt Determined by the Weight-Loss Method. J. Geol. 1986, 94, 626–630. [Google Scholar] [CrossRef]
- Chen, J.; Sarma, B.; Evans, J.M.B.; Myerson, A.S. Pharmaceutical Crystallization. Cryst. Growth Des. 2011, 11, 887–895. [Google Scholar] [CrossRef]
- Näther, C.; Jess, I.; Seyfarth, L.; Bärwinkel, K.; Senker, J. Trimorphism of Betamethasone Valerate: Preparation, Crystal Structures, and Thermodynamic Relations. Cryst. Growth Des. 2015, 15, 366–373. [Google Scholar] [CrossRef]
- Cardew, P.T.; Davey, R.J. The Kinetics of Solvent-Mediated Phase Transformations. Proc. R. Soc. Lond. 1985, 398, 415–428. [Google Scholar] [CrossRef]
- Skrdla, P.J.; Robertson, R.T. Dispersive kinetic models for isothermal solid-state conversions and their application to the thermal decomposition of oxacillin. Thermochim. Acta 2007, 453, 14–20. [Google Scholar] [CrossRef]
- Liu, W.; Dang, L.; Wei, H. Thermal, phase transition, and thermal kinetics studies of carbamazepine. J. Therm. Anal. Calorim. 2013, 111, 1999–2004. [Google Scholar] [CrossRef]
- Skrdla, P.J. Crystallizations, solid-state phase transformations and dissolution behavior explained by dispersive kinetic models based on a Maxwell-Boltzmann distribution of activation energies: Theory, applications, and practical limitations. J. Phys. Chem. A 2009, 113, 9329. [Google Scholar] [CrossRef]
- Liu, M.; Pourquie, M.J.B.M.; Fan, L.; Halliop, W.; Cobas, V.R.M.; Verkooijen, A.H.M.; Aravind, P.V. The Use of Methane-Containing Syngas in a Solid Oxide Fuel Cell: A Comparison of Kinetic Models and a Performance Evaluation. Fuel Cells 2013, 13, 428–440. [Google Scholar] [CrossRef]
- Takane, Y.; Young, F.W.; Leeuw, J.D. Nonmetric individual differences multidimensional scaling: An alternating least squares method with optimal scaling features. Psychometrika 1977, 42, 7–67. [Google Scholar] [CrossRef]
- Khoshkhoo, S.; Anwar, J. Crystallization of polymorphs: The effect of solvent. J. Phys. D Appl. Phys. 1993, 26, B90. [Google Scholar] [CrossRef]
- Blagden, N.; Davey, R.J.; Lieberman, H.F.; Williams, L.; Payne, R.; Roberts, R.; Rowe, R.; Docherty, R. Crystal chemistry and solvent effects in polymorphic systems Sulfathiazole. J. Chem. Soc. Faraday Trans. 1998, 94, 1035–1044. [Google Scholar] [CrossRef]
- Gidalevitz, D.; Feidenhans’L, R.; Matlis, S.; Smilgies, D.M.; Christensen, M.J.; Leiserowitz, L. Monitoring in situ growth and dissolution of molecular crystals: Towards determination of the growth unit. Angew. Chem. Int. Ed. Engl. 1997, 36, 955–959. [Google Scholar] [CrossRef]
- Marcus, Y. ChemInform Abstract: The Properties of Organic Liquids that are Relevant to Their Use as Solvating Solvents. Cheminform 1994, 25, 409–416. [Google Scholar] [CrossRef]
- A braham, M.H. ChemInform Abstract: Scales of Solute Hydrogen-Bonding: Their Construction and Application to Physicochemical and Biochemical Processes; National Academy of Sciences-National Research Council: Washington, DC, USA, 1993; pp. 277–283. [Google Scholar]
- Heijnen, J.J.; Riet, K.V. Mass transfer, mixing and heat transfer phenomena in low viscosity bubble column reactors. Chem. Eng. J. 1984, 28, B21–B42. [Google Scholar] [CrossRef]
- Aimar, P.; Field, R. Limiting flux in membrane separations: A model based on the viscosity dependency of the mass transfer coefficient. Chem. Eng. Sci. 1992, 47, 579–586. [Google Scholar] [CrossRef]
Figure 1.
Molecular structure of famoxadone.

Figure 2.
XRPD patterns of famoxadone from Form I to Form VI polymorphs.

Figure 3.
SEM images of famoxadone Form I (a), Form II (b), Form III (c), Form IV (d), Form V (e), and Form VI (f).
Figure 3.
SEM images of famoxadone Form I (a), Form II (b), Form III (c), Form IV (d), Form V (e), and Form VI (f).


Figure 4.
Famoxadone racemic Form I crystal packing projection graphs.

Figure 5.
DSC curves of famoxadone from Form I to Form VI.

Figure 6.
Variation curve of particle counts and mean of chord length in Experiment #4.

Figure 7.
Solution concentration change of famoxadone in Experiment #4.

Figure 8.
Comparison diagram of XRPD during the transformation process in Experiment #4.

Figure 9.
Correlation of SMPT rate constants (k) and the difference value between the solubilities of Form I and Form II (ΔS) in mixed solvent system.
Figure 9.
Correlation of SMPT rate constants (k) and the difference value between the solubilities of Form I and Form II (ΔS) in mixed solvent system.


Table 1.
Crystallographic information of famoxadone Form I.
| Polymorph | Form I |
|---|---|
| Crystal system | Orthorhombic |
| Space group | P212121 |
| a (Å) | 5.8880 (5) |
| b (Å) | 16.9635 (16) |
| c (Å) | 18.4218 (17) |
| α (°) | 90 |
| β (°) | 90 |
| γ (°) | 90 |
| Volume (Å3) | 1840.0(3) |
| Z | 4 |
| CCDC No. | 1560380 |
| Temperature | 130 K |
| Crystal size | 0.22 × 0.08 × 0.05 mm3 |
| Theta range for data collection | 1.632 to 30,565° |
| Reflections collected | 18,744 |
| Absorption correction | Semi-empirical from equivalents |
| Final R indices [I>2σ (I)] | R1 = 0.0395, ωR2 = 0.0932 |
Table 2.
Melting data of famoxadone polymorphs.
| Polymorph | Tonset (°C) | Tpeak (°C) | Hf (kJ/mol) |
|---|---|---|---|
| Form I | 141.86 | 144.07 | 93.43 |
| Form II | 129.78 | 133.95 | 91.27 |
| Form III | 130.63 | 136.51 | 71.89 |
| Form IV | 119.99 | 131.2 | 80.23 |
| Form V | 137.12 | 140.22 | 88.02 |
| Form VI | 128.72 | 130.87 | 86.10 |
Table 3.
Experimental conditions and parameters.
| No. | Mixed Solvent System | T (°C) | Approximate Form II Added at t = 0 min (g) | Approximate ttrans (min) |
|---|---|---|---|---|
| #1 | Nitromethane/toluene (1:1) | 30 | 2.06 | 1 |
| #2 | Nitromethane/isopropylbenzene (1:1) | 30 | 1.51 | 2 |
| #3 | Acetone/m-xylene (1:1) | 30 | 0.49 | 3 |
| #4 | Acetone/toluene (1:1) | 30 | 5.57 | 5 |
| #5 | Acetone/o-xylene (1:1) | 30 | 5.72 | 15 |
| #6 | Acetone/p-xylene (1:1) | 30 | 5.31 | 19 |
| #7 | Acetone/mesitylene (1:1) | 30 | 1.23 | 26 |
ttrans means the required time from the start of the addition of Form II to the completion of the transformation to Form I.
Table 4.
The rate constant and solubility data of Form I and Form II in experiments at 30 °C.
| No. | Mixed Solvent System | Rate Constant k (min-1) | SForm I (g/L) | SForm II (g/L) |
|---|---|---|---|---|
| #1 | nitromethane/toluene (1:1) | 5.98 | 0.15555 | 0.15609 |
| #2 | nitromethane/isopropylbenzene (1:1) | 3.26 | 0.29251 | 0.29278 |
| #3 | acetone/m-xylene (1:1) | 2.78 | 0.26269 | 0.26293 |
| #4 | acetone/toluene (1:1) | 1.73 | 0.19559 | 0.19577 |
| #5 | acetone/o-xylene (1:1) | 0.55 | 0.28751 | 0.28755 |
| #6 | acetone/p-xylene (1:1) | 0.46 | 0.26279 | 0.26281 |
| #7 | acetone/mesitylene (1:1) | 0.31 | 0.49958 | 0.49959 |
© 2019 by the authors. Licensee MDPI, Basel, Switzerland. This article is an open access article distributed under the terms and conditions of the Creative Commons Attribution (CC BY) license (http://creativecommons.org/licenses/by/4.0/).
Share and Cite
MDPI and ACS Style
Du, D.; Ren, G.-B.; Qi, M.-H.; Li, Z.; Xu, X.-Y. Solvent-Mediated Polymorphic Transformation of Famoxadone from Form II to Form I in Several Mixed Solvent Systems. Crystals 2019, 9, 161. https://0-doi-org.brum.beds.ac.uk/10.3390/cryst9030161
AMA Style
Du D, Ren G-B, Qi M-H, Li Z, Xu X-Y. Solvent-Mediated Polymorphic Transformation of Famoxadone from Form II to Form I in Several Mixed Solvent Systems. Crystals. 2019; 9(3):161. https://0-doi-org.brum.beds.ac.uk/10.3390/cryst9030161
Chicago/Turabian StyleDu, Dan, Guo-Bin Ren, Ming-Hui Qi, Zhong Li, and Xiao-Yong Xu. 2019. "Solvent-Mediated Polymorphic Transformation of Famoxadone from Form II to Form I in Several Mixed Solvent Systems" Crystals 9, no. 3: 161. https://0-doi-org.brum.beds.ac.uk/10.3390/cryst9030161
Note that from the first issue of 2016, this journal uses article numbers instead of page numbers. See further details here.