Liquid-Crystalline Dispersions of Double-Stranded DNA
by
Yuri Yevdokimov
1,*,†, 
Sergey Skuridin
1,†,
Viktor Salyanov
1,†,
Sergey Semenov
2 and
Efim Kats
3 1
Engelhardt Institute of Molecular Biology of the Russian Academy of Sciences, Vavilova, St. 32, Moscow 119991, Russia
2
National Research Centre “Kurchatov Institute”, Kurchatova Sq. 1, Moscow 123182, Russia
3
Landau Institute for Theoretical Physics of the Russian Academy of Sciences, Academician Semenov Ave. 1a, Chernogolovka, Moscow Region 142432, Russia
*
Author to whom correspondence should be addressed.
†
These authors contributed equally to this manuscript.
Crystals 2019, 9(3), 162; https://0-doi-org.brum.beds.ac.uk/10.3390/cryst9030162
Submission received: 13 February 2019
/
Revised: 12 March 2019
/
Accepted: 17 March 2019
/
Published: 20 March 2019
(This article belongs to the Special Issue Advances in Cholesteric Liquid Crystals)
Abstract
:In this review, we compare the circular dichroism (CD) spectra of liquid-crystalline dispersion (LCD) particles formed in PEG-containing aqueous-salt solutions with the purpose of determining the packing of ds DNA molecules in these particles. Depending on the osmotic pressure of the solution, the phase exclusion of ds DNA molecules at room temperature results in the formation of LCD particles with the cholesteric or the hexagonal packing of molecules. The heating of dispersion particles with the hexagonal packing of the ds DNA molecules results in a new phase transition, accompanied by an appearance of a new optically active phase of ds DNA molecules. Our results are rationalized by way of a concept of orientationally ordered “quasinematic” layers formed by ds DNA molecules, with a parallel alignment in the hexagonal structure. These layers can adopt a twisted configuration with a temperature increase; and as a result of this process, a new, helicoidal structure of dispersion particle is formed (termed as the “re-entrant” cholesteric phase). To prove the cholesteric pattern of ds DNA molecules in this phase, the “liquid-like” state of the dispersion particles was transformed into its “rigid” counterpart.
Keywords:
liquid-crystalline dispersions of DNA; cholesteric and hexagonal packing of DNA; theoretically calculated and experimental circular dichroism spectra; textures of the DNA liquid-crystalline phases; “re-entrant” cholesteric phase of DNA; anthracyclines drugs; chelate complexes; nanobridges; “rigid” particles of DNA1. Introduction:
The packing of double-stranded (ds) DNA molecules in liquid-crystalline (LC) phases is still the focus of many experimental and theoretical works.
Since 1961 it has been known that the dissolution of lyophilized ds DNA samples (of high molecular mass) in aqueous-salt solutions and the adjustment of concentration with the buffer solution is accompanied by the assembling of the adjacent molecules and the formation of condensed phases. Historically, the first of such phases were cholesteric [1] and columnar hexagonal phases [2,3,4,5,6,7,8,9,10].
An alternative method to prepare the ds DNA phases is to increase ds DNA concentration by ultrafiltration through a membrane the pore size of which allows the passage of water and ions but not ds DNA molecules [11,12,13,14].
One can note that most previous work and reviews are dedicated to the problem of the packing of ds DNA molecules in the formed phases [8,15,16,17,18]. The patterns of the ds DNA molecules packing in different phases have been investigated by electron (and cryo-electron) microscopy as well as the analysis of thin layer textures of these phases by polarizing microscopy [19,20,21,22].
The X-ray diffraction analysis was used to measure the ds DNA interhelix spacing in the formed phases. According to these studies, the adjacent ds DNA molecules are ordered in the formed phases at distances of 2.5–5.0 nm, that is they acquire the properties of a crystal and according to the results of the analysis of their thin layer textures the DNA molecules are mobile, that is they retain the properties of a liquid (see, for instance, [23,24,25]).
As a result of all of these studies the term “ds DNA liquid-crystalline phases” is proposed and it is possible to establish the details of the ds DNA packing in the formed LC phases. The cascade of DNA phases established in these works looks as follows: isotropic phase → (blue phase?) → cholesteric phase → columnar phase → crystalline phase [11,16,17,18,25,26].
Bulk ds DNA LC phases represent, by themselves, viscous solutions in which adjacent DNA molecules with phosphate groups neutralized by cations are ordered while keeping their ability to slide relative to each other.
Hence, ds DNA molecules undergo a spontaneous transition from an isotropic to a compact (condensed) state at the increase of their concentration in aqueous-salt solutions [25,27]. The latter state in this transition is, as a rule, characterized by the hexagonal packing [16,21,28,29] enabling a high packing density of adjacent ds DNA molecules (“local” order in the arrangement of the centres of mass of the molecules detected by small-angle X-ray scattering).
The mean interhelix distance between ds DNA molecules in the cholesteric phase varies from about 5.0 mm to 3.2 nm and in the case of the hexagonal phase from 3.2 nm to 2.3 nm [25].
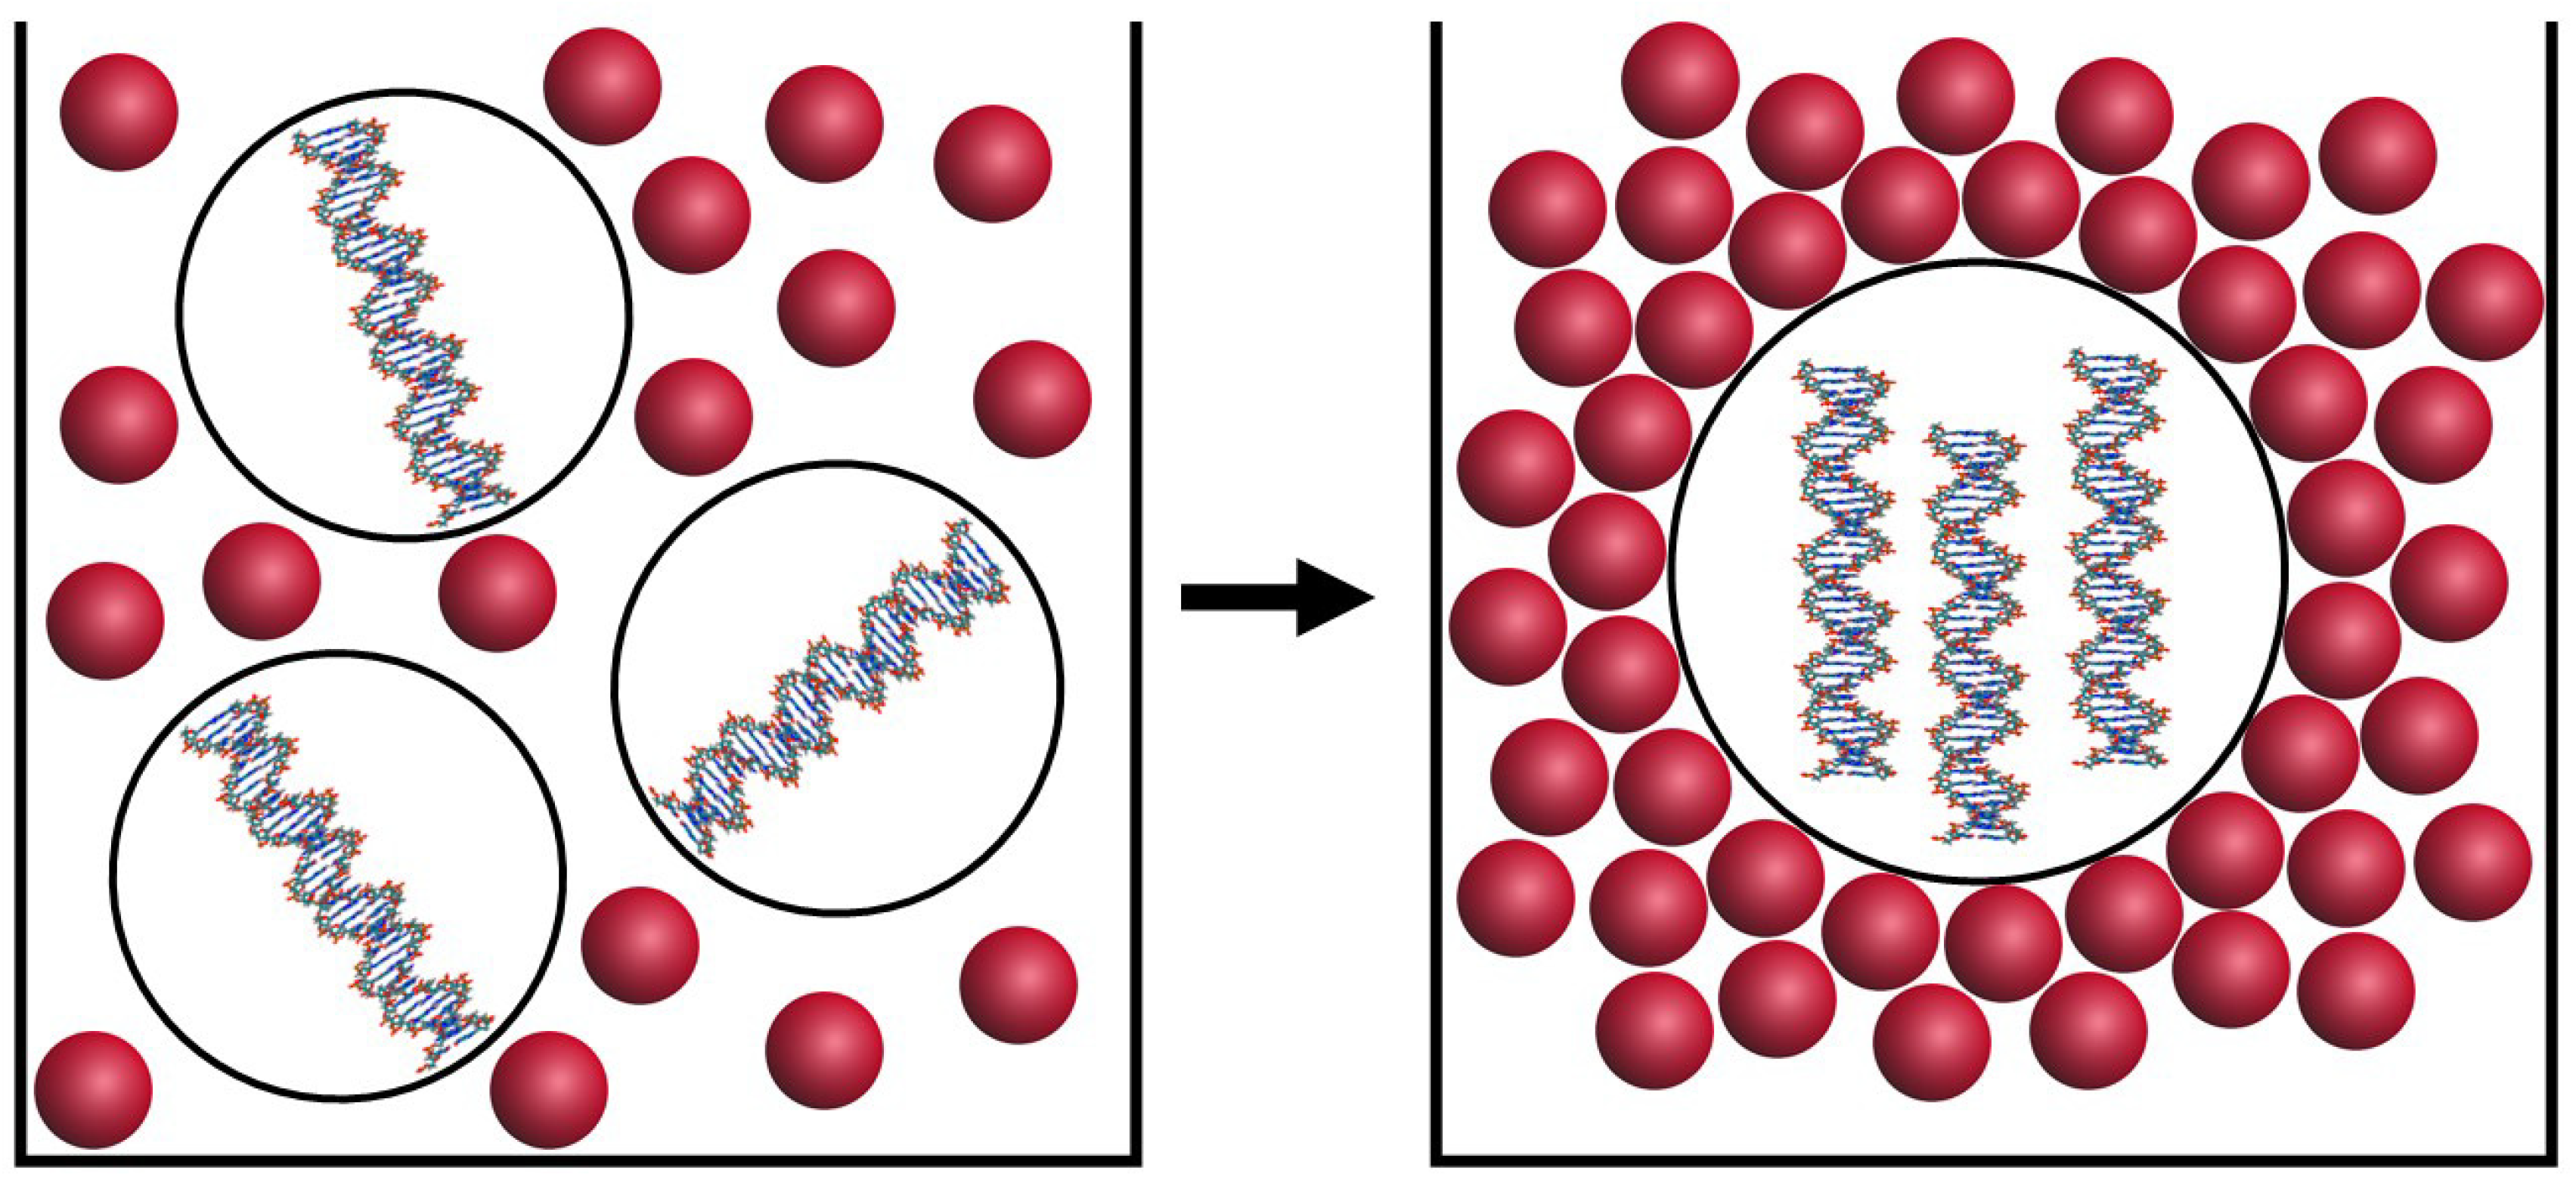
Besides, it has been shown that the mixing of the ds DNA molecules and aqueous-salt solutions of some strongly hydrophilic polymers poly (ethylene glycol), poly (acrylic acid) or poly (vinyl pyrrolidone) leads to the phase exclusion of the DNA (Figure 1). This process has been known since Lerman’s experiments (1971) as “ψ-condensation” (psi is the acronym for polymer-salt-induced) [30,31,32,33]). This method of the phase exclusion, depending on two parameters, that is, ds DNA molecular mass and its concentration, can be realized as the intramolecular or intermolecular assembling of these molecules.
In the first case, the phase exclusion of the extremely high molecular mass ds DNA (molecular mass ≥ 10 × 106 Da) performed at a very low DNA concentration, leads to the formation of toroid-like particles consisting of a single DNA molecule [30,34]. The toroid-like DNA particles have been detected experimentally under various conditions [35,36].
Despite of the fact that there are current theoretical attempts [37,38] to describe this pattern of DNA condensation, a universal theory that explains the formation of DNA toroidal condensates does not exist.
In the second case, the phase exclusion (condensation) of the low molecular mass, rigid, linear ds DNA (molecular mass < 1 × 10⁶ Da) from aqueous-salt poly (ethylene glycol) (PEG) solutions [39,40] or mixtures of PEG with a mineral oil [41] at room temperature is accompanied by the assembling of adjacent molecules and by the formation of DNA dispersions.
The particles of the low molecular mass ds DNA dispersions are “microscopic droplets of concentrated DNA solution”, which cannot be “taken in hand” or “directly seen.” A “liquid-like” pattern of packing of ds DNA molecules in the particles prevents their immobilization on the surface of a membrane filter.
Theoretical estimations of the ds DNA dispersion particle size, based on the data obtained by different methods (low-speed centrifugation, UV-light scattering, dynamic light scattering, etc.), show that for the DNA with a molecular mass of about (0.6–0.8)Ч 106 Da the mean particle diameter is close to 500–1000 nm and one particle contains about 104 DNA molecules [42]. These results have been confirmed by the direct atomic force microscopy data on specially prepared “rigid” (gel-like) ds DNA dispersion particles, immobilized on the surface of nuclear membrane filters [43].
The ds DNA ordering in dispersion particles is interesting from several viewpoints. These particles are of biological interest, because ds DNA dispersions represent the simplest model systems for DNA packing in nature. Indeed, in vivo this state is observed in bacteriophage heads, bacterial nucleoids, dinoflagellate chromosomes and the sperm nuclei of many vertebrates (such as humans, horses, rabbits) [17,44] that are, in fact, microscopic bodies that contain densely packed DNA molecules.
It is worth stressing that the patterns of DNA molecules packing in the dispersion particles can significantly differ from the mode typical of the bulk LC phases [45,46]. Indeed, we should keep in mind that we are dealing with finite size condensed ds DNA particles, not with bulk LC systems. In such confined geometry there is a diverse variety of generally metastable cholesteric-like structures, first of all because the boundary conditions (surface anchoring) are incompatible with the optimal cholesteric twist. Multi stability of possible cholesteric structures is the result of this frustration.
Finally, due to the reactive capacity of the DNA molecules, the dispersion can provide background for biosensors in analytical kits designed for detecting biologically active and chemically important compounds.
Dispersion particles have several characteristic features. First, the polymer (PEG) is not contained in dispersion particles. Second, adjacent DNA molecules are separated by distance of 2.5–5.0 nm, that is, particles have certain crystal-like properties. Third, the concentration of DNA in dispersion particles (or packing density of DNA molecules) is very high and it depends on the osmotic pressure of a PEG-containing solution (or PEG concentration in the solution).
Clearly, that the maximal density of ds DNA molecules in the dispersion particles can be achieved at their hexagonal packing. Hexagonal packing may be schematically represented, as shown in Figure 2. Ordering in a single direction in the case of hexagonal packing is evident from Figure 2. However, this packing does not correspond to the structure of a true crystal, because there are disordered water molecules between the ds DNA molecules. The shown structure does not possess a long-range positional order. The ds DNA molecules have some disorder around their positions; they can slide and bend in respect to each other, as well as rotate around their long axis. This corresponds to the “liquid” character of the ds DNA molecules packing. These facts allow one to describe such particles using the “liquid-crystalline dispersion (LCD) DNA particle” term.
The minimization of the excluded volume of adjacent linear, rigid, ds DNA molecules leads to their parallel, unidirectional (nematic-like) alignment. Regardless of the dense packing, some authors assume that the molecules form so-called “quasinematic” layers (marked by blue arrows in Figure 2) [47,48,49,50]. Double-stranded nucleic acid molecules lie in the plane of the layers, with the layer thickness being close to the intermolecular distance [25].
It should be noted that the packing pattern of the ds DNA molecules in bulk LC phases can be determined by various methods, while additional studies are required to determine, how the DNA molecules are packed in dispersion particles obtained as a result of their phase exclusion from aqueous-salt solutions of polymers (for instance, PEG-containing solutions).
2. Some Peculiarities of the CD Spectra of ds DNA Liquid-Crystalline Dispersions
Very useful and robust global information about the secondary structure of ds DNA molecules and their pattern of packing within spatially distributed, independent, small size dispersion particles can be obtained by application of the circular dichroism method [51,52].
In Reference [52] a phenomenological approach based on the theory [53,54,55,56,57] of electromagnetic wave absorption by large molecular aggregates has been developed. This approach permits the analysis of many peculiarities of the circular dichroism (CD) spectra of ds DNA LCD particles.
Let us briefly comment on this approach. When the size of a molecular aggregate is comparable to light wavelength, its optical properties depend on both the size and the shape of dispersion particles. The properties are determined by long-distance interactions between chromophores that occur in a given structure. To calculate optical characteristics of the structure, a particle can be divided into cells and each cell is considered as a single effective chromophore. These effective chromophores, which are absorbing dipoles, have an ordering that is similar (but not identical, see the note of caution above) to a cholesteric helix with the pitch P.
The approach proceeds from the simplifying assumption that the DNA particles (“molecular aggregates”) are cubic in shape. Thus, a single particle is modelled as a set of quasinematic layers that are the distance d apart and contain absorbing dipoles with the rotation angle Δφ between two adjacent layers. Accordingly, P = 2πd/Δφ. The electric field at the point where a particular chromophore occurs is a superposition of the field of incident light and the electric fields that are generated by induced dipoles of all the other chromophores of the system. As a result, light absorption is a process that involves the whole molecular aggregate and the electric field within a particle is obtained by solving a self-consistent set of linear equations for the field amplitudes at each effective chromophore.
The theoretical studies predict an appearance of an intense band in the CD spectrum located in the region of absorption of the original chromophores that are contained in the molecular aggregate (condensed phase) with the cholesteric pattern of molecules packing [58,59,60,61]. Its value is related mainly to the spatial parameters of particles (their diameter D) and the magnitude of the cholesteric pitch P.
The sign of the helical twist of the spatial structure of the molecular aggregate is determined by the sign of an intense band in the CD spectrum (i.e., a positive band corresponds to a right-handed helical arrangement and a negative band means a left-handed twist of adjacent quasinematic layers of molecules).
The theory’s assumptions are applicable both to the original chromophores of the system and the “external” (additional) chromophores introduced into the structure of the molecular aggregates with a cholesteric packing of molecules. If the molecules of the “external” chromophores are arranged in the structure of the cholesteric molecular aggregate specifically, the theories [58,59,60,61] predict the appearance of two intense bands in different regions of the CD spectrum. Random arrangement of any type of chromophores in the molecular aggregate is unaccompanied by any considerable change in the amplitude of their CD bands.
After Norden paper [62] an intense band in the CD spectrum is expressed as ∆A (in optical units) and reflects a so-called “structural circular dichroism”. In order to stress the difference between the “molecular circular dichroism” and the “structural circular dichroism”, the term “abnormal band” has been used to designate an intense band in the CD spectrum [63].
Hence, according to theoretical considerations, an abnormal band in the CD spectrum in the absorption region of the original chromophores in the content of a cholesteric molecular aggregate can be considered direct evidence of its helically twisted spatial structure.
This approach was applied to the calculation of the CD spectra of ds DNA LCD particles and the dependence upon their structural parameters [52,63,64].
The particles of ds DNA dispersions are considered polycrystalline objects with random distribution and orientation of individual particles, possessing their own absorption in the UV-region of the spectrum due to the presence of the chromophores (nitrogen bases) in the content of DNA molecules. The theory takes into account both the quasinematic structure of the ds DNA molecules packing (Figure 2) and the data shown above, concerning these dispersion particles. In particular, experimental data enable us to treat the particles of dispersions, formed by linear, rigid, ds DNA molecules of low molecular mass (about 106 Da), as spheres of diameter D. For these particles, because of the inherent rigidity of these molecules, the LC ordering is specific at the phase exclusion from PEG-containing solutions.
The distance between ds DNA molecules is determined by a balance between the repulsive intermolecular forces and the compressing osmotic pressure of the PEG solution. Besides, ds DNA molecules possess several levels of chirality (helical secondary structure of ds DNA molecules, helical distribution of counter-ions near the DNA surface as well as asymmetry of C-atoms in sugar residues). The chiral and anisotropic properties of ds DNA molecules favour the helical twisting of adjacent molecules.
Note that if molecules in the content of a dispersion particle rotate independently around their long axes, their chiral interactions can be averaged and smoothed-out [65,66]. The non-zero chiral interactions require rotational biaxial correlations between ds DNA molecules and the behaviour of adjacent ds DNA molecules in dispersion particles should be spatially correlated to make the chiral interaction pronounced [66]. At room temperature, this correlation is possible only in the case of large enough distances between ds DNA molecules in quasinematic layers. In this case, the unidirectional alignment of ds DNA molecules in quasinematic layers of dispersion particles competes with the tendency of these molecules to form a spatially twisted (cholesteric) structure. The spatial correlation is very limited in the case of dense packing of ds DNA molecules.
Hence, we consider low molecular mass ds DNA molecules ordered in particles of dispersions as continuous cholesteric LC phase.
In such cases, the anisotropy of the absorption of nitrogen bases (chromophores) for the linear polarizations of the light must show itself as an intense band in the CD spectrum.
The sign of the band in the CD spectrum in the region of the absorption of nitrogen bases must depend on the orientation of the planes of these components in respect to the long axis of the DNA molecule.
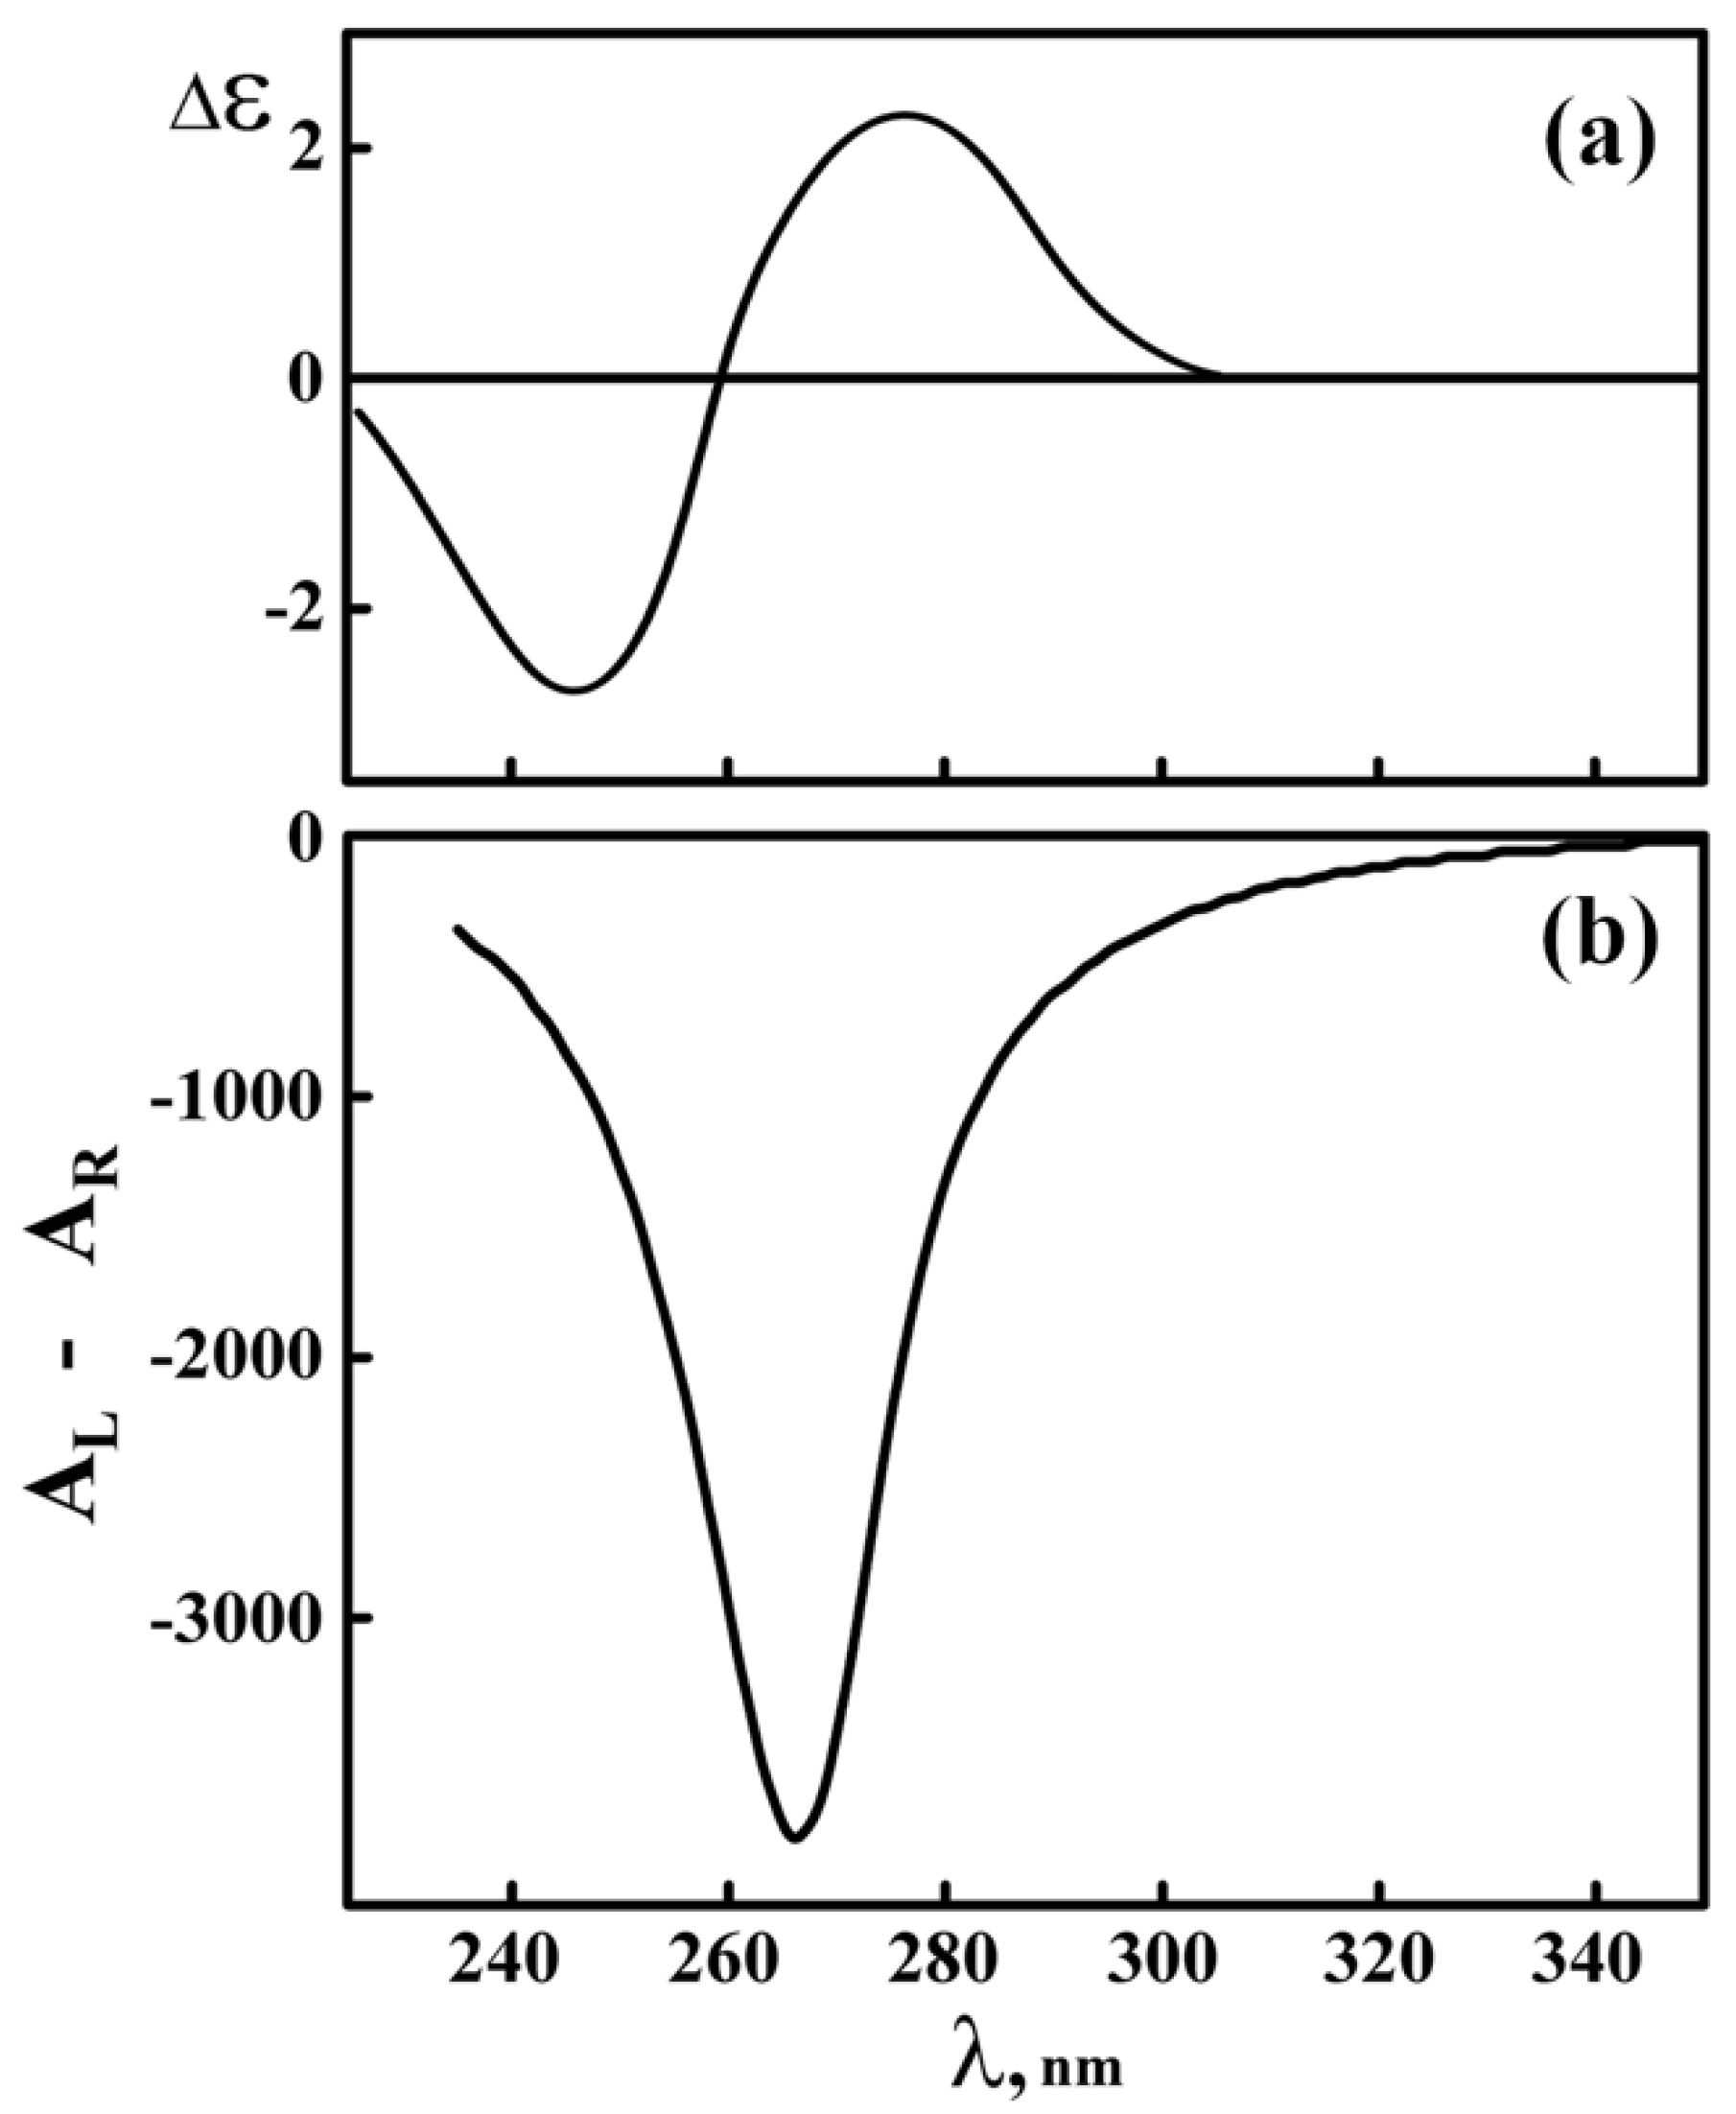
The experimentally measured CD spectrum of the initial, linear, ds DNA molecules in aqueous-salt solution (isotropic state of DNA) is well-known [67] and is shown in Figure 3a.
The ds DNA molecules possess the parameters of a classical B-form; this is confirmed by the results of small-angle X-ray scattering [68,69] and by measured ∆ε value. The “molecular circular dichroism” (expressed as ∆ε value, ∆εmax ~ 2.5 M−1·cm−1), that is, the physical constant, is usually used to describe the peculiarities of isolated nitrogen bases or individual DNA molecules. Its value can be calculated theoretically [67].
The theoretically calculated CD spectrum of a DNA dispersion formed in a PEG-containing solution is given in the Figure 3b. One can see that, in accordance with the theoretical assumption given above, the formation of a dispersion is followed by an appearance of an intense (abnormal) negative band in the CD spectrum located in the region of the nitrogen bases absorption. An appearance of this band in the CD spectrum of the ds DNA LCD means that the purine and pyrimidine nitrogen bases do play the role of “chromophores,” providing information about the spatial packing of DNA molecules in particles of liquid-crystalline dispersions. This conclusion corresponds to the intuitive expectation that the cholesteric packing is a specific property of any molecule having geometrical and optical anisotropy and chirality. Hence, rigid, anisotropic, double-stranded nucleic acid molecules (DNA, RNA, etc.) tend to realize their potential tendency to the cholesteric mode of packing in dispersion particles.
However, the condensation of DNA molecules is not by itself a sufficient condition for the appearance of an intense band in the CD spectrum, since many aggregated forms of DNA (for instance, the aggregates formed by single-stranded DNA molecules) fail to show intense band in their CD spectra.
A comparison of Figure 3b to Figure 3a allows one to conclude that the intense negative band in the CD spectrum reflects a so-called “structural circular dichroism” and must be expressed as ∆A (in optical units).
The theory [52] does predict the following features of the CD spectrum of ds DNA dispersion particles.
(1) The formed particles are “coloured” because DNA molecules contain chromophores (nitrogen bases) that absorb UV irradiation.
In this case, theory predicts an appearance of an abnormal band in the CD spectrum in the region of absorption of the ds DNA nitrogen bases. This is the univocal indication of the macroscopic (cholesteric) twist in the orientation of quasinematic layers formed by ds DNA molecules in dispersion particles. The term “cholesteric liquid-crystalline dispersions” (CLCDs) is used to signify these dispersions [64].
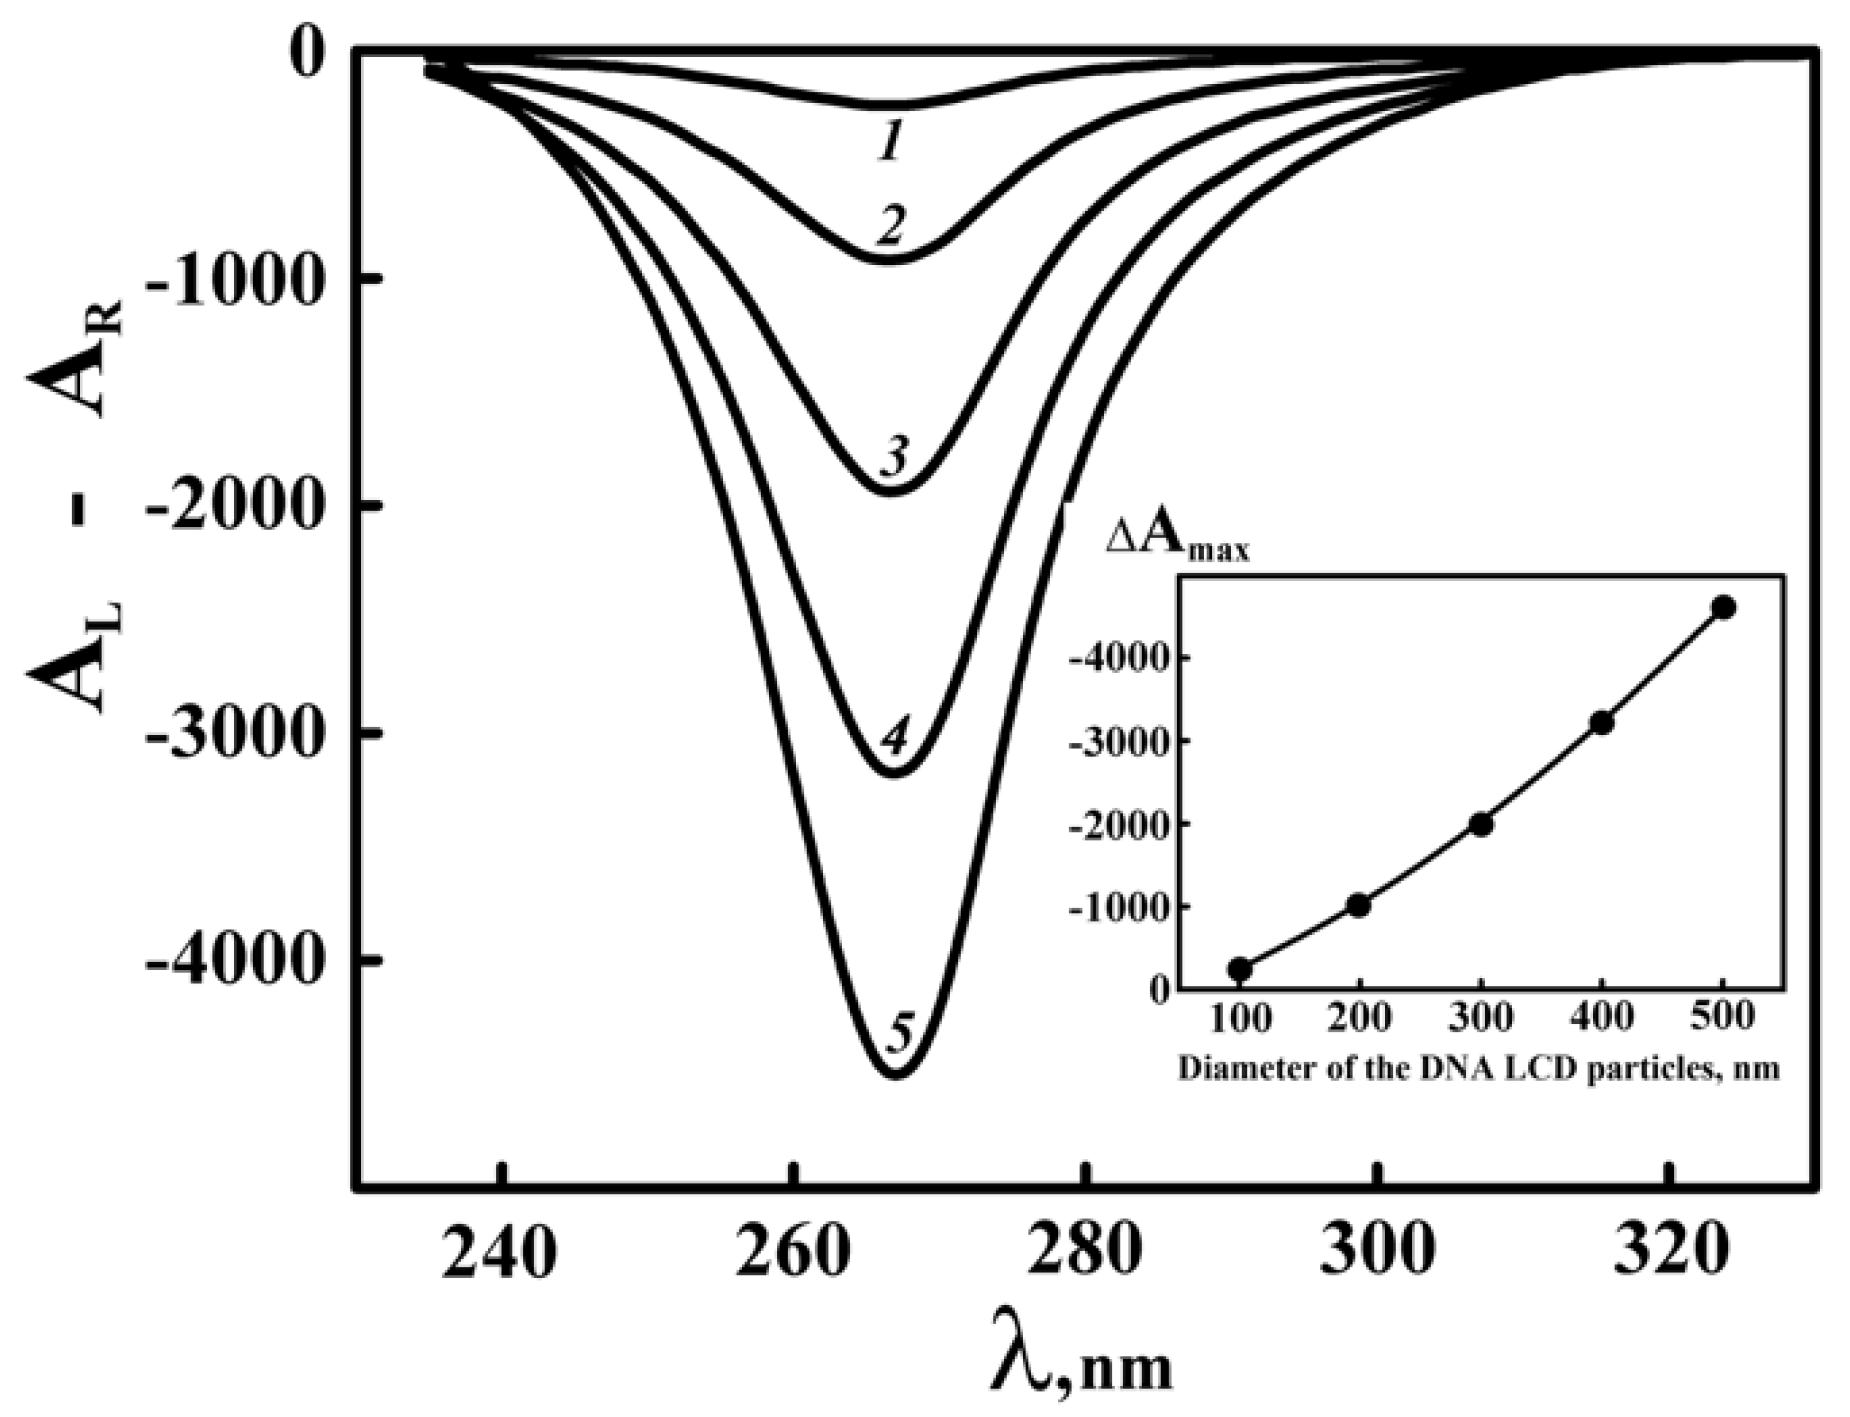
(2) The theoretically calculated amplitude of the abnormal band in the CD spectrum increases as the diameter of the ds DNA CLCD particles grows (Figure 4). However, if the diameter of the DNA CLCD particles reaches the minimal value about of 50 nm, the amplitude of the abnormal band in the CD spectrum decreases so sharply that it no longer can be distinguished from that in the CD spectrum typical of the initial linear DNA. This result indicates that in the case of the formation of CLCDs with a particle diameter of 50 nm their presence cannot be registered by CD spectroscopy.
(3) The smaller the pitch (P)value of the DNA cholesteric structure (i.e., the greater the twist—the angle between the adjacent quasinematic layers of DNA molecules in the helical structure of the cholesteric), the more intense the band in the CD spectrum (Figure 5).
Conversely, the more untwisted the cholesteric structure, the lower the amplitude of the band in the CD spectrum of the CLCD. The calculations have shown that at a P value of about 30 m and constant structural properties of DNA molecules, the amplitude of the abnormal band in the CD spectrum is quite close to the amplitude of the band characteristic of isolated linear DNA molecules.
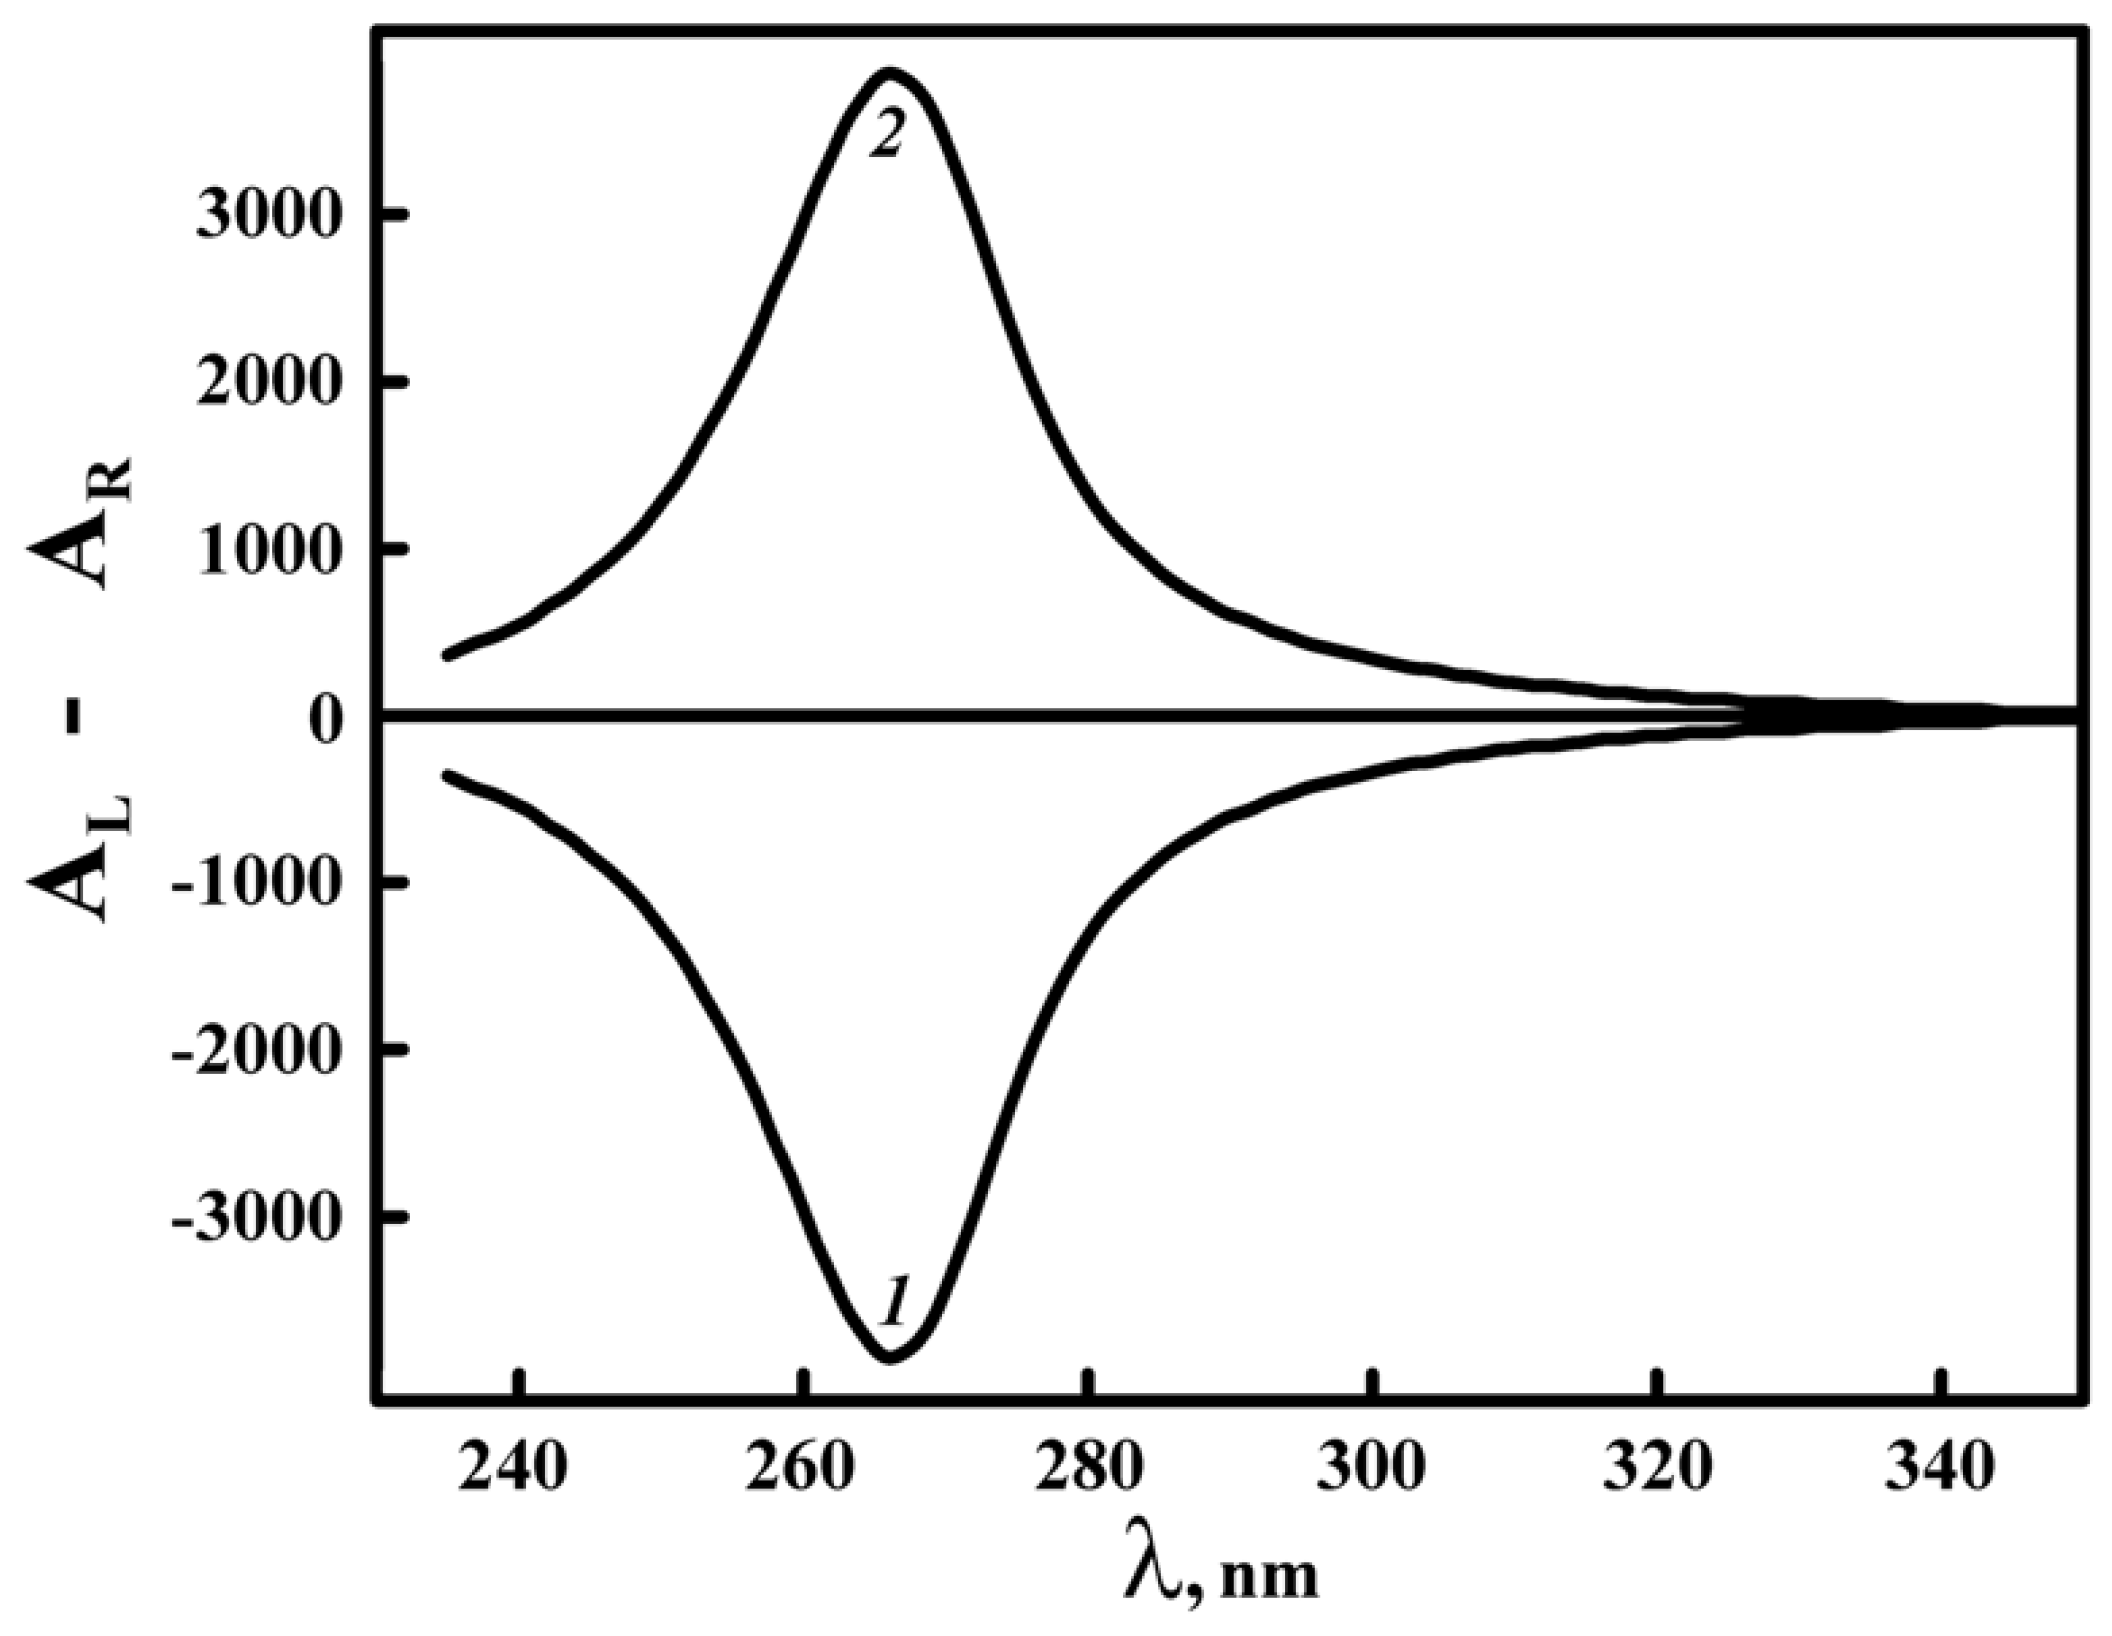
(4) The sign of the abnormal band in the CD spectrum of DNA CLCD depends on the sense of the twist of the spatial cholesteric structure formed by DNA molecules packed in CLCD particles (Figure 6). The negative sign of the abnormal band in the CD spectrum proves the left-handed cholesteric twist of quasinematic layers formed by the right-handed DNA molecules(B-form) in particles of dispersions.
(5) Very small alterations in the base pair sequence or in parameters of the secondary structure of nucleic acid molecules can be sufficient to cause the change from the left-handed to the right-handed twist of the quasinematic layers in particles of CLCD. This means, that there are two types (left-handed and right-handed) of cholesteric structures formed by ds nucleic acids.
(6) The “external” (additional) chromophores with the absorption bands that do not coincide with the nitrogen bases absorption band can be chemically incorporated into the structure of the ds DNA molecules.
Such a situation is possible at the insertion (intercalation) of coloured biologically active compounds, for instance, antibiotic of the anthracycline group—daunomycin (DAU)—between DNA base pairs.
Since ds DNA molecules are ordered in quasinematic layers and “external” chromophores (in our case DAU) are rigidly fixed in respect to the long axis of DNA molecules, the “external” chromophores are automatically included in the composition of quasinematic layer.
For this case, the theory predicts an appearance of two bands located in different regions of the CD spectrum. One of the bands is located in the region of DNA chromophore (nitrogen bases) absorption (л ~ 270 nm), the other one is situated in the region of DAU absorption (л ~ 510 nm) (Figure 7). Both of the bands have negative signs and their amplitudes are much larger in comparison to that typical of the molecular circular dichroism of nitrogen bases and DAU chromophores. The coincidence of the signs of these bands shows that the DAU molecules are located in respect to the DNA molecules long axis the same way as the nitrogen base pairs, that is, the angle between the “external” chromophore molecules plane and the DNA molecules long axis is close to 90°. Such coincidence of the signs of two abnormal bands in different regions of the CD spectrum is only possible if DAU molecules intercalate between DNA nitrogen base pairs.
Figure 7 shows that the amplitude of the negative band in the region of DAU absorption increases as the extent of DAU molecules intercalation between the DNA nitrogen base pairs increases, reaching the equilibrium state.
Hence, the appearance of two independent bands in different regions of the CD spectrum is definite evidence in favour of the cholesteric pattern of packing of the ds DNA molecules in the CLCD particles.
3. Formation of LCDs as a Result of Phase Exclusion of ds DNA Molecules from PEG Solutions and Properties of these Dispersions at Room Temperature
Double-stranded DNA LCDs have been formed as the result of a phase exclusion when aqueous-salt solutions of DNA were mixed with aqueous-salt solutions of a synthetic chemically neutral polymer—poly (ethylene glycol) (PEG) [27,39].
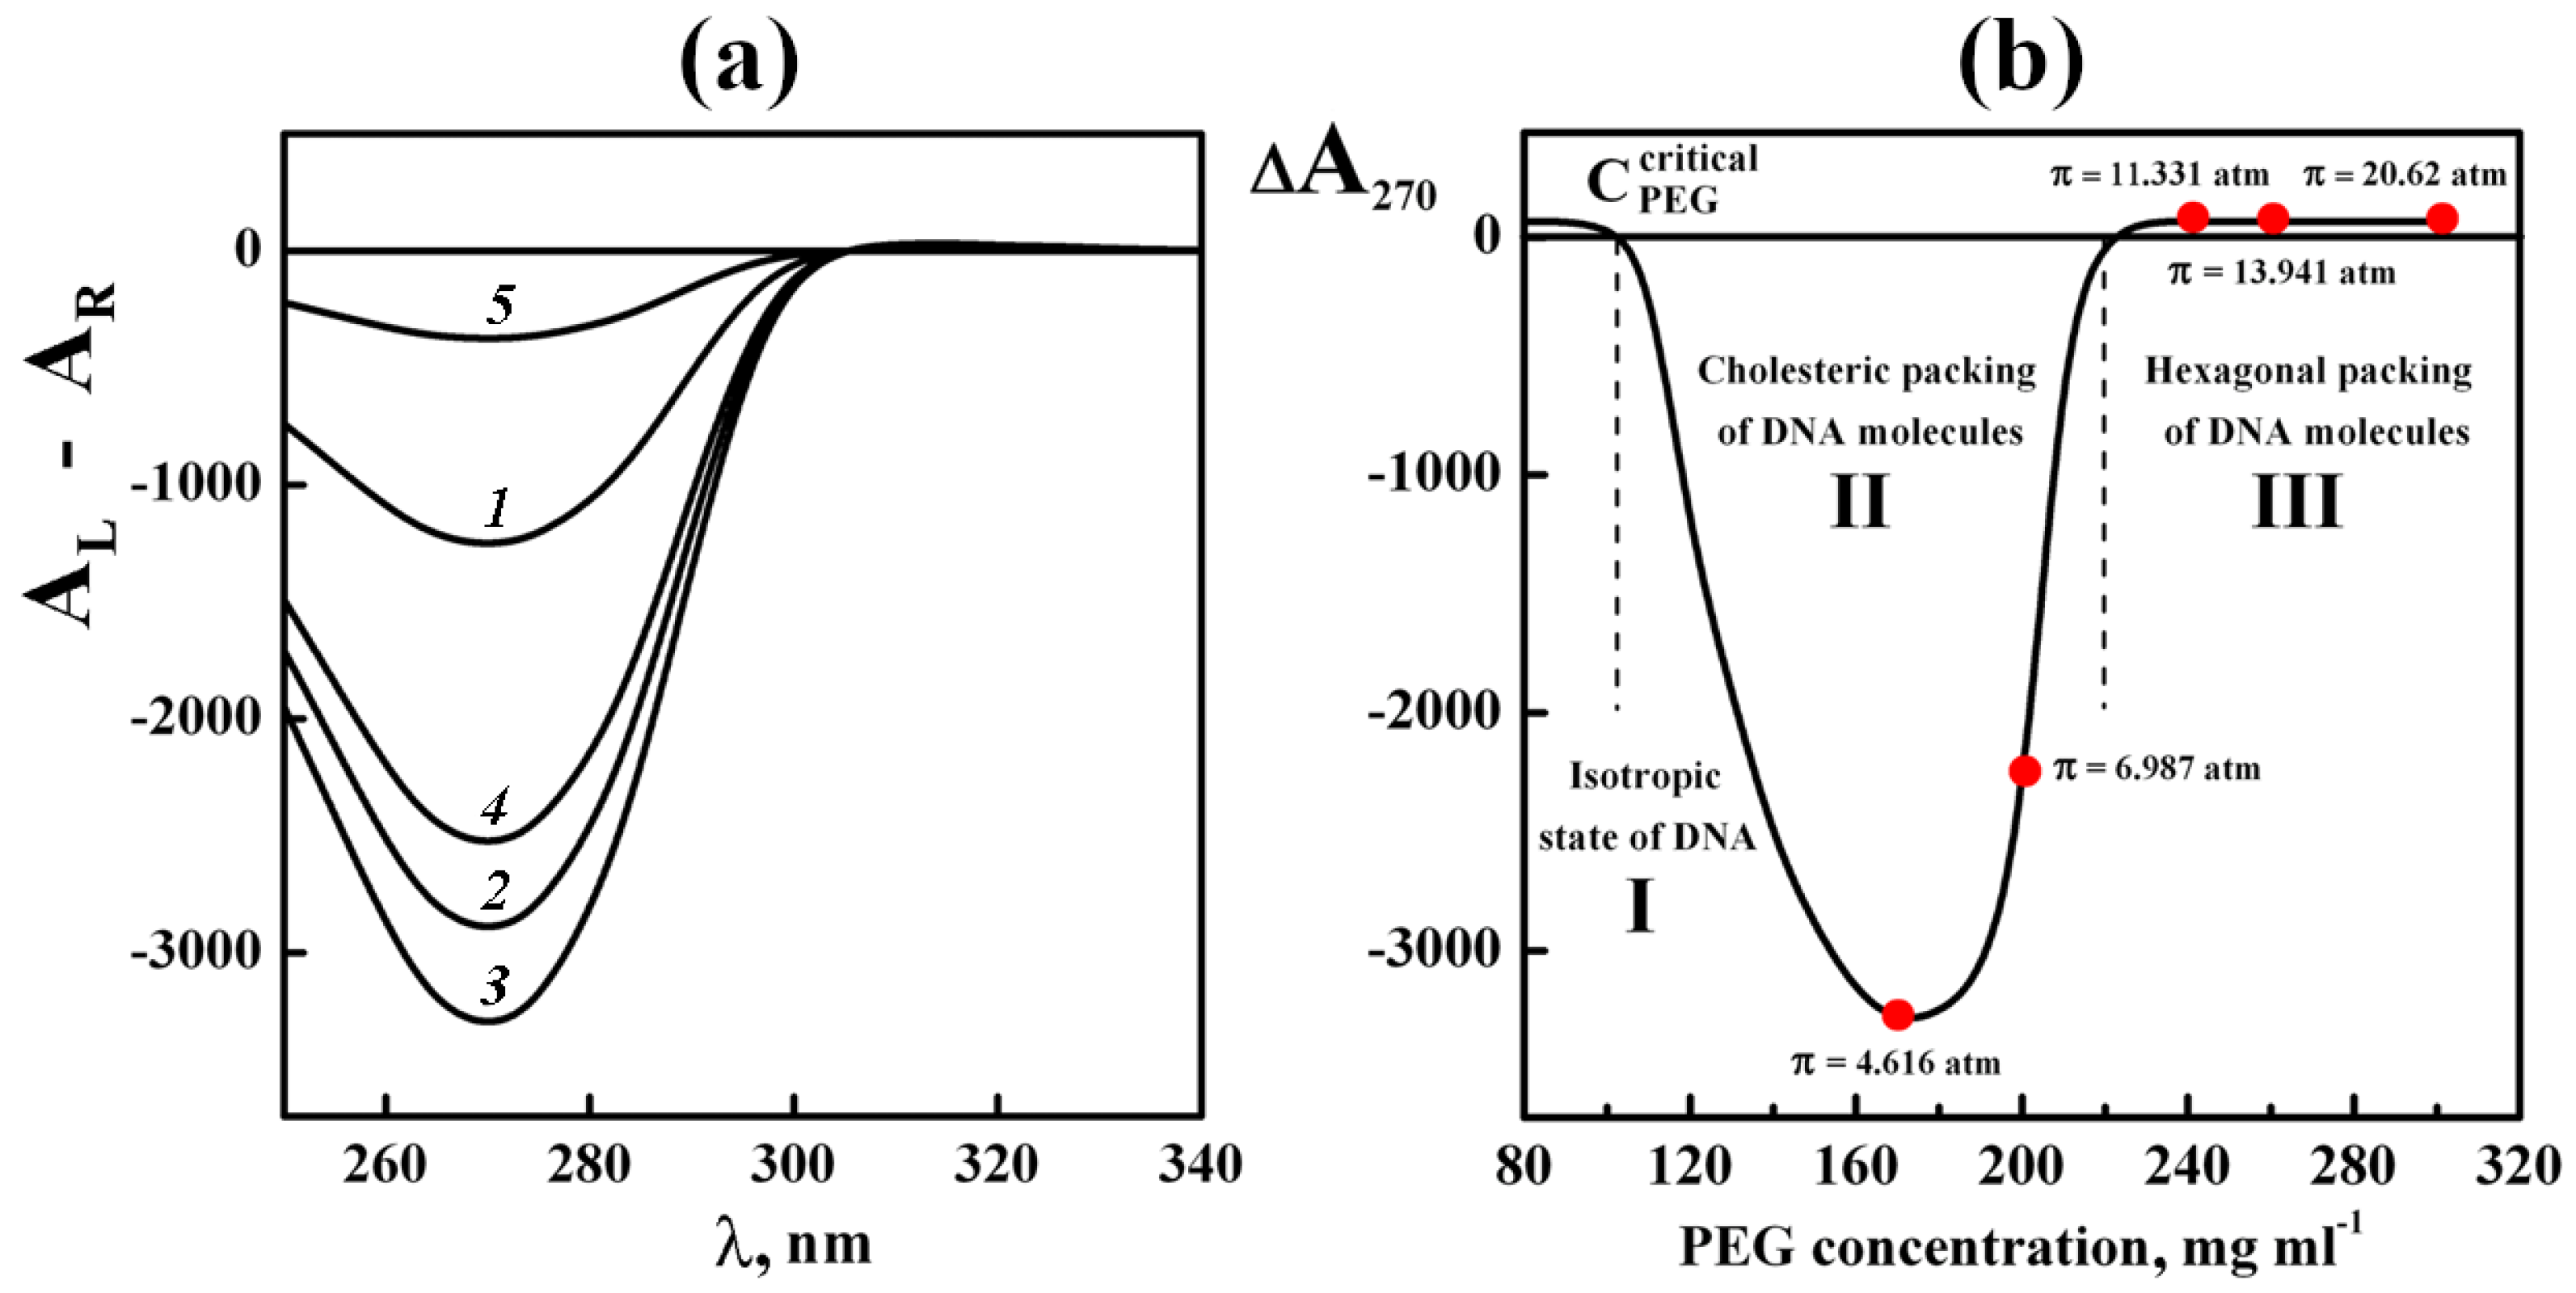
The phase exclusion of linear ds DNA molecules with the “standard” molecular mass from aqueous-salt PEG solutions [70] was accompanied by the formation of dispersions, which possesses an abnormal band in the CD spectrum (Figure 8a, curves 1–4).
The appearance of the abnormal negative band in the CD spectrum located in absorption region of ds DNA nitrogen bases (λ270 nm) is the direct evidence of their introduction (as chomophores) into the helically twisted structure of dispersion particles [58,59].
Taking into account the rigid position of nitrogen bases in respect to the long axes of the ds DNA molecules, one can infer, in turn, the existence of a helically twisted spatial (cholesteric) structure of quasinematic layers in dispersion particles [70]. (Under the conditions used, the single-stranded (or denatured) DNA does not condense and cannot go into the regular composition of dispersion particles [71]).
The decrease in the amplitude of the abnormal band in the CD spectrum (to zero level) with an increase in the PEG concentration (Figure 8b, domain III) is indicative of the untwisting of the spatial helical structure of dispersion particles [72].
It is worth reminding that in the range of osmotic PEG pressures up to ~ 20 atm (Figure 8b), DNA molecules belong to the B-form, as confirmed by the X-ray diffraction data [68,69].
Besides, the small-angle X-ray scattering data of phases that were formed as a result of the low-speed sedimentation of ds DNA dispersion particles under different PEG concentrations demonstrate the dense packing of the ds DNA molecules in dispersions formed in domains II and III.
In domain II (120 mg·mL−1 ≤ CPEG ≤ 220 mg·mL−1) the mean distance (d) between ds DNA molecules varies from 3.8 nm to 2.8 nm; whereas in the domain III (220 mg·mL−1 ≤ CPEG ≤ 320 mg·mL−1), the d value only slightly decreases (from 2.8 to 2.4 nm) [70].
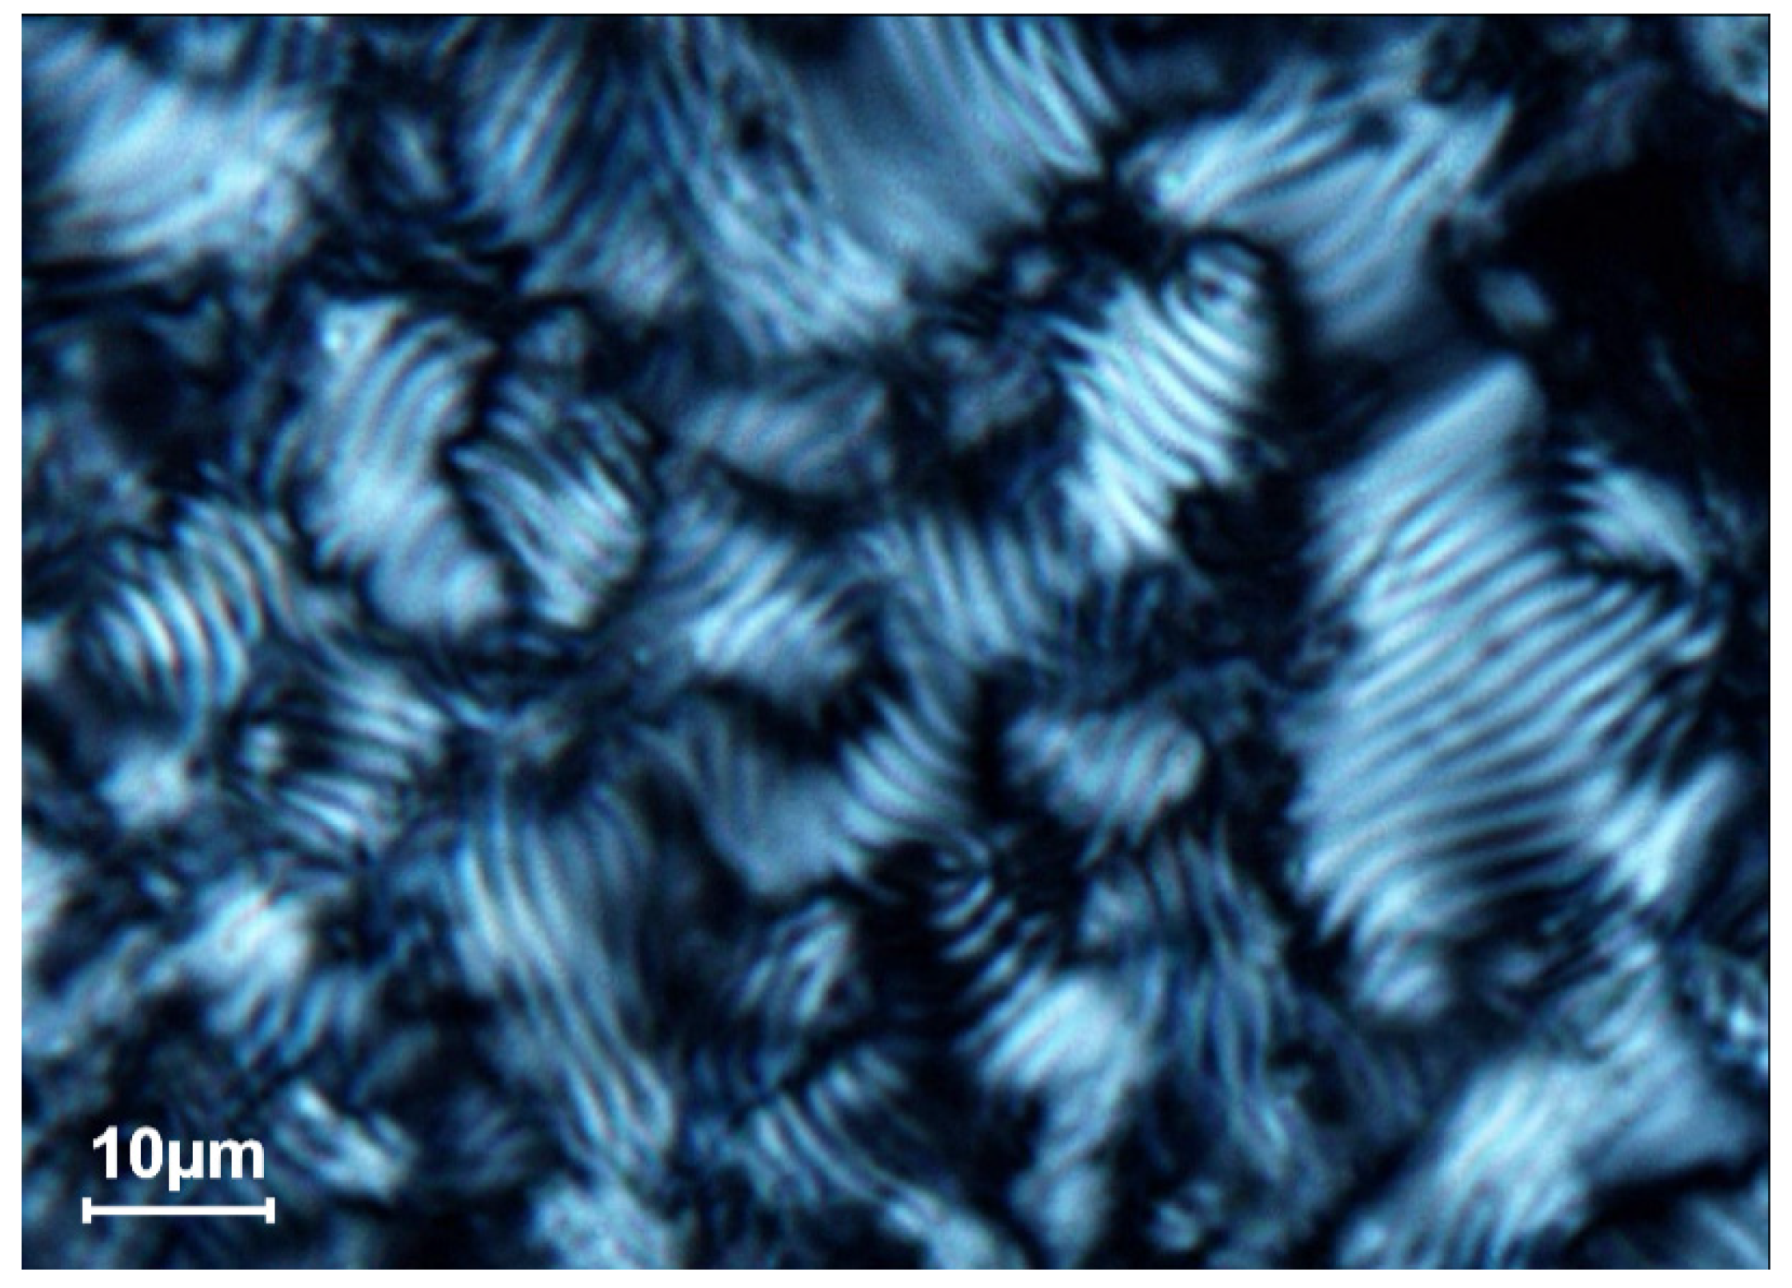
Therefore, in domain II the LCD particles formed by ds DNA molecules at room temperature possess a structure not only with a dense packing of the linear adjacent ds DNA molecules but also with a spatially twisted arrangement of these molecules.
This conclusion is confirmed by the presence of a texture of the phase obtained at the low- speed sedimentation of dispersion particles (Figure 9). It is a “fingerprint” texture, which istypical of ds DNA cholesterics [19,25].
The ds DNA molecules spatial ordering in the LCD particles in domain III is significantly different from that in domain II. At osmotic pressure above 10 atm (PEG concentrations ~ 240–300 mg·mL−1) the packing pattern can be described as unidirectional hexagonal alignment of ds DNA molecules or as a hexagonal packing with the parallel (nematic-like) alignment of orientationally ordered ds DNA quasinematic layers.
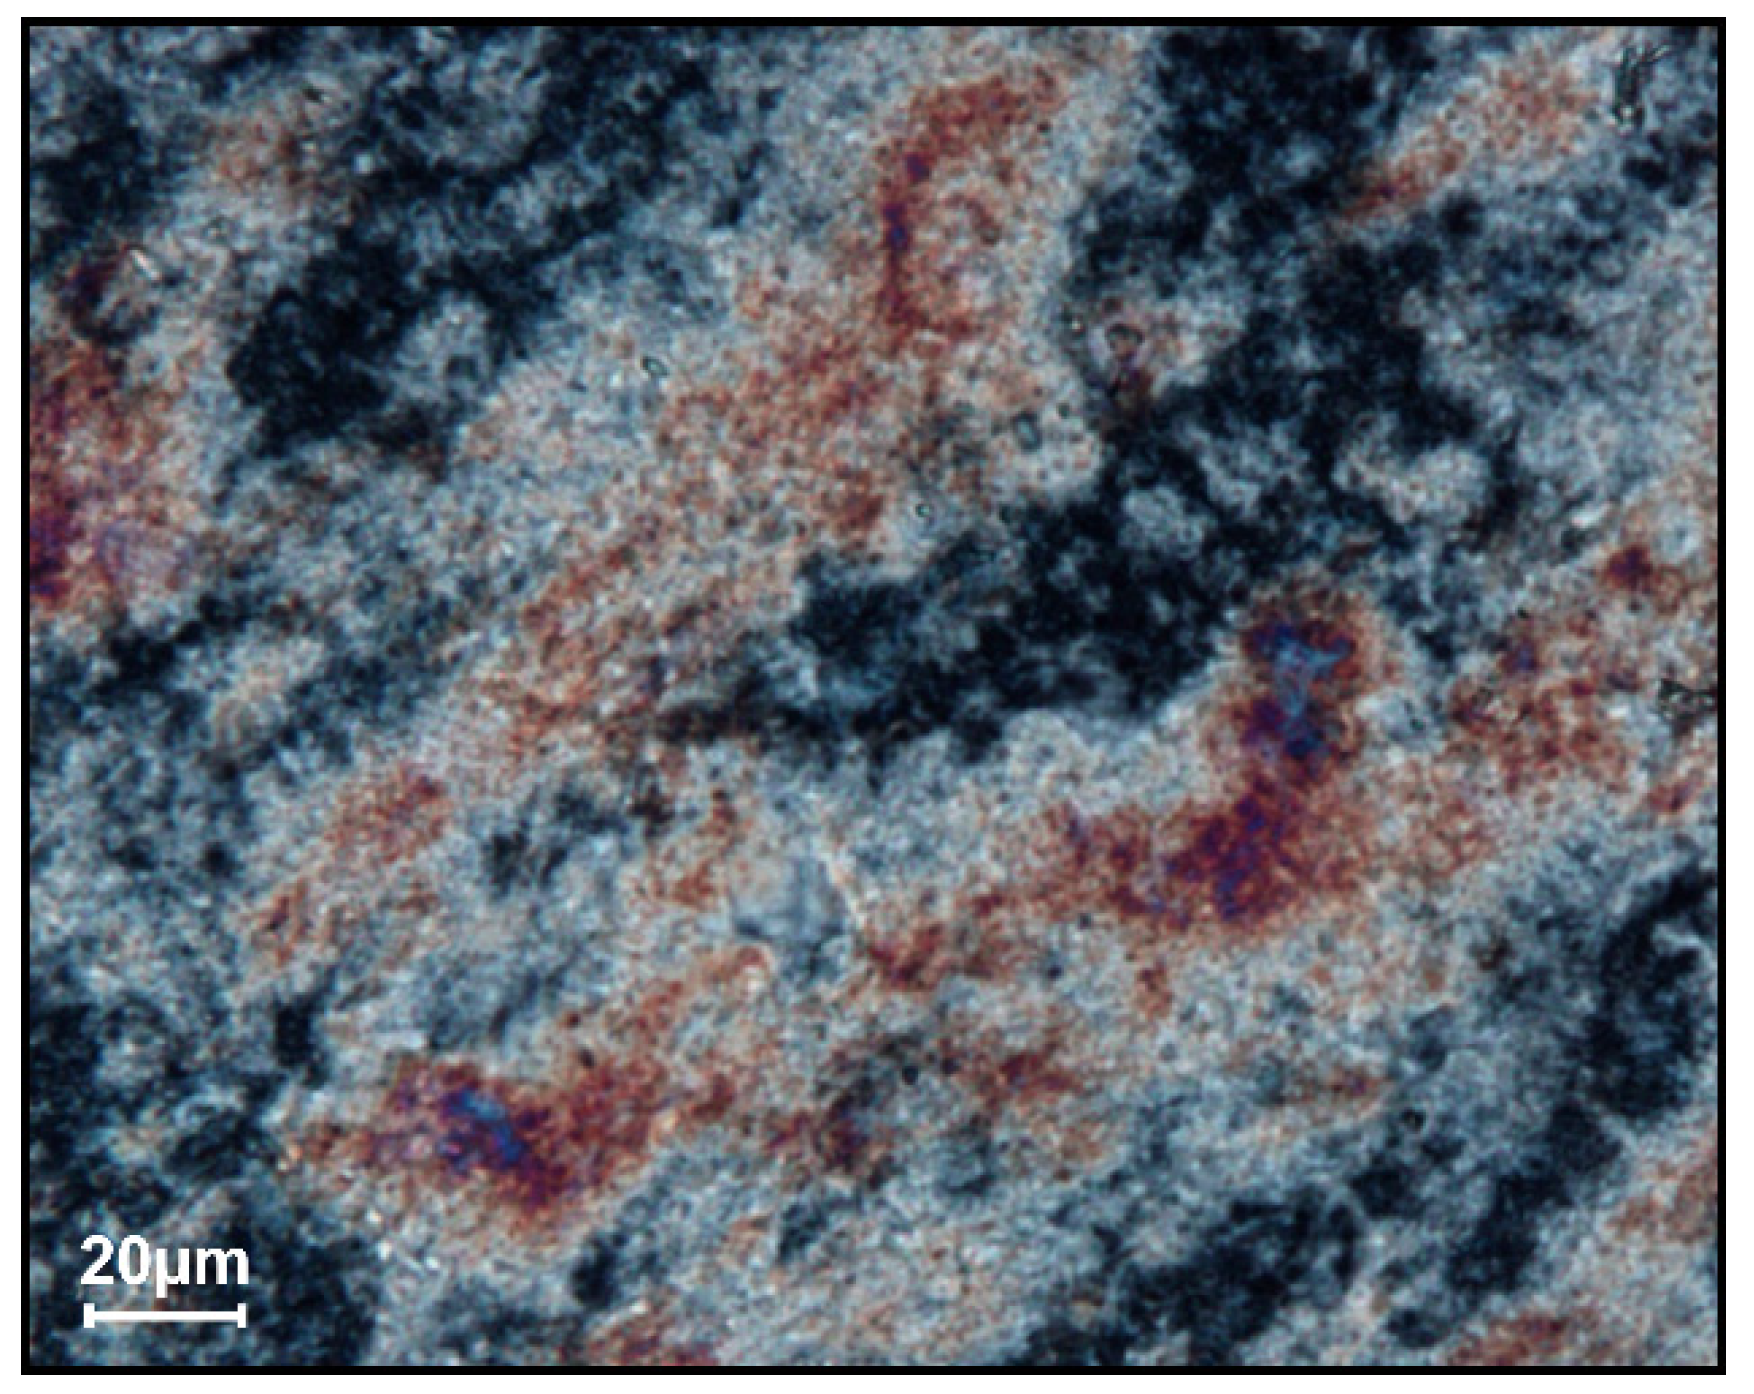
The hexagonal packing of ds DNA molecules does not possess an abnormal optical activity [25]. This statement is confirmed by the optical texture of the phase obtained as the result of the low-speed sedimentation of dispersion particles (Figure 10).
This texture differs from the fingerprint texture of ds DNA cholesteric shown above. Under conditions, which correspond to the hexagonal packing of ds DNA molecules, the main part of this texture only has the attributes of an anisotropic object, where deep red and blue colors are present but does not contain any specific peculiarities.
Hence, Figure 8 shows that the phase exclusion of ds DNA molecules at room temperature leads to the following sequence of phase transitions: isotropic (I) → cholesteric (II) → hexagonal state (III) governed by an increase of the PEG concentration in a solution (PEG osmotic pressure). Two types of the condensed states (i.e., cholesteric and hexagonal) differ by the packing pattern of ds DNA molecules.
4. The Effect of Temperature on the Optical Properties of ds DNA LCDs
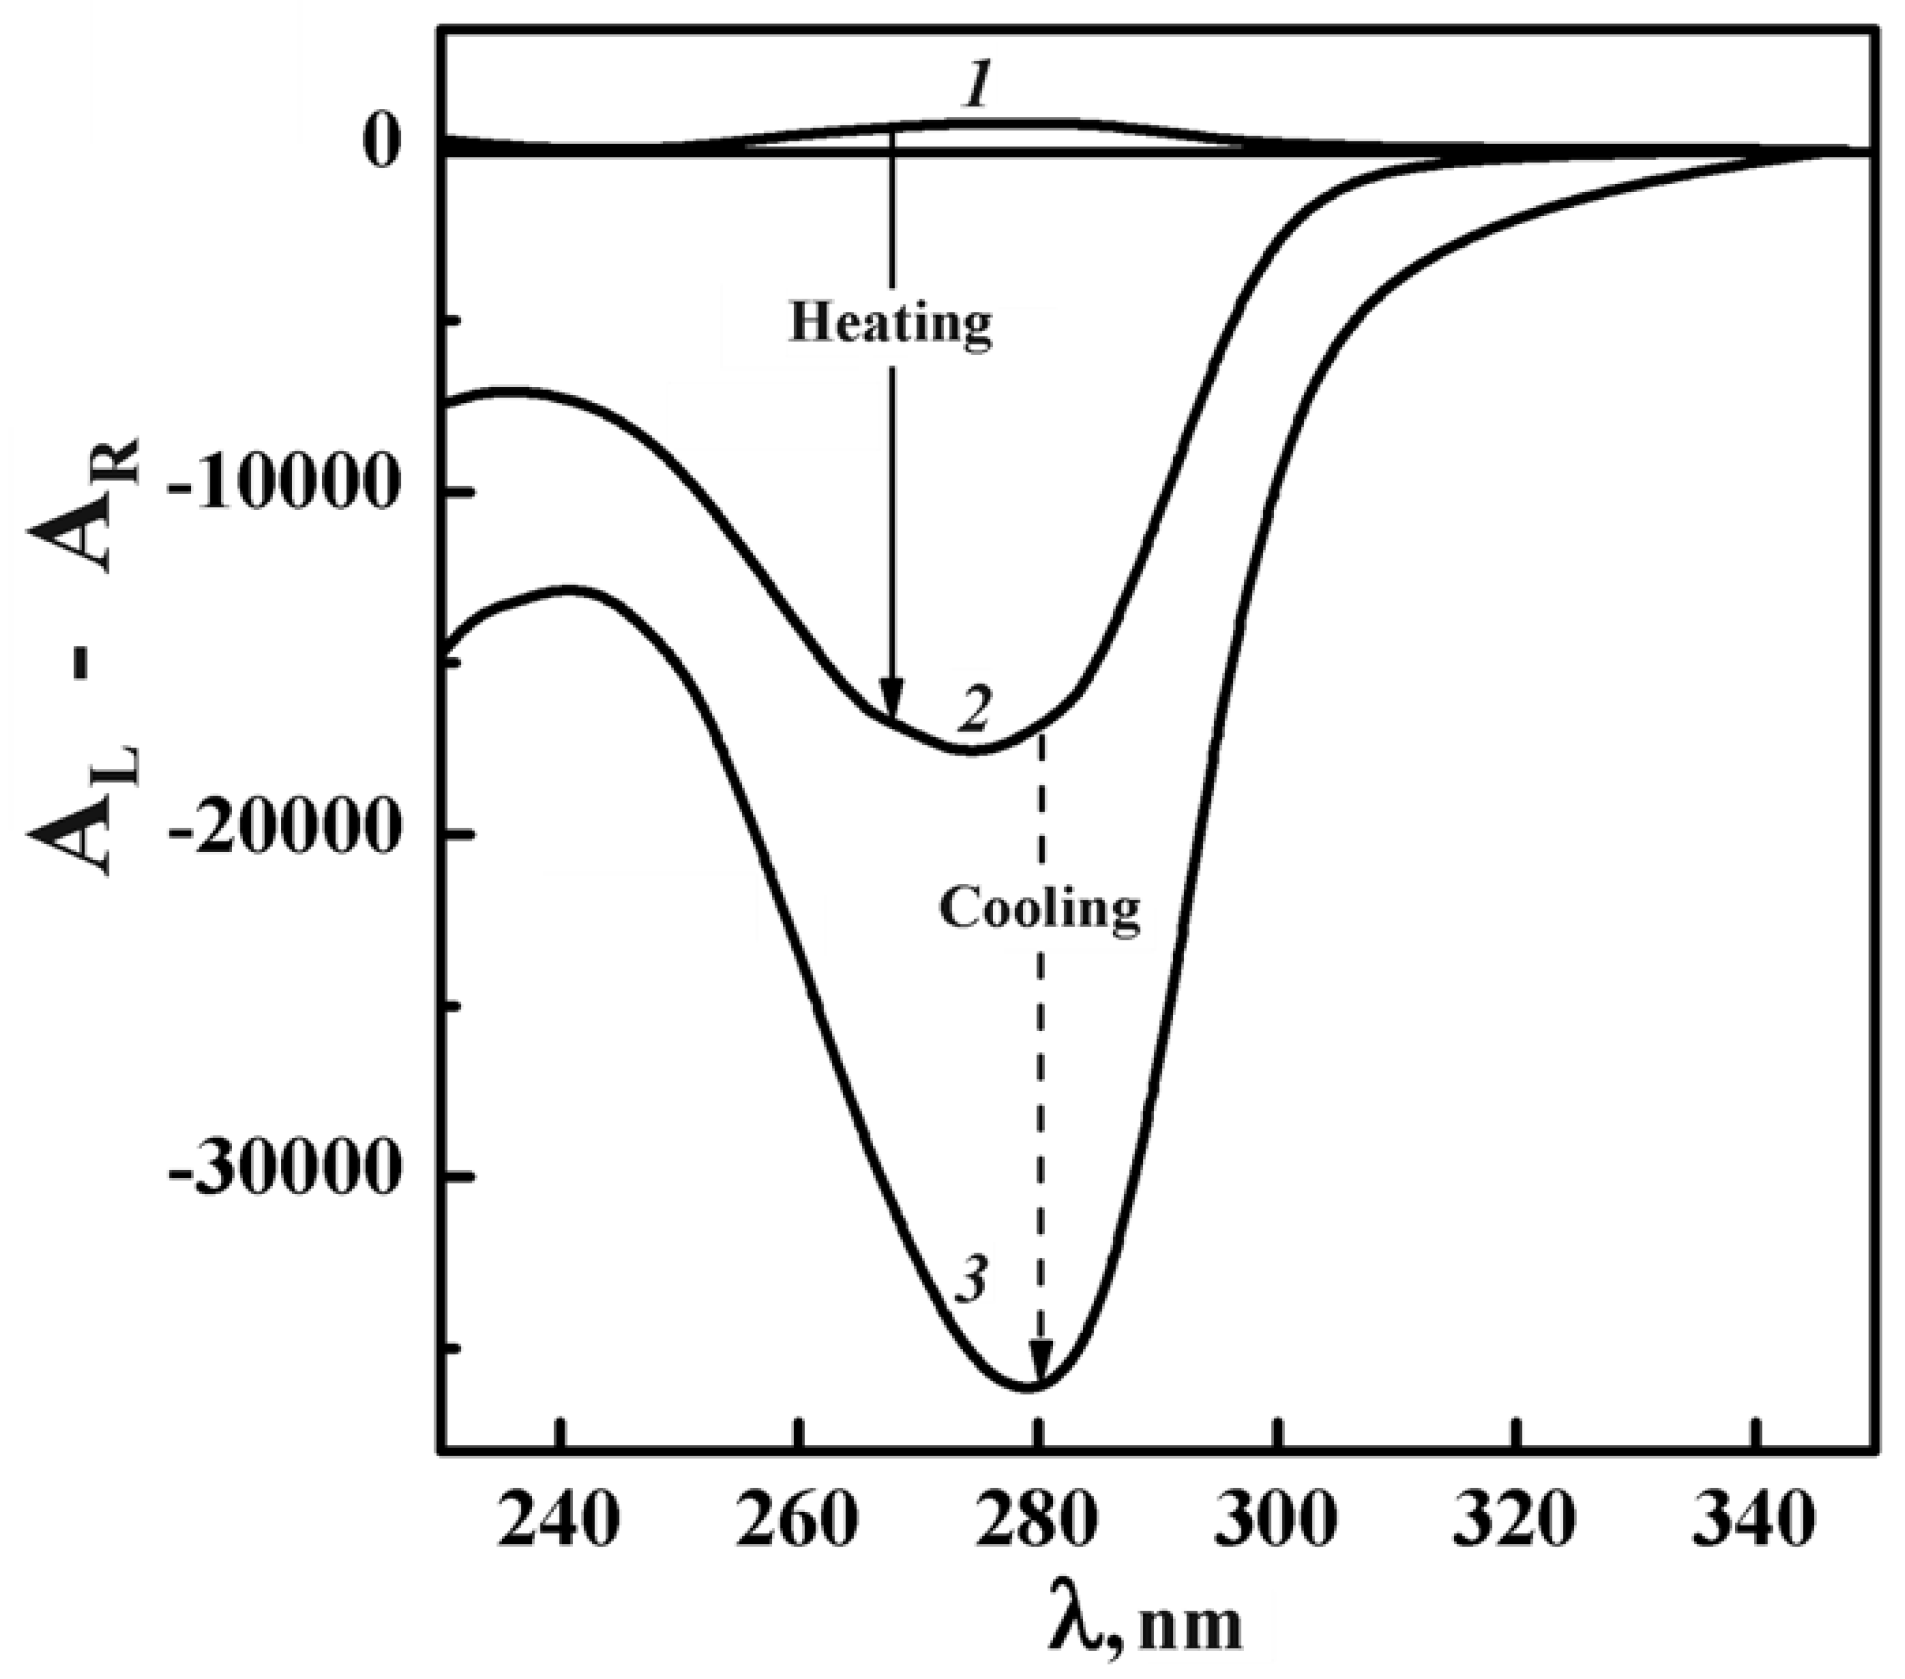
Figure 11 shows, as an example, the change in the CD spectrum of ds DNA CLCD formed in domain II (curve 1, CPEG = 170 mg·mL−1, π = 4.62 atm) upon heating and subsequent cooling (curves 1, 2 and 3, respectively).
The well-known decrease in the amplitude of the abnormal CD band upon heating (compare curves 1 and 2 in Figure 11) is referred to as the “CD melting” [73]. It is the evidence of the untwisting of spatial helical structure of dispersion particles. The dispersion cooling is accompanied not only by the recovery of the abnormal band in the CD spectrum but also by an increase in its amplitude (curve 3). This effect reflects the “quality” of ds DNA molecules packing in dispersion particles realized in the process of phase exclusion. It depends, mainly, on the peculiarities of ds DNA molecules (secondary structure, molecular mass, etc.) [74] and it is quiteconsistent with the concept of the improvement of the cholesteric packing of dispersion particle structure as a result of the thermal “training” [75,76] of ds DNA CLCDs.
The aforementioned change in the CD spectrum upon heating and cooling is characteristic of all dispersions formed in domain II of PEG osmotic pressure.
The change in the CD spectra of ds DNA LCD formed in domain III (π = 12.43 atm, CPEG = 250 mg·mL−1) upon heating and cooling is shown, as an example, in Figure 12.
(One can see that in the initial CD spectrum of this LCD there is the band (curve 1) of unknown origin. Usually, a very low amplitude of this band is accepted as a zero value (see also Figure 8, domain III).
The increase in temperature is accompanied by an unusual effect: an intense negative band arises in the CD spectrum (Figure 12, curve 2) of DNA dispersion particles that did not possess such band at room temperature (curve 1).
An appearance of the intense band in domain III occurs at a certain “critical” temperature, which depends on the PEG osmotic pressure [77]. The higher the PEG osmotic pressure the larger the “critical” temperature value.
An intense band in the CD spectrum (Figure 12, curve 2) in the absorption region of ds DNA is related [27] to the spatial twist of nitrogen based in quasinematic layers of dispersion particles, or, more exactly, to the formation of a new phase of ds DNA molecules, which possess an abnormal optical activity. It permits us to suggest that the original hexagonal packing of ds DNA molecules in the dispersion particles changes upon heating the LCDs (obtained in domain III).
It is necessary to add that the optical texture of this new, optically active phase does not possess the fingerprint texture typical of classical cholesterics.
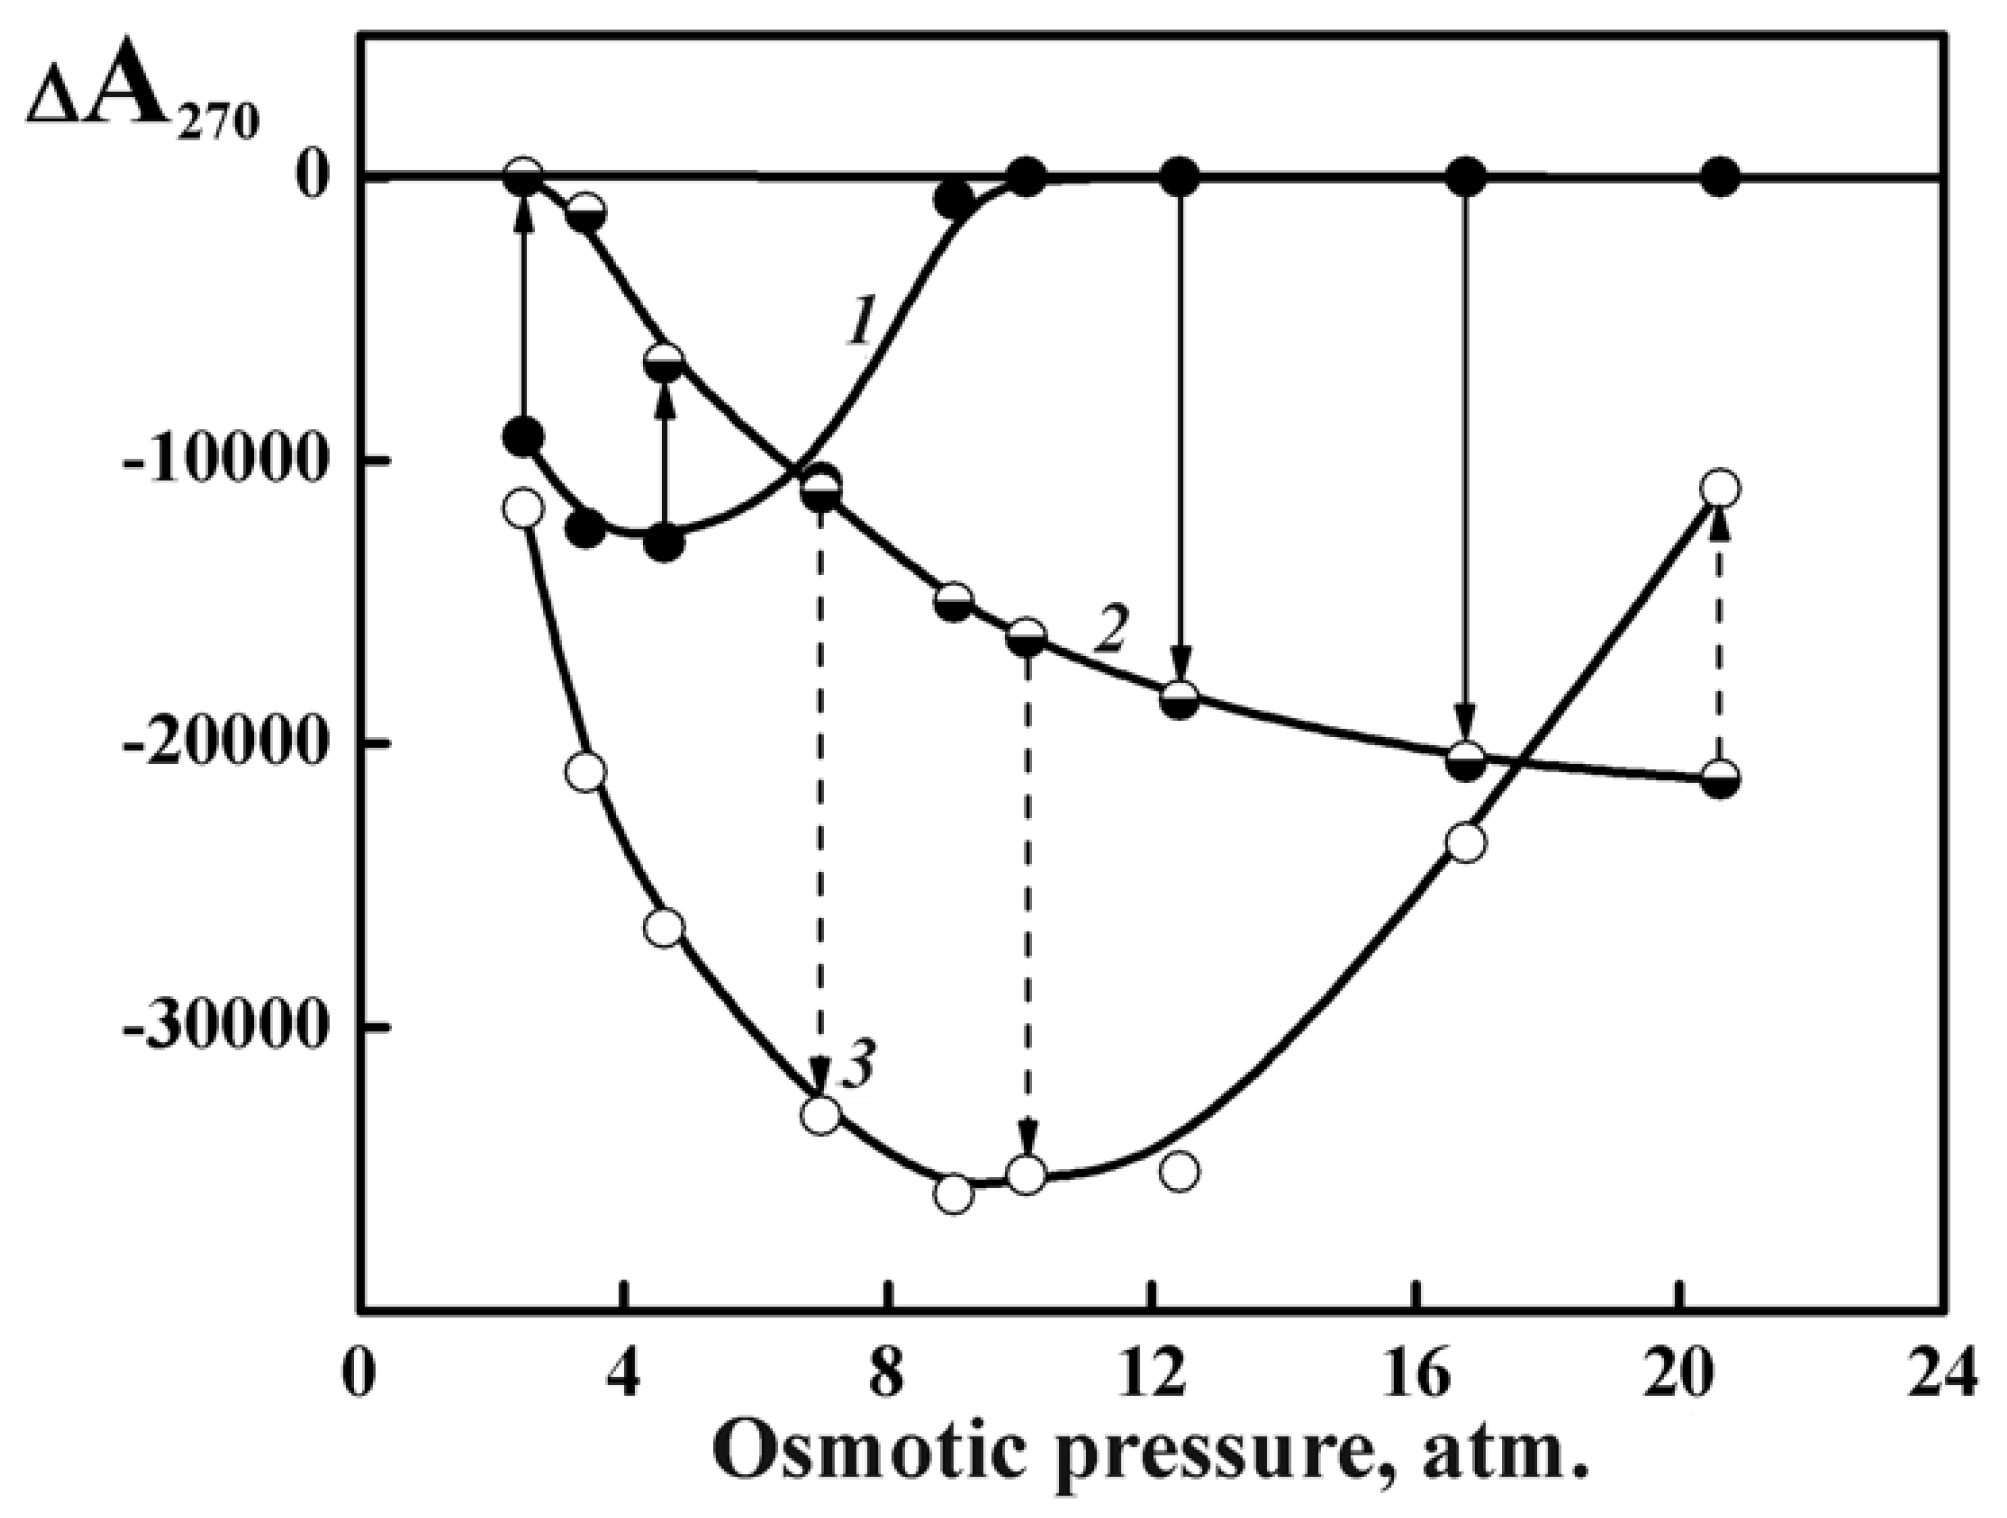
The curves characterizing the change in the abnormal bands for all ds DNA LCDs formed in domains II and III under their heating (curve 2) and cooling (curve 3) are shown in Figure 13.
One can see that the increase and the subsequent decrease in the temperature is accompanied by different optical effects, depending on the PEG osmotic pressure. For instance, at PEG osmotic pressures below 10 atm, the abnormal band increases (Figure 13, curve 3) upon cooling, whereas at PEG osmotic pressures exceeding 10 atm one observes a tendency to partial recovery of the initial abnormal optical activity of LCD. These optical effects depend on molecular mass of ds DNA molecules and on their nitrogen bases content [77].
Hence, the dense hexagonal packing of ds DNA molecules in dispersion particles obtained at CPEG more than 220 mg·mL−1 (osmotic pressure more than 10 atm) is transformed to a new optically active phase (structure) upon heating.
To proceed further we have to know, whether an optically active phase corresponds to the cholesteric structure. The matter is that this new state we found is formed at small distances between the ds DNA molecules in dispersion particles (see above) and the corresponding textures are not similar to classical cholesteric fingerprint textures.
In the next sections we present arguments supporting the cholesteric-like structure of this new optically active phase.
5. The Formation of “Rigid” Particles of the Cholesteric ds DNA Dispersions
To prove the spatially twisted (cholesteric) structure of the new optically active phase we have used well-elaborated approach [78] based on the transformation of the “liquid-like” state of ds DNA particles to the “rigid” (gel-like) state.
The main idea of this approach was formulated in the following way: “The adjacent ds DNA molecules with phosphate groups neutralized by sodium cations are resided in quasinematic layers of a single СLCD particle in the “dissolved” state and there is free space between them. The molecules of chemical substances (“guests”) entering the free space due to diffusion can react with the chemical groups available of the DNA surface or even form chemical cross-links between DNA molecules in quasinematic layers of a СLCD particle. Such cross-linking can result in the formation of an “integrated” structure involving all the DNA molecules ordered in quasinematic layers of a СLCD particle. The integrated structure having a very high molecular mass will be incompatible with a PEG-containing solution. This means that the cross-linking of adjacent DNA molecules will lead to the transition of a single СLCD particle from the “liquid-like” to the “rigid” (gel-like) state.”
The “rigid” ds DNA particles can be immobilized on the surface of a nuclear membrane filter and their properties can be studied by atomic force (AFM) or by electron microscopy.
This approach is similar, in fact, to gelation due to the formation of unordered, artificial chemical cross-links between adjacent molecules of polymers. However, in our case, gelation should be realized in such a way that the fixed distance between adjacent ds DNA molecules in quasinematic layers of a single CLCD particle does not change and the spatial helical structure of DNA CLCD particle is preserved. Therefore, we are dealing with a rather specific gelation process inside a single particle with nanometre-scale parameters.
As a control to the considered approach, we formed “rigid” particles by means of the cross-linking of adjacent ds DNA molecules fixed in quasinematic layers of CLCD particles. To create the cross-links (nanobridges) between ds DNA molecules we used anthracycline antibiotics.
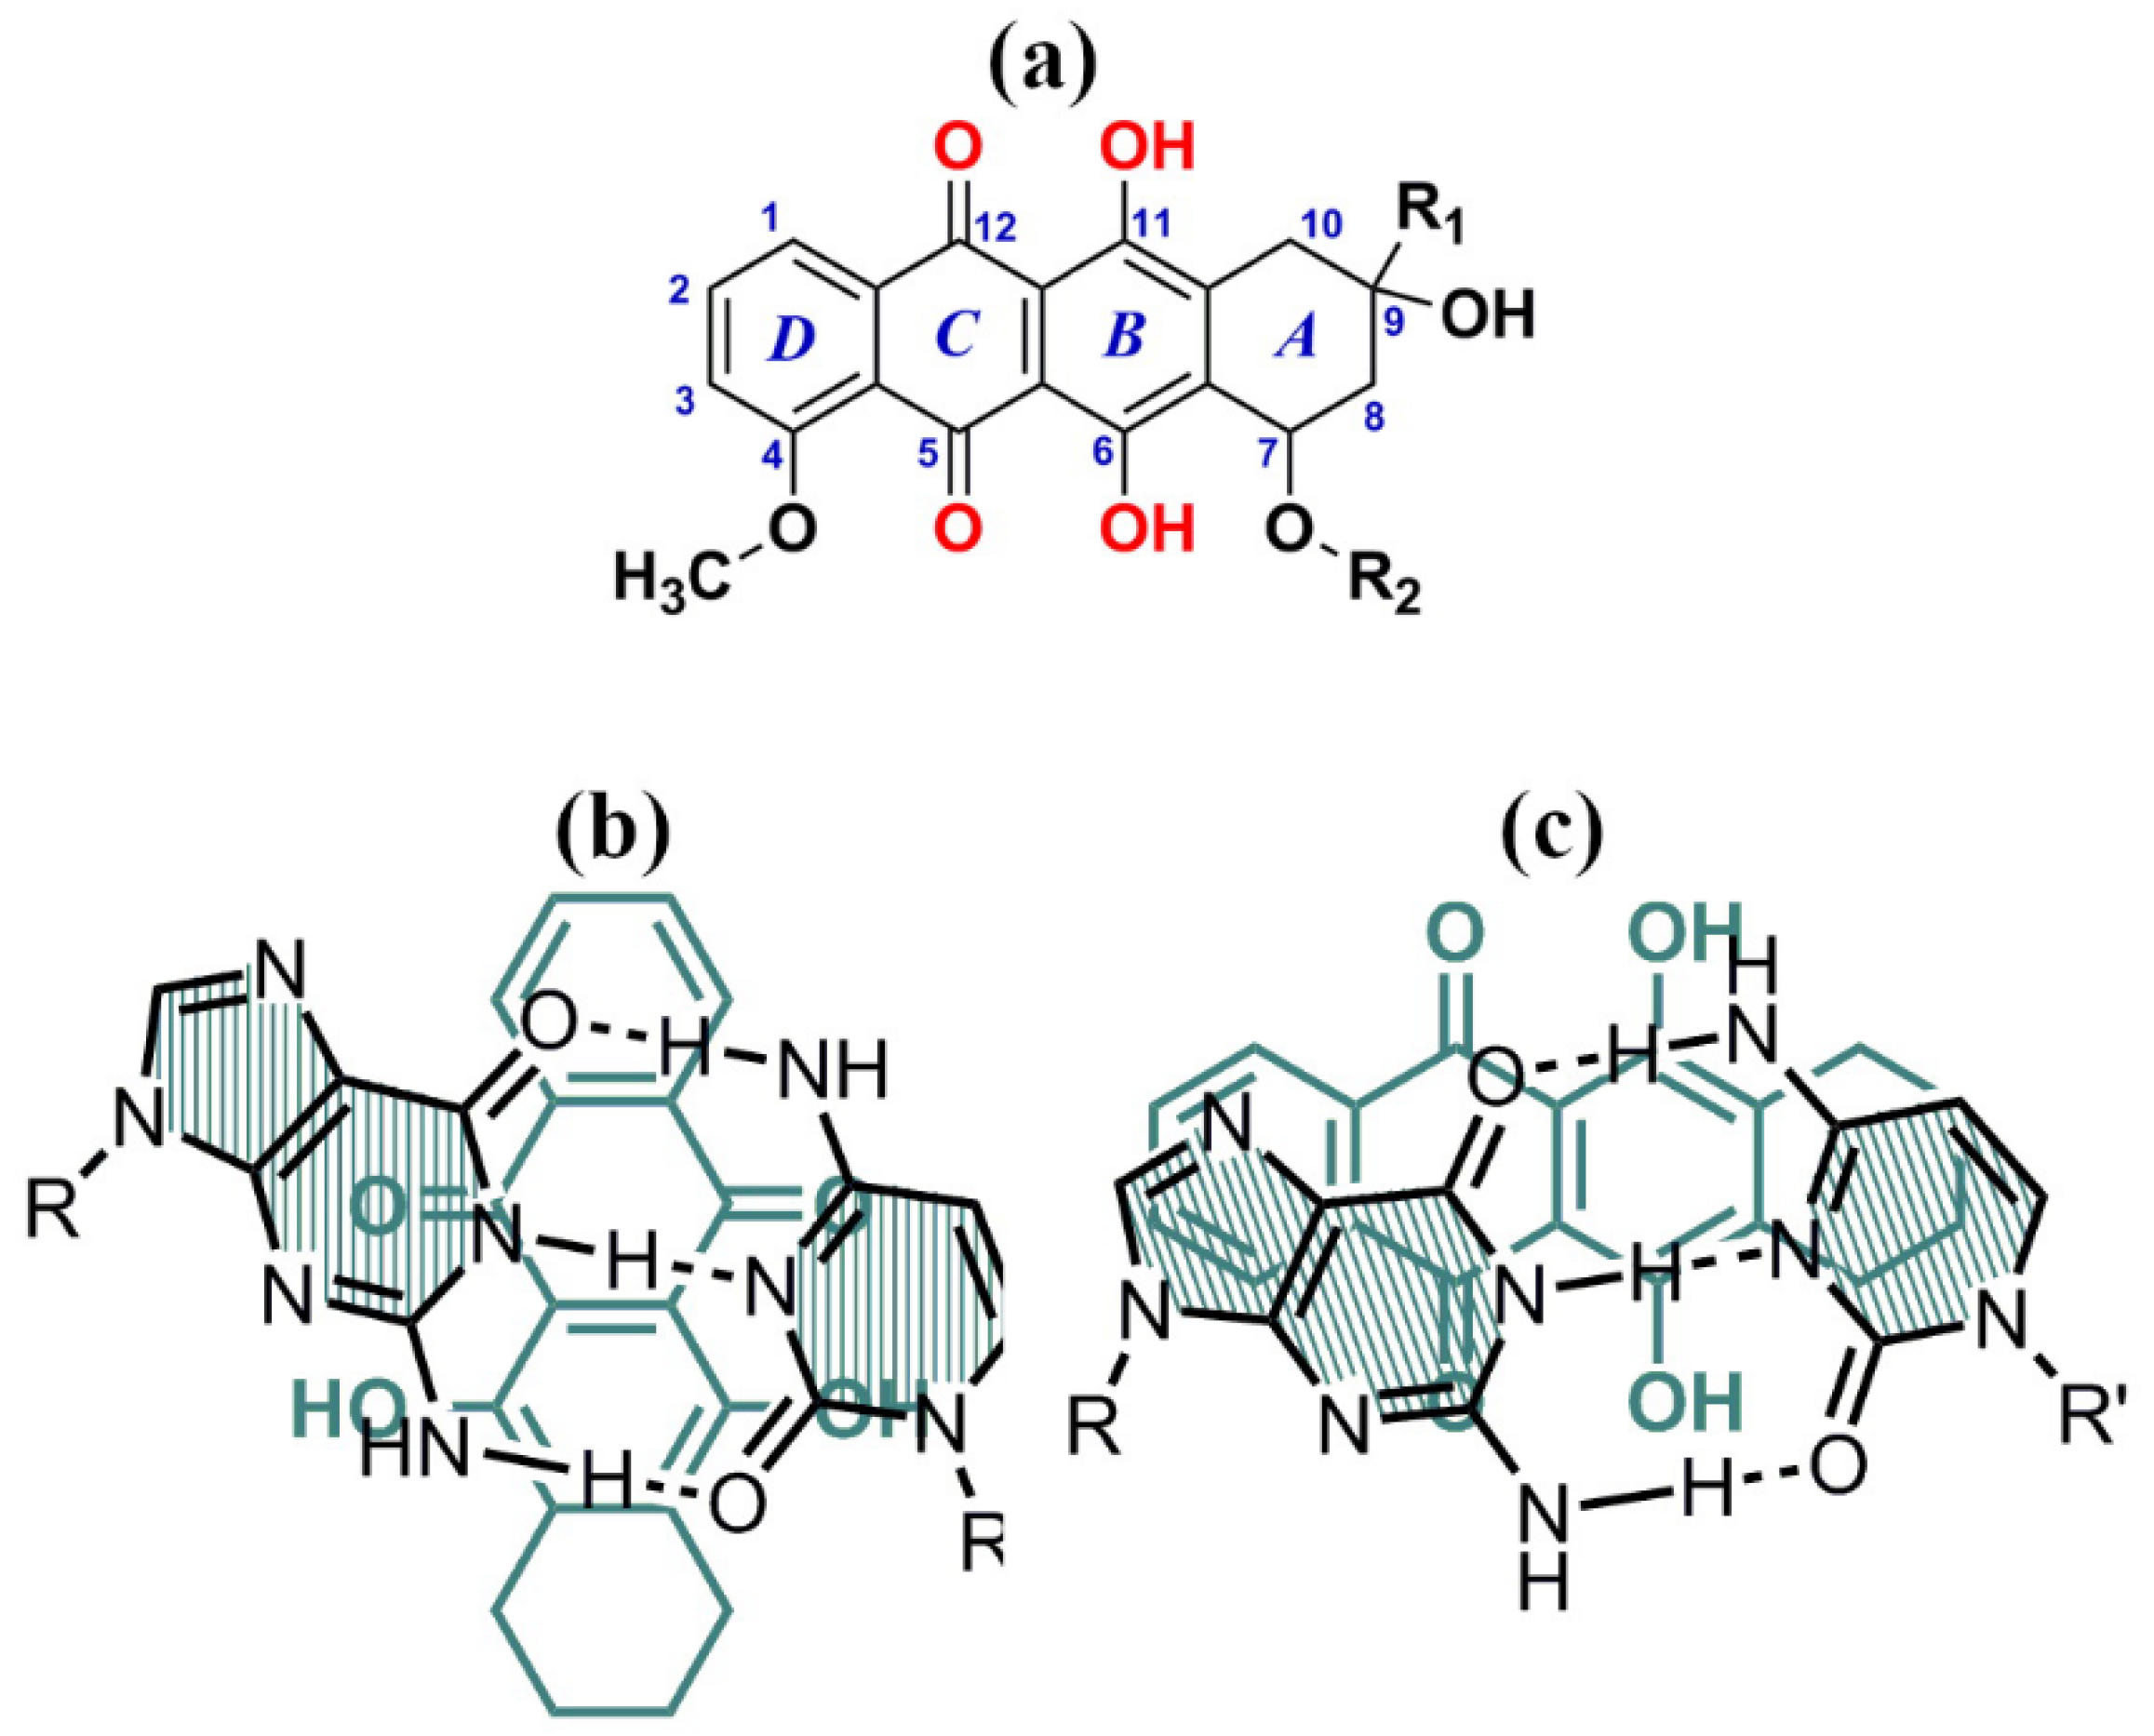
These antibiotics are water-soluble, low molecular mass compounds, which have 4 reactive oxygen atoms in the 5, 6 and 11, 12 positions of anthracycline aglycone (Figure 14a).
They can form two types of complexes with ds DNA molecules, that is, the classical intercalation complex I (Figure 14b) at low drug concentration and nonclassical (“external”) complex II (Figure 14c) at higher extent of binding to DNA. In the first case, an anthracycline molecule, for instance DAU, is rigidly fixed between the base pairs of DNA and synthetic polynucleotides only of the B-family (Figure 14b). Here the reactive oxygen atoms of DAU molecule become inaccessible for different chemical and electrochemical reactions even in aqueous-salt solutions but DAU molecules, being fixed in the cholesteric quasinematic layers of ds DNA, are “visible” by the CD spectroscopy. In the second case, DAU molecules form so-called “external” complexes with nucleic acids of the B- and A-families [79,80] (Figure 14c). Upon the formation of an “external” complex, the reactive groups of DAU prove to be available for chemical reactions.
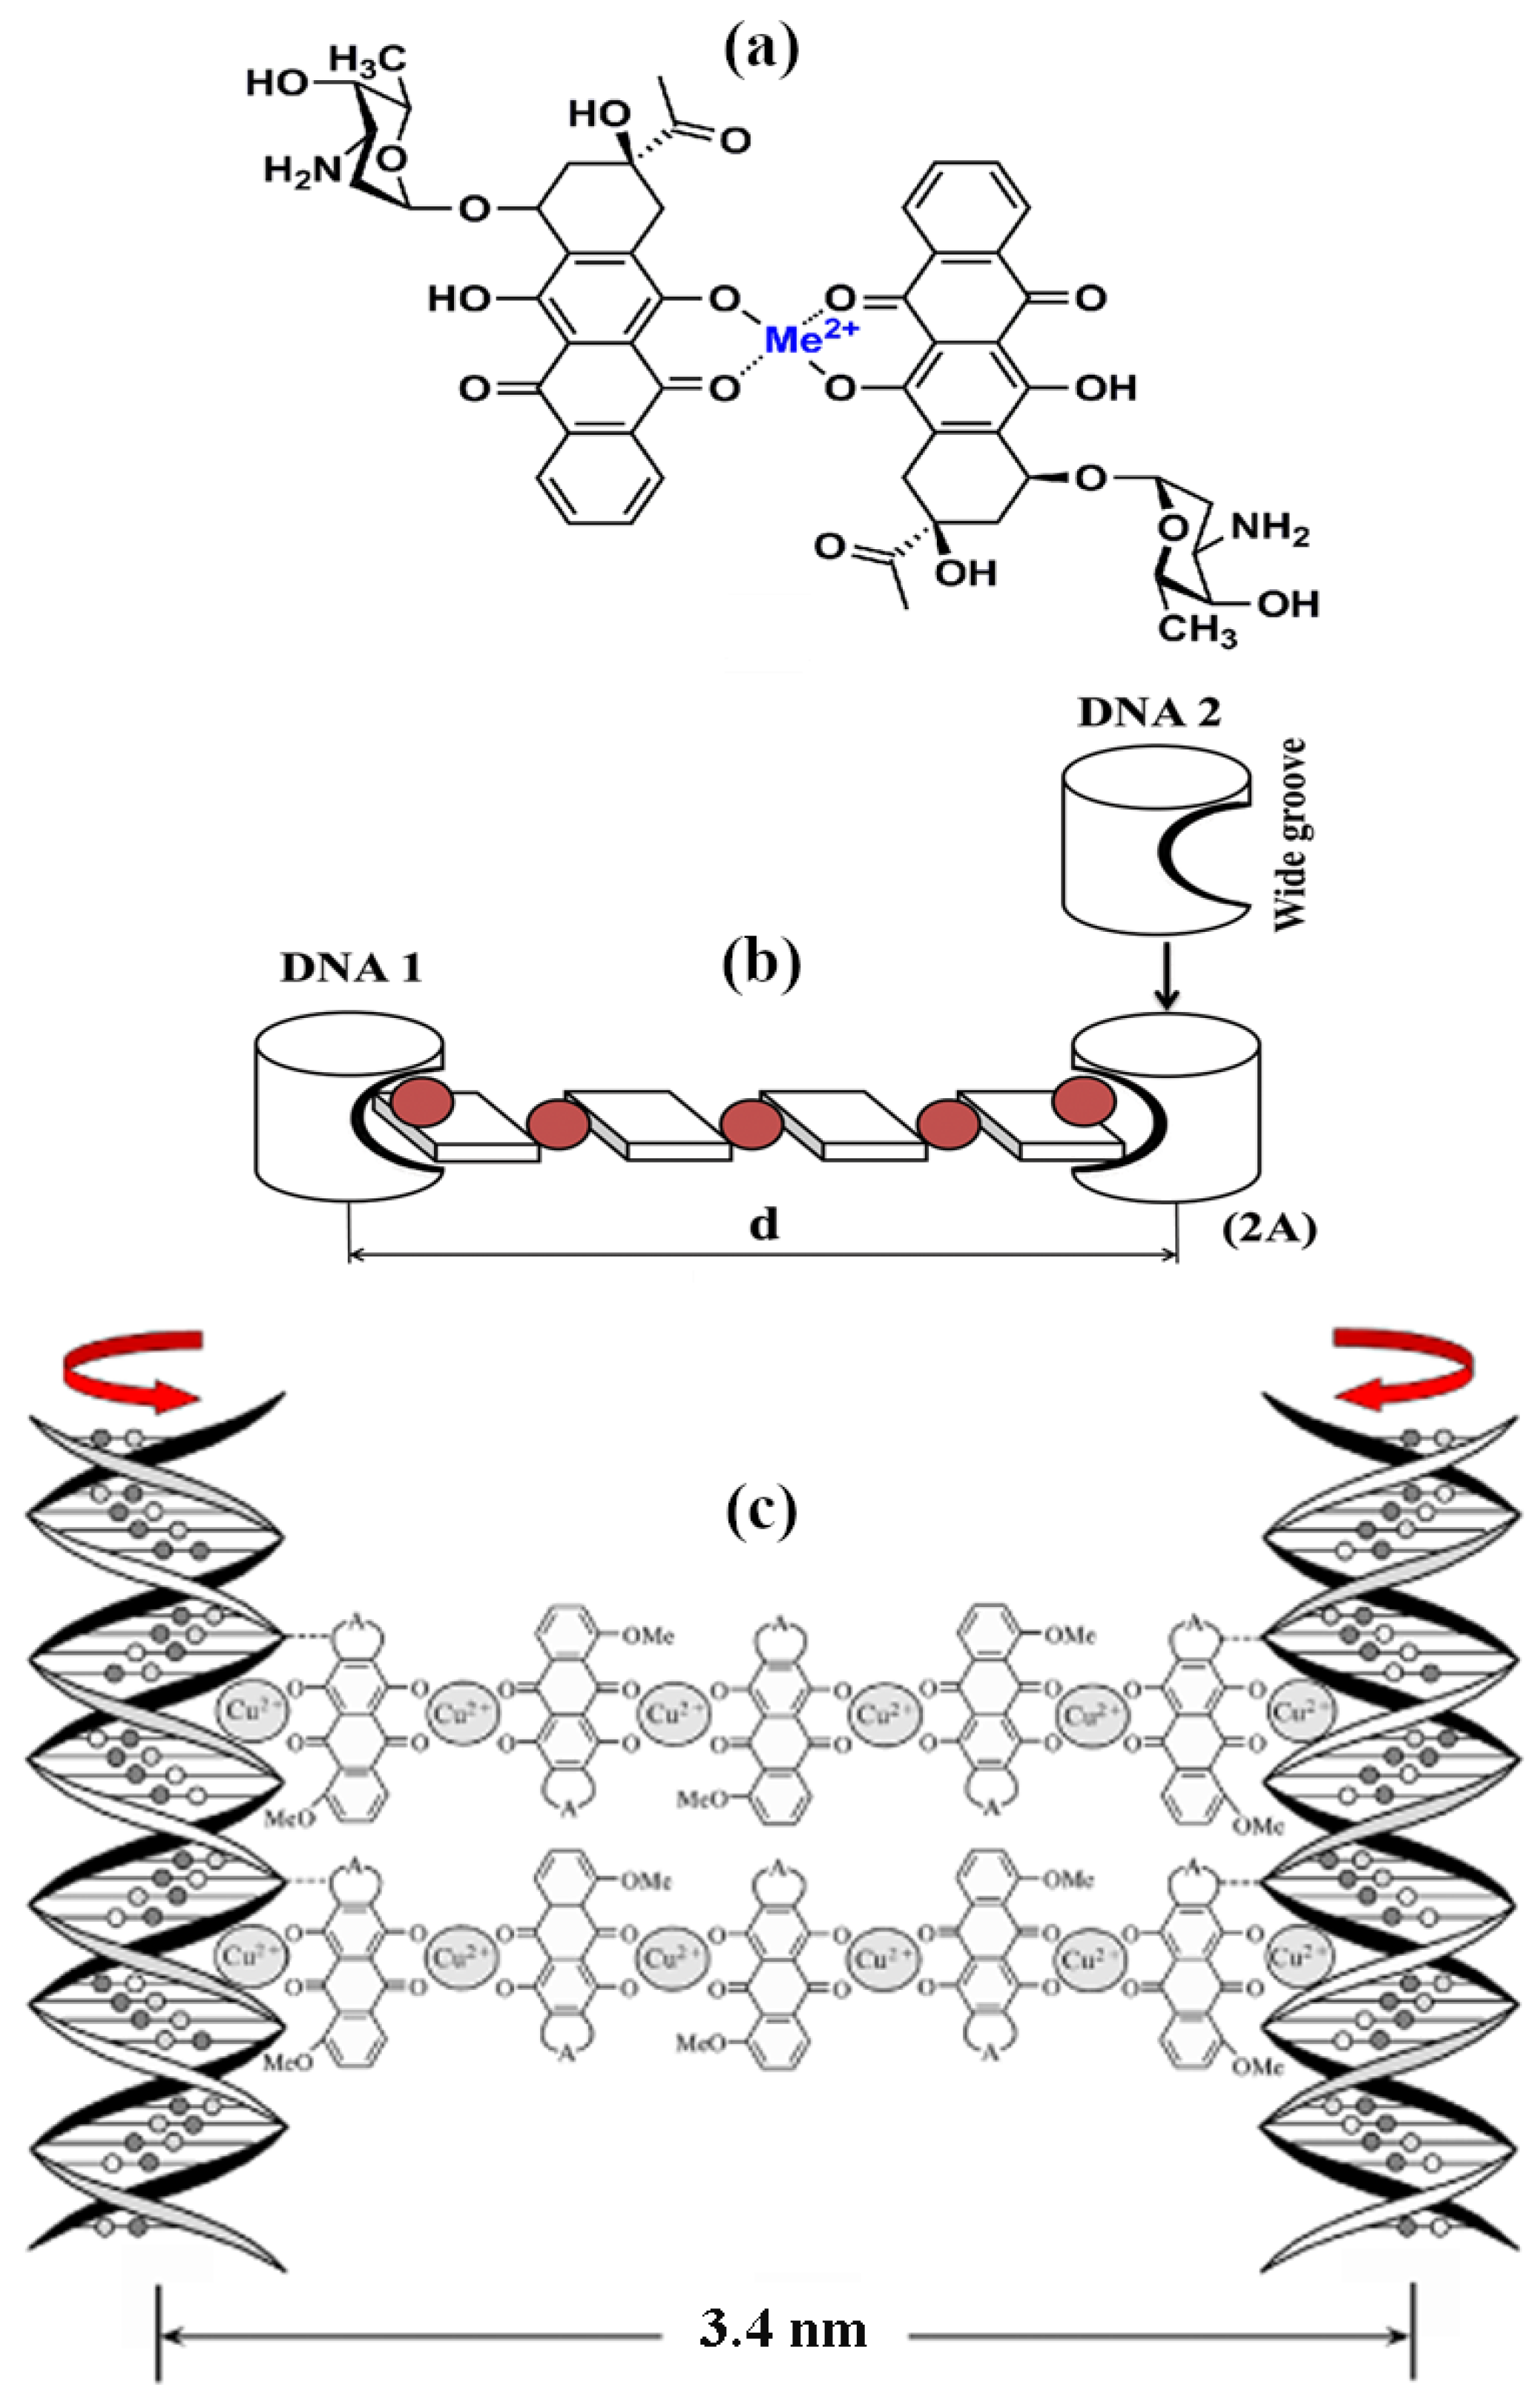
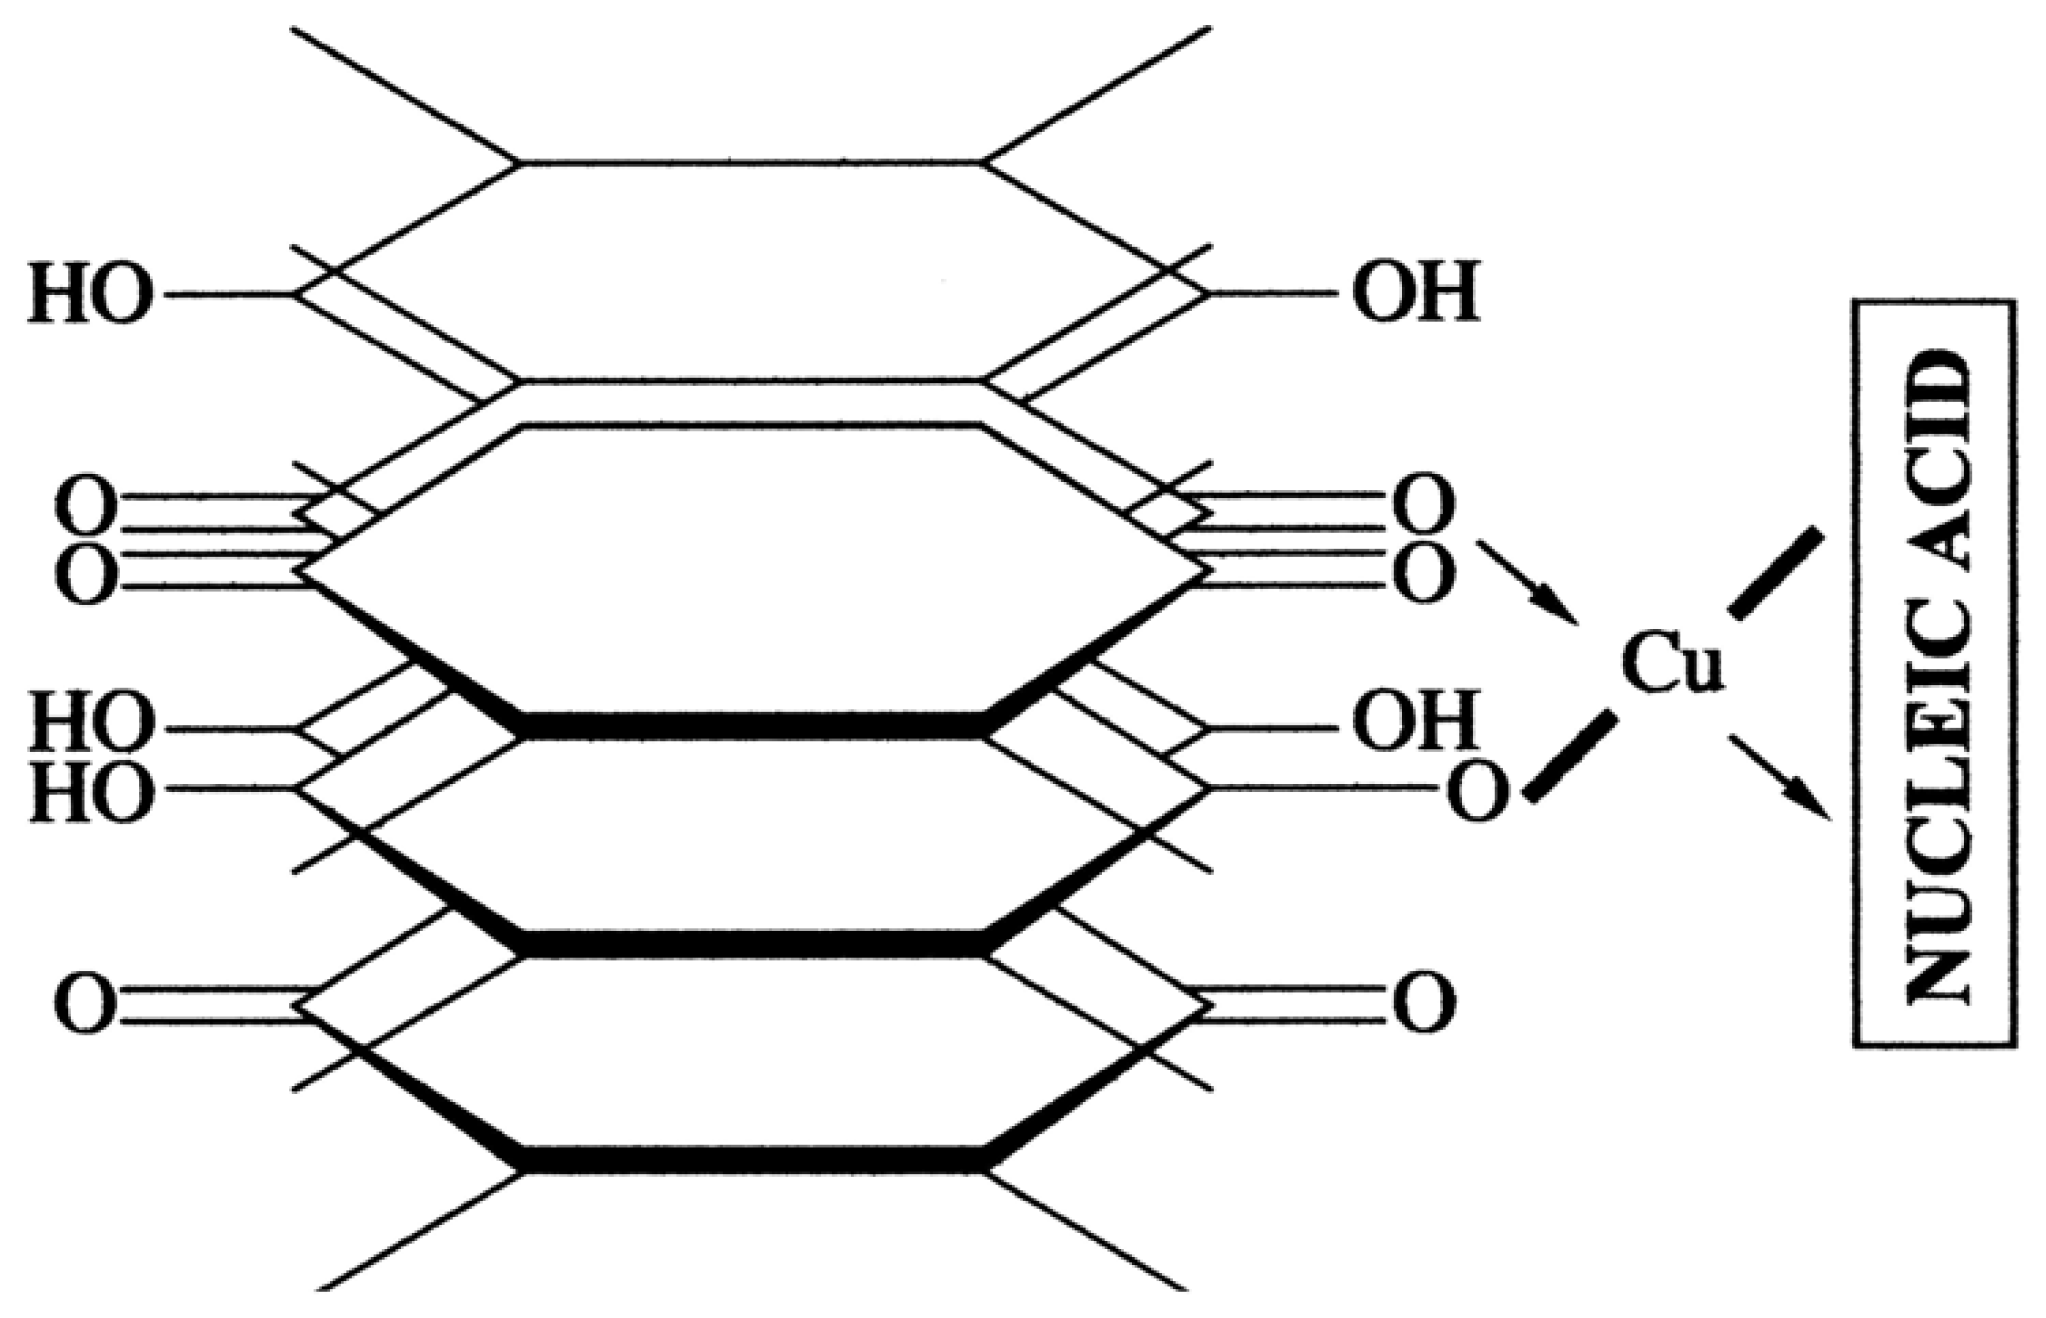
The anthracyclines can form chelate complexes with bivalent metal ions like zinc, cadmium, nickel and so forth (Figure 15a). Chelate complexes produced by bivalent copper ions are of particular interest. The interest is due to the fact that the resulting chelate complexes have planar structures on account of the electronic structure of the bivalent copper ion [81,82,83] and the spatial structure of the anthracycline aglycons. In the case of appropriate bidentate ligands, complexation may result in the formation of a flat polymeric chain comprising up to 10 sequentially arranged molecules cross-linked by bivalent copper ions [84,85].
Figure 15b shows, as an example, the scheme of a “polymeric” chelate cross-link formed between two artificial molecules. The application of this scheme to ds DNA case permits to formulate a few practical requirements.
(1) In order to form polymeric cross-links between adjacent ds DNA molecules in a quasinematic layer, one can use the chemical groups of compounds deliberately “immersed” in the DNA wide groove and spatially fixed here.
(2) The “beginning” and the “end” of such cross-links must be disposed at adjacent ds DNA molecules, that is, they should link these molecules. Taking into account the mean distance between ds DNA molecules the extended cross-links formed between molecules can be named “nanobridges.”
(3) Due to the spatial helical structure of ds DNA molecules (shown in Figure 15b as 1 and 2), in order to form cross-links with a fixed symmetry between the same groups of molecules “immersed” into wide grooves of ds DNA molecules it is necessary to turn DNA molecule 2 around its long axis on 180° in respect to molecule 1 (Figure 15b). It is means that cross-linking can ne only achieved at certain particular arrangement of two adjacent ds DNA molecules in quasinematic layers of CLCD particles, that is, they must be sterically “phased.” Hence, spatial adjustment of the position of ds DNA molecules within quasinematic layers of dispersion particles must be spontaneously realized to cross-link these molecules.
(4) For the sterical phasing of two parallel ds DNA molecules a certain distance between these molecules in a quasinematic layer, and, hence, definite degree of diffusion freedom for both ds DNA molecules, which is enough for a rotation of molecules around their long axes has to exist. Very close packing of ds DNA molecules in quasinematic layers will restrict the sterical phasing and formation of extended cross-links (nanobridges).
(5) Since the direction of the long axis of a polymeric chelate bridge proves to be perpendicular to the direction of the long axis of ds DNA molecules (Figure 15b), we should expect the emergence of an additional abnormal band in the CD spectrum in the absorption region of chromophores in the content of the chelate bridge.
(6) The use of ds DNA CLCD particles in this approach is of special interest because of two circumstances: (i) only in this case can one regulate the mean distance between ds DNA molecules in quasinematic layers of dispersion particles from 4.0 to 2.8 nm by changing the osmotic pressure of a PEG solution even at room temperature; (ii) only in this case the abnormal band in the CD spectra allows one to monitor the minor changes in the spatial structure of these particles and estimate the position of nanobridges in quasinematic layers.
Hence, the formation of nanobridges between adjacent ds DNA molecules is a very delicate stereochemical process, which could be realized in the case of dispersion particles that only possess the cholesteric spatial structure. It means that the considered approach can be used for the estimation of spatial structure of a new optical active phase, which arises at the heating of ds DNA dispersion particles with hexagonal packing of molecules.
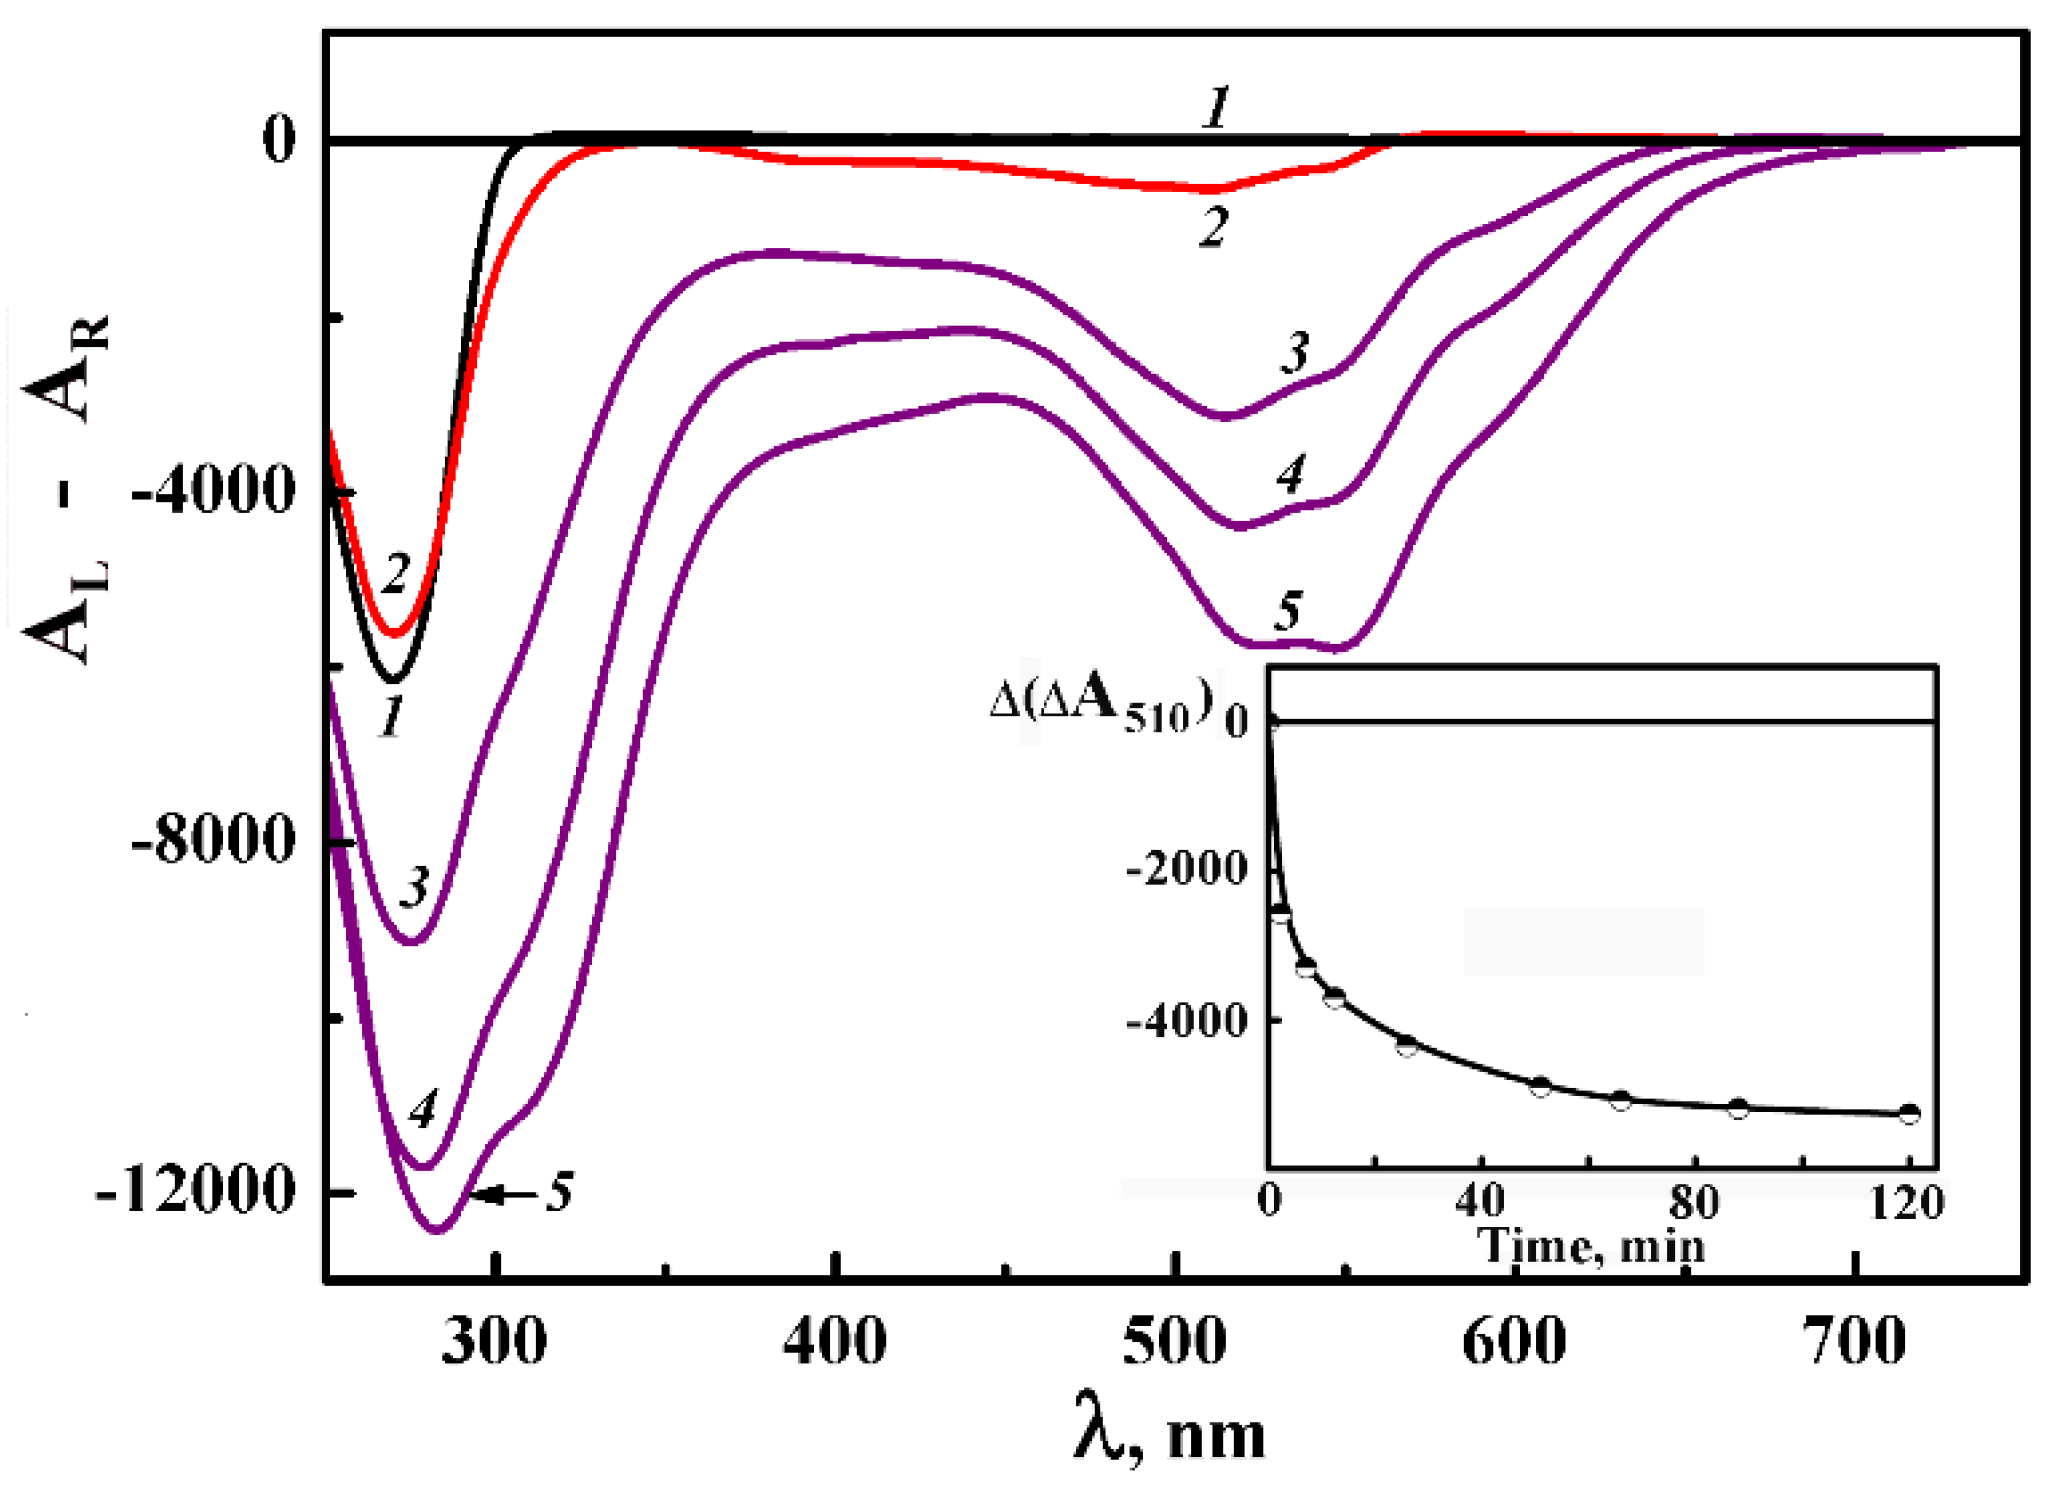
The “rigid” ds DNA particles were made by means of the scheme illustrated in Figure 16.
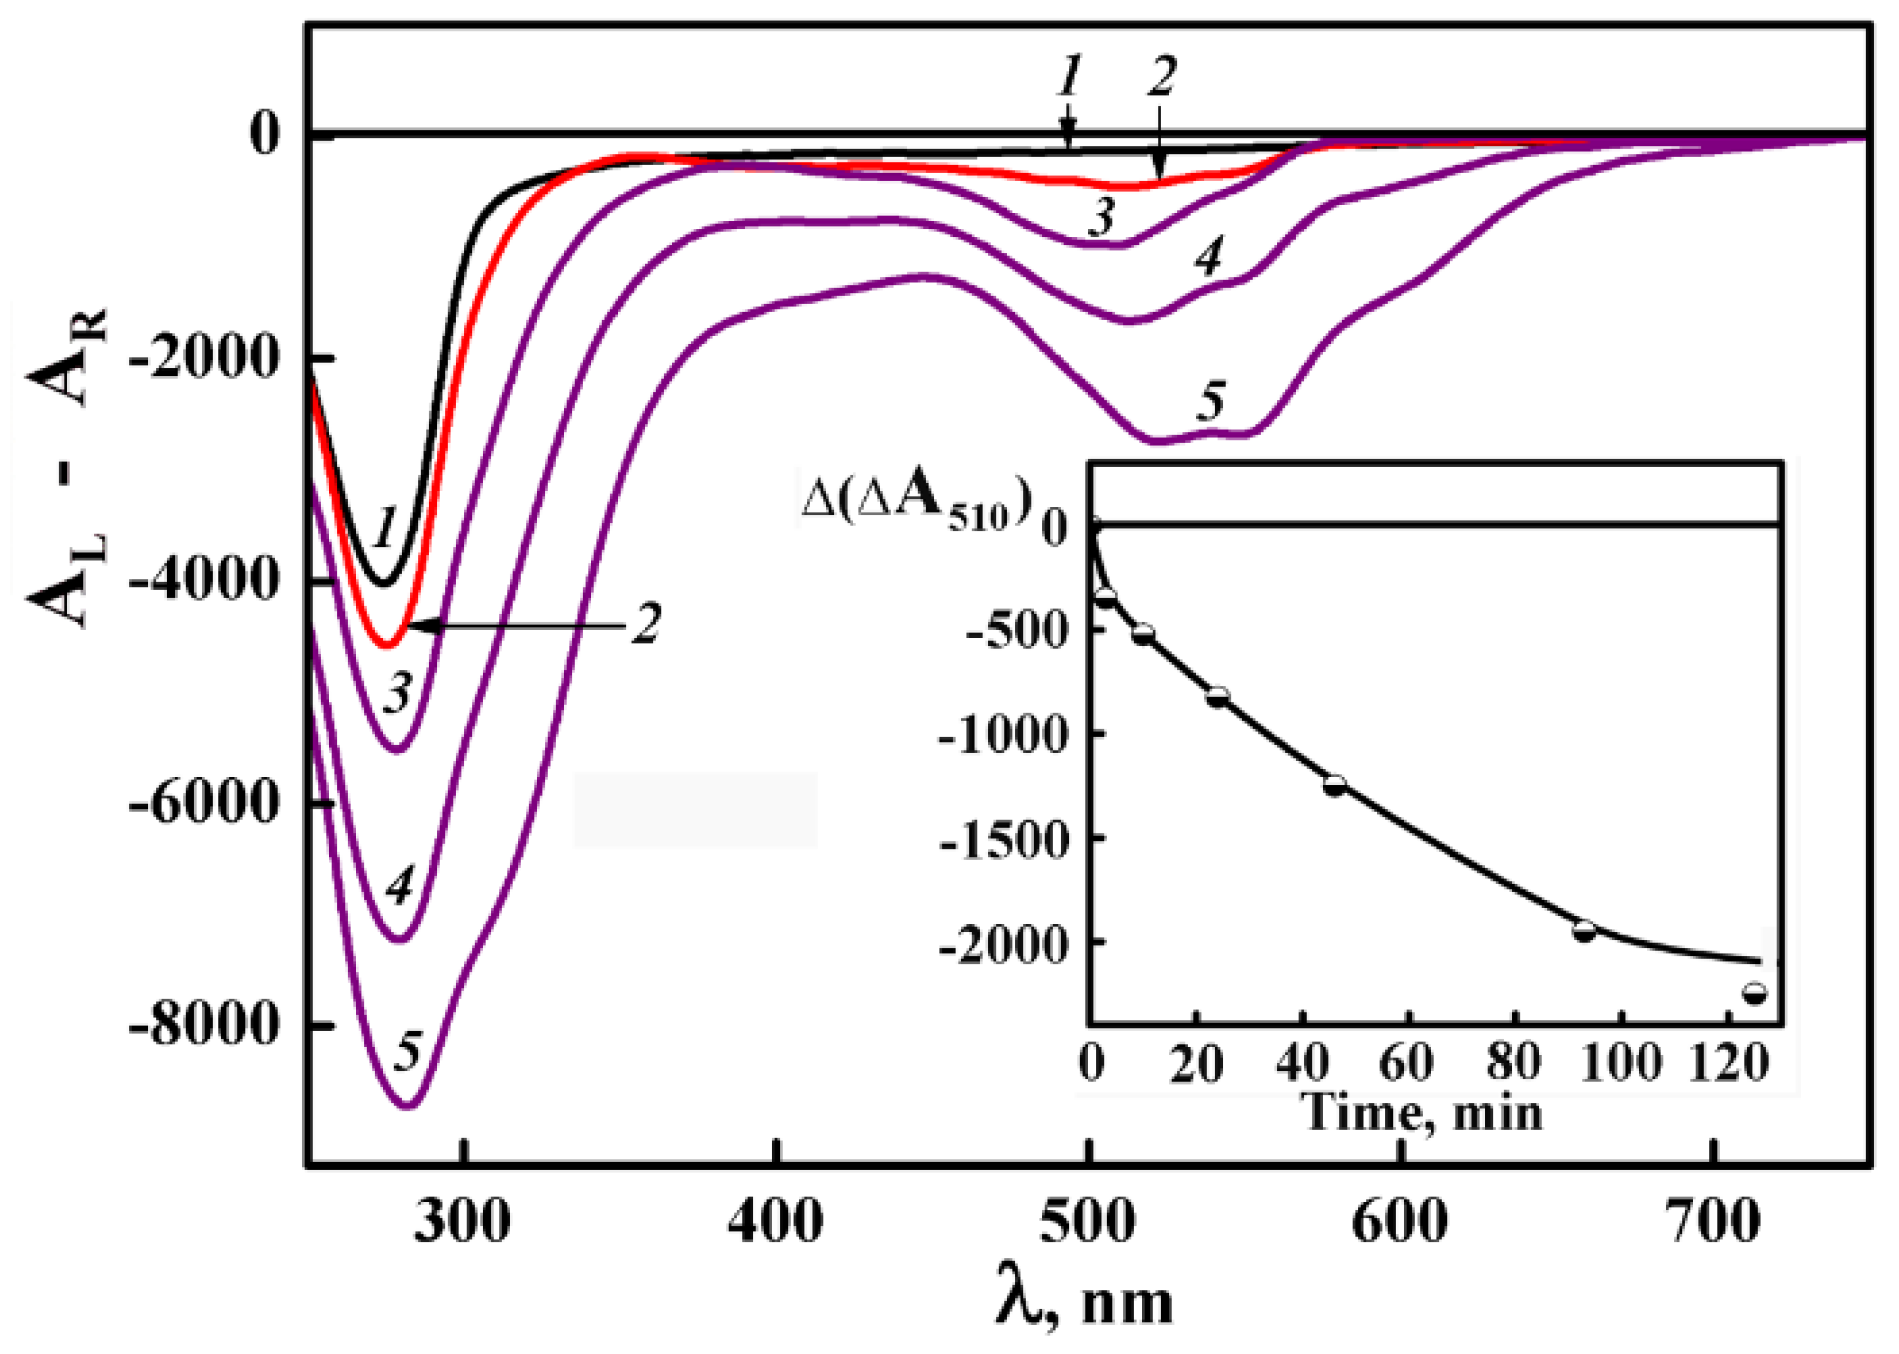
This Figure shows the CD spectrum of ds DNA CLCD obtained as the result of the phase exclusion from PEG-containing solution at room temperature with subsequent thermal “training” (curve1). One can see that the phase exclusion of ds DNA molecules is accompanied by an appearance of an abnormal negative band in the nitrogen bases absorption region (λ 270 nm). According to the theory [51,52] an appearance of this band demonstrates the formation of ds DNA dispersion particles, which possess the cholesteric structure.
After the thermal “training” [75,76] of the ds DNA CLCD, DAU solution was added to this dispersion (Figure 16, curve 2). It results in the appearance of an additional band located in the absorption region of DAU chromophores (л ~ 510 nm). The amplitude of this band grows with the increase in DAU concentration and reaches an equilibrium value at such DAU concentration that corresponds to the maximal extent of the DNA saturation by DAU.
The negative sign of the band at λ ~ 510 nm shows that the orientation of DAU molecules coincide with the orientation of the nitrogen bases in respect to the long axis of the DNA molecules. It is possible if DAU molecules are intercalated between the nitrogen base pairs of ds DNA molecules in the content of the dispersion particles. Under these conditions the reactive groups of DAU (Figure 14b) are unavailable for chemical reactions [86].
To induce the formation of the “external” complexes of DAU with ds DNA (Figure 14c), the ds DNA CLCD was treated by DAU solutions, the concentrations of which exceed the equilibrium value. After that the solution of CuCl2 was added. The addition of CuCl2 leads to manifold increase of the band at λ ~ 510 nm (curves 3–5). This process takes about one hour (see inset in Figure 16). The amplification of the band in the visible region of the CD spectrum means that a new pattern of fixation of DAU nearby ds DNA molecules ordered in the quasinematic layers has appeared.
The multiple dilution of PEG-containing solution, in which the DNA CLCD was processed with DAU and CuCl2, to conditions of full disintegration of the LC structure of the initial dispersion particles [27] does not lead to an appreciable decrease in the specific abnormal optical activity of the DNA CLCD (taking into account simply the decrease in the concentration of the DNA CLCD particles due to dilution). It means that the spatial orientation of adjacent ds DNA molecules in quasinematic layers of the CLCD treated by DAU and CuCl2 is not violated even outside the “boundary” conditions [27].
Hence, the osmotic pressure of PEG-containing aqueous-salt solution is not the main factor affecting the pattern of packing ds DNA molecules in a CLCD particle.
The created structure can exist not only in solutions with a very low (up to zero) concentration of PEG but also in solutions with low ionic strength. It means, the adjacent ds DNA molecules in quasinematic layers of a single dispersion particles are cross-linked by (DAU-Cu2+) complexes and these complexes stabilize the spatial structure of the CLCD particles.
The formation of cross-links between ds DNA molecules ordered in quasinematic layers of dispersion particle depends on the number of DAU molecules and on the number of copper atoms, as well as on the average distance between DNA molecules in the spatial structure of a dispersion particle [86].
The analysis of more than 10 DAU analogues, which differ by the presence and the position of substituents at the aglycon, has shown that the presence of reactive oxygen atoms in the 5, 6 and 11, 12 positions of anthracyclines is one of the essential conditions for the amplification of abnormal optical activity upon building of cross-links (chelate bridges). Consequently, each copper atom in the bridge forms 4 bonds with coplanar oxygen atoms [87]. This reflects the well-known stereochemical and electronic properties of chelate complexes in which Cu2+ ions interact with 4 oxygen atoms of anthracyclines [81,88,89,90].
If Cu2+ ion forms a chelate complex with four reactive oxygen atoms, this ion is in d9 state, which exhibits a nonzero magnetic moment [91]. It allows one to directly estimate the number of Cu2+ ions in one cross-link (nanobridge) between adjacent ds DNA molecules ordered in quasinematic layers of one cholesteric liquid-crystalline particle by low-temperature magnetometry [91].
Taking into account the distance between ds DNA molecules in dispersion particles formed at CPEG = 170 mg·mL−1, the results obtained by low-temperature magnetometry and supported by the theoretical calculations [87,92,93,94] allow one to accept that the nanobridge between adjacent ds DNA molecules contains six Cu2+ ions. Besides, the theoretical evaluations, based on the analysis of the dependences of the amplitude of the band at λ ~ 510 nm on the number of DAU molecules (an isotropically oriented near ds DNA surface) and on the number of copper atoms [92,93] has shown that one nanobridge in dispersion particles (at CPEG = 170 mg·mL−1) can include from four to six DAU molecules and its final structure is shown in Figure 15c.
The nanobridges (cross-links) are planar chelate complexes. The stabilization of the nanobridges is achieved by the rigid fixation of the [-(Cu2+-DAU…-…DAU-Cu2+)n] chelate system between two adjacent DNA molecules. It means that the spatial final system of nanobridge looks like [DNA-extDAU-(Cu2+-DAU…-…DAU-Cu2+)n-extDAU-DNA].
The directions of the long axes of the planar nanobridges are perpendicular to the direction of the long axes of ds DNA molecules ordered in quasinematic layers of the dispersion particles, and, hence, to the cholesteric axis. In this case, the helical twist of the quasinematic layers means the spatial rotation of the “coloured” nanobridges and they are “visible” by means of CD spectroscopy. If this is the case, one can suppose that the amplitude of an abnormal band in the CD spectrum of cholesteric dispersion particles depends upon the length of nanobridges between adjacent ds DNA molecules, which, in turn, depends on the distance between these molecules.
The formation of the nanobridges (cross-links) between ds DNA molecules ordered in quasinematic layers of a single dispersion particle results in the creation of three-dimensional, “integrated” structure of the particle, which includes all ds DNA molecules as well as numerous (DAU-Cu2+) bridges in the content of a single particle. This high molecular mass structure is incompatible with a PEG-containing solution. The stability of the “rigid” structure is determined by the number and the properties of the nanobridges rather than the properties of the initial PEG-containing solution. Hence, the transition of ds DNA particles from the “liquid-like” to the “rigid” (gel-like) state takes place [42].
Due to the presence of the nanobridges between adjacent ds DNA molecules, the spatial structure of “rigid” particles remains stable for a long time (months) at PEG and NaCl concentrations significantly below those at which the CLCD particles, not stabilized with nanobridges, can exist. Consequently, the created structure can exist not only in solutions with low ionic strength but also in solutions with a very low (up to zero) concentration of PEG, that is, under the conditions of a low osmotic pressure of the solution.
It is worth to noting that the rigid particle size can be different from the liquid-like particle size. Indeed although the intermolecular potential is overall repulsive, due to the nanobridges, it contains a local minimum at relatively short distances corresponding to the characteristic bridge length. Then the competition between the standard aggregation driven by osmotic pressure and bridge induced potential energy minimum, kinetics of macroscopic phase formation, may proceed non-monotonously in time. We defer the detailed investigation of this phenomenon for a future work.
Taking the results shown above into account, the possibility to investigate the properties of “rigid” particles of ds DNA by experimental techniques appears. For instance, one can immobilize “rigid” particles cross-linked by nanobridges onto the surface of nuclear membrane filter and directly directly visualize their size.
The AFM images of “rigid” particles formed at CPEG = 170 mg·mL−1 have been recorded. The shape of the particles is close to spherocylinders. Estimation of the size of many particles demonstrates that the mean size of these particles is close to 500–600 nm, which is in good agreement with the data on particle size theoretically calculated for the initial PEG-containing solution with constant osmotic pressure [27].
Therefore, a few new features, that is, the appearance of an additional band at λ 510 nm at the treatment of the ds DNA dispersion by DAU, the formation of cross-links between adjacent ds DNA molecules in quasinematic layers and the creation of the “rigid” structure are distinctive of the dispersions with the cholesteric pattern of ds DNA molecules ordering.
6. The Optical Evidence of the Cholesteric Packing of ds DNA Molecules in a New Optically Active (“Re-Entrant” Cholesteric) Phase
The steps of the formation of the initial LCD particles with hexagonal packing of ds DNA molecules and their transformation to the optically active state are illustrated in Figure 17.
(Again, in the CD spectrum of the initial ds DNA LCD obtained as the result of the phase exclusion of ds DNA molecules from a PEG-containing solution (CPEG = 280 mg·mL−1) at room temperature there is a low intensity band of unknown origin. This non-specific band, which appears in the CD spectrum in the ds DNA absorption region (λ ~ 270 nm) confirms the formation of a dispersion, particles of which possess the hexagonal packing of ds DNA molecules [25]. Very low amplitude of this band is accepted as a zero value (see also Figure 8b, domain III).
In addition, the results of an X-ray study of unoriented samples of phase, obtained by the sedimentation of LCD particles and our additional control of the ds DNA secondary structure, confirm that ds DNA molecules retain the B-form under these conditions. However, in the contrast to the previous case (Section 5) the mean distance between DNA molecules in the dispersion particles formed at CPEG = 280 mg·mL−1 is about 2.5 nm.
Curve 1 in Figure 17 is the CD spectrum after the thermal “training” of the ds DNA dispersion, that is, after its heating to 80°C and subsequent cooling to the room temperature. One can see that the thermal “training” of this dispersion is accompanied by a remarkable optical effect, that is, an abnormal negative band arises in the CD spectrum at λ = 270 nm. An appearance of an abnormal band means that the heating of the dispersion particles with hexagonal packing of ds DNA molecules (and therefore, with no abnormal optical activity) results in a transition of these particles into a new optically active state, that is, a new optically active phase is formed. (We used term “ds DNA-III” to designate this phase). The transition, which looks like a phase transition, testifies of a change in the spatial structure of the ds DNA dispersion particles.
The comparison of curve 1 in Figure 17 to curve 1 in Figure 16 demonstrates their close similarity. It permits us to suppose that the initial hexagonal packing of quasinematic layers of ds DNA molecules in the particles is transformed into the cholesteric packing upon their heating.
However, the optical texture of a thin layer of ds DNA phase, obtained from the heated dispersion particles formed at CPEG = 280 mg·mL−1, does not demonstrate the specific characters typical of the classical cholesterics, in particular, we cannot see the fingerprint texture [95]. Since the distance between ds DNA molecules in a new optically active phase formed at CPEG = 280 mg·mL−1 is small (2.5 nm), the simplest rationalization of the absence of the fingerprint texture typical of classical DNA cholesterics is that the pitch of the helical twist of the new structure of the dispersion particles formed at CPEG = 280 mg·mL−1 is so small, that it cannot be detected by the polarization microscope.
To check the hypothesis about the cholesteric packing of ds DNA molecules in the new optically active phase, we used an approach considered above.
Fixed volumes of DAU solution have been added to the dispersion particles of the new optically active phase (Figure 17, curve 2). In full correspondence with the results presented in Figure 16, the addition of DAU to the ds DNA-III is accompanied by the appearance of a new band located in the absorption region of DAU chromophores (λ ~ 510 nm). The amplitude of this band grows with the increase in DAU concentration and reaches the equilibrium value at DAU concentration that corresponds to the maximal saturation of the ds DNA-III with DAU molecules (curve 2). The equilibrium value of this band does not change upon further growth of DAU concentration.
The negative sign of the band at λ ~ 510 nm shows that the orientation of DAU in respect to the axis of the DNA molecules in the content of ds DNA-III coincides with the orientation of nitrogen bases.
According to the results presented in Section 5, the appearance of an additional band in the CD spectrum in DAU absorption region is the first evidence in favour of the spatially twisted (cholesteric) structure of ds DNA-III phase.
We induced the formation of the “external” complexes of DAU with ds DNA-III particles by increase of DAU concentration. Then, the obtained mixture was treated with CuCl2 solution. The addition of CuCl2 solution to the ds DNA-III, treated by DAU, leads to manifold increase in the band amplitude at λ ~ 510 nm (Figure 17, curves 3–5). The amplification of this band is the second evidence in favour of the spatially twisted (cholesteric) structure of the ds DNA-III phase.
Hence, one can consider the appearance of the additional band at λ 510 nm at the treatment of ds DNA-III dispersion by DAU, its amplification at addition of CuCl2 solution as the distinctive factors of the dispersions with the cholesteric ordering of ds DNA molecules. Based on the similarity between the abnormal optical properties of ds DNA-III phase and the standard ds DNA cholesterics, we designate this new state as the “re-entrant” cholesteric phase [77].
However, comparison of Figure 17 to Figure 16 attracts attention to following items: (i) the process of amplification of the band at λ ~ 510 nm (Figure 17, see inset) takes more time in comparison to the case shown in Figure 16, (ii) the maximal value of the band at λ ~510 in Figure 17 is about 3 times smaller in comparison to Figure 16. It means that the abnormal optical properties typical of two types of the cholesteric dispersion particles (formed at CPEG 170 and 280 mg·mL−1) are related, as minimum, to the distance between adjacent ds DNA molecules ordered in quasinematic layers. It is not excluded that the dense packing ds DNA molecules in dispersion particles formed at CPEG 280 mg·mL−1 prevents the correct spatial “phasing” of adjacent ds DNA molecules in quasinematic layers and influences, probably, the pattern of DAU interaction with ds DNA molecules.
Taking into account the small distance between molecules in dispersion particles formed at C PEG 280 mg·mL−1 (i.e., ds DNA-III), we can suppose that there are two reasons for the increase in the amplitude of the band in the CD spectrum of ds DNA-III dispersion treated by high DAU concentration and CuCl2.
The first reason consists in the formation of a small size cross-links (“nanobridges”) of type [-(Cu2+-DAU…-…DAU-Cu2+)n−] between two adjacent DNA molecules ordered in quasinematic layers of dispersion particle. In this case, the helical twist of the quasinematic layers means the spatial rotation of the “coloured” nanobridges and they are “visible” in the CD spectrum at λ ~ 510 nm (Figure 17). The formation of the nanobridges (cross-links) between ds DNA molecules ordered in quasinematic layers of a single dispersion particle results in the creation of the “integrated” structure of the particle. This structure must be incompatible with a PEG-containing solution and the transition of ds DNA-III particles from the “liquid-like” to the “rigid” (gel-like) state will takes place.
However, there is the other reason for the increase in the amplitude of band in the CD spectrum of ds DNA-III dispersion treated by high DAU concentration and CuCl2 [87,95].
An intense band at λ ~ 510 nm may reflect the appearance of a new pattern of anisotropic arrangement of DAU molecules, which is realized, mainly, at small distances between the ds DNA molecules in dispersion particles. Owing to stacking interaction between DAU molecules forming the “external” complexes and free DAU molecules in solution, a “shell” of DAU is formed in proximity to the surface of ds DNA-III molecule, where a portion of DAU molecules is linked by copper ions (Figure 18). It should be noted that, in principle, the beginning of this “shell” may be not only a DAU molecule of “external” complexes but also a copper ion bound to ds DNA bases. At a small distance between molecules in the ds DNA-III dispersion particles, the question of the steric hindrances arising upon such an arrangement of adjacent DAU molecules, in particular, the location of sugar residues, remains open. The orientation of DAU molecules in the created structure may coincide with the orientation of nitrogen base pairs. It is obvious that in the case of the “shell” structure, DAU molecules are ordered in quasinematic layer. The helical twist of the quasinematic layers results in the spatial rotation of the created “shell” structure and it is “visible” in the CD spectrum. Whether there is in this case the transition from “liquid-like” to “rigid” (gel-like) state of ds DNA-III dispersion particle, remains unknown.
The both aforesaid arguments confirm the helical twist of the quasinematic layers of dispersion particles of ds DNA-III, that is, they strongly suggest the existence of the “re-entrant” cholesteric structure of ds DNA-III.
The investigation of the details of an appearance of an intense band at λ ~ 510 nm in the case of all dispersion particles formed in domain III and differ by the distances between ds DNA molecules in quasinematic layers is now in progress.
The results presented in this review demonstrate that “liquid-like” and “rigid” (solid) ds DNA dispersion particles have the unique physicochemical properties. This opens a gate for their application in various fields of science and technology, for instance:
(i) “Liquid-like” particles based on ds DNA molecules can be considered as polyfunctional sensing elements for optical analytical systems permitting the detection of biologically active compounds: antibiotics, genotoxicants and so forth, in laboratory and physiological liquids (application field: medicine, ecology and biotechnology);
(ii) “Rigid” particles, where the ds DNA concentration exceeding 200 mg·mL−1, can be used as carriers of genetic material or various biologically-active or chemical substances introduced into these structures (application field: medicine and biotechnology).
7. Conclusions
The phase exclusion of ds linear, low molecular mass DNA molecules from aqueous-salt PEG-containing solutions at room temperature results in the formation of LCD particles with the cholesteric and the hexagonal packing mode of the molecules. However, the heating of dispersion particles with the hexagonal packing of ds DNA molecules results in a new phase transition accompanied by the appearance of an abnormal optical activity in the particles. Obtained results are explained in the framework of a concept of orientationally ordered “quasinematic” layers formed by ds DNA molecules, with a parallel alignment in the hexagonal structure. These layers can adopt a spatially twisted configuration at temperature increase; and as a result of this process, a new optically active structure is formed. This structure was termed the “re-entrant” cholesteric phase. This as one can expectour results indicate than the pattern of packing of the adjacent “quasinematic” layers of the ds DNA molecules in dispersion particles, obtained in PEG-containing aqueous-salt solutions, is determined not only by the osmotic pressure of the solution but also by its temperature.
To prove the cholesteric pattern of ds DNA molecules in a new optically active phase an approach based on the transition from the “liquid-like” to the “rigid” state of dispersion particles was used.
Author Contributions
Y.Y. and S.S. (Sergey Skuridin) conceived and designed the experiments; S.S. (Sergey Semenov) performed theoretical calculations of the circular dichroism spectra; V.S. and S.S. (Sergey Skuridin) performed the experiments; Y.Y., S.S. (Sergey Skuridin) and E.K. analysed the data; Y.Y. and E.K. wrote the paper with an input from all co-authors.
Funding
Yuri Yevdokimov, Sergey Skuridin, Viktor Salyanov were financially supported by the Russian Science Foundation (Grant number 16-15-00041).
Conflicts of Interest
The authors declare no conflict of interest.
References
- Robinson, C. Liquid crystalline structures in polypeptides solutions. Tetrahedron 1961, 13, 219–234. [Google Scholar] [CrossRef]
- Luzzati, V.; Nicolaieff, A. The structure of nucleohistones and nucleoprotamines. J. Mol. Biol. 1963, 7, 142–163. [Google Scholar] [CrossRef]
- Iizuka, I. Some new finding in the liquid crystals of sodium salt of deoxyribonucleic acid. Polym. J. 1977, 9, 173–180. [Google Scholar] [CrossRef]
- Senechal, E.; Maret, G.; Dransfeld, K. Long-range order of nucleic acids in aqueous solutions. Int. J. Biol. Macromol. 1980, 2, 256–262. [Google Scholar] [CrossRef]
- Potaman, V.N.; Alexeev, D.G.; Skuratovskii, I.Y.; Rabinovich, A.Z.; Shlyakhtenko, L.S. Study of DNA films by CD, X-ray and polarization microscopy techniques. Nucleic Acids Res. 1981, 9, 55–64. [Google Scholar] [CrossRef] [PubMed]
- Rill, R.L.; Hilliard, P.R.; Levy, G.C. Spontaneous ordering of DNA. J. Biol. Chem. 1983, 258, 250–256. [Google Scholar] [PubMed]
- Brandes, R.; Kearns, D.R. Magnetic ordering of DNA liquid crystals. Biochemistry 1986, 25, 5890–5895. [Google Scholar] [CrossRef] [PubMed]
- Strzelecka, T.E.; Rill, R.L. Solid-state phosphorus-31 NMR studies of DNA liquid crystalline phases. The isotropic to cholesteric transition. J. Am. Chem. Soc. 1987, 109, 4513–4518. [Google Scholar] [CrossRef]
- Merchant, K.; Rill, R. Isotropic to anisotropic phase transition of extremely long DNA in an aqueous saline solution. Macromolecules 1994, 27, 2365–2370. [Google Scholar] [CrossRef]
- Wissenburg, P.; Odjik, T.; Cirkel, P.; Mandel, M. Multimolecular aggregation of monoclonal DNA in concentrated isotropic solutions. Macromolecules 1995, 28, 2315–2328. [Google Scholar] [CrossRef]
- Rau, D.C.; Lee, B.; Parsegian, V.A. Measurement of the repulsive force between polyelectrolyte molecules in ionic solution: Hydration forces between parallel DNA double helices. Proc. Natl. Acad. Sci. USA 1984, 81, 2621–2625. [Google Scholar] [CrossRef] [PubMed]
- Parsegian, V.A.; Rand, R.P.; Fuller, N.L.; Rau, D.C. Osmotic stress for the direct measurement of intermolecular forces. Methods Enzymol. 1986, 127, 400–416. [Google Scholar] [CrossRef] [PubMed]
- Rau, D.C.; Parsegian, V.A. Direct measurement of the intermolecular forces between counterion-condensed DNA double helices. Evidence for long range attractive hydration forces. Biophys. J. 1992, 61, 246–259. [Google Scholar] [CrossRef]
- Todd, B.A.; Parsegian, V.A.; Shirahata, A.; Thomas, T.J.; Rau, D.C. Attractive forces between cation condensed DNA double helices. Biophys. J. 2008, 94, 4775–4782. [Google Scholar] [CrossRef]
- Livolant, F.; Bouligand, Y. Liquid crystalline phases given by helical biological polymers (DNA, PBLG and xantan). Columnar textures. J. Phys. (France) 1986, 47, 1813–1827. [Google Scholar] [CrossRef]
- Livolant, F.; Levelut, A.M.; Doucet, J.; Benoit, J.P. The highly concentrated liquid-crystalline phase of DNA is columnar hexagonal. Nature 1989, 339, 724–726. [Google Scholar] [CrossRef] [PubMed]
- Rill, R.L.; Strzelecka, T.E.; Davidson, M.W.; van Winkle, D.H. Ordered phases in concentrated DNA solutions. Physica A 1991, 176, 87–116. [Google Scholar] [CrossRef]
- Kassapidou, K.; Jesse, W.; van Dijk, J.F.; van der Maarel, J.R. Liquid crystal formation in DNA fragment solutions. Biopolymers 1998, 46, 31–37. [Google Scholar] [CrossRef]
- Livolant, F. Cholesteric organization of DNA in vivo and in vitro. Eur. J. Cell Biol. 1984, 33, 300–311. [Google Scholar]
- Rill, R.L.; Livolant, F.; Aldrich, H.C.; Davidson, M.A. Electron microscopy of liquid crystalline DNA: Direct evidence of cholesteric-like organization of DNA in dinoflagellate chromosome. Chromosoma 1989, 98, 280–286. [Google Scholar] [CrossRef]
- Livolant, F. Supramolecular organization of double-stranded DNA molecules in the columnar hexagonal liquid crystalline phase. An electron microscopic analysis using freeze-fracture methods. J. Mol. Biol. 1991, 218, 165–181. [Google Scholar] [CrossRef]
- Leforestier, A.; Livolant, F. Cholesteric liquid crystalline DNA; a comparative analysis of cryofixation methods. Biol. Cell 1991, 71, 115–122. [Google Scholar] [CrossRef]
- Durand, D.; Doucet, J.; Livolant, F. A study of the structure of highly concentrated phases of DNA by X-ray diffraction. J. Phys. II France 1992, 2, 1769–1783. [Google Scholar] [CrossRef]
- Leforestier, A.; Livolant, F. Supramolecular ordering of DNA in the cholesteric liquid crystalline phase: An ultrastructural study. Biophys. J. 1993, 65, 56–72. [Google Scholar] [CrossRef]
- Livolant, F.; Leforestier, A. Condensed phases of DNA: Structures and phase transitions. Prog. Polym. Sci. 1996, 21, 1115–1164. [Google Scholar] [CrossRef]
- Mitov, M. Cholesteric liquid crystals in living matter. Soft Matter 2017, 13, 4176–4209. [Google Scholar] [CrossRef]
- Yevdokimov, Y.M.; Salyanov, V.I.; Semenov, S.V.; Skuridin, S.G. DNA Liquid Crystalline Dispersions and Nanoconstructions; CRC Press (Taylor & Francis Group): Boca Raton, FL, USA, 2012; 258p. [Google Scholar]
- Bouligand, Y. Liquid crystalline order in biological materials. In Solid State Physics; Liebert, L., Ed.; Academic: New York, NY, USA, 1978; (Suppl. 14), pp. 259–294. [Google Scholar]
- Kamien, R.D.; Selinger, J.V. Order and frustration in chiral liquid crystals. J. Phys.Condens. Matter 2001, 13, R1. [Google Scholar] [CrossRef]
- Lerman, L.S. A transition to a compact form of DNA in polymer solutions. Proc. Natl. Acad. Sci. USA 1971, 68, 1886–1890. [Google Scholar] [CrossRef] [PubMed]
- Evdokimov, Y.M.; Platonov, A.L.; Tikhonenko, A.S.; Varshavsky, Y.M. A compact form of double-stranded DNA in solution. FEBS Lett. 1972, 23, 180–184. [Google Scholar] [CrossRef] [Green Version]
- Akimenko, N.M.; Dijakova, E.B.; Evdokimov, Y.M.; Frisman, E.V.; Varshavsky, Y.M. Viscosimetric study of compact form of DNA in water-salt solutions containing polyethyleneglycol. FEBS Lett. 1973, 38, 61–63. [Google Scholar] [CrossRef]
- Maniatis, T.; Venable, J.H.; Lerman, L.S. The structure of Ψ DNA. J. Mol. Biol. 1974, 84, 37–64. [Google Scholar] [CrossRef]
- Lerman, L.S. Chromosomal analogues: Long-range order in Ψ -condensed DNA. Cold Spring Harb. Symp. Quant. Biol. 1974, 38, 59–73. [Google Scholar]
- Poglazov, B.F.; Tikhonenko, A.S.; Engelhardt, V.A. ATP action on DNA release from bacteriophage. Proc. USSR Acad. Sci. 1962, 145, 450–452. [Google Scholar]
- Laemmli, U.K. Characterization of DNA condensates induced by poly(ethylene oxide) and polylysine. Proc. Natl. Acad. Sci. USA 1975, 72, 4288–4292. [Google Scholar] [CrossRef]
- Hud, N.V.; Vilfan, I.D. Toroidal DNA condensates: Unraveling the fine structure and the role of nucleation in determining size. Annu. Rev. Biophys. Biomol. Struct. 2005, 34, 295–318. [Google Scholar] [CrossRef] [PubMed]
- Hoang, T.X.; Giacometti, A.; Podgornik, R.; Nguyen, N.T.; Banavar, J.R.; Maritan, A. From toroidal to rod-like condensates of semiflexible polymers. J. Chem. Phys. 2014, 140, 064902. [Google Scholar] [CrossRef] [PubMed] [Green Version]
- Yevdokimov, Y.M.; Skuridin, S.G.; Lortkipanidze, G.B. Liquid-crystalline dispersions of nucleic acids. Liq. Cryst. 1992, 12, 1–16. [Google Scholar] [CrossRef]
- Goldar, A.; Thomson, H.; Seddon, J.M. Structure of DNA cholesteric spherulitic droplet dispersions. J. Phys. Condens. Matter 2007, 20, 9. [Google Scholar] [CrossRef]
- Biswas, N.; Ichikawa, M.; Datta, A.; Sato, Y.T.; Yanagisawa, M.; Yoshikawa, K. Phase separation in crowded micro-spheroids: DNA-PEG system. Chem. Phys. Lett. 2012, 539–540, 157–162. [Google Scholar] [CrossRef]
- Yevdokimov, Y.M.; Skuridin, S.G.; Salyanov, V.I.; Bykov, V.A.; Palumbo, M. Structural DNA nanothechnology: Liquid-crystalline approach. In Biotechnology.Applied Synthetic Biology; Singh, V., Ed.; Studium Press LLC: Houston, TX, USA, 2014; Volume 4, pp. 327–380. [Google Scholar]
- Yevdokimov, Y.M.; Salyanov, V.I.; Savateev, M.N.; Dubinskaya, V.A.; Skuridin, S.G. Analysis of “solid” nanoconstructs formed of liquid-crystalline DNA dispersion particles by the method of atomic force microscopy. Technol. Living Syst. 2013, 10, 20–27. (In Russian) [Google Scholar]
- Livolant, F. Ordered phases of DNA in vivo and in vitro. Phys. A 1991, 176, 117–137. [Google Scholar] [CrossRef]
- Adamczyk, A. Phase transition in freely suspended smectic droplets. Cotton-Mouton technique, architecture of droplets and formation nematoids. Mol. Cryst. Liq. Cryst. 1989, 170, 53–69. [Google Scholar] [CrossRef]
- Chiccoli, C.; Pasini, P.; Semeria, F.; Zannoni, C. Computer simulations of nematic droplets with toroidal boundary conditions. Mol. Cryst. Liq. Cryst. 1992, 221, 19–28. [Google Scholar] [CrossRef]
- Chandrasekhar, S. Liquid Crystals, 2nd ed.; Cambridge University Press: Cambridge, UK, 1992; p. 480. [Google Scholar]
- Papkov, S.P.; Kulichikhin, V.G. The Liquid Crystal State of Polymers; Khimiya: Moscow, Russia, 1977; 240p. (In Russian) [Google Scholar]
- Chilaya, G.S.; Lisetskii, L.N. Helical twist in cholesteric mesophases. Sov. Phys. Usp. 1981, 24, 496–510. [Google Scholar] [CrossRef]
- Kornyshev, A.A.; Leikin, S.; Malinin, S.V. Chiral electrostatic interaction and cholesteric liquid crystals of DNA. Eur. Phys. J. E 2002, 7, 83–93. [Google Scholar] [CrossRef]
- Yevdokimov, Y.M.; Salyanov, V.I.; Skuridin, S.G.; Semenov, S.V.; Kompanets, O.N. The CD Spectra of Double-Stranded DNA Liquid Crystalline Dispersions. In Circular Dichroism: Theory and Spectroscopy; Rogders, D.S., Ed.; Nova Science Publishers: New York, NY, USA, 2012; pp. 5–75. [Google Scholar]
- Semenov, S.V.; Yevdokimov, Y.M. Circular dichroism of DNA liquid-crystalline dispersion particles. Biophysics 2015, 60, 188–196. [Google Scholar] [CrossRef]
- Keller, D.; Bustamante, C. Theory of the interaction of light with large inhomogeneous molecular aggregates. I. Absorption. J. Chem. Phys. 1986, 84, 2961–2971. [Google Scholar] [CrossRef]
- Keller, D.; Bustamante, C. Theory of the interaction of light with large inhomogeneous molecular aggregates. II. Psi-type circular dichroism. J. Chem. Phys. 1986, 84, 2972–2980. [Google Scholar] [CrossRef]
- Kim, M.-H.; Ulibarri, L.; Keller, D.; Maestre, M.F.; Bustamante, C. The psi-type circular dichroism of large molecular aggregates. III. Calculations. J. Chem. Phys. 1986, 84, 2981–2989. [Google Scholar] [CrossRef]
- Belyakov, V.A.; Sonin, A.S. Optics of Cholesteric Liquid Crystals; Nauka: Moscow, Russia, 1982; 360p. (In Russian) [Google Scholar]
- Belyakov, V.A.; Dmitrienko, V.E. Optics of Chiral Liquid Crystals (Sov. Sci. Rev. Sect. A); Routledge: Abingdon-on-Thames, UK, 1989; 222p. [Google Scholar]
- Saeva, F.D.; Wysocki, J.J. Induced circular dichroism in cholesteric liquid crystals. J. Am. Chem. Soc. 1971, 93, 5928–5929. [Google Scholar] [CrossRef]
- Sackman, E.; Voss, J. Circular dichroism of helically arranged molecules in cholesteric phases. Chem. Phys. Lett. 1972, 14, 528–532. [Google Scholar] [CrossRef]
- De Vries, H. Rotatory power and other optical properties of certain liquid crystals. Acta Cryst. 1951, 4, 219–226. [Google Scholar] [CrossRef] [Green Version]
- Mauguin, C. Sur les cristaux liquids de Lehman. Bull. Soc. Franc. Minéral. 1911, 34, 71–117. [Google Scholar]
- Nordén, B. Application of linear dichroism spectroscopy. Appl.Spectrosc. Rev. 1978, 14, 157–248. [Google Scholar] [CrossRef]
- Belyakov, V.A.; Orlov, V.P.; Semenov, S.V.; Skuridin, S.G.; Yevdokimov, Y.M. Comparison of calculated and observed CD spectra of liquid crystalline dispersions formed from double-stranded DNA and from DNA complexes with coloured compounds. Liq. Cryst. 1996, 20, 777–784. [Google Scholar] [CrossRef]
- Yevdokimov, Y.M.; Salyanov, V.I.; Skuridin, S.G.; Semenov, S.V.; Kompanets, O.N. The CD Spectra of Double-Stranded DNA Liquid Crystalline Dispersions; Nova Science Publishers: New York, NY, USA, 2011; 103p. [Google Scholar]
- Harris, A.B.; Kamien, R.D.; Lubensky, T.C. Microscopic origin of cholesteric pitch. Phys. Rev. Lett. 1997, 78, 1476–1479. [Google Scholar] [CrossRef]
- Harris, A.B.; Kamien, R.D.; Lubensky, T.C. Molecular chirality and chiral parameters. Rev. Modern Phys. 1999, 71, 1745–1757. [Google Scholar] [CrossRef] [Green Version]
- Bloomfield, V.A.; Crothers, D.M.; Tinoko, I. Physical Chemistry of Nucleic Acids; Harper & Row: New York, NY, USA, 1974; 517p. [Google Scholar]
- Evdokimov, Y.M.; Pyatigopckaya, T.L.; Polivtsev, O.F.; Akimenko, N.M.; Tsvankin, D.Y.; Varshavsky, Y.M. DNA compact form. 8. X-ray diffraction study of DNA compact particles, formed in solutions, containing poly (ethylene glycol). Mol. Biol. 1976, 10, 1221–1229. (In Russian) [Google Scholar]
- Skuridin, S.G.; Damaschun, H.; Damaschun, G.; Yevdokimov, Y.M.; Misselwitz, R. Polymer condensed DNA: A study by small-angle X-ray scattering, intermediate-angle X-ray scattering and cicular dichroitic spectroscopy. Stud. Biophys. 1986, 112, 139–150. [Google Scholar]
- Yevdokimov, Y.M.; Skuridin, S.G.; Semenov, S.V.; Dadinova, L.A.; Salyanov, V.I.; Kats, E.I. Re-entrant cholesteric phase in DNA liquid-crystalline dispersion particles. J. Biol. Phys. 2017, 43, 45–68. [Google Scholar] [CrossRef] [PubMed]
- Lis, J.T.; Schleif, R.R. Size fractionation of double-stranded DNA by precipitation with polyethylene glycol. Nucleic Acids Res. 1975, 2, 383–390. [Google Scholar] [CrossRef] [Green Version]
- Brunner, W.C.; Maestre, M.F. Circular dichroism of films of polynucleotides. Biopolymers 1974, 13, 345–357. [Google Scholar] [CrossRef] [PubMed]
- Yevdokimov, Y.M.; Skuridin, S.G.; Salyanov, V.I. The liquid-crystalline phases of double-stranded nucleic acids in vitro and in vivo. Liq. Cryst. 1988, 3, 1443–1459. [Google Scholar] [CrossRef]
- Yevdokimov, Y.M.; Skuridin, S.G.; Salyanov, V.I.; Muzipov, E.R.; Semenov, S.V.; Kats, E.I. Double-stranded DNA packing in particles of liquid-crystalline dispersions and liquid-crystalline phases obtained from these particles. Liq. Cryst. Their Appl. 2018, 18, 64–85. [Google Scholar] [CrossRef]
- Sonin, A.S. Introduction to the Physics of Liquid Crystals; Nauka: Moscow, Russia, 1983; 320p. (In Russian) [Google Scholar]
- Sundaresan, N.; Thomas, T.; Thomas, T.J.; Pillai, C.K.S. Lithium ion induced stabilization of liquid crystalline DNA. Macromol. Biosci. 2006, 6, 27–32. [Google Scholar] [CrossRef] [PubMed]
- Yevdokimov, Y.M.; Skuridin, S.G.; Salyanov, V.I.; Semenov, S.V.; Shtykova, E.V.; Dadinova, L.A.; Kompanets, O.N.; Kats, E.I. The re-entrant cholesteric phase of DNA. Opt. Spectrosc. 2017, 123, 56–69. [Google Scholar] [CrossRef]
- Yevdokimov, Y.M.; Salyanov, V.I.; Skuridin, S.G.; Shtykova, E.V.; Khlebtsov, N.G.; Kats, E.I. Physicochemical and nanotechnological approaches to the design of “rigid” spatial structures of DNA. Rus. Chem. Rev. 2015, 84, 27–42. [Google Scholar] [CrossRef]
- Doskocil, J.; Fric, I. Complex formation of daunomycin with double-stranded RNA. FEBS Lett. 1973, 37, 55–58. [Google Scholar] [CrossRef] [Green Version]
- Barthelemy-Clavey, V.; Maurizot, J.-C.; Sicard, P.J. Etude spectrophotometrique du complexe DNA-daunorubicine. Biochimie 1973, 55, 859–868. [Google Scholar] [CrossRef]
- Wells, A.F. Cooper, Silver and Gold. In Structural Inorganic Chemistry, 4th ed.; Oxford University Press: Oxford, UK, 1975; pp. 875–910. [Google Scholar]
- Bersuker, I.B. The Jahn-Teller Effect and Vibronic Interactions in Modern Chemistry; Nauka: Moscow, Russia, 1987; 251p. (In Russian) [Google Scholar]
- Basolo, F.; Pearson, R.G. Mechanisms of Inorganic Reactions: A Study of Metal Complexes in Solution, 2nd ed.; Wiley: New York, NY, USA, 1967; 701p. [Google Scholar]
- Kaneko, M.; Tsuchida, E. Formation, characterization and catalytic activity of polymer-metal complexes. J. Polym. Sci. Macromol. Rev. 1981, 16, 397–522. [Google Scholar] [CrossRef]
- Coble, H.D.; Holtzclaw, H.F. Chelate polymers of copper (II) various dihydroxyquinoid ligands. J. Inorg. Nuclear Chem. 1974, 36, 1049–1053. [Google Scholar] [CrossRef]
- Yevdokimov, Y.M.; Skuridin, S.G.; Salyanov, V.I.; Bobrov, Y.A.; Bucharsky, V.A.; Kats, E.I. New optical evidence of the cholesteric packing of DNA molecules in “re-entrant” phase. Chem. Phys. Lett. 2019, 717, 59–68. [Google Scholar] [CrossRef]
- Yevdokimov, Y.M.; Salyanov, V.I.; Nechipurenko, Y.D.; Skuridin, S.G.; Zakharov, M.A.; Spener, F.; Palumbo, M. Molecular constructions (superstructures) with adjustable properties based on double-stranded nucleic acids. Mol. Biol. 2003, 37, 293–306. [Google Scholar] [CrossRef]
- Greenaway, F.T.; Dabrowiak, J.C. The binding of copper ions to daunomycin and adriamycin. J. Inorg. Biochem. 1982, 16, 91–107. [Google Scholar] [CrossRef]
- Fishman, M.M.; Schwastz, I. Effect of divalent cations on the daunomycin-deoxyribonucleic acid complex. Biochem. Pharmacol. 1974, 23, 2147–2154. [Google Scholar] [CrossRef]
- Roy, S.; Mondal, P.; Sengupta, P.S.; Dhak, D.; Santra, R.C.; Das, S.; Guin, P.S. Spectroscopic, computational and electrochemical studies on the formation of the copper complex of 1-amino-4-hydroxy-9,10-anthraquinone and effect of it on superoxide formation by NADH dehydrogenase. Dalton Trans. 2015, 44, 5428–5440. [Google Scholar] [CrossRef]
- Nikiforov, V.N.; Kuznetsov, V.D.; Nechipurenko, Y.D.; Salyanov, V.I.; Yevdokimov, Y.M. Magnetic properties of copper as a constituent of nanobridges formed between spatially fixed deoxyribonucleic acid molecules. JETP Lett. 2005, 81, 264–266. [Google Scholar] [CrossRef]
- Nechipurenko, Y.D.; Strel’tsov, S.A.; Yevdokimov, Y.M. Thermodynamic model of bridging between nucleic acid molecules in liquid crystal. Biophysics 2001, 46, 428–435. [Google Scholar]
- Nechipurenko, Y.D.; Ryabokon, V.F.; Semenov, S.V.; Yevdokimov, Y.M. Thermodynamic models describing the formation of “bridges” between of nucleic acid molecules and liquid crystals. Biophysics 2003, 48, 594–601. [Google Scholar]
- Ryabokon, V.F.; Nechipurenko, Y.D.; Semenov, S.V.; Yevdokimov, Y.M. “Bridges” between nucleic acid molecules in liquid crystals. Description from the point of view of the adsorption theory. Liq. Cryst. Their Appl. 2003, 3, 69–78. (In Russian) [Google Scholar]
- Yevdokimov, Y.M.; Skuridin, S.G.; Salyanov, V.I.; Kats, E.I. Anomalous behavior of the DNA liquid-crystalline dispersion particles and their phases. Chem. Phys. Lett. 2018, 707, 154–159. [Google Scholar] [CrossRef]
Figure 1.
Simplest scheme of the phase exclusion of low molecular mass, linear, rigid ds DNA molecules from an aqueous-salt PEG-containing solution. (Left panel)—At concentration of PEG below the “critical” value, there is enough a “free space” for ds DNA molecules. (Right panel)—At concentration of PEG higher than the “critical” value, the ordered assembling of adjacent ds DNA molecules takes place. ![Crystals 09 00162 i001]() —Image of PEG molecules.
—Image of PEG molecules.
 —Image of PEG molecules.
Figure 1.
Simplest scheme of the phase exclusion of low molecular mass, linear, rigid ds DNA molecules from an aqueous-salt PEG-containing solution. (Left panel)—At concentration of PEG below the “critical” value, there is enough a “free space” for ds DNA molecules. (Right panel)—At concentration of PEG higher than the “critical” value, the ordered assembling of adjacent ds DNA molecules takes place. ![Crystals 09 00162 i001]() —Image of PEG molecules.
—Image of PEG molecules.
—Image of PEG molecules.
Figure 2.
Hypothetical scheme of the hexagonal packing of linear ds DNA molecules in a dispersion particle formed in an aqueous-salt PEG-containing solution. ![Crystals 09 00162 i002]() —Schematic images of PEG molecules; the blue arrows indicate the quasinematic layers of DNA molecules. The three main directions of the hexagonal array permit one to define the quasinematic layers in the structure. Quasinematic layers, even with a constant distance between them, can be rotated by a small angle with a change in the osmotic pressure or temperature. It leads to the formation of a spatially twisted structure with an abnormal optical activity.
—Schematic images of PEG molecules; the blue arrows indicate the quasinematic layers of DNA molecules. The three main directions of the hexagonal array permit one to define the quasinematic layers in the structure. Quasinematic layers, even with a constant distance between them, can be rotated by a small angle with a change in the osmotic pressure or temperature. It leads to the formation of a spatially twisted structure with an abnormal optical activity.
 —Schematic images of PEG molecules; the blue arrows indicate the quasinematic layers of DNA molecules. The three main directions of the hexagonal array permit one to define the quasinematic layers in the structure. Quasinematic layers, even with a constant distance between them, can be rotated by a small angle with a change in the osmotic pressure or temperature. It leads to the formation of a spatially twisted structure with an abnormal optical activity.
Figure 2.
Hypothetical scheme of the hexagonal packing of linear ds DNA molecules in a dispersion particle formed in an aqueous-salt PEG-containing solution. ![Crystals 09 00162 i002]() —Schematic images of PEG molecules; the blue arrows indicate the quasinematic layers of DNA molecules. The three main directions of the hexagonal array permit one to define the quasinematic layers in the structure. Quasinematic layers, even with a constant distance between them, can be rotated by a small angle with a change in the osmotic pressure or temperature. It leads to the formation of a spatially twisted structure with an abnormal optical activity.
—Schematic images of PEG molecules; the blue arrows indicate the quasinematic layers of DNA molecules. The three main directions of the hexagonal array permit one to define the quasinematic layers in the structure. Quasinematic layers, even with a constant distance between them, can be rotated by a small angle with a change in the osmotic pressure or temperature. It leads to the formation of a spatially twisted structure with an abnormal optical activity.
—Schematic images of PEG molecules; the blue arrows indicate the quasinematic layers of DNA molecules. The three main directions of the hexagonal array permit one to define the quasinematic layers in the structure. Quasinematic layers, even with a constant distance between them, can be rotated by a small angle with a change in the osmotic pressure or temperature. It leads to the formation of a spatially twisted structure with an abnormal optical activity.
Figure 3.
The CD spectrum of an aqueous-salt (0.3 M NaCl + 0.002 M Na+-phosphate buffer) solution of linear double-stranded B-form of DNA (a) and the theoretically calculated CD spectrum for ds DNA CLCD (b). СDNA = 10 μg·mL−1, P = 2500 nm, D = 500 nm. ∆A = (AL − AR) × 10−6 optical units, L = 1 cm.
Figure 3.
The CD spectrum of an aqueous-salt (0.3 M NaCl + 0.002 M Na+-phosphate buffer) solution of linear double-stranded B-form of DNA (a) and the theoretically calculated CD spectrum for ds DNA CLCD (b). СDNA = 10 μg·mL−1, P = 2500 nm, D = 500 nm. ∆A = (AL − AR) × 10−6 optical units, L = 1 cm.

Figure 4.
Theoretically calculated CD spectra of ds DNA CLCDs with different size (D) of particles: D-100, 200, 300, 400 and 500 nm (curves 1–5). СDNA = 10 μg·mL−1, P = 2500 nm; ∆A = (AL − AR) × 10−6 optical units, L = 1 cm. Inset: The dependence of the amplitude (ΔAmax) the negative band in the CD spectra of the DNA CLCD on size (D) of particles.

Figure 5.
Theoretically calculated CD spectra of ds DNA CLCDs whose particles have different cholesteric pitch (P). Curves 1–5: P-2000, 4000, 6000, 8000 and 10,000 nm. СDNA = 10 μg·mL−1, D = 500 nm. Inset: The dependence of the amplitude (ΔAmax) of the negative band in CD spectra on pitch (P) of the spatially twisted structure of the DNA CLCD.

Figure 6.
Theoretically calculated CD spectra of ds DNA CLCDs with left- (curve 1) and right-handed (curve 2) twist of spatial structure. СDNA = 10 μg·mL−1, D = 500 nm, P = 2500 nm. ΔA = (AL − AR) × 10−6 optical units, L = 1 cm.
Figure 6.
Theoretically calculated CD spectra of ds DNA CLCDs with left- (curve 1) and right-handed (curve 2) twist of spatial structure. СDNA = 10 μg·mL−1, D = 500 nm, P = 2500 nm. ΔA = (AL − AR) × 10−6 optical units, L = 1 cm.

Figure 7.
Theoretically calculated CD spectra of ds DNA CLCD treated with daunomycin (curves 1–3 correspond to different DAU concentrations; 3 > 1). СDNA = 10 μg·mL−1, D = 500 nm, P = 2500 nm. ΔA = (AL − AR) × 10−6 optical units, L = 1 cm.
Figure 7.
Theoretically calculated CD spectra of ds DNA CLCD treated with daunomycin (curves 1–3 correspond to different DAU concentrations; 3 > 1). СDNA = 10 μg·mL−1, D = 500 nm, P = 2500 nm. ΔA = (AL − AR) × 10−6 optical units, L = 1 cm.

Figure 8.
(a) The CD spectra of the DNA LCDs formed in aqueous-salt solutions with different PEG concentration. 1—CPEG = 120 mg·mL−1 (π = 2.062 atm), 2—CPEG = 150 mg·mL−1 (π = 3.422 atm), 3—CPEG = 170 mg·mL−1 (π = 4.616 atm), 4—CPEG = 200 mg·mL−1 (π = 6.987 atm), 5—CPEG = 210 mg·mL−1 (π = 7.839 atm). СDNA = 10 μg·mL−1, 0.3 М NaCl + 0.002 M Na+-phosphate buffer. ΔA = (AL − AR)Ч10−6 optical units, T = 22 °C, L = 1 cm. (b) The generalized dependence of the amplitude of the band in the CD spectra of DNA LCDs (λ = 270 nm) upon PEG concentration. СDNA = 10 μg·mL−1, 0.3 М NaCl + 0.002 M Na+-phosphate buffer. ΔA270 × 10−6 optical units, Т = 22 °С, L = 1 cm. CPEGcritical—“critical” concentration of PEG at which the formation of DNA LCDs begins. р—osmotic pressure of PEG solution. domain I—isotropic ds DNA solution; domain II and domain III—the existence of the ds DNA LCDs with cholesteric and hexagonal packing of molecules in particles, respectively.

Figure 9.
Fingerprint texture of cholesteric phaseobtained as the result of the low-speed sedimentation of the ds DNA particles formed in a PEG-containing aqueous-salt solution (CPEG = 170 mg·mL−1). Bar corresponds to 10 μm.
Figure 9.
Fingerprint texture of cholesteric phaseobtained as the result of the low-speed sedimentation of the ds DNA particles formed in a PEG-containing aqueous-salt solution (CPEG = 170 mg·mL−1). Bar corresponds to 10 μm.

Figure 10.
Thin-layer optical texture of the phase obtained as the result of the low-speed sedimentation of the ds DNA particles formed in a PEG-containing aqueous-salt solution (CPEG = 240 mg·mL−1). Bar corresponds to 20 μm.
Figure 10.
Thin-layer optical texture of the phase obtained as the result of the low-speed sedimentation of the ds DNA particles formed in a PEG-containing aqueous-salt solution (CPEG = 240 mg·mL−1). Bar corresponds to 20 μm.

Figure 11.
The CD spectra of the ds DNA CLCD formed in domain II (CPEG = 170 mg·mL−1, curve 1) upon heating (curve 2) and subsequent cooling (curve 3).1–22°C, 2–80 °C, 3–80 →22 °C. CDNA = 30 μg·mL−1, 0.3 M NaCl + 0.002 M Na+-phosphate buffer. ΔA = (AL − AR) × 10–6 optical units, L = 1 cm.
Figure 11.
The CD spectra of the ds DNA CLCD formed in domain II (CPEG = 170 mg·mL−1, curve 1) upon heating (curve 2) and subsequent cooling (curve 3).1–22°C, 2–80 °C, 3–80 →22 °C. CDNA = 30 μg·mL−1, 0.3 M NaCl + 0.002 M Na+-phosphate buffer. ΔA = (AL − AR) × 10–6 optical units, L = 1 cm.

Figure 12.
The CD spectra of the ds DNA LCD formed in domain III (CPEG = 250 mg·mL−1, curve 1) upon heating (curve 2) and subsequent cooling (curve 3). 1–22 °C, 2–80 °C, 3–80 → 22 °C. CDNA = 30 μg·mL−1, 0.3 M NaCl + 0.002 M Na+-phosphate buffer. ΔA = (AL − AR) × 10–6 optical units, L= 1 cm.
Figure 12.
The CD spectra of the ds DNA LCD formed in domain III (CPEG = 250 mg·mL−1, curve 1) upon heating (curve 2) and subsequent cooling (curve 3). 1–22 °C, 2–80 °C, 3–80 → 22 °C. CDNA = 30 μg·mL−1, 0.3 M NaCl + 0.002 M Na+-phosphate buffer. ΔA = (AL − AR) × 10–6 optical units, L= 1 cm.

Figure 13.
The dependence of an abnormal band amplitude in the CD spectra (λ = 270 nm) of the ds DNA LCDs formed in PEG-containing aqueous-salt solutions with different osmotic pressures. curve 1—room temperature, curve 2—heated to 80 °C, curve 3—cooled back from 80 °C to 22 °C. CDNA = 30 μg·mL−1, 0.3 M NaCl + 0.002 M Na+-phosphate buffer. ΔA270 × 10–6 optical units, L = 1 cm.

Figure 14.
Panel (a) structure of aglycone part of anthracycline compounds; panel (b) and panel (c) complexes formed by DAU and ds DNA molecule; (b) scheme of intercalation complex; (c) scheme of “external” complex. View along the long axis of DNA helix.
Figure 14.
Panel (a) structure of aglycone part of anthracycline compounds; panel (b) and panel (c) complexes formed by DAU and ds DNA molecule; (b) scheme of intercalation complex; (c) scheme of “external” complex. View along the long axis of DNA helix.

Figure 15.
Panel (a) structure of chelate complex formed by various bivalent metal ions with oxygen groups of anthracycline compounds: panel (b) structure of extended chelate complex (“polymeric” chelate complex) formed between two model compounds, which possess the similar sites for complex “immersion”; panel (c) show a more detailed structure of nanobridges that link ds DNA molecules ordered in one quasinematic layer.

Figure 16.
The CD spectra of the ds DNA CLCD formed in an aqueous-salt PEG-containing solution (curve 1) and successively processing by DAU (curve 2) and CuCl2 (curves 3–5) solutions. Curve 1—the ds DNA CLCD after thermal “training.” Curve 2—the ds DNA CLCD treated by DAU (СDAU = 5.99 × 10⁻⁵ М). Curves 3–5—the ds DNA CLCD treated by DAU and CuCl2 (CCu = 2.9 × 10⁻⁵ М) taken after 2.3 min, 12.5 min and 51 min. CPEG = 170 mg·mL−1 (domain II), CDNA = 10 μg·mL−1, 0.3M NaCl + 0.002 M Na+-phosphate buffer. (AL − AR) × 10−6 optical units, 22 °С, L = 1 cm. Inset—the dependence of the amplitude of the band at 510 nm in the CD spectrum of ds DNA CLCD treated by DAU and CuCl2 upon time.

Figure 17.
The CD spectra of the ds DNA LCD formed in an aqueous-salt PEG-containing solution (curve 1) and successively processing by DAU (curve 2) and CuCl2 (curves 3–5) solutions. Curve 1—the ds DNA LCD after thermal “training”. Curve 2—the ds DNA LCD treated by DAU (СDAU = 5.99 × 10⁻⁵ М).Curves 3–5—the ds DNA LCD treated by DAU and CuCl2 (CCu = 2.9 × 10⁻⁵ М) taken after 10 min, 46 min and 125 min. CPEG = 280 mg·mL−1 (domain III), CDNA = 10 μg·mL−1,0.3M NaCl + 0.002M Na+-phosphate buffer.(AL − AR) × 10−6 optical units, 22 °С, L = 1 cm. Inset—the dependence of the amplitude of the band at 510 nm in the CD spectrum of ds DNA LCD treated by DAU and CuCl2 upon time.

Figure 18.
Hypothetical scheme of spatial ordering of DAU molecules in proximity to ds DNA surface on account of stacking interaction of these molecules (side view).
Figure 18.
Hypothetical scheme of spatial ordering of DAU molecules in proximity to ds DNA surface on account of stacking interaction of these molecules (side view).

© 2019 by the authors. Licensee MDPI, Basel, Switzerland. This article is an open access article distributed under the terms and conditions of the Creative Commons Attribution (CC BY) license (http://creativecommons.org/licenses/by/4.0/).
Share and Cite
MDPI and ACS Style
Yevdokimov, Y.; Skuridin, S.; Salyanov, V.; Semenov, S.; Kats, E. Liquid-Crystalline Dispersions of Double-Stranded DNA. Crystals 2019, 9, 162. https://0-doi-org.brum.beds.ac.uk/10.3390/cryst9030162
AMA Style
Yevdokimov Y, Skuridin S, Salyanov V, Semenov S, Kats E. Liquid-Crystalline Dispersions of Double-Stranded DNA. Crystals. 2019; 9(3):162. https://0-doi-org.brum.beds.ac.uk/10.3390/cryst9030162
Chicago/Turabian StyleYevdokimov, Yuri, Sergey Skuridin, Viktor Salyanov, Sergey Semenov, and Efim Kats. 2019. "Liquid-Crystalline Dispersions of Double-Stranded DNA" Crystals 9, no. 3: 162. https://0-doi-org.brum.beds.ac.uk/10.3390/cryst9030162
Note that from the first issue of 2016, this journal uses article numbers instead of page numbers. See further details here.