Enhancement of Lysozyme Crystallization Using DNA as a Polymeric Additive

 and
and 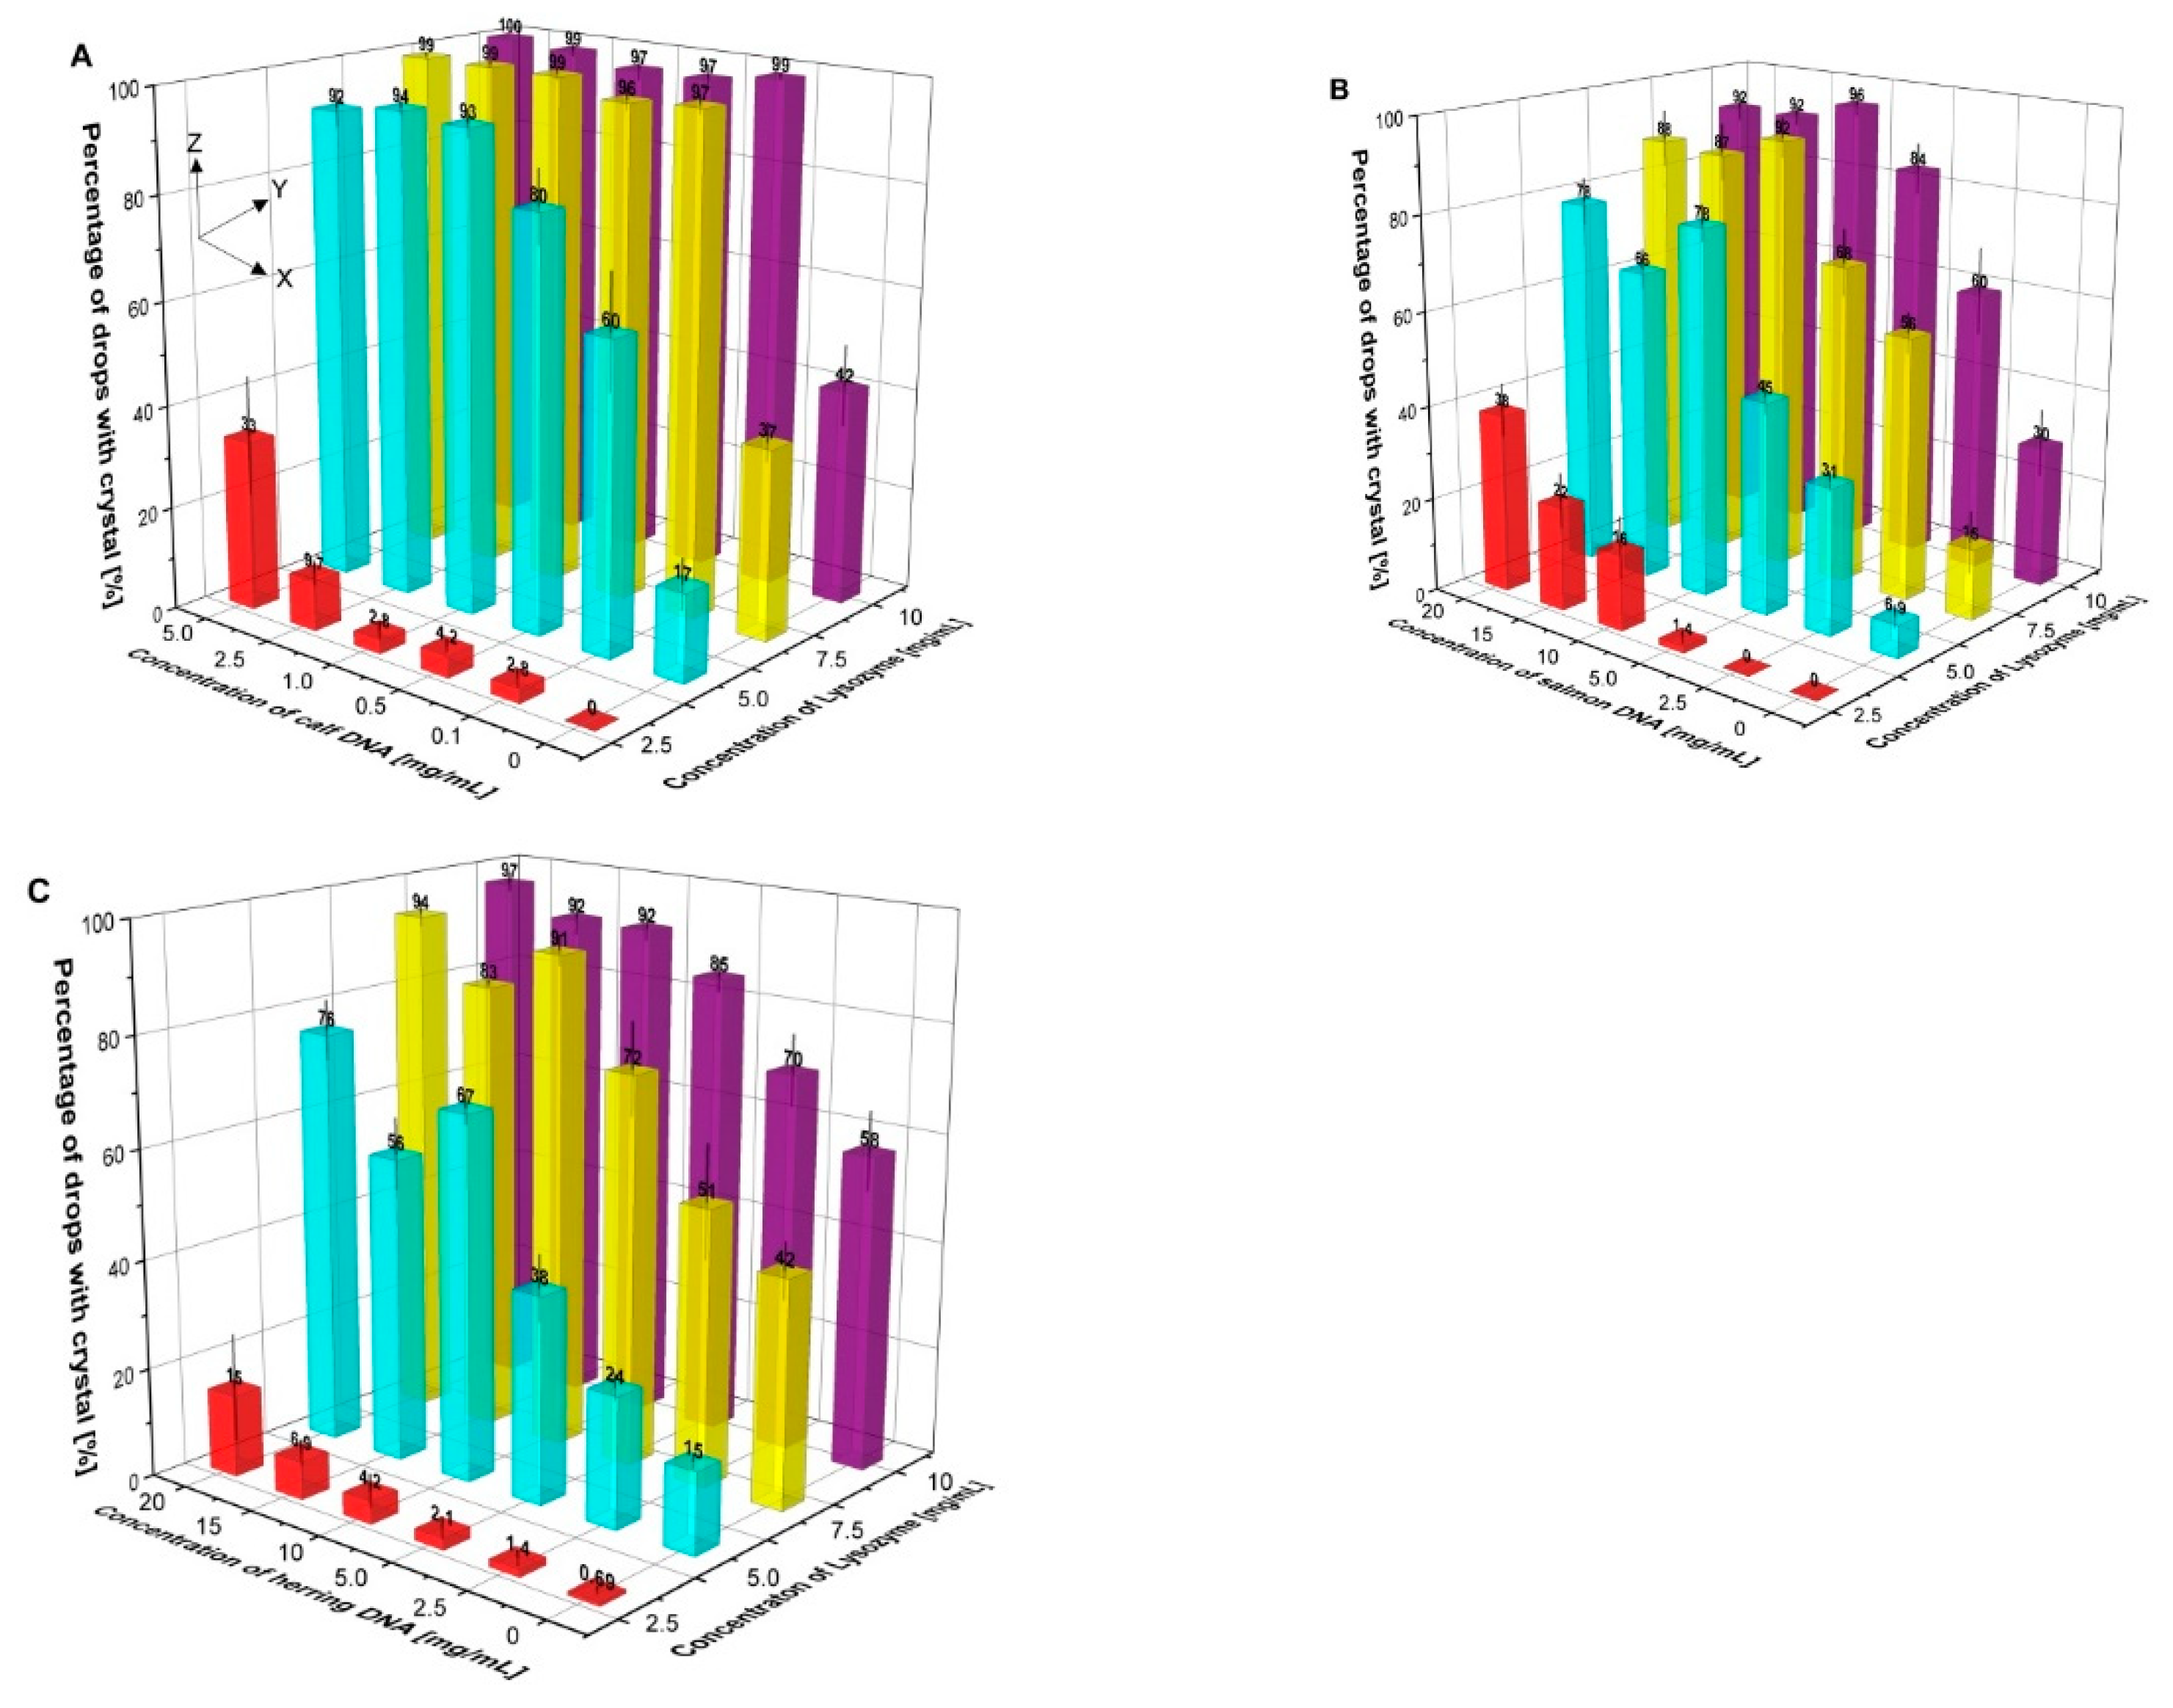
Abstract
:1. Introduction
2. Materials and Methods
2.1. Materials
2.2. Protein Samples Preparation
2.3. Agarose Gel Electrophoresis
2.4. Protein Crystallization Experiment
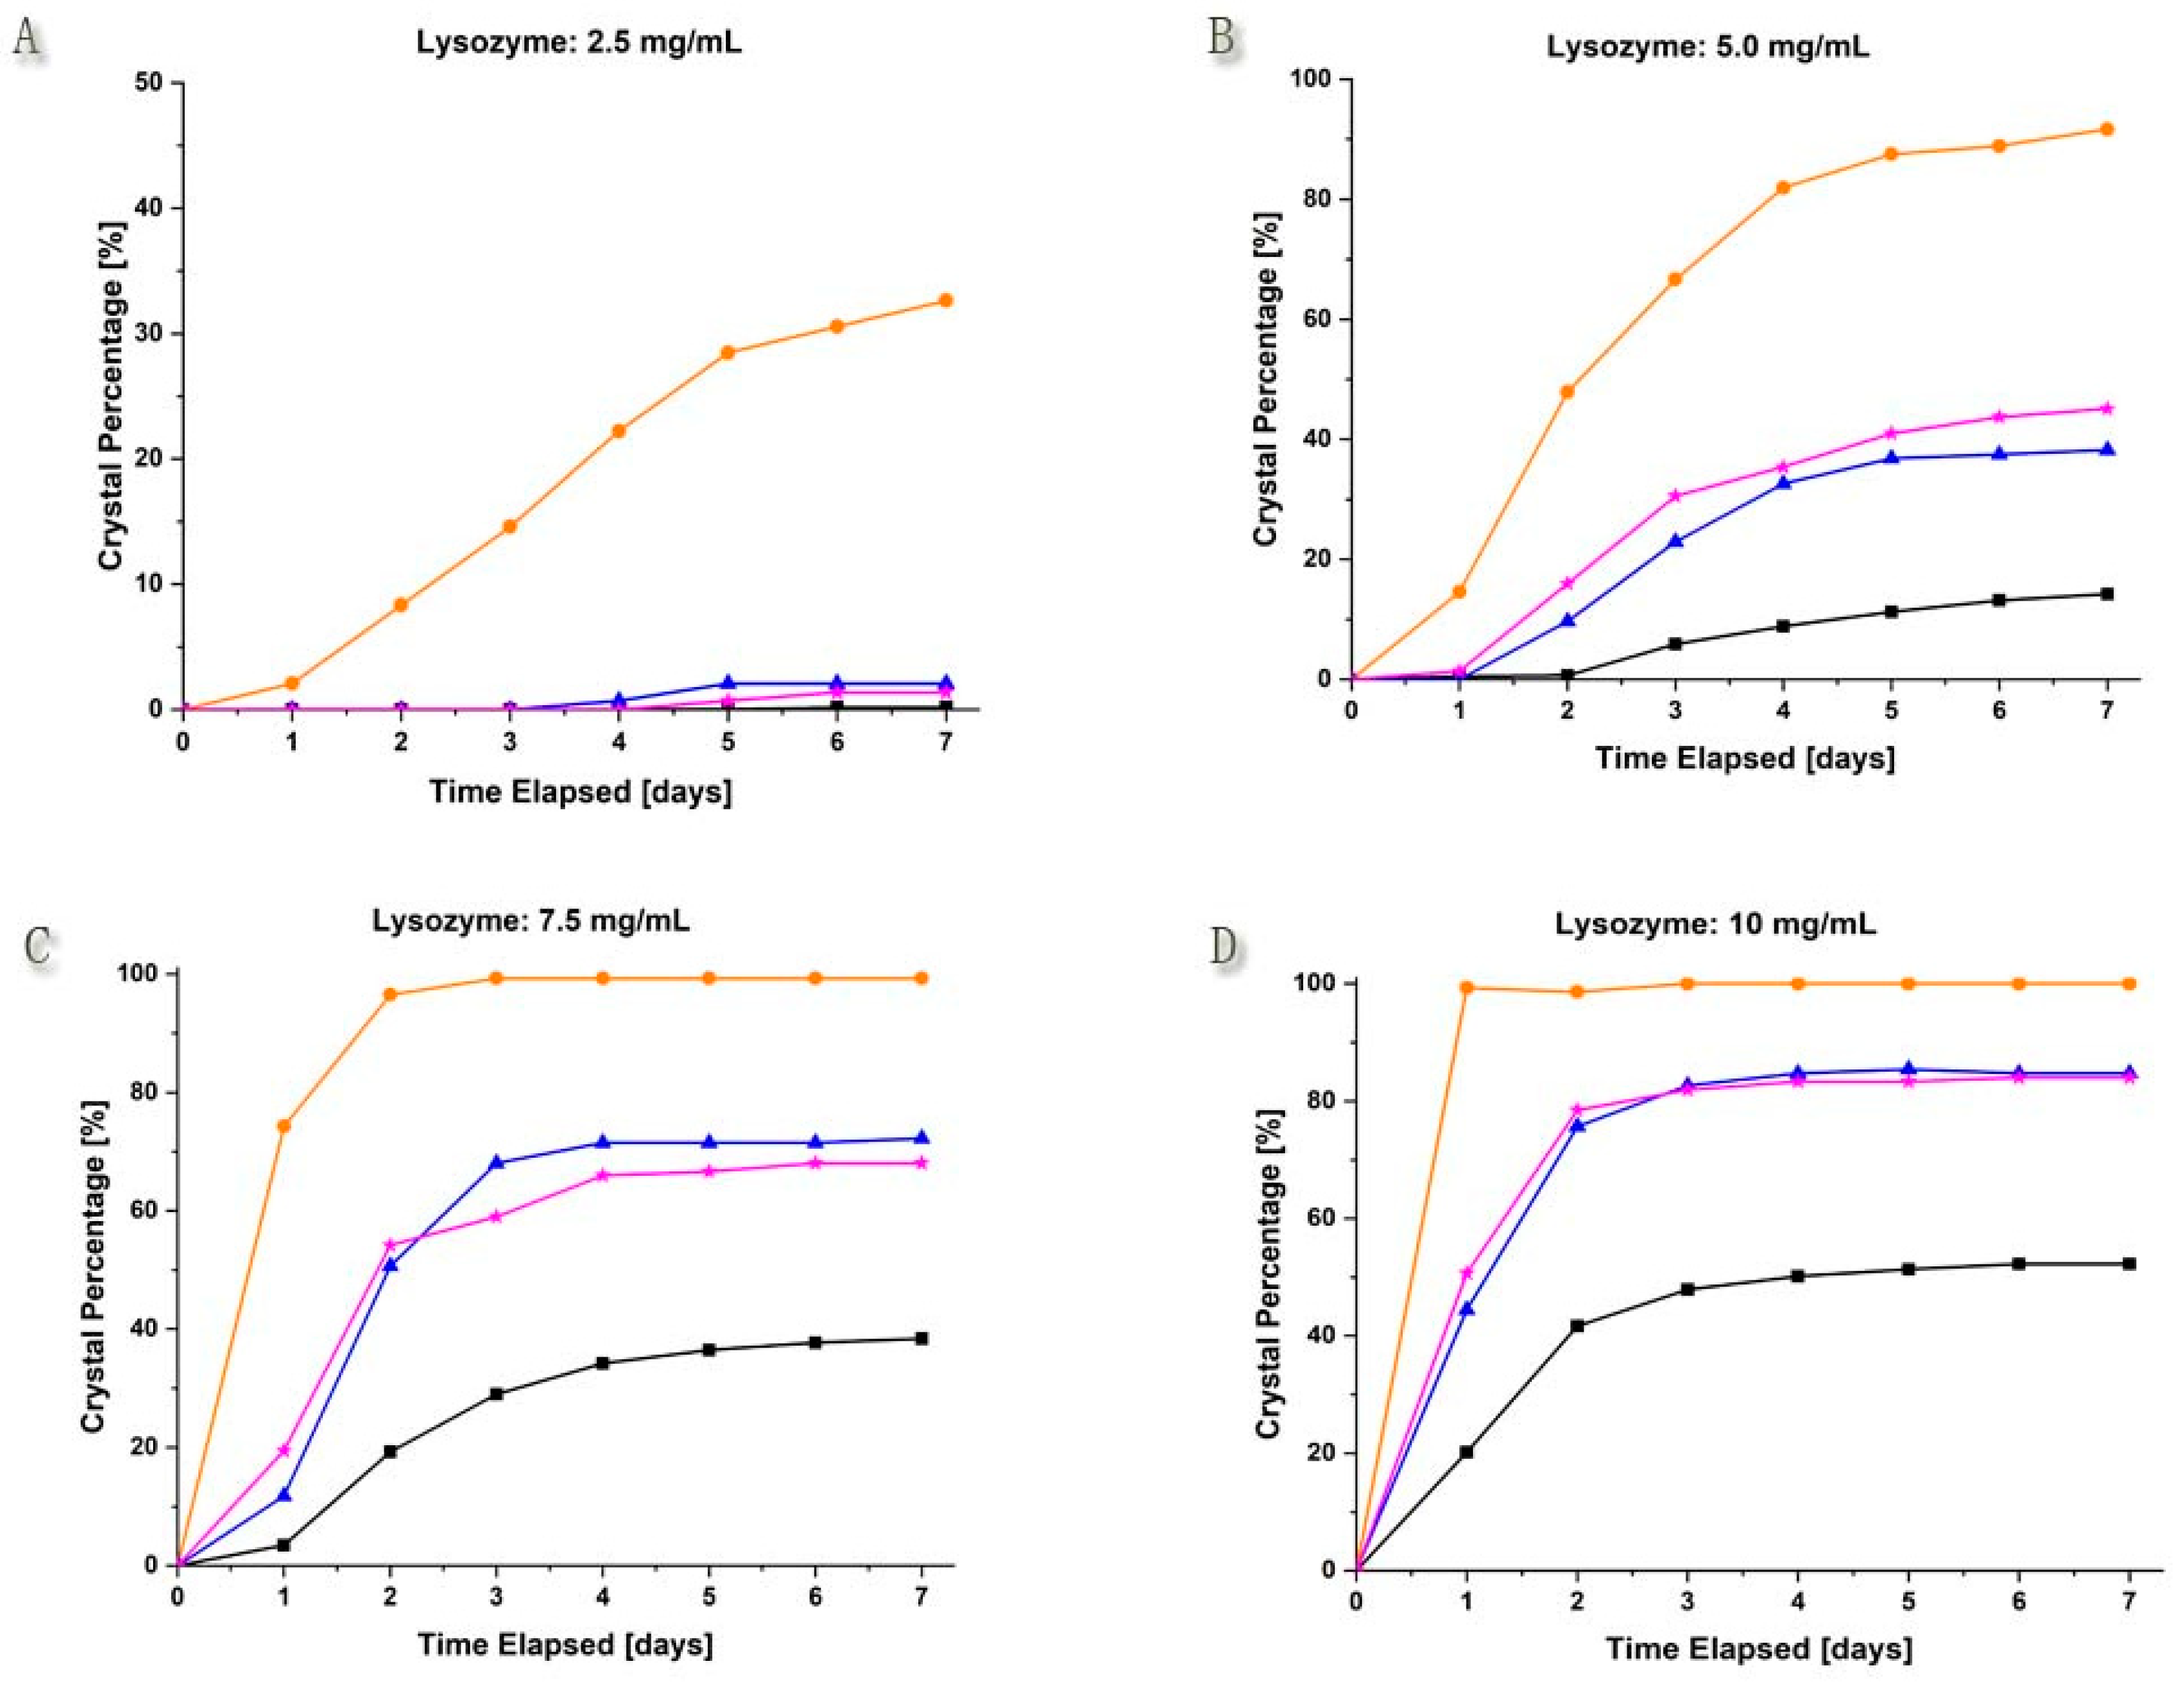
3. Results and Discussion
4. Conclusions
Supplementary Materials
Author Contributions
Funding
Conflicts of Interest
References
- Seeman, N.C. Nucleic Acid Junctions and Lattices. J. Theor. Biol. 1982, 99, 237–247. [Google Scholar] [CrossRef]
- Seeman, N.C. DNA Nanotechnology: Novel DNA Constructions. Annu. Rev. Biophys. Biomol. Struct. 1998, 27, 225–248. [Google Scholar] [CrossRef]
- Shiping, L.; Seeman, N.C. Translation of DNA Signals into Polymer Assembly Instructions. Science 2004, 306, 2072–2074. [Google Scholar] [Green Version]
- Dong, Y.; Liu, D.; Yang, Z. A Brief Review of Methods for Terminal Functionalization of DNA. Methods 2014, 67, 116–122. [Google Scholar] [CrossRef] [PubMed]
- Rothemund, P.W. Folding DNA to Create Nanoscale Shapes and Patterns. Nature 2006, 440, 297–302. [Google Scholar] [CrossRef] [PubMed]
- Qian, L.; Wang, Y.; Zhang, Z. Analogic China Map Constucted by DNA. Chin. Sci. Bull. 2006, 51, 2973–2976. [Google Scholar] [CrossRef]
- Andersen, E.S.; Dong, M.D.; Nielsen, M.M.; Jahn, K.; Lind-Thomsen, A.; Mamdouh, W.; Gothelf, K.V.; Besenbacher, F.; Kjems, J. DNA Origami Design of Dolphin-Shaped Structures with Flexible Tails. ACS Nano 2008, 2, 1213–1218. [Google Scholar] [CrossRef] [PubMed]
- Ke, Y.; Ong, L.L.; Shih, W.M.; Yin, P. Three-Dimensional Structures Self-Assembled from DNA Bricks. Science 2012, 338, 1177–1183. [Google Scholar] [CrossRef] [PubMed] [Green Version]
- Zahid, M.; Kim, B.; Hussain, R.; Amin, R.; Park, S.H. DNA Nanotechnology: A Future Perspective. Nanoscale 2013, 8, 119. [Google Scholar] [CrossRef]
- Andersen, E.S.; Dong, M.D.; Nielsen, M.M.; Jahn, K.; Subramani, R.; Mamdouh, W.; Golas, M.M.; Sander, B.; Stark, H.; Oliveira, C.L.P.; et al. Self-Assembly of a Nanoscale DNA Box with a Controllable Lid. Nature 2009, 459, 73–76. [Google Scholar] [CrossRef]
- Douglas, S.M.; Dietz, H.; Liedl, T. Self-Assembly of DNA into Nanoscale Three-Dimensional Shapes. Nature 2009, 459, 414–418. [Google Scholar] [CrossRef] [PubMed]
- Han, D.; Pal, S.; Nangreave, J.; Deng, Z.; Liu, Y.; Yan, H. DNA Origami with Complex Curvatures in Three-Dimensional Space. Science 2011, 332, 342–346. [Google Scholar] [CrossRef] [PubMed]
- Dietz, H.; Douglas, S.M.; Shih, W.M. Folding DNA into Twisted and Curved Nanoscale Shapes. Science 2009, 325, 725–730. [Google Scholar] [CrossRef] [PubMed] [Green Version]
- Zhang, B.; Andy, R.M.; Isbell, M.A.; Wang, D.; Wang, Y.; Tan, S.F.; Teo, X.L.; Xu, L.; Yang, Z.; Heng, J.Y.Y. DNA Origami as Seeds for Promoting Protein Crystallization. ACS Appl. Mat. Interfaces 2018. [Google Scholar] [CrossRef]
- Liu, X.; Zhang, F.; Jing, X.; Pan, M.; Liu, P.; Li, W.; Zhu, B.; Li, J.; Chen, H.; Wang, L.; et al. Complex Silica Composite Nanomaterials Templated with DNA Origami. Nature 2018, 559, 593–598. [Google Scholar] [CrossRef]
- Udomprasert, A.; Kangsamaksin, T. DNA Origami Applications in Cancer Therapy. Cancer Sci. 2017, 108, 1535–1543. [Google Scholar] [CrossRef]
- Fan, C.; Liu, D. DNA Nanotechnology; Science Press: Beijing, China, 2015. [Google Scholar]
- Chayen, N.E. Turning Protein Crystallisation from an Art into a Science. Curr. Opin. Struct. Biol. 2004, 14, 577–583. [Google Scholar] [CrossRef]
- McPherson, A. Crystallization of Biological Macromolecules, 1st ed.; Cold Spring Harbour Laboratory Press: New York, NY, USA, 1999; Volume 586. [Google Scholar]
- McPherson, A.; Gavira, J.A. Introduction to Protein Crystallization. Acta Crystallogr. F Struct. Biol. Commun. 2014, 70, 2–20. [Google Scholar] [CrossRef] [PubMed]
- Giegé, R. A Historical Perspective on Protein Crystallization from 1840 to the Present Day. FEBS J. 2013, 280, 6456–6497. [Google Scholar] [CrossRef]
- D’Arcy, A.; Sweeneya, A.M.; Haber, A. Using Natural Seeding Material to Generate Nucleation in Protein Crystallization Experiments. Acta Cryst. 2003, 59, 1343–1346. [Google Scholar] [CrossRef]
- Kimble, W.L.; Paxton, T.E.; Rousseau, R.W.; Sambanis, A. The Effect of Mineral Substrates on the Crystallization of Lysozyme. J. Cryst. Growth 1998, 187, 268–276. [Google Scholar] [CrossRef]
- Chayen, N.E.; Saridakis, E.; El-Bahar, R.; Nemirovsky, Y. Porous Silicon: An Effective Nucleation-Inducing Material for Protein Crystallization. J. Mol. Biol. 2001, 312, 591–595. [Google Scholar] [CrossRef] [PubMed]
- Shah, U.V.; Jahn, N.H.; Huang, S.; Yang, Z.; Williams, D.R.; Heng, J.Y.Y. Crystallisation via Novel 3D Nanotemplates as a Tool for Protein Purification and Bio-Separation. J. Cryst. Growth 2017, 469, 42–47. [Google Scholar] [CrossRef]
- Hu, Y.; Chen, Z.; Fu, Y.; He, Q.; Jiang, L.; Zheng, J.; Gao, Y.; Mei, P.; Chen, Z.; Ren, X. The Amino-Terminal Structure of Human Fragile X Mental Retardation Protein Obtained Using Precipitant-Immobilized Imprinted Polymers. Nat. Commun. 2015, 6, 6634. [Google Scholar] [CrossRef] [PubMed]
- Chayen, N.E.; Sarldakis, E.; Sear, R.P. Experiment and Theory for Heterogeneous Nucleation of Protein Crystals in a Porous Medium. Proc. Natl. Acad. Sci. USA 2006, 103, 597–601. [Google Scholar] [CrossRef] [PubMed]
- Saridakis, E.; Khurshid, S.; Govada, L.; Phan, Q.; Hawkins, D.; Crichlow, G.V.; Lolis, E.; Reddy, S.M.; Chayen, N.E. Protein Crystallization Facilitated by Molecularly Imprinted Polymers. Proc. Natl. Acad. Sci. USA 2011, 108, 11081–11086. [Google Scholar] [CrossRef] [PubMed]
- Thakur, A.S.; Robin, G.; Guncar, G.; Saunders, N.F.; Newman, J.; Martin, J.L.; Kobe, B. Improved Success of Sparse Matrix Protein Crystallization Screening with Heterogeneous Nucleating Agents. PLoS ONE 2007, 2, e1091. [Google Scholar] [CrossRef]
- Shah, U.V.; Amberg, C.; Diao, Y.; Yang, Z.; Heng, J.Y.Y. Heterogeneous Nucleants for Crystallogenesis and Bioseparation. Curr. Opin. Chem. Eng. 2015, 8, 69–75. [Google Scholar] [CrossRef]
- Zhou, R.; Cao, H.; Zhang, C.; Yin, D. A Review on Recent Advances for Nucleants and Nucleation in Protein Crystallization. CrystEngComm 2017, 19, 1143–1155. [Google Scholar] [CrossRef]
- Bijelic, A.; Molitor, C.; Mauracher, S.G.; Al-Oweini, R.; Kortz, U.; Rompel, A. Hen Egg-White Lysozyme Crystallisation: Protein Stacking and Structure Stability Enhanced by a Tellurium(VI)-Centred Polyoxotungstate. ChemBioChem 2015, 16, 233–241. [Google Scholar] [CrossRef]
- McGovern, R.E.; McCarthy, A.A.; Crowley, P.B. Protein assembly mediated by sulfonatocalix[4]arene. Chem. Commun. 2014, 50, 10412. [Google Scholar] [CrossRef]
- Beck, T.; Krasauskas, A.; Gruene, T.; Sheldrick, G.M. A Magic Triangle for Experimental Phasing of Macromolecule. Acta Cryst. 2008, D64, 1179–1182. [Google Scholar] [CrossRef]
- He, F. DNA Molecular Weight Calculation. Bio-Protocol 2011, 1, e46. [Google Scholar] [CrossRef]
- Liu, Y.; Li, H.; Wu, Z.; Chen, R.; Lu, Q.; Guo, Y.; Zhang, C.; Yin, D. Sensitivity of Lysozyme Crystallization to Temperature Variation. CrystEngComm 2016, 18, 1609–1617. [Google Scholar] [CrossRef]
- Zhang, C.; Wang, Y.; Schubert, R.; Liu, Y.; Wang, M.; Chen, D.; Guo, Y.; Dong, C.; Lu, H.; Liu, Y.; et al. Effect of Audible Sound on Protein Crystallization. Cryst. Growth Des. 2016, 16, 705–713. [Google Scholar] [CrossRef]
- Tong, X.; Kang, J.; Zhang, J.; Jia, X.; Li, W. Interfacial Functional Terminals Enhance the Heterogeneous Nucleation of Lysozyme Crystals. CrystEngComm 2018, 20, 2499–2510. [Google Scholar] [CrossRef]
- Stevens, R.C. High-Throughput Protein Crystallization. Curr. Opin. Struct. Biol. 2000, 10, 558–563. [Google Scholar] [CrossRef]
- Bolanos-Garcia, V.M.; Chayen, N.E. New Directions in Conventional Methods of Protein Crystallization. Prog. Biophys. Mol. Biol. 2009, 101, 3–12. [Google Scholar] [CrossRef] [PubMed]
- Tardieua, A.; Bonnete, F.; Finetc, S.; Vivarès, D. Understanding Salt or PEG Induced Attractive Interactions to Crystallize Biological Macromolecules. Acta Cryst. 2002, D58, 1549–1553. [Google Scholar] [CrossRef]
- Phillip, Y.; Sherman, E.; Haran, G.; Schreiber, G. Common Crowding Agents Have Only a Small Effect on Protein-Protein Interactions. Biophys J. 2009, 97, 875–885. [Google Scholar] [CrossRef] [Green Version]
- Bonvin, A.M.J.J.; Sunnerhagen, M.; Otting, G.; Gunsteren, W.F.V. Water Molecules in DNA Recognition II: A Molecular Dynamics View of the Structure and Hydration of the trp Operator. J. Mol. Biol. 1998, 282, 859–873. [Google Scholar] [CrossRef] [PubMed]
- Reddy, C.K.; Das, A.; Jayaram, B. Do Water Molecules Mediate Protein-DNA Recogniton. J. Mol. Biol. 2001, 314, 619–632. [Google Scholar] [CrossRef] [PubMed]


© 2019 by the authors. Licensee MDPI, Basel, Switzerland. This article is an open access article distributed under the terms and conditions of the Creative Commons Attribution (CC BY) license (http://creativecommons.org/licenses/by/4.0/).
Share and Cite
Zhang, B.; Wang, Y.; Thi, S.; Toong, V.; Luo, P.; Fan, S.; Xu, L.; Yang, Z.; Heng, J.Y.Y. Enhancement of Lysozyme Crystallization Using DNA as a Polymeric Additive. Crystals 2019, 9, 186. https://0-doi-org.brum.beds.ac.uk/10.3390/cryst9040186
Zhang B, Wang Y, Thi S, Toong V, Luo P, Fan S, Xu L, Yang Z, Heng JYY. Enhancement of Lysozyme Crystallization Using DNA as a Polymeric Additive. Crystals. 2019; 9(4):186. https://0-doi-org.brum.beds.ac.uk/10.3390/cryst9040186
Chicago/Turabian StyleZhang, Bo, Yao Wang, Shiki Thi, Vincent Toong, Ping Luo, Shilong Fan, Lijin Xu, Zhongqiang Yang, and Jerry Y. Y. Heng. 2019. "Enhancement of Lysozyme Crystallization Using DNA as a Polymeric Additive" Crystals 9, no. 4: 186. https://0-doi-org.brum.beds.ac.uk/10.3390/cryst9040186